phar 7633 chapter 6 intravenous infusion - boomer · pdf filephar 7633 chapter 6 intravenous...
TRANSCRIPT
2/12/14, 6:58 PMc06
Page 1 of 19http://www.boomer.org/c/p4/c06/c06.html
PHAR 7633 Chapter 6
Intravenous Infusion
Intravenous Infusion
One Compartment Linear Model
Student Objectives for this Chapter
After completing the material in this chapter each student should:-
be able to draw the schemes and write the differential equations for a one compartment pharmacokineticmodel after IV infusion administrationbe able use the integrated equations for drug concentrations during and after an IV infusion administration tocalculate parameter values and suitable dosing regimens including IV infusion alone, fast/slow IV infusionor infusion/bolus dosage regimensbe able to calculate kel and V from data collected after a single IV infusionbe able to define, use, and calculate the parameters:
k0 (infusion rate constant)D (infusion duration)
Hospital patients will commonly receive drugs by intravenous infusion. The inconvenience of administering thedrug over a long time is not a real problem with bedridden patients. Some may already be receiving intravenousfluids. If a drug is chemically stable and is compatible with the intravenous fluid it may be added to the fluid andthereby be given by slow infusion.
Some drugs cannot be given by rapid intravenous injection. Therefore they may be given by slower IV infusion over15 or 30 minutes. For example, IV phenytoin must be given slowly, no greater than 50 mg/min (and preferably 25mg/min or less) in adults. Much slower in neonates. Phenytoin's poor solubility required alkaline pH control and/or aco-solvent which can produce adverse effects when given too quickly.
This page was last modified: Wednesday 26 May 2010 at 08:49 AM
Material on this website should be used for Educational or Self-Study Purposes Only
Copyright © 2001-2014 David W. A. Bourne ([email protected])

2/12/14, 6:58 PMc06
Page 2 of 19http://www.boomer.org/c/p4/c06/c06.html
PHAR 7633 Chapter 6
Intravenous Infusion
Continuous IV Infusion - Steady State
The ModelGiving the drug by infusion changes the drug concentration versus time curve. The equations used to describe thedrug concentration are different.
The model can be described schematically.
Figure 6.2.1 Scheme for One Compartment Intravenous Infusion
In Figure 6.2.1 we have added an infusion rate constant, k0, to the diagram presented earlier, (Figure 4.4.1). This is azero order process so the units of k0 are amount per time, for example 25 mg/min.
Differential and Integrated equationThe differential equation for V • Cp is then:
Equation 6.2.1 Differential Equation for Drug amount During an IV Infusion
Equation 6.2.1 is the differential equation during the infusion period and it can be integrated to give Equation 6.2.2using Laplace transforms.
Equation 6.2.2 Integrated Equation for Drug Amount in the body versus Time

2/12/14, 6:58 PMc06
Page 3 of 19http://www.boomer.org/c/p4/c06/c06.html
and after dividing both sides by the apparent volume of distribution, V.
Equation 6.2.3 Integrated Equation for Drug Concentration versus Time
Equation 6.2.3 can be used estimate the drug concentration at various times after an infuion is started OR tocalculate the infusion rate needed to achive a desired drug concentration.
Javascript Calculators using Equation 6.2.3
Calculator 6.2.1 Calculate Cp Given k0,kel and V at time t
Enter your own values into each fieldk0 (zero order
mass/time) 100
kel (first orderreciprocal time) 0.15
V (volume) 10
t (time) 1
Calculate Cp at time t
Cp (mass/volume)is:
Calculator 6.2.2 Calculate k0 required togive Cp at time t
Enter your own values into each fieldDesired Cp
(mass/volume) 10
kel (first orderreciprocal time) 0.15
V (volume) 10
t (time) 1
Calculate Required k0
k0 (mass/time) is:
You may notice that Equation 6.2.3 for Cp is quite similar to Equation 5.3.4 that we used before for the cumulativeamount of drug excreted into urine. As you might expect the plot of Cp would be similar in shape.

2/12/14, 6:58 PMc06
Page 4 of 19http://www.boomer.org/c/p4/c06/c06.html
Figure 6.2.2 Linear Plot of Cp versus Time During a Continuous Infusion
Click on the figure to view the interactive graph Use the links below for Internet Explorer
Linear - kel/V Semi-log - kel/V
Linear - CL/V Semi-log - CL/V
If we continue the infusion indefinitely then we will approach a steady state plasma concentration when the rate ofinfusion will be equal to the rate of elimination.
This is because the rate of infusion is constant whereas the rate of elimination will increase as the plasmaconcentration increases. At steady state the two rates become equal. We can determine the steady state concentrationfrom the differential equation by setting the rate of change of Cp, i.e. dCp/dt = 0.
Then
therefore
Equation 6.2.4 Steady State Concentration after Continuous IV Infusion
This could also be calculated from the integrated equation by setting e- kel • t = 0 at t = ∞.
We can now calculate the infusion rate necessary to produce some desired steady state plasma level.
For Example:
2/12/14, 6:58 PMc06
Page 5 of 19http://www.boomer.org/c/p4/c06/c06.html
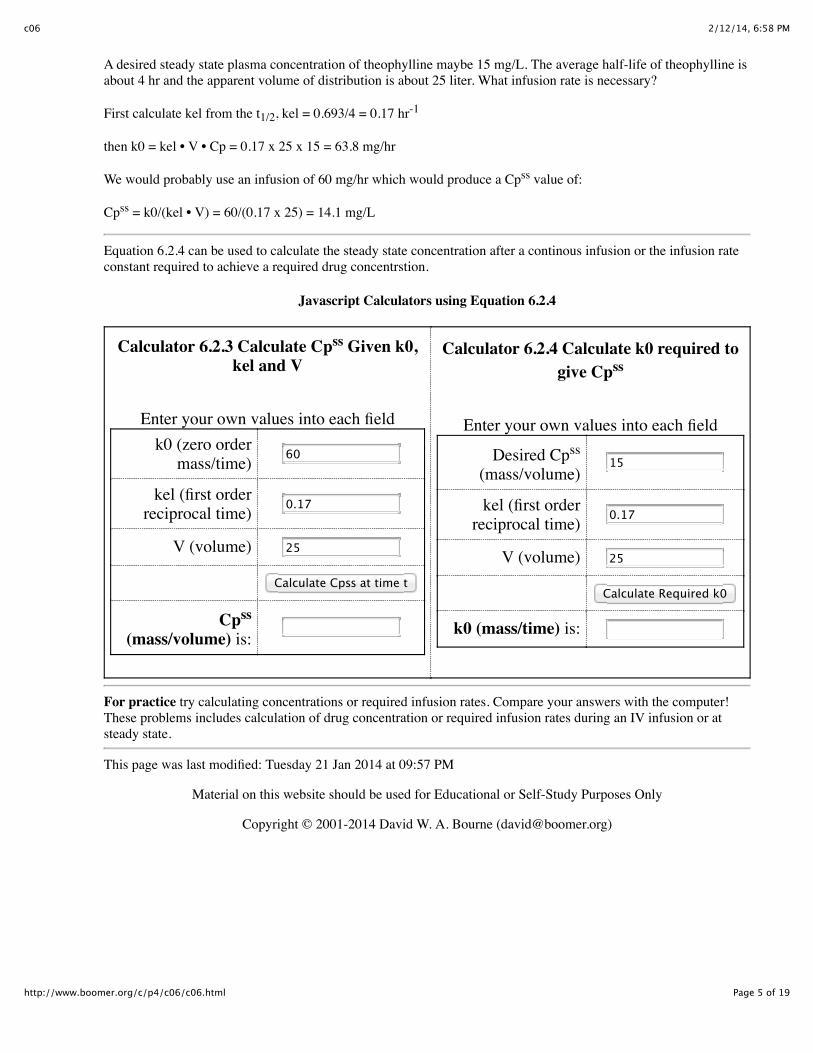
A desired steady state plasma concentration of theophylline maybe 15 mg/L. The average half-life of theophylline isabout 4 hr and the apparent volume of distribution is about 25 liter. What infusion rate is necessary?
First calculate kel from the t1/2, kel = 0.693/4 = 0.17 hr-1
then k0 = kel • V • Cp = 0.17 x 25 x 15 = 63.8 mg/hr
We would probably use an infusion of 60 mg/hr which would produce a Cpss value of:
Cpss = k0/(kel • V) = 60/(0.17 x 25) = 14.1 mg/L
Equation 6.2.4 can be used to calculate the steady state concentration after a continous infusion or the infusion rateconstant required to achieve a required drug concentrstion.
Javascript Calculators using Equation 6.2.4
Calculator 6.2.3 Calculate Cpss Given k0,kel and V
Enter your own values into each fieldk0 (zero order
mass/time) 60
kel (first orderreciprocal time) 0.17
V (volume) 25
Calculate Cpss at time t
Cpss
(mass/volume) is:
Calculator 6.2.4 Calculate k0 required togive Cpss
Enter your own values into each field
Desired Cpss
(mass/volume)15
kel (first orderreciprocal time) 0.17
V (volume) 25
Calculate Required k0
k0 (mass/time) is:
For practice try calculating concentrations or required infusion rates. Compare your answers with the computer!These problems includes calculation of drug concentration or required infusion rates during an IV infusion or atsteady state.
This page was last modified: Tuesday 21 Jan 2014 at 09:57 PM
Material on this website should be used for Educational or Self-Study Purposes Only
Copyright © 2001-2014 David W. A. Bourne ([email protected])
2/12/14, 6:58 PMc06
Page 6 of 19http://www.boomer.org/c/p4/c06/c06.html
PHAR 7633 Chapter 6
Intravenous Infusion
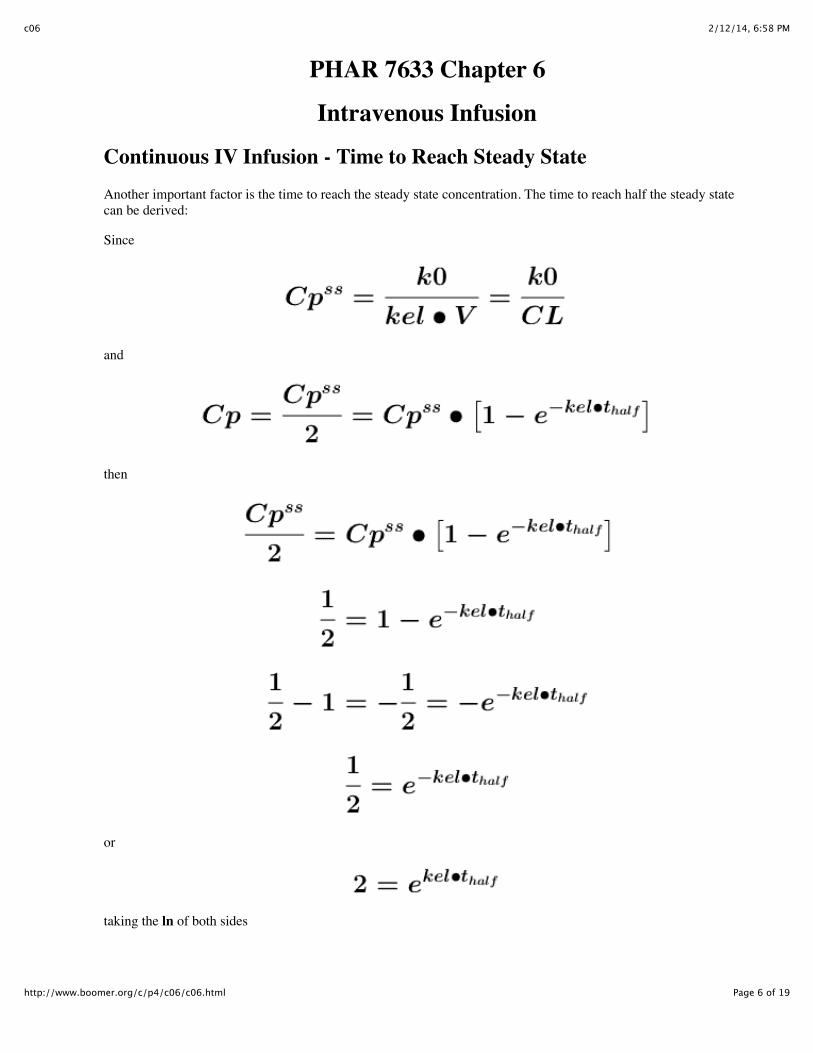
Continuous IV Infusion - Time to Reach Steady StateAnother important factor is the time to reach the steady state concentration. The time to reach half the steady statecan be derived:
Since
and
then
or
taking the ln of both sides

2/12/14, 6:58 PMc06
Page 7 of 19http://www.boomer.org/c/p4/c06/c06.html
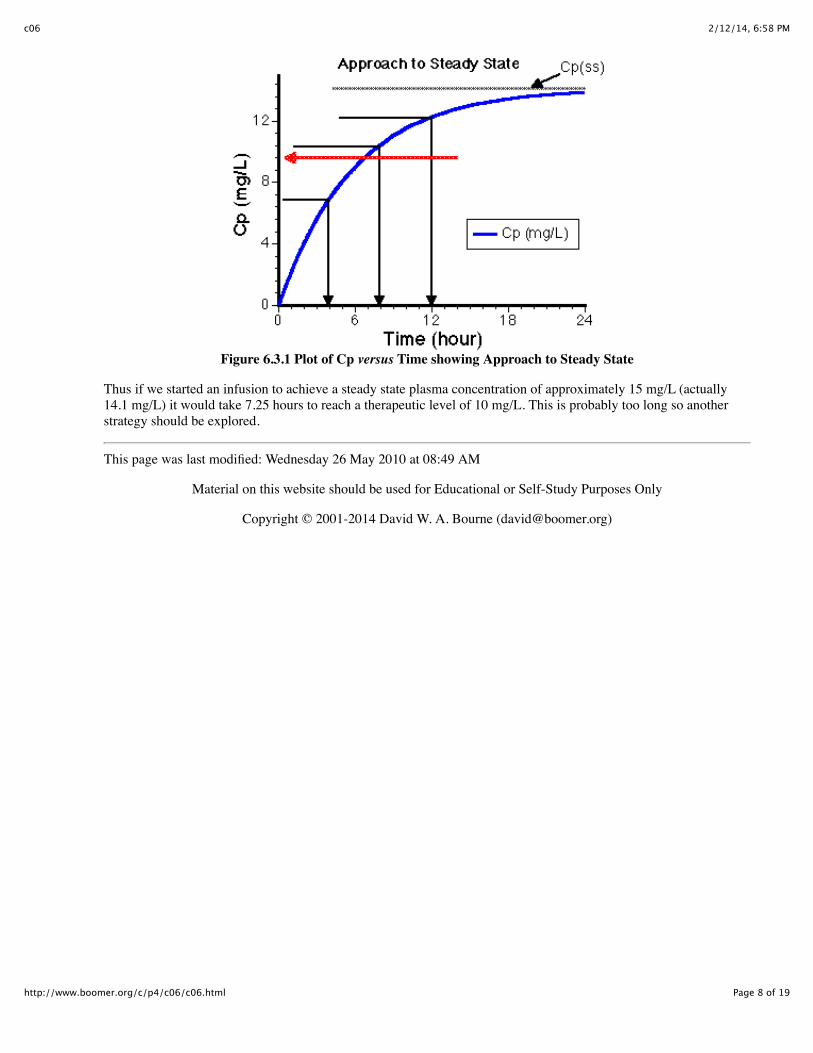
Thus
Thus the approach to Cpss is exponential in nature and is controlled by the elimination process NOT the infusionprocess. NOTE however that the value of Cpss IS controlled by k0.
Halfway - 50% to steady state in one half-life
75% to steady state in 2 half-life
87.5% to steady state in 3 half-life
94% to steady state in 4 half-life
For theophylline with a t1/2 equal to 4 hours the time to reach 94% of steady state will be 16 hours. We couldcalculate how long it might take to reach a therapeutic concentration. For theophylline this might be 10 mg/L
Thus
Using the values from before
k0 = 60 mg/hr; kel = 0.17 hr- 1; V = 25 L; and Crequired = 10 mg/L
thus
and taking the ln of both sides gives -0.17 * t = -1.231 or t = 7.24 hr
2/12/14, 6:58 PMc06
Page 8 of 19http://www.boomer.org/c/p4/c06/c06.html
Figure 6.3.1 Plot of Cp versus Time showing Approach to Steady State
Thus if we started an infusion to achieve a steady state plasma concentration of approximately 15 mg/L (actually14.1 mg/L) it would take 7.25 hours to reach a therapeutic level of 10 mg/L. This is probably too long so anotherstrategy should be explored.
This page was last modified: Wednesday 26 May 2010 at 08:49 AM
Material on this website should be used for Educational or Self-Study Purposes Only
Copyright © 2001-2014 David W. A. Bourne ([email protected])

2/12/14, 6:58 PMc06
Page 9 of 19http://www.boomer.org/c/p4/c06/c06.html
PHAR 7633 Chapter 6
Intravenous Infusion
Combined Infusion and bolus administrationOne reason we give a drug by IV is because we need a quick therapeutic response. One way to achieve a therapeuticconcentration more quickly is to give a loading dose by rapid intravenous injection and then start the slowermaintenance infusion.
For Drugs which can be given as a bolusFor example, using theophylline again.
To achieve Cpss = 14.1 mg/L; k0 = 60 mg/hr; V = 25 L; kel = 0.17 hr- 1.
A loading dose can be calculated from
thus
DOSE = V • Cp0 = 25 x 14.1 = 353 mg
Figure 6.4.1 Linear Plot of Cp versus Time Showing Bolus, Infusion, and Combined Curves
Click on the figure to view the interactive graph Use the links below for Internet Explorer
Linear - kel/V Semi-log - kel/V
Linear - CL/V Semi-log - CL/V

2/12/14, 6:58 PMc06
Page 10 of 19http://www.boomer.org/c/p4/c06/c06.html
The plasma concentration from the combined bolus and infusion regimen is shown as the black horizontal line inFigure 6.4.1
Javascript Calculators using Equation 6.2.3 and 4.5.2
Calculator 6.4.1 Calculate Cp given k0, Bolus Dose, kel and V at time t
Enter your own values into each fieldk0 (zero order mass/time) 60
Dose (bolus dose - mass) 353
kel (first order reciprocal time) 0.17
V (volume) 25
t (time) 1
Calculate Cp at time t
Cp from the bolus dose (mass/volume) is:
Cp from the maintenance infusion (mass/volume) is:
The total Cp (mass/volume) is:
An IV bolus and maintenance infusion is one way to achieve a steady state plasma concentration rapidly andmaintain it. However, we may not be able to give a bolus dose intravenously so another approach may be necessary.
This page was last modified: Thursday 24 Jan 2013 at 09:39 AM
Material on this website should be used for Educational or Self-Study Purposes Only
Copyright © 2001-2014 David W. A. Bourne ([email protected])
2/12/14, 6:58 PMc06
Page 11 of 19http://www.boomer.org/c/p4/c06/c06.html
PHAR 7633 Chapter 6
Intravenous Infusion
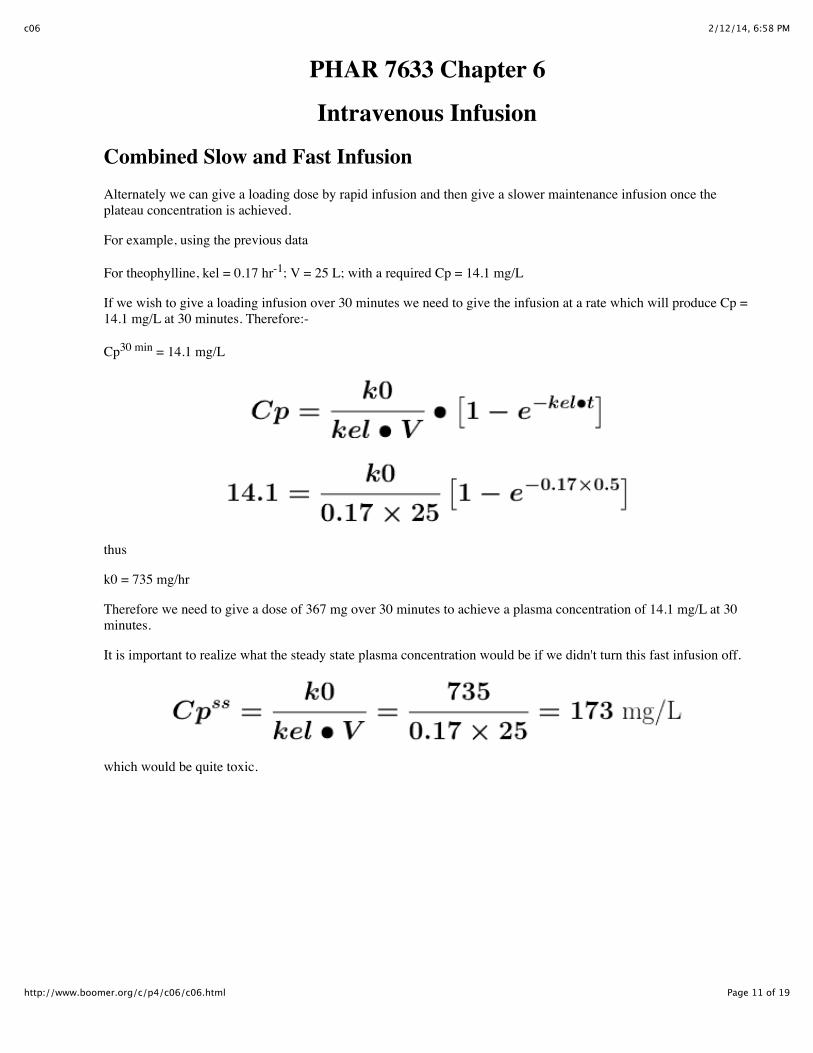
Combined Slow and Fast InfusionAlternately we can give a loading dose by rapid infusion and then give a slower maintenance infusion once theplateau concentration is achieved.
For example, using the previous data
For theophylline, kel = 0.17 hr-1; V = 25 L; with a required Cp = 14.1 mg/L
If we wish to give a loading infusion over 30 minutes we need to give the infusion at a rate which will produce Cp =14.1 mg/L at 30 minutes. Therefore:-
Cp30 min = 14.1 mg/L
thus
k0 = 735 mg/hr
Therefore we need to give a dose of 367 mg over 30 minutes to achieve a plasma concentration of 14.1 mg/L at 30minutes.
It is important to realize what the steady state plasma concentration would be if we didn't turn this fast infusion off.
which would be quite toxic.

2/12/14, 6:58 PMc06
Page 12 of 19http://www.boomer.org/c/p4/c06/c06.html
Figure 6.5.1 Linear Plot of Cp versus Time showing Combined and Separate Curves for Both Infusions
Click on the figure to view the interactive graph Use the links below for Internet Explorer
Linear - kel/V Semi-log - kel/V
Linear - CL/V Semi-log - CL/V
Consequently we would need to ensure that at 30 minutes the rapid infusion rate was slowed from 735 mg/hr to 60mg/hr. One way to do this would be to only provide 367 mg (or 360 mg) in the infusion syringe at first.
The dosing regimen (or controlled sequence of drug administration) to achieve the desired plasma concentration is:-
a) a loading dose by IV infusion of 367 mg/30 minutes followed by
b) a maintenance IV infusion of 60 mg/hr
2/12/14, 6:58 PMc06
Page 13 of 19http://www.boomer.org/c/p4/c06/c06.html
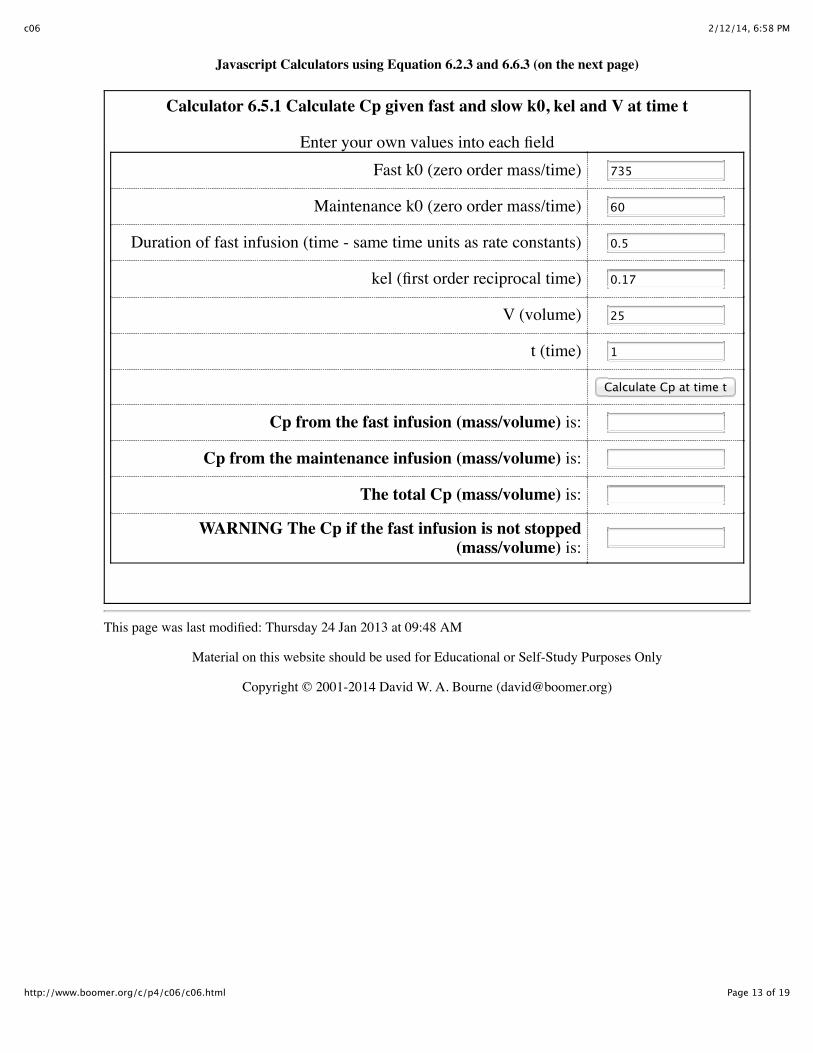
Javascript Calculators using Equation 6.2.3 and 6.6.3 (on the next page)
Calculator 6.5.1 Calculate Cp given fast and slow k0, kel and V at time t
Enter your own values into each fieldFast k0 (zero order mass/time) 735
Maintenance k0 (zero order mass/time) 60
Duration of fast infusion (time - same time units as rate constants) 0.5
kel (first order reciprocal time) 0.17
V (volume) 25
t (time) 1
Calculate Cp at time t
Cp from the fast infusion (mass/volume) is:
Cp from the maintenance infusion (mass/volume) is:
The total Cp (mass/volume) is:
WARNING The Cp if the fast infusion is not stopped(mass/volume) is:
This page was last modified: Thursday 24 Jan 2013 at 09:48 AM
Material on this website should be used for Educational or Self-Study Purposes Only
Copyright © 2001-2014 David W. A. Bourne ([email protected])

2/12/14, 6:58 PMc06
Page 14 of 19http://www.boomer.org/c/p4/c06/c06.html
PHAR 7633 Chapter 6
Intravenous Infusion
Post InfusionBefore moving on we should look at the equation for plasma concentration after an infusion is stopped.
Remember that the equation for plasma concentration versus time during an IV infusion is:
Equation 6.6.1 Drug Concentration during an IV Infusion
If the infusion is continued indefinitely then the plasma concentration approaches a steady state plasmaconcentration.
If however the infusion is stopped the plasma concentration can be expected to fall.
Scheme or diagram
Figure 6.6.1 During and After an IV Infusion - One Compartment Model
The scheme shown to represent 'after the infusion is stopped' is the same as that for the bolus injection.
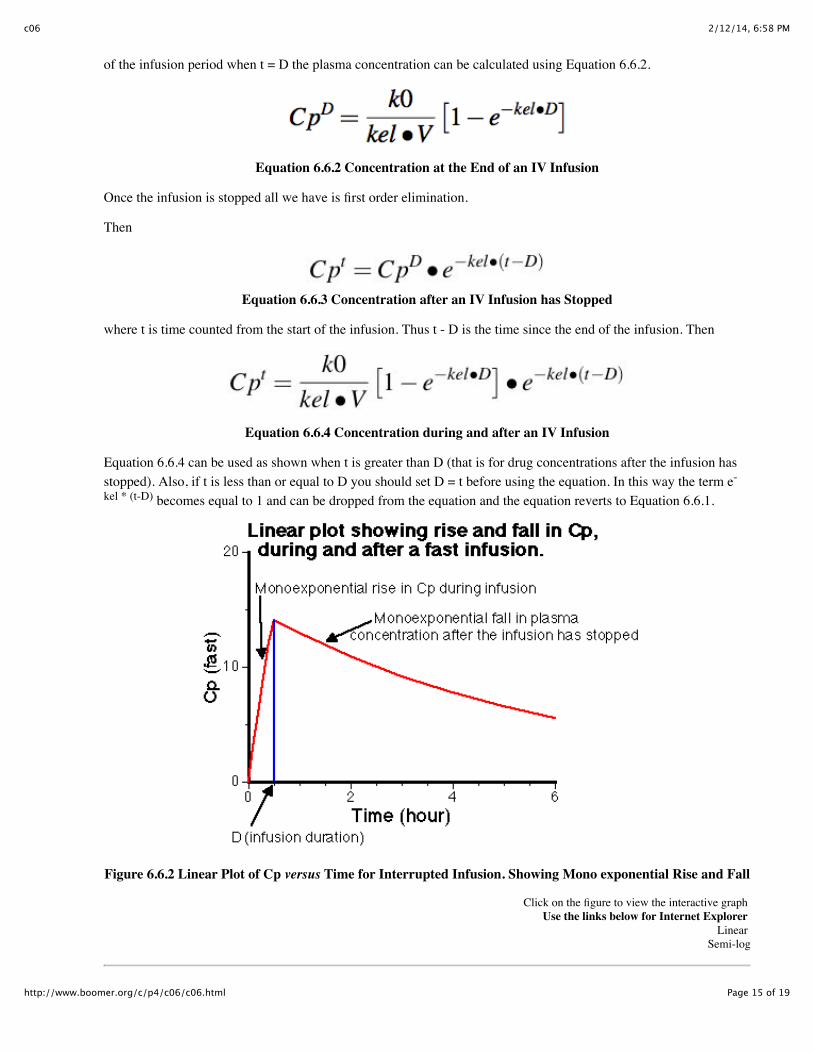
EquationsThe equation for drug concentration versus time during an IV infusion is shown above as Equation 6.6.1. At the end
2/12/14, 6:58 PMc06
Page 15 of 19http://www.boomer.org/c/p4/c06/c06.html
of the infusion period when t = D the plasma concentration can be calculated using Equation 6.6.2.
Equation 6.6.2 Concentration at the End of an IV Infusion
Once the infusion is stopped all we have is first order elimination.
Then
Equation 6.6.3 Concentration after an IV Infusion has Stopped
where t is time counted from the start of the infusion. Thus t - D is the time since the end of the infusion. Then
Equation 6.6.4 Concentration during and after an IV Infusion
Equation 6.6.4 can be used as shown when t is greater than D (that is for drug concentrations after the infusion hasstopped). Also, if t is less than or equal to D you should set D = t before using the equation. In this way the term e-kel * (t-D) becomes equal to 1 and can be dropped from the equation and the equation reverts to Equation 6.6.1.
Figure 6.6.2 Linear Plot of Cp versus Time for Interrupted Infusion. Showing Mono exponential Rise and Fall
Click on the figure to view the interactive graph Use the links below for Internet Explorer
Linear Semi-log

2/12/14, 6:58 PMc06
Page 16 of 19http://www.boomer.org/c/p4/c06/c06.html
If we use the previous example data, V = 25 L; kel = 0.17 hr-1; D = 0.5 hour; and k0 = 735 mg/hr, what would be theplasma concentration be at 4.5 hours (t = 4.5 hours). That is if we stop the loading infusion and don't start themaintenance infusion.
Figure 6.6.3 Semi-log Plot of Cp versus Time. NOTE: Intercept is not Cp0
Click on the figure to view the interactive graph
Thus 4 hours after the infusion was stopped the drug concentration has fallen to half the value at the end of theinfusion. Did you remember that the drug half-life was 4 hours.

2/12/14, 6:58 PMc06
Page 17 of 19http://www.boomer.org/c/p4/c06/c06.html
Example Calculation
Following a two-hour infusion of 100 mg/hr plasma samples were collected and analysed for drug concentration.Calculate kel and V.
Time (hr) 3 5 9 12 18 24
Cp (mg/L) 12 9 8 5 3.9 1.7
Figure 6.6.4 Plot of Cp versus Time after a Two-Hour Infusion
The red line drawn through the data points and back to the Y-axis represents the best-fit line.
Rearranges to

2/12/14, 6:58 PMc06
Page 18 of 19http://www.boomer.org/c/p4/c06/c06.html
Javascript Calculators using Equation 6.6.4
Calculator 6.6.1 Calculate kel and V given post infusion Cp versus time data
Enter a value for the infusion rate and duration (< 3 hr)Infusion rate k0 (zero order mass/time) 100
Infusion duration < 3 (time) 2
Generate a new Cp versus time data set
Cp at 4 hours (mg/L)
Cp at 5 hours (mg/L)
Cp at 6 hours (mg/L)
Cp at 9 hours (mg/L)
Cp at 12 hours (mg/L)
Cp at 24 hours (mg/L)
Click here to see the answer
kel (first order reciprocal time)
V (volume)
Something to consider
Item 1. Which equation should you use. That is, is the simpler IV bolus dose equation close enough or is the 'full' IVinfusion equation necessary. Winter (Winter 2004) suggests using the drug elimination half-life as a criteria. That is,if the infusion duration is less than 1/6th of the elimination half-life the simpler IV bolus equation is satisfactory,within 10%. When the infusion duration is longer the more complete IV infusion equation is better.
First try simulating concentration versus time after an IV bolus: Dose = 250 mg; D = 0 hr (IV Bolus); kel = 0.123 hr-1; V = 25 L. Contrast this with an IV infusion of the same dose over an infusion duration of 1 or 2 hours. Explore theproblem as a Linear Plot - Interactive graph Winter 2004.
For practice try calculating required infusion rates and parameter values. Compare your answers with thecomputer! These problems include bolus/infusion and fast/slow infusion regimen calculations as well as parametersdeterminations from two post infusion drug concentrations.

2/12/14, 6:58 PMc06
Page 19 of 19http://www.boomer.org/c/p4/c06/c06.html
For practice try estimating various parameter values from post infusion data. Compare your answers with thecomputer! These problems include graphing post infusion drug concentration data on semi-log graph paper andestimating parameters from the slope and intercept of the best-fit line.
References
Winter, M.E. 2004 Basic Clinical Pharmacokinetics, 4th ed., Lippincott Williams & Wilkins, Baltimore, p61-63
Student Objectives for this ChapterThis page (http://www.boomer.org/c/p4/c06/c0606.html) was last modified: Tuesday 21 Jan 2014 at 09:02 PM
Material on this website should be used for Educational or Self-Study Purposes Only
Copyright © 2001-2014 David W. A. Bourne ([email protected])