pfizer little island
TRANSCRIPT

Pfizer Little IslandIEL Groundwater MonitoringRound 2 (November) 2016
Pfizer Ireland Pharmaceuticals Limited
Project Reference: CKRP0002Project Number: 6048815112 December 2016
For
insp
ectio
n pur
pose
s only
.
Conse
nt of
copy
right
owne
r req
uired
for a
ny ot
her u
se.
EPA Export 10-04-2017:02:56:33
Pfizer Little Island Pfizer Ireland Pharmaceuticals LimitedProject Reference: CKRP0002
Prepared for: Pfizer Ireland Pharmaceuticals LimitedCkrp0002 Pfizer Little Island Round 2 2016 Final
AECOM
Quality informationPrepared by Checked by Approved by
Fergus O'ReganSenior Environmental Scientist
Kevin FordeAssociate Director
Kevin FordeAssociate Director
Revision HistoryRevision Revision date Details Name Position
1 12 December 2016 Final Kevin Forde Associate Director
For
insp
ectio
n pur
pose
s only
.
Conse
nt of
copy
right
owne
r req
uired
for a
ny ot
her u
se.
EPA Export 10-04-2017:02:56:33

Pfizer Little Island Pfizer Ireland Pharmaceuticals LimitedProject Reference: CKRP0002
Prepared for: Pfizer Ireland Pharmaceuticals LimitedCkrp0002 Pfizer Little Island Round 2 2016 Final
AECOM
Prepared for:Pfizer Ireland Pharmaceuticals LimitedWallingstownLittle IslandCork
Prepared by:Fergus O'ReganSenior Environmental ScientistT: +353 (21) 4365 006M: +353 (87) 3295 461E: [email protected]
AECOM Ireland LimitedDouglas Business CentreCarrigaline RoadDouglasCork
T: +353 21 4365 006aecom.com
© 2016 AECOM Ireland Limited. All Rights Reserved.
This document has been prepared by AECOM Ireland Limited (“AECOM”) for sole use of our client (the “Client”)in accordance with generally accepted consultancy principles, the budget for fees and the terms of referenceagreed between AECOM and the Client. Any information provided by third parties and referred to herein has notbeen checked or verified by AECOM, unless otherwise expressly stated in the document. No third party may relyupon this document without the prior and express written agreement of AECOM.
For
insp
ectio
n pur
pose
s only
.
Conse
nt of
copy
right
owne
r req
uired
for a
ny ot
her u
se.
EPA Export 10-04-2017:02:56:33

Pfizer Little Island Pfizer Ireland Pharmaceuticals LimitedProject Reference: CKRP0002
Prepared for: Pfizer Ireland Pharmaceuticals LimitedCkrp0002 Pfizer Little Island Round 2 2016 Final
AECOM
Table of ContentsExecutive Summary .......................................................................................................................................... 51. Introduction ............................................................................................................................................ 7
1.1 Background Information ............................................................................................................... 71.1.1 Site History ................................................................................................................................. 71.1.2 Site Description, Topography and Setting ..................................................................................... 71.1.3 Hydrology ................................................................................................................................... 81.1.4 Soils and Geology ....................................................................................................................... 81.1.5 Hydrogeology .............................................................................................................................. 91.1.6 Groundwater Flow ....................................................................................................................... 91.1.7 Groundwater Redox Chemistry .................................................................................................... 91.1.8 Chemicals of Potential Concern ................................................................................................. 101.1.9 Source-Pathway-Receptor Linkages .......................................................................................... 101.1.10 Monitoring Network and Sampling Schedule............................................................................... 111.2 Project Objectives ..................................................................................................................... 111.3 Scope of Works ......................................................................................................................... 111.3.1 Sampling Methodology .............................................................................................................. 121.3.2 Laboratory Analyses .................................................................................................................. 12
2. Results and Discussion of Monitoring Programme ................................................................................. 132.1 Site Hydrogeology and Groundwater Flow.................................................................................. 132.1.1 Water Quality Parameters .......................................................................................................... 132.1.2 Groundwater Flow Gradient ....................................................................................................... 132.1.3 Field Observations .................................................................................................................... 132.2 Laboratory Analysis of Groundwater Samples ............................................................................ 142.2.1 Assessment Guidelines ............................................................................................................. 142.2.2 Groundwater Monitoring Results ................................................................................................ 142.2.2.1Volatile Organic Compounds ...................................................................................................... 142.2.2.2Semi-Volatile Organic Compounds ............................................................................................. 142.2.2.3Major Ions ................................................................................................................................. 142.2.2.4Duplicate Sample ...................................................................................................................... 152.2.3 Temporal Trends in Chemicals of Potential Concern ................................................................... 152.3 Conceptual Site Model............................................................................................................... 162.3.1 Potential Pollutant Linkages ....................................................................................................... 17
3. Summary, Conclusions and Recommendations ..................................................................................... 193.1 Summary and Conclusion .......................................................................................................... 193.2 Recommended Way Forward ..................................................................................................... 19
FiguresTablesAppendix A – Laboratory Certificates
For
insp
ectio
n pur
pose
s only
.
Conse
nt of
copy
right
owne
r req
uired
for a
ny ot
her u
se.
EPA Export 10-04-2017:02:56:33

Pfizer Little Island Pfizer Ireland Pharmaceuticals LimitedProject Reference: CKRP0002
Prepared for: Pfizer Ireland Pharmaceuticals LimitedCkrp0002 Pfizer Little Island Round 2 2016 Final
AECOM5
Executive SummaryThe second groundwater monitoring round for 2016 was conducted by AECOM on 03 November 2016 at thePfizer Ireland Pharmaceuticals Limited site, Little Island, Co. Cork. The monitoring was completed in accordancewith the site’s Industrial Emissions Licence (IEL) and is reported in accordance with Stage 1 - Step 2 of theEnvironmental Protection Agency’s (EPA’s) Guidance on the Management of Contaminated Land andGroundwater at EPA Sites, issued in 2013.
During November 2016, groundwater from the following monitoring wells was sampled:
· 200-series wells – wells 203 (plus duplicate Dup 01) and 207
· 300-series wells – wells 301, 302, 304 and 305
· 600-series wells – well 604
No floating/sinking non-aqueous phase liquid layer was detected in any of the groundwater monitoring wells.
The site is underlain by sand and gravel fill, overlying natural gravelly silt, which in turn overlies limestonegravels. Depth to bedrock has not been proven (>16 m below ground level) on the Pfizer Little Island site. Thegeneral groundwater flow direction in the gravel aquifer in November 2016 was to the north and north-west(toward Bury’s Bridge Basin).
Field measurements of water quality parameters and low nitrate concentrations are consistent with results ofprevious monitoring rounds and indicate that groundwater beneath the site is low in dissolved oxygen and isreducing (anaerobic). However, groundwater is no longer sufficiently reducing for the widespread generation ofhydrogen sulphide gas – hydrogen sulphide odours were detected during purging and sampling of two of theseven wells monitored in November 2016.
Groundwater analytical results for methyl tertiary butyl ether (MTBE) in November 2016 are similar to theprevious monitoring round in April 2016. In November 2016, MTBE was detected above the GroundwaterThreshold Value (GTV) (0.010 mg/L) at wells 203 (0.0104 mg/L), 302 (0.015 mg/L) and 604 (0.265 mg/L);however, all concentrations of MTBE were reported below the IGV.
Volatile organic compound (VOC) results for groundwater monitoring conducted in November 2016 are amongstthe lowest recorded in recent years. Between April 2016 and November 2016, the MTBE concentrationdecreased to below the EPA Draft Interim Guideline Value (IGV) of 0.030 mg/L in groundwater from well 203(from 0.045 mg/L to 0.010 mg/L).
In April 2014, the EPA requested that well 604, (drilled on the Buffer Property in November 2013) be included inall future groundwater monitoring rounds. Concentrations of MTBE at well 604 have declined between April 2014(0.162 mg/L) and November 2016 (0.0265 mg/L). The November 2016 MTBE result for well 604 is the lowestresult to date.
The continual detection of MTBE in groundwater from well 604 since it was drilled and installed in November2013 indicates that MTBE is continuing to be flushed through the sand and gravel aquifer beneath the sitetowards Bury’s Bridge Basin.
Toluene was not detected in groundwater from any well sampled in November 2016; the most recent toluenedetection on the site was in March 2009 at well 203 (0.002 mg/L).
Excluding MTBE, no other VOCs from the standard suite of VOCs were detected above laboratory methoddetection limits (MDLs).
In the 2000 Qualitative Risk Assessment (QRA), AECOM (then URS Dames & Moore) estimated that worst-caseMTBE concentrations of up to 10 mg/L in Bury’s Bridge Basin would not cause significant harm to the aquaticecosystem1.
Given that MTBE concentration close to the down-gradient site boundary in November 2016 is more than twoorders of magnitude lower than 10 mg/L (0.027 mg/L at well 604) and the potential for dilution in the basin isgreat, potential environmental impact of MTBE in groundwater discharging to the basin under November 2016conditions is considered to be negligible.
1 URS Dames & Moore (AECOM legacy company) report, 13218-123-447, dated January 2001
For
insp
ectio
n pur
pose
s only
.
Conse
nt of
copy
right
owne
r req
uired
for a
ny ot
her u
se.
EPA Export 10-04-2017:02:56:33
Pfizer Little Island Pfizer Ireland Pharmaceuticals LimitedProject Reference: CKRP0002
Prepared for: Pfizer Ireland Pharmaceuticals LimitedCkrp0002 Pfizer Little Island Round 2 2016 Final
AECOM6
Based on the Round 2 2016 groundwater monitoring results, AECOM continue to recommend that the frequencyof groundwater sampling be reduced from biannually to annually.
For
insp
ectio
n pur
pose
s only
.
Conse
nt of
copy
right
owne
r req
uired
for a
ny ot
her u
se.
EPA Export 10-04-2017:02:56:33

Pfizer Little Island Pfizer Ireland Pharmaceuticals LimitedProject Reference: CKRP0002
Prepared for: Pfizer Ireland Pharmaceuticals LimitedCkrp0002 Pfizer Little Island Round 2 2016 Final
AECOM7
1. IntroductionAECOM Professional Services Ireland Limited (AECOM) was requested by Pfizer Ireland PharmaceuticalsLimited (Pfizer) to conduct biannual groundwater monitoring during 2016 at their Little Island facility, Co. Cork.The groundwater monitoring programme was detailed in AECOM Proposal OPP-454637, dated 29 January 2016and authorised by Pfizer under their purchase order number N-3604810, dated 01 February 2016.
The AECOM team for Round 2 November 2016 comprised the following:
· Project Director: Kevin Forde, Associate Director
· Project Manager and Field Scientist: Fergus O’Regan, Senior Environmental Scientist
Laboratory analysis of samples was subcontracted to Exova Jones Laboratories, Flintshire, U.K.; an-AECOMapproved laboratory with UKAS accreditation.
1.1 Background Information
1.1.1 Site History
The Pfizer Little Island facility is situated in an industrial estate approximately 8 kilometres (km) east of Cork city.A site location plan is presented as Figure 1.
The facility, originally developed in 1978 by Plaistow Limited, manufactures synthetic chemicals of bulk activepharmaceutical ingredients (API) for use in the pharmaceutical industry. Warner Lambert acquired the site in1997 and merged with Pfizer in 2000.
The site was granted an Integrated Pollution Control (IPC) licence (P0136-01) in December 1996 by theEnvironmental Protection Agency (EPA). The licence was revised to an Integrated Pollution, Prevention andControl (IPPC) in September 2007 (P0136-03). The IPPC licence was most recently revised in 2010 (P0136-04).IPPC licence P0136-04 was converted by the EPA in January 2014 to an Industrial Emissions Licence (IEL) inline with provisions and requirements of Council Directive 2010/75/EU.
Groundwater and localised soil contamination by organic solvents, predominantly methyl tertiary butyl ether(MTBE) and toluene have been previously identified at the Pfizer Little Island facility. Groundwater dischargesfrom the facility to a tidal surface water body adjacent to the site called Bury’s Bridge Basin.
Significant upgrades to the site’s effluent drainage system were made between 2006 and 2008 by Pfizer,including bringing effluent drainage above ground where feasible.
Based on the decline in MTBE concentrations across the site, risk assessment of the presence of MTBE ingroundwater in 2001 predicted no significant environmental impacts on the aquatic flora and fauna in Bury’sBridge Basin due to exposure to low concentrations of MTBE2.
1.1.2 Site Description, Topography and Setting
The main site comprises a manufacturing facility with associated administration buildings, on-site and off-site carparks and a wastewater treatment plant (WWTP). The site manufactures bulk API and is often referred to as theAPI site. The API site is approximately 4.5 ha in area.
In 2005, Pfizer acquired approximately 2.26 ha of land located to the west of the API site. This area is referred toas the ‘Buffer Property’ (BP) and was incorporated within a revised site boundary in the IPPC licence revision forthe main site in 2007/2008 (IPPC licence revision P0136-03).
In general, the API site slopes upwards to the north, before sloping down towards Bury’s Bridge Basin, a tidalchannel located immediately north of the site. Ground elevation at the site varies between approximately 2 m and11 m above Ordnance Datum (aOD).
2 AECOM report, Assessment of MTBE Persistence in the Source Area, Pfizer, Little Island, Cork, dated 14 November 2002,ref. 17717-113-447/KF
For
insp
ectio
n pur
pose
s only
.
Conse
nt of
copy
right
owne
r req
uired
for a
ny ot
her u
se.
EPA Export 10-04-2017:02:56:33
Pfizer Little Island Pfizer Ireland Pharmaceuticals LimitedProject Reference: CKRP0002
Prepared for: Pfizer Ireland Pharmaceuticals LimitedCkrp0002 Pfizer Little Island Round 2 2016 Final
AECOM8
By contrast, the BP is relatively flat and is at a general elevation of less than 5 m aOD (Malin). The BP is at alower elevation than surrounding lands to the west, south and east, which reach elevations of approximately 10 maOD to the south and east and up to 15 m aOD to the west.
Land use in the vicinity of the main API site is predominantly commercial/industrial, as summarised below:
North – Bury’s Bridge Basin and N25 dual carriageway.
South – Cara Partners (IEL P0017-02, a homeopathic medicine production facility) is located to the south.Further south is the Little Island main road, with the shoreline of Cork Harbour 75 m beyond that.
East – Industrial units (including John Davis Design and the empty former Showerlux site) are to the east withopen grassland beyond (~100m to the east of the site). Further to the east (~200m to the east of the site) is amajor development of office and light industrial facilities (Eastgate Business Park).
West – Cara Partners fire water retention pond and a Gas Networks Ireland (formerly Bord Gais Eireann) aboveground installation (AGI, gas transmission infrastructure) immediately to the west. Further to the west is the BP,and beyond that (~150m west of the site) is Tapella Limited (Integrated Pollution Control (IPC) licence P0103-02,former pharmaceutical facility), where a number of small start-up businesses occupy the former office, laboratoryand warehouse buildings (now termed the Hoffman Science Technology Enterprise Park). The other buildingsassociated with the former pharmaceutical facility have been demolished in 2015/2016.
The BP has not been developed since it was acquired in 2005, other than fencing-off the boundaries of the areaand some improvements to the surface water drainage. Bury’s Bridge Basin lies on the northern boundary of theBP and beyond that is the N25 dual carriageway.
Other nearby chemical/pharmaceutical facilities include:
· Janssen Pharmaceuticals, (IEL P016-02)
· FMC (pharmaceutical)
· Thornbush Holdings Limited, (IPC licence P0389-01)
Little Island is also shared by a small number of residences. Within 1 km of the facility there is a population ofapproximately 500 people and a primary school is located approximately 1 km to the east of the facility.
A site layout plan is presented as Figure 2.
1.1.3 Hydrology
Little Island is located in the northern part of Cork Harbour called Lough Mahon. Bury’s Bridge Basin, a tidalchannel on the sites northern boundary, eventually flows into Lough Mahon, which is located approximately750 m west of the site. The basin comprises of a mudflat, and a narrow intertidal channel.
The estuarine water quality in Lough Mahon (2010 – 2012 data) is classified as ‘Intermediate’ by the EPA3.
Under the Water Framework Directive (WFD) (2009-2015 data), Lough Mahon, a Transitional Waterbody, isclassified as ‘Moderate’.
There are no significant rivers in close proximity to the API production site or BP. The nearest river is theGlashaboy River, which is located approximately 1.5 km north-west of the industrial estate and which flows fromnorth to south into Lough Mahon.
1.1.4 Soils and Geology
Geological Survey of Ireland (GSI) data4 indicate that the bedrock aquifer underlying the site consists of‘Dinantian Pure Unbedded Limestone’. According to the GSI, the majority of the site is covered with madeground overlying bedrock, with glacial sandstone tills occupying a small section in the eastern part of the site,however site-specific geological data contradicts the GSI information and indicates tills overlying sands andgravels below the fill across the entire site.
3 www.epa.ie, accessed on 25 November 20164 www.gsi.ie
For
insp
ectio
n pur
pose
s only
.
Conse
nt of
copy
right
owne
r req
uired
for a
ny ot
her u
se.
EPA Export 10-04-2017:02:56:33

Pfizer Little Island Pfizer Ireland Pharmaceuticals LimitedProject Reference: CKRP0002
Prepared for: Pfizer Ireland Pharmaceuticals LimitedCkrp0002 Pfizer Little Island Round 2 2016 Final
AECOM9
Subsoil thickness varies across the Pfizer Little Island site, with actual drilling records indicating sand and gravelfill overlying natural gravelly silts overlying limestone gravels. Drilling on site has not proven depth to bedrock(>16 m below ground level (bgl)). Limestone rock outcrop and subcrop are also located in the vicinity of theformer Inchera House and Quarry, located approximately 600 m west of the site boundary.
1.1.5 Hydrogeology
According to the GSI online maps, the Waulsortian bedrock aquifer in the region is classified as a RegionallyImportant Aquifer – karstified, diffuse (Rkd). Northern sections of the site border a “locally important aquifer (LI),which is moderately productive in local zones”. The GSI classifies the interim vulnerability of the underlyingaquifer as ‘High’.
There is a groundwater abstraction well on the API production site. The well was drilled in 2010 on the easternside of the site to approximately 16 m bgl and installed within the gravel aquifer. Water from the well (referred toin this report as the Production Well) was being used for cooling purposes in the WWTP. The daily averagevolume of water abstracted from the Production Well during 2014 was 23 m3/d, with elevated salinity. There hasbeen no abstraction of groundwater from the well since early December 2014.
Two wells are recorded in the GSI database within a 1 km radius of the API site. One borehole is identifiedapproximately 300 m to the south, with a second well (industrial use) approximately 650 m to the south-east ofthe site. No details are available as to whether the wells are currently in use; what geological unit the wellsabstract groundwater from; or, the depth from which they abstract groundwater. Given that groundwater in thiscoastal area is likely to be brackish and, as they are situated in a heavily commercial/industrial area, it is unlikelythat wells for potable use are located in the vicinity of the site. It is considered that wells in the vicinity of the siteare likely to be groundwater monitoring wells or used for industrial supply purposes.
There are four wells reported on the GSI database within 2 km radius of the BP, all of which are groundwatermonitoring wells installed at industrial sites as part of the conditions attached to EPA regulatory licences.
Groundwater vulnerability in the general Wallingstown area is assessed as “High” by the GSI because of thepredominantly thin and permeable subsoils present, with areas of “Extreme” vulnerability immediately to the westof the BP (rock mapped at, or close to, the surface, there is an old limestone quarry in this area).
1.1.6 Groundwater Flow
Depth to groundwater ranges from approximately 3.0 m to 6.0 m below casing top (m bct); with groundwater flowdirections in the limestone gravel aquifer beneath the main site to the north and north-west (towards Bury’sBridge Basin).
The majority of the API site is covered by either concrete hard standing or tarmac at ground level, which restrictsinfiltration of rainfall to the gravel aquifer beneath.
Given its proximity to the tidal Bury’s Bridge Basin, groundwater beneath the BP is anticipated to show tidalfluctuations. Groundwater is interpreted to follow the topography and flow from more elevated lands surroundingthe BP, possibly converging on the BP from the west, south and east.
Groundwater from beneath the BP is expected to discharge northward to Bury’s Bridge Basin. There is historicaldirect evidence of groundwater discharge to the basin via coarser areas within the tidal mud flats to theimmediate north-west of the main site at low tide; however these areas have been subsequently infilled anddeveloped.
1.1.7 Groundwater Redox Chemistry
Field measurements of dissolved oxygen (DO) and oxidation redox potential (ORP), together with low nitrateconcentrations, suggest groundwater conditions are both reducing and anaerobic down-gradient of the formerAeration Basin area of the site. However, groundwater is no longer sufficiently reducing for the widespreadgeneration of hydrogen sulphide gas – hydrogen sulphide odours were detected during purging and sampling oftwo of the seven wells monitored in November 2016.
For
insp
ectio
n pur
pose
s only
.
Conse
nt of
copy
right
owne
r req
uired
for a
ny ot
her u
se.
EPA Export 10-04-2017:02:56:33

Pfizer Little Island Pfizer Ireland Pharmaceuticals LimitedProject Reference: CKRP0002
Prepared for: Pfizer Ireland Pharmaceuticals LimitedCkrp0002 Pfizer Little Island Round 2 2016 Final
AECOM10
1.1.8 Chemicals of Potential Concern
Groundwater monitoring results are available going back to 1997 for selected wells (see Table 7). MTBE is theonly remaining chemical of potential concern (COPC) detected in groundwater beneath the site.
Toluene had historically been widely detected in groundwater beneath the site, but has remained below thelaboratory method detection limit (MDL) since March 2009.
Other VOCs, such as chloroform and 1-1, dichloroethane (1,1-DCA), are occasionally detected in groundwaterfrom monitoring wells, but generally at low concentrations.
Since significant upgrades to the site effluent drainage system between 2006 and 2008, the general trend hasbeen for VOC concentrations in groundwater to decrease.
The highest VOC concentration historically reported was for MTBE, detected in groundwater from monitoring well404 at a peak concentration of 1,098 mg/L in May 2005. This well is located in the south western corner of thesite, in the area of the former Aeration Basin. Since May 2011, MTBE concentrations in groundwater from well404 have been below 0.20 mg/L.
The highest concentration historically reported for toluene was 190 mg/L, detected in groundwater frommonitoring well 203 in November 1997. Since September 2009, toluene results from well 203 have beenconsistently below the laboratory MDL (0.0005 mg/L).
1.1.9 Source-Pathway-Receptor Linkages
A summary of potential Source-Pathway-Receptor (SPR) linkages are outlined in the table below.
POTENTIAL SPR LINKAGES
Sources Pathways Receptor
S1 MTBE and other VOCs in soiland groundwater related tohistorical leaks from undergroundpipelines
Human HealthP1 Ingestion of soil/dust,groundwater or surface waterP2 Dermal contact with soil,dust, and groundwaterP3 Inhalation of indoor andoutdoor contaminant vapourswhich can arise directly fromresidual contaminants in theunsaturated overburden itselfand indirectly via the dissolvedphase in groundwater
Human HealthR1 On-site workersR2 Off-site workersR3 Workers on-siteundertakingsubsurface works
Controlled WatersP4 Lateral migration ofcontaminants through thegravel aquifer
Water Supply WellThere are noknown potablewater supplieswithin 300 m of siteOn-site productionwell – used forcooling purposesonly and notpotable supply
Controlled WatersR4 Bury’s BridgeBasinR5 Cork HarbourSPA (No. 004030)R6 Dunkettle Shore(pNHA)
For
insp
ectio
n pur
pose
s only
.
Conse
nt of
copy
right
owne
r req
uired
for a
ny ot
her u
se.
EPA Export 10-04-2017:02:56:33
Pfizer Little Island Pfizer Ireland Pharmaceuticals LimitedProject Reference: CKRP0002
Prepared for: Pfizer Ireland Pharmaceuticals LimitedCkrp0002 Pfizer Little Island Round 2 2016 Final
AECOM11
1.1.10 Monitoring Network and Sampling Schedule
Over several years of site investigation, Pfizer has built up a network of monitoring wells on the API site.Monitoring wells on-site are screened at various depths but all are within subsoils; there are no deep monitoringwells screened within the bedrock aquifer.
In November 2013, four boreholes were drilled on the BP to a maximum depth of 10 m bgl, to assist in thepreparation of a hydrogeological assessment report5. All four groundwater monitoring wells were screened withinthe gravel aquifer.
Former IPC and IPPC licence requirements included monitoring of groundwater on a monthly and quarterly basisacross the site from selected wells.
Due to improvements in infrastructure and groundwater quality at the site, the EPA agreed in 2007 to reducegroundwater monitoring frequency from quarterly to biannually, under a revised IPPC licence.
In May 2010, the EPA further agreed to remove wells 403 and 501 from the sampling schedule and requestedthat wells 206 and 303 be monitored biennially, as opposed to biannually.
As agreed with the EPA in August 2012, wells 201, 202, 205A and 405 were removed from monitoring schedule.
Groundwater from the following wells is currently sampled in accordance with the site’s IEL:
· Biannual sampling: 203, 207, 301, 302, 304, 305, 404
· Biennial sampling: 206 and 303
In February 2014, the EPA also requested that well 604 be sampled in all future groundwater monitoring rounds.
The suite of parameters analysed for in each monitoring round generally includes:
· VOCs
· Semi-Volatile Organic Compounds (SVOCs), including polycyclic aromatic hydrocarbons (PAHs)
· Major Ions (calcium, magnesium, potassium, sodium, sulphate, chloride, nitrate and total alkalinity)
· pH
· Electrical conductivity (EC)
1.2 Project Objectives
The main objective of groundwater monitoring is to ensure that the Pfizer Little Island site complies withgroundwater monitoring requirements detailed in the site’s IEL and as agreed with the EPA.
Secondary objectives of the monitoring are:
· To assess short and long-term concentration trends in key chemicals of potential concern for the selectedwells
· To assess groundwater flow direction in the gravel aquifer
1.3 Scope of Works
Fieldwork for Round 2 2016 monitoring was carried out on 03 November 2016.
The scope of work for Round 2 IEL groundwater sampling comprised sampling from six on-site monitoring wellsand one off-site monitoring well on the BP as follows:
· 200-series wells – wells 203 (plus duplicate sample Dup 01) and 207
· 300-series wells – wells 301, 302, 304 and 305
· 600-series wells – well 604 (located on the BP)
5 AECOM Report, CKRP0003/47092578, Issue 4/Final, dated 28 March 2014
For
insp
ectio
n pur
pose
s only
.
Conse
nt of
copy
right
owne
r req
uired
for a
ny ot
her u
se.
EPA Export 10-04-2017:02:56:33
Pfizer Little Island Pfizer Ireland Pharmaceuticals LimitedProject Reference: CKRP0002
Prepared for: Pfizer Ireland Pharmaceuticals LimitedCkrp0002 Pfizer Little Island Round 2 2016 Final
AECOM12
Well 404 is required to be monitored on a biannual basis; however, well 404 was dry during Round 2 2016 and nogroundwater sample was obtained for analysis.
The site layout, showing groundwater sampling locations, is presented in Figure 2.
1.3.1 Sampling Methodology
Prior to sampling, the depth to groundwater in all accessible monitoring wells on site was measured using anelectronic interface probe. An interface probe is capable of distinguishing between water and separate-phasenon-aqueous layers, which can be either more or less dense than water.
Groundwater samples were collected in accordance with AECOM groundwater sampling protocols, usingdedicated sampling equipment in each monitoring well.
Stable measurements of groundwater quality parameters (DO, pH, EC, ORP and temperature) were recordedusing a calibrated water quality meter and flow through cell (where possible). A flow-through cell minimisescontact between the water sample and the atmosphere, which is critical for measuring DO and ORP accurately.
Sample containers were labelled in the field and the details were entered onto a chain of custody form. Sampleswere stored in a chilled cool-box on site and during overnight transit to the laboratory.
1.3.2 Laboratory Analyses
Groundwater samples were sent for analysis to Exova Jones Environmental Laboratory, Flintshire, U.K.; an-AECOM approved laboratory with UKAS accreditation.
Groundwater samples from all wells were submitted for analysis of the following parameters:
· VOCs
· SVOCs
· Major Ions (calcium, magnesium, potassium, sodium, sulphate, chloride, nitrate and total alkalinity)
A duplicate sample was collected from well 203 for quality assurance purposes, labelled as:
· Dup 01
A sample inventory is provided in Table 1. Analytical results are presented in Tables 2 to 4, with laboratorycertificates in Appendix A.
For in
spec
tion p
urpo
ses o
nly.
Conse
nt of
copy
right
owne
r req
uired
for a
ny ot
her u
se.
EPA Export 10-04-2017:02:56:33

Pfizer Little Island Pfizer Ireland Pharmaceuticals LimitedProject Reference: CKRP0002
Prepared for: Pfizer Ireland Pharmaceuticals LimitedCkrp0002 Pfizer Little Island Round 2 2016 Final
AECOM13
2. Results and Discussion of Monitoring Programme
2.1 Site Hydrogeology and Groundwater Flow
2.1.1 Water Quality Parameters
Table 5 presents field water quality measurements of DO, pH, ORP, EC and temperature for all wells sampled inNovember 2016.
In Round 2 2016, DO readings were low across the site, ranging between 1.10 mg/L (well 304) and 4.50 mg/L(well 604).
Field readings of ORP (relative to an Ag/AgCl reference electrode) were compensated as per the manufacturer’sinstructions, giving adjusted redox potential (Eh) readings of between 130 mV (well 203) and 260 mV (well 207).
DO readings and field ORP results generally indicate anaerobic groundwater conditions beneath the site.
Groundwater pH readings were generally close to neutral, ranging between 6.45 (well 301) and 8.10 (well 404) inNovember 2016. All readings were within the typical range for Irish groundwater (6 - 9 pH units).
EC values measured in the field ranged from 330 mS/cm (well 305) to 2,490 mS/cm (well 207). The recorded ECvalues for November 2016 are comparable to those recorded in previous monitoring rounds. The higher ECreading for well 207 confirms analytical results, which show elevated major ion concentrations.
Groundwater temperatures recorded in Round 2 2016 were between 12.3 °C (well 604) and 14.8 °C (well 301).Groundwater temperature values were above the normal range for groundwater in Ireland of 10.0 ºC to 12.0 ºC.
2.1.2 Groundwater Flow Gradient
Depth to groundwater measurements and calculated water table elevations from all accessible wells in Round 22016 are presented in Table 6. Depth to groundwater ranged from 2.525 m bct at well 501 to 6.445 m bct at well301.
A piezometric surface contour map for the deeper gravel aquifer is presented as Figure 3.
The overall direction of groundwater flow is interpreted from the groundwater elevation data to be to the north andnorth-west, toward Bury’s Bridge Basin. This interpretation is consistent with previous interpretations ofgroundwater flow across the site.
2.1.3 Field Observations
During the water level measurement round, no light/dense NAPL layers were identified in any of the wells.
Considerable amounts of silt have entered the well-head chamber at well 207. As had been recommended byAECOM in previous monitoring reports, the cover and headworks of the well have been re-sealed, to preventfurther ingress of silt and surface water run-off.
The total depth of each well, as measured on 03 November 2016, has been compared to the reported welldepths on installation (Table 6). Some siltation has occurred in most wells, with the thickness of silt accumulatingin the base of each well ranging from 0.01 m (well 403) to 2.87 m (well 207). The accumulation of silt in the baseof well 207 has blocked approximately 96% of the total screen length in this well.
During the October 2011 monitoring round, a surge block was used to try to remove this accumulated silt fromwell 207. The well was purged for over an hour and it was considered that the removal of silt was not occurringat a quick enough rate to continue.
Despite the degree of siltation in the base of well 207, it remains a functioning monitoring well and the rate ofrecharge to the well during purging does not appear to have decreased. Therefore, it is not recommended thatmore aggressive rehabilitation methods be undertaken at this stage.
In May 2012, a surge block was used to try and remove accumulated silt from well 202. Well 202 is located inthe production area. Site safety restrictions prevented the use of a petrol powered pump and so well
For
insp
ectio
n pur
pose
s only
.
Conse
nt of
copy
right
owne
r req
uired
for a
ny ot
her u
se.
EPA Export 10-04-2017:02:56:33
Pfizer Little Island Pfizer Ireland Pharmaceuticals LimitedProject Reference: CKRP0002
Prepared for: Pfizer Ireland Pharmaceuticals LimitedCkrp0002 Pfizer Little Island Round 2 2016 Final
AECOM14
rehabilitation was attempted by purging the well by hand. Over 30 litres of water was purged from the well. Finesilt, but mostly coarse black sand was removed from the well. During well rehabilitation the total depth of the welldecreased slightly rather than increased. It is considered possible that the base of the well is damaged and thatcoarse silica sand that was used as a filter pack during the construction of the well, now coated with organicdeposits, is entering at the base of the well.
2.2 Laboratory Analysis of Groundwater Samples
The results of laboratory analysis of groundwater samples are presented in Tables 2 to 4.
2.2.1 Assessment Guidelines
Preliminary assessment of groundwater field and analytical data was completed by comparing the results with arange of generic groundwater assessment criteria, specifically the Groundwater Threshold Values (GTVs), DraftInterim Guideline Values (IGVs) and the Dutch Intervention Values (DIVs).
The GTVs were developed to give effect to measures needed to achieve the objectives of the Water Frameworkand Groundwater Directives. The GTVs were most recently amended in July 2016 and are defined in Irish law inStatutory Instrument No. 366 of 2016, European Communities Environmental Objectives (Groundwater)(Amended) Regulations, 2016. Exceedance of a threshold value triggers further investigation to confirm whethera ‘Poor’ groundwater chemical status for the groundwater body as a whole is indicated.
The IGVs were developed by the EPA in 2002 using a number of existing water quality guidelines in use inIreland, including existing national environmental quality standards, proposed common indicators for the newgroundwater directive, drinking water standards and GSI trigger values.
The DIVs represent concentrations, above which there may be a risk to human receptors, and above which moredetailed site-specific risk assessment or remediation may be required in the Netherlands. These guidelines haveno legal standing in Ireland and are used as a screening tool for assessment of potential contaminants only.
2.2.2 Groundwater Monitoring Results
2.2.2.1 Volatile Organic Compounds
Based on historical data, MTBE is the primary COPC in groundwater at the site. VOC results (including MTBE)are presented in Table 2 and historic results for the main COPCs are presented in Table 7.
The MTBE concentration in groundwater from well 305 was below the laboratory MDL (0.0001 mg/L) inNovember 2016.
In November 2016, MTBE was detected in groundwater from wells 207, 301, 302, 304 and 305 above the MDLbut at concentrations that did not exceed the IGV (0.03 mg/L) or DIV (9.20 mg/L).
MTBE was detected above the GTV (0.0100 mg/L) at wells 203 (0.0104 mg/L), 302 (0.0150 mg/L) and 604(0.0265 mg/L) in Round 2 2016.
All other VOCs concentrations reported in November 2016 were below their respective MDLs.
Other VOCs which have previously been reported in groundwater at the site include chloroform, 1,1-DCA, 1,1,1-trichloroethane and 1,2-dichlorobenzene.
2.2.2.2 Semi-Volatile Organic Compounds
SVOC results are presented in Table 3. No SVOCs were detected above laboratory MDLs in November 2016.
2.2.2.3 Major Ions
As required by the EPA, seven monitoring wells were analysed for selected major ions in November 2016. Majorion results are presented in Table 4.
Major ion results in November 2016 were within previously reported concentration ranges for all of the wells.
For
insp
ectio
n pur
pose
s only
.
Conse
nt of
copy
right
owne
r req
uired
for a
ny ot
her u
se.
EPA Export 10-04-2017:02:56:33

Pfizer Little Island Pfizer Ireland Pharmaceuticals LimitedProject Reference: CKRP0002
Prepared for: Pfizer Ireland Pharmaceuticals LimitedCkrp0002 Pfizer Little Island Round 2 2016 Final
AECOM15
In November 2016, elevated concentrations (relative to the other wells on site) of magnesium (88 mg/L),potassium (16 mg/L), sodium (349 mg/L), sulphate (501 mg/L) and chloride (331 mg/L) were reported ingroundwater from up-gradient well 207.
Each of the listed five major ion concentrations in groundwater from well 207 exceeded their respective IGVs(and GTVs where applicable).
Historically, groundwater from well 207 consistently records the highest major ion concentrations at the site. Well207 is the deepest monitoring well on site and is likely to be intersecting groundwater from the transition zonebetween shallow, fresh groundwater and deeper, more brackish/saline groundwater, which would account for thehigher major ion concentrations. The higher major ion concentrations are also consistent with the higher fieldreading of EC (2,490 µS/cm) for well 207. The nearby Production Well is of similar depth to well 207 and alsointersects brackish/saline water.
2.2.2.4 Duplicate Sample
In November 2016, duplicate sample analysis of groundwater from well 203 was completed for quality assurancepurposes. The primary (well 203) and duplicate (Dup 01) samples were analysed for VOCs and SVOCs. All VOCand SVOC parameters, with the exception of MTBE were below laboratory MDLs. The relative percentagedifference (RPD) for MTBE in the primary and duplicate samples was 8%.
A RPD of <20% is accepted for analytical variation in VOC samples by US EPA; therefore the Round 2 2016duplicate sample analysis is satisfactory.
2.2.3 Temporal Trends in Chemicals of Potential Concern
Groundwater monitoring results are available going back to 1997 for selected wells (see Table 7 and Figures 5 to10).
MTBE is the only remaining compound of concern detected in groundwater at the Pfizer Little Island site.
The following trends in MTBE concentrations were noted in November 2016:
· The MTBE concentration in groundwater from well 203 decreased from 0.0484 mg/L in April 2016 to0.0104 mg/L in November 2016. The November 2016 MTBE result for well 203 marginally exceeded theGTV (0.0100 mg/L), but was less than the IGV (0.030 mg/L) and was significantly below the DIV(9.20 mg/L). During recent monitoring rounds, MTBE concentrations in groundwater from well 203 arefrequently below the IGV and were last detected above the DIV in September 2006 (Figure 5.1)
· MTBE was reported marginally above the MDL (<0.0001 mg/L) in groundwater from up-gradientgroundwater monitoring well 207 (0.0005 mg/L)
· In groundwater from well 301, the MTBE concentration decreased from 0.0037 mg/L in April 2016 to0.0017 mg/L in November 2016 (Figure 6.2). MTBE was last detected above the IGV in groundwater fromwell 301 in October 2011 (0.035 mg/L)
· The MTBE concentration in groundwater from well 302 increased between April 2016 (0.0035 mg/L) andNovember 2016 (0.0150 mg/L). The MTBE concentration in groundwater from well 302 exceeded the GTVbut has been below the IGV since October 2011 (Figure 7.2)
· In groundwater from well 304, MTBE marginally increased from 0.002 mg/L in April 2016 to 0.005 mg/L inNovember 2016. MTBE concentrations in groundwater from well 304 have been below the DIV sinceDecember 2005 and below the IGV since April 2010 (Figure 8.1 and 8.2)
· In November 2016, MTBE was below the MDL (<0.0001 mg/L) in groundwater from well 305
· Well 604 was installed and first sampled in November 2013, when an MTBE concentration of 0.139 mg/Lwas recorded. MTBE in groundwater from well 604 has declined to 0.0265 mg/L in November 2016 (Figure10.2)
Toluene had historically been detected in groundwater at the site, but has been below the MDL in all wells sinceMarch 2009. In November 2016, toluene remained below the laboratory MDL (0.0005 mg/L) in groundwater fromall wells sampled.
For
insp
ectio
n pur
pose
s only
.
Conse
nt of
copy
right
owne
r req
uired
for a
ny ot
her u
se.
EPA Export 10-04-2017:02:56:33
Pfizer Little Island Pfizer Ireland Pharmaceuticals LimitedProject Reference: CKRP0002
Prepared for: Pfizer Ireland Pharmaceuticals LimitedCkrp0002 Pfizer Little Island Round 2 2016 Final
AECOM16
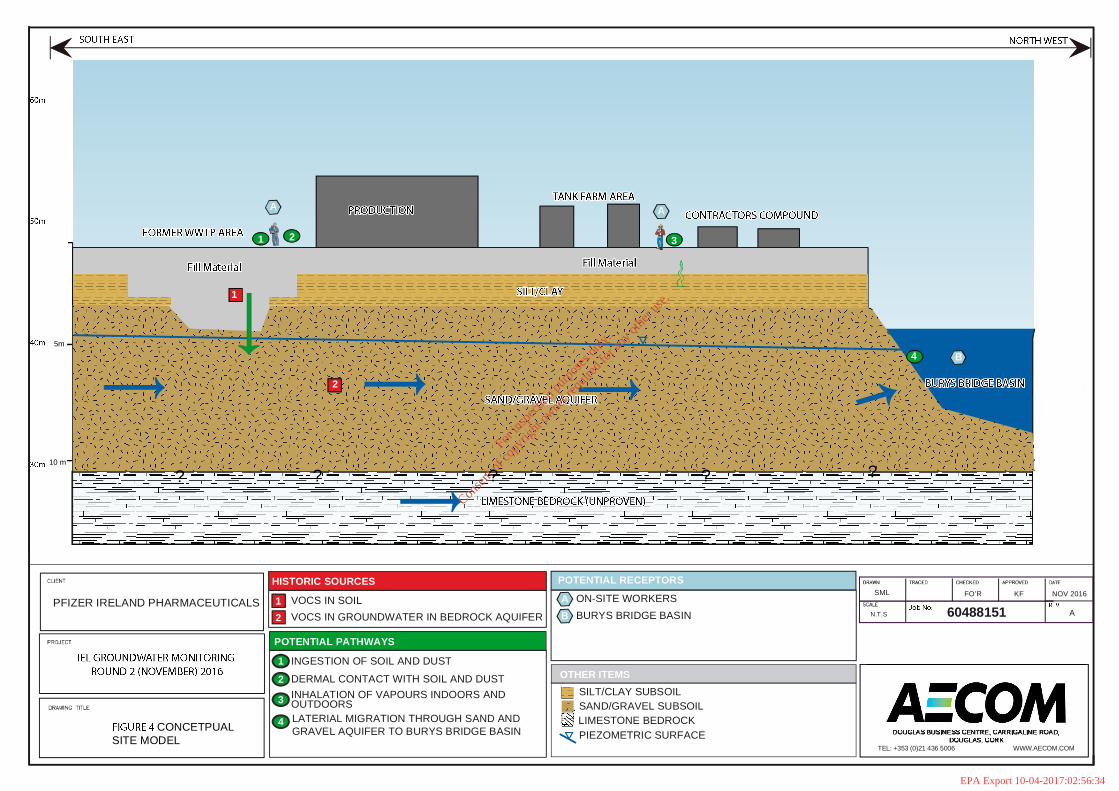
2.3 Conceptual Site Model
A schematic representation of the conceptual site model (CSM) is presented in Figure 4.
Groundwater and localised areas of soil impacted by VOCs, predominantly MTBE and toluene, have historicallybeen identified on the API site and, to a lesser extent, on the BP.
Since 1997, toluene concentrations have decreased site-wide due to source removal and natural attenuation inthe aquifer. The source of toluene is considered to have been from historic drum storage on the API site and noflux of toluene to the basin is currently occurring. Toluene is no longer detected in groundwater and is no longerconsidered to pose a threat to Bury’s Bridge Basin.
Data from groundwater analysis indicate that there are no current, sustained elevated concentrations of organiccompounds.
The source area for MTBE was largely restricted to the northern and western margins of the Main ProductionBuilding and an area south of the Production Building (OP1), which formerly contained the site’s WWTP.Groundwater impacts in this area are believed to have historically been related to broken effluent drains leadingto the former WWTP.
A drains survey in 1999 identified a damaged section of drain in this area, which was subsequently repaired. Thesite strong stream and weak stream effluent systems were significantly altered and upgraded between 2006 and2008, bringing effluent drains above ground site-wide, where possible. MTBE concentrations across the API sitehave subsequently reduced substantially from peak concentrations recorded in late 1990s and early 2000s, andMTBE is frequently below the MDL in recent monitoring rounds. Based on monitoring data reviewed fromsurrounding industrial sites, there does not appear to be an alternative source of MTBE in the immediate area.
There are no significant rivers or streams in close proximity to the Little Island facility. The nearest surface waterbody is Bury’s Bridge Basin, a shallow tidal inlet of Lough Mahon adjacent to the site. Groundwater is unconfinedwithin the gravel aquifer unit. Depth to groundwater is typically between 2 m and 6.5 m bgl, with equivalentgroundwater elevations generally <1 m aOD. Groundwater flow direction across the API and BP portions of thesite is towards the north and north-west.
Based on the available data, MTBE appears to be migrating from the area of the Main Production Building viagroundwater in a generally north-western direction, ultimately discharging to the Bury’s Bridge Basin. MBTEmovement towards the north-west of the site is under low head difference and groundwater follows the path ofleast resistance. The gravel aquifer itself is considered to be the main migration pathway, rather than a receptor,because of its lack of resource potential and the fact that groundwater is brackish to saline down-gradient of thesite.
Beneath the site, the fresh groundwater lens is expected to be relatively thin, given that the groundwaterelevation is <1 m aOD, this is supported by brackish groundwater in the 10 m deep, unused Production Well onthe site. Natural biodegradation of MTBE is not believed to be occurring to any significant extent along thegroundwater flow path in the anaerobic gravel aquifer.
Concerns about MTBE arise from the fact that its properties differ significantly from other common organicsolvents such as benzene, toluene, ethyl benzene and xylene (BTEX) compounds. MTBE is highly soluble inwater, has low biodegradation potential and low sorption properties, which means that MTBE dissolves rapidly oncontact with groundwater and the resulting MTBE plumes migrate rapidly, thereby threatening potential downgradient receptors. The toxicity of MTBE is low, but its low taste and odour threshold (0.005 –0.015 mg/L inwater) makes it an undesirable contaminant in water used for potable water production6.
Human toxicological data derived from both inhalation and oral routes of exposure suggest that MTBE is of lowacute and sub-acute toxicity. It does not appear to be either a reproductive toxicant or to be mutagenic. TheEnvironment Agency in the U.K. accepts a target criterion of 0.3 mg/L (a factor of 10 higher than the Irish IGV) forsites with no nearby potable groundwater abstractions, similar to the Pfizer site7. All November 2016 MTBEresults for the Pfizer Little Island site are below this EA criterion for MTBE.
6 Chisala BN, Tait NG, Lerner DN, 2007. Evaluating the Risks of MTBE Pollution of Urban Groundwater. Journal ofContaminant Hydrology 91:128-1457 Environment Agency, 2000. A Review of the Current MTBE Usage and Occurrence in Groundwater in England and Wales.R&D Project Report No. 97
For
insp
ectio
n pur
pose
s only
.
Conse
nt of
copy
right
owne
r req
uired
for a
ny ot
her u
se.
EPA Export 10-04-2017:02:56:33

Pfizer Little Island Pfizer Ireland Pharmaceuticals LimitedProject Reference: CKRP0002
Prepared for: Pfizer Ireland Pharmaceuticals LimitedCkrp0002 Pfizer Little Island Round 2 2016 Final
AECOM17
Seepages of MTBE-impacted groundwater to the Bury’s Bridge Basin have been historically identified (i.e. URSDames & Moore 2001 - Quantitative Risk Assessment). However, due to its low aquatic toxicity and high volatility,MTBE is not considered to pose a significant threat to the aquatic ecosystem in Bury’s Bridge Basin, even atconcentrations significantly higher than those detected in groundwater from the Little Island site in recent years.
The ongoing detections of MTBE at well 604 since it was drilled and installed in November 2013, indicates thatMTBE is continuing to be flushed through the sand and gravel aquifer beneath the site north-westward towardsthe basin. MTBE in groundwater entering Bury’s Bridge Basin is greatly diluted by tidal flushing and is expectedto be transported throughout the basin and into Cork Harbour/Lough Mahon by tidal mixing.
Detected elevated concentrations of some major ions (potassium, sodium, magnesium, sulphate and chloride)are considered to be related to the site’s location adjacent to the tidal Bury’s Bridge Basin. The mixing ofgroundwater and more saline surface water results in higher concentrations of these major ions in certain wells(particularly the deeper well 207 and the Pfizer Production well).
2.3.1 Potential Pollutant Linkages
A summary of potential Source-Pathway-Receptor (SPR) linkages is outlined in the table below.
POTENTIAL SPR LINKAGES
Sources Pathways Receptor
S1 MTBE and other VOCs in soiland groundwater related tohistorical leaks from undergroundpipelines
Human HealthP1 Ingestion of soil/dust,groundwater or surface waterP2 Dermal contact with soil,dust, and groundwaterP3 Inhalation of indoor andoutdoor contaminant vapourswhich can arise directly fromresidual contaminants in theunsaturated overburden itselfand indirectly via the dissolvedphase in groundwater
Human HealthR1 On-site workersR2 Off-site workersR3 Workers on-siteundertakingsubsurface works
Controlled WatersP4 Lateral migration ofcontaminants through thegravel aquifer
Water Supply WellThere are noknown potablewater supplieswithin 300 m of siteOn-site productionwell – used forcooling purposesonly and notpotable supply
Controlled WatersR4 Bury’s BridgeBasinR5 Cork HarbourSPA (No. 004030)R6 Dunkettle Shore(pNHA)
In 2001, AECOM estimated that worst-case MTBE concentrations of up to 10 mg/L in Bury’s Bridge Basin wouldnot cause significant harm to the aquatic ecosystem1.
Given that MTBE concentrations in the sand and gravel unit across the site in November 2016 are more than twoorders of magnitude lower than 10 mg/L (groundwater monitoring wells 203 (0.0104 mg/L) and 604 (0.0265 mg/L)had the highest concentrations of MTBE in November 2016) and the potential for dilution in the basin is great, the
For
insp
ectio
n pur
pose
s only
.
Conse
nt of
copy
right
owne
r req
uired
for a
ny ot
her u
se.
EPA Export 10-04-2017:02:56:33

Pfizer Little Island Pfizer Ireland Pharmaceuticals LimitedProject Reference: CKRP0002
Prepared for: Pfizer Ireland Pharmaceuticals LimitedCkrp0002 Pfizer Little Island Round 2 2016 Final
AECOM18
potential environmental impact of MTBE in groundwater discharging to the basin under November 2016conditions is considered to be negligible.
For
insp
ectio
n pur
pose
s only
.
Conse
nt of
copy
right
owne
r req
uired
for a
ny ot
her u
se.
EPA Export 10-04-2017:02:56:33

Pfizer Little Island Pfizer Ireland Pharmaceuticals LimitedProject Reference: CKRP0002
Prepared for: Pfizer Ireland Pharmaceuticals LimitedCkrp0002 Pfizer Little Island Round 2 2016 Final
AECOM19
3. Summary, Conclusions and Recommendations
3.1 Summary and Conclusion
The general groundwater flow direction in November 2016 was to the north and north-west (toward Bury’s BridgeBasin) and is consistent with previous monitoring rounds.
In November 2016, MTBE was detected above the GTV (0.010 mg/L) at wells 203 (0.0104 mg/L), 302(0.015 mg/L) and 604 (0.265 mg/L); however, all concentrations of MTBE were reported below the IGV.
In general, groundwater analytical results for MTBE in November 2016 are similar to the previous monitoringround in April 2016 and are some of the lowest MTBE concentrations on record. The November 2016 analyticalresults continue to demonstrate the long-term declining trend in MTBE concentrations observed since significantupgrades to the site effluent drainage system between 2006 and 2008.
Toluene was not detected above the MDL in groundwater from any well sampled in Round 2 November 2016 andhas not been detected in groundwater since March 2009.
Excluding MTBE, no other VOCs from the standard suite of VOCs were detected above laboratory MDLs.
3.2 Recommended Way Forward
Based on the results of the first round of 2016 biannual groundwater monitoring, AECOM continue to recommendthat the groundwater monitoring frequency be reduced from biannually to annually.
For
insp
ectio
n pur
pose
s only
.
Conse
nt of
copy
right
owne
r req
uired
for a
ny ot
her u
se.
EPA Export 10-04-2017:02:56:33

Pfizer Little Island Pfizer Ireland Pharmaceuticals LimitedProject Reference: CKRP0002
Prepared for: Pfizer Ireland Pharmaceuticals LimitedCkrp0002 Pfizer Little Island Round 2 2016 Final
AECOM
Figures
For
insp
ectio
n pur
pose
s only
.
Conse
nt of
copy
right
owne
r req
uired
for a
ny ot
her u
se.
EPA Export 10-04-2017:02:56:33

N.T.SJob No.SCALE
FO’R
CLIENT
PROJECT LOCATION
DRAWING TITLENOV 2016
A
PFIZER IRELAND PHARMACEUTICALS
FO’R KF
60488151FIGURE 1 - SITE LOCATION PLAN
CORK
LITTLE ISLAND CO. CORK
SITELOCATION
Contains Ordnance Survey Data Crown Copyright and database right 2016. Reproduced from Ordnance Survey digitalmap data. Crown copyright 2016. All rights reserved.
2016. Material is reproduced with the permission ofNatural England 2016. Copyright English Heritage 2016.Reproduced under the terms of the Click-Use Licence.(C) AECOM 2016.
Licence number 0100031673. Copyright Natural England
DOUGLAS BUSINESS CENTRE, CARRIGALINE ROAD,DOUGLAS, CORK
TEL: +353 (0)21 436 5006 WWW.AECOM.COM
North
For
insp
ectio
n pur
pose
s only
.
Conse
nt of
copy
right
owne
r req
uired
for a
ny ot
her u
se.
EPA Export 10-04-2017:02:56:33

207207
201
302
301 206
304
403404
501
Job No.
TRACED CHECKEDDRAWN APPROVED
FO’R FO’RDATE
A
NOV 2016
AS SHOWNSCALE REV.
KF DOUGLAS BUSINESS CENTRE, CARRIGALINE ROAD,DOUGLAS, CORK
TEL: +353 (0)21 436 5006 WWW.AECOM.COM
PFIZER IRELANDPHARMACEUTICALS
CLIENT
PROJECT LOCATION
DRAWING TITLE
FIGURE 2 SITE LAYOUTSHOWING BOREHOLE LOCATIONS
LITTLE ISLAND, CORK, IRELAND
60488151
APPROXIMATE SCALE50m 0m 100m
LEGEND
For
insp
ectio
n pur
pose
s only
.
Conse
nt of
copy
right
owne
r req
uired
for a
ny ot
her u
se.
EPA Export 10-04-2017:02:56:33

207
201
206
304
305
402
303
205A
405
602
203207
302
301301
Production Well
Job No.
TRACED CHECKEDDRAWN APPROVED
FO’R FO’RDATE
A
NOV 2016
AS SHOWNSCALE REV.
KF DOUGLAS BUSINESS CENTRE, CARRIGALINE ROAD,DOUGLAS, CORK
TEL: +353 (0)21 436 5006 WWW.AECOM.COM
PFIZER IRELANDPHARMACEUTICALS
CLIENT
PROJECT LOCATION
DRAWING TITLEFIGURE 3 GROUNDWATER CONTOUR
MAP - GAVEL AQUIFER -03 NOVEMBER 2016
LITTLE ISLAND, CORK, IRELAND
60488151
APPROXIMATE SCALE50m0m 100m
LEGEND
0.700.69
0.59
0.55
0.67
0.66
0.65
0.660.59
0.58
0.58
0.57
0.55
0.64
0.58
0.590.56
NM
0.930.85
0.64
0.61
0.74
0.70 0.69
0.710.65
0.64
0.64
0.65
0.62
0.68
0.64
0.660.63
NM
NM
0.75m AOD0.75m AOD
0.75m AOD
0.65m AOD
0.65m AOD
0.85 m AOD
For
insp
ectio
n pur
pose
s only
.
Conse
nt of
copy
right
owne
r req
uired
for a
ny ot
her u
se.
EPA Export 10-04-2017:02:56:33
12
3
A
B
4
D
3
A
31
2
?
?
?
FO’R NOV 2016
OTHER ITEMS
AN.T.S
KF
SILT/CLAY SUBSOILSAND/GRAVEL SUBSOIL
PIEZOMETRIC SURFACE
PFIZER IRELAND PHARMACEUTICALS 60488151
VOCS IN SOILVOCS IN GROUNDWATER IN BEDROCK AQUIFER
INGESTION OF SOIL AND DUST
DERMAL CONTACT WITH SOIL AND DUSTINHALATION OF VAPOURS INDOORS ANDOUTDOORSLATERIAL MIGRATION THROUGH SAND ANDGRAVEL AQUIFER TO BURYS BRIDGE BASIN
ON-SITE WORKERSBURYS BRIDGE BASIN
11
1
2
3
AB
HISTORIC SOURCES
2
4
POTENTIAL RECEPTORS
POTENTIAL PATHWAYS
SML
LIMESTONE BEDROCK
10 m
5m
CONCETPUALSITE MODEL
DOUGLAS BUSINESS CENTRE, CARRIGALINE ROAD,DOUGLAS, CORK
TEL: +353 (0)21 436 5006 WWW.AECOM.COM
A
? ????
B
1
2
31 2
4
A A
For
insp
ectio
n pur
pose
s only
.
Conse
nt of
copy
right
owne
r req
uired
for a
ny ot
her u
se.
EPA Export 10-04-2017:02:56:34
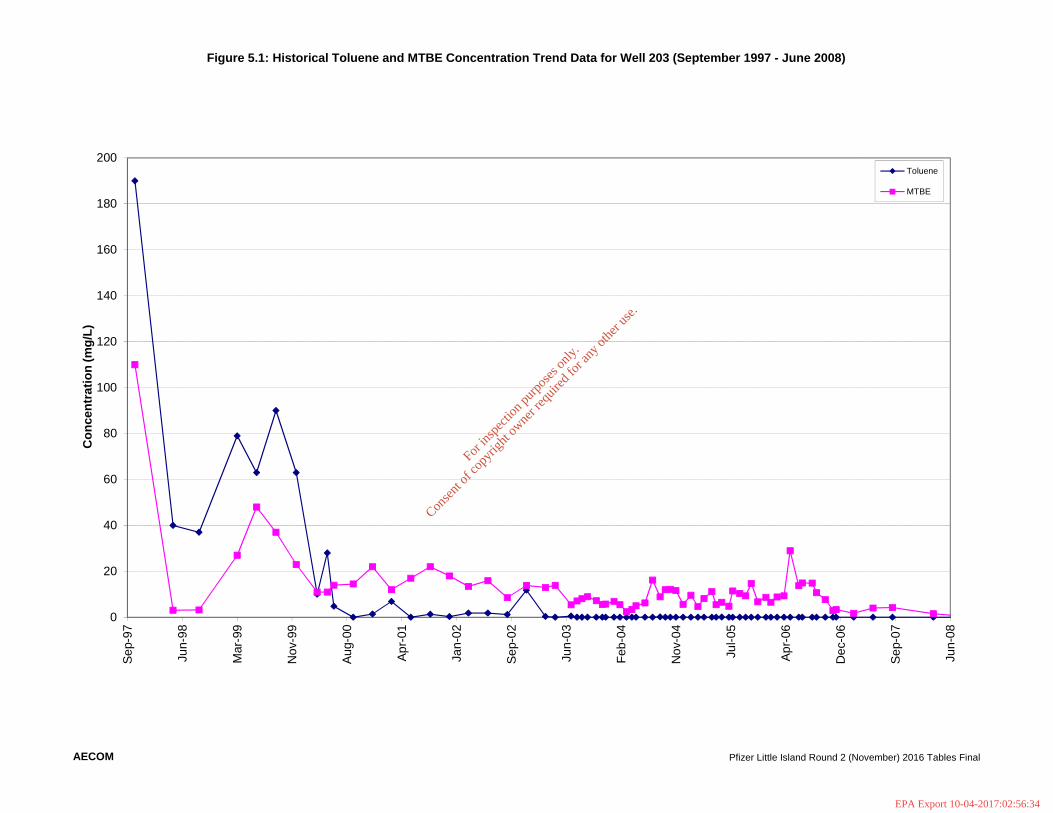
Figure 5.1: Historical Toluene and MTBE Concentration Trend Data for Well 203 (September 1997 - June 2008)
AECOM Pfizer Little Island Round 2 (November) 2016 Tables Final
0
20
40
60
80
100
120
140
160
180
200
Sep-
97
Jun-
98
Mar
-99
Nov
-99
Aug-
00
Apr-0
1
Jan-
02
Sep-
02
Jun-
03
Feb-
04
Nov
-04
Jul-0
5
Apr-0
6
Dec
-06
Sep-
07
Jun-
08
Con
cent
ratio
n (m
g/L)
Toluene
MTBE
For
insp
ectio
n pur
pose
s only
.
Conse
nt of
copy
right
owne
r req
uired
for a
ny ot
her u
se.
EPA Export 10-04-2017:02:56:34

Figure 5.2: Historical Toluene and MTBE Concentration Trend Data for Well 203 (June 2008 - November 2016)
AECOM Pfizer Little Island Round 2 (November) 2016 Tables Final
0.0
0.2
0.4
0.6
0.8
1.0
1.2
1.4
1.6Ju
n-08
Jan-
09
Aug-
09
Mar
-10
Oct
-10
Jun-
11
Jan-
12
Aug-
12
Mar
-13
Nov
-13
Jun-
14
Jan-
15
Aug-
15
Mar
-16
Nov
-16
Con
cent
ratio
n (m
g/L)
Toluene
MTBE
For
insp
ectio
n pur
pose
s only
.
Conse
nt of
copy
right
owne
r req
uired
for a
ny ot
her u
se.
EPA Export 10-04-2017:02:56:34

Figure 5.3: Historical MTBE Concentration Trend Data for Well 203 (June 2008 - November 2016)
AECOM Pfizer Little Island Round 2 (November) 2016 Tables Final
0.0
0.1
0.2
0.3
0.4
0.5
0.6Ju
n-08
Jan-
09
Aug-
09
Mar
-10
Oct
-10
Jun-
11
Jan-
12
Aug-
12
Mar
-13
Nov
-13
Jun-
14
Jan-
15
Aug-
15
Mar
-16
Nov
-16
Con
cent
ratio
n (m
g/L)
MTBE
MTBE IGV
MTBE GTV
For
insp
ectio
n pur
pose
s only
.
Conse
nt of
copy
right
owne
r req
uired
for a
ny ot
her u
se.
EPA Export 10-04-2017:02:56:34
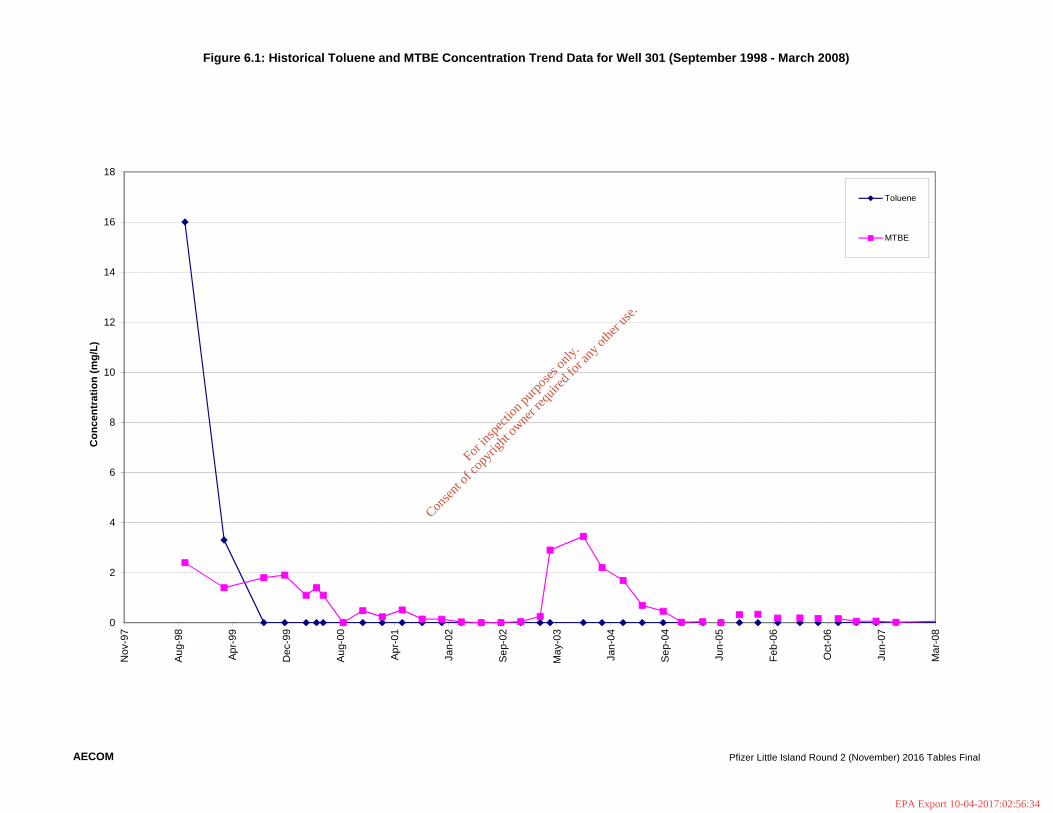
Figure 6.1: Historical Toluene and MTBE Concentration Trend Data for Well 301 (September 1998 - March 2008)
AECOM Pfizer Little Island Round 2 (November) 2016 Tables Final
0
2
4
6
8
10
12
14
16
18
Nov
-97
Aug-
98
Apr-
99
Dec
-99
Aug-
00
Apr-
01
Jan-
02
Sep-
02
May
-03
Jan-
04
Sep-
04
Jun-
05
Feb-
06
Oct
-06
Jun-
07
Mar
-08
Con
cent
ratio
n (m
g/L)
Toluene
MTBE
For
insp
ectio
n pur
pose
s only
.
Conse
nt of
copy
right
owne
r req
uired
for a
ny ot
her u
se.
EPA Export 10-04-2017:02:56:34
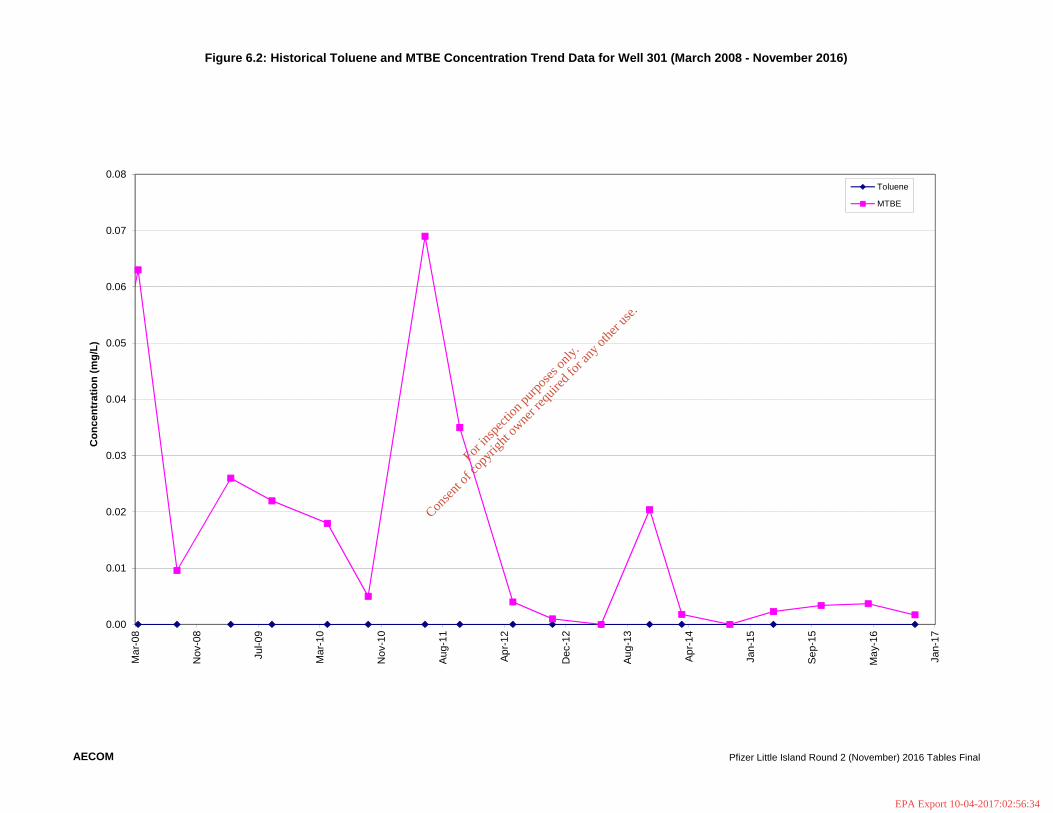
Figure 6.2: Historical Toluene and MTBE Concentration Trend Data for Well 301 (March 2008 - November 2016)
AECOM Pfizer Little Island Round 2 (November) 2016 Tables Final
0.00
0.01
0.02
0.03
0.04
0.05
0.06
0.07
0.08
Mar
-08
Nov
-08
Jul-0
9
Mar
-10
Nov
-10
Aug-
11
Apr-
12
Dec
-12
Aug-
13
Apr-
14
Jan-
15
Sep-
15
May
-16
Jan-
17
Con
cent
ratio
n (m
g/L)
Toluene
MTBE
For
insp
ectio
n pur
pose
s only
.
Conse
nt of
copy
right
owne
r req
uired
for a
ny ot
her u
se.
EPA Export 10-04-2017:02:56:34
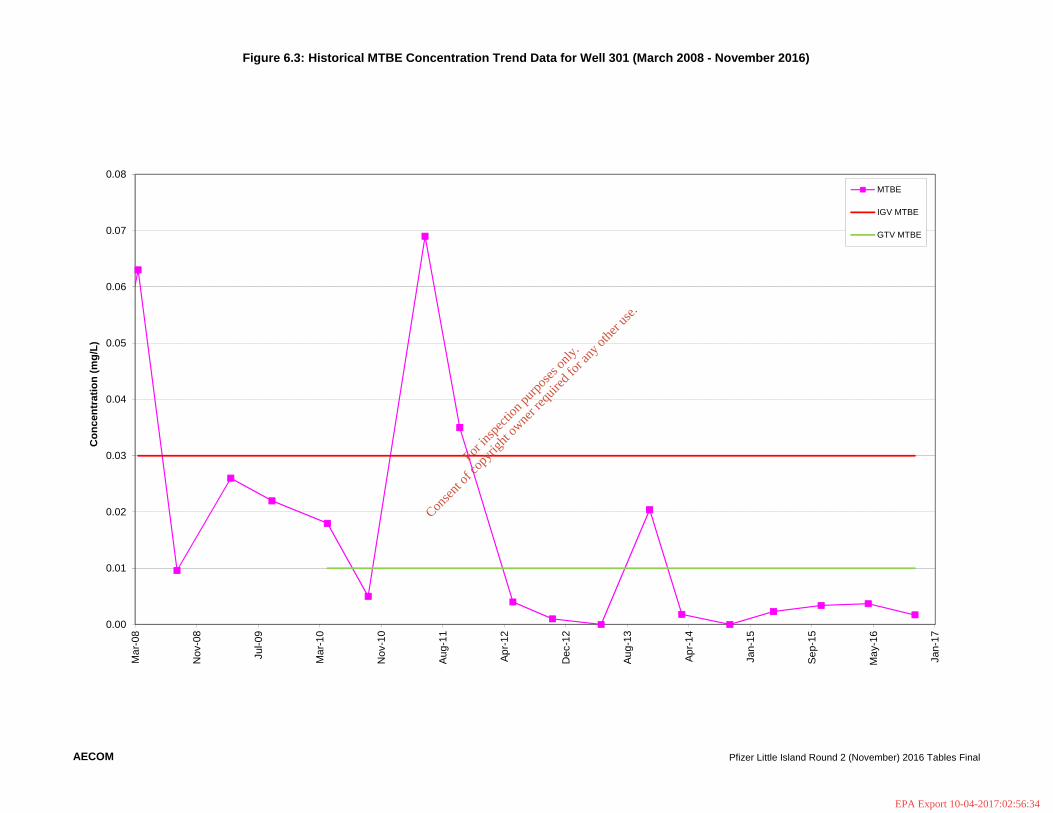
Figure 6.3: Historical MTBE Concentration Trend Data for Well 301 (March 2008 - November 2016)
AECOM Pfizer Little Island Round 2 (November) 2016 Tables Final
0.00
0.01
0.02
0.03
0.04
0.05
0.06
0.07
0.08
Mar
-08
Nov
-08
Jul-0
9
Mar
-10
Nov
-10
Aug-
11
Apr-
12
Dec
-12
Aug-
13
Apr-
14
Jan-
15
Sep-
15
May
-16
Jan-
17
Con
cent
ratio
n (m
g/L)
MTBE
IGV MTBE
GTV MTBE
For
insp
ectio
n pur
pose
s only
.
Conse
nt of
copy
right
owne
r req
uired
for a
ny ot
her u
se.
EPA Export 10-04-2017:02:56:34

Figure 7.1: Historical Toluene and MTBE Concentration Trend Data for Well 302 (September 1998 - March 2008)
AECOM Pfizer Little Island Round 2 (November) 2016 Tables Final
0
10
20
30
40
50
60
70
80
Nov
-97
Aug-
98
Apr-9
9
Dec
-99
Aug-
00
Apr-0
1
Jan-
02
Sep-
02
May
-03
Jan-
04
Sep-
04
Jun-
05
Feb-
06
Oct
-06
Jun-
07
Mar
-08
Con
cent
ratio
n (m
g/L)
Toluene
MTBE
For
insp
ectio
n pur
pose
s only
.
Conse
nt of
copy
right
owne
r req
uired
for a
ny ot
her u
se.
EPA Export 10-04-2017:02:56:34

Figure 7.2: Historical Toluene and MTBE Concentration Trend Data for Well 302 (March 2008 - November 2016)
AECOM Pfizer Little Island Round 2 (November) 2016 Tables Final
0.00
0.01
0.02
0.03
0.04
0.05
Mar
-08
Nov
-08
Jul-0
9
Mar
-10
Nov
-10
Aug-
11
Apr-1
2
Dec
-12
Aug-
13
Apr-1
4
Jan-
15
Sep-
15
May
-16
Jan-
17
Con
cent
ratio
n (m
g/L)
Toluene
MTBE
For
insp
ectio
n pur
pose
s only
.
Conse
nt of
copy
right
owne
r req
uired
for a
ny ot
her u
se.
EPA Export 10-04-2017:02:56:34
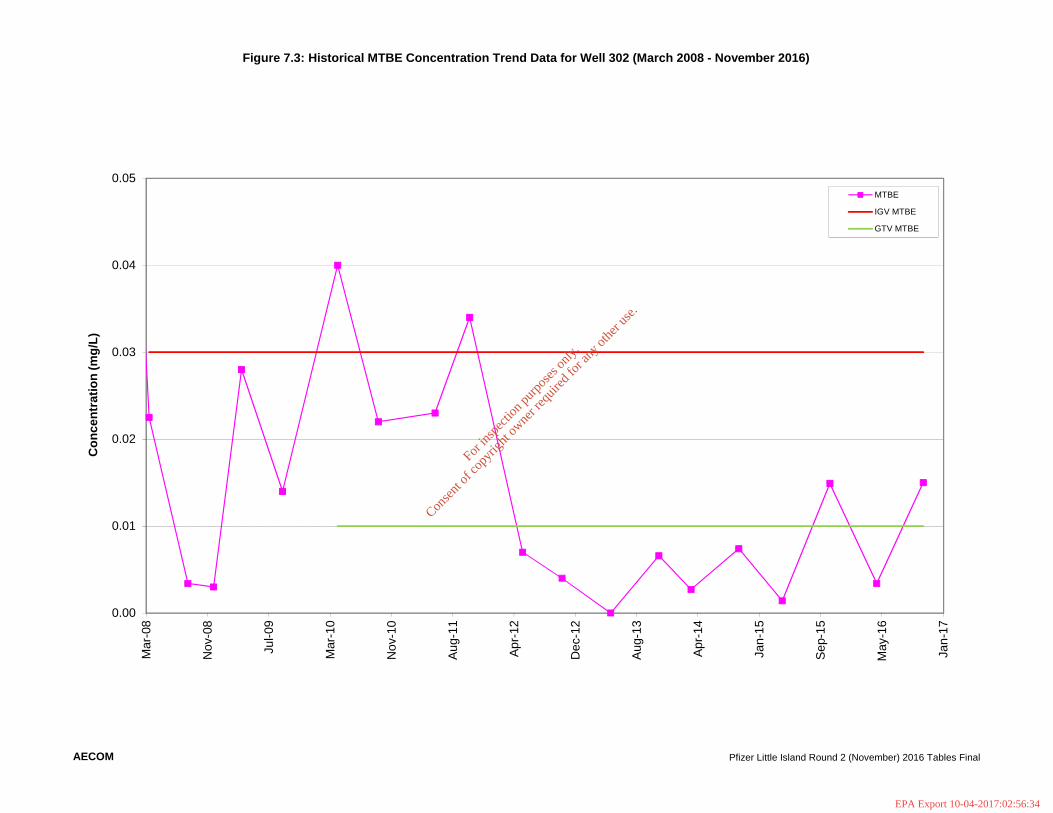
Figure 7.3: Historical MTBE Concentration Trend Data for Well 302 (March 2008 - November 2016)
AECOM Pfizer Little Island Round 2 (November) 2016 Tables Final
0.00
0.01
0.02
0.03
0.04
0.05
Mar
-08
Nov
-08
Jul-0
9
Mar
-10
Nov
-10
Aug-
11
Apr-1
2
Dec
-12
Aug-
13
Apr-1
4
Jan-
15
Sep-
15
May
-16
Jan-
17
Con
cent
ratio
n (m
g/L)
MTBE
IGV MTBE
GTV MTBE
For
insp
ectio
n pur
pose
s only
.
Conse
nt of
copy
right
owne
r req
uired
for a
ny ot
her u
se.
EPA Export 10-04-2017:02:56:34
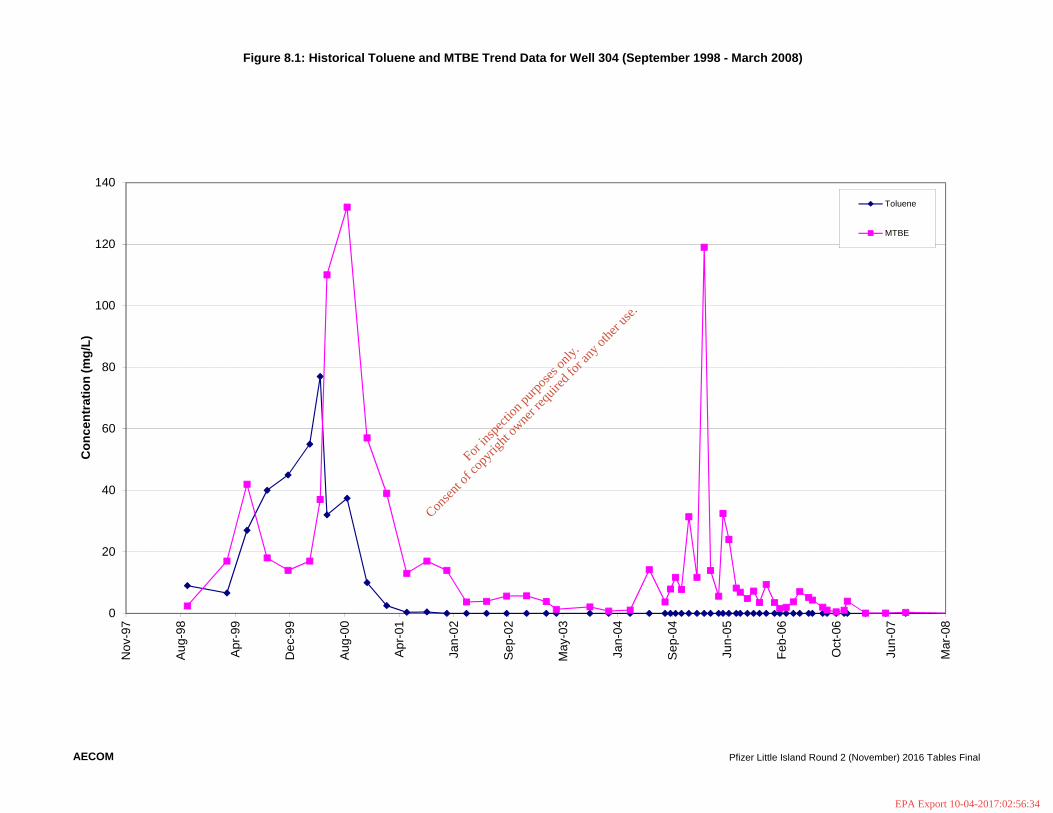
Figure 8.1: Historical Toluene and MTBE Trend Data for Well 304 (September 1998 - March 2008)
AECOM Pfizer Little Island Round 2 (November) 2016 Tables Final
0
20
40
60
80
100
120
140
Nov
-97
Aug-
98
Apr-9
9
Dec
-99
Aug-
00
Apr-0
1
Jan-
02
Sep-
02
May
-03
Jan-
04
Sep-
04
Jun-
05
Feb-
06
Oct
-06
Jun-
07
Mar
-08
Con
cent
ratio
n (m
g/L)
Toluene
MTBE
For
insp
ectio
n pur
pose
s only
.
Conse
nt of
copy
right
owne
r req
uired
for a
ny ot
her u
se.
EPA Export 10-04-2017:02:56:34
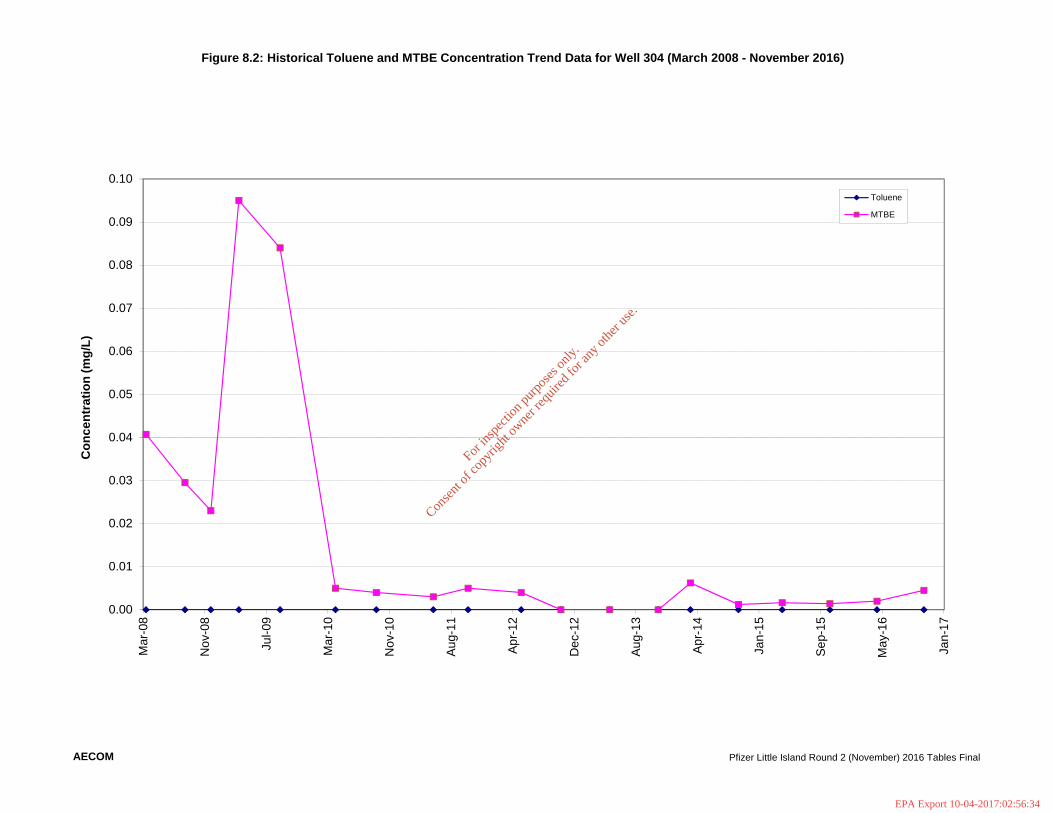
Figure 8.2: Historical Toluene and MTBE Concentration Trend Data for Well 304 (March 2008 - November 2016)
AECOM Pfizer Little Island Round 2 (November) 2016 Tables Final
0.00
0.01
0.02
0.03
0.04
0.05
0.06
0.07
0.08
0.09
0.10
Mar
-08
Nov
-08
Jul-0
9
Mar
-10
Nov
-10
Aug-
11
Apr-1
2
Dec
-12
Aug-
13
Apr-1
4
Jan-
15
Sep-
15
May
-16
Jan-
17
Con
cent
ratio
n (m
g/L)
Toluene
MTBE
For
insp
ectio
n pur
pose
s only
.
Conse
nt of
copy
right
owne
r req
uired
for a
ny ot
her u
se.
EPA Export 10-04-2017:02:56:34

Figure 8.3: Historical MTBE Concentration Trend Data for Well 304 (March 2008 - November 2016)
AECOM Pfizer Little Island Round 2 (November) 2016 Tables Final
0.00
0.01
0.02
0.03
0.04
0.05
0.06
0.07
0.08
0.09
0.10
Mar
-08
Nov
-08
Jul-0
9
Mar
-10
Nov
-10
Aug-
11
Apr-1
2
Dec
-12
Aug-
13
Apr-1
4
Jan-
15
Sep-
15
May
-16
Jan-
17
Con
cent
ratio
n (m
g/L)
MTBE
IGV MTBE
GTV MTBE
For
insp
ectio
n pur
pose
s only
.
Conse
nt of
copy
right
owne
r req
uired
for a
ny ot
her u
se.
EPA Export 10-04-2017:02:56:34

Figure 9.1: Historical Toluene and Chloroform Concentration Trend Data for Well 404 (March 2003 - March 2009)
AECOM Pfizer Little Island Round 2 (November) 2016 Tables Final
0
200
400
600
800
1000
1200
Mar
-03
Nov
-03
Aug-
04
Apr-0
5
Dec
-05
Aug-
06
Apr-0
7
Jan-
08
Sep-
08
May
-09
Con
cent
ratio
n (m
g/L)
Toluene
MTBE
For
insp
ectio
n pur
pose
s only
.
Conse
nt of
copy
right
owne
r req
uired
for a
ny ot
her u
se.
EPA Export 10-04-2017:02:56:34

Figure 9.2: Historical Toluene and Chloroform Concentration Trend Data for Well 404 (March 2009 - April 2016)
AECOM Pfizer Little Island Round 2 (November) 2016 Tables Final
0.00
0.10
0.20
0.30
0.40
0.50
0.60
0.70
0.80
0.90
1.00
Mar
-09
Dec
-09
Aug-
10
Apr-1
1
Dec
-11
Aug-
12
May
-13
Jan-
14
Sep-
14
May
-15
Jan-
16
Oct
-16
Con
cent
ratio
n (m
g/L)
Toluene
MTBE
For
insp
ectio
n pur
pose
s only
.
Conse
nt of
copy
right
owne
r req
uired
for a
ny ot
her u
se.
EPA Export 10-04-2017:02:56:34
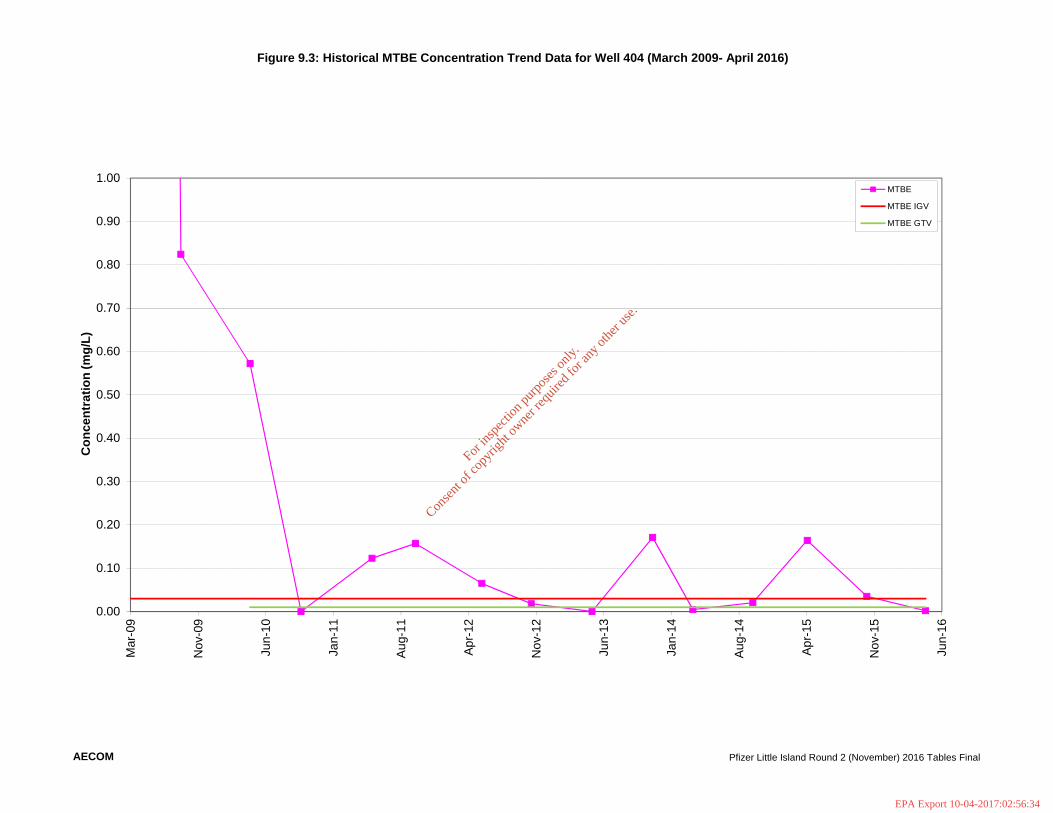
Figure 9.3: Historical MTBE Concentration Trend Data for Well 404 (March 2009- April 2016)
AECOM Pfizer Little Island Round 2 (November) 2016 Tables Final
0.00
0.10
0.20
0.30
0.40
0.50
0.60
0.70
0.80
0.90
1.00
Mar
-09
Nov
-09
Jun-
10
Jan-
11
Aug-
11
Apr-1
2
Nov
-12
Jun-
13
Jan-
14
Aug-
14
Apr-1
5
Nov
-15
Jun-
16
Con
cent
ratio
n (m
g/L)
MTBE
MTBE IGV
MTBE GTV
For
insp
ectio
n pur
pose
s only
.
Conse
nt of
copy
right
owne
r req
uired
for a
ny ot
her u
se.
EPA Export 10-04-2017:02:56:34
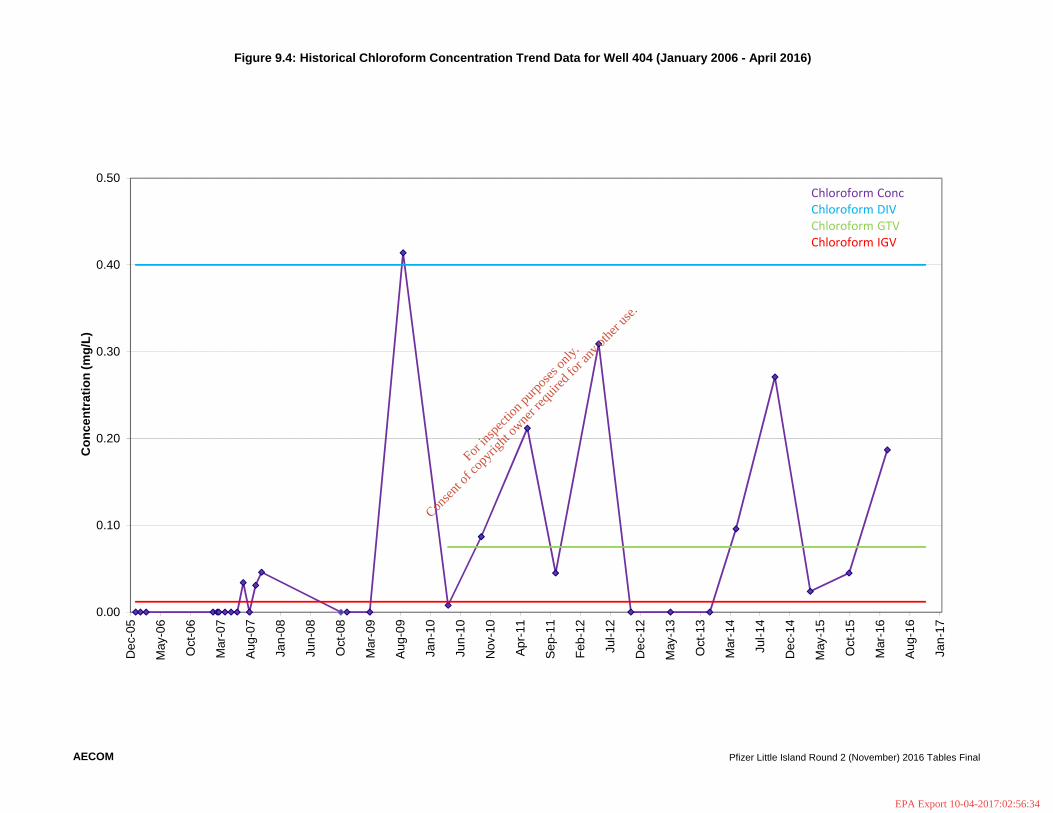
Figure 9.4: Historical Chloroform Concentration Trend Data for Well 404 (January 2006 - April 2016)
AECOM Pfizer Little Island Round 2 (November) 2016 Tables Final
0.00
0.10
0.20
0.30
0.40
0.50
Dec
-05
May
-06
Oct
-06
Mar
-07
Aug-
07
Jan-
08
Jun-
08
Oct
-08
Mar
-09
Aug-
09
Jan-
10
Jun-
10
Nov
-10
Apr-1
1
Sep-
11
Feb-
12
Jul-1
2
Dec
-12
May
-13
Oct
-13
Mar
-14
Jul-1
4
Dec
-14
May
-15
Oct
-15
Mar
-16
Aug-
16
Jan-
17
Con
cent
ratio
n (m
g/L)
Chloroform ConcChloroform DIVChloroform GTVChloroform IGV
For
insp
ectio
n pur
pose
s only
.
Conse
nt of
copy
right
owne
r req
uired
for a
ny ot
her u
se.
EPA Export 10-04-2017:02:56:34

Figure 10.1: Historical Toluene and Chloroform Concentration Trend Data for Well 604 (November 2013 - November 2016)
AECOM Pfizer Little Island Round 2 (November) 2016 Tables Final
0
0.02
0.04
0.06
0.08
0.1
0.12
0.14
0.16
0.18
0.2
Nov
-13
Feb-
14
May
-14
Aug-
14
Dec
-14
Mar
-15
Jun-
15
Oct
-15
Jan-
16
Apr-1
6
Jul-1
6
Nov
-16
Feb-
17
Con
cent
ratio
n (m
g/L)
Toluene
MTBE
For
insp
ectio
n pur
pose
s only
.
Conse
nt of
copy
right
owne
r req
uired
for a
ny ot
her u
se.
EPA Export 10-04-2017:02:56:34
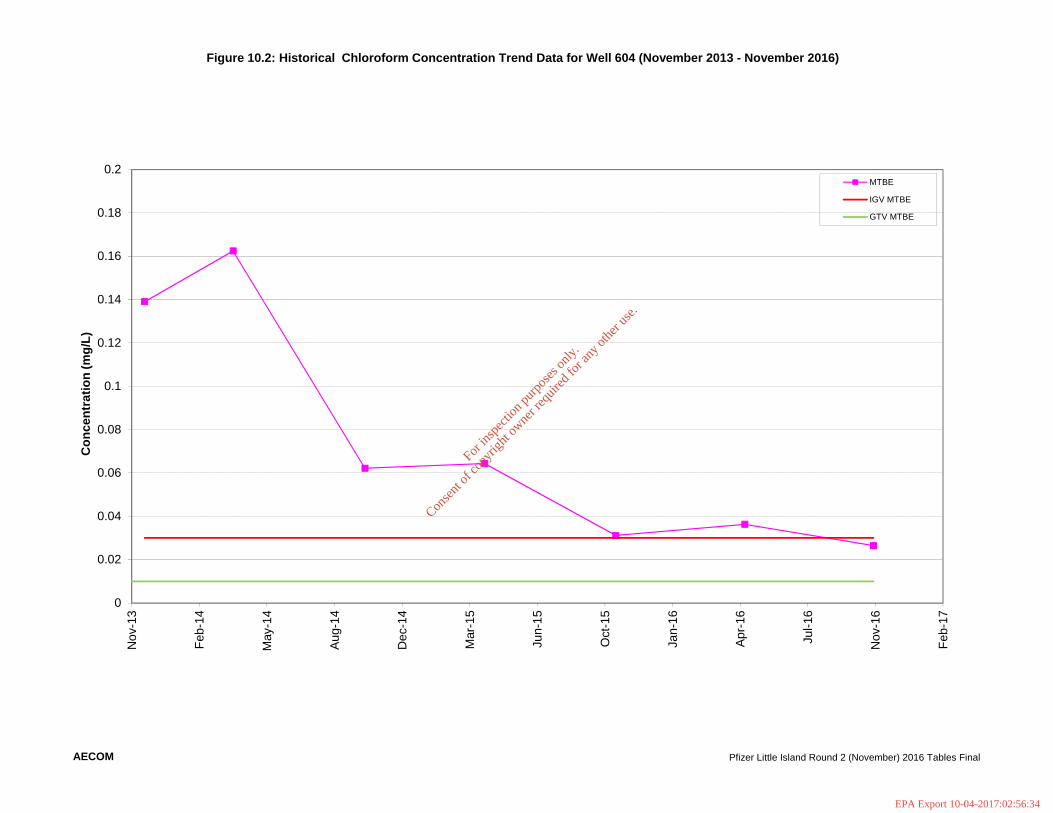
Figure 10.2: Historical Chloroform Concentration Trend Data for Well 604 (November 2013 - November 2016)
AECOM Pfizer Little Island Round 2 (November) 2016 Tables Final
0
0.02
0.04
0.06
0.08
0.1
0.12
0.14
0.16
0.18
0.2
Nov
-13
Feb-
14
May
-14
Aug-
14
Dec
-14
Mar
-15
Jun-
15
Oct
-15
Jan-
16
Apr-1
6
Jul-1
6
Nov
-16
Feb-
17
Con
cent
ratio
n (m
g/L)
MTBE
IGV MTBE
GTV MTBE
For
insp
ectio
n pur
pose
s only
.
Conse
nt of
copy
right
owne
r req
uired
for a
ny ot
her u
se.
EPA Export 10-04-2017:02:56:34
Pfizer Little Island Pfizer Ireland Pharmaceuticals LimitedProject Reference: CKRP0002
Prepared for: Pfizer Ireland Pharmaceuticals LimitedCkrp0002 Pfizer Little Island Round 2 2016 Final
AECOM
Tables
For
insp
ectio
n pur
pose
s only
.
Conse
nt of
copy
right
owne
r req
uired
for a
ny ot
her u
se.
EPA Export 10-04-2017:02:56:34

Compiled by: FO'RChecked by: KF
Table 1 - Sample Inventory, Pfizer Little Island - November 2016
VOCs SVOCs Major Ions
203 (plus duplicateDup 01) X X X X
206* NA NA NA NA
207 X X X X301 X X X X302 X X X X303* NA NA NA NA304 X X X X305 X X X X404 ~ ~ NA ~
201+ NA NA NA NA202+ NA NA NA NA
205A+ NA NA NA NA402 NA NA NA NA403^ NA NA NA NA405+ NA NA NA NA501^ NA NA NA NA502 NA NA NA NA503 NA NA NA NA503 NA NA NA NA
Production Well NA NA NA NA601~ NA NA NA NA602~ NA NA NA NA603~ NA NA NA NA604~ X X X X
Notes:VOCs : Volatile Organic CompoundsSVOCs: Semi Volatile Organic CompoundsMajor Ions: Calcium, magnesium, potassium, sodium, sulphate, chloride, nitrate and total alkalinityField Parameters: Dissolved oxygen, oxidation-reduction potential, pH, electrical conductivity and temperature
~: Not scheduled for analysisNA: Analysis not required
^ As agreed with the EPA (May 2010), wells 403 and 501 were removed from monitoring schedule+ As agreed with the EPA (August 2012), wells 201, 202, 205A and 405 were removed from monitoring schedule~600 Series wells drilled in the Overflow Car Park and Buffer Property in November 2013. Well 604 is now included inthe biannual monitoring schedule
Additional monitoring wells onsite - not included in IEL monitoring.
MonitoringWell
IEL C.6 Monitoring RequirementsLaboratory Parameters
Field Parameters
* As agreed with the EPA (May 2010), wells 206 and 303 are monitored biennially, to be monitored next in Round 1 2018
X: Scheduled for analysis
AECOM Pfizer Little Island Round 2 (November) 2016 Tables Final
For
insp
ectio
n pur
pose
s only
.
Conse
nt of
copy
right
owne
r req
uired
for a
ny ot
her u
se.
EPA Export 10-04-2017:02:56:34
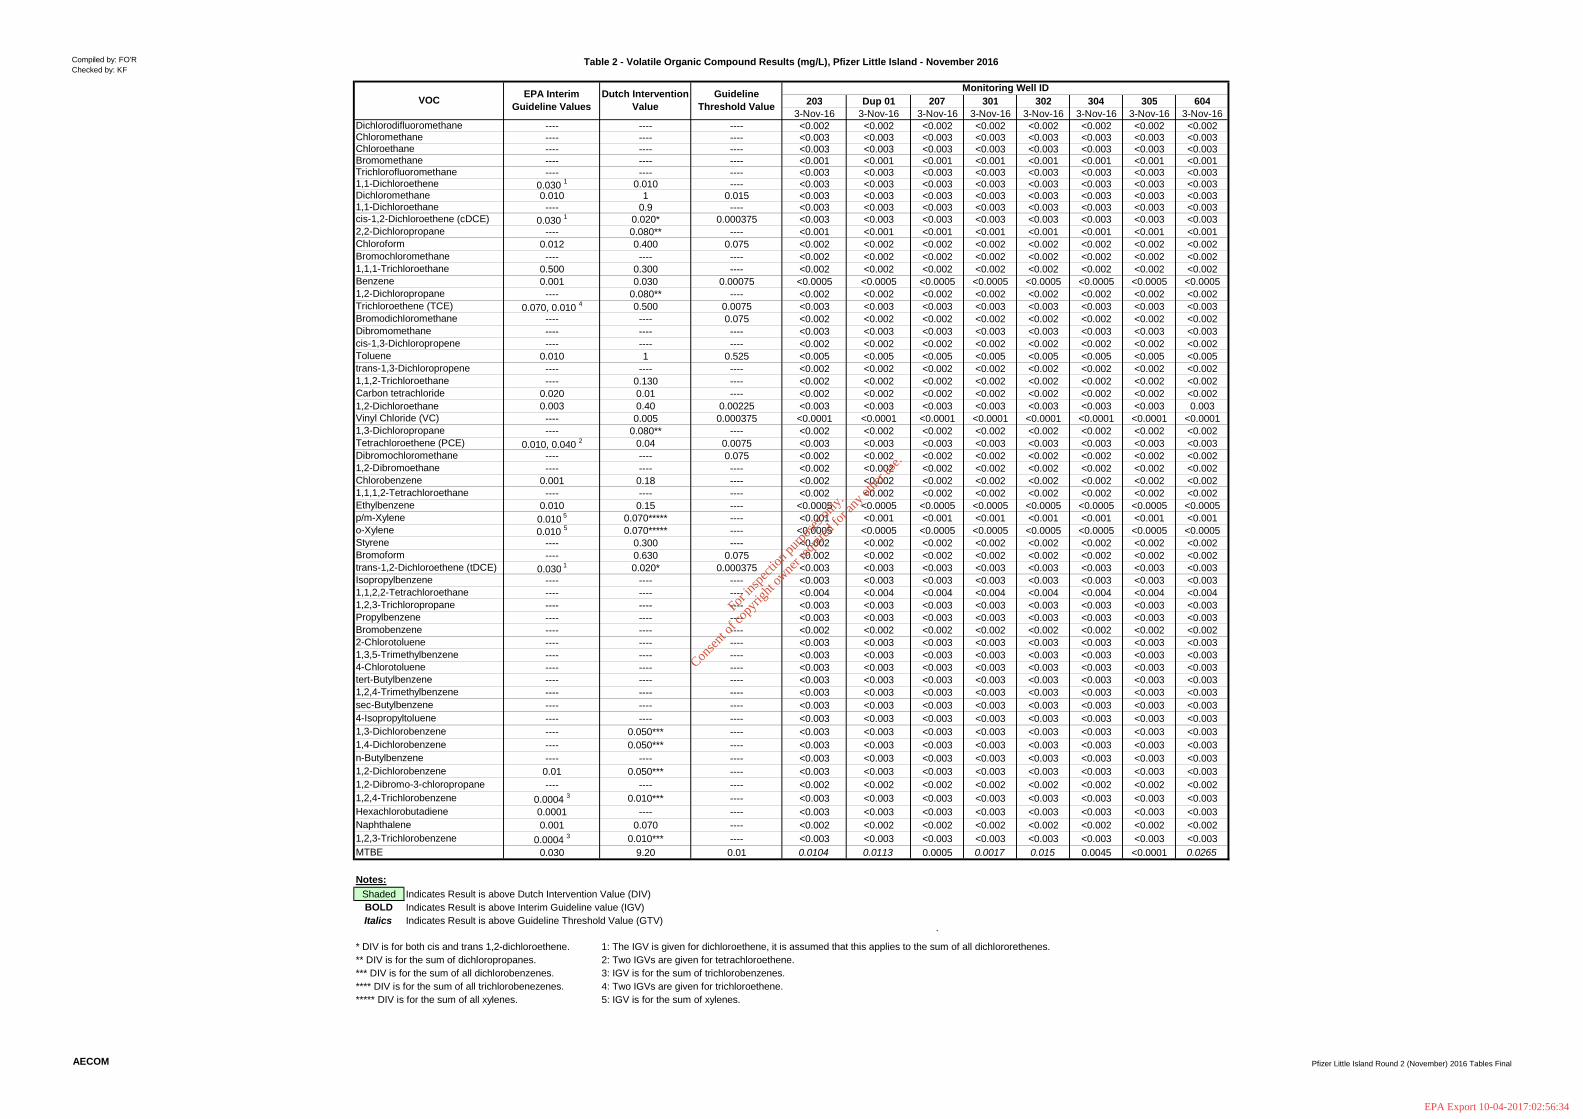
Compiled by: FO'RChecked by: KF
Table 2 - Volatile Organic Compound Results (mg/L), Pfizer Little Island - November 2016
203 Dup 01 207 301 302 304 305 6043-Nov-16 3-Nov-16 3-Nov-16 3-Nov-16 3-Nov-16 3-Nov-16 3-Nov-16 3-Nov-16
---- ---- ---- <0.002 <0.002 <0.002 <0.002 <0.002 <0.002 <0.002 <0.002---- ---- ---- <0.003 <0.003 <0.003 <0.003 <0.003 <0.003 <0.003 <0.003---- ---- ---- <0.003 <0.003 <0.003 <0.003 <0.003 <0.003 <0.003 <0.003---- ---- ---- <0.001 <0.001 <0.001 <0.001 <0.001 <0.001 <0.001 <0.001---- ---- ---- <0.003 <0.003 <0.003 <0.003 <0.003 <0.003 <0.003 <0.003
0.030 1 0.010 ---- <0.003 <0.003 <0.003 <0.003 <0.003 <0.003 <0.003 <0.0030.010 1 0.015 <0.003 <0.003 <0.003 <0.003 <0.003 <0.003 <0.003 <0.003
---- 0.9 ---- <0.003 <0.003 <0.003 <0.003 <0.003 <0.003 <0.003 <0.0030.030 1 0.020* 0.000375 <0.003 <0.003 <0.003 <0.003 <0.003 <0.003 <0.003 <0.003
---- 0.080** ---- <0.001 <0.001 <0.001 <0.001 <0.001 <0.001 <0.001 <0.0010.012 0.400 0.075 <0.002 <0.002 <0.002 <0.002 <0.002 <0.002 <0.002 <0.002
---- ---- ---- <0.002 <0.002 <0.002 <0.002 <0.002 <0.002 <0.002 <0.0020.500 0.300 ---- <0.002 <0.002 <0.002 <0.002 <0.002 <0.002 <0.002 <0.0020.001 0.030 0.00075 <0.0005 <0.0005 <0.0005 <0.0005 <0.0005 <0.0005 <0.0005 <0.0005
---- 0.080** ---- <0.002 <0.002 <0.002 <0.002 <0.002 <0.002 <0.002 <0.0020.070, 0.010 4 0.500 0.0075 <0.003 <0.003 <0.003 <0.003 <0.003 <0.003 <0.003 <0.003
---- ---- 0.075 <0.002 <0.002 <0.002 <0.002 <0.002 <0.002 <0.002 <0.002---- ---- ---- <0.003 <0.003 <0.003 <0.003 <0.003 <0.003 <0.003 <0.003---- ---- ---- <0.002 <0.002 <0.002 <0.002 <0.002 <0.002 <0.002 <0.002
0.010 1 0.525 <0.005 <0.005 <0.005 <0.005 <0.005 <0.005 <0.005 <0.005---- ---- ---- <0.002 <0.002 <0.002 <0.002 <0.002 <0.002 <0.002 <0.002---- 0.130 ---- <0.002 <0.002 <0.002 <0.002 <0.002 <0.002 <0.002 <0.002
0.020 0.01 ---- <0.002 <0.002 <0.002 <0.002 <0.002 <0.002 <0.002 <0.0021,2-Dichloroethane 0.003 0.40 0.00225 <0.003 <0.003 <0.003 <0.003 <0.003 <0.003 <0.003 0.003
---- 0.005 0.000375 <0.0001 <0.0001 <0.0001 <0.0001 <0.0001 <0.0001 <0.0001 <0.0001---- 0.080** ---- <0.002 <0.002 <0.002 <0.002 <0.002 <0.002 <0.002 <0.002
0.010, 0.040 2 0.04 0.0075 <0.003 <0.003 <0.003 <0.003 <0.003 <0.003 <0.003 <0.003---- ---- 0.075 <0.002 <0.002 <0.002 <0.002 <0.002 <0.002 <0.002 <0.002---- ---- ---- <0.002 <0.002 <0.002 <0.002 <0.002 <0.002 <0.002 <0.002
0.001 0.18 ---- <0.002 <0.002 <0.002 <0.002 <0.002 <0.002 <0.002 <0.002---- ---- ---- <0.002 <0.002 <0.002 <0.002 <0.002 <0.002 <0.002 <0.002
0.010 0.15 ---- <0.0005 <0.0005 <0.0005 <0.0005 <0.0005 <0.0005 <0.0005 <0.00050.010 5 0.070***** ---- <0.001 <0.001 <0.001 <0.001 <0.001 <0.001 <0.001 <0.0010.010 5 0.070***** ---- <0.0005 <0.0005 <0.0005 <0.0005 <0.0005 <0.0005 <0.0005 <0.0005
---- 0.300 ---- <0.002 <0.002 <0.002 <0.002 <0.002 <0.002 <0.002 <0.002---- 0.630 0.075 <0.002 <0.002 <0.002 <0.002 <0.002 <0.002 <0.002 <0.002
0.030 1 0.020* 0.000375 <0.003 <0.003 <0.003 <0.003 <0.003 <0.003 <0.003 <0.003---- ---- ---- <0.003 <0.003 <0.003 <0.003 <0.003 <0.003 <0.003 <0.003---- ---- ---- <0.004 <0.004 <0.004 <0.004 <0.004 <0.004 <0.004 <0.004---- ---- ---- <0.003 <0.003 <0.003 <0.003 <0.003 <0.003 <0.003 <0.003---- ---- ---- <0.003 <0.003 <0.003 <0.003 <0.003 <0.003 <0.003 <0.003---- ---- ---- <0.002 <0.002 <0.002 <0.002 <0.002 <0.002 <0.002 <0.002---- ---- ---- <0.003 <0.003 <0.003 <0.003 <0.003 <0.003 <0.003 <0.003---- ---- ---- <0.003 <0.003 <0.003 <0.003 <0.003 <0.003 <0.003 <0.003---- ---- ---- <0.003 <0.003 <0.003 <0.003 <0.003 <0.003 <0.003 <0.003---- ---- ---- <0.003 <0.003 <0.003 <0.003 <0.003 <0.003 <0.003 <0.003---- ---- ---- <0.003 <0.003 <0.003 <0.003 <0.003 <0.003 <0.003 <0.003---- ---- ---- <0.003 <0.003 <0.003 <0.003 <0.003 <0.003 <0.003 <0.003---- ---- ---- <0.003 <0.003 <0.003 <0.003 <0.003 <0.003 <0.003 <0.003---- 0.050*** ---- <0.003 <0.003 <0.003 <0.003 <0.003 <0.003 <0.003 <0.003---- 0.050*** ---- <0.003 <0.003 <0.003 <0.003 <0.003 <0.003 <0.003 <0.003---- ---- ---- <0.003 <0.003 <0.003 <0.003 <0.003 <0.003 <0.003 <0.003
0.01 0.050*** ---- <0.003 <0.003 <0.003 <0.003 <0.003 <0.003 <0.003 <0.003---- ---- ---- <0.002 <0.002 <0.002 <0.002 <0.002 <0.002 <0.002 <0.002
0.0004 3 0.010*** ---- <0.003 <0.003 <0.003 <0.003 <0.003 <0.003 <0.003 <0.0030.0001 ---- ---- <0.003 <0.003 <0.003 <0.003 <0.003 <0.003 <0.003 <0.0030.001 0.070 ---- <0.002 <0.002 <0.002 <0.002 <0.002 <0.002 <0.002 <0.002
0.0004 3 0.010*** ---- <0.003 <0.003 <0.003 <0.003 <0.003 <0.003 <0.003 <0.0030.030 9.20 0.01 0.0104 0.0113 0.0005 0.0017 0.015 0.0045 <0.0001 0.0265
Shaded Indicates Result is above Dutch Intervention Value (DIV)BOLD Indicates Result is above Interim Guideline value (IGV)Italics Indicates Result is above Guideline Threshold Value (GTV)
`
Monitoring Well ID
1,1-DichloroetheneDichloromethane
VOC Dutch InterventionValue
EPA InterimGuideline Values
GuidelineThreshold Value
DichlorodifluoromethaneChloromethaneChloroethaneBromomethane
MTBE1,2,3-Trichlorobenzene
Trichlorofluoromethane
Vinyl Chloride (VC)
1,1-Dichloroethanecis-1,2-Dichloroethene (cDCE)2,2-DichloropropaneChloroformBromochloromethane1,1,1-TrichloroethaneBenzene
PropylbenzeneBromobenzene2-Chlorotoluene
p/m-Xyleneo-Xylene
Notes:
1,2-DichloropropaneTrichloroethene (TCE)BromodichloromethaneDibromomethanecis-1,3-DichloropropeneToluene
1,1,2-TrichloroethaneCarbon tetrachloride
1,3-Dichloropropane
trans-1,3-Dichloropropene
1,2,3-Trichloropropane
Tetrachloroethene (PCE)Dibromochloromethane1,2-DibromoethaneChlorobenzene
Styrene
1,1,2,2-Tetrachloroethane
1,1,1,2-Tetrachloroethane
Bromoformtrans-1,2-Dichloroethene (tDCE)Isopropylbenzene
Ethylbenzene
Naphthalene
1,3,5-Trimethylbenzene4-Chlorotoluene
1,3-Dichlorobenzene1,4-Dichlorobenzene
1,2-Dibromo-3-chloropropane1,2,4-TrichlorobenzeneHexachlorobutadiene
tert-Butylbenzene
n-Butylbenzene1,2-Dichlorobenzene
sec-Butylbenzene4-Isopropyltoluene
1,2,4-Trimethylbenzene
5: IGV is for the sum of xylenes.**** DIV is for the sum of all trichlorobenezenes.***** DIV is for the sum of all xylenes.
* DIV is for both cis and trans 1,2-dichloroethene.
*** DIV is for the sum of all dichlorobenzenes.2: Two IGVs are given for tetrachloroethene.3: IGV is for the sum of trichlorobenzenes.4: Two IGVs are given for trichloroethene.
1: The IGV is given for dichloroethene, it is assumed that this applies to the sum of all dichlororethenes.** DIV is for the sum of dichloropropanes.
AECOM Pfizer Little Island Round 2 (November) 2016 Tables Final
For
insp
ectio
n pur
pose
s only
.
Conse
nt of
copy
right
owne
r req
uired
for a
ny ot
her u
se.
EPA Export 10-04-2017:02:56:34
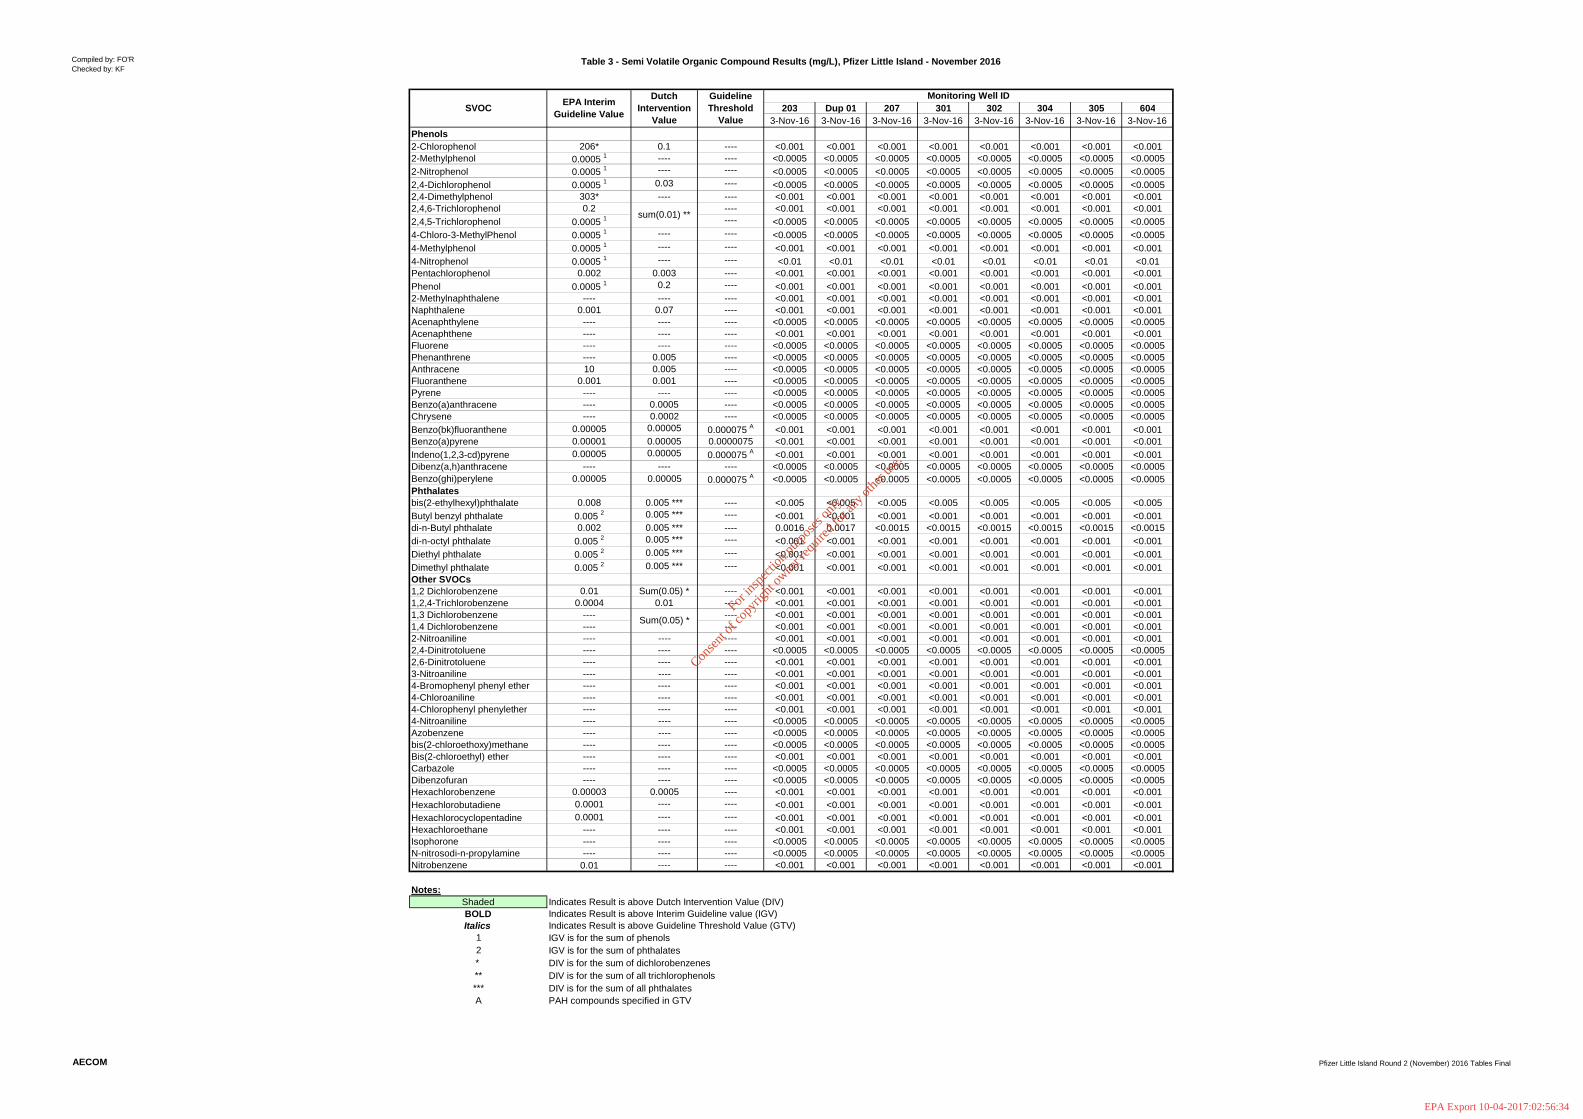
Compiled by: FO'RChecked by: KF
Table 3 - Semi Volatile Organic Compound Results (mg/L), Pfizer Little Island - November 2016
203 Dup 01 207 301 302 304 305 6043-Nov-16 3-Nov-16 3-Nov-16 3-Nov-16 3-Nov-16 3-Nov-16 3-Nov-16 3-Nov-16
Phenols2-Chlorophenol 206* 0.1 ---- <0.001 <0.001 <0.001 <0.001 <0.001 <0.001 <0.001 <0.0012-Methylphenol 0.0005 1 ---- ---- <0.0005 <0.0005 <0.0005 <0.0005 <0.0005 <0.0005 <0.0005 <0.00052-Nitrophenol 0.0005 1 ---- ---- <0.0005 <0.0005 <0.0005 <0.0005 <0.0005 <0.0005 <0.0005 <0.00052,4-Dichlorophenol 0.0005 1 0.03 ---- <0.0005 <0.0005 <0.0005 <0.0005 <0.0005 <0.0005 <0.0005 <0.00052,4-Dimethylphenol 303* ---- ---- <0.001 <0.001 <0.001 <0.001 <0.001 <0.001 <0.001 <0.0012,4,6-Trichlorophenol 0.2 ---- <0.001 <0.001 <0.001 <0.001 <0.001 <0.001 <0.001 <0.0012,4,5-Trichlorophenol 0.0005 1 ---- <0.0005 <0.0005 <0.0005 <0.0005 <0.0005 <0.0005 <0.0005 <0.00054-Chloro-3-MethylPhenol 0.0005 1 ---- ---- <0.0005 <0.0005 <0.0005 <0.0005 <0.0005 <0.0005 <0.0005 <0.00054-Methylphenol 0.0005 1 ---- ---- <0.001 <0.001 <0.001 <0.001 <0.001 <0.001 <0.001 <0.0014-Nitrophenol 0.0005 1 ---- ---- <0.01 <0.01 <0.01 <0.01 <0.01 <0.01 <0.01 <0.01Pentachlorophenol 0.002 0.003 ---- <0.001 <0.001 <0.001 <0.001 <0.001 <0.001 <0.001 <0.001Phenol 0.0005 1 0.2 ---- <0.001 <0.001 <0.001 <0.001 <0.001 <0.001 <0.001 <0.0012-Methylnaphthalene ---- ---- ---- <0.001 <0.001 <0.001 <0.001 <0.001 <0.001 <0.001 <0.001Naphthalene 0.001 0.07 ---- <0.001 <0.001 <0.001 <0.001 <0.001 <0.001 <0.001 <0.001Acenaphthylene ---- ---- ---- <0.0005 <0.0005 <0.0005 <0.0005 <0.0005 <0.0005 <0.0005 <0.0005Acenaphthene ---- ---- ---- <0.001 <0.001 <0.001 <0.001 <0.001 <0.001 <0.001 <0.001Fluorene ---- ---- ---- <0.0005 <0.0005 <0.0005 <0.0005 <0.0005 <0.0005 <0.0005 <0.0005Phenanthrene ---- 0.005 ---- <0.0005 <0.0005 <0.0005 <0.0005 <0.0005 <0.0005 <0.0005 <0.0005Anthracene 10 0.005 ---- <0.0005 <0.0005 <0.0005 <0.0005 <0.0005 <0.0005 <0.0005 <0.0005Fluoranthene 0.001 0.001 ---- <0.0005 <0.0005 <0.0005 <0.0005 <0.0005 <0.0005 <0.0005 <0.0005Pyrene ---- ---- ---- <0.0005 <0.0005 <0.0005 <0.0005 <0.0005 <0.0005 <0.0005 <0.0005Benzo(a)anthracene ---- 0.0005 ---- <0.0005 <0.0005 <0.0005 <0.0005 <0.0005 <0.0005 <0.0005 <0.0005Chrysene ---- 0.0002 ---- <0.0005 <0.0005 <0.0005 <0.0005 <0.0005 <0.0005 <0.0005 <0.0005Benzo(bk)fluoranthene 0.00005 0.00005 0.000075 A <0.001 <0.001 <0.001 <0.001 <0.001 <0.001 <0.001 <0.001Benzo(a)pyrene 0.00001 0.00005 0.0000075 <0.001 <0.001 <0.001 <0.001 <0.001 <0.001 <0.001 <0.001Indeno(1,2,3-cd)pyrene 0.00005 0.00005 0.000075 A <0.001 <0.001 <0.001 <0.001 <0.001 <0.001 <0.001 <0.001Dibenz(a,h)anthracene ---- ---- ---- <0.0005 <0.0005 <0.0005 <0.0005 <0.0005 <0.0005 <0.0005 <0.0005Benzo(ghi)perylene 0.00005 0.00005 0.000075 A <0.0005 <0.0005 <0.0005 <0.0005 <0.0005 <0.0005 <0.0005 <0.0005Phthalatesbis(2-ethylhexyl)phthalate 0.008 0.005 *** ---- <0.005 <0.005 <0.005 <0.005 <0.005 <0.005 <0.005 <0.005Butyl benzyl phthalate 0.005 2 0.005 *** ---- <0.001 <0.001 <0.001 <0.001 <0.001 <0.001 <0.001 <0.001di-n-Butyl phthalate 0.002 0.005 *** ---- 0.0016 0.0017 <0.0015 <0.0015 <0.0015 <0.0015 <0.0015 <0.0015di-n-octyl phthalate 0.005 2 0.005 *** ---- <0.001 <0.001 <0.001 <0.001 <0.001 <0.001 <0.001 <0.001Diethyl phthalate 0.005 2 0.005 *** ---- <0.001 <0.001 <0.001 <0.001 <0.001 <0.001 <0.001 <0.001Dimethyl phthalate 0.005 2 0.005 *** ---- <0.001 <0.001 <0.001 <0.001 <0.001 <0.001 <0.001 <0.001Other SVOCs1,2 Dichlorobenzene 0.01 Sum(0.05) * ---- <0.001 <0.001 <0.001 <0.001 <0.001 <0.001 <0.001 <0.0011,2,4-Trichlorobenzene 0.0004 0.01 ---- <0.001 <0.001 <0.001 <0.001 <0.001 <0.001 <0.001 <0.0011,3 Dichlorobenzene ---- ---- <0.001 <0.001 <0.001 <0.001 <0.001 <0.001 <0.001 <0.0011,4 Dichlorobenzene ---- ---- <0.001 <0.001 <0.001 <0.001 <0.001 <0.001 <0.001 <0.0012-Nitroaniline ---- ---- ---- <0.001 <0.001 <0.001 <0.001 <0.001 <0.001 <0.001 <0.0012,4-Dinitrotoluene ---- ---- ---- <0.0005 <0.0005 <0.0005 <0.0005 <0.0005 <0.0005 <0.0005 <0.00052,6-Dinitrotoluene ---- ---- ---- <0.001 <0.001 <0.001 <0.001 <0.001 <0.001 <0.001 <0.0013-Nitroaniline ---- ---- ---- <0.001 <0.001 <0.001 <0.001 <0.001 <0.001 <0.001 <0.0014-Bromophenyl phenyl ether ---- ---- ---- <0.001 <0.001 <0.001 <0.001 <0.001 <0.001 <0.001 <0.0014-Chloroaniline ---- ---- ---- <0.001 <0.001 <0.001 <0.001 <0.001 <0.001 <0.001 <0.0014-Chlorophenyl phenylether ---- ---- ---- <0.001 <0.001 <0.001 <0.001 <0.001 <0.001 <0.001 <0.0014-Nitroaniline ---- ---- ---- <0.0005 <0.0005 <0.0005 <0.0005 <0.0005 <0.0005 <0.0005 <0.0005Azobenzene ---- ---- ---- <0.0005 <0.0005 <0.0005 <0.0005 <0.0005 <0.0005 <0.0005 <0.0005bis(2-chloroethoxy)methane ---- ---- ---- <0.0005 <0.0005 <0.0005 <0.0005 <0.0005 <0.0005 <0.0005 <0.0005Bis(2-chloroethyl) ether ---- ---- ---- <0.001 <0.001 <0.001 <0.001 <0.001 <0.001 <0.001 <0.001Carbazole ---- ---- ---- <0.0005 <0.0005 <0.0005 <0.0005 <0.0005 <0.0005 <0.0005 <0.0005Dibenzofuran ---- ---- ---- <0.0005 <0.0005 <0.0005 <0.0005 <0.0005 <0.0005 <0.0005 <0.0005Hexachlorobenzene 0.00003 0.0005 ---- <0.001 <0.001 <0.001 <0.001 <0.001 <0.001 <0.001 <0.001Hexachlorobutadiene 0.0001 ---- ---- <0.001 <0.001 <0.001 <0.001 <0.001 <0.001 <0.001 <0.001Hexachlorocyclopentadine 0.0001 ---- ---- <0.001 <0.001 <0.001 <0.001 <0.001 <0.001 <0.001 <0.001Hexachloroethane ---- ---- ---- <0.001 <0.001 <0.001 <0.001 <0.001 <0.001 <0.001 <0.001Isophorone ---- ---- ---- <0.0005 <0.0005 <0.0005 <0.0005 <0.0005 <0.0005 <0.0005 <0.0005N-nitrosodi-n-propylamine ---- ---- ---- <0.0005 <0.0005 <0.0005 <0.0005 <0.0005 <0.0005 <0.0005 <0.0005Nitrobenzene 0.01 ---- ---- <0.001 <0.001 <0.001 <0.001 <0.001 <0.001 <0.001 <0.001
Notes:Shaded Indicates Result is above Dutch Intervention Value (DIV)BOLD Indicates Result is above Interim Guideline value (IGV)Italics Indicates Result is above Guideline Threshold Value (GTV)
1 IGV is for the sum of phenols2 IGV is for the sum of phthalates* DIV is for the sum of dichlorobenzenes** DIV is for the sum of all trichlorophenols*** DIV is for the sum of all phthalatesA PAH compounds specified in GTV
Monitoring Well IDSVOC EPA Interim
Guideline Value
Sum(0.05) *
GuidelineThreshold
Value
sum(0.01) **
DutchIntervention
Value
AECOM Pfizer Little Island Round 2 (November) 2016 Tables Final
For
insp
ectio
n pur
pose
s only
.
Conse
nt of
copy
right
owne
r req
uired
for a
ny ot
her u
se.
EPA Export 10-04-2017:02:56:34
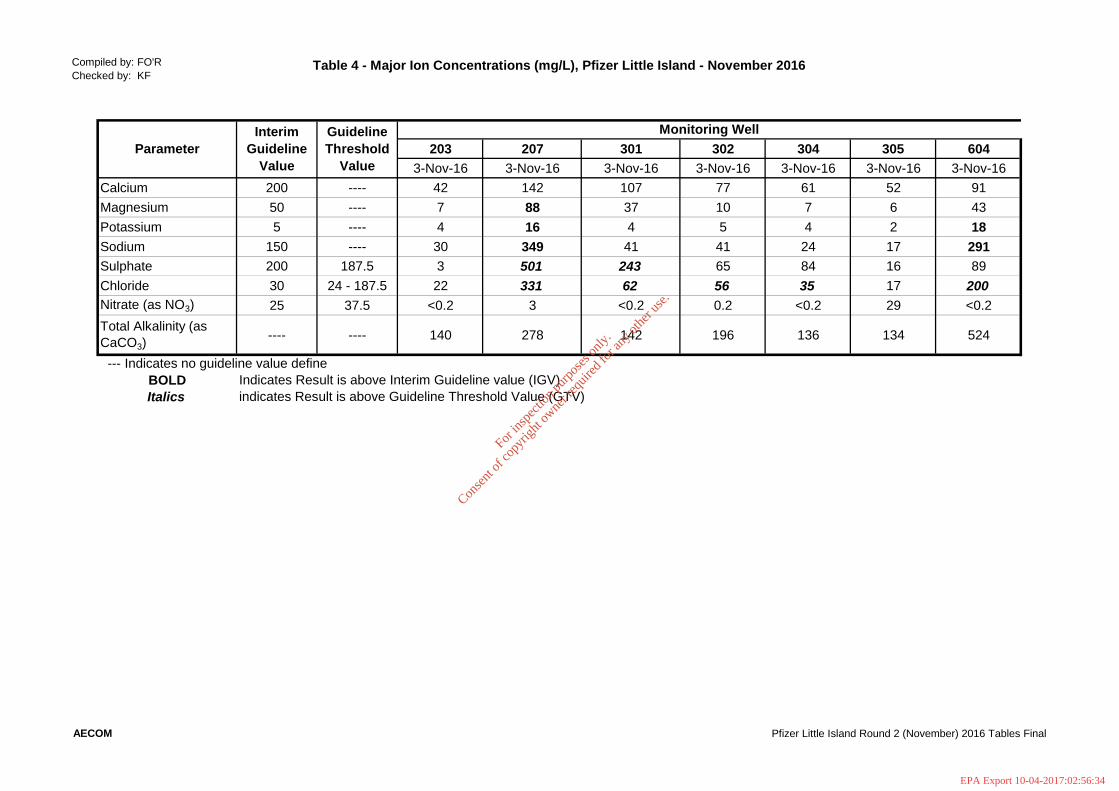
Compiled by: FO'RChecked by: KF
Table 4 - Major Ion Concentrations (mg/L), Pfizer Little Island - November 2016
203 207 301 302 304 305 6043-Nov-16 3-Nov-16 3-Nov-16 3-Nov-16 3-Nov-16 3-Nov-16 3-Nov-16
Calcium 200 ---- 42 142 107 77 61 52 91Magnesium 50 ---- 7 88 37 10 7 6 43Potassium 5 ---- 4 16 4 5 4 2 18Sodium 150 ---- 30 349 41 41 24 17 291Sulphate 200 187.5 3 501 243 65 84 16 89Chloride 30 24 - 187.5 22 331 62 56 35 17 200Nitrate (as NO3) 25 37.5 <0.2 3 <0.2 0.2 <0.2 29 <0.2Total Alkalinity (asCaCO3)
---- ---- 140 278 142 196 136 134 524
--- Indicates no guideline value defineBOLD Indicates Result is above Interim Guideline value (IGV)Italics indicates Result is above Guideline Threshold Value (GTV)
ParameterInterim
GuidelineValue
GuidelineThreshold
Value
Monitoring Well
AECOM Pfizer Little Island Round 2 (November) 2016 Tables Final
For
insp
ectio
n pur
pose
s only
.
Conse
nt of
copy
right
owne
r req
uired
for a
ny ot
her u
se.
EPA Export 10-04-2017:02:56:34
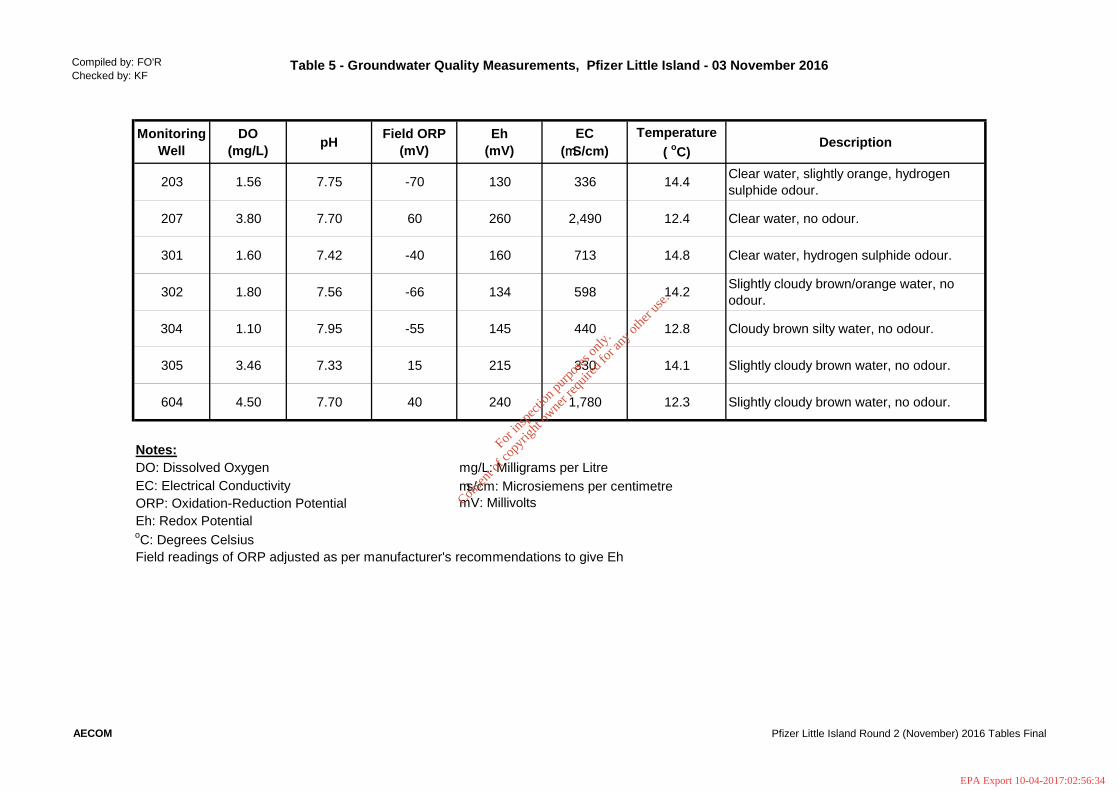
Compiled by: FO'RChecked by: KF
Table 5 - Groundwater Quality Measurements, Pfizer Little Island - 03 November 2016
MonitoringWell
DO(mg/L) pH Field ORP
(mV)Eh
(mV)EC
(mS/cm)Temperature
( oC)Description
203 1.56 7.75 -70 130 336 14.4 Clear water, slightly orange, hydrogensulphide odour.
207 3.80 7.70 60 260 2,490 12.4 Clear water, no odour.
301 1.60 7.42 -40 160 713 14.8 Clear water, hydrogen sulphide odour.
302 1.80 7.56 -66 134 598 14.2 Slightly cloudy brown/orange water, noodour.
304 1.10 7.95 -55 145 440 12.8 Cloudy brown silty water, no odour.
305 3.46 7.33 15 215 330 14.1 Slightly cloudy brown water, no odour.
604 4.50 7.70 40 240 1,780 12.3 Slightly cloudy brown water, no odour.
Notes:
EC: Electrical Conductivity ms/cm: Microsiemens per centimetreORP: Oxidation-Reduction PotentialEh: Redox Potential
Field readings of ORP adjusted as per manufacturer's recommendations to give Eh
DO: Dissolved Oxygen mg/L: Milligrams per Litre
oC: Degrees Celsius
mV: Millivolts
AECOM Pfizer Little Island Round 2 (November) 2016 Tables Final
For
insp
ectio
n pur
pose
s only
.
Conse
nt of
copy
right
owne
r req
uired
for a
ny ot
her u
se.
EPA Export 10-04-2017:02:56:34

Compiled by: FO'RChecked by: KF
Table 6 - Groundwater Level Data, Pfizer Little Island - 03 November 2016
MonitoringWell
ScreenIntervalm bct
Top of WellCasingm AOD
SWLm bct
SWLm AOD
Total DepthMeasured
m bct
Total DepthInstalled
m bct
Thickness ofSiltm
% of ScreenSection
Silted-Up201 4.5-10.0 5.341 4.600 0.74 8.60 10.00 1.40 25%202 6.0-10.0 6.115 NM NM NM 10.00 NM NM203 4.5-10.0 6.397 5.760 0.64 8.28 9.24 0.96 17%
205A 3.4-7.1 6.649 6.025 0.62 7.16 7.15 NA NA206 7.0-13.0 6.953 6.298 0.66 12.47 13.00 0.53 9%207 10.5-13.5 6.774 6.060 0.71 10.63 13.50 2.87 96%301 6.0-10.0 7.079 6.445 0.63 10.45 10.00 NA NA302 2.0-7.0 4.006 3.365 0.64 7.57 7.00 NA NA303 3.2-6.2 4.190 3.545 0.65 6.54 6.20 NA NA304 2.9-9.6 6.535 5.890 0.65 9.48 9.60 0.12 2%305 2.6-6.9 4.395 3.760 0.64 7.08 6.90 NA NA402 5.0-6.5 6.001 5.307 0.69 6.45 6.50 0.05 3%403 1.5-3.0 5.453 2.680 2.77 2.99 3.00 0.01 1%404 1.7-4.7 5.628 Dry - 4.26 4.70 0.44 15%405 5.1-6.1 5.856 5.155 0.70 5.99 6.10 0.11 11%501 2.1-4.1 5.584 2.885 2.70 3.69 4.10 0.41 21%601 8.1-10.1 4.494 3.565 0.93 10.07 10.17 0.10 5%602 8.45-9.4 5.385 4.540 0.85 9.40 9.47 0.07 7%603 9.6-10.6 5.171 4.530 0.64 10.58 10.60 0.02 2%604 7.6-9.1 4.790 4.185 0.61 9.03 9.16 0.13 9%
Production Well - 7.080 6.400 0.68 NM 16.05 NA NA
Notes:m AOD: Metres above Ordnance DatumSWL: Static Water Levelm bct: Metres below casing topNM: Not MeasuredNA: Not Applicable-: Not KnownBold. Greater than 30% of screen section silted up
AECOM Pfizer Little Island Round 2 (November) 2016 Tables Final
For
insp
ectio
n pur
pose
s only
.
Conse
nt of
copy
right
owne
r req
uired
for a
ny ot
her u
se.
EPA Export 10-04-2017:02:56:34
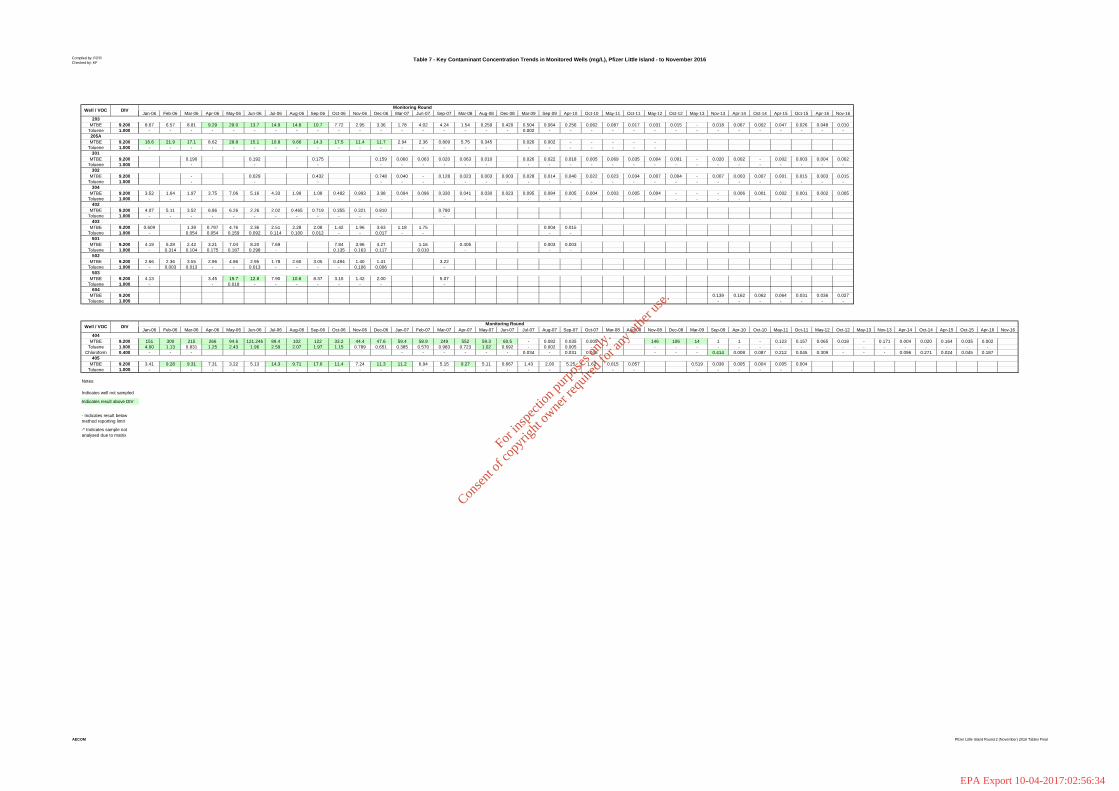
Compiled by: FO'RChecked by: KF
Table 7 - Key Contaminant Concentration Trends in Monitored Wells (mg/L), Pfizer Little Island - to November 2016
203MTBE 9.200
Toluene 1.000205AMTBE 9.200
Toluene 1.000301
MTBE 9.200Toluene 1.000
302MTBE 9.200
Toluene 1.000304
MTBE 9.200Toluene 1.000
402MTBE 9.200
Toluene 1.000403
MTBE 9.200Toluene 1.000
501MTBE 9.200
Toluene 1.000502
MTBE 9.200Toluene 1.000
503MTBE 9.200
Toluene 1.000604
MTBE 9.200Toluene 1.000
404MTBE 9.200
Toluene 1.000Chloroform 0.400
405MTBE 9.200
Toluene 1.000
Notes:
Indicates well not sampled
Indicates result above DIV
-* Indicates sample notanalysed due to matrix
- Indicates result belowmethod reporting limit
Well / VOC DIV
Well / VOC DIV
Jan-06 Feb-06 Mar-06 Apr-06 May-06 Jun-06 Jul-06 Aug-06 Sep-06 Oct-06 Nov-06 Dec-06 Mar-07 Jun-07 Sep-07 Mar-08 Aug-08 Dec-08 Mar-09 Sep-09 Apr-10 Oct-10 May-11 Oct-11 May-12 Oct-12 May-13 Nov-13 Apr-14 Oct-14 Apr-15 Oct-15 Apr-16 Nov-16
8.67 6.57 8.81 9.29 29.0 13.7 14.9 14.8 10.7 7.72 2.95 3.36 1.78 4.02 4.24 1.54 0.259 0.420 0.504 0.064 0.256 0.062 0.087 0.017 0.031 0.015 - 0.018 0.067 0.002 0.047 0.026 0.048 0.010- - - - - - - - - - - - - - - - - - 0.002 - - - - - - - - - - - - - - -
16.6 21.9 17.1 8.62 28.8 15.1 10.8 9.66 14.3 17.5 11.4 11.7 2.94 2.36 0.809 5.75 0.345 0.026 0.002 - - - - -- - - - - - - - - - - - - - - - - - - - - - - -
0.190 0.192 0.175 0.159 0.060 0.063 0.020 0.063 0.010 0.026 0.022 0.018 0.005 0.069 0.035 0.004 0.001 - 0.020 0.002 - 0.002 0.003 0.004 0.002- - - - - - - - - - - - - - - - - - - - - - - - -
- 0.029 0.432 0.748 0.040 - 0.128 0.023 0.003 0.003 0.028 0.014 0.040 0.022 0.023 0.034 0.007 0.004 - 0.007 0.003 0.007 0.001 0.015 0.003 0.015- - - - - - - - - - - - - - - - - - - - - - - - - -
3.52 1.64 1.97 3.75 7.06 5.16 4.33 1.99 1.08 0.482 0.993 3.98 0.094 0.096 0.330 0.041 0.030 0.023 0.095 0.084 0.005 0.004 0.003 0.005 0.004 - - - 0.006 0.001 0.002 0.001 0.002 0.005- - - - - - - - - - - - - - - - - - - - - - - - - - - - - - - - - -
4.07 5.11 3.52 6.86 6.26 2.26 2.02 0.465 0.719 0.355 0.321 0.810 0.780- - - - - - - - - - - - -
0.609 1.39 0.797 4.76 2.36 2.51 2.28 2.08 1.42 1.96 3.63 1.18 1.75 0.004 0.015- 0.054 0.054 0.159 0.092 0.114 0.100 0.012 - - 0.017 - - - -
4.19 5.28 2.42 3.21 7.04 8.20 7.69 7.84 3.96 4.27 1.16 0.405 0.003 0.003- 0.314 0.104 0.175 0.187 0.298 - 0.135 0.163 0.117 0.010 - - -
2.66 2.36 3.55 2.96 4.86 2.95 1.78 2.60 3.05 0.494 1.40 1.41 3.22- 0.003 0.013 - - 0.013 - - - - 0.106 0.006 -
4.13 3.45 19.7 12.8 7.90 10.6 8.37 3.15 1.42 2.00 5.07- - 0.018 - - - - - - - -
0.139 0.162 0.062 0.064 0.031 0.036 0.027- - - - - - -
Jan-06 Feb-06 Mar-06 Apr-06 May-06 Jun-06 Jul-06 Aug-06 Sep-06 Oct-06 Nov-06 Dec-06 Jan-07 Feb-07 Mar-07 Apr-07 May-07 Jun-07 Jul-07 Aug-07 Sep-07 Oct-07 Mar-08 Aug-08 Nov-08 Dec-08 Mar-09 Sep-09 Apr-10 Oct-10 May-11 Oct-11 May-12 Oct-12 May-13 Nov-13 Apr-14 Oct-14 Apr-15 Oct-15 Apr-16 Nov-16
151 300 215 266 94.6 121.246 89.4 102 122 33.2 44.4 47.6 59.4 58.9 249 552 59.3 60.5 - 0.082 0.035 0.005 146 106 14 1 1 - 0.123 0.157 0.065 0.018 - 0.171 0.004 0.020 0.164 0.035 0.0024.00 1.13 0.831 1.25 2.43 1.96 2.59 2.07 1.97 1.15 0.789 0.651 0.385 0.570 0.983 0.723 1.02 0.692 - 0.002 0.005 - - - - - - - - - - - - - - - - - -
- - - - - - - - - 0.034 - 0.031 0.046 - - - 0.414 0.008 0.087 0.212 0.045 0.309 - - - 0.096 0.271 0.024 0.045 0.187
3.41 9.28 9.31 7.31 3.22 5.13 14.3 9.71 17.6 11.4 7.24 11.3 11.2 6.94 5.15 9.27 5.11 0.667 1.43 2.00 5.25 1.62 0.015 0.057 0.519 0.038 0.005 0.004 0.005 0.004- - - - - - - - - - - - - - - - - - - - - - - - - - - - - -
Monitoring Round
Monitoring Round
AECOM Pfizer Little Island Round 2 (November) 2016 Tables Final
For
insp
ectio
n pur
pose
s only
.
Conse
nt of
copy
right
owne
r req
uired
for a
ny ot
her u
se.
EPA Export 10-04-2017:02:56:34

Pfizer Little Island Pfizer Ireland Pharmaceuticals LimitedProject Reference: CKRP0002
Prepared for: Pfizer Ireland Pharmaceuticals LimitedCkrp0002 Pfizer Little Island Round 2 2016 Final
AECOM
Appendix A – Laboratory Certificates
For
insp
ectio
n pur
pose
s only
.
Conse
nt of
copy
right
owne
r req
uired
for a
ny ot
her u
se.
EPA Export 10-04-2017:02:56:34
Unit 3 Deeside Point
Zone 3
Deeside Industrial Park
Deeside
AECOM
Attention :
Date :
Your reference :
Our reference :
Location :
Date samples received :
Status :
Issue :
Fergus O'Regan
28th November, 2016
1
Exova Jones Environmental
CH5 2UA
Tel: +44 (0) 1244 833780
Fax: +44 (0) 1244 833781
Acorn Business Campus
Mahon Industrial Park
Black Rock
Cork
Ireland
Registered Address : Exova (UK) Ltd, Lochend Industrial Estate, Newbridge, Midlothian, EH28 8PL
Eight samples were received for analysis on 4th November, 2016 of which eight were scheduled for analysis. Please find attached our Test Report
which should be read with notes at the end of the report and should include all sections if reproduced. Interpretations and opinions are outside the
scope of any accreditation, and all results relate only to samples supplied.
All analysis is carried out on as received samples and reported on a dry weight basis unless stated otherwise. Results are not surrogate corrected.
Paul Lee-Boden BSc
Project Manager
60488151
Little Island
4th November, 2016
Final report
Compiled By:
Test Report 16/16640 Batch 1
QF-PM 3.1.1 v16Please include all sections of this report if it is reproduced
All solid results are expressed on a dry weight basis unless stated otherwise. 1 of 10
For
insp
ectio
n pur
pose
s only
.
Conse
nt of
copy
right
owne
r req
uired
for a
ny ot
her u
se.
EPA Export 10-04-2017:02:56:34

Client Name: Report : Liquid
Reference:
Location:
Contact: Liquids/products: V=40ml vial, G=glass bottle, P=plastic bottle
JE Job No.: 16/16640 H=H2SO4, Z=ZnAc, N=NaOH, HN=HN03
J E Sample No. 1-5 11-15 16-20 21-25 26-30 31-35 36-40
Sample ID 203 207 301 302 304 305 604
Depth
COC No / misc
Containers V P G V P G V P G V P G V P G V P G V P G
Sample Date 03/11/2016 03/11/2016 03/11/2016 03/11/2016 03/11/2016 03/11/2016 03/11/2016
Sample Type Ground Water Ground Water Ground Water Ground Water Ground Water Ground Water Ground Water
Batch Number 1 1 1 1 1 1 1
Date of Receipt 04/11/2016 04/11/2016 04/11/2016 04/11/2016 04/11/2016 04/11/2016 04/11/2016
Dissolved Calcium # 41.9 142.1 107.3 77.3 60.7 51.9 91.1 <0.2 mg/l TM30/PM14
Dissolved Magnesium # 6.9 87.9 36.7 9.6 7.4 6.4 43.1 <0.1 mg/l TM30/PM14
Dissolved Potassium # 4.2 16.0 3.8 4.5 3.6 1.5 18.0 <0.1 mg/l TM30/PM14
Dissolved Sodium # 30.3 349.4AA 40.9 41.1 23.8 17.4 291.3AA <0.1 mg/l TM30/PM14
Sulphate # 2.5 500.7 243.1 65.0 83.9 15.7 89.3 <0.5 mg/l TM38/PM0
Chloride # 22.0 331.0 61.6 56.4 34.5 17.4 200.4 <0.3 mg/l TM38/PM0
Nitrate as NO3 # <0.2 2.9 <0.2 0.2 <0.2 29.1 <0.2 <0.2 mg/l TM38/PM0
Total Alkalinity as CaCO3 # 140 278 142 196 136 134 524 <1 mg/l TM75/PM0
Little Island
Fergus O'Regan
Please see attached notes for all
abbreviations and acronyms
LOD/LOR UnitsMethod
No.
Exova Jones Environmental
AECOM
60488151
QF-PM 3.1.2 v11Please include all sections of this report if it is reproduced
All solid results are expressed on a dry weight basis unless stated otherwise. 2 of 10
For
insp
ectio
n pur
pose
s only
.
Conse
nt of
copy
right
owne
r req
uired
for a
ny ot
her u
se.
EPA Export 10-04-2017:02:56:34

Client Name: Report : Misc
Reference:
Location: Solids: V=60g VOC jar, J=250g glass jar, T=plastic tub
Contact:
JE Job No.: 16/16640
J E Sample No. 1-5
Sample ID 203
Depth
COC No / misc
Containers V P G
Sample Date 03/11/2016
Sample Type Ground Water
Batch Number 1
Date of Receipt 04/11/2016
Sample Temperature 6.5 <0.1 Degrees C NONE/NONE
Little Island
Fergus O'Regan
Please see attached notes for all
abbreviations and acronyms
LOD/LOR UnitsMethod
No.
Exova Jones Environmental
AECOM
60488151
QF-PM 3.1.2 v11Please include all sections of this report if it is reproduced
All solid results are expressed on a dry weight basis unless stated otherwise. 3 of 10
For
insp
ectio
n pur
pose
s only
.
Conse
nt of
copy
right
owne
r req
uired
for a
ny ot
her u
se.
EPA Export 10-04-2017:02:56:34

Client Name: SVOC Report : Liquid
Reference:
Location:
Contact:
JE Job No.: 16/16640
J E Sample No. 1-5 6-10 11-15 16-20 21-25 26-30 31-35 36-40
Sample ID 203 DUP01 207 301 302 304 305 604
Depth
COC No / misc
Containers V P G V P G V P G V P G V P G V P G V P G V P G
Sample Date 03/11/2016 03/11/2016 03/11/2016 03/11/2016 03/11/2016 03/11/2016 03/11/2016 03/11/2016
Sample Type Ground Water Ground Water Ground Water Ground Water Ground Water Ground Water Ground Water Ground Water
Batch Number 1 1 1 1 1 1 1 1
Date of Receipt 04/11/2016 04/11/2016 04/11/2016 04/11/2016 04/11/2016 04/11/2016 04/11/2016 04/11/2016
SVOC MS
Phenols
2-Chlorophenol # <1 <1 <1 <1 <1 <1 <1 <1 <1 ug/l TM16/PM30
2-Methylphenol # <0.5 <0.5 <0.5 <0.5 <0.5 <0.5 <0.5 <0.5 <0.5 ug/l TM16/PM30
2-Nitrophenol <0.5 <0.5 <0.5 <0.5 <0.5 <0.5 <0.5 <0.5 <0.5 ug/l TM16/PM30
2,4-Dichlorophenol # <0.5 <0.5 <0.5 <0.5 <0.5 <0.5 <0.5 <0.5 <0.5 ug/l TM16/PM30
2,4-Dimethylphenol <1 <1 <1 <1 <1 <1 <1 <1 <1 ug/l TM16/PM30
2,4,5-Trichlorophenol # <0.5 <0.5 <0.5 <0.5 <0.5 <0.5 <0.5 <0.5 <0.5 ug/l TM16/PM30
2,4,6-Trichlorophenol <1 <1 <1 <1 <1 <1 <1 <1 <1 ug/l TM16/PM30
4-Chloro-3-methylphenol # <0.5 <0.5 <0.5 <0.5 <0.5 <0.5 <0.5 <0.5 <0.5 ug/l TM16/PM30
4-Methylphenol <1 <1 <1 <1 <1 <1 <1 <1 <1 ug/l TM16/PM30
4-Nitrophenol <10 <10 <10 <10 <10 <10 <10 <10 <10 ug/l TM16/PM30
Pentachlorophenol <1 <1 <1 <1 <1 <1 <1 <1 <1 ug/l TM16/PM30
Phenol <1 <1 <1 <1 <1 <1 <1 <1 <1 ug/l TM16/PM30
PAHs
2-Chloronaphthalene # <1 <1 <1 <1 <1 <1 <1 <1 <1 ug/l TM16/PM30
2-Methylnaphthalene # <1 <1 <1 <1 <1 <1 <1 <1 <1 ug/l TM16/PM30
Naphthalene # <1 <1 <1 <1 <1 <1 <1 <1 <1 ug/l TM16/PM30
Acenaphthylene # <0.5 <0.5 <0.5 <0.5 <0.5 <0.5 <0.5 <0.5 <0.5 ug/l TM16/PM30
Acenaphthene # <1 <1 <1 <1 <1 <1 <1 <1 <1 ug/l TM16/PM30
Fluorene # <0.5 <0.5 <0.5 <0.5 <0.5 <0.5 <0.5 <0.5 <0.5 ug/l TM16/PM30
Phenanthrene # <0.5 <0.5 <0.5 <0.5 <0.5 <0.5 <0.5 <0.5 <0.5 ug/l TM16/PM30
Anthracene # <0.5 <0.5 <0.5 <0.5 <0.5 <0.5 <0.5 <0.5 <0.5 ug/l TM16/PM30
Fluoranthene # <0.5 <0.5 <0.5 <0.5 <0.5 <0.5 <0.5 <0.5 <0.5 ug/l TM16/PM30
Pyrene # <0.5 <0.5 <0.5 <0.5 <0.5 <0.5 <0.5 <0.5 <0.5 ug/l TM16/PM30
Benzo(a)anthracene # <0.5 <0.5 <0.5 <0.5 <0.5 <0.5 <0.5 <0.5 <0.5 ug/l TM16/PM30
Chrysene # <0.5 <0.5 <0.5 <0.5 <0.5 <0.5 <0.5 <0.5 <0.5 ug/l TM16/PM30
Benzo(bk)fluoranthene # <1 <1 <1 <1 <1 <1 <1 <1 <1 ug/l TM16/PM30
Benzo(a)pyrene <1 <1 <1 <1 <1 <1 <1 <1 <1 ug/l TM16/PM30
Indeno(123cd)pyrene <1 <1 <1 <1 <1 <1 <1 <1 <1 ug/l TM16/PM30
Dibenzo(ah)anthracene # <0.5 <0.5 <0.5 <0.5 <0.5 <0.5 <0.5 <0.5 <0.5 ug/l TM16/PM30
Benzo(ghi)perylene # <0.5 <0.5 <0.5 <0.5 <0.5 <0.5 <0.5 <0.5 <0.5 ug/l TM16/PM30
Phthalates
Bis(2-ethylhexyl) phthalate <5 <5 <5 <5 <5 <5 <5 <5 <5 ug/l TM16/PM30
Butylbenzyl phthalate <1 <1 <1 <1 <1 <1 <1 <1 <1 ug/l TM16/PM30
Di-n-butyl phthalate # 1.6 1.7 <1.5 <1.5 <1.5 <1.5 <1.5 <1.5 <1.5 ug/l TM16/PM30
Di-n-Octyl phthalate <1 <1 <1 <1 <1 <1 <1 <1 <1 ug/l TM16/PM30
Diethyl phthalate # <1 <1 <1 <1 <1 <1 <1 <1 <1 ug/l TM16/PM30
Dimethyl phthalate <1 <1 <1 <1 <1 <1 <1 <1 <1 ug/l TM16/PM30
Little Island
Fergus O'Regan
Please see attached notes for all
abbreviations and acronyms
LOD/LOR UnitsMethod
No.
Exova Jones Environmental
AECOM
60488151
QF-PM 3.1.3 v11Please include all sections of this report if it is reproduced
All solid results are expressed on a dry weight basis unless stated otherwise. 4 of 10
For
insp
ectio
n pur
pose
s only
.
Conse
nt of
copy
right
owne
r req
uired
for a
ny ot
her u
se.
EPA Export 10-04-2017:02:56:34
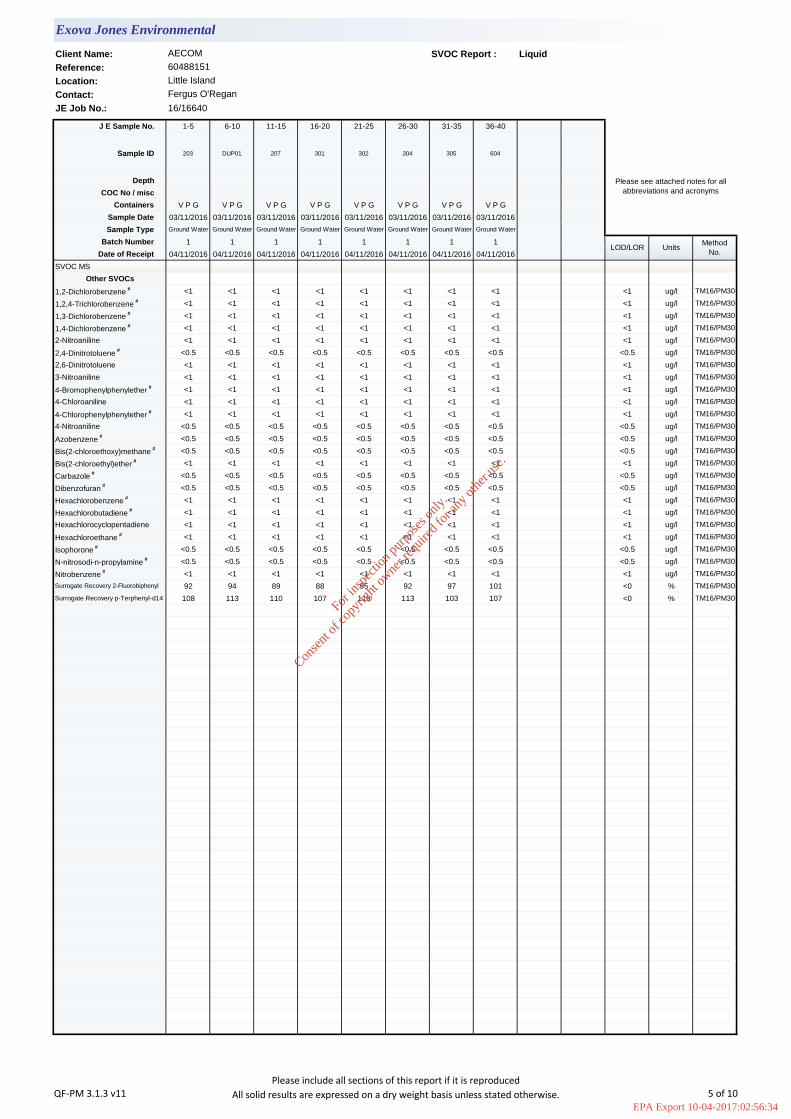
Client Name: SVOC Report : Liquid
Reference:
Location:
Contact:
JE Job No.: 16/16640
J E Sample No. 1-5 6-10 11-15 16-20 21-25 26-30 31-35 36-40
Sample ID 203 DUP01 207 301 302 304 305 604
Depth
COC No / misc
Containers V P G V P G V P G V P G V P G V P G V P G V P G
Sample Date 03/11/2016 03/11/2016 03/11/2016 03/11/2016 03/11/2016 03/11/2016 03/11/2016 03/11/2016
Sample Type Ground Water Ground Water Ground Water Ground Water Ground Water Ground Water Ground Water Ground Water
Batch Number 1 1 1 1 1 1 1 1
Date of Receipt 04/11/2016 04/11/2016 04/11/2016 04/11/2016 04/11/2016 04/11/2016 04/11/2016 04/11/2016
SVOC MS
Other SVOCs
1,2-Dichlorobenzene # <1 <1 <1 <1 <1 <1 <1 <1 <1 ug/l TM16/PM30
1,2,4-Trichlorobenzene # <1 <1 <1 <1 <1 <1 <1 <1 <1 ug/l TM16/PM30
1,3-Dichlorobenzene # <1 <1 <1 <1 <1 <1 <1 <1 <1 ug/l TM16/PM30
1,4-Dichlorobenzene # <1 <1 <1 <1 <1 <1 <1 <1 <1 ug/l TM16/PM30
2-Nitroaniline <1 <1 <1 <1 <1 <1 <1 <1 <1 ug/l TM16/PM30
2,4-Dinitrotoluene # <0.5 <0.5 <0.5 <0.5 <0.5 <0.5 <0.5 <0.5 <0.5 ug/l TM16/PM30
2,6-Dinitrotoluene <1 <1 <1 <1 <1 <1 <1 <1 <1 ug/l TM16/PM30
3-Nitroaniline <1 <1 <1 <1 <1 <1 <1 <1 <1 ug/l TM16/PM30
4-Bromophenylphenylether # <1 <1 <1 <1 <1 <1 <1 <1 <1 ug/l TM16/PM30
4-Chloroaniline <1 <1 <1 <1 <1 <1 <1 <1 <1 ug/l TM16/PM30
4-Chlorophenylphenylether # <1 <1 <1 <1 <1 <1 <1 <1 <1 ug/l TM16/PM30
4-Nitroaniline <0.5 <0.5 <0.5 <0.5 <0.5 <0.5 <0.5 <0.5 <0.5 ug/l TM16/PM30
Azobenzene # <0.5 <0.5 <0.5 <0.5 <0.5 <0.5 <0.5 <0.5 <0.5 ug/l TM16/PM30
Bis(2-chloroethoxy)methane # <0.5 <0.5 <0.5 <0.5 <0.5 <0.5 <0.5 <0.5 <0.5 ug/l TM16/PM30
Bis(2-chloroethyl)ether # <1 <1 <1 <1 <1 <1 <1 <1 <1 ug/l TM16/PM30
Carbazole # <0.5 <0.5 <0.5 <0.5 <0.5 <0.5 <0.5 <0.5 <0.5 ug/l TM16/PM30
Dibenzofuran # <0.5 <0.5 <0.5 <0.5 <0.5 <0.5 <0.5 <0.5 <0.5 ug/l TM16/PM30
Hexachlorobenzene # <1 <1 <1 <1 <1 <1 <1 <1 <1 ug/l TM16/PM30
Hexachlorobutadiene # <1 <1 <1 <1 <1 <1 <1 <1 <1 ug/l TM16/PM30
Hexachlorocyclopentadiene <1 <1 <1 <1 <1 <1 <1 <1 <1 ug/l TM16/PM30
Hexachloroethane # <1 <1 <1 <1 <1 <1 <1 <1 <1 ug/l TM16/PM30
Isophorone # <0.5 <0.5 <0.5 <0.5 <0.5 <0.5 <0.5 <0.5 <0.5 ug/l TM16/PM30
N-nitrosodi-n-propylamine # <0.5 <0.5 <0.5 <0.5 <0.5 <0.5 <0.5 <0.5 <0.5 ug/l TM16/PM30
Nitrobenzene # <1 <1 <1 <1 <1 <1 <1 <1 <1 ug/l TM16/PM30
Surrogate Recovery 2-Fluorobiphenyl 92 94 89 88 95 92 97 101 <0 % TM16/PM30
Surrogate Recovery p-Terphenyl-d14 108 113 110 107 115 113 103 107 <0 % TM16/PM30
LOD/LOR UnitsMethod
No.
Exova Jones Environmental
AECOM
60488151
Little Island
Fergus O'Regan
Please see attached notes for all
abbreviations and acronyms
QF-PM 3.1.3 v11Please include all sections of this report if it is reproduced
All solid results are expressed on a dry weight basis unless stated otherwise. 5 of 10
For
insp
ectio
n pur
pose
s only
.
Conse
nt of
copy
right
owne
r req
uired
for a
ny ot
her u
se.
EPA Export 10-04-2017:02:56:34
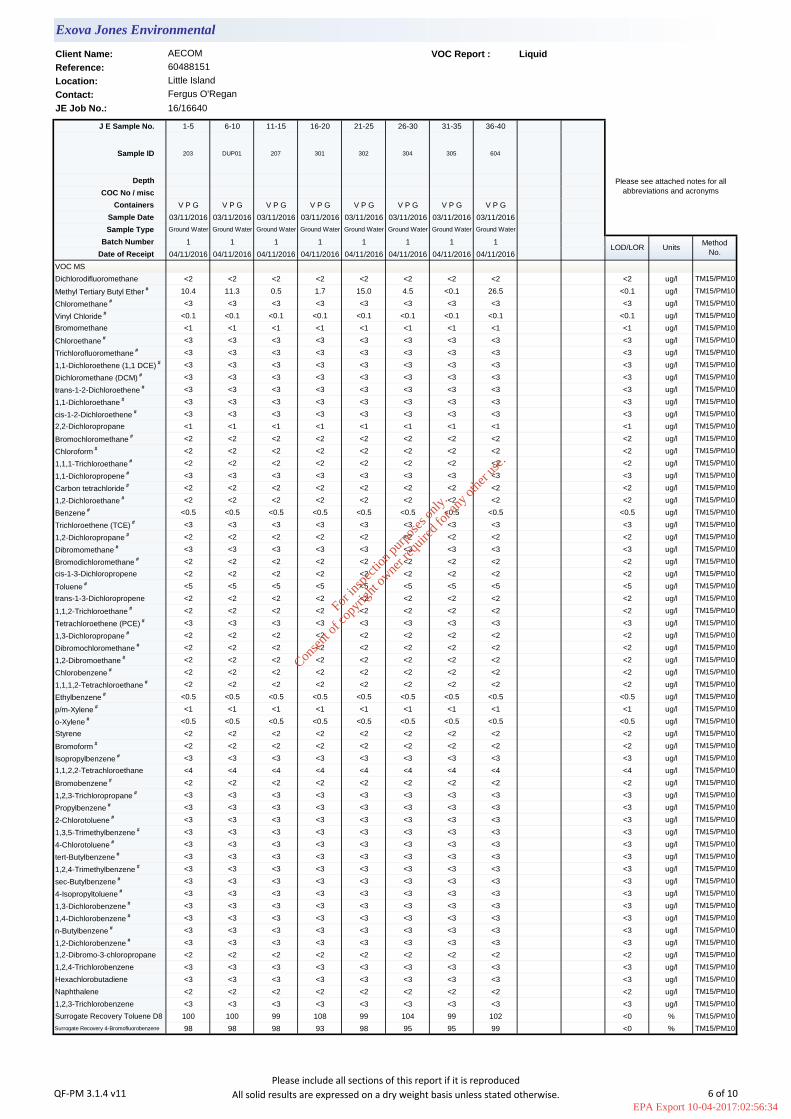
Client Name: VOC Report : Liquid
Reference:
Location:
Contact:
JE Job No.: 16/16640
J E Sample No. 1-5 6-10 11-15 16-20 21-25 26-30 31-35 36-40
Sample ID 203 DUP01 207 301 302 304 305 604
Depth
COC No / misc
Containers V P G V P G V P G V P G V P G V P G V P G V P G
Sample Date 03/11/2016 03/11/2016 03/11/2016 03/11/2016 03/11/2016 03/11/2016 03/11/2016 03/11/2016
Sample Type Ground Water Ground Water Ground Water Ground Water Ground Water Ground Water Ground Water Ground Water
Batch Number 1 1 1 1 1 1 1 1
Date of Receipt 04/11/2016 04/11/2016 04/11/2016 04/11/2016 04/11/2016 04/11/2016 04/11/2016 04/11/2016
VOC MS
Dichlorodifluoromethane <2 <2 <2 <2 <2 <2 <2 <2 <2 ug/l TM15/PM10
Methyl Tertiary Butyl Ether # 10.4 11.3 0.5 1.7 15.0 4.5 <0.1 26.5 <0.1 ug/l TM15/PM10
Chloromethane # <3 <3 <3 <3 <3 <3 <3 <3 <3 ug/l TM15/PM10
Vinyl Chloride # <0.1 <0.1 <0.1 <0.1 <0.1 <0.1 <0.1 <0.1 <0.1 ug/l TM15/PM10
Bromomethane <1 <1 <1 <1 <1 <1 <1 <1 <1 ug/l TM15/PM10
Chloroethane # <3 <3 <3 <3 <3 <3 <3 <3 <3 ug/l TM15/PM10
Trichlorofluoromethane # <3 <3 <3 <3 <3 <3 <3 <3 <3 ug/l TM15/PM10
1,1-Dichloroethene (1,1 DCE) # <3 <3 <3 <3 <3 <3 <3 <3 <3 ug/l TM15/PM10
Dichloromethane (DCM) # <3 <3 <3 <3 <3 <3 <3 <3 <3 ug/l TM15/PM10
trans-1-2-Dichloroethene # <3 <3 <3 <3 <3 <3 <3 <3 <3 ug/l TM15/PM10
1,1-Dichloroethane # <3 <3 <3 <3 <3 <3 <3 <3 <3 ug/l TM15/PM10
cis-1-2-Dichloroethene # <3 <3 <3 <3 <3 <3 <3 <3 <3 ug/l TM15/PM10
2,2-Dichloropropane <1 <1 <1 <1 <1 <1 <1 <1 <1 ug/l TM15/PM10
Bromochloromethane # <2 <2 <2 <2 <2 <2 <2 <2 <2 ug/l TM15/PM10
Chloroform # <2 <2 <2 <2 <2 <2 <2 <2 <2 ug/l TM15/PM10
1,1,1-Trichloroethane # <2 <2 <2 <2 <2 <2 <2 <2 <2 ug/l TM15/PM10
1,1-Dichloropropene # <3 <3 <3 <3 <3 <3 <3 <3 <3 ug/l TM15/PM10
Carbon tetrachloride # <2 <2 <2 <2 <2 <2 <2 <2 <2 ug/l TM15/PM10
1,2-Dichloroethane # <2 <2 <2 <2 <2 <2 <2 <2 <2 ug/l TM15/PM10
Benzene # <0.5 <0.5 <0.5 <0.5 <0.5 <0.5 <0.5 <0.5 <0.5 ug/l TM15/PM10
Trichloroethene (TCE) # <3 <3 <3 <3 <3 <3 <3 <3 <3 ug/l TM15/PM10
1,2-Dichloropropane # <2 <2 <2 <2 <2 <2 <2 <2 <2 ug/l TM15/PM10
Dibromomethane # <3 <3 <3 <3 <3 <3 <3 <3 <3 ug/l TM15/PM10
Bromodichloromethane # <2 <2 <2 <2 <2 <2 <2 <2 <2 ug/l TM15/PM10
cis-1-3-Dichloropropene <2 <2 <2 <2 <2 <2 <2 <2 <2 ug/l TM15/PM10
Toluene # <5 <5 <5 <5 <5 <5 <5 <5 <5 ug/l TM15/PM10
trans-1-3-Dichloropropene <2 <2 <2 <2 <2 <2 <2 <2 <2 ug/l TM15/PM10
1,1,2-Trichloroethane # <2 <2 <2 <2 <2 <2 <2 <2 <2 ug/l TM15/PM10
Tetrachloroethene (PCE) # <3 <3 <3 <3 <3 <3 <3 <3 <3 ug/l TM15/PM10
1,3-Dichloropropane # <2 <2 <2 <2 <2 <2 <2 <2 <2 ug/l TM15/PM10
Dibromochloromethane # <2 <2 <2 <2 <2 <2 <2 <2 <2 ug/l TM15/PM10
1,2-Dibromoethane # <2 <2 <2 <2 <2 <2 <2 <2 <2 ug/l TM15/PM10
Chlorobenzene # <2 <2 <2 <2 <2 <2 <2 <2 <2 ug/l TM15/PM10
1,1,1,2-Tetrachloroethane # <2 <2 <2 <2 <2 <2 <2 <2 <2 ug/l TM15/PM10
Ethylbenzene # <0.5 <0.5 <0.5 <0.5 <0.5 <0.5 <0.5 <0.5 <0.5 ug/l TM15/PM10
p/m-Xylene # <1 <1 <1 <1 <1 <1 <1 <1 <1 ug/l TM15/PM10
o-Xylene # <0.5 <0.5 <0.5 <0.5 <0.5 <0.5 <0.5 <0.5 <0.5 ug/l TM15/PM10
Styrene <2 <2 <2 <2 <2 <2 <2 <2 <2 ug/l TM15/PM10
Bromoform # <2 <2 <2 <2 <2 <2 <2 <2 <2 ug/l TM15/PM10
Isopropylbenzene # <3 <3 <3 <3 <3 <3 <3 <3 <3 ug/l TM15/PM10
1,1,2,2-Tetrachloroethane <4 <4 <4 <4 <4 <4 <4 <4 <4 ug/l TM15/PM10
Bromobenzene # <2 <2 <2 <2 <2 <2 <2 <2 <2 ug/l TM15/PM10
1,2,3-Trichloropropane # <3 <3 <3 <3 <3 <3 <3 <3 <3 ug/l TM15/PM10
Propylbenzene # <3 <3 <3 <3 <3 <3 <3 <3 <3 ug/l TM15/PM10
2-Chlorotoluene # <3 <3 <3 <3 <3 <3 <3 <3 <3 ug/l TM15/PM10
1,3,5-Trimethylbenzene # <3 <3 <3 <3 <3 <3 <3 <3 <3 ug/l TM15/PM10
4-Chlorotoluene # <3 <3 <3 <3 <3 <3 <3 <3 <3 ug/l TM15/PM10
tert-Butylbenzene # <3 <3 <3 <3 <3 <3 <3 <3 <3 ug/l TM15/PM10
1,2,4-Trimethylbenzene # <3 <3 <3 <3 <3 <3 <3 <3 <3 ug/l TM15/PM10
sec-Butylbenzene # <3 <3 <3 <3 <3 <3 <3 <3 <3 ug/l TM15/PM10
4-Isopropyltoluene # <3 <3 <3 <3 <3 <3 <3 <3 <3 ug/l TM15/PM10
1,3-Dichlorobenzene # <3 <3 <3 <3 <3 <3 <3 <3 <3 ug/l TM15/PM10
1,4-Dichlorobenzene # <3 <3 <3 <3 <3 <3 <3 <3 <3 ug/l TM15/PM10
n-Butylbenzene # <3 <3 <3 <3 <3 <3 <3 <3 <3 ug/l TM15/PM10
1,2-Dichlorobenzene # <3 <3 <3 <3 <3 <3 <3 <3 <3 ug/l TM15/PM10
1,2-Dibromo-3-chloropropane <2 <2 <2 <2 <2 <2 <2 <2 <2 ug/l TM15/PM10
1,2,4-Trichlorobenzene <3 <3 <3 <3 <3 <3 <3 <3 <3 ug/l TM15/PM10
Hexachlorobutadiene <3 <3 <3 <3 <3 <3 <3 <3 <3 ug/l TM15/PM10
Naphthalene <2 <2 <2 <2 <2 <2 <2 <2 <2 ug/l TM15/PM10
1,2,3-Trichlorobenzene <3 <3 <3 <3 <3 <3 <3 <3 <3 ug/l TM15/PM10
Surrogate Recovery Toluene D8 100 100 99 108 99 104 99 102 <0 % TM15/PM10
Surrogate Recovery 4-Bromofluorobenzene 98 98 98 93 98 95 95 99 <0 % TM15/PM10
Little Island
Fergus O'Regan
Please see attached notes for all
abbreviations and acronyms
LOD/LOR UnitsMethod
No.
Exova Jones Environmental
AECOM
60488151
QF-PM 3.1.4 v11Please include all sections of this report if it is reproduced
All solid results are expressed on a dry weight basis unless stated otherwise. 6 of 10
For
insp
ectio
n pur
pose
s only
.
Conse
nt of
copy
right
owne
r req
uired
for a
ny ot
her u
se.
EPA Export 10-04-2017:02:56:34
Notification of Deviating Samples
J E
Job
No.
Batch Depth J E Sample
No.Analysis Reason
Please note that only samples that are deviating are mentioned in this report. If no samples are listed it is because none were deviating.
Only analyses which are accredited are recorded as deviating if set criteria are not met.
Exova Jones Environmental
60488151
Little Island
Fergus O'ReganContact:
Sample ID
Client Name: AECOM
Reference:
Location:
No deviating sample report results for job 16/16640
QF-PM 3.1.11 v3 Please include all sections of this report if it is reproduced 7 of 10
For
insp
ectio
n pur
pose
s only
.
Conse
nt of
copy
right
owne
r req
uired
for a
ny ot
her u
se.
EPA Export 10-04-2017:02:56:34
JE Job No.:
SOILS
DEVIATING SAMPLES
SURROGATES
DILUTIONS
BLANKS
NOTE
Where Mineral Oil or Fats, Oils and Grease is quoted, this refers to Total Aliphatics C10-C40.
Please note we are not a UK Drinking Water Inspectorate (DWI) Approved Laboratory .
If you have not already done so, please send us a purchase order if this is required by your company.
Samples must be received in a condition appropriate to the requested analyses. All samples should be submitted to the laboratory in suitable
containers with sufficient ice packs to sustain an appropriate temperature for the requested analysis. If this is not the case you will be informed and
any test results that may be compromised highlighted on your deviating samples report.
ISO17025 accreditation applies to surface water and groundwater and usually one other matrix which is analysis specific, any other liquids are
outside our scope of accreditation.
As surface waters require different sample preparation to groundwaters the laboratory must be informed of the water type when submitting samples.
Where appropriate please make sure that our detection limits are suitable for your needs, if they are not, please notify us immediately.
Data is only reported if the laboratory is confident that the data is a true reflection of the samples analysed. Data is only reported as accredited when
all the requirements of our Quality System have been met. In certain circumstances where all the requirements of the Quality System have not been
met, for instance if the associated AQC has failed, the reason is fully investigated and documented. The sample data is then evaluated alongside
the other quality control checks performed during analysis to determine its suitability. Following this evaluation, provided the sample results have not
been effected, the data is reported but accreditation is removed. It is a UKAS requirement for data not reported as accredited to be considered
indicative only, but this does not mean the data is not valid.
Where possible, and if requested, samples will be re-extracted and a revised report issued with accredited results. Please do not hesitate to contact
the laboratory if further details are required of the circumstances which have led to the removal of accreditation.
Where an MCERTS report has been requested, you will be notified within 48 hours of any samples that have been identified as being outside our
MCERTS scope. As validation has been performed on clay, sand and loam, only samples that are predominantly these matrices, or combinations
of them will be within our MCERTS scope. If samples are not one of a combination of the above matrices they will not be marked as MCERTS
accredited.
Negative Neutralization Potential (NP) values are obtained when the volume of NaOH (0.1N) titrated (pH 8.3) is greater than the volume of HCl (1N)
to reduce the pH of the sample to 2.0 - 2.5. Any negative NP values are corrected to 0.
Where a CEN 10:1 ZERO Headspace VOC test has been carried out, a 10:1 ratio of water to wet (as received) soil has been used.
All samples will be discarded one month after the date of reporting, unless we are instructed to the contrary.
% Asbestos in Asbestos Containing Materials (ACMs) is determined by reference to HSG 264 The Survey Guide - Appendix 2 : ACMs in buildings
listed in order of ease of fibre release.
All analysis is reported on a dry weight basis unless stated otherwise. Results are not surrogate corrected. Samples are dried at 35°C ±5°C unless
otherwise stated. Moisture content for CEN Leachate tests are dried at 105°C ±5°C.
Surrogate compounds are added during the preparation process to monitor recovery of analytes. However low recovery in soils is often due to peat,
clay or other organic rich matrices. For waters this can be due to oxidants, surfactants, organic rich sediments or remediation fluids. Acceptable
limits for most organic methods are 70 - 130% and for VOCs are 50 - 150%. When surrogate recoveries are outside the performance criteria but
the associated AQC passes this is assumed to be due to matrix effect. Results are not surrogate corrected.
A dilution suffix indicates a dilution has been performed and the reported result takes this into account. No further calculation is required.
NOTES TO ACCOMPANY ALL SCHEDULES AND REPORTS
Please note we are only MCERTS accredited (UK soils only) for sand, loam and clay and any other matrix is outside our scope of accreditation.
Where Mineral Oil or Fats, Oils and Grease is quoted, this refers to Total Aliphatics C10-C40.
16/16640
WATERS
Where analytes have been found in the blank, the sample will be treated in accordance with our laboratory procedure for dealing with contaminated
blanks.
It is assumed that you have taken representative samples on site and require analysis on a representative subsample. Stones will generally be
included unless we are requested to remove them.
QF-PM 3.1.9 v33Please include all sections of this report if it is reproduced
All solid results are expressed on a dry weight basis unless stated otherwise. 8 of 10
For
insp
ectio
n pur
pose
s only
.
Conse
nt of
copy
right
owne
r req
uired
for a
ny ot
her u
se.
EPA Export 10-04-2017:02:56:34

JE Job No.:
#
SA
B
DR
M
NA
NAD
ND
NDP
SS
SV
W
+
++
*
AD
CO
LOD/LOR
ME
NFD
BS
LB
N
TB
OC
AA x5 Dilution
Dilution required.
Analysis subcontracted to a Jones Environmental approved laboratory.
Matrix Effect
Blank Sample
Client Sample
Trip Blank Sample
AQC Sample
Suspected carry over
Limit of Detection (Limit of Reporting) in line with ISO 17025 and MCERTS
Samples are dried at 35°C ±5°C
16/16640
AQC failure, accreditation has been removed from this result, if appropriate, see 'Note' on previous page.
Calibrated against a single substance
Not applicable
No Asbestos Detected.
No Determination Possible
Indicates analyte found in associated method blank.
None Detected (usually refers to VOC and/SVOC TICs).
ISO17025 (SANAS) accredited - South Africa.
MCERTS accredited.
Outside Calibration Range
No Fibres Detected
Result outside calibration range, results should be considered as indicative only and are not accredited.
Results expressed on as received basis.
Surrogate recovery outside performance criteria. This may be due to a matrix effect.
ISO17025 (UKAS) accredited - UK.
ABBREVIATIONS and ACRONYMS USED
QF-PM 3.1.9 v33Please include all sections of this report if it is reproduced
All solid results are expressed on a dry weight basis unless stated otherwise. 9 of 10
For
insp
ectio
n pur
pose
s only
.
Conse
nt of
copy
right
owne
r req
uired
for a
ny ot
her u
se.
EPA Export 10-04-2017:02:56:34
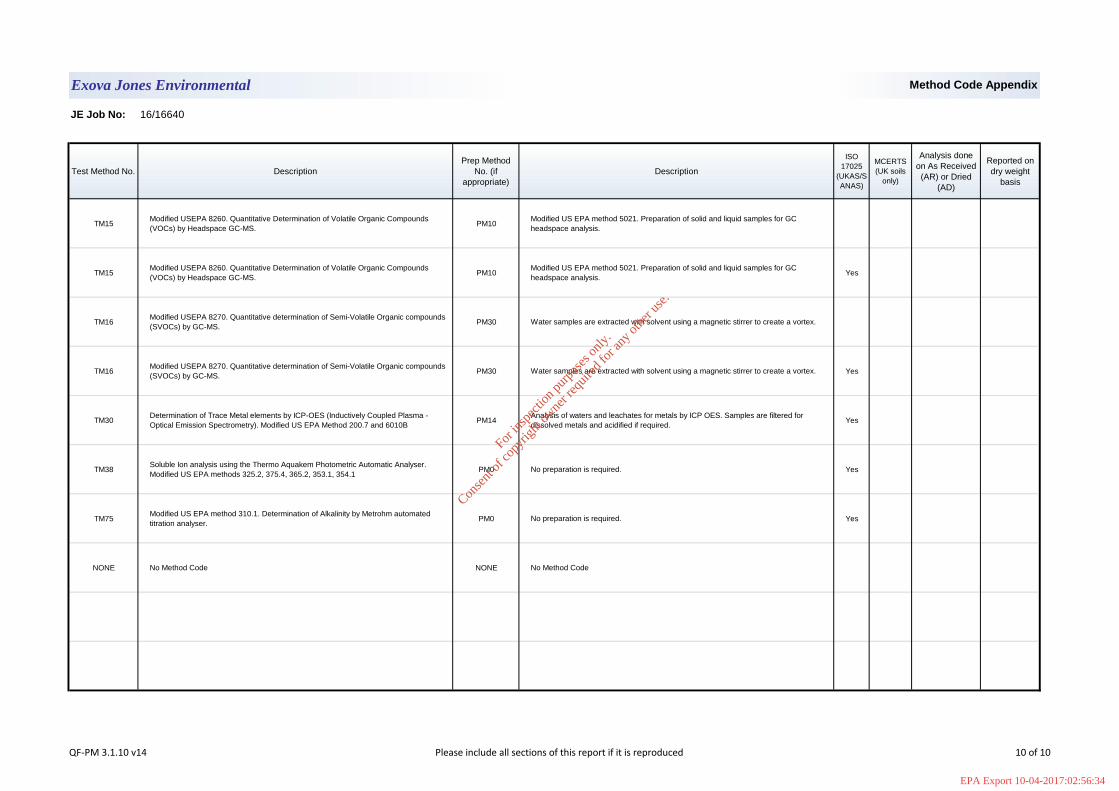
JE Job No: 16/16640
Test Method No. Description
Prep Method
No. (if
appropriate)
Description
ISO
17025
(UKAS/S
ANAS)
MCERTS
(UK soils
only)
Analysis done
on As Received
(AR) or Dried
(AD)
Reported on
dry weight
basis
TM15Modified USEPA 8260. Quantitative Determination of Volatile Organic Compounds
(VOCs) by Headspace GC-MS.PM10
Modified US EPA method 5021. Preparation of solid and liquid samples for GC
headspace analysis.
TM15Modified USEPA 8260. Quantitative Determination of Volatile Organic Compounds
(VOCs) by Headspace GC-MS.PM10
Modified US EPA method 5021. Preparation of solid and liquid samples for GC
headspace analysis. Yes
TM16Modified USEPA 8270. Quantitative determination of Semi-Volatile Organic compounds
(SVOCs) by GC-MS. PM30 Water samples are extracted with solvent using a magnetic stirrer to create a vortex.
TM16Modified USEPA 8270. Quantitative determination of Semi-Volatile Organic compounds
(SVOCs) by GC-MS. PM30 Water samples are extracted with solvent using a magnetic stirrer to create a vortex. Yes
TM30Determination of Trace Metal elements by ICP-OES (Inductively Coupled Plasma -
Optical Emission Spectrometry). Modified US EPA Method 200.7 and 6010BPM14
Analysis of waters and leachates for metals by ICP OES. Samples are filtered for
dissolved metals and acidified if required.Yes
TM38Soluble Ion analysis using the Thermo Aquakem Photometric Automatic Analyser.
Modified US EPA methods 325.2, 375.4, 365.2, 353.1, 354.1PM0 No preparation is required. Yes
TM75Modified US EPA method 310.1. Determination of Alkalinity by Metrohm automated
titration analyser.PM0 No preparation is required. Yes
NONE No Method Code NONE No Method Code
Exova Jones Environmental Method Code Appendix
QF-PM 3.1.10 v14 Please include all sections of this report if it is reproduced 10 of 10
For
insp
ectio
n pur
pose
s only
.
Conse
nt of
copy
right
owne
r req
uired
for a
ny ot
her u
se.
EPA Export 10-04-2017:02:56:34

Pfizer Little Island Pfizer Ireland Pharmaceuticals LimitedProject Reference: CKRP0002
Prepared for: Pfizer Ireland Pharmaceuticals LimitedCkrp0002 Pfizer Little Island Round 2 2016 Final
AECOM
AECOM Ireland LimitedDouglas Business CentreCarrigaline RoadDouglasCork
T: +353 21 4365006aecom.com
For
insp
ectio
n pur
pose
s only
.
Conse
nt of
copy
right
owne
r req
uired
for a
ny ot
her u
se.
EPA Export 10-04-2017:02:56:34