petsky prunier - march 2017 m&a and investment...
TRANSCRIPT

March 2017 M&A and Investment Summary

2 | M&A and Investment Summary March 2017
Table of Contents
Overview of Monthly M&A and Investment Activity 31
Monthly M&A and Investment Activity by Industry Segment 82
Additional Monthly M&A and Investment Activity Data 403
About Petsky Prunier 524
Securities offered through Petsky Prunier Securities, LLC, member of FINRA.
This M&A and Investment Summary has been prepared by and is being distributed in the United States by Petsky Prunier, a broker dealer registered with the U.S. SEC and a member ofFINRA.

3 | M&A and Investment Summary March 2017
M&A and Investment Summary for All Segments
Transaction Distribution
A total of 545 deals were announced in March 2017, of which 315 were worth $19.9 billion in aggregate reported value
Software was the most active segment with 180 deals announced — 120 of these transactions reported $8.4 billion in value
Digital Media/Commerce was also active with 126 transactions announced, of which 90 were worth a reported $5.5 billion in value
Strategic buyers announced 242 deals (44 reported $11.0 billion in value)
VC/Growth Capital investors announced 290 transactions (267 reported $7.8 billion in value)
Private Equity investors announced 13 deals during the month (four reported $1.0 billion in value)
* AT&T’s $108 billion acquisition of Time Warner has been excluded to limit comparative distortions
# % $MM % # $MM # $MM # $MM
Software 180 33% $8,400.0 42% 60 $6,181.3 7 $215.6 113 $2,003.1
Digital Media/Commerce 126 23% 5,451.1 27% 37 853.2 2 ‐ 87 4,597.9
Marketing Technology 85 16% 3,120.9 16% 35 2,504.4 0 ‐ 50 616.5
Business Services 62 11% 1,639.8 8% 42 559.7 3 700.0 17 380.1
Agency & Marketing Services 32 6% 18.8 0% 30 16.0 0 ‐ 2 2.8
Digital Advertising 25 5% 493.6 2% 11 349.2 0 ‐ 14 144.4
Traditional Media 22 4% 408.9 2% 19 274.4 1 122.5 2 12.0
Information 13 2% 332.6 2% 8 274.8 0 ‐ 5 57.8
Total 545 100% 19,865.7 100% 242 11,013.0 13 1,038.1 290 7,814.6
March 2017
BUYER/INVESTOR BREAKDOWN
Transactions Reported Value Strategic Buyout Venture/Growth Capital

4 | M&A and Investment Summary March 2017
$25.2
$73.1
$29.3$24.6 $20.8 $19.9
$44.7
$21.3$22.1
$42.6
$21.3
$33.7$25.4
545433 404 432 491 427 473 463 450 419 415 457 449 $-
$100.0
$200.0
$300.0
$400.0
$500.0
$‐ $10.0 $20.0 $30.0 $40.0 $50.0 $60.0 $70.0 $80.0 $90.0
$100.0 $110.0 $120.0
Mar‐16 Apr‐16 May‐16 Jun‐16 Jul‐16 Aug‐16 Sep‐16 Oct‐16 Nov‐16 Dec‐16 Jan‐17 Feb‐17 Mar‐17
Transaction Distribution
Reported transaction value in March remained flat from February 2017 and was down seven percent from March 2016
Strategic activity accounted for 44 percent of reported deal activity during the month and included significant transactions:
• The pending take‐private of payments and lending software developer DH Corporation by Vista Equity Partners‐backed Misys for $3.4 billion
• The pending merger between GTCR‐backed PR software provider Cision and public investment vehicle Capital Acquisition Corp. III in a transaction that will result in a public company with an enterprise value of $2.4 billion
• Hewlett Packard Enterprise’s $1.2 billion acquisition of data storage solutions company Nimble
• Application security testing solutions provider Veracode’s sale to CA Technologies for $614 million
• KeyW Corporation’s acquisition of security systems and technology company Sotera Defense Solutions for a reported $235 million
Supercell /Tencent
LinkedIn / Microsoft
IMS Health
HP IT / CSC
MultiPlan
NetSuite
HP Software
*Note, Microsoft’s $26.2 billion acquisition of LinkedIn, Tencent’s $10.2 billion acquisition of Supercell, Oracle’s $9.3 billion acquisition of NetSuite, Micro Focus’ $8.8 billion acquisition of Hewlett PackardEnterprise’s Software business, Computer Science Corporation’s $8.5 billion acquisition of Hewlett Packard Enterprises’ IT Services Division, Hellman & Friedman and Leonard Green & Partners’ $7.5 billionacquisition of MultiPlan, and Blackstone’s $6.1 billion acquisition of TeamHealth have been excluded to limit comparative distortions.
M&A and Investment Summary for All Segments
TeamHealth

5 | M&A and Investment Summary March 2017
Selected Transactions with Valuation Information Disclosed($ in Millions)
Target Subsegment Buyer/Investor Ent. Value Rev EBITDA EV/REV EV/EBITDA
Agency & Marketing ServicesGlobal Group Dialog Solutions AG Database/Analytics Bisnode AB 6.1$ 11.1$ ‐$ 0.5x NA
Business ServicesThe HCI Group IT Consulting/Systems Integration Tech Mahindra Limited 110.0 114.0 ‐ 1.0x NA Pubridge Printing Services Media Do Co., Ltd. 99.3 130.3 ‐ 0.8x NA Keystone Logic IT Consulting/Systems Integration Zensar Technologies Ltd. 20.4 12.5 ‐ 1.6x NA
Digital AdvertisingTeads, Inc. Digital Video Altice N.V. 308.0 202.0 ‐ 1.5x NA Kleding BV Vertical Search The Mitula Group Limited 11.2 3.2 0.4 3.5x 26.7xNA
Digital Media/Commercei f(we) Social Media/Apps MeetMe, Inc. 60.0 44.0 ‐ 1.4x NA Daisuki Niche Content BANDAI NAMCO Holdings, Inc. 29.1 2.0 ‐ 14.5x NA Hermo Creative (M) Sdn Bhd eCommerce istyle, Inc. 22.0 9.5 ‐ 2.3x NA
InformationIncisive Media Limited, Insight Division Credit/Risk Management Information Infopro Digital SAS 149.8 50.0 ‐ 3.0x NA RISI, Inc. Product/Price Information Euromoney Institutional Investor plc 125.0 29.6 7.7 4.2x 16.2xNA
Marketing Technology Cision, Inc. Media Management System Capitol Acquisition Corp. III 2,400.0 ‐ 228.6 NA 10.5xIngresso Group Limited Commerce Management accesso Techology Group, plc 36.6 53.2 ‐ 0.7x NA
SoftwareDH Corporation Financial Software Misys plc 3,458.7 1,250.6 236.3 2.8x 14.6xNimble Storage, Inc. Data Management Software Hewlett Packard Enterprise Company 1,200.0 402.0 ‐ 3.0x NA Tagetik Software srl ERP Software Wolters Kluwer NV 319.5 60.1 ‐ 5.3x NA BI‐SAM Technologies S.A. Financial Software FactSet Research Systems, Inc. 205.2 28.0 ‐ 7.3x NA LightCyber, Inc. Security Software Palo Alto Networks 105.0 10.0 ‐ 10.5x NA PleaseTech Ltd. Collaboration Software Ideagen Plc 15.0 4.8 1.6 3.1x 9.6xCyberGhost S.R.L. Security Software Crossrider Plc 11.5 ‐ 1.0 NA 11.5xOntology‐Partners Limited Geo‐Demo Software EXFO, Inc. 7.6 4.0 ‐ 1.9x NA
Traditional MediaShow Management, Inc. B‐to‐B Media Informa PLC 133.0 ‐ 11.6 NA 11.5xMTG Broadcast Television Providence Equity Partners, Inc. 122.5 111.1 9.9 1.1x 12.4xRegent Publishing Services Consumer Book Publishing 1010 Printing Group Limited 9.3 ‐ 1.6 NA 5.8x
Selected Transactions With Multiples Information

6 | M&A and Investment Summary March 2017
Securities in Registration($ in Millions)
Aggregate Date Company Name Country Segment Offering Value Rev EBITDA
Mar‐17 Netshoes.com Brazil Digital Media/Commerce 157.0$ 493.6$ (4.0)$
Mar‐17 Yext, Inc. United States Digital Advertising 105.0 124.3 (39.0)
Mar‐17 Okta, Inc. Okta, Inc. Software 154.0 160.3 (80.4)
Mar‐17 Veritone, Inc. United States Software 15.0 8.9 (23.3)
Feb‐17 ForeScout Technologies, Inc. United States Software ‐ NA NA
Jan‐17 EVRY AS Norway Business Services 151.1 12,859.5 NA
Dec‐16 AppNexus, Inc United States Marketing Technology NA NA NA
Oct‐16 Carbon Black, Inc. United States Software NA NA NA
Sep‐16 Tintri, Inc. United States Software 100.0 NA NA
LTM

7 | M&A and Investment Summary March 2017
LTM IPO Performance
Initial Offering Final Price Stock Price at Close Stock Price on % Change from
Date Ticker Company Name Country Price Range Per Share on 1st Trading Day Mar 31, 2017 1st Trading Day
Mar‐17 NYSE:AYX Alteryx, Inc. United States $12.00‐$14.00 14.00 $15.50 up 10.7% 15.63 0.8%
Mar‐17 NYSE:MULE MuleSoft, Inc. United States 14.00‐16.00 17.00 24.75 up 46% 24.33 (1.7%)
Mar‐17 NasdaqGS:PSDO Pres idio, Inc. United States 14.00‐16.00 14.00 14.25 up 1.8% 15.49 8.7%
Mar‐17 NYSE:SNAP Snap Inc. United States 14.00‐16.00 17.00 24.48 up 44% 22.53 (8.0%)
Dec‐16 NasdaqGS:TRVG trivago N.V. Germany 13.00‐15.00 11.00 11.85 up 7.7% 13.03 10.0%
Oct‐16 NasdaqGS:BL BlackLine, Inc. United States 15.00‐17.00 17.00 23.70 up 39% 29.76 25.6%
Oct‐16 NasdaqGS:COUP Coupa Software Incorporated United States 16.00‐18.00 18.00 32.78 up 82% 25.40 (22.5%)
Sep‐16 NasdaqGS:NTNX Nutanix, Inc. United States 13.00‐15.00 18.00 37.00 up 131% 18.77 (49.3%)
Sep‐16 NasdaqGM:TTD The Trade Desk, Inc. United States 16.00‐18.00 18.00 30.10 up 67% 37.25 23.8%
Sep‐16 NasdaqGM:APTI Apptio, Inc. United States 13.00‐15.00 16.00 22.55 up 40% 11.73 (48.0%)
Sep‐16 NasdaqGS:GSUM Gridsum Holding Inc. China 10.50‐12.50 13.00 15.25 up 17% 13.29 (12.9%)
Sep‐16 NasdaqGM:EVBG Everbridge, Inc. United States 11.00‐13.00 12.00 14.70 up 22% 20.53 39.7%
Jul ‐16 Nasdaq:TLND Talend S.A. France 15.00‐17.00 18.00 25.50 up 42% 29.78 16.8%
Jul ‐16 NYSE:LN LINE Corporation Japan 31.00‐33.00 33.00 41.58 up 27% 38.46 (7.5%)
Jun‐16 NYSE:TWLO Twi l io Inc. United States 12.00‐14.00 15.00 28.79 up 92% 28.87 0.3%
Jun‐16 NasdaqGS:NH NantHealth, Inc. United States 13.00‐15.00 14.00 19.47 up 39% 4.96 (74.5%)
May‐16 NYSE:COTV Cotivi ti Holdings , Inc. United States 17.00‐19.00 19.00 18.14 down 4.6% 41.63 129.5%
Apr‐16 NasdaqGS:SCWX SecureWorks Corp. United States 15.50‐17.50 14.00 13.88 down 1% 9.50 (31.6%)

8 | M&A and Investment Summary March 2017
Digital Media/Commerce
Of the total $5.5 billion in value reported in the Digital Media/Commerce segment, $4.6 billion in venture/growth capital investments were announced, while more than $850 million in strategic acquisitions were made
eCommerce was the most active subsegment across all segments with 49 transactions announced, of which 33 were reported for $3.7 billion. Select transactions from the subsegment include:
• The acquisition of UAE‐based eCommerce player Souq.com by Amazon for a reported $650 million
Select Digital Media/Commerce transactions include:
• The $1 billion raised by Airbnb at a reported valuation of $31 billion from Andreessen Horowitz, CapitalG, Sequoia Capital, Technology Crossover Ventures, The Founders Fund, and TPG Capital
• Daily Fantasy sports company DraftKings’ $100 million round of funding from Elbridge Industries
• Walmart’s acquisitions of women’s fashion e‐tailer Modcloth for a reported $80 million
• MeetMe’s $60 million acquisition of social media platforms company Ifwe from Mayfield Fund and Transmedia Capital
* Microsoft’s $26.2 billion acquisition of LinkedIn and Tencent’s $10.2 billion acquisition of Supercell have been excluded to limit comparative distortions
# % $MM % # $MM # $MM # $MM
eCommerce 49 39% $3,715.5 68% 12 $734.5 0 ‐ 37 $2,981.0
Digital Marketplace 21 17% 734.2 13% 3 ‐ 2 ‐ 16 734.2
Mobile Content/Apps 19 15% 121.6 2% 8 ‐ 0 ‐ 11 121.6
Niche Content 15 12% 126.7 2% 6 54.1 0 ‐ 9 72.6
Social Media/Apps 12 10% 542.0 10% 4 60.0 0 ‐ 8 482.0
Gaming 10 8% 211.1 4% 4 4.6 0 ‐ 6 206.5
Total 126 100% 5,451.1 100% 37 853.2 2 0.0 87 4,597.9
BUYER/INVESTOR BREAKDOWN
Transactions Reported Value Strategic Buyout Venture/Growth Capital
DIGITAL MEDIA/COMMERCE TRANSACTIONS BY SEGMENT

9 | M&A and Investment Summary March 2017
Digital MediaPublic Company Valuation (1/2)
*Note: Alphabet Inc. pricing represents (Nasdaq:GOOGL)*Yahoo! multiples based on Petsky Prunier estimates. Yahoo’s ownership interest in Alibaba and Yahoo! Japan equals approximately 90% of the enterprise value of Yahoo!, enterprise value reflects Adjusted Enterprise Value
($ in Millions, except stock price data)
Stock Price Chg % From Equity Ent. LTM LTM Margin LTM LTM Multiples Company Name 03/31/17 52WK High Value Value Revenue EBITDA EBITDA Rev Growth EV/Rev EV/EBITDAAlphabet Inc. 847.80 ‐3% $ 579,857.6 $ 497,459.6 $ 90,272.0 $ 29,860.0 33.1% 20.4% 5.5x 16.7xApple Inc. 143.66 ‐1% 753,717.9 780,959.9 218,118.0 69,750.0 32.0% ‐7.2% 3.6x 11.2xBlucora, Inc. 17.30 ‐4% 733.8 1,105.6 455.9 $78.3 17.2% NA 2.4x 14.1xFacebook, Inc. 142.05 ‐1% 410,521.8 381,072.8 27,638.0 14,835.0 53.7% 54.2% 13.8x 25.7xFitbit, Inc. 5.92 ‐69% 1,344.5 638.5 2,169.5 (54.0) NM 16.8% 0.3x NM Glu Mobile Inc. 2.27 ‐27% 305.8 203.7 200.6 (63.0) NM ‐19.7% 1.0x NM GoPro, Inc. 8.70 ‐51% 1,236.4 1,018.4 1,185.5 (287.2) NM ‐26.8% 0.9x NM IAC/InterActiveCorp 73.72 ‐5% 5,731.0 6,089.2 3,139.9 419.6 13.4% ‐2.8% 1.9x 14.5xLeaf Group Ltd. 7.50 ‐10% 151.0 100.1 113.5 (23.7) NM ‐9.9% 0.9x NM MeetMe, Inc. 5.89 ‐27% 394.3 372.7 76.1 25.7 33.8% 33.8% 4.9x 14.5xNetflix, Inc. 147.81 0% 63,618.9 65,249.4 8,830.7 437.3 5.0% 30.3% 7.4x NM Pandora Media, Inc. 11.81 ‐21% 2,778.7 2,883.9 1,384.8 (238.7) NM 19.0% 2.1x NM RealNetworks, Inc. 4.84 ‐11% 179.2 102.1 120.5 (26.4) NM ‐3.9% 0.8x NM Snap Inc. 22.53 ‐23% 26,072.5 25,100.3 404.5 (491.3) NM 589.5% 62.1x NM TheStreet, Inc. 0.76 ‐41% 27.1 5.7 63.5 (2.8) NM ‐6.1% 0.1x NM Twitter, Inc. 14.95 ‐43% 10,790.81 8,702.88 2,529.62 61.66 2.4% 14.0% 3.4x NM WebMD Health Corp. 52.68 ‐22% 1,941.4 1,995.2 705.0 188.3 26.7% 10.8% 2.8x 10.6xXO Group Inc. 17.21 ‐18% 435.8 330.1 152.1 20.3 13.3% 7.4% 2.2x 16.3xYahoo! Inc. 46.41 ‐2% 44,390.6 4,148.6 5,169.1 829.7 16.1% 4.0% 0.8x 5.0xZynga Inc. 2.85 ‐7% 2,474.4 1,621.9 741.4 (92.5) NM ‐3.0% 2.2x NM
Average 2.2x 12.9x
*Calculation is market cap weighted and excludes revenue multiples that are 2.0 standard deviations above the mean (33.1x) and EBITDA multiples that are 1.0 standard deviations above the mean (19.9x)
US‐Based Digital Media and Internet

10 | M&A and Investment Summary March 2017
Digital Media Public Company Valuation (2/2)
($ in Millions, except stock price data)
Stock Price Chg % From Equity Ent. LTM LTM Margin LTM LTM Multiples Company Name Headquarters 03/31/17 52WK High Value Value Revenue EBITDA EBITDA Rev Growth EV/Rev EV/EBITDABaidu, Inc. China 184.16 ‐8% $64,237.5 $59,206.8 $10,651.2 $2,800.0 26.3% 15.1% 5.6x 21.1xCyberAgent, Inc. Japan 27.06 ‐8% 3,402.5 3,250.3 2,768.4 321.6 11.6% 22.0% 1.2x 10.1xDeNA Co., Ltd. Japan 21.99 ‐37% 3,189.9 2,523.1 1,231.0 310.6 25.2% ‐0.8% 2.0x 8.1xG5 Entertainment AB (publ) Sweden 20.27 ‐11% 181.4 175.3 50.6 5.5 10.8% 18.7% 3.5x 32.2xGree, Inc. Japan 6.13 0% 1,439.7 712.9 537.0 96.2 17.9% ‐22.0% 1.3x 7.4xHolidayCheck Group AG * Germany 2.75 ‐18% 161.4 125.6 125.5 3.0 2.4% 1.0% 1.0x 41.4xInternational Game Technology PLC United Kingdom 27.41 ‐15% 5,468.1 13,405.1 5,197.6 1,605.5 30.9% 23.3% 2.6x 8.3xKongZhong Corporation China 7.12 ‐6% 334.4 255.2 181.2 17.9 9.9% ‐8.6% 1.4x 14.3xMixi, Inc. Japan 41.70 ‐8% 3,414.4 2,431.3 1,725.9 751.8 43.6% 3.4% 1.4x 3.2xMeitu, Inc. * China 1.27 ‐7% 5,370.4 6,418.3 172.5 (106.9) NM 0.0% 37.2x NM NCsoft Corporation South Korea 259.18 ‐9% 5,505.2 4,796.4 817.0 299.2 36.6% 17.3% 5.9x 16.0xNaver Corporation South Korea 689.41 ‐13% 19,860.2 17,868.0 3,341.3 1,039.0 31.1% 23.7% 5.3x 17.2xNetEase, Inc. China 292.37 ‐2% 39,081.6 34,430.4 5,498.6 1,866.0 33.9% 67.4% 6.3x 18.5xNEXON Co., Ltd. Japan 16.95 ‐5% 7,373.5 4,555.6 1,568.5 402.8 25.7% ‐3.8% 2.9x 11.3xPacific Online Limited China 0.25 ‐22% 274.5 233.3 162.0 33.2 20.5% 0.1% 1.4x 7.0xPhoenix New Media Limited China 4.00 ‐14% 271.6 186.9 219.5 14.9 6.8% ‐9.4% 0.9x 12.6xRenren Inc. * China 8.40 ‐53% 566.1 589.9 46.5 (84.7) NM 211.7% 12.7x NM Weibo Corporation * China 57.94 3% 11,930.4 11,455.4 592.1 122.5 20.7% 36.4% 19.3x 93.5xWeMade Entertainment Co., Ltd. South Korea 25.83 ‐18% 428.9 406.6 107.2 13.2 12.3% ‐11.3% 3.8x 30.8xYandex N.V. Netherlands 24.22 ‐3% 7,955.8 7,256.9 1,240.4 366.8 29.6% 27.0% 5.9x 19.8xYY Inc. China 46.86 ‐27% 2,660.2 2,404.6 1,142.5 286.4 25.1% 47.4% 2.1x 8.4x
Average 2.2x 14.6x
*Calculation is market cap weighted and excludes revenue multiples that are 2.0 standard deviations above the mean (22.7x) and EBITDA multiples that are 1.0 standard deviations above the mean (40.4x)
Internationally‐based Digital Media and Internet

11 | M&A and Investment Summary March 2017
eCommercePublic Company Valuation (1/2)
($ in Millions, except stock price data)
Stock Price Chg % From Equity Ent. LTM LTM Margin LTM LTM Multiples Company Name 03/31/17 52WK High Value Value Revenue EBITDA EBITDA Rev Growth EV/Rev EV/EBITDA1‐800‐FLOWERS.COM, Inc. 10.30 ‐10% $659.0 $656.0 $1,189.0 $78.1 6.6% 2.1% 0.6x 8.4xAlphabet Inc. 841.63 ‐3% 573,232.0 490,834.0 90,272.0 29,860.0 33.1% 20.4% 5.4x 16.4xAmazon.com, Inc. 837.07 ‐1% 399,167.5 393,599.5 135,987.0 11,668.0 8.6% 27.1% 2.9x 33.7xApple Inc. 134.86 1% 699,311.3 726,553.3 218,118.0 69,750.0 32.0% ‐7.2% 3.3x 10.4xBlucora, Inc. 14.85 ‐6% 621.6 1,011.5 372.0 67.6 18.2% NA 2.7x 15.0xBlue Nile, Inc. 40.71 ‐2% 477.7 437.6 471.9 16.4 3.5% ‐3.2% 0.9x 26.7xCafePress Inc. 3.40 ‐15% 56.0 20.5 96.8 (0.9) NM ‐16.0% 0.2x NM CDW Corporation 59.38 0% 9,511.6 13,062.7 13,981.9 1,073.7 7.7% 7.6% 0.9x 12.2xChegg, Inc. 8.03 ‐6% 676.0 598.6 254.1 (17.4) NM ‐15.7% 2.4x NM Copart, Inc. 58.55 0% 6,726.2 7,302.0 1,325.6 468.3 35.3% 15.8% 5.5x 15.6xeBay Inc. 33.81 ‐1% 36,731.2 38,542.2 8,979.0 3,007.0 33.5% 4.5% 4.3x 12.8xEtsy, Inc. 12.87 ‐20% 1,474.7 1,216.2 342.7 37.0 10.8% 36.8% 3.5x 32.9xEVINE Live Inc. 1.43 ‐40% 91.1 137.6 687.2 13.1 1.9% 0.6% 0.2x 10.5xExpedia, Inc. 119.35 ‐11% 17,902.1 20,753.1 8,773.6 1,073.2 12.2% 31.5% 2.4x 19.3xFTD Companies, Inc. 24.50 ‐15% 667.7 932.5 1,140.0 101.7 8.9% 5.6% 0.8x 9.2xGrubHub Inc. 37.11 ‐17% 3,141.3 2,817.6 493.3 119.0 24.1% 36.3% 5.7x 23.7xHSN, Inc. 35.73 ‐36% 1,863.2 2,422.6 3,592.3 290.0 8.1% ‐3.2% 0.7x 8.4xIAC/InterActiveCorp 75.92 ‐2% 5,942.5 6,300.7 3,139.9 393.8 12.5% ‐2.8% 2.0x 16.0xLiberty Ventures 43.61 ‐3% 3,746.7 5,283.7 535.0 (22.0) NM ‐53.4% 9.9x NM Liquidity Services, Inc. 8.60 ‐25% 273.1 146.2 321.4 (10.6) NM ‐4.9% 0.5x NM Match Group, Inc. 17.17 ‐13% 4,472.3 5,401.2 1,222.5 360.2 29.5% 19.8% 4.4x 15.0xOverstock.com, Inc. 18.30 ‐11% 457.8 331.6 1,800.0 19.7 1.1% 8.6% 0.2x 16.8xPetMed Express, Inc. 21.20 ‐11% 428.6 380.7 241.5 35.5 14.7% 5.3% 1.6x 10.7xThe Priceline Group Inc. 1,633.13 ‐1% 81,230.8 84,197.6 10,394.6 4,009.5 38.6% 14.7% 8.1x 21.0xQVC Group $19.15 ‐30% 8,874.0 15,100.0 10,320.0 1,775.0 17.2% 18.3% 1.5x 8.5xShutterfly, Inc. 44.50 ‐18% 1,485.4 1,585.7 1,134.2 162.8 14.3% 7.1% 1.4x 9.7xShutterstock, Inc. 53.23 ‐18% 1,877.3 1,586.9 480.1 65.1 13.6% 19.9% 3.3x 24.4xSpark Networks, Inc. 0.90 ‐74% 28.4 17.0 38.1 (2.2) NM ‐26.4% 0.4x NM Stamps.com Inc. 127.25 ‐1% 2,160.54 2,241.17 328.29 120.63 36.7% 76.6% 6.8x 18.6xU.S. Auto Parts Network, Inc. 3.25 ‐28% 117.2 121.1 300.0 9.2 3.1% 2.0% 0.4x 13.1xWayfair Inc. 41.62 ‐16% 3,585.1 3,321.2 3,135.6 (136.1) NM 63.4% 1.1x NM
Average 1.9x 12.2x
*Calculation is market cap weighted and excludes revenue multiples that are 2.0 standard deviations above the mean (7.7x) and EBITDA multiples that are 1.0 standard deviations above the mean (23.6x)
US‐based eCommerce

12 | M&A and Investment Summary March 2017
eCommercePublic Company Valuation (2/2)
($ in Millions, except stock price data)
Stock Price Chg % From Equity Ent. LTM LTM Margin LTM LTM Multiples Company Name Headquarters 03/31/17 52WK High Value Value Revenue EBITDA EBITDA Rev Growth EV/Rev EV/EBITDA58.com Inc. * China 33.71 ‐45% $ 4,734.7 $ 4,721.2 $ 1,090.8 $ (13.3) NM 102.1% 4.3x NM Alibaba Group Holding Limited * China 101.37 ‐8% 257,750.0 256,505.1 20,721.5 7,639.5 36.9% 52.4% 12.4x 33.6xCnova N.V. * Netherlands 5.35 ‐3% 2,413.9 2,564.0 2,493.6 (42.3) NM ‐37.5% 1.0x NM JD.com, Inc. * China 29.41 ‐2% 41,933.3 41,008.6 35,167.1 (39.2) NM 45.3% 1.2x NM Jumei International Holding Limited China 4.15 ‐38% 614.4 171.0 1,113.4 20.2 1.8% 26.2% 0.2x 8.5xLightInTheBox Holding Co., Ltd. * China 2.98 ‐17% 205.4 117.4 284.8 (9.5) NM ‐18.3% 0.4x NM Mercadolibre, Inc. * Argentina 196.40 0% 8,616.0 8,449.9 768.9 190.7 24.8% 21.6% 11.0x 44.3xPChome Online Inc. Taiwan 7.56 ‐41% 834.2 607.7 800.2 39.8 5.0% 12.9% 0.8x 15.3xRakuten, Inc. Japan 9.69 ‐24% 13,824.9 15,250.4 6,697.4 1,044.0 15.6% 9.6% 2.3x 14.6xTravelport Worldwide Limited United Kingdom 14.10 ‐7% 1,757.5 4,012.0 2,340.8 414.2 17.7% 7.3% 1.7x 9.7xtrivago N.V. * Germany 13.65 ‐2% 3,114.6 3,112.3 769.1 (31.3) NM 0.0% 4.0x NM Vipshop Holdings Limited China 12.44 ‐29% 7,152.5 7,049.8 7,723.8 495.7 6.4% 48.4% 0.9x 14.2x
Average 1.9x 10.4x
*Calculation is market cap weighted and excludes revenue multiples that are 2.0 standard deviations above the mean (11.6x) and EBITDA multiples that are 1.0 standard deviations above the mean (33.6x)
Internationally‐based eCommerce

13 | M&A and Investment Summary March 2017
Digital Advertising
There was a total of 25 transactions announced in the Digital Advertising segment, of which 15 were worth nearly $500 million inreported value
Vertical Search was the most active subsegment with eight transactions announced in March
Select Transactions:
• Netherlands‐based telecom company Altice’s acquisition of video ad company Teads in a transaction valued at a reported $308 million
• The $30 million round of funding raised by email marketing services company Zenreach from Maverick Ventures, Founders Fund, 8 VC, Bain Capital Ventures, and First Round Capital
• Offline retailer mobile advertising platform Databerries’ $16 million round of funding from Index Ventures, ISAI, and Mosaic Ventures
• Entravision Communications’ acquisition of mobile, programmatic, and performance digital marketing solutions provider Headway
# % $MM % # $MM # $MM # $MM
Vertical Search 8 32% $72.2 15% 3 $11.2 0 ‐ 5 $61.0
Digital Promotion/Coupon 5 20% 14.5 3% 2 ‐ 0 ‐ 3 14.5
Mobile Marketing 4 16% 55.0 11% 2 30.0 0 ‐ 2 25.0
Comparison Shopping 3 12% 4.6 1% 1 ‐ 0 ‐ 2 4.6
Digital Video 2 8% 308.0 62% 2 308.0 0 ‐ 0 ‐
Email Services 1 4% 30.0 6% 0 ‐ 0 ‐ 1 30.0
Local Search 1 4% ‐ 0% 1 ‐ 0 ‐ 0 ‐
Search Marketing 1 4% 9.3 2% 0 ‐ 0 ‐ 1 9.3
Total 25 100% 493.6 100% 11 349.2 0 0.0 14 144.4
DIGITAL ADVERTISING TRANSACTIONS BY SEGMENT BUYER/INVESTOR BREAKDOWN
Transactions Reported Value Strategic Buyout Venture/Growth Capital

14 | M&A and Investment Summary March 2017
Digital AdvertisingPublic Company Valuation (1/3)($ in Millions, except stock price data)
US‐based Digital Advertising
Stock Price Chg % From Equity Ent. LTM LTM Margin LTM LTM Multiples Company Name 03/31/17 52WK High Value Value Revenue EBITDA EBITDA Rev Growth EV/Rev EV/EBITDAAlliance Data Systems Corporation $249.00 ‐1% $ 13,925.4 $ 33,014.9 $ 7,138.1 $ 1,462.4 20.5% 10.8% 4.6x 22.6xAlphabet Inc. 847.80 ‐3% 579,857.6 497,459.6 90,272.0 29,860.0 33.1% 20.4% 5.5x 16.7xAngie's List, Inc. $5.70 ‐47% 338.7 357.4 323.3 4.8 1.5% ‐6.0% 1.1x 74.4xAutobytel Inc. 12.53 ‐34% 138.1 122.4 156.7 14.1 9.0% 17.6% 0.8x 8.7xBankrate, Inc. 9.65 ‐19% 867.7 986.8 434.2 94.0 21.6% 16.7% 2.3x 10.5xBlucora, Inc. 17.30 ‐4% 733.8 1,105.6 455.9 78.3 17.2% NA 2.4x 14.1xCare.com, Inc. 12.51 ‐4% 364.7 336.3 161.8 6.2 3.8% 16.6% 2.1x 54.3xCogint, Inc. 4.65 ‐25% 250.1 290.1 186.8 (16.9) NM 1225.9% 1.6x NM DHI Group, Inc. 3.95 ‐53% 199.1 260.9 227.0 47.1 20.7% ‐12.6% 1.1x 5.5xFacebook, Inc. 142.05 ‐1% 410,521.8 381,072.8 27,638.0 14,835.0 53.7% 54.2% 13.8x 25.7xGroupon, Inc. * 3.93 ‐34% 2,208.9 1,545.3 3,143.4 9.7 0.3% 0.8% 0.5x 160.1xIAC/InterActiveCorp 73.72 ‐5% 5,731.0 6,089.2 3,139.9 419.6 13.4% ‐2.8% 1.9x 14.5xInuvo, Inc. 1.29 ‐44% 36.7 32.8 71.5 1.2 1.7% 1.6% 0.5x 27.0xLendingTree, Inc. 125.35 ‐4% 1,484.1 1,393.0 384.4 55.2 14.4% 51.2% 3.6x 25.2xMaxPoint Interactive, Inc. 6.41 ‐46% 42.5 45.8 149.1 (12.0) NM 6.4% 0.3x NM Perion Network Ltd. 1.78 ‐25% 137.5 182.8 312.8 28.5 9.1% 41.6% 0.6x 6.4xQuinStreet, Inc. 3.90 ‐10% 177.1 139.6 299.4 (5.7) NM 5.6% 0.5x NM Quotient Technology Inc. 9.55 ‐33% 851.3 675.9 275.2 (6.5) NM 16.0% 2.5x NM RetailMeNot, Inc. 8.10 ‐37% 390.8 235.1 280.4 31.1 11.1% 12.6% 0.8x 7.6xRhythmOne plc 0.54 ‐9% 264.6 225.4 156.1 (20.7) NM ‐22.1% 1.4x NM Rocket Fuel Inc. 5.36 ‐2% 247.9 250.1 456.3 (11.4) NM ‐1.2% 0.5x NM Snap Inc. * 22.53 ‐23% 26,072.5 25,100.3 404.5 (491.3) NM 589.5% 62.1x NM The Rubicon Project, Inc. 5.89 ‐71% 284.8 94.9 278.2 26.9 9.7% 12.0% 0.3x 3.5xTiVo Corporation 18.75 ‐20% 2,262.84 2,947.17 649.09 212.03 32.7% 23.3% 4.5x 13.9xTravelzoo Inc. 9.65 ‐27% 129.4 102.4 128.6 13.1 10.2% ‐9.3% 0.8x 7.8xThe Trade Desk, Inc. 37.25 ‐19% 1,459.4 1,351.9 202.9 59.5 29.3% 78.3% 6.7x 22.7xTremor Video, Inc. 2.00 ‐28% 100.1 58.1 166.8 (10.1) NM ‐4.1% 0.3x NM TripAdvisor, Inc. 43.16 ‐40% 6,221.9 5,746.9 1,480.0 215.0 14.5% ‐0.8% 3.9x 26.7xTrueCar, Inc. 15.47 ‐3% 1,340.8 1,261.9 277.5 (25.5) NM 6.8% 4.5x NM

15 | M&A and Investment Summary March 2017
Digital AdvertisingPublic Company Valuation (2/3)
*Yahoo! multiples based on Petsky Prunier estimates. Yahoo’s ownership interest in Alibaba and Yahoo! Japan equals approximately 90% of the enterprise value of Yahoo!, enterprise value reflects Adjusted Enterprise Value*NOTE: Google Inc. pricing represents (Nasdaq:GOOGL)
($ in Millions, except stock price data)
US‐based Digital Advertising
Stock Price Chg % From Equity Ent. LTM LTM Margin LTM LTM Multiples Company Name 03/31/17 52WK High Value Value Revenue EBITDA EBITDA Rev Growth EV/Rev EV/EBITDATwitter, Inc. * 14.95 ‐43% $ 10,790.8 $ 8,702.9 $ 2,529.6 $ 61.7 2.4% 14.0% 3.4x 141.1xWeb.com Group, Inc. 19.30 ‐14% 881.3 1,525.0 710.5 128.3 18.1% 30.7% 2.1x 11.9xYahoo! Inc. 46.41 ‐2% 44,390.6 4,148.6 5,169.1 829.7 16.1% 4.0% 0.8x 5.0xYelp Inc. * 32.75 ‐25% 2,606.9 2,127.4 713.1 21.5 3.0% 29.7% 3.0x 98.8xYuMe, Inc. 4.09 ‐6% 139.2 78.8 160.4 (0.8) NM ‐7.4% 0.5x NM Zillow Group, Inc. 33.81 ‐15% 6,035.9 5,896.9 846.6 (2.1) NM 31.3% 7.0x NM
Average 2.0x 11.0x
*Calculation i s market cap weighted and excludes revenue multiples that are 2.0 s tandard deviations above the mean (25.7x)and EBITDA multiples that are 1.0 s tandard deviations above the mean (78.0x)

16 | M&A and Investment Summary March 2017
Digital AdvertisingPublic Company Valuation (3/3)
($ in Millions, except stock price data)
Stock Price Chg % From Equity Ent. LTM LTM Margin LTM LTM Multiples Company Name Headquarters 03/31/17 52WK High Value Value Revenue EBITDA EBITDA Rev Growth EV/Rev EV/EBITDACriteo S.A. France 45.86 ‐4% 2,868.0 2,479.9 1,629.3 152.2 9.3% 21.3% 1.5x 16.3xJust Dial Limited India 7.57 ‐44% 526.7 416.6 104.2 25.4 24.3% 17.1% 4.0x 16.4xMakeMyTrip Limited India 33.30 ‐9% 3,068.1 2,935.3 415.6 (86.1) NM 35.5% 7.1x NM Matomy Media Group Ltd. Israel 1.31 ‐24% 125.8 150.7 270.4 20.3 7.5% 6.1% 0.6x 7.4xMetaps Inc. * Japan 25.07 ‐37% 323.7 296.9 92.1 4.6 5.0% 0.0% 3.2x 64.3xOpera Software ASA Norway 4.32 ‐47% 634.8 837.3 707.4 83.4 11.8% 48.6% 1.2x 10.0xPacific Online Limited China 0.25 ‐22% 274.5 233.3 162.0 33.2 20.5% 0.1% 1.4x 7.0xRightmove plc * United Kingdom 52.95 ‐4% 4,900.9 4,884.3 275.1 202.4 73.6% 15.1% 17.8x 24.1xSepteni Holdings Co., Ltd. Japan 3.09 ‐56% 394.9 291.2 143.1 34.0 23.7% ‐69.3% 2.0x 8.6xTaptica International Ltd Israel 2.93 ‐6% 185.1 176.2 93.7 12.3 13.1% 41.6% 1.9x 14.3xTencent Holdings Limited China 27.19 ‐4% 255,063.17 256,141.47 20,769.05 8,835.86 42.5% 48.3% 12.3x 29.0xTradeDoubler AB Sweden 0.53 ‐36% 23.30 21.51 148.06 (3.32) NM ‐17.3% 0.1x NM XLMedia PLC Channel Islands 1.30 ‐11% 257.2 219.0 103.6 29.1 28.1% 53.2% 2.1x 7.5xYandex N.V. Netherlands 24.22 ‐3% 7,955.8 7,256.9 1,240.4 366.8 29.6% 27.0% 5.9x 19.8xZhaopin Limited China 16.90 ‐2% 939.1 634.6 245.1 52.1 21.2% 22.1% 2.6x 12.2x
Average 2.4x 12.0x
Internationally‐based Digital Advertising
*Calculation is market cap weighted and excludes revenue multiples that are 2.0 standard deviations above the mean (14.0x)and EBITDA multiples that are 1.0 standard deviations above the mean (33.6x)

17 | M&A and Investment Summary March 2017
Marketing Technology
The Marketing Technology segment announced 85 transactions, of which 52 reported $3.1 billion in value
Analytics & Targeting was the most active subsegment with 13 transactions announced, nine of which were worth $58 million in value
Select Transactions:
• The $81.5 million raised by business intelligence and data solutions platform Looker from CapitalG, Geodesic Capital, Goldman Sachs, and Kleiner Perkins Caufield & Byers
• Iconiq Capital’s $80 million investment in business and customer management platform ServiceTitan
• Real estate customer relationship management platform Placester’s $50 million round of funding from New Enterprise Associates
• The $25 million investment received by SaaS‐based shipping price automation solution developer Freightos from GE Ventures
• MINDBODY’s acquisition of class and appointments pricing company Lymber Wellness
# % $MM % # $MM # $MM # $MM
Analytics & Targeting 13 15% $57.8 2% 3 $10.0 0 ‐ 10 $47.8
CRM 12 14% 140.3 4% 5 17.8 0 ‐ 7 122.5
BI Tools 8 9% 189.1 6% 2 ‐ 0 ‐ 6 189.1
Content Management 8 9% 22.4 1% 3 ‐ 0 ‐ 5 22.4
Commerce Management 6 7% 54.5 2% 4 36.6 0 ‐ 2 17.9
Email/Messaging Software 4 5% 25.7 1% 1 ‐ 0 ‐ 3 25.7
Product/Price Software 4 5% 38.0 1% 2 ‐ 0 ‐ 2 38.0
Other* 30 35% 2,593.1 83% 15 2,440.0 0 ‐ 15 127.1
Total 85 100% 3,120.9 100% 35 2,504.4 0 0.0 50 616.5
MARKETING TECHNOLOGY TRANSACTIONS BY SEGMENT BUYER/INVESTOR BREAKDOWN
Transactions Reported Value Strategic Buyout Venture/Growth Capital

18 | M&A and Investment Summary March 2017
Marketing TechnologyPublic Company Valuation (1/3)
($ in Millions, except stock price data)
Stock Price Chg % From Equity Ent. LTM LTM Margin LTM LTM Multiples Company Name 03/31/17 52WK High Value Value Revenue EBITDA EBITDA Rev Growth EV/Rev EV/EBITDAAdobe Systems Incorporated * 130.13 0% $ 64,375.05 $ 61,611.51 $ 6,152.74 $ 1,984.48 32.3% 21.4% 10.0x 31.0xAlteryx, Inc. * 15.63 ‐1% 880.3 927.1 85.8 (21.3) NM 59.4% 10.8x NM AppFolio, Inc. 27.20 ‐3% 917.6 891.5 105.6 (4.7) NM 40.8% 8.4x NM Bazaarvoice, Inc. 4.30 ‐30% 356.1 309.6 201.7 (8.4) NM 2.2% 1.5x NM Blackbaud, Inc. 76.67 ‐2% 3,560.0 3,885.7 730.8 124.7 17.1% 14.6% 5.3x 31.2xBrightcove Inc. 8.90 ‐36% 303.1 267.1 150.3 (1.0) NM 11.6% 1.8x NM ChannelAdvisor Corporation 11.15 ‐30% 292.7 230.9 113.2 (6.2) NM 12.5% 2.0x NM Covisint Corporation 2.05 ‐17% 83.8 53.3 71.2 (10.0) NM ‐10.4% 0.7x NM eBay Inc. 33.57 ‐2% 36,492.0 38,303.0 8,979.0 3,007.0 33.5% 4.5% 4.3x 12.7xEndurance International Group 7.85 ‐32% 1,117.6 3,075.9 1,111.1 230.1 20.7% 49.9% 2.8x 13.4xFive9, Inc. 16.46 ‐13% 896.1 883.8 162.1 1.8 1.1% 25.8% 5.5x NM GoDaddy Inc. 37.90 0% 3,398.6 4,043.8 1,847.9 210.2 11.4% 15.0% 2.2x 19.2xHubSpot, Inc. 60.55 ‐8% 2,189.5 2,076.2 271.0 (38.6) NM 48.9% 7.7x NM Inter Industries LTD. 2.95 ‐5% 27.3 34.0 86.8 3.3 3.8% 10.6% 0.4x 10.2xIBM Corporation 174.14 ‐5% 164,251.0 198,046.0 79,919.0 18,552.0 23.2% ‐2.2% 2.5x 10.7xJive Software, Inc. 4.30 ‐6% 340.4 231.8 204.1 (0.2) NM 4.2% 1.1x NM LivePerson, Inc. * 6.85 ‐23% 399.4 348.5 222.8 8.9 4.0% ‐6.8% 1.6x 39.0xMarin Software Incorporated 1.80 ‐45% 70.9 39.9 99.9 (6.2) NM ‐8.0% 0.4x NM MaxPoint Interactive, Inc. 6.41 ‐46% 42.5 45.8 149.1 (12.0) NM 6.4% 0.3x NM MicroStrategy Incorporated 187.80 ‐9% 2,147.5 1,558.2 512.2 115.9 22.6% ‐3.3% 3.0x 13.4xMINDBODY, Inc. 27.45 ‐3% 1,121.7 1,051.3 139.0 (14.3) NM 37.1% 7.6x NM Nuance Communications, Inc. 17.31 ‐10% 5,047.0 6,890.4 1,950.4 397.3 20.4% 0.4% 3.5x 17.3xOracle Corporation 44.61 ‐5% 183,555.9 178,578.9 37,429.0 14,535.0 38.8% 0.7% 4.8x 12.3xPayPal Holdings, Inc. 43.02 ‐3% 51,950.2 42,134.2 10,842.0 2,102.0 19.4% 17.2% 3.9x 20.0xPROS Holdings, Inc. 24.19 ‐6% 746.9 735.2 153.3 (55.9) NM ‐8.9% 4.8x NM PTC Inc. * 52.55 ‐7% 6,081.2 6,616.8 1,135.8 91.5 8.1% ‐7.0% 5.8x 72.3xRightside Group, Ltd. 9.92 ‐23% 194.8 176.7 62.1 (13.3) NM 8.2% 2.8x NM The Rubicon Project, Inc. 5.89 ‐71% 284.8 94.9 278.2 26.9 9.7% 12.0% 0.3x 3.5xSalesforce.com, inc. * 82.49 ‐2% 58,361.7 58,862.3 8,392.0 504.8 6.0% 25.9% 7.0x 116.6x
US‐based Marketing Technology

19 | M&A and Investment Summary March 2017
Marketing TechnologyPublic Company Valuation (2/3)
($ in Millions, except stock price data)
Stock Price Chg % From Equity Ent. LTM LTM Margin LTM LTM Multiples Company Name 03/31/17 52WK High Value Value Revenue EBITDA EBITDA Rev Growth EV/Rev EV/EBITDASquare, Inc. 17.28 ‐5% $ 6,345.1 $ 5,833.2 $ 1,708.7 $ (40.6) NM 34.9% 3.4x NM Synchronoss Technologies, Inc. 24.40 ‐51% 1,105.9 1,229.6 476.8 54.3 11.4% 11.4% 2.6x 22.6xTableau Software, Inc. 49.55 ‐21% 3,867.5 2,958.7 826.9 (96.6) NM 26.5% 3.6x NM Teradata Corporation 31.12 ‐7% 4,073.2 3,667.2 2,322.0 380.0 16.4% ‐8.2% 1.6x 9.7xVerint Systems Inc. 43.38 ‐3% 2,707.5 3,154.7 1,062.1 97.5 9.2% ‐6.0% 3.0x 32.4xWeb.com Group, Inc. 19.30 ‐14% 881.3 1,525.0 710.5 128.3 18.1% 30.7% 2.1x 11.9xXactly Corporation 11.90 ‐26% 375.1 346.9 95.5 (12.4) NM 25.6% 3.6x NM Zendesk, Inc. 28.04 ‐12% 2,759.0 2,534.2 312.0 (84.2) NM 49.4% 8.1x NM
Adjusted Weighted Average 2.9x 13.1x
*Calculation is market cap weighted and excludes revenue multiples that are 2.0 standard deviations above the mean (9.4x)and EBITDA multiples that are 1.0 standard deviations above the mean (47.7x)
US‐based Marketing Technology

20 | M&A and Investment Summary March 2017
Marketing TechnologyPublic Company Valuation (3/3)
($ in Millions, except stock price data)
Stock Price Chg % From Equity Ent. LTM LTM Margin LTM LTM Multiples Company Name Headquarters 03/31/17 52WK High Value Value Revenue EBITDA EBITDA Rev Growth EV/Rev EV/EBITDABaozun Inc. China 14.94 ‐20% $ 793.87 $ 656.00 $ 488.27 $ 17.87 3.7% 30.5% 1.3x 36.7xChinaCache International Holdings Ltd. China 1.56 ‐84% 42.0 44.2 151.8 (47.9) NM ‐22.1% 0.3x NM Mercadolibre, Inc. Argentina 211.47 ‐3% 9,338.0 9,164.0 844.4 223.8 26.5% 29.6% 10.9x 40.9xOpen Text Corporation Canada 34.01 ‐3% 8,949.4 9,622.1 1,958.7 580.6 29.6% 7.0% 4.9x 16.6xOpera Software ASA Norway 4.70 ‐41% 686.1 566.8 536.7 51.4 9.6% ‐12.9% 1.1x 11.0xThe Sage Group plc United Kingdom 7.90 ‐22% 8,530.68 8,922.89 2,043.19 581.15 28.4% 9.3% 4.4x 15.4xSAP SE Germany 98.37 0% 117,914.2 122,194.6 23,289.3 6,369.7 27.4% 6.1% 5.2x 19.2xSharpSpring, Inc. United States 4.61 ‐27% 38.6 29.9 11.5 (4.9) NM ‐20.9% 2.6x NM Shopify Inc. Canada 68.09 ‐7% 6,142.2 5,746.7 389.3 (26.5) NM 89.7% 14.8x NM United Internet AG Germany 44.27 ‐9% 8,926.1 10,796.9 4,168.6 880.2 21.1% 6.3% 2.6x 12.3xWeborama SA France 10.56 ‐25% 36.0 35.9 34.6 1.7 4.9% 14.2% 1.0x 21.1xWix.com ltd Israel 67.90 ‐5% 3,044.6 2,873.3 290.1 (39.5) NM 42.5% 9.9x NM
Adjusted Weighted Average 2.6x 14.9x
*Calculation is market cap weighted and excludes revenue multiples that are 2.0 standard deviations above the mean (14.1x)and EBITDA multiples that are 1.0 standard deviations above the mean (32.8x)
Internationally‐based Marketing Technology

21 | M&A and Investment Summary March 2017
Agency & Marketing Services
There were 32 transactions announced in the Agency & Marketing Services segment in March. Digital Agency was the most active subsegment with 10 transactions
Select transactions:
• Altice’s acquisition of data‐driven digital and direct marketing solutions company Audience Partners
• Conde Nast’s acquisition of experiential marketing services firm Pop2Life
• The acquisitions of internet marketing consultancy and campaign analytics company Agence79 and shopper marketing services company DB Australia by Havas
• Independent marketing firm The Shipyard’s acquisition of strategy and creative services firm Tomorro
• Shiseido Americas Corporation’s acquisition of JWALK, a leading, full‐service creative and digital design agency (A Petsky Prunier‐led transaction)
# % $MM % # $MM # $MM # $MM
Digital Agency 10 31% ‐ 0% 10 ‐ 0 ‐ 0 ‐
Public Relations 4 13% ‐ 0% 4 ‐ 0 ‐ 0 ‐
Design Agency 3 9% ‐ 0% 3 ‐ 0 ‐ 0 ‐
Loyalty/Retention 3 9% 2.8 15% 2 ‐ 0 ‐ 1 2.8
DM Agency 2 6% 9.9 53% 2 9.9 0 ‐ 0 ‐
Experiential Marketing 2 6% ‐ 0% 2 ‐ 0 ‐ 0 ‐
Marketing Consulting 2 6% ‐ 0% 2 ‐ 0 ‐ 0 ‐
Other* 6 19% 6 32% 5 6.1 0 ‐ 1 ‐
Total 32 100% 18.8 100% 30 16.0 0 0.0 2 2.8
AGENCY & MARKETING SERVICES TRANSACTIONS BY SEGMENT BUYER/INVESTOR BREAKDOWN
Transactions Reported Value Strategic Buyout Venture/Growth Capital

22 | M&A and Investment Summary March 2017
Agency Public Company Valuation
($ in Millions, except stock price data)
Stock Price Chg % From Equity Ent. LTM LTM Margin LTM LTM Multiples Company Name Headquarters 03/31/17 52WK High Value Value Revenue EBITDA EBITDA Rev Growth EV/Rev EV/EBITDACello Group Plc * United Kingdom $1.55 ‐1% $ 159.7 $ 166.0 $ 204.1 $ 10.0 4.9% 5.1% 0.8x 16.5xDentsu Inc. Japan 54.17 ‐6% 15,423.0 17,310.1 7,180.8 1,572.1 21.9% NM 2.4x 11.0xEnero Group Limited Australia 0.76 ‐24% 65.4 42.7 139.6 9.1 6.5% ‐11.4% 0.3x 4.7xHakuhodo DY Holdings Inc Japan 11.84 ‐12% 4,411.7 3,543.7 10,633.3 455.1 4.3% 5.3% 0.3x 7.8xHavas SA France 8.93 ‐6% 3,746.9 3,587.6 2,402.6 352.6 14.7% 4.0% 1.5x 10.2xHuntsworth plc United Kingdom 0.55 ‐8% 176.9 216.3 222.4 25.6 11.5% 7.0% 1.0x 8.5xM&C Saatchi plc * United Kingdom 4.41 ‐8% 336.1 344.4 278.3 15.4 5.5% 26.0% 1.2x 22.4xM.D.C. Holdings, Inc. United States 30.05 ‐4% 1,551.0 2,203.3 2,326.8 172.1 7.4% 21.9% 0.9x 12.8xNext Fifteen Communications Group plc United Kingdom 4.81 ‐10% 353.0 369.4 197.1 26.5 13.4% 28.8% 1.9x 14.0xOmnicom Group Inc. United States 86.21 ‐4% 20,218.9 22,892.2 15,416.9 2,301.8 14.9% 1.9% 1.5x 9.9xOPT Holding, Inc. Japan 9.45 ‐5% 210.6 182.8 598.0 24.8 4.2% 9.0% 0.3x 7.4xPublicis Groupe SA France 70.05 ‐6% 15,686.9 16,855.6 10,274.5 1,852.6 18.0% 1.4% 1.6x 9.1xThe Interpublic Group of Companies, Inc. United States 24.57 ‐3% 9,648.3 10,530.4 7,846.6 1,098.2 14.0% 3.1% 1.3x 9.6xWPP plc United Kingdom 21.94 ‐9% 27,616.4 33,343.9 17,765.8 3,131.0 17.6% 17.6% 1.9x 10.6x
1.7x 10.1xAdjusted Weighted Average
*Calculation is market cap weighted and excludes revenue multiples that are 2.0 standard deviations above the mean (2.5x)and EBITDA multiples that are 1.0 standard deviations above the mean (15.4x)

23 | M&A and Investment Summary March 2017
Marketing ServicesPublic Company Valuation
($ in Millions, except stock price data)
Stock Price Chg % From Equity Ent. LTM LTM Margin LTM LTM Multiples Company Name Headquarters 03/31/17 52WK High Value Value Revenue EBITDA EBITDA Rev Growth EV/Rev EV/EBITDAAcxiom Corporation * United States $28.47 ‐6% $ 2,226.7 $ 2,325.7 $ 880.0 $ 91.0 10.3% 5.9% 2.6x 25.6xAimia Inc. Canada 6.75 ‐5% 1,028.5 1,321.7 1,703.4 91.6 5.4% ‐7.0% 0.8x 14.4xAlliance Data Systems Corporation United States 249.00 ‐1% 13,925.4 27,060.6 7,138.1 1,462.4 20.5% 10.8% 3.8x 18.5xCogint, Inc. United States 4.65 ‐25% 250.1 290.1 186.8 (16.9) NM 1225.9% 1.6x NM CSG Systems International Inc. United States 37.81 ‐26% 1,241.7 1,381.4 761.0 159.8 21.0% 1.1% 1.8x 8.6xDST Systems Inc. United States 122.50 ‐5% 3,855.1 4,189.1 1,556.7 330.3 21.2% 5.6% 2.7x 12.7xFair Isaac Corporation * United States 128.95 ‐3% 4,005.1 4,537.6 900.9 206.9 23.0% 6.1% 5.0x 21.9xHarte‐Hanks Inc. United States 1.40 ‐51% 86.2 140.5 462.3 12.8 2.8% ‐2.4% 0.3x 11.0xHigh Co. SA France 6.90 ‐10% 141.7 83.8 182.0 17.7 9.7% 16.9% 0.5x 4.7xMultiplus S.A. Brazil 11.39 ‐27% 1,845.9 1,383.6 675.8 175.3 25.9% ‐2.8% 2.0x 7.9xPitney Bowes Inc. United States 13.11 ‐40% 2,442.1 5,004.5 3,406.6 748.8 22.0% ‐4.8% 1.5x 6.7xPoints International Ltd. Canada 7.74 ‐20% 115.0 58.1 321.6 9.6 3.0% 8.6% 0.2x 6.1xViad Corp United States 45.20 ‐6% 918.8 1,160.4 1,205.0 119.2 9.9% 10.6% 1.0x 9.7x
2.9x 14.6xAdjusted Weighted Average
*Calculation is market cap weighted and excludes revenue multiples that are 2.0 standard deviations above the mean (4.7x)and EBITDA multiples that are 1.0 standard deviations above the mean (18.9x)

24 | M&A and Investment Summary March 2017
Traditional Media
Of the 22 transactions announced in the Traditional Media segment in March, nine announced more than $400 million in reported transaction value
Select Transactions:
• Informa’s acquisition of boat shows operator Show Management from Active Interest Media for $133 million
• The $123 million acquisition of Baltic broadcasting operations MTG by Providence Equity Partners
• The acquisition of US Weekly by American Media from Wenner Media for $100 million
• Sinclair Broadcast Group’s $15 million acquisition of Tennis.com operator and Tennis Magazine publisher Tennis Media
• Nature programs television broadcaster NatureVision TV’s sale to Stingray Digital Group
• Cision’s acquisition of the daily White House News Summary publisher Bulletin Intelligence
# % $MM % # $MM # $MM # $MM
Entertainment Media 8 36% $9.0 2% 7 ‐ 0 ‐ 1 $9.0
Consumer Magazine Publishing 6 27% 120.5 30% 6 120.5 0 ‐ 0 ‐
B‐to‐B Media 3 14% 133.0 33% 3 133.0 0 ‐ 0 ‐
Broadcast Television 2 9% 122.5 30% 1 ‐ 1 122.5 0 ‐
Consumer Book Publishing 2 9% 19.9 5% 2 19.9 0 ‐ 0 ‐
Digital Place‐Based Media 1 5% 3.0 1% 0 ‐ 0 ‐ 1 3.0
Total 22 100% 407.9 100% 19 273.4 1 122.5 2 12.0
TRADTIONAL MEDIA TRANSACTIONS BY SEGMENT BUYER/INVESTOR BREAKDOWN
Transactions Reported Value Strategic Buyout Venture/Growth Capital

25 | M&A and Investment Summary March 2017
Traditional MediaPublic Company Valuation (1/3)
($ in Millions, except stock price data)
Stock Price Chg % From Equity Ent. LTM LTM Margin LTM LTM Multiples Company Name Headquarters 03/31/17 52WK High Value Value Revenue EBITDA EBITDA Rev Growth EV/Rev EV/EBITDACBS Corporation * United States $69.36 0% $ 28,443.2 $ 37,220.2 $ 13,166.0 $ 3,095.0 23.5% 3.9% 2.8x 12.0xDiscovery Communications, Inc. United States 29.09 ‐3% 17,003.5 24,709.5 6,497.0 2,444.0 37.6% 1.6% 3.8x 10.1xTime Warner Inc. United States 97.71 ‐2% 75,659.8 98,490.8 29,318.0 8,573.0 29.2% 4.3% 3.4x 11.5xTwenty‐First Century Fox, Inc. United States 32.39 ‐1% 59,461.4 76,617.4 28,062.0 6,954.0 24.8% 5.9% 2.7x 11.0xViacom, Inc. United States 46.62 0% 18,608.4 30,716.4 12,658.0 2,863.0 22.6% ‐3.2% 2.4x 10.7xThe Walt Disney Company United States 113.39 0% 179,297.7 200,018.7 55,172.0 16,784.0 30.4% 1.6% 3.6x 11.9x
Adjusted Weighted Average 3.3x 11.5x
($ in Millions, except stock price data)
B‐to‐B Media
Stock Price Chg % From Equity Ent. LTM LTM Margin LTM LTM Multiples Company Name Headquarters 03/31/17 52WK High Value Value Revenue EBITDA EBITDA Rev Growth EV/Rev EV/EBITDAAscential plc United Kingdom $4.01 ‐1% $ 1,607.6 $ 1,887.9 $ 369.9 $ 106.3 28.7% ‐6.1% 5.1x 17.8xEuromoney Institutional Investor PLC United Kingdom $13.31 ‐14% 1,428.7 1,426.7 524.9 149.5 28.5% ‐0.1% 2.7x 9.5xGlobal Sources Ltd. Bermuda 8.25 ‐13% 197.0 91.2 150.7 31.3 20.8% ‐8.0% 0.6x 2.9xInforma plc United Kingdom 8.16 ‐14% 6,722.9 8,584.8 1,661.5 522.2 31.4% 11.0% 5.2x 16.4xTechTarget, Inc. * United States 9.03 ‐4% 247.6 256.6 106.6 11.7 11.0% ‐4.7% 2.4x 22.0xUBM plc United Kingdom 9.57 ‐2% 3,767.9 4,566.0 1,065.5 296.1 27.8% 12.1% 4.3x 15.4x
Adjusted Weighted Average 4.5x 15.1x
($ in Millions, except stock price data)
Radio Broadcasting
Stock Price Chg % From Equity Ent. LTM LTM Margin LTM LTM Multiples Company Name Headquarters 03/31/17 52WK High Value Value Revenue EBITDA EBITDA Rev Growth EV/Rev EV/EBITDABeasley Broadcast Group, Inc. * United States $11.60 ‐19% $ 334.4 $ 568.5 $ 136.7 $ 29.7 21.7% 29.0% 4.2x 19.2xCumulus Media Inc. United States 0.32 ‐92% 9.4 2,262.3 1,141.4 201.0 17.6% ‐2.3% 2.0x 11.3xEmmis Communications Corp. United States 2.45 ‐43% 30.4 280.9 222.0 30.6 13.8% ‐5.1% 1.3x 9.2xEntercom Communications Corp. United States 14.30 ‐14% 580.2 1,033.6 460.2 106.8 23.2% 11.9% 2.2x 9.7xPandora Media, Inc. United States 11.81 ‐21% 2,778.7 2,883.9 1,384.8 (238.7) NM 19.0% 2.1x NM Radio One, Inc. United States 3.30 ‐7% 159.1 1,131.9 456.2 123.8 27.1% 1.2% 2.5x 9.1xSalem Media Group, Inc. United States 7.45 ‐9% 193.8 455.8 274.3 48.5 17.7% 3.2% 1.7x 9.4xSirius XM Holdings Inc. * United States 5.15 ‐7% 24,283.1 29,917.4 5,017.2 1,740.9 34.7% 9.8% 6.0x 17.2xSpanish Broadcasting System, Inc. United States 0.00 NA 5.4 408.1 142.8 38.2 26.7% ‐0.1% 2.9x 10.7xTownsquare Media, Inc. United States 12.18 ‐6% 224.6 745.0 516.9 102.5 19.8% 17.1% 1.4x 7.3x
Adjusted Weighted Average 2.2x 9.1x
*Calculation is market cap weighted and excludes revenue multiples that are 2.0 standard deviations above the mean (5.5x)and EBITDA multiples that are 1.0 standard deviations above the mean (15.4x)
Large Cap Diversified Media
*Calculation is market cap weighted and excludes revenue multiples that are 2.0 standard deviations above the mean (4.2x)and EBITDA multiples that are 1.0 standard deviations above the mean (12.0x)
*Calculation is market cap weighted and excludes revenue multiples that are 2.0 standard deviations above the mean (6.6x)and EBITDA multiples that are 1.0 standard deviations above the mean (20.5x)

26 | M&A and Investment Summary March 2017
Traditional MediaPublic Company Valuation (2/3)
($ in Millions, except stock price data)
Broadcast, Cable, and Satellite Television
Stock Price Chg % From Equity Ent. LTM LTM Margin LTMCompany Name Headquarters 03/31/17 52WK High Value Value Revenue EBITDA EBITDA Rev Growth EV/Rev EV/EBITDAAltice N.V. Netherlands $22.67 ‐2% $ 24,673.8 $ 86,536.1 $ 20,879.4 $ 7,315.3 35.0% 50.6% 4.1x 11.8xAMC Networks Inc. United States $58.68 ‐17% 3,974.9 6,600.4 2,755.7 865.8 31.4% 6.8% 2.4x 7.6xSky plc * United Kingdom 12.22 ‐7% 20,895.5 30,883.7 15,627.5 2,338.5 15.0% 11.0% 2.0x 13.2xCVC Limited Australia 1.41 ‐6% 168.0 173.2 93.7 27.1 28.9% 41.7% 1.8x 6.4xCBS Corporation United States 69.36 0% 28,443.2 37,220.2 13,166.0 3,095.0 23.5% 3.9% 2.8x 12.0xCharter Communications, Inc. * United States 327.32 ‐4% 88,015.6 158,454.6 29,003.0 10,728.0 37.0% 197.3% 5.5x 14.8xComcast Corporation United States 37.59 ‐2% 178,612.6 238,262.6 80,403.0 26,478.0 32.9% 7.9% 3.0x 9.0xDiscovery Communications, Inc. United States 29.09 ‐3% 17,003.5 24,709.5 6,497.0 2,444.0 37.6% 1.6% 3.8x 10.1xDISH Network Corporation * United States 63.49 ‐2% 29,547.3 40,995.3 15,094.6 3,170.3 21.0% 0.2% 2.7x 12.9xEntravision Communications Corporation United States 6.20 ‐25% 559.3 793.0 258.5 64.6 25.0% 1.7% 3.1x 12.3xGeneral Communication, Inc. United States 20.80 ‐7% 745.7 2,153.9 933.8 272.9 29.2% ‐4.6% 2.3x 7.9xGray Television, Inc. United States 14.50 ‐4% 1,037.2 2,468.7 812.5 304.4 37.5% 36.0% 3.0x 8.1xGrupo Televisa, S.A.B. Mexico 5.15 ‐9% 12,586.8 17,874.9 4,674.3 1,699.1 36.4% 9.4% 3.8x 10.5xLiberty Global plc United Kingdom 35.87 ‐10% 37,765.9 81,613.9 20,008.8 8,938.3 44.7% 9.5% 4.1x 9.1xNexstar Media Group, Inc. * United States 70.15 ‐5% 3,304.8 5,679.2 1,103.2 404.5 36.7% 23.1% 5.1x 14.0xScripps Networks Interactive, Inc. United States 78.37 ‐6% 10,165.3 13,573.4 3,401.4 1,523.6 44.8% 12.7% 4.0x 8.9xSinclair Broadcast Group, Inc. United States 40.50 ‐6% 4,150.9 8,064.7 2,736.9 880.5 32.2% 23.3% 2.9x 9.2xTEGNA Inc. United States 25.62 ‐4% 5,502.6 9,797.0 3,341.2 1,208.7 36.2% 9.5% 2.9x 8.1xThe E. W. Scripps Company United States 23.44 ‐3% 1,926.6 2,185.4 943.0 186.4 19.8% 31.8% 2.3x 11.7xTime Warner Inc. United States 97.71 ‐2% 75,659.8 98,490.8 29,318.0 8,573.0 29.2% 4.3% 3.4x 11.5x
Adjusted Weighted Average 3.2x 9.9x
($ in Millions, except stock price data)
Entertainment Media
Stock Price Chg % From Equity Ent. LTM LTM Margin LTMCompany Name Headquarters 03/31/17 52WK High Value Value Revenue EBITDA EBITDA Rev Growth EV/Rev EV/EBITDACineplex Inc. Canada $37.89 ‐5% $ 2,407.0 $ 2,696.7 $ 1,100.6 $ 170.9 15.5% 7.8% 2.5x 15.8xEros International Plc * United States 10.30 ‐48% 621.2 869.3 265.5 28.9 10.9% ‐10.9% 3.3x 30.1xLions Gate Entertainment Corp. United States 26.56 ‐9% 5,439.1 8,513.1 2,736.4 12.5 0.5% 24.3% 3.1x NM Live Nation Entertainment, Inc. United States 30.37 ‐1% 6,218.6 7,575.6 8,354.9 598.7 7.2% 15.3% 0.9x 12.7xTwenty‐First Century Fox, Inc. United States 32.39 ‐1% 59,461.4 76,617.4 28,062.0 6,954.0 24.8% 5.9% 2.7x 11.0xLiberty Global plc United Kingdom 35.87 ‐10% 37,765.9 81,613.9 20,008.8 8,938.3 44.7% 9.5% 4.1x 9.1xVillage Roadshow Limited Australia 3.21 ‐25% 519.1 954.3 771.6 108.1 14.0% 3.6% 1.2x 8.8xWorld Wrestling Entertainment, Inc. United States 22.22 ‐4% 1,698.7 1,634.3 729.2 83.4 11.4% 10.7% 2.2x 19.6x
Adjusted Weighted Average 3.1x 10.6x
*Calculation is market cap weighted and excludes revenue multiples that are 2.0 standard deviations above the mean (5.2x)and EBITDA multiples that are 1.0 standard deviations above the mean (12.8x)
*Calculation is market cap weighted and excludes revenue multiples that are 2.0 standard deviations above the mean (4.8x)and EBITDA multiples that are 1.0 standard deviations above the mean (23.5x)
LTM Multiples
LTM Multiples

27 | M&A and Investment Summary March 2017
Traditional MediaPublic Company Valuation (3/3)
($ in Millions, except stock price data)
Out‐of‐Home Media
Stock Price Chg % From Equity Ent. LTM LTM Margin LTM LTM Multiples Company Name Headquarters 03/31/17 52WK High Value Value Revenue EBITDA EBITDA Rev Growth EV/Rev EV/EBITDAAirMedia Group Inc. China $2.75 ‐51% $ 172.2 $ (40.2) $ (14.1) $ (86.6) NM #VALUE! 2.8x 0.5xAPG|SGA SA Switzerland 467.16 0% 1,401.0 1,274.2 312.3 77.5 24.8% 0.6% 4.1x 16.4xClear Channel Outdoor Holdings, Inc. United States 6.05 ‐17% 2,178.2 6,901.7 2,702.4 652.6 24.2% ‐3.7% 2.6x 10.6xClear Media Limited Hong Kong 1.16 ‐2% 627.4 569.3 231.6 101.8 44.0% ‐2.0% 2.5x 5.6xJCDecaux SA France 35.28 ‐17% 7,497.9 8,003.7 3,140.0 564.9 18.0% 6.0% 2.5x 14.2xLamar Advertising Company United States 74.74 ‐6% 7,282.2 9,595.9 1,500.3 628.9 41.9% 10.9% 6.4x 15.3xMood Media Corporation Canada 0.05 ‐77% 9.6 620.1 465.3 79.7 17.1% ‐2.1% 1.3x 7.8xNational CineMedia, Inc. United States 12.63 ‐22% 794.0 1,910.7 447.6 208.5 46.6% 0.2% 4.3x 9.2xNTN Buzztime, Inc. * United States 8.60 ‐28% 21.4 24.2 22.3 0.2 1.0% ‐9.0% 1.1x 108.5xStingray Digital Group Inc. Canada 6.33 ‐8% 324.6 357.1 74.9 20.5 27.3% 19.9% 4.8x 17.4xTOM Group Limited * Hong Kong 0.23 ‐20% 911.1 1,246.6 133.4 12.3 9.2% ‐17.3% 9.3x 101.6x
Adjusted Weighted Average 4.1x 13.8x
($ in Millions, except stock price data)
Publishing
Stock Price Chg % From Equity Ent. LTM LTM Margin LTM LTM Multiples Company Name Headquarters 03/31/17 52WK High Value Value Revenue EBITDA EBITDA Rev Growth EV/Rev EV/EBITDAA.H. Belo Corporation United States $6.15 ‐23% $ 133.6 $ 57.5 $ 260.0 $ 10.6 4.1% ‐4.5% 0.2x 5.4xDaily Mail and General Trust plc * United Kingdom 9.02 ‐14% 3,020.6 4,094.0 2,496.6 327.4 13.1% 4.0% 1.6x 12.5xEmmis Communications Corp. United States 2.45 ‐43% 30.4 280.9 222.0 30.6 13.8% ‐5.1% 1.3x 9.2xGannett Co., Inc. United States 8.38 ‐53% 952.1 1,237.7 3,047.5 337.3 11.1% 5.6% 0.4x 3.7xGlacier Media Inc. Canada 0.50 ‐21% 55.3 107.2 148.0 11.9 8.0% ‐9.9% 0.7x 9.0xJohn Wiley & Sons, Inc. * United States 53.80 ‐9% 3,088.8 3,472.1 1,700.6 280.1 16.5% ‐1.9% 2.0x 12.4xMeredith Corporation United States 64.60 ‐2% 2,863.0 3,494.1 1,701.1 357.9 21.0% 5.3% 2.1x 9.8xNews Corporation United States 13.00 ‐11% 7,664.5 6,748.5 8,198.0 669.0 8.2% 2.4% 0.8x 10.1xScholastic Corporation United States 42.57 ‐14% 1,482.6 1,026.6 1,755.8 129.2 7.4% 6.6% 0.6x 7.9xThe E. W. Scripps Company * United States 23.44 ‐3% 1,926.6 2,185.4 943.0 186.4 19.8% 31.8% 2.3x 11.7xThe McClatchy Company United States 9.67 ‐51% 73.3 965.7 977.1 141.0 14.4% ‐7.5% 1.0x 6.8xThe New York Times Company United States 14.40 ‐12% 2,321.2 2,014.4 1,555.3 213.5 13.7% ‐1.5% 1.3x 9.4xTime Inc. United States 19.35 ‐5% 1,919.4 2,823.4 3,081.0 402.0 13.0% ‐0.8% 0.9x 7.0x
Adjusted Weighted Average 1.3x 9.0x
*Calculation is market cap weighted and excludes revenue multiples that are 2.0 standard deviations above the mean (2.5x)and EBITDA multiples that are 1.0 standard deviations above the mean (11.5x)
*Calculation is market cap weighted and excludes revenue multiples that are 2.0 standard deviations above the mean (7.9x)and EBITDA multiples that are 1.0 standard deviations above the mean (59.4x)

28 | M&A and Investment Summary March 2017
Software
Within the Software segment, more than $6.2 billion in reported value involved strategic transactions, while $2.0 billion in venture/growth capital investments were announced
Financial and Healthcare Software were the most active subsegments in March with 33 and 23 transactions announced, respectively
Select Transactions:
• FactSet’s acquisition of market risk and portfolio attribution solutions company BI‐SAM Technologies from Aquiline Capital Partners for $205 million
• The $170 million HMS Holdings acquisition of health engagement and member analytics company Eliza Corp. from Parthenon Capital Partners
• Application development company Progress’ $30 million acquisition of data management software provider DataRPM
• GoDaddy’s purchase of website security products and services provider Sucuri
• Digital performance management platform SOASTA’s sale to Akamai Technologies
*Micro Focus’ $8.8 billion acquisition of Hewlett Packard Enterprise’s Software business has been excluded to limit comparative distortions
# % $MM % # $MM # $MM # $MM
Financial 33 18% $4,239.3 50% 8 $3,677.3 2 ‐ 23 $562.0
Healthcare 23 13% 596.7 7% 5 170.0 2 75.0 16 351.7
HR 19 11% 130.8 2% 8 ‐ 0 ‐ 11 130.8
Security 18 10% 249.1 3% 5 124.6 0 ‐ 13 124.5
Collaboration 14 8% 93.3 1% 5 15.0 1 ‐ 8 78.3
Data Management 13 7% 1,370.0 16% 7 1,230.0 0 ‐ 6 140.0
Other* 60 27% 1,648.9 20% 22 964 2 141 36 543.9
Total 180 100% 8,400.0 100% 60 6,181.3 7 215.6 113 2,003.1
SOFTWARE TRANSACTIONS BY SEGMENT BUYER/INVESTOR BREAKDOWN
Transactions Reported Value Strategic Buyout Venture/Growth Capital
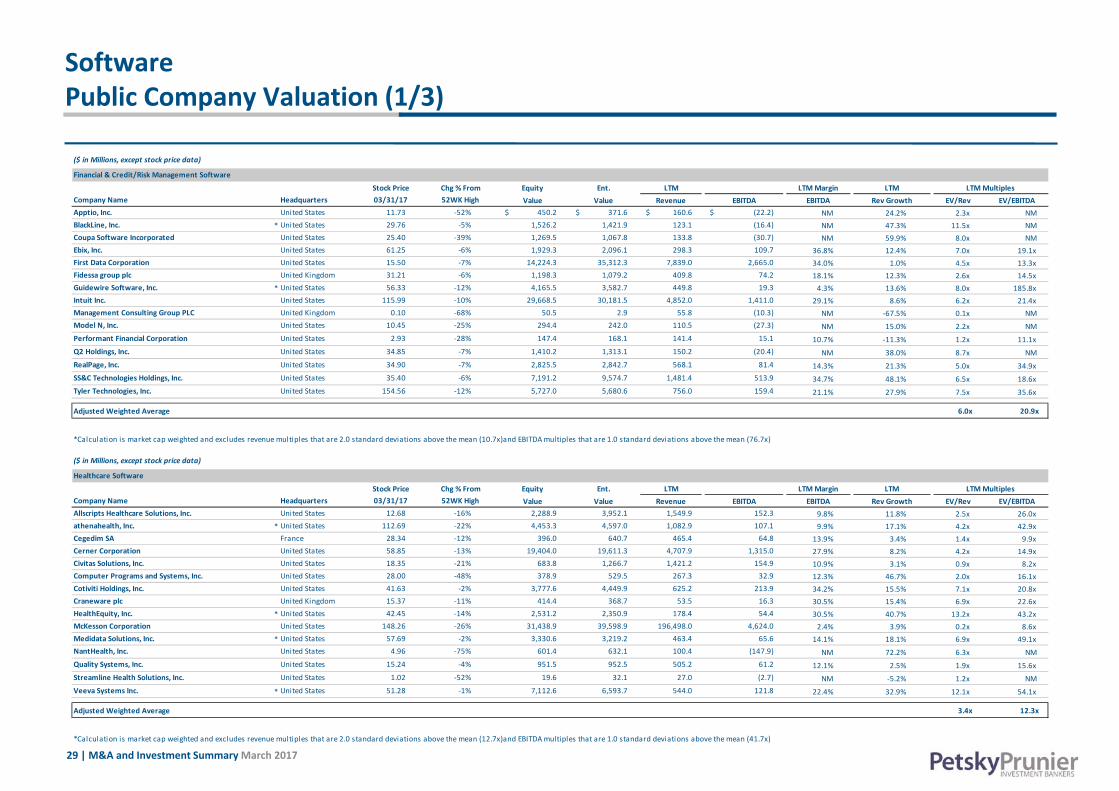
29 | M&A and Investment Summary March 2017
SoftwarePublic Company Valuation (1/3)
($ in Millions, except stock price data)
Stock Price Chg % From Equity Ent. LTM LTM Margin LTM LTM Multiples Company Name Headquarters 03/31/17 52WK High Value Value Revenue EBITDA EBITDA Rev Growth EV/Rev EV/EBITDAApptio, Inc. United States 11.73 ‐52% $ 450.2 $ 371.6 $ 160.6 $ (22.2) NM 24.2% 2.3x NM BlackLine, Inc. * United States 29.76 ‐5% 1,526.2 1,421.9 123.1 (16.4) NM 47.3% 11.5x NM Coupa Software Incorporated United States 25.40 ‐39% 1,269.5 1,067.8 133.8 (30.7) NM 59.9% 8.0x NM Ebix, Inc. United States 61.25 ‐6% 1,929.3 2,096.1 298.3 109.7 36.8% 12.4% 7.0x 19.1xFirst Data Corporation United States 15.50 ‐7% 14,224.3 35,312.3 7,839.0 2,665.0 34.0% 1.0% 4.5x 13.3xFidessa group plc United Kingdom 31.21 ‐6% 1,198.3 1,079.2 409.8 74.2 18.1% 12.3% 2.6x 14.5xGuidewire Software, Inc. * United States 56.33 ‐12% 4,165.5 3,582.7 449.8 19.3 4.3% 13.6% 8.0x 185.8xIntuit Inc. United States 115.99 ‐10% 29,668.5 30,181.5 4,852.0 1,411.0 29.1% 8.6% 6.2x 21.4xManagement Consulting Group PLC United Kingdom 0.10 ‐68% 50.5 2.9 55.8 (10.3) NM ‐67.5% 0.1x NM Model N, Inc. United States 10.45 ‐25% 294.4 242.0 110.5 (27.3) NM 15.0% 2.2x NM Performant Financial Corporation United States 2.93 ‐28% 147.4 168.1 141.4 15.1 10.7% ‐11.3% 1.2x 11.1xQ2 Holdings, Inc. United States 34.85 ‐7% 1,410.2 1,313.1 150.2 (20.4) NM 38.0% 8.7x NM RealPage, Inc. United States 34.90 ‐7% 2,825.5 2,842.7 568.1 81.4 14.3% 21.3% 5.0x 34.9xSS&C Technologies Holdings, Inc. United States 35.40 ‐6% 7,191.2 9,574.7 1,481.4 513.9 34.7% 48.1% 6.5x 18.6xTyler Technologies, Inc. United States 154.56 ‐12% 5,727.0 5,680.6 756.0 159.4 21.1% 27.9% 7.5x 35.6x
Adjusted Weighted Average 6.0x 20.9x
($ in Millions, except stock price data)
Healthcare Software
Stock Price Chg % From Equity Ent. LTM LTM Margin LTM LTM Multiples Company Name Headquarters 03/31/17 52WK High Value Value Revenue EBITDA EBITDA Rev Growth EV/Rev EV/EBITDAAllscripts Healthcare Solutions, Inc. United States 12.68 ‐16% 2,288.9 3,952.1 1,549.9 152.3 9.8% 11.8% 2.5x 26.0xathenahealth, Inc. * United States 112.69 ‐22% 4,453.3 4,597.0 1,082.9 107.1 9.9% 17.1% 4.2x 42.9xCegedim SA France 28.34 ‐12% 396.0 640.7 465.4 64.8 13.9% 3.4% 1.4x 9.9xCerner Corporation United States 58.85 ‐13% 19,404.0 19,611.3 4,707.9 1,315.0 27.9% 8.2% 4.2x 14.9xCivitas Solutions, Inc. United States 18.35 ‐21% 683.8 1,266.7 1,421.2 154.9 10.9% 3.1% 0.9x 8.2xComputer Programs and Systems, Inc. United States 28.00 ‐48% 378.9 529.5 267.3 32.9 12.3% 46.7% 2.0x 16.1xCotiviti Holdings, Inc. United States 41.63 ‐2% 3,777.6 4,449.9 625.2 213.9 34.2% 15.5% 7.1x 20.8xCraneware plc United Kingdom 15.37 ‐11% 414.4 368.7 53.5 16.3 30.5% 15.4% 6.9x 22.6xHealthEquity, Inc. * United States 42.45 ‐14% 2,531.2 2,350.9 178.4 54.4 30.5% 40.7% 13.2x 43.2xMcKesson Corporation United States 148.26 ‐26% 31,438.9 39,598.9 196,498.0 4,624.0 2.4% 3.9% 0.2x 8.6xMedidata Solutions, Inc. * United States 57.69 ‐2% 3,330.6 3,219.2 463.4 65.6 14.1% 18.1% 6.9x 49.1xNantHealth, Inc. United States 4.96 ‐75% 601.4 632.1 100.4 (147.9) NM 72.2% 6.3x NM Quality Systems, Inc. United States 15.24 ‐4% 951.5 952.5 505.2 61.2 12.1% 2.5% 1.9x 15.6xStreamline Health Solutions, Inc. United States 1.02 ‐52% 19.6 32.1 27.0 (2.7) NM ‐5.2% 1.2x NM Veeva Systems Inc. * United States 51.28 ‐1% 7,112.6 6,593.7 544.0 121.8 22.4% 32.9% 12.1x 54.1x
Adjusted Weighted Average 3.4x 12.3x
*Calculation is market cap weighted and excludes revenue multiples that are 2.0 standard deviations above the mean (10.7x)and EBITDA multiples that are 1.0 standard deviations above the mean (76.7x)
Financial & Credit/Risk Management Software
*Calculation is market cap weighted and excludes revenue multiples that are 2.0 standard deviations above the mean (12.7x)and EBITDA multiples that are 1.0 standard deviations above the mean (41.7x)

30 | M&A and Investment Summary March 2017
SoftwarePublic Company Valuation (2/3)
($ in Millions, except stock price data)
HR Software
Stock Price Chg % From Equity Ent. LTM LTM Margin LTMCompany Name Headquarters 03/31/17 52WK High Value Value Revenue EBITDA EBITDA Rev Growth EV/Rev EV/EBITDA51job, Inc. China $36.66 ‐3% $ 2,203.6 $ 1,510.2 $ 336.8 $ 97.2 28.9% 13.8% 4.5x 15.5xBenefitfocus, Inc. United States 27.95 ‐38% 858.5 900.4 233.3 (21.5) NM 26.0% 3.9x NM Castlight Health, Inc. United States 3.65 ‐34% 384.7 270.1 101.7 (53.8) NM 35.0% 2.7x NM Cornerstone OnDemand, Inc. United States 38.89 ‐19% 2,203.4 2,139.7 423.1 (46.3) NM 24.6% 5.1x NM DHI Group, Inc. United States 3.95 ‐53% 199.1 260.9 227.0 47.1 20.7% ‐12.6% 1.1x 5.5xPaycom Software, Inc. United States 57.51 0% 3,420.3 3,375.9 329.1 68.0 20.7% 46.5% 10.3x 49.6xPaylocity Holding Corporation United States 38.63 ‐22% 1,987.0 1,909.0 264.1 7.1 2.7% 40.8% 7.2x NM The Ultimate Software Group, Inc. * United States 195.21 ‐13% 5,789.9 5,709.7 781.3 67.6 8.7% 26.4% 7.3x 84.5xWorkday, Inc. United States 83.28 ‐11% 16,905.8 15,443.5 1,569.4 (273.8) NM 35.0% 9.8x NM
Adjusted Weighted Average 8.4x 35.2x
($ in Millions, except stock price data)
Security Software
Stock Price Chg % From Equity Ent. LTM LTM Margin LTMCompany Name Headquarters 03/31/17 52WK High Value Value Revenue EBITDA EBITDA Rev Growth EV/Rev EV/EBITDAAbsolute Software Corporation Canada $5.66 ‐11% $ 224.0 $ 186.0 $ 88.6 $ 11.2 12.6% ‐4.2% 2.1x 16.7xAVG Technologies N.V. Netherlands 24.65 ‐30% 1,250.5 1,372.4 430.6 125.0 29.0% 6.8% 3.2x 11.0xCheck Point Software Technologies Ltd. Israel 102.66 ‐2% 17,955.4 16,582.5 1,741.3 864.8 49.7% 6.8% 9.5x 19.2xCisco Systems, Inc. United States 33.80 ‐2% 169,265.5 132,347.5 48,570.0 14,670.0 30.2% ‐2.1% 2.7x 9.0xCheetah Mobile Inc. * China 10.74 ‐37% 1,530.0 1,373.7 657.4 19.7 3.0% 23.9% 2.1x 69.8xCyberArk Software Ltd. Israel 50.87 ‐14% 1,751.1 1,476.1 216.6 42.4 19.6% 34.7% 6.8x 34.8xFireEye, Inc. United States 12.61 ‐33% 2,238.4 2,044.6 714.1 (295.6) NM 14.6% 2.9x NM Fortinet, Inc. United States 38.35 ‐1% 6,723.5 5,638.0 1,275.4 95.8 7.5% 26.4% 4.4x 58.9xGemalto N.V. Netherlands 56.01 ‐19% 5,013.8 5,091.0 3,300.5 571.3 17.3% 0.2% 1.5x 8.9xImperva, Inc. United States 41.05 ‐28% 1,373.3 1,112.2 264.5 (53.3) NM 12.9% 4.2x NM Juniper Networks, Inc. United States 27.83 ‐5% 10,553.0 10,101.2 4,990.1 1,105.6 22.2% 2.7% 2.0x 9.1xMimecast Limited United Kingdom 22.39 ‐9% 1,234.2 1,134.5 171.0 (0.9) NM 26.1% 6.6x NM Mobileye N.V. * Israel 61.40 0% 13,633.5 13,234.0 358.2 125.0 34.9% 48.7% 36.9x 105.8xNQ Mobile Inc. China 4.17 ‐22% 401.0 383.4 375.8 0.6 0.2% 1.9% 1.0x NM Palo Alto Networks, Inc. United States 112.68 ‐32% 10,370.6 9,528.5 1,567.3 (160.1) NM 36.3% 6.1x NM Proofpoint, Inc. United States 74.36 ‐16% 3,219.5 3,189.4 375.5 (41.7) NM 41.5% 8.5x NM SecureWorks Corp. United States 9.50 NA 765.4 648.8 429.5 (26.5) NM 26.5% 1.5x NM Symantec Corporation United States 30.68 ‐1% 18,985.8 20,548.8 3,777.0 875.0 23.2% 4.2% 5.4x 23.5xTrend Micro Incorporated Japan 44.39 ‐3% 6,088.4 4,880.7 1,130.1 390.2 34.5% 6.1% 4.3x 12.5xVeriSign, Inc. United States 87.11 ‐5% 8,913.8 8,982.9 1,142.2 744.7 65.2% 7.8% 7.9x 12.1x
Adjusted Weighted Average 3.8x 12.6x
LTM Multiples
LTM Multiples
*Calculation is market cap weighted and excludes revenue multiples that are 2.0 standard deviations above the mean (12.0x)and EBITDA multiples that are 1.0 standard deviations above the mean (74.6x)
*Calculation is market cap weighted and excludes revenue multiples that are 2.0 standard deviations above the mean (21.4x)and EBITDA multiples that are 1.0 standard deviations above the mean (60.2x)

31 | M&A and Investment Summary March 2017
SoftwarePublic Company Valuation (3/3)
($ in Millions, except stock price data)
Engineering Software
Stock Price Chg % From Equity Ent. LTM LTM Margin LTM LTM Multiples Company Name Headquarters 03/31/17 52WK High Value Value Revenue EBITDA EBITDA Rev Growth EV/Rev EV/EBITDAAnsys, Inc. United States $106.87 ‐2% $ 9,144.0 $ 8,321.2 $ 988.5 $ 446.2 45.1% 4.8% 8.4x 18.6xAutodesk, Inc. United States 86.47 ‐3% 19,096.8 18,687.6 2,031.0 (279.9) NM ‐18.9% 9.2x NM AVEVA Group plc United Kingdom 24.42 ‐9% 1,561.7 1,405.8 265.4 67.6 25.5% ‐0.5% 5.3x 20.8xDassault Systèmes SE * France 86.76 0% 22,017.4 20,445.4 3,225.6 885.3 27.4% 7.6% 6.3x 23.1x
Adjusted Weighted Average 7.7x 19.0x
($ in Millions, except stock price data)
Infrastructure Software
Stock Price Chg % From Equity Ent. LTM LTM Margin LTM LTM Multiples Company Name Headquarters 03/31/17 52WK High Value Value Revenue EBITDA EBITDA Rev Growth EV/Rev EV/EBITDAAdobe Systems Incorporated United States $130.13 0% $ 64,375.1 $ 61,611.5 $ 6,152.7 $ 1,984.5 32.3% 21.4% 10.0x 31.0xTeam Tankers International Ltd. United States 1.39 NM 260.6 260.1 266.5 32.9 12.3% ‐16.5% 1.0x 7.9xCA, Inc. United States 31.72 ‐9% 13,258.1 12,519.1 4,033.0 1,283.0 31.8% ‐0.1% 3.1x 9.8xCommvault Systems, Inc. * United States 50.80 ‐12% 2,290.0 1,852.9 637.2 17.2 2.7% 8.7% 2.9x 107.6xCovisint Corporation United States 2.05 ‐17% 83.8 53.3 71.2 (10.0) NM ‐10.4% 0.7x NM Endurance International Group Holdings, Inc. United States 7.85 ‐32% 1,117.6 3,075.9 1,111.1 230.1 20.7% 49.9% 2.8x 13.4xFirst Data Corporation United States 15.50 ‐7% 14,224.3 35,312.3 7,839.0 2,665.0 34.0% 1.0% 4.5x 13.3xGuidance Software, Inc. United States 5.90 ‐24% 189.3 180.7 110.5 (13.0) NM 3.3% 1.6x NM Hortonworks Inc. United States 9.81 ‐25% 611.8 526.7 184.5 (244.0) NM 51.3% 2.9x NM IBM Corporation United States 174.14 ‐5% 164,251.0 198,046.0 79,919.0 18,552.0 23.2% ‐2.2% 2.5x 10.7xMuleSoft, Inc. * United States 24.33 ‐6% 3,065.4 3,222.9 187.7 (46.4) NM 70.3% 17.2x NM Nutanix, Inc. United States 18.77 ‐60% 2,688.1 2,333.0 603.5 (288.7) NM 83.4% 3.9x NM Opera Software ASA Norway 4.70 ‐41% 686.1 566.8 536.7 51.4 9.6% ‐12.9% 1.1x 11.0xOracle Corporation United States 44.61 ‐5% 183,555.9 178,578.9 37,429.0 14,535.0 38.8% 0.7% 4.8x 12.3xsalesforce.com, inc. * United States 82.49 ‐2% 58,361.7 58,862.3 8,392.0 504.8 6.0% 25.9% 7.0x 116.6xRapid7, Inc. United States 14.98 ‐ 637.5 565.5 157.4 (42.3) NM 42.4% 3.6x NM ServiceNow, Inc. United States 87.47 ‐8% 14,521.0 14,129.4 1,390.5 (68.7) NM 38.3% 10.2x NM Talend S.A. France 29.78 ‐14% 852.3 761.5 106.0 (24.6) NM 39.5% 7.2x NM Twilio Inc. United States 28.87 ‐59% 2,527.1 2,221.4 277.3 (34.1) NM 66.1% 8.0x NM Varonis Systems, Inc. United States 31.80 ‐1% 862.3 748.4 164.5 (13.5) NM 29.3% 4.6x NM
Adjusted Weighted Average 5.0x 14.4x
*Calculation is market cap weighted and excludes revenue multiples that are 2.0 standard deviations above the mean (13.0x)and EBITDA multiples that are 1.0 standard deviations above the mean (75.4x)
*Calculation is market cap weighted and excludes revenue multiples that are 2.0 standard deviations above the mean (10.9x)and EBITDA multiples that are 1.0 standard deviations above the mean (23.1x)

32 | M&A and Investment Summary March 2017
Information
The Information segment reported 13 transactions worth more than $330 million in value
Financial Information was the most active subsegment throughout the month with five transactions announced
Select Transactions:
• France‐based Infopro Digital’s acquisition of Incisive Media’s Financial, Risk, and Insurance information services division Insight for a reported $150 million
• Euromoney Institutional Investor’s $125 million purchase of RISI, a provider of price information and data for the global forest products industry, from AXIO Group
• The $12 million round of funding received by patient reported outcomes company Cognoa from Morningside
• The acquisition of L2, a provider of subscription‐based business intelligence solutions for digital competence, by Gartner
• Wellness and safety incentives program provider Global Behavioral Solutions’ acquisition of health and nutrition information company RivalHealth
*Intercontinental Exchange’s $7.4 billion acquisition of Interactive Data has been excluded to limit comparative distortions
# % $MM % # $MM # $MM # $MM
Financial Information 5 38% $30.0 9% 3 ‐ 0 ‐ 2 $30.0
Healthcare Information 4 31% 11.6 3% 3 ‐ 0 ‐ 1 11.6
Product/Price Information 2 15% 129.2 39% 1 125.0 0 ‐ 1 4.2
Credit/Risk Management Information 1 8% 149.8 45% 1 149.8 0 ‐ 0 ‐
Legal Information 1 8% 12.0 4% 0 ‐ 0 ‐ 1 12.0
Total 13 100% 332.6 100% 8 274.8 0 0.0 5 57.8
INFORMATION TRANSACTIONS BY SEGMENT BUYER/INVESTOR BREAKDOWN
Transactions Reported Value Strategic Buyout Venture/Growth Capital

33 | M&A and Investment Summary March 2017
InformationPublic Company Valuation (1/2)
($ in Millions, except stock price data)
Stock Price Chg % From Equity Ent. LTM LTM Margin LTM LTM Multiples Company Name Headquarters 03/31/17 52WK High Value Value Revenue EBITDA EBITDA Rev Growth EV/Rev EV/EBITDABroadridge Financial Solutions, Inc. United States $67.95 ‐5% $ 8,036.9 $ 9,007.1 $ 3,451.2 $ 635.1 18.4% 23.4% 2.6x 14.2xComputershare Limited Australia 10.74 ‐2% 5,867.2 7,162.1 2,030.0 436.2 21.5% 4.2% 3.5x 16.4xCoreLogic, Inc. United States 40.72 ‐6% 3,441.7 4,974.0 1,952.6 419.5 21.5% 27.8% 2.5x 11.9xCoStar Group, Inc. * United States 207.22 ‐8% 6,755.3 6,526.4 837.6 215.1 25.7% 17.7% 7.8x 30.3xDST Systems, Inc. United States 122.50 ‐5% 3,855.1 4,189.1 1,556.7 330.3 21.2% 5.6% 2.7x 12.7xThe Dun & Bradstreet Corporation United States 107.94 ‐24% 3,982.7 5,261.3 1,703.7 450.0 26.4% 4.1% 3.1x 11.7xEnvestnet, Inc. * United States 32.30 ‐22% 1,402.9 1,641.6 578.2 42.4 7.3% 37.4% 2.8x 38.7xEquifax Inc. United States 136.74 ‐1% 16,508.6 19,110.1 3,144.9 1,122.6 35.7% 18.1% 6.1x 17.0xExperian plc Ireland 20.39 ‐1% 18,944.2 21,997.6 4,607.0 1,401.0 30.4% ‐0.5% 4.8x 15.7xFactSet Research Systems Inc. United States 164.91 ‐10% 6,524.9 6,704.5 1,157.2 409.4 35.4% 8.3% 5.8x 16.4xFair Isaac Corporation United States 128.95 ‐3% 4,005.1 4,537.6 900.9 206.9 23.0% 6.1% 5.0x 21.9xFidelity National Information Services, Inc. United States 79.62 ‐5% 26,177.5 36,076.5 9,241.0 2,270.0 24.6% 40.1% 3.9x 15.9xFinancial Engines, Inc. * United States 43.55 ‐5% 2,682.0 2,548.1 423.9 75.5 17.8% 36.4% 6.0x 33.7xMoody's Corporation United States 112.04 ‐2% 21,401.9 22,737.7 3,604.2 1,641.5 45.5% 3.4% 6.3x 13.9xMorningstar, Inc. United States 78.60 ‐12% 3,374.3 3,320.6 798.6 231.5 29.0% 1.2% 4.2x 14.3xMSCI Inc. * United States 97.19 ‐11% 8,790.9 10,074.3 1,150.7 569.5 49.5% 7.0% 8.8x 17.7xReis, Inc. United States 17.90 ‐33% 205.5 184.0 47.5 9.5 20.0% ‐6.6% 3.9x 19.4xSEI Investments Co. United States 50.44 ‐4% 8,028.8 7,333.1 1,401.5 402.5 28.7% 5.0% 5.2x 18.2xThomson Reuters Corporation United States 43.16 ‐4% 31,236.3 37,035.1 11,166.0 2,383.0 21.3% ‐0.8% 3.3x 15.5xVerisk Analytics, Inc. United States 81.14 ‐7% 13,499.7 15,748.2 1,995.2 937.2 47.0% 13.3% 7.9x 16.8xWorkiva Inc. United States 15.65 ‐18% 645.8 604.2 178.6 (39.8) NM 23.0% 3.4x NM
Adjusted Weighted Average 4.8x 15.8x
Financial & Credit/Risk Management Information
*Calculation is market cap weighted and excludes revenue multiples that are 2.0 standard deviations above the mean (8.5x)and EBITDA multiples that are 1.0 standard deviations above the mean (25.9x)

34 | M&A and Investment Summary March 2017
InformationPublic Company Valuation (2/2)
($ in Millions, except stock price data)
Marketing Information
Stock Price Chg % From Equity Ent. LTM LTM Margin LTM LTM Multiples Company Name Headquarters 03/31/17 52WK High Value Value Revenue EBITDA EBITDA Rev Growth EV/Rev EV/EBITDAAcxiom Corporation United States $28.47 ‐6% $ 2,226.7 $ 2,325.7 $ 880.0 $ 91.0 10.3% 5.9% 2.6x 25.6xAlliance Data Systems Corporation * United States 249.00 ‐1% 13,925.4 33,014.9 7,138.1 1,462.4 20.5% 10.8% 4.6x 22.6xBrainjuicer Group Plc United Kingdom 9.86 ‐5% 121.0 111.2 38.6 7.9 20.5% 24.0% 2.9x 14.1xCello Group Plc United Kingdom 1.55 ‐1% 159.7 166.0 204.1 10.0 4.9% 5.1% 0.8x 16.5xcomScore, Inc. United States 21.59 ‐38% 1,236.6 1,122.7 368.8 37.1 10.1% 12.1% 3.0x 30.2xEbiquity plc United Kingdom 1.42 ‐17% 103.8 139.8 103.2 16.8 16.3% 28.6% 1.4x 8.3xGfK SE Germany 52.40 ‐6% 1,912.6 2,254.5 1,566.4 168.8 10.8% ‐3.9% 1.4x 13.4xHarte Hanks, Inc. United States 1.40 ‐51% 86.2 140.5 462.3 12.8 2.8% ‐2.4% 0.3x 11.0xInnerWorkings, Inc. United States 9.96 ‐9% 539.1 615.6 1,090.7 44.4 4.1% 6.0% 0.6x 13.9xIntage Holdings Inc. Japan 17.94 ‐14% 358.2 305.9 400.3 49.3 12.3% 2.6% 0.8x 6.2xIpsos SA France 31.12 ‐13% 1,296.9 1,904.0 1,881.9 210.3 11.2% ‐0.1% 1.0x 9.1xNeuStar, Inc. United States 33.15 ‐4% 1,828.3 2,590.6 1,209.8 465.0 38.4% 15.2% 2.1x 5.6xNielsen Holdings plc United Kingdom 41.31 ‐26% 14,770.0 22,138.0 6,309.0 1,619.0 25.7% 2.2% 3.5x 13.7xOnvia, Inc. * United States 4.40 ‐16% 31.7 24.6 24.6 0.2 0.7% 4.2% 1.0x 154.0xPearson plc United Kingdom 8.55 ‐31% 6,969.1 8,555.7 5,620.3 708.7 12.6% 1.9% 1.5x 12.1xYouGov plc United Kingdom 3.35 ‐3% 351.9 333.2 123.2 12.4 10.0% 20.4% 2.7x 26.9x
Adjusted Weighted Average 2.6x 16.7x
($ in Millions, except stock price data)
Other Information
Stock Price Chg % From Equity Ent. LTM LTM Margin LTM LTM Multiples Company Name Headquarters 03/31/17 52WK High Value Value Revenue EBITDA EBITDA Rev Growth EV/Rev EV/EBITDACentaur Media plc United Kingdom $0.52 ‐28% $ 75.3 $ 92.8 $ 89.5 $ 9.3 10.3% 2.8% 1.0x 10.0xCEB Inc. United States 78.60 ‐1% 2,519.6 3,259.2 949.8 200.6 21.1% 2.3% 3.4x 16.3xCogint, Inc. United States 4.65 ‐25% 250.1 290.1 186.8 (16.9) NM 1225.9% 1.6x NM Forrester Research Inc. United States 39.75 ‐10% 718.8 580.7 326.1 40.4 12.4% 3.9% 1.8x 14.4xGartner, Inc. * United States 107.99 ‐4% 8,961.0 9,181.2 2,444.5 400.9 16.4% 13.0% 3.8x 22.9xIHS Markit Ltd. * United Kingdom 41.95 ‐1% 16,908.7 20,540.8 3,030.5 871.0 28.7% 36.6% 6.8x 23.6xInforma plc United Kingdom 8.16 ‐14% 6,722.9 8,584.8 1,661.5 522.2 31.4% 11.0% 5.2x 16.4xNational Research Corporation United States 39.25 ‐15% 550.5 521.1 109.4 35.4 32.4% 6.9% 4.8x 14.7xNIC Inc. United States 20.20 ‐22% 1,348.8 1,221.8 317.9 83.3 26.2% 8.7% 3.8x 14.7xPremier, Inc. United States 31.83 ‐9% 1,613.8 1,740.5 1,271.9 381.9 30.0% 16.6% 1.4x 4.6xProofpoint, Inc. * United States 74.36 ‐16% 3,219.5 3,189.4 375.5 (41.7) NM 41.5% 8.5x NM
Reed Elsevier plc(1) United Kingdom 19.59 0% 39,792.1 45,701.7 8,513.2 2,552.1 30.0% 15.5% 5.4x 17.9xTarsus Group plc Ireland 3.57 ‐2% 401.2 492.2 84.4 23.1 27.4% ‐16.6% 5.8x 21.3xTechTarget, Inc. * United States 9.03 ‐4% 247.6 256.6 106.6 11.7 11.0% ‐4.7% 2.4x 22.0xThe Advisory Board Company United States 46.80 ‐9% 1,883.0 2,377.3 803.4 124.0 15.4% 4.6% 3.0x 19.2xUBM plc United Kingdom 9.57 ‐2% 3,767.9 4,566.0 1,065.5 296.1 27.8% 12.1% 4.3x 15.4xWolters Kluwer N.V. Netherlands 41.66 0% 11,970.7 14,048.3 4,536.0 1,185.5 26.1% 2.1% 3.1x 11.9x
*Calculation is market cap weighted and excludes revenue multiples that are 2.0 standard deviations above the mean (4.4x)and EBITDA multiples that are 1.0 standard deviations above the mean (59.4x)
(1) All financials are representative of the Reed Elsevier combined businesses, except per stock data, which represents Reed Elsevier (LSE:REL)
*Calculation is market cap weighted and excludes revenue multiples that are 2.0 standard deviations above the mean (8.0x)and EBITDA multiples that are 1.0 standard deviations above the mean (21.5x)

35 | M&A and Investment Summary March 2017
Business Services
The Business Services segment reported 62 transactions in March worth more than $1.6 billion in value
The IT Consulting subsegment accounted for 45 percent of segments total activity with 26 transactions
Select Transactions:
• Providence Equity Partners’ sale of online scuba certification and training services company PADI to a group of wealthy families and endowments for a reported $700 million
• Healthcare IT services company HCI Group’s $110 million sale to Tech Mahindra
• The acquisition of care benefits management company HealthHelp by WNS for $95 million
• The $62.5 million minority equity investment received by expert testimony and litigation support company Berkeley Research Groupfrom Endeavour Capital
• Deloitte’s acquisition of systems integrator and cloud consulting firm Day1 Solutions
# % $MM % # $MM # $MM # $MM
IT Consulting 26 42% $387.4 24% 22 $365.4 1 ‐ 3 $22.0
Corporate Training 12 19% 782.1 48% 6 ‐ 1 700.0 5 82.1
HR Consulting 2 3% ‐ 0% 0 ‐ 0 ‐ 2 ‐
Logistics 9 15% 209.8 13% 3 ‐ 1 ‐ 5 209.8
Management Consulting 1 2% ‐ 0% 1 ‐ 0 ‐ 0 ‐
Financial Consulting 0 0% ‐ 0% 0 ‐ 0 ‐ 0 ‐
Healthcare Consulting 0 0% ‐ 0% 0 ‐ 0 ‐ 0 ‐
Other* 12 19% 260.5 16% 10 194.3 0 0.0 2 66.2
Total 62 100% 1,639.8 100% 42 559.7 3 700.0 17 380.1
BUSINESS SERVICES TRANSACTIONS BY SEGMENT BUYER/INVESTOR BREAKDOWN
Transactions Reported Value Strategic Buyout Venture/Growth Capital

36 | M&A and Investment Summary March 2017
Business ServicesPublic Company Valuation (1/3)
($ in Millions, except stock price data)
Consulting
Stock Price Chg % From Equity Ent. LTM LTM Margin LTM LTM Multiples Company Name Headquarters 03/31/17 52WK High Value Value Revenue EBITDA EBITDA Rev Growth EV/Rev EV/EBITDAAccenture plc Ireland 119.88 ‐5% $ 74,335.5 $ 71,772.5 $ 33,757.2 $ 5,721.4 16.9% 6.8% 2.1x 12.5xCRA International, Inc. United States 35.33 ‐12% 301.8 249.0 324.8 26.8 8.2% 7.0% 0.8x 9.3xFTI Consulting, Inc. United States 41.17 ‐13% 1,657.5 1,806.8 1,810.4 195.6 10.8% 1.8% 1.0x 9.2xInformation Services Group, Inc. * United States 3.15 ‐27% 133.2 222.1 216.5 11.7 5.4% 3.5% 1.0x 19.0xNavigant Consulting, Inc. United States 22.86 ‐18% 1,072.3 1,199.0 938.7 142.1 15.1% 12.6% 1.3x 8.4xICF International, Inc. United States 41.30 ‐31% 785.4 1,038.8 1,185.1 111.9 9.4% 4.7% 0.9x 9.3xHuron Consulting Group Inc. United States 42.10 ‐35% 893.7 1,168.8 726.3 127.6 17.6% 3.9% 1.6x 9.2xThe Hackett Group, Inc. United States 19.49 ‐6% 568.9 556.1 259.9 39.4 15.1% 10.8% 2.1x 14.1x
Adjusted Weighted Average 1.3x 9.6x
($ in Millions, except stock price data)
HR Services
Stock Price Chg % From Equity Ent. LTM LTM Margin LTM LTM Multiples Company Name Headquarters 03/31/17 52WK High Value Value Revenue EBITDA EBITDA Rev Growth EV/Rev EV/EBITDAAutomatic Data Processing, Inc. United States 102.39 ‐3% $ 45,963.1 $ 45,219.4 $ 12,051.0 $ 2,733.1 22.7% 7.2% 3.8x 16.5xBarrett Business Services, Inc. United States 54.62 ‐18% 396.1 344.2 840.6 32.2 3.8% 13.5% 0.4x 10.7xCapita plc United Kingdom 7.07 ‐49% 4,704.2 7,628.8 6,061.3 777.0 12.8% 1.5% 1.3x 9.8xDHI Group, Inc. United States 3.95 ‐53% 199.1 260.9 227.0 47.1 20.7% ‐12.6% 1.1x 5.5xEdenred SA France 23.68 ‐1% 5,485.2 6,189.8 1,132.7 381.1 33.6% 7.3% 5.5x 16.2xInsperity, Inc. United States 88.65 ‐2% 1,861.7 1,678.3 2,941.3 120.0 4.1% 13.0% 0.6x 14.0xMarsh & McLennan Companies, Inc. United States 73.89 ‐2% 38,053.6 41,914.6 13,211.0 3,102.0 23.5% 2.5% 3.2x 13.5xPaychex, Inc. United States 58.90 ‐7% 21,159.7 20,811.2 3,106.6 1,337.7 43.1% 7.5% 6.7x 15.6xProfessional Diversity Network, Inc. United States 9.59 ‐31% 37.7 31.7 26.2 (1.8) NM ‐31.3% 1.2x NM TriNet Group, Inc. United States 28.90 ‐4% 1,973.0 2,248.0 3,060.3 152.9 5.0% 15.1% 0.7x 14.7xWageWorks, Inc. * United States 72.30 ‐10% 2,681.8 2,252.3 364.7 64.3 17.6% 9.1% 6.2x 35.0x
Adjusted Weighted Average 4.0x 15.0x
*Calculation is market cap weighted and excludes revenue multiples that are 2.0 standard deviations above the mean (2.3x)and EBITDA multiples that are 1.0 standard deviations above the mean (15.5x)
*Calculation is market cap weighted and excludes revenue multiples that are 2.0 standard deviations above the mean (7.6x)and EBITDA multiples that are 1.0 standard deviations above the mean (22.9x)

37 | M&A and Investment Summary March 2017
Business ServicesPublic Company Valuation (2/3)
($ in Millions, except stock price data)
IT Consulting
Stock Price Chg % From Equity Ent. LTM LTM Margin LTM LTM Multiples Company Name Headquarters 03/31/17 52WK High Value Value Revenue EBITDA EBITDA Rev Growth EV/Rev EV/EBITDAAccenture plc Ireland 119.88 ‐5% $ 74,335.5 $ 71,772.5 $ 33,757.2 $ 5,721.4 16.9% 6.8% 2.1x 12.5xAmdocs Limited United States 60.99 ‐3% 8,946.7 8,006.4 3,751.5 703.4 18.8% 2.5% 2.1x 11.4xBechtle AG Germany 108.80 ‐3% 2,284.8 2,184.0 3,265.7 177.2 5.4% 9.3% 0.7x 12.3xBooz Allen Hamilton Holding Corporation United States 35.39 ‐8% 5,306.9 6,521.2 5,646.5 520.1 9.2% 6.1% 1.2x 12.5xBusiness & Decision SA * France 7.58 ‐10% 59.8 90.0 254.3 4.3 NA 4.2% 0.4x 21.1xCap Gemini S.A. France 92.56 ‐4% 15,167.0 16,859.7 13,236.6 1,670.0 12.6% 5.2% 1.3x 10.1xCerner Corporation * United States 58.85 ‐13% 19,404.0 19,611.3 4,707.9 1,315.0 27.9% 8.2% 4.2x 14.9xCGI Group Inc. Canada 47.82 ‐5% 14,111.1 15,255.7 7,947.5 1,352.8 17.0% 2.4% 1.9x 11.3xCognizant Technology Solutions Corporation United States 59.52 ‐6% 36,226.3 31,935.3 13,487.0 2,668.0 19.8% 8.6% 2.4x 12.0xComputer Sciences Corporation United States 69.01 ‐8% 9,745.5 11,846.5 7,525.0 931.0 12.4% 4.4% 1.6x 12.7xDigi International Inc. United States 11.90 ‐16% 314.5 181.4 197.9 20.4 10.3% ‐4.3% 0.9x 8.9xGlobant S.A. * Luxembourg 36.40 ‐23% 1,259.4 1,198.9 322.9 59.9 18.5% 27.2% 3.7x 20.0xInternational Business Machines Corporation United States 174.14 ‐5% 164,251.0 198,046.0 79,919.0 18,552.0 23.2% ‐2.2% 2.5x 10.7xInfosys Limited India 15.78 ‐20% 36,060.1 31,357.0 10,085.0 2,787.0 27.6% 9.5% 3.1x 11.3xITS Group France 7.59 ‐6% 58.1 60.8 212.2 8.1 3.8% 1.7% 0.3x 7.5xNCI, Inc. United States 15.05 ‐2% 203.8 202.8 322.4 28.7 8.9% ‐3.2% 0.6x 7.1xNTT Data Corporation Japan 47.35 ‐13% 13,282.9 17,370.9 14,136.8 2,226.2 15.7% 3.8% 1.2x 7.8xPerficient, Inc. United States 17.36 ‐23% 614.9 636.8 468.5 50.0 10.7% 2.3% 1.4x 12.7xPresidio, Inc. United States 15.49 ‐1% 1,404.7 2,554.2 2,799.8 195.5 7.0% 0.0% 0.9x 13.1xReply S.p.A. Italy 158.36 ‐1% 1,481.0 1,450.8 824.2 105.7 12.8% 8.2% 1.8x 13.7xSQLi France 43.73 ‐5% 161.5 164.6 205.9 14.9 7.2% 7.3% 0.8x 11.1xTata Consultancy Services Limited * India 37.53 ‐11% 73,951.5 68,046.7 17,194.0 4,710.5 27.4% 11.8% 4.0x 14.4xWipro Limited India 7.95 ‐15% 19,224.3 16,558.1 8,052.0 1,606.6 20.0% 9.9% 2.1x 10.3x
Adjusted Weighted Average 2.5x 11.8x
*Calculation is market cap weighted and excludes revenue multiples that are 2.0 standard deviations above the mean (4.0x)and EBITDA multiples that are 1.0 standard deviations above the mean (15.5x)

38 | M&A and Investment Summary March 2017
Business ServicesPublic Company Valuation (3/3)
($ in Millions, except stock price data)
Outsourced Services
Stock Price Chg % From Equity Ent. LTM LTM Margin LTM LTM Multiples Company Name Headquarters 03/31/17 52WK High Value Value Revenue EBITDA EBITDA Rev Growth EV/Rev EV/EBITDAAMREP Corporation United States $6.41 ‐21% $ 51.8 $ 42.6 $ 40.6 $ (1.2) NM ‐5.3% 1.0x NM Cenveo, Inc. United States 5.02 ‐52% 42.9 1,056.1 1,660.0 136.7 8.2% ‐4.7% 0.6x 7.7xCommunisis plc United Kingdom 0.69 ‐4% 144.2 170.9 446.9 34.5 7.7% 2.2% 0.4x 5.0xContax Participações S.A. Brazil 2.06 ‐63% 8.5 359.5 627.7 30.8 4.9% ‐14.7% 0.6x 11.7xConvergys Corporation United States 21.15 ‐32% 2,000.0 2,147.6 2,913.6 365.4 12.5% ‐1.3% 0.7x 5.9xCSG Systems International, Inc. United States 37.81 ‐26% 1,241.7 1,381.4 761.0 159.8 21.0% 1.1% 1.8x 8.6xElanders AB (publ) Sweden 10.97 ‐18% 388.0 627.3 692.4 55.2 8.0% 48.4% 0.9x 11.4xEniro AB Sweden 0.04 ‐66% 19.2 205.5 216.7 47.2 21.8% ‐19.3% 0.9x 4.4xExlservice Holdings, Inc. * United States 47.36 ‐14% 1,600.6 1,419.7 686.0 99.1 14.4% 9.1% 2.1x 14.3xFirstsource Solutions Limited India 0.64 ‐22% 439.0 518.8 517.4 65.4 12.6% 13.9% 1.0x 7.9xGenpact Limited * Bermuda 24.76 ‐13% 4,926.5 5,406.9 2,570.8 420.6 16.4% 4.5% 2.1x 12.9xInnerWorkings, Inc. United States 9.96 ‐9% 539.1 615.6 1,090.7 44.4 4.1% 6.0% 0.6x 13.9xLuxoft Holding, Inc. * SwitzerlandSwitzerland 62.55 ‐5% 2,076.5 1,979.0 750.6 96.1 12.8% 21.3% 2.6x 20.6xMAXIMUS, Inc. * United States 62.20 ‐1% 4,031.4 4,115.3 2,454.2 380.4 15.5% 12.1% 1.7x 10.8xQuad/Graphics, Inc. United States 25.24 ‐14% 1,317.3 2,444.5 4,329.5 480.1 11.1% ‐5.8% 0.6x 5.1xQuintiles IMS Holdings, Inc. * United States 80.53 ‐3% 18,999.0 25,188.0 5,364.0 1,073.0 20.0% 24.0% 4.7x 23.5xR.R. Donnelley & Sons Company United States 12.11 ‐80% 846.3 2,601.0 6,895.7 469.1 6.8% ‐0.6% 0.4x 5.5xSerco Group plc United Kingdom 1.45 ‐24% 1,574.7 1,764.7 3,717.7 117.3 3.2% ‐5.2% 0.5x 15.0xSt Ives plc United Kingdom 0.66 ‐77% 94.7 182.9 472.4 53.0 11.2% 6.1% 0.4x 3.5xStarTek, Inc. United States 8.69 ‐11% 137.4 170.7 307.2 15.5 5.0% 8.9% 0.6x 11.0xSYNNEX Corporation United States 111.94 ‐13% 4,469.1 5,263.0 14,457.1 545.4 3.8% 9.0% 0.4x 9.6xSykes Enterprises, Incorporated United States 29.40 ‐6% 1,240.1 1,240.4 1,460.0 163.6 11.2% 13.5% 0.8x 7.6xTeleperformance SE * France 108.27 ‐6% 6,129.6 7,922.8 3,852.0 545.1 14.2% 7.4% 2.1x 14.5xTeleTech Holdings, Inc. United States 29.60 ‐7% 1,358.4 1,527.6 1,275.3 157.9 12.4% ‐0.9% 1.2x 9.7xtranscosmos inc. Japan 23.46 ‐20% 973.1 875.8 2,030.8 99.9 4.9% 8.8% 0.4x 8.8xTranscontinental Inc. Canada 18.44 ‐4% 1,426.8 1,637.5 1,544.0 303.0 19.6% 0.6% 1.1x 5.4xCimpress N.V. * Netherlands 86.19 ‐17% 2,680.4 3,707.1 1,936.6 146.7 7.6% 21.6% 1.9x 25.3xWest Corporation * United States 24.42 ‐6% 2,035.4 5,022.4 2,292.0 653.7 28.5% 0.5% 2.2x 7.7xXchanging Solutions Limited * India 0.74 ‐55% 82.4 65.9 42.2 4.1 9.8% ‐2.6% 1.6x 16.0x
Adjusted Weighted Average 1.1x 9.2x
*Calculation is market cap weighted and excludes revenue multiples that are 2.0 standard deviations above the mean (1.3x)and EBITDA multiples that are 1.0 standard deviations above the mean (13.1x)

39 | M&A and Investment Summary March 2017
PPLLC IndicesValuation Summary
Public Company Index MEAN MEDIAN W. AVG ADJ. W. AVG*US‐based Digital Media and Internet 6.0x 2.2x 7.2x 2.2xInternationally‐based Digital Media and Internet 5.9x 2.9x 7.0x 2.2xUS‐based eCommerce 2.7x 2.0x 4.1x 1.9xInternationally‐based eCommerce 3.3x 1.4x 9.9x 1.9xUS‐based Digital Advertising 4.2x 1.9x 9.6x 2.0xInternationally‐based Digital Advertising 4.2x 2.1x 11.9x 2.4xUS‐based Marketing Technology 3.8x 3.0x 4.8x 2.9xInternationally‐based Marketing Technology 4.9x 3.5x 5.8x 5.4xAgency 1.2x 1.3x 1.7x 1.7xMarketing Services 1.8x 1.6x 3.1x 2.9xTraditional Media 2.8x 2.5x 3.7x 3.5xSoftware 5.0x 4.4x 4.9x 4.8xInformation 4.0x 3.5x 5.8x 4.8xBusiness Services 1.3x 1.0x 2.5x 2.2x
deviations above the mean and EBITDA multiples that are 2 standard deviations above the mean
Current Summary Trading Valuation InformationRevenue Multiples
As of close of business on 03/31/17
*Calculation is market cap weighted and excludes revenue multiples that are 3 standard

40 | M&A and Investment Summary March 2017
PPLLC IndicesValuation Summary
Public Company Index MEAN MEDIAN W. AVG ADJ. W. AVG*US‐based Digital Media and Internet 14.3x 14.5x 15.2x 12.9xInternationally‐based Digital Media and Internet 20.1x 14.3x 22.1x 14.6xUS‐based eCommerce 16.4x 15.0x 17.9x 12.2xInternationally‐based eCommerce 20.0x 14.6x 27.3x 10.4xUS‐based Digital Advertising 33.5x 15.6x 20.8x 11.0xInternationally‐based Digital Advertising 18.2x 14.3x 28.3x 12.0xUS‐based Marketing Technology 20.9x 17.3x 24.9x 13.1xInternationally‐based Marketing Technology 21.6x 17.9x 18.7x 18.3xAgency 11.0x 10.1x 10.2x 10.1xMarketing Services 12.3x 10.4x 16.2x 14.6xTraditional Media 14.0x 10.1x 12.1x 12.1xSoftware 31.9x 18.6x 21.2x 15.0xInformation 20.9x 16.3x 22.1x 22.4xBusiness Services 11.4x 10.3x 13.0x 11.9x
deviations above the mean and EBITDA multiples that are 2 standard deviations above the mean
Current Summary Trading Valuation Information
EBITDA Multiples
As of close of business on 03/31/17
*Calculation is market cap weighted and excludes revenue multiples that are 3 standard

41 | M&A and Investment Summary March 2017
Digital Advertising
PPLLC IndicesLTM Share Pricing Trends
Note: LTM as of 3/31/2017
LTM Index Performance
• S&P 500 – 14.0 %
• Digital Media/Commerce – 24.9 %
• Traditional Media – 17.2 %
LTM Index Performance
• S&P 500 – 14.0 %
• Marketing Technology – 17.4 %
LTM Index Performance
• S&P 500 – 14.0 %
• Digital Advertising – 11.8 %
LTM Index Performance
• S&P 500 – 14.0 %
• Agency – 1.3 %
• Marketing Services – 13.5 %
Digital Media/Commerce and Traditional Media
Software
Marketing Technology
LTM Index Performance
• S&P 500 – 14.0 %
• Software – 15.9 %
Agency & Marketing Services
Information & Business Services LTM Index Performance
• S&P 500 – 14.0 %
• Information – 10.3 %
• Business Services – 11.0 %
80%
95%
110%
125%
140%
Apr‐16 Jun‐16 Aug‐16 Oct‐16 Dec‐16 Feb‐17
Index Performance (%
)
Traditional Media S&P 500 Index (^SPX) Digital Media/Commerce
80%
90%
100%
110%
120%
130%
140%
150%
Apr‐16 Jun‐16 Aug‐16 Oct‐16 Dec‐16 Feb‐17
Index Performance (%
)
Digital Advertising S&P 500 Index (^SPX)
80%
90%
100%
110%
120%
130%
140%
150%
Apr‐16 Jun‐16 Aug‐16 Oct‐16 Dec‐16 Feb‐17
Index Performance (%
)
Marketing Technology S&P 500 Index (^SPX)
80%
90%
100%
110%
120%
130%
140%
150%
Apr‐16 Jun‐16 Aug‐16 Oct‐16 Dec‐16 Feb‐17
Index Performance (%
)
Agency Marketing Services S&P 500 Index (^SPX)
80%
90%
100%
110%
120%
130%
140%
150%
Apr‐16 Jun‐16 Aug‐16 Oct‐16 Dec‐16 Feb‐17
Index Performance (%
)
Software S&P 500 Index (^SPX)
80%
90%
100%
110%
120%
130%
140%
150%
Apr‐16 Jun‐16 Aug‐16 Oct‐16 Dec‐16 Feb‐17
Index Performance (%
)
Information Business Services S&P 500 Index (^SPX)

42 | M&A and Investment Summary March 2017
All Segments($ in Millions)
Strategic TransactionsTarget Target Segment Buyer/Investor Reported TV
StrategicValues Disclosed
DH Corporation Software Misys plc 3,458.7$ Cis ion, Inc. Marketing Technology Capitol Acquis i tion Corp. I I I 2,400.0 Nimble Storage, Inc. Software Hewlett Packard Enterprise Company 1,200.0 SOUQ.com Digi ta l Media/Commerce Amazon.com, Inc. 650.0 Veracode, Inc. Software CA Technologies 614.0 Tagetik Software s rl Software Wolters Kluwer NV 319.5 Teads , Inc. Digi ta l Advertis ing Altice N.V. 308.0 Sotera Defense Solutions , Inc. Bus iness Services KEYW Corporation 235.0 BI‐SAM Technologies S.A. Software FactSet Research Systems, Inc. 205.2 El iza Corporation Software HMS Holdings 170.0 Incis ive Media Limited, Ins ight Divis ion Information Infopro Digi ta l SAS 149.8 Show Management, Inc. Tradi tional Media Informa PLC 133.0 RISI, Inc. Information Euromoney Insti tutional Investor plc 125.0 The HCI Group Bus iness Services Tech Mahindra Limited 110.0 LightCyber, Inc. Software Palo Alto Networks 105.0 US Weekly Tradi tional Media American Media, Inc. 100.0 Pubridge Bus iness Services Media Do Co., Ltd. 99.3 HealthHelp, Inc. Bus iness Services WNS Holdings Ltd. 95.0 ModCloth, Inc. Digi ta l Media/Commerce Jet.com, Inc. 62.5 i f(we) Digi ta l Media/Commerce MeetMe, Inc. 60.0 NoWait, Inc. Marketing Technology Yelp!, Inc. 40.0 Ingresso Group Limited Marketing Technology accesso Techology Group, plc 36.6 DataRPM Corporation Software Progress Software Corporation 30.0 Daisuki Digi ta l Media/Commerce BANDAI NAMCO Holdings , Inc. 29.1 BumpCl ick LLC Digi ta l Media/Commerce Function(x), Inc. 25.0 Rx Networks Software Bei jing BDStar Navigation 23.3 Hermo Creative (M) Sdn Bhd Digi ta l Media/Commerce is tyle, Inc. 22.0 Keystone Logic Bus iness Services Zensar Technologies Ltd. 20.4 Flocktory Ltd. Marketing Technology Qiwi plc 17.8 PleaseTech Ltd. Software Ideagen Plc 15.0 Tennis Media Co. LLC Tradi tional Media Sincla i r Broadcast Group, Inc. 14.0 Pri tle N.V. Software BinckBank N.V. 13.4 CyberGhost S.R.L. Software Crossrider Plc 11.5 Kleding BV Digi ta l Advertis ing The Mitula Group Limited 11.2 Art People A/S Tradi tional Media Storytel AB 10.6 Vis ible Measures Corporation Marketing Technology AcuityAds Inc. 10.0 adflex communications , Inc. Agency & Marketing Services Tri ‐Stage Inc. 9.9 Regent Publ ishing Services Tradi tional Media 1010 Printing Group Limited 9.3 Greenview Data, Inc. Software Zix Corporation 8.1 Ontology‐Partners Limited Software EXFO, Inc. 7.6 Emmis Communications , Substantia l Publ ishing Assets Tradi tional Media Hour Media, LLC 6.5 Global Group Dia log Solutions AG Agency & Marketing Services Bisnode AB 6.1 My Play Company Limited Digi ta l Media/Commerce iSentric Limited 4.6

43 | M&A and Investment Summary March 2017
All Segments($ in Millions)
Strategic TransactionsTarget Target Segment Buyer/Investor Reported TV
StrategicUndisclosed
3ti Solutions , Inc. Agency & Marketing Services WPP Group ‐$ ADS Media Group, Inc. Agency & Marketing Services Fus ion92 ‐ Agence79 Agency & Marketing Services Havas ‐ Anagram Agency & Marketing Services Digi lant Inc. ‐ Audience Partners Agency & Marketing Services Altice N.V. ‐ BD Austra l ia Agency & Marketing Services Havas ‐ Bri l l iantservice Co., Ltd. Agency & Marketing Services Cognizant Technology Solutions Corporation ‐ Bruketa&Zinic OM d.o.o. Agency & Marketing Services WPP Group ‐ CloudRaker, Inc. Agency & Marketing Services Altavia Group ‐ Combera Group GmbH Agency & Marketing Services Advantage Sales & Marketing, LLC ‐ ComboApp, Inc. Agency & Marketing Services Digi117 Ltd. ‐ Equator Ltd. Agency & Marketing Services Matthews International Corporation ‐ Exclus ive Connections LLC Agency & Marketing Services Excentus Corporation ‐ Exequo SA Agency & Marketing Services Lionbridge Technologies , Inc. ‐ Firs t Annapol is Consulting, Inc. Agency & Marketing Services Accenture plc ‐ Ful lSense Agency & Marketing Services Passage Pieton ‐ Glue PR Ltd. Agency & Marketing Services W Communications ‐ GPShopper, LLC Agency & Marketing Services Synchrony Financia l ‐ Grant Group Agency & Marketing Services Dentsu, Inc. ‐ Innovative Marketing Actions Agency & Marketing Services DKSH Management Ltd. ‐ Pineapple PR Agency & Marketing Services Interpubl ic Group of Companies , Inc. ‐ Polvora Advertis ing, Inc. Agency & Marketing Services Saturno Des ign LLC ‐ Pop2Li fe Agency & Marketing Services Conde Nast ‐ Ratio Interactive LLC Agency & Marketing Services Globant S.A. ‐ ShapiroWalker Des ign Agency & Marketing Services Elephant In The Room ‐ Shine Des ign Agency & Marketing Services Stocks Taylor Benson ‐ Tomorro LLC Agency & Marketing Services The Shipyard, LLC ‐ uFluencer Group, Inc. Agency & Marketing Services Gushcloud ‐ Accume Partners LLC Bus iness Services Aporia Solutions , Inc. ‐ AdvancedEPM Consulting, Inc. Bus iness Services Datavai l Corporation ‐ Avantida NV Bus iness Services INTTRA ‐ Big Drop Pvt. Ltd. Bus iness Services Appworks Technologies Private Limited ‐ Cardio Partner Resources LLC Bus iness Services DXE Medica l , Inc. ‐ Castle Copy Service, Inc. Bus iness Services Depos i tion Solutions LLC ‐ Chi ldcare Education Insti tute LLC Bus iness Services Excel l igence Learning Corporation ‐ CloudLabs , Inc. Bus iness Services Udaci ty, Inc. ‐ CloudMGR Bus iness Services Cloudabi l i ty, Inc. ‐

44 | M&A and Investment Summary March 2017
All Segments($ in Millions)
Strategic TransactionsTarget Target Segment Buyer/Investor Reported TV
StrategicUndisclosed
Curvature LLC Bus iness Services SMS Systems Maintenance Services , Inc. ‐$ Davies Consulting LLC Bus iness Services Accenture plc ‐ Day1 Solutions LLC Bus iness Services Deloi tte LLP ‐ derivIT Solutions Pte Ltd. Bus iness Services Luxoft Holding, Inc. ‐ e4e, Inc. Bus iness Services nThrive, Inc. ‐ Elk Grove Graphics Bus iness Services The Vomela Companies ‐ Focus Group Europe Ltd. Bus iness Services Accenture plc ‐ FutureStaff Bus iness Services MAU Workforce Solutions ‐ GAM Consult s .a . Bus iness Services Amexio ‐ Interfi le Bus iness Services Atento S.A. ‐ Itel ios SAS Bus iness Services Capgemini Group ‐ Lenmar Consulting Bus iness Services Kel l ton Tech Solutions Ltd. ‐ Magnus Management Group LLC Bus iness Services NXTKey Corporation ‐ Mesclado SA Bus iness Services Qvest Media GmbH ‐ Netcraft Ltd. Bus iness Services Elad Software Systems Ltd. ‐ Orion Financia l Group, Inc. Bus iness Services MetaSource LLC ‐ Pivota l Education Ltd. Bus iness Services Cris i s Prevention Insti tute ‐ Premium Transportation Logis tics LLC Bus iness Services Magnate Worldwide LLC ‐ Rx Medica l Web LLC Bus iness Services Empire Medica l Tra ining, Inc. ‐ SharePointXperts LLC Bus iness Services Bamboo Solutions Corporation ‐ Software Link, Inc. Bus iness Services Kerr Consulting ‐ spm GmbH Bus iness Services Rel ias Learning ‐ Stel l igent Systems LLC Bus iness Services HOSTING.com ‐ Structured Network Solutions , Inc. Bus iness Services Orion Systems Integrators , Inc. ‐ Stuart SAS Bus iness Services La Poste ‐ The Vintage Group Bus iness Services Toppan Printing Co. Ltd. ‐ Tivi tie Bus iness Services Wicresoft ‐ Vernal i s Group, Inc. Bus iness Services Orion Systems Integrators , Inc. ‐ Airl ineFl ightSearch.com Digi ta l Advertis ing Emedia Group, Inc. ‐ CompareHotels .Onl ine Digi ta l Advertis ing Emedia Group, Inc. ‐ Groupon Singapore Limited Digi ta l Advertis ing KFi t Holdings Pte. Ltd. ‐ Headway Digi ta l Digi ta l Adverti s ing Entravis ion Communications Corporation ‐ Li ft Network Digi ta l Advertis ing Stratacache, Inc. ‐ MyBui lder Limited Digi ta l Adverti s ing HomeAdvisor, Inc. ‐ Statiq Limited Digi ta l Advertis ing Telefonica , S.A. ‐ TruEngage Digi ta l Advertis ing PK4 Media, Inc. ‐ VaycayHero, Inc. Digi ta l Advertis ing RedAwning.com, Inc. ‐ Bookouture Digi ta l Media/Commerce Hachette Book Group, Inc. ‐ Cappsool Technologies Ltd. Digi ta l Media/Commerce Natura l Intel l igence Ltd. ‐ ChimeraCompanyGames Digi ta l Media/Commerce Momentous Enterta inment Group, Inc. ‐ Damai .cn Digi ta l Media/Commerce Al ibaba Group Holding Ltd. ‐

45 | M&A and Investment Summary March 2017
All Segments($ in Millions)
Strategic TransactionsTarget Target Segment Buyer/Investor Reported TV
StrategicUndisclosed
DogVacay, Inc. Digi ta l Media/Commerce A Place for Rover ‐$ FaceCar Digi ta l Media/Commerce Vivu Technology Development ‐ Fanatic Software, Inc. Digi ta l Media/Commerce Complete XRM, Inc. ‐ Fini tePaths , Inc. Digi ta l Media/Commerce Lyft, Inc. ‐ Gothamist LLC Digi ta l Media/Commerce DNAinfo ‐ Growtopia Digi ta l Media/Commerce Ubisoft Holdings , Inc. ‐ HomeExchange.com Digi ta l Media/Commerce GuestToGuest ‐ Imoji Digi ta l Media/Commerce Giphy, Inc. ‐ Jel ly Industries , Inc. Digi ta l Media/Commerce Pinterest, Inc. ‐ JustShareIt, Inc. Digi ta l Media/Commerce Fox Rent A Car, Inc. ‐ Kite.ly Digi ta l Media/Commerce Canon, Inc. ‐ Legacy.com, Inc. Digi ta l Media/Commerce Pamplona Capita l Management LLP ‐ MightyTV, Inc. Digi ta l Media/Commerce Spoti fy Ltd. ‐ Namefy.co Digi ta l Media/Commerce AppSwarm, Inc. ‐ Nimbuzz B.V. Digi ta l Media/Commerce Mara Socia l Media ‐ OneCl ickWash Digi ta l Media/Commerce PickMyLaundry ‐ Pragmatix Studio Digi ta l Media/Commerce Fuzic, Inc. ‐ Publ ic Auction Finder Digi ta l Media/Commerce Auction Media Group ‐ Rooster, Inc. Digi ta l Media/Commerce Spacer.com, Inc. ‐ Shopcade Digi ta l Media/Commerce Lagardere SCA ‐ Si lvercar, Inc. Digi ta l Media/Commerce Audi AG ‐ Sonalytic Ltd. Digi ta l Media/Commerce Spoti fy Ltd. ‐ The Creative Assembly Limited Digi ta l Media/Commerce SEGA Corporation ‐ True&Co Digi ta l Media/Commerce PVH Corporation ‐ Vira lNova LLC Digi ta l Media/Commerce BumpCl ick LLC ‐ Workflow.is Digi ta l Media/Commerce Apple Inc. ‐ AdviceIQ Information Financia l Media Exchange LLC ‐ DISCUS Information Embark Group ‐ L2, Inc. Information Gartner, Inc. ‐ Polyglot Systems, Inc. Information Firs t DataBank, Inc. ‐ Report on Medicare Compl iance Information The Health Care Compl iance Association ‐ Riva lHealth, LLC Information Global Behaviora l Solutions LLC ‐ Acculynk Marketing Technology Firs t Data Corporation ‐ Adam Software NV Marketing Technology Aprimo, LLC ‐ Aeria l ink, Inc. Marketing Technology CSF Corporation ‐ Bizzy, Inc. Marketing Technology SendGrid ‐ Buzzcapture B.V. Marketing Technology OBI4wan B.V. ‐ Capgemini , IBX Bus iness Network Marketing Technology Tradeshi ft, Inc. ‐ ChowBOT Marketing Technology ShopKeep.com, Inc. ‐ Compass Marketing Technology Sage Group plc ‐ Darwin Pricing LLC Marketing Technology SPOSEA Holding BV ‐

46 | M&A and Investment Summary March 2017
All Segments($ in Millions)
Strategic TransactionsTarget Target Segment Buyer/Investor Reported TV
StrategicUndisclosed
HipMob Marketing Technology Conversocia l ‐$ IneoQuest Technologies , Inc. Marketing Technology Telestream, Inc. ‐ Kaggle, Inc. Marketing Technology Google, Inc. ‐ Kaybus , Inc. Marketing Technology Prysm, Inc. ‐ Loopd, Inc. Marketing Technology etouches , Inc. ‐ Lymber Wel lness , Inc. Marketing Technology MINDBODY, Inc. ‐ MarketSpace Technologies , Inc. Marketing Technology Tickr, Inc. ‐ Nari tiv, Snapchat Analytics Platform Marketing Technology HootSuite Media, Inc. ‐ NetSource Communications , Inc. Marketing Technology Venture Technologies , Inc. ‐ Novaetus , Inc. Marketing Technology SurveyVita ls , Inc. ‐ nvite Marketing Technology EventBri te ‐ ObjectVideo, Inc. Marketing Technology Alarm.com ‐ Origin Events (Scotland) Ltd. Marketing Technology Red Pepper Events ‐ Poken, Inc. Marketing Technology GES Expos i tion Services ‐ Reach150 Socia l , Inc. Marketing Technology SmartZip Analytics , Inc. ‐ Ribyt Marketing Technology Conde Nast ‐ Seeding Al l iance GmbH Marketing Technology Stroer Digi ta l Group GmbH ‐ Tagga Media, Inc. Marketing Technology Campaign Monitor Pty Ltd. ‐ Thinkbox Software, Inc. Marketing Technology Amazon.com, Inc. ‐ WebSl ice Limited Marketing Technology Si teTech Solutions Ltd. ‐ Zen Planner, LLC Marketing Technology Daxko, Inc. ‐ 440 Labs , Inc. Software Ecoark Holdings , Inc. ‐ Amris Software PIXID SAS ‐ Appbridge Software, Inc. Software Google, Inc. ‐ Appra isa l Scope Software Mercury Network LLC ‐ BigRoad, Inc. Software Complete Innovations , Inc. ‐ Centrici ty Contingent Staffing Software HealthcareSource HR, Inc. ‐ Comm Solutions Company Software Optiv Securi ty, Inc. ‐ ConEst Software Sys tems, Inc. Software JDM Technology Group ‐ Core Informatics LLC Software Thermo Fisher Scienti fic Inc. ‐ Corona Labs , Inc. Software Appodeal , Inc. ‐ Cumuloci ty GmbH Software Software AG ‐ Do.com Software Amazon.com, Inc. ‐ Dutch Cloud B.V. Software Denit Hosting Solutions B.V. ‐ Electroni fie, Inc. Software Trumid Financia l LLC ‐ EveryMove, Inc. Software higi SH l l c ‐ Fairsa i l Limited Software Sage Group plc ‐ Fyre LLC Software Peoplenet, Inc. ‐ Geotech Vigis Software Parera Groupe ‐ Gitter Software GitLab B.V. ‐ HealthSystems Software Quatris Health ‐

47 | M&A and Investment Summary March 2017
All Segments($ in Millions)
Strategic TransactionsTarget Target Segment Buyer/Investor Reported TV
StrategicUndisclosed
Hummingbi l l , Inc. Software KredX ‐$ InfraAdvice Sweden AB Software Techstep ASA ‐ LeChat, Inc. Software 8x8, Inc. ‐ ManyWho Software Del l , Inc. ‐ Merlon Software Corporation Software XYPRO Technology Corporation ‐ Message Automation Limited Software Broadridge Financia l Solutions , Inc. ‐ NuData Securi ty, Inc. Software MasterCard, Inc. ‐ PocketRx Software Digi ta l Pharmacis t, Inc. ‐ PrepMo, Inc. Software Huddle, Inc. ‐ Rage Frameworks Inc. Software Genpact Limited ‐ RecordLion, Inc. Software Gimmal LLC ‐ Safe Computing Limited Software Access UK Limited ‐ Savcor Group Oy, Forestry Bus iness Assets Software Trimble Navigation Limited ‐ ShipNet AS Software Constel lation Software, Inc. ‐ SOASTA, Inc. Software Akamai Technologies , Inc. ‐ StepOne, Inc. Software FanThreeSixty LLC ‐ Stormpath, Inc. Software Okta, Inc. ‐ SwissComply AG Software Evolute Group AG ‐ Tapglue UG Software Localytics , Inc. ‐ TFG Financia l Systems Software NumeriX LLC ‐ TreatMD Software GlobalMed, Inc. ‐ Uppl ication Software Technologies S.L. Software Mobus i Mobi le Adverti s ing s .l . ‐ VERDE VDI Software Ncomputing ‐ Vocus Group, Cloud Col laboration Practice Assets Software West Corporation ‐ Webtrends , Inc., Infini ty Assets Software Oracle Corporation ‐ WhiteSpace Health, Inc. Software Omega Healthcare Management Services ‐ 24‐7 Enterta inment GmbH Traditional Media 7digi ta l Group PLC ‐ Beachsound, Inc. Tradi tional Media 3G Productions , Inc. ‐ Bul letin Intel l igence LLC Traditional Media Cis ion, Inc. ‐ Digi ta l RodeoTV Traditional Media WhereverTV Broadcasting Corporation, Inc. ‐ Euromedia Group K.S. Tradi tional Media Rockaway Capita l SE ‐ GG Media Network Traditional Media American Leisure Holdings , Inc. ‐ Le Young Pictures Traditional Media LeEco ‐ Lighthouse Independent Media Pte Ltd. Tradi tional Media Forum Media Group GmbH ‐ Metrosource Publ ishing, Inc. Tradi tional Media Davler Media Group ‐ NatureVis ion TV Traditional Media Stingray Digi ta l Group, Inc. ‐ Nitrogen Studios Canada, Inc. Tradi tional Media Cines i te Studios Group ‐ Reach Magazine Traditional Media Valass is Communications , Inc. ‐ Tetra Media Studio SAS Traditional Media ITV plc ‐

48 | M&A and Investment Summary March 2017
All Segments($ in Millions)
Buyout Transactions Target Target Segment Buyer/Investor Reported TV
Buyout DealsValues Disclosed
PADI Bus iness Services Providence Equity Partners , Inc. 700.0$ ITRS Group Ltd. Software TA Associates 140.6 MTG Tradi tional Media Providence Equity Partners , Inc. 122.5 Verisys Corporation Software Spectrum Equity Inves tors , LP 75.0
Target Target Segment Buyer/Investor Reported TV Buyout DealsUndisclosed
Geneva Technica l Services LLC Bus iness Services Highlands Ventures ‐$ Simpl i fied Logis ti cs LLC Bus iness Services CI Capita l Partners LLC ‐ Ageras A/S Digi ta l Media/Commerce Investcorp ‐ Corry Auto Dealers Exchange Digi ta l Media/Commerce Huron Capita l Partners , LLC ‐ Bracket Software Genstar Capita l , LP ‐ CarePayment Technologies , Inc. Software Cedar Spring Capita l ‐ Geomedia SAS Software Capzanine ‐ NetDocuments Software Clearlake Capita l Group ‐ Xceptor Software CBPE Capita l LLP ‐

49 | M&A and Investment Summary March 2017
All Segments($ in Millions)
Venture/Growth Capital Transactions Target Target Segment Buyer/Investor Reported TV VC/Growth CapitalValues Disclosed
Fl ipkart Internet Private Limited Digi ta l Media/Commerce Tencent Holdings Ltd. 1,000.0$ UCAR Technology, Inc. Digi ta l Media/Commerce AXA Investment Managers 670.0 Airbnb, Inc. Digi ta l Media/Commerce Sequoia Capita l 448.0 Instacart, Inc. Digi ta l Media/Commerce Sequoia Capita l 400.0 Kuaishou Digi ta l Media/Commerce Tencent Holdings Ltd. 350.0 Avaloq Group AG Software Warburg Pincus LLC 300.0 Paytm E‐Commerce Pvt. Ltd. Digi ta l Media/Commerce Al ibaba Group Holding Ltd. 200.0 Maihuolang Digi ta l Media/Commerce Shenzhen Capita l Group 150.0 Al ignment Healthcare LLC Software Warburg Pincus LLC 115.0 Picnic B.V. Digi ta l Media/Commerce NPM Capita l N.V. 108.5 Delhivery Bus iness Services The Carlyle Group 100.0 Jiangsu Chezhibao Information Technology Co., Ltd. Digi ta l Media/Commerce JD Capita l 100.0 DraftKings , Inc. Digi ta l Media/Commerce Eldridge Industries 100.0 ROBLOX Corporation Digi ta l Media/Commerce Index Ventures 92.0 i fl i x Digi ta l Media/Commerce Liberty Global , Inc. 90.0 Looker Data Sciences , Inc. Marketing Technology Kleiner Perkins Caufield & Byers 81.5 ServiceTi tan, Inc. Marketing Technology Iconiq Capita l 80.0 Blackbuck Digi ta l Media/Commerce Accel Partners 71.0 Oodrive Group Software NextStage Capita l 70.0 SoundCloud Ltd. Digi ta l Media/Commerce Ares Capita l Corporation 70.0 Blackbuck Bus iness Services Accel Partners 70.0 Freenome, Inc. Software Andreessen Horowitz 65.0 Berkeley Research Group LLC Bus iness Services Endeavour Capita l , Inc. 62.5 Decisely Insurance Services , Inc. Software Two Sigma Ventures 60.0 Bluegogo Digi ta l Media/Commerce Blackhole Capita l 58.0 Lucid Holdings LLC Software North Bridge Growth Equity 57.0 MarketsandMarkets Marketing Technology FTV Capita l 56.0 Juni fer Systems Ltd. Software Gentrack Ltd. 55.6 DataRobot Inc. Software New Enterprise Associates 54.0 Livongo Health, Inc. Software Genera l Cata lyst Partners LLC 52.2 Placester, Inc. Marketing Technology New Enterprise Associates 50.0 CloudCheckr, Inc. Software Level Equity 50.0 Confluent, Inc. Software Sequoia Capita l 50.0 Kensho Technologies , Inc. Software S&P Global Inc. 50.0 Viva Republ ica Co. Ltd. Digi ta l Media/Commerce Bessemer Venture Partners 48.0 Haoeyou Software Hakim Unique Internet 40.0 Farmers Bus iness Network, Inc. Digi ta l Media/Commerce Kleiner Perkins Caufield & Byers 40.0 Hotel Tonight, Inc. Digi ta l Media/Commerce Battery Ventures 37.0 Bei jing Fuyou Onl ine Information Technology Co., Ltd. Bus iness Services Legend Capita l 36.0 Job Today S.A. Digi ta l Advertis ing German Media Pool 35.5 MasterClass Bus iness Services New Enterprise Associates 35.0 Tukazza! SAS Digi ta l Media/Commerce Maif Avenir SAS 35.0

50 | M&A and Investment Summary March 2017
All Segments($ in Millions)
Venture/Growth Capital Transactions Target Target Segment Buyer/Investor Reported TV VC/Growth CapitalValues Disclosed
VeloCloud Networks Software New Enterprise Associates 35.0$ s implesurance GmbH Software Rakuten, Inc. 32.2 Zenreach, Inc. Digi ta l Advertis ing Maverick Venture Partners 30.0 Klook Travel Technology Limited Digi ta l Media/Commerce Sequoia Capita l 30.0 Dely, Inc. Digi ta l Media/Commerce Yahoo Japan 27.0 Newrank.cn Marketing Technology HG Capita l 26.0 Vis ier, Inc. Software Adams Street Partners , LLC 25.5 Icerti s .com Marketing Technology Greycroft Partners LLC 25.0 Freightos Marketing Technology GE Ventures 25.0 MapD Technologies , Inc. Software New Enterprise Associates 25.0 Turvo, Inc. Software Activant Capita l Group LLC 25.0 Flock.co Software (Private Investors ) 25.0 iD Fresh Food (India) Pvt. Ltd. Digi ta l Media/Commerce Premji i Invest 25.0 Skuid, Inc. Software Iconiq Capita l 25.0 EVRYTHNG Ltd. Software Cisco Investments 24.8 Al ign Commerce, Inc. Software Kleiner Perkins Caufield & Byers 24.0 Reduxio Systems Ltd. Software Intel Capita l 22.5 KNIME.com AG Software Invus Group 21.5 Hedvig, Inc. Software Hewlett Packard Enterprise Company 21.5 Turnkey Vacation Renta ls , LLC Software Altos Ventures 21.0 24Tidy.com, Incorporated Digi ta l Media/Commerce China Merchants Venture Capita l Management 21.0 Nearpod, Inc. Digi ta l Media/Commerce Ins ight Venture Partners 21.0 Examity, Inc. Bus iness Services Univers i ty Ventures 21.0 YCloset Digi ta l Media/Commerce IDG Capita l Partners 20.0 The Jel lyvis ion Lab, Inc. Software Updata Partners 20.0 Canopy Tax, Inc. Marketing Technology New Enterprise Associates 20.0 Urjanet, Inc. Information Oak HC/FT 20.0 ID.me, Inc. Software FTV Capita l 19.0 2nd Watch, Inc. Bus iness Services Madrona Venture Group 19.0 WayUp, Inc. Digi ta l Advertis ing Index Ventures 18.5 Mashape, Inc. Software Andreessen Horowitz 18.0 Xioayu Link Software Lightspeed Venture Partners 18.0 Evolv Technology, Inc. Software Lux Capita l 18.0 UNIFi Software Software Canaan Partners 17.5 Sens ibi l l , Inc. Software Information Venture Partners 17.3 Pharmeasy Digi ta l Media/Commerce Bessemer Venture Partners 17.0 Weather Analytics LLC Software W.R. Berkley Corporation 17.0 Hubble Contacts Digi ta l Media/Commerce Firs tMark Capita l 16.5 DataBerries Digi ta l Advertis ing Index Ventures 16.0 Fluxx Software Canvas Venture Fund 16.0 Scyl laDB Software Bessemer Venture Partners 16.0 Cal l inize Inc. Marketing Technology Andreessen Horowitz 15.8

51 | M&A and Investment Summary March 2017
All Segments($ in Millions)
Venture/Growth Capital Transactions Target Target Segment Buyer/Investor Reported TV VC/Growth CapitalValues Disclosed
cloudvirga, Inc. Software The Blackstone Group L.P. 15.0$ Infoworks .io, Inc. Software Centerview Capita l Technology 15.0 Mintigo, Inc. Marketing Technology Sequoia Capita l 15.0 ACV Auctions LLC Digi ta l Media/Commerce Bessemer Venture Partners 15.0 Zimperium Ltd. Software SoftBank Capita l 15.0 Pypestream, Inc. Marketing Technology (Private Investors ) 15.0 Garrison Technology Ltd. Software Touchstone Innovations 14.6 MediSafe Project Ltd. Software Octopus Ventures , LLC 14.5 Kingdee Healthcare Software Yongjin Group 14.0 Avere Systems, Inc. Software Norwest Venture Partners 14.0 RiskSense, Inc. Software Jump Capita l 14.0 The Naga Group Digi ta l Media/Commerce Fosun Venture Capita l Investment 13.4 Akeneo SAS Marketing Technology Partech Ventures 13.0 Flow Commerce, Inc. Marketing Technology Bain Capita l Ventures 13.0 Raise.me Digi ta l Media/Commerce Redpoint Ventures 12.0 Voxy, Inc. Bus iness Services SJF Ventures 12.0 Bustle.com Digi ta l Media/Commerce Genera l Cata lyst Partners LLC 12.0 Casetext, Inc. Information Canvas Venture Fund 12.0 Carro Digi ta l Media/Commerce Venturra Capita l 12.0 LimeBike Digi ta l Media/Commerce Andreessen Horowitz 12.0 Dyadic Securi ty Ltd. Software Goldman Sachs Asset Management, L.P. 12.0 UNICAF Bus iness Services Univers i ty Ventures 12.0 Qapita l , Inc. Digi ta l Media/Commerce Northzone 12.0 Dora's Dreams Digi ta l Media/Commerce Legend Capita l 12.0 WorkJam, Inc. Software Lerer Hippeau Ventures 12.0 Cognoa, Inc. Information Mornings ide Group 11.6 Aetion, Inc. Software Flare Capita l Partners 11.2 Clari ty Money, Inc. Digi ta l Media/Commerce Bessemer Venture Partners 11.0 Bayshore Networks , Inc. Software Trident Capita l 11.0 PayQix, Inc. Software Undisclosed 11.0 PeerSpace, Inc. Digi ta l Media/Commerce Foundation Capita l 11.0 Helpl ing GmbH Digi ta l Media/Commerce As ia Paci fic Internet Group 10.8 Kaloom, Inc. Software FTQ 10.7 mycs GmbH Digi ta l Media/Commerce Global Founders Capi ta l 10.7 InterCloud S.A.S. Software CapHorn Invest 10.7 Licious Digi ta l Media/Commerce Mayfield Fund 10.0 ControlUp Technologies Ltd. Software K1 Investment Management, LLC 10.0 Rigetti Computing Software Andreessen Horowitz 10.0 Lystable Industries Limited Software Valar Ventures LP 10.0 Paradata, Inc. Software PivotNorth Capita l 10.0 MotorK Marketing Technology 83North 10.0 Brookl inen Digi ta l Media/Commerce Firs tMark Capita l 10.0

52 | M&A and Investment Summary March 2017
All Segments($ in Millions)
Venture/Growth Capital Transactions Target Target Segment Buyer/Investor Reported TV VC/Growth CapitalValues Disclosed
Bringg, Inc. Software Aleph VC 10.0$ Waitr, Inc. Digi ta l Media/Commerce (Private Investors ) 10.0 Borqs Ltd. Software Accel Partners 10.0 Prevedere Software, Inc. Marketing Technology Norwest Venture Partners 10.0 Goldbely, Inc. Digi ta l Media/Commerce Intel Capita l 10.0 Dream Payments Corporation Marketing Technology Fair Ventures 10.0 Liven Pty. Ltd. Digi ta l Adverti s ing Undisclosed 10.0 LoopMe Ltd. Marketing Technology Holtzbrinck Digi ta l GmbH 10.0 Algomi Corporation Information Euronext N.V 10.0 CampusLogic, Inc. Software 4.0 Partners 10.0 Incorta , Inc. Marketing Technology Google Ventures 10.0 Nested Digi ta l Media/Commerce Pass ion Capita l 9.9 Joyrun, Inc. Digi ta l Media/Commerce Norwest Venture Partners 9.8 Ripcord, Inc. Marketing Technology Kleiner Perkins Caufield & Byers 9.5 crealytics GmbH Digi ta l Advertis ing High‐Tech Gründerfonds 9.3 Aditor Digi ta l Advertis ing Playtika Ltd. 9.0 Moneytree KK Digi ta l Media/Commerce SBI Group 9.0 Mythic AI Software Lux Capita l Management 9.0 BeautyCon LLC Tradi tional Media CCA, Inc. 9.0 Convers ion Logic Marketing Technology Lerer Hippeau Ventures 9.0 Nimble, Inc. Marketing Technology Google Ventures 9.0 Goodlord Ltd. Software Global Founders Capi ta l 8.8 Regent Education, Inc. Software Ares Capita l Corporation 8.5 Astro Technology, Inc. Marketing Technology Redpoint Ventures 8.3 Beekeeper, Inc. Software Keen Venture Partners 8.0 Chairi sh, Inc. Digi ta l Media/Commerce Altos Ventures 8.0 SHYFT Analytics Software Optum Ventures 7.5 Rippl ing Software (Private Investors ) 7.0 LawGeex Software Recrui t Holdings Co., Ltd. 7.0 Banyan Technology, Inc. Software Jumpstart 7.0 Quidd, Inc. Digi ta l Media/Commerce (Private Investors ) 6.8 The People Analytics Corporation Marketing Technology Idinvest Partners 6.6 Carbon Health Software Javel in Venture Partners 6.5 FarmLead Resources Ltd. Digi ta l Media/Commerce Monsanto Company 6.5 Kiddom, Inc. Software Khos la Ventures 6.5 CareDox, Inc. Software Digi ta l i s Ventures 6.4 Timetrade Systems, Inc. Marketing Technology Origami Capita l Partners 6.3 Odi lo Marketing Technology Active Venture Partners 6.3 PocketWatch, Inc. Digi ta l Media/Commerce Third Wave Digi ta l 6.0 Mass Appeal , Inc. Digi ta l Media/Commerce Universa l Music Group, Inc. 6.0 Caicloud Software Matrix Partners 6.0 Zenrez Corporation Digi ta l Media/Commerce Artis Ventures 6.0

53 | M&A and Investment Summary March 2017
All Segments($ in Millions)
Venture/Growth Capital Transactions Target Target Segment Buyer/Investor Reported TV VC/Growth CapitalValues Disclosed
Music Audience Exchange LLC Marketing Technology Math Venture Partners 6.0$ Foodsby LLC Digi ta l Media/Commerce Greycroft Partners LLC 5.9 Smal l Giant Games Oy Digi ta l Media/Commerce EQT Ventures 5.7 Optolexia Software The Ponoma Group 5.6 Closetbox, Inc. Digi ta l Media/Commerce Undisclosed 5.5 scriptr.io Software Endeavor Cata lyst 5.5 Autobooks Software Draper Triangle Ventures 5.5 KnowBe4, Inc. Software Undisclosed 5.5 The Glue N.V. Software Polytech Ecosystem Ventures 5.4 OpenRent Ltd. Digi ta l Media/Commerce Global Founders Capi ta l 5.4 rankingCoach GmbH Marketing Technology United Internet AG 5.3 MyGlamm Digi ta l Media/Commerce Locci tane 5.3 Dimebox BV Software Bi l lPro Group 5.3 Mynd.co Marketing Technology Lightspeed Venture Partners 5.1 Streetbees .com Limited Marketing Technology Octopus Ventures , LLC 5.1 Munchery Digi ta l Media/Commerce Menlo Ventures 5.0 Emoticast Limited Digi ta l Media/Commerce Strangeloop Ventures 5.0 Trapl ight Oy Digi ta l Media/Commerce Sunstone Capita l A/S 5.0 RavenPack International S.L. Software Draper Espiri t 5.0 Launcher Solutions LLC Software Lucor Holdings 5.0 Endor Software Ltd. Software Innovation Endeavors LLC 5.0 Brayola Fi tting Technologies , Inc. Digi ta l Media/Commerce Firstime Venture Capi ta l 5.0 Cloud.IQ Limited Marketing Technology Nauta Capita l 4.9 Kabuni Technologies , Inc. Marketing Technology Print the Future, Inc. 4.9 Liqid Investments GmbH Software Project A Ventures 4.8 Travelaer LLC Marketing Technology Calypso Capita l Management 4.6 Insuri fy, Inc. Digi ta l Adverti s ing MassMutual Ventures LLC 4.6 Picki t Marketing Technology Microsoft Ventures 4.6 Si lverfin SA Software Index Ventures 4.5 ZoneFox Limited Software Archangels 4.4 HundredRooms SL Digi ta l Advertis ing Seaya Ventures 4.3 Gro Solutions , Inc. Software TTV Capita l 4.3 Booksy, Inc. Software Open Ocean Capita l Ltd. 4.2 HowGood Information FirstMark Capita l 4.2 Chute Corporation Marketing Technology Salesforce Ventures 4.1 Ripjar Limited Software Winton Ventures 4.0 Wrench, Inc. Digi ta l Media/Commerce Madrona Venture Group 4.0 Smyte, Inc. Software Harrison Metal Capita l 4.0 Qubiqle, Inc. Software Ini tia l i zed Capita l 4.0 Bivarus , Inc. Software Hatteras Venture Partners 4.0 Marketing Evolution Marketing Technology Zetta Venture Partners 4.0

54 | M&A and Investment Summary March 2017
All Segments($ in Millions)
Venture/Growth Capital Transactions Target Target Segment Buyer/Investor Reported TV VC/Growth CapitalValues Disclosed
VentureApp, Inc. Software Accompl ice VC 4.0$ Dia logue Technologies , Inc. Software BDC Capita l 4.0 Amper Music, Inc. Software Two Sigma Ventures 4.0 Chronotruck.com Bus iness Services Seventure Partners 3.8 Intel l ing Ltd. Bus iness Services NVM Private Equity Limited 3.7 WhenFresh Ltd. Marketing Technology CLS Group 3.7 Crypt TV Digi ta l Media/Commerce Lerer Hippeau Ventures 3.5 Quantexa Limited Software Albion Ventures LLP 3.3 ZenJob Digi ta l Media/Commerce Redalpine Venture Partners AG 3.2 Universe Digi ta l Media/Commerce Genera l Cata lyst Partners LLC 3.2 Kidizen, Inc. Digi ta l Media/Commerce Origin Ventures 3.2 FloriSmart Digi ta l Media/Commerce Beaubridge 3.1 ADVR Marketing Technology Undisclosed 3.0 Snapcart Digi ta l Advertis ing Vickers Venture Partners 3.0 Big Squid, Inc. Marketing Technology Si lverton Partners 3.0 TVPage, Inc. Marketing Technology (Private Investors ) 3.0 TextRecrui t LLC Software Signal fi re Fund 3.0 Levvel LLC Bus iness Services (Private Investors ) 3.0 Cymulate Ltd. Software Susquehanna Growth Equity, LLC 3.0 Wrapify, Inc. Tradi tional Media Avery Dennison Corporation 3.0 Maisonette LLC Digi ta l Media/Commerce New Enterprise Associates 2.8 Wazoku Software Undisclosed 2.8 Anchor FM, Inc. Digi ta l Media/Commerce Accel Partners 2.8 Fanmi les GmbH Agency & Marketing Services Auden Group 2.8 Ti lak Healthcare Software iBionext Growth Fund 2.7 Purple Squirrel , Inc. Digi ta l Advertis ing Greycroft Partners LLC 2.7 POPxo Digi ta l Media/Commerce GREE Ventures , Inc. 2.7 DateBox, Inc. Digi ta l Media/Commerce (Private Investors ) 2.6 Lynkos LLC Marketing Technology Logitech Internationa l 2.5 Col lective Retreats Digi ta l Media/Commerce Firs t Round Capita l 2.5 StatX, Inc. Marketing Technology Signia Venture Partners 2.5 Ematic Solutions Pte. Ltd. Marketing Technology Wavemaker Partners 2.4 MomentSnap, Inc. Software Bowery Capita l 2.3 Brigad SAS Digi ta l Media/Commerce Square Capita l 2.3 LUCY Digi ta l Media/Commerce Forerunner Ventures 2.3 Gamee s .r.o. Digi ta l Media/Commerce Index Ventures 2.2 Glofox Marketing Technology Notion Capita l 2.2 Gamelearn Bus iness Services Kibo Ventures 2.1 Kel i Network, Inc. Digi ta l Media/Commerce Partech Ventures 2.0 Piwik PRO Sp. z o.o. Software Warsaw Equity Group 2.0 Diamond Software Palanti r Technologies , Inc. 2.0 Flont Digi ta l Media/Commerce (Private Investors ) 2.0

55 | M&A and Investment Summary March 2017
All Segments($ in Millions)
Venture/Growth Capital Transactions Target Target Segment Buyer/Investor Reported TV VC/Growth CapitalValues Disclosed
Raken, Inc. Software Rincon Venture Partners 2.0$ Smack, Inc. Digi ta l Media/Commerce New Enterprise Associates 1.8 CrowdCare Corporation Marketing Technology ScaleUp Ventures 1.7 Attaq Onl ine, Inc. Digi ta l Media/Commerce (Private Investors ) 1.6 LivingLens Ltd. Marketing Technology (Private Investors ) 1.6 Firs t Stop Health LLC Software (Private Investors ) 1.6 Babel Health LLC Software (Private Investors ) 1.5 Si ft Wallet Digi ta l Advertis ing Liquid 2 Ventures 1.5 Planity SAS Digi ta l Media/Commerce Alven Capita l Partners 1.5 Botfuel SAS Software Seventure Partners 1.4 SV Ins ight Digi ta l Media/Commerce Blackhole Capita l 1.4 ShopChat Digi ta l Media/Commerce Rakuten, Inc. 1.3 Homage Co. Pte. Ltd. Digi ta l Media/Commerce 500 Startups 1.2 Socedo Inc. Marketing Technology Vulcan Capita l 1.0 Prospecti fy.io Marketing Technology Geekdom Fund 1.0 Rel inkLabs AS Software SEED Capita l 1.0

56 | M&A and Investment Summary March 2017
All Segments($ in Millions)
Venture/Growth Capital TransactionsTarget Target Segment Buyer/Investor Reported TV
VC/Growth CapitalUndisclosed
Divimove GmbH Agency & Marketing Services FremantleMedia Enterprises ‐$ Bai l iwick, Inc. Bus iness Services Norwest Venture Partners ‐ Employee Relations Associates , Inc. Bus iness Services Boathouse Capita l ‐ General Information Services , Inc. Bus iness Services Genera l Atlantic, LLC ‐ ti ramizoo GmbH Bus iness Services Shel l Technology Ventures ‐ Comparesoft Ltd. Digi ta l Advertis ing Mercia Technologies ‐ PlacePass Digi ta l Advertis ing Marriott Internationa l ‐ BIGO Technology Pte. Ltd. Digi ta l Media/Commerce Ping An Ventures ‐ Emmy‐Sharing.de Digi ta l Media/Commerce Investi tionsbank Berl in ‐ Hel loprint Digi ta l Media/Commerce Project A Ventures ‐ Urban Sports GmbH Digi ta l Media/Commerce Holtzbrinck Digi ta l GmbH ‐ Cobrainer GmbH Marketing Technology Bayern Kapita l ‐ Reputation.com, Inc. Marketing Technology Heri tage Group, LLC ‐ SmartZip Analytics , Inc. Marketing Technology Toba Capita l ‐ Ascentis Corporation Software Summit Partners LP ‐ Asurint Software North Bridge Growth Equity ‐ C3 IoT Software Breyer Capita l ‐ Episode Six Limited Software SBI Group ‐ Ndgit Software DVH Ventures ‐ PokitDok, Inc. Software GIS Strategic Ventures ‐ Sucuri , Inc. Software GoDaddy ‐ Talmetrix Software Jumpstart ‐ Virsae Group Limi ted Software Darby Capita l Partners ‐

57 | M&A and Investment Summary March 2017
Petsky Prunier: Maximizing Shareholder Value
M&A Advisory and Sell‐Side Representation
Privately‐Owned Companies
Entrepreneur‐Led Businesses
Private Equity Portfolio Companies
VC‐Backed Companies
Corporate Divestitures
Selected Buy‐Side Engagements
Capital Raising and Private Placements
Advertising & Marketing
eCommerce
Digital Media Technology Information
Business Services
Healthcare Services
Business Current Situation Assessment and Profit Improvement Planning
Opportunity Mapping: Strategic Planning & Development Competitive Landscape Analysis M&A Transaction Due Diligence Support Buy‐Side Targeting Criteria & Integration Strategy
Custom Market Research
Publishing, Speaking, and Thought Leadership
Top‐ranked, global investment bank dedicated to digital advertising and marketing, eCommerce, digital media, technology, information,business services, and healthcare services industries
Extensive sell‐side M&A and capital raise expertise, with a transaction closing rate unmatched at our level of deal volume
Founded in 1999
More than 50 focused professionals; growth of 40% since 2011
New York, Palo Alto, Las Vegas, Chicago, Boston, Charlotte
Deep relationships across a broad spectrum of strategic buyers, as well as private equity, growth equity, and VC groups and lenders
Strategic consulting firm Winterberry Group – one of the largest industry‐specific advisors providing strategic and transactional services
Global reach enhanced through our partnerships in China and India
Securities transactions are processed through Petsky Prunier Securities LLC, a member of FINRA and an affiliated entity

58 | M&A and Investment Summary March 2017
Ranked #1 by Bloomberg For Mid‐Market Internet & Advertising Transactions
Bloomberg M&A League Tables, 2011‐2016TOP ADVISORS SERVING THE MIDDLE MARKET INTERNET & ADVERTISING SECTORS
2016 2011‐2016 (6‐Year)
Rank Advisor Deal Count Rank Advisor Deal Count
1 Petsky Prunier 19 1 Petsky Prunier 103
2 Goldman Sachs 18 2 Goldman Sachs 893 JP Morgan 16 3 Morgan Stanley 683 KPMG Corporate Finance 16 4 PwC 675 Rothschild 15 5 Jordan Edmiston Group 656 Houlihan Lokey 13 6 KPMG Corporate Finance 636 PwC 13 7 China Renaissance Group 528 Avendus Capital 11 7 GCA Savvian Group 528 Daiwa Securities 11 7 JP Morgan 5210 Bank of America Merrill Lynch 9 10 Nomura 5110 Credit Suisse 9 11 Jefferies 4610 Jefferies 9 12 Ernst & Young 4510 Morgan Stanley 9 13 Rothschild 4410 Deloitte Touche Tohmatsu 9 14 Credit Suisse 4315 Citi 8 14 Daiwa Securities 43
15 GCA Savvian Group 8 16 Houlihan Lokey 37
Based on number of deals announced in 2011‐2016 valued at $500 million or less. Internet and Advertising is defined by Bloomberg.
With more than 75 transactions closed in the last 36 months, and more than 125 transactions closed since 2011 (across all industries inaddition to Internet and Advertising), Petsky Prunier is one of the most active M&A practices within the marketing and advertising,eCommerce, and media industries

59 | M&A and Investment Summary March 2017
Representative Recent Transactions*
*For a more comprehensive list, please click here.
(NASDAQ: SYKE)
*Approximate Value
*Approximate Value
$225,000,000*
(NYSE: IDI)
has been sold to
has received a significant growth investment from
$160,000,000*
has been sold to
a portfolio company of
(NYSE: DLX)
has been sold to
a portfolio company of
has been sold to
*Approximate Value
a portfolio company of
has been sold to
a division of
a portfolio company of
has been sold to
has been sold to
$207,000,000*
has been sold to
a portfolio company of
has received a majority investment from
has received a majority investment from has been sold to
a portfolio company of
in partnership with
(NYSE: OMC)
and
comprising Media Properties Holdingshas been sold to
a portfolio company of
has been sold tohas acquired
(NASDAQ: CTSH)has acquired
(NASDAQ: ACXM)
from
has been sold toAperion Management
has been sold to
and
has sold
to
(NYSE: ACN)
has been sold to
a portfolio company of
has received a majority investment from
a portfolio company of
has been sold to
has been sold to
comprised of The Simple Dollar, Reviews.com, and Freshome
a portfolio company of
has been sold to
a division of
has been sold to
a portfolio company of
has been sold tohas been sold to
a subsidiary of
(NASDAQ: COGT)
has sold
to
to
has sold
has acquired
$200,000,000
(NYSE: DLX)
has acquired
a portfolio company of
Compliance Solutions Strategies
has been sold to
a division of
(TSO: 4911)