petroleum products adulteration
TRANSCRIPT

ANALYSIS OF ADULTERATION IN PETROLEUM PRODUCTS OF
FORENSIC INTEREST

Introduction• The word "petroleum" means "rock oil" or "oil from the earth". • It has two main uses:
as a fuel. in synthesis of organic compound.
• Petroleum products are materials derived from crude oil as it is processed in oil refineries.
• The majority of petroleum is converted to petroleum products, which includes several classes of fuels.
• Adulteration of petroleum is a common problem for the society and law enforcement agencies. It also endangers for health of human beings and other animals and also for environment.
• Adulteration is unlawful and illegal so it comes under the examination of forensic science.

Main petroleum products of Forensic interest are:
• Petrol: A fluid consisting of various volatile flammable liquid mixtures of hydrocarbons, mainly hexane, heptane, and octane, obtained from petroleum and used as solvent and a fuel for internal combustion engines and commonly used as a motor fuel.
• Diesel: The most common is a specific fractional distillate of petroleum fuel oil, but alternatives that are not derived from petroleum, such as biodiesel, biomass to liquid (BTL), or gas to liquid (GTL) diesel, are increasingly being developed and adopted.
• Kerosene: Organic compound, a clear, oily, highly flammable liquid with a strong odor, distilled from petroleum. It is a mixture of about 10 different types of fairly simple hydrocarbons, depending on its source.

Review of Literature
• Allision et al. (1998) discussed the implementation and progress of Fourier Transform Infrared (FT-IR) spectroscopy in U.S. Army Oil Analysis Program (AOAP). The use of FT-IR by AOAP increases the overall maintenance posture, improves operational readiness, enhances safety and saves valuable resources- a quantum jump for the Army.
• Chung et al.(1999) utilized Near-infrared (NIR) spectroscopy for the rigid identification of six typical petroleum products such as light straight-rum (LSR), naphtha, Kerosene, light gas oil (LGO), gasoline, and diesel.
• Mohammad et al. (2008) were analyzed the ten blend mixtures of regular and super motor gasoline and these were prepared in order to study density, distillation temperatures and FTIR spectra characteristics for each blend.

MATERIALS AND METHODS
• Sample Collection: Properly sterilized glass bottles of 100ml were used to collect 50ml of each sample.
Sample name Company name TypeP1 Club HP Petrol
D1 Club HP Diesel P2 Indian Oil Petrol
D2 Indian Oil Diesel P3 Bharat Petroleum Petrol D3 Bharat Petroleum Diesel P4 HP Petrol
D4 HP Diesel P PDS
Kerosene

Methods of analysis
Thin Layer Chromatography
• TLC is a technique of separation of compounds on the basis of their affinity towards stationary and mobile phase. The values are read as retardation factor (Rf).
• Rf = Distance travelled by the solute
Distance travelled by solvent

Fourier Transform Infrared Spectroscopy• It is a technique used to obtain an
Infrared spectrum of absorption, emission, photoconductivity or Raman scattering of a solid, liquid or gas.
• An FTIR spectrometer collects high spectral resolution data over a wide spectral range.

OBSERVATIONS AND RESULTS• Following solvent systems were tried for the separation of selected
petroleum samples:• Hexane : Acetone : : 8:2• Hexane : Acetone : : 7:3• Hexane: Chloroform : :8:2• Hexane: Chloroform : :7:3• Hexane: Methanol : : 8:2• Chloroform : Methanol : :8: 2• Toluene: Methanol : : 8:2• Toluene: Acetone : : 7:3• Toluene: Acetone : : 8:2• Toluene : Acetone : : 9:1• Benzene : Acetone : : 8: 2• Benzene : Acetone : : 7:3• Chloroform: Benzene: Acetone : : 5:3:2• Hexane : Toluene : Acetone : : 3:5:2• Hexane : Toluene : Acetone : : 5:2:3• Hexane : Toluene : Acetone : : 5:3:2• Hexane : Toluene : Acetone : : 6:3:1

Experimental conditions for TLC• Solvent system used :
Hexane:Toluene:Acetone::6:3:1• Saturation time : 10 minutes• Run Time : 20 minutes
Spraying Reagent: Plate was sprayed with the following spraying reagent:
1.Chloranil Spray reagent which was prepared as: A small amount of Chloranil was added in benzene followed by double diluted sulphuric acid, then heated in oven at 105°C for 10 minutes.
2.Vanillin in 2% Sulphuric acid, followed by heating at 100°C.
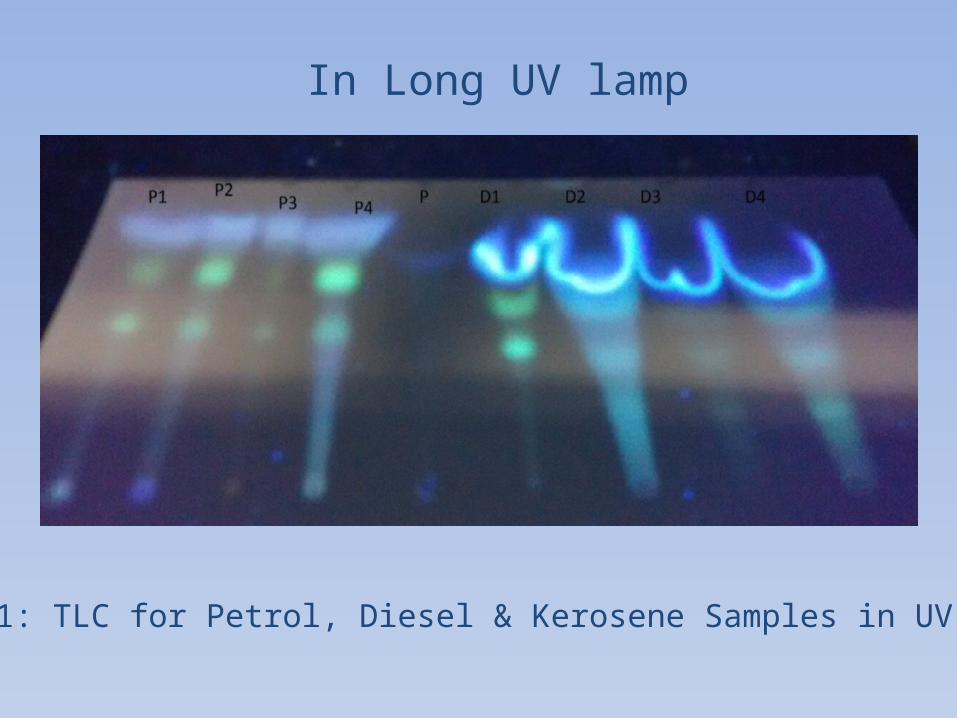
In Long UV lamp
Plate-1: TLC for Petrol, Diesel & Kerosene Samples in UV light
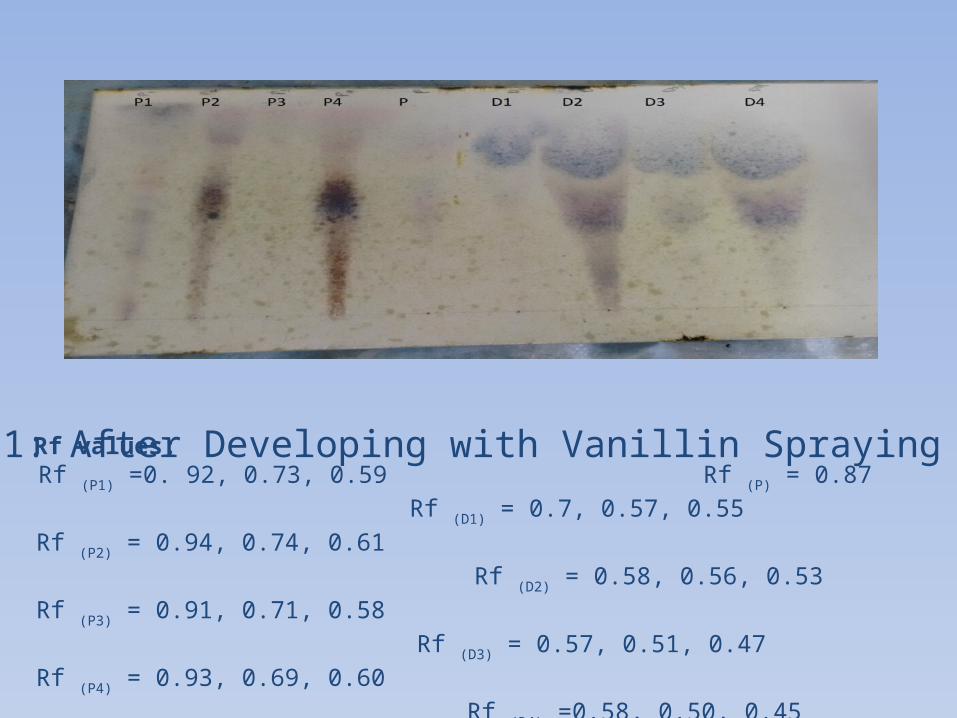
Plate-1: After Developing with Vanillin Spraying reagent
Rf values:Rf (P1) =0. 92, 0.73, 0.59 Rf (P) = 0.87 Rf (D1) = 0.7, 0.57, 0.55
Rf (P2) = 0.94, 0.74, 0.61 Rf (D2) = 0.58, 0.56, 0.53
Rf (P3) = 0.91, 0.71, 0.58 Rf (D3) = 0.57, 0.51, 0.47
Rf (P4) = 0.93, 0.69, 0.60 Rf (D4) =0.58, 0.50, 0.45

TLC of Adulterated Petrol Sample with Kerosene
In Long UV Lamp
Plate 2:TLC for Adulterated Petrol samples with Kerosene in UV light

Plate 2:After Developing with Vanillin Spraying reagent
Rf values:Rf (P1P) = 0.87,0.73,0.59 Rf (P) = 0.87 Rf (P1) = 0.92,0.73,0.59
Rf (P2P) = 0.87,0.74,0.61 Rf (P2) = 0.94,0.74,0.61
Rf (P3P) = 0.87,0.71,0.58 Rf (P3) = 0.91,0.71,0.58
Rf (P4P) = 0.87,0.69,0.60 Rf (P4) = 0.93,0.69,0.60

TLC of Adulterated Diesel Samples with Kerosene
In Long UV Lamp
Plate 3:TLC for Adulterated Kerosene samples with Kerosene

Plate 3:After Developing with Vanillin Spraying reagent
Rf values:Rf (D1) = 0.70,0.57,0.55 Rf (P) = 0.87 Rf (D1P) = 0.92,0.87,0.73,0.59
Rf (D2) =0.58,0.56,0.53 Rf (D2P) = 0.94,0.87, 0.74, 0.61
Rf (D3) = 0.57,0.51,0.47 Rf (D3P) = 0.91,0.87, 0.71, 0.58
Rf (D4) = 0.58,0.50,0.45 Rf (D4P) =0.93,0.87, 0.69, 0.60

FTIR Analysis
• Each sample was run over FTIR- ATR and the spectrograph thus obtained was read and interpretations were made.
IR Spectrum is divided into two parts:1. Diagnostic region or Functional group
region from 500 to 1500 cmˉ¹.2. Fingerprint region from 1500 to 4000
cmˉ¹.

Interpretation from Diagnostic Region of IR Spectra for P1,P2,P3,P4:
• All the spectra i.e., P1,P2,P3,P4 showed same peaks in their diagnostic regions showing the characteristics of Hydrocarbons as explained below:
• Spectra showed peaks at 2872 cmˉ¹is due to sp3 C-H stretch & peaks at 2957 cmˉ¹ & 2925 cmˉ¹ is due to sp2 C-H stretch and this is due to the absorption of methylene group.
• Peak at 3028 cmˉ¹ showed the presence of Aromatic Character.
• Peak at 1606ˉ¹ is due to C=C stretch. • Thus, petrol has Aromatic, Aliphatic mixture.

P1 Spectrum
Fingerprint Region:•Peaks at 1495 cmˉ¹ & 1457 cmˉ¹ are due to CH2 bend absorption.•Peak at 1378 cmˉ¹ is due to CH3 bend absorption.•Peaks at 1083 cmˉ¹ & 1050 cmˉ¹ are due to Cyclohexane ring vibrations.•Peak at 879 cmˉ¹ shows the presence of 1,4 disubstituted (para) group frequency and Vinylidene C-H out of plane bend.•Major peaks at 795 cmˉ¹,769 cmˉ¹,742 cmˉ¹,728 cmˉ¹,694 cmˉ¹ show the presence of mono-substituted group frequencies.

P2 Spectrum
Fingerprint Region:•Peaks at 1496 cmˉ¹ & 1460 cmˉ¹ is due to CH2 bend absorption •Peak at 1378 cmˉ¹ is due to CH3 bend absorption.•Peaks at 1082 cmˉ¹ & 1050 cmˉ¹ are due to Cyclohexane ring vibrations.•Peak at 881 cmˉ¹ shows the presence of 1,4 disubstituted (para) group frequency and Vinylidene C-H out of plane bend.•Major peaks at 795 cmˉ¹,768 cmˉ¹,728 cmˉ¹,694 cmˉ¹ show the presence of mono-substituted group frequencies.

P3 Spectrum
Fingerprint Region:•Peaks at 1495 cmˉ¹ & 1462 cmˉ¹ are due to CH2 bend absorption.•Peaks at 1378 cmˉ¹ & 1365 cmˉ¹ are due to CH3 bend absorption.•Peaks at 1083 cmˉ¹ & 1031 cmˉ¹ are due to Cyclohexane ring vibrations.•Peak at 875 cmˉ¹ shows the presence of 1,4 disubstituted (para) group frequency and Vinylidene C-H out of plane bend.•Major peaks at 795 cmˉ¹,769 cmˉ¹,742 cmˉ¹,728 cmˉ¹,694 cmˉ¹ show the presence of mono-substituted group frequencies.

P4 Spectrum
Fingerprint Region:•Peaks at 1495 cmˉ¹ & 1456 cmˉ¹are due to CH2 bend absorption.•Peaks at 1378 cmˉ¹are due to CH3 bend absorption.•Peaks at 1081 cmˉ¹ & 1030 cmˉ¹are due to Cyclohexane ring vibrations.•Peak at 875 cmˉ¹ shows the presence of 1,4 disubstituted (para) group frequency and Vinylidene C-H out of plane bend.•Major peaks at 795 cmˉ¹,768 cmˉ¹,742 cmˉ¹,728 cmˉ¹,693 cmˉ¹ show the presence of mono-substituted group frequencies.

Interpretation from Diagnostic Region of IR Spectra of D1, D2, D3, D4:
• All the spectra i.e., D1,D2,D3,D4 showed same peaks in their diagnostic regions showing the characteristics of Hydrocarbons as explained below:
• Spectra showed peaks at 2872 cmˉ¹ is due to sp3 C-H stretch & peaks at 2957 cmˉ¹ & 2925 cmˉ¹ is due to sp2 C-H stretch and this is due to the absorption of methylene group.
• There is no peak above 3000 cmˉ¹; this infers that there is no Aromatic character present in diesel.
• No peak around 1600 cmˉ¹ showed the absence of C=C stretch.
• Thus, Diesel has an Aliphatic Saturated Character.

D1 Spectrum:
Fingerprint Region:•Peaks at 1458 cmˉ¹ are due to CH2 bend absorption.•Peaks at 1377 cmˉ¹ are due to CH3 bend absorption.•Peaks at 741 cmˉ¹,723 cmˉ¹,699 cmˉ¹ are associated with 4 or more CH2 groups in an open chain.

D2 Spectrum:
Fingerprint Region:•Peaks at 1458 cmˉ¹are due to CH2 bend absorption.•Peaks at 1377 cmˉ¹are due to CH3 bend absorption.
Peaks at 741 cmˉ¹,725 cmˉ¹,698 cmˉ¹are associated with 4 or more CH2 groups in an open chain
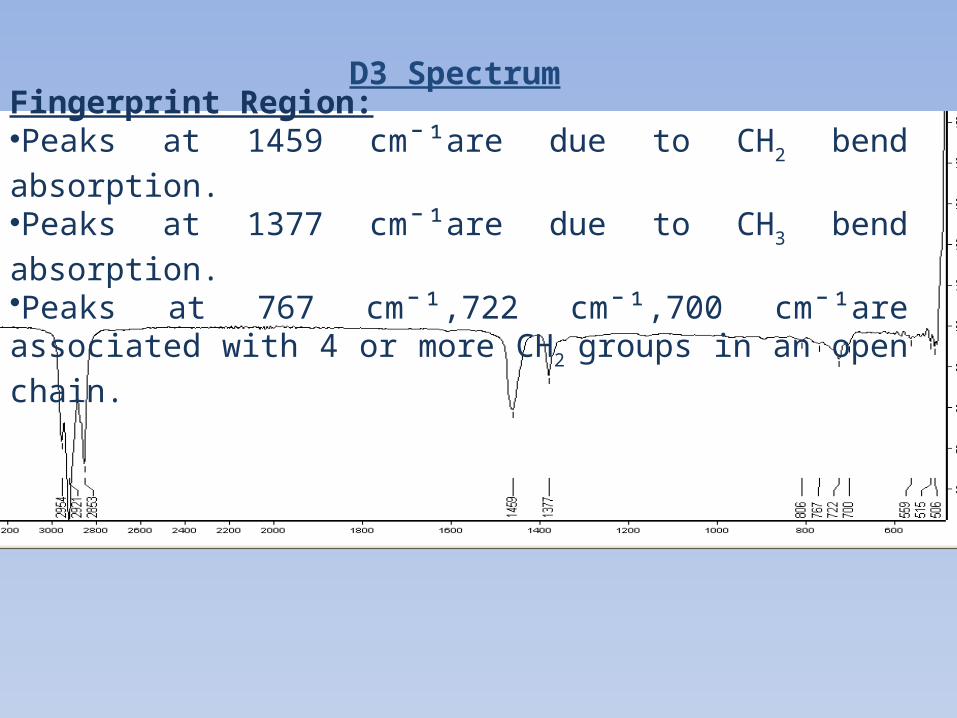
D3 Spectrum
Fingerprint Region:•Peaks at 1459 cmˉ¹are due to CH2 bend absorption.•Peaks at 1377 cmˉ¹are due to CH3 bend absorption.•Peaks at 767 cmˉ¹,722 cmˉ¹,700 cmˉ¹are associated with 4 or more CH2 groups in an open chain.

D4 Spectrum
Fingerprint Region:•Peaks at 1458 cmˉ¹are due to CH2 bend absorption.•Peaks at 1377 cmˉ¹are due to CH3 bend absorption.•Peak around 723 cmˉ¹ is associated with 4 or more CH2
groups in an open chain.

CONCLUSION
• The Solvent system which showed the best separation for Petrol, Diesel , Kerosene & adulterated samples of Petrol & Diesel with Kerosene is Hexane : Toluene: Acetone: : 6:3:1.
• Rf Values showed the difference in separation of Petrol, Diesel, Kerosene & adulterated samples of Petrol & Diesel with Kerosene.
• Spots were visible in long UV range i.e., 365-400nm.
• Vanillin in 2% Sulphuric acid is used as spraying agent for the development of TLC plate.
• IR Spectra identified the Petrol, Diesel & Kerosene as Hydrocarbons as interpreted from Diagnostic region of their Spectra.

• IR Spectra of P1,P2, P3 &P4 showed differences at some group absorptions as due their different manufacturers and thus, identified as a mixture of :
• Alkanes due to C-H stretching & bending absorptions.
• Cycloalkanes due to ring strain vibrations.
• Olefins due to C=C stretching.• Benzene due to Aromatic character
peak at 3022 cmˉ¹ and conjugated alkene character.

• Toluene due to C-H stretch (aromatic) around 3022 cmˉ¹ & C-H stretch (alkyl) at 2925 cmˉ¹ and 735 cmˉ¹ out of plane C-H bending.
• Xylene due to C-H stretch (aromatic) around 3022 cmˉ¹ & C-H stretch(alkyl) at 2925 cmˉ¹ and absorbance at 860-880 cmˉ¹ ( 1,4 para substituted group).
• IR Spectra of D1,D2,D3&D4 showed differences at some group absorptions as due their different manufacturers but much information could be fetched out. Spectra showed the difference only at long chain band absorbance.
• IR Spectra for P (Kerosene) showed similar absorbance as that of Diesel showing the similar structure and similar number of Carbon atoms.
REFERENCES• Speight J. Handbook of Petroleum Product Analysis,
John Wiley & Sons,. Inc. (2002):1-6
• Toms A, Powell J, Dixon J. The Utilization of FT-IR for Army Oil Condition Monitoring (1998):1-6.
• Chung H, Choi H J, Ku MS. Rapid Identification of Petroleum Products by Near Infrared Spectroscopy, Petroleum Identification by NIR, Bull. Korean Chem. Soc. (1999) 20:1021-1025.
• DFS Manual of Petroleum Products, MHA, Govt. of India, New Delhi, 2005.

THANK YOU!