petrochemical economics - vcmstudy.ir · british library cataloguing-in-publication data a...
TRANSCRIPT


Petrochemical EconomicsTechnology Selection in a
Carbon Constrained World

CATALYTIC SCIENCE SERIES
Series Editor: Graham J. Hutchings (Cardiff University)
Published
Vol. 1 Environmental Catalysisedited by F. J. J. G. Janssen and R. A. van Santen
Vol. 2 Catalysis by Ceria and Related Materialsedited by A. Trovarelli
Vol. 3 Zeolites for Cleaner Technologiesedited by M. Guisnet and J.-P. Gilson
Vol. 4 Isotopes in Heterogeneous Catalysisedited by Justin S. J. Hargreaves, S. D. Jackson and G. Webb
Vol. 5 Supported Metals in Catalysisedited by J. A. Anderson and M. F. García
Vol. 6 Catalysis by Goldedited by G. C. Bond, C. Louis and D. T. Thompson
Vol. 7 Combinatorial Development of Solid Catalytic Materials:Design of High-Throughput Experiments, Data Analysis,Data Miningedited by M. Baerns and M. HoleÁa
Vol. 8 Petrochemical Economics: Technology Selection in a Carbon Constrained Worldby D. Seddon
Steven - Petrochemical Economics.pmd 3/1/2010, 11:31 AM2

ICP Imperial College Press
CATALYTIC SCIENCE SERIES — VOL. 8Series Editor: Graham J. Hutchings
Duncan SeddonDuncan Seddon & Associates Pty Ltd, Australia
Petrochemical EconomicsTechnology Selection in a
Carbon Constrained World

British Library Cataloguing-in-Publication DataA catalogue record for this book is available from the British Library.
Published by
Imperial College Press57 Shelton StreetCovent GardenLondon WC2H 9HE
Distributed by
World Scientific Publishing Co. Pte. Ltd.
5 Toh Tuck Link, Singapore 596224
USA office: 27 Warren Street, Suite 401-402, Hackensack, NJ 07601
UK office: 57 Shelton Street, Covent Garden, London WC2H 9HE
Printed in Singapore.
For photocopying of material in this volume, please pay a copying fee through the CopyrightClearance Center, Inc., 222 Rosewood Drive, Danvers, MA 01923, USA. In this case permission tophotocopy is not required from the publisher.
ISBN-13 978-1-84816-534-2ISBN-10 1-84816-534-X
All rights reserved. This book, or parts thereof, may not be reproduced in any form or by any means,electronic or mechanical, including photocopying, recording or any information storage and retrievalsystem now known or to be invented, without written permission from the Publisher.
Copyright © 2010 by Imperial College Press
Catalytic Science Series — Vol. 8PETROCHEMICAL ECONOMICSTechnology Selection in a Carbon Constrained World
Disclaimer. The materials and opinions herein are based upon publicly available informationbelieved to be reliable, and may change without notice. The author or Publisher shall not in anyway be liable for claims relating to them, and makes no express or implied representations or warrantiesas to their accuracy or completeness or for statements or errors contained in, or omissions from, them.The information and analyses contained herein are not intended as tax, legal or investment adviceand may not be suitable for your specific circumstances; accordingly, you should consult your owntax, legal, investment or other advisors to determine such suitability. Any investment returns, past,hypothetical or otherwise, are not indicative of future performance.
Steven - Petrochemical Economics.pmd 3/1/2010, 11:31 AM1

v
To Joan & George

This page intentionally left blankThis page intentionally left blank

vii
PREFACE
The objective of this book is to give industry professionals,
engineering, research scientists and financiers an overview of the
technologies and economics for the production of olefins in the
petrochemical industries. The book gives an overview of the options and
costs for producing olefins using different technologies and from
different feedstocks at a time when the cost of carbon dioxide emissions
are set to be included in the processing cost.
The book is based on a series of workshops and specialist seminars
given by the author dating from 1996 in Singapore and Kuala Lumpur.
The workshops focussed on production economics, improving plant
profitability, feedstock supply and cost. The book is an updated and
expanded version of the author’s workshop notes.
The book critically compares the alternatives so that the most
attractive options for petrochemical production can be identified for
specific locations and conditions. For this purpose, technology capital
and operating costs have been compared on the same basis (US Gulf
location to a late 2007 cost base). From this, the production costs are
estimated for various feedstock prices and compared to the traded prices
of the products where appropriate.
The contents are widely embracing as possible for viable
technologies in 2008. From time to time new technologies are identified
or more information on emerging technologies become available. For
brevity, the book does not cover technology still in the research and
development stage. In particular, the extensive volume of material on the
direct conversion of gas (methane) into ethylene has been omitted.
The text is roughly divided into two parts: the first six chapters
discuss steam cracking technology and the approaches to olefin

viii Preface
production from hydrocarbons and the later chapters concentrate on the
production economics.
Units
A technical and economic appraisal of petrochemicals spans
several large subject areas: petroleum and oil industry economics,
petrochemical refining and applied chemistry, chemical engineering and
process economics. Unfortunately these distinct fields carry their own
units. The petroleum industry generally uses American units based on
standards defined at 60o
Fahrenheit and are generally the units used in
the US chemicals industry. Most chemists and academic engineers use
S.I. units which are the most widely used units used in the European
chemical industry. However, much petroleum engineering and refining
technology uses a bastardised version - often mixing American and S.I.
units in the same function.
The book generally employs S.I. units which the author considers
to be the most widely acceptable. American units are used where
appropriate. All costs are in US dollars of late 2007. Note the possibility
of confusing US one thousand (M) with the S.I. Mega (M). In this work
Mt is million metric tonnes and MM$ is million US dollars.
Economic Analysis
The economic analysis follows the methodology described by the
International Energy Agency for evaluating alternative feed stocks for
the production of petrochemicals. Full details of the method are given in
the Appendix. In summary the issue is that petrochemical technologies
are highly capital intensive and some means has to be found for
comparing alternatives. The method used for technology comparisons is
to develop a fixed variable equation for a hypothetical green-field plant
producing olefins from a given feedstock. The fixed costs of the plant are
derived from published estimates of the costs of the capital items and
operating costs. The operating costs can often be approximated as fixed
percentages (typically 10%) of the total installed capital cost. The return
Preface ix
on working capital is also included in the fixed cost term. No account is
taken of tax, depreciation or allowances.
This leaves the feedstock as the only variable in the fixed-variable
equation:
P = x.F + C
where P is the product production cost, F is the feedstock price, x is the
variable constant and C is the constant representing the fixed costs of
capital and non feedstock operating costs.
The largest component of the constant C is the return on
investment of the fixed capital. In order to make comparisons easier, a
standardised methodology is adopted which is detailed in the Appendix.
Typically process plants are assumed to take a similar (3 year)
construction period to operate at full output over the project lifetime with
zero residual value. The capital payback is then over this operating life.
Once the fixed variable relationships are derived the equation can
be used to estimate the production cost for any given feedstock price. By
comparing the estimated production cost with traded prices for the
product, the viability of a particular project can be determined. By
considering alternative technologies at similar feedstock prices,
alternative approaches can be critically compared.
Approximations to the Economic Analysis
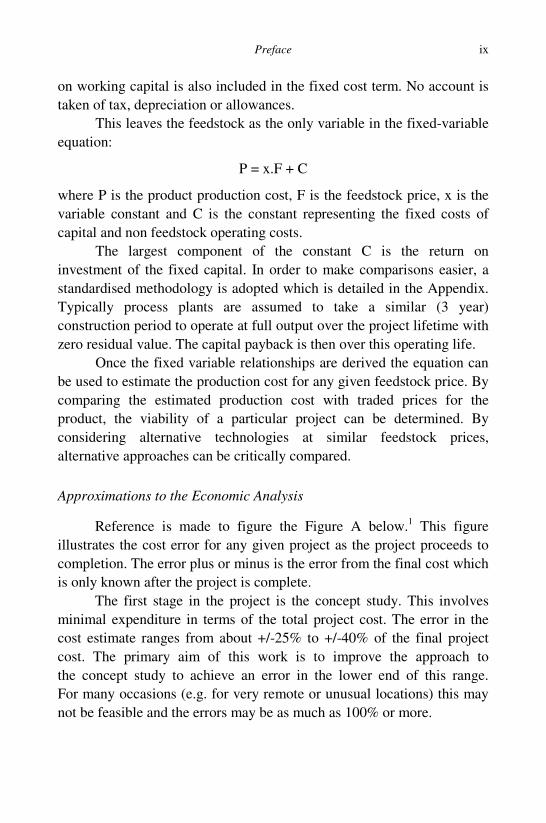
Reference is made to figure the Figure A below.1
This figure
illustrates the cost error for any given project as the project proceeds to
completion. The error plus or minus is the error from the final cost which
is only known after the project is complete.
The first stage in the project is the concept study. This involves
minimal expenditure in terms of the total project cost. The error in the
cost estimate ranges from about +/-25% to +/-40% of the final project
cost. The primary aim of this work is to improve the approach to
the concept study to achieve an error in the lower end of this range.
For many occasions (e.g. for very remote or unusual locations) this may
not be feasible and the errors may be as much as 100% or more.

x Preface
Figure A: Error in an estimate as a function of project life
The second phase is the feasibility study. This stage may require
the expenditure of 1 to 2% of the total project cost. Thus for a $1,000
million project about $20 million will be required. This will define the
location, feedstock and product market and the technology to be used. It
will also typically encompass outline regulatory approval and assessment
of environmental impacts. The error in the estimate is typically not less
than about +/-10%. Financiers (bankers and corporate boards) like the
error to be +/-5%. This level of estimate can usually only be achieved by
a FEED study.
Front-End Engineering and Design (FEED) focuses on obtaining
accurate cost estimates for the major items of process equipment and
further definition of the most sensitive parts of the overall project cost. It
is denoted Front-End because this is performed prior to final corporate
board and financial approval for the overall project. FEED costs
typically 5 to 10% of the overall project cost – thus for a $1,000 million
project expenditure of about $100 million will be required. Only after the
feasibility and FEED will the cost error be in the vicinity of +/-5%. In
many instances, especially for new technology or for a remote location or
offshore, the error will still be in the region of +/-10% or more.
The full engineering design, procurement and construction will
also account for some error, hopefully <5%. Only when the project is
completed and started and running to the design specifications is the final
cost of the project known.
P R O J E C T T I M E - L I N E
ER
RO
R IN
CO
ST
ES
TIM
AT
E
c o n c e p t f e a s i b i l i t y F E E D
c o n s t r u c t i o n
c o m p l e t e
E r r o r i n c o s t e s t i m a t e sError in cost estimates
PROJECT TIME-LINE
feasibility FEED
construction
complete concept
ER
RO
R I
N C
OS
T E
ST
IMA
TE

Preface xi
As the adage goes, “the accuracy of the cost estimate is
proportional to the time and money expended.” Unfortunately there is a
common tendency to try to shorten or circumvent the costing process,
which often leads to project failure.
Data Sources
The world petrochemical industry is surveyed annually in the Oil
& Gas Journal as the “Ethylene Report.” This is a useful source of
country production, individual steam crackers (including ownership) and
the feedstock used. Since 2006 US olefins and the US natural gas liquid
supply and prices are each reviewed twice per year by Lippe.2
Weissermel and Arpe3
have provided an excellent description of many
technologies and approaches to chemical synthesis in the chemical
process industry.
In this book, wherever possible literature references are given
which should be followed for further information. The Oil & Gas
Journal articles are a useful source and these often give further
references to conference proceedings and articles published in the
academic literature. As well as technical articles, Hydrocarbon
Processing produces reviews of technology on a regular basis.
Nowadays, these are issued on a CD ROM and provide more details of
different technologies from the various process licensors.
In the descriptions of the various technologies, several
assumptions and omissions to the process flow sheets have been made in
order to help understanding of the principal issues and to improve the
clarity of the descriptive. If a particular technology or approach is of
interest to the reader then the process licensor should be approached for
the latest updates and information.
For many chemicals reporting agencies such as ICIS-LORS and
Platts produce daily price and volume bulletins for subscribers. ICIS-
LORS data is reported for a wide range of chemicals regularly in ICIS
Chemical Business (formerly European Chemical News). Other groups
such as Chemical Market Associates regularly report on global trends
and prices which are often reviewed in the Oil & Gas Journal.4

xii Preface
Purvin & Gertz Inc. produce regular reports concerning the LPG
trade. Some of these reports are reviewed in the Oil & Gas Journal.5
Oil statistics, natural gas and propane prices are readily available
from the US Energy Information Administration website (www.eia.gov)
which as well collating a vast amount of current and historical data offers
useful links to other sites.
1
See also P.B. McIntire, Oil & Gas Journal, Aug 13, 2001, p. 30
2
For example D. Lippe, Oil & Gas Journal, Jul. 7, 2008, p. 64; idem., Nov. 3, 2008,
p. 54
3
K. Weissermel and H.-J. Arpe, “Industrial Organic Chemistry”, VCH Publishers, New
York, 2nd
edition 1993
4 For example M. Eramo, Oil & Gas Journal, Dec. 5, 2005, p. 52 and see also ibid.,
Aug. 25, 2008, p. 48
5 For example W. Hart, R. Gist, K. Otto. D. Rogers, Oil & Gas Journal, Jun 23, 2008,
p. 58

xiii
CONTENTS
Preface ................................................................................................... vii
Chapter 1: World Ethylene Production by Steam Cracking ................... 1
North America .............................................................................. 2
European Union and Russia .......................................................... 6
Ethylene Production in the Middle East ..................................... 10
Cracking Operations in the Far East ........................................... 12
South America ............................................................................ 28
Africa .......................................................................................... 28
Feedstock and Carbon Emissions ............................................... 29
Chapter 2: Chemistry of Olefin Production .......................................... 33
Thermodynamics of Thermal Cracking ...................................... 34
Chemical Kinetics ....................................................................... 38
Yield of Ethylene and Propylene from Lighter Feedstock ......... 41
Thermal Cracking of Larger Molecules ...................................... 43
Reaction Severity .......................................................................... 47
Differences between Pyrolysis and Catalytic Cracking .............. 48
Chapter 3: Gaseous Feedstocks – Production and Price ....................... 51
Gaseous Feed Stocks from Natural Gas ...................................... 51
LPG from Other Sources – LPG Quality .................................... 63
Prices of Gaseous Feed Stocks ................................................... 66
Chapter 4: Liquid Feedstock, Production and Price .............................. 71
Primary Refinery Operations ...................................................... 71
Naphtha Quality .......................................................................... 75
Price of Naphtha and Other Liquid Feed Stocks ........................ 78

xiv Petrochemical Economics
Chapter 5: Value of Products, Storage and Transport ........................... 87
Products ...................................................................................... 87
Hydrocarbon By-Products .......................................................... 88
Storage of LPG ........................................................................... 96
Transport ................................................................................... 100
Estimation of Chemical Shipping Costs ................................... 102
Chapter 6: Carbon Dioxide Emissions ................................................ 109
Carbon Geo-Sequestration ........................................................ 109
Removal of Carbon Dioxide from Process Streams ................. 110
Removal of Carbon Dioxide from Flue Gas ............................. 115
Strategies for Reducing Carbon Emissions ............................... 117
Geo-Sequestration ..................................................................... 119
The Cost of Carbon Geo-Sequestration .................................... 121
ECONOMIC ANALYSIS ................................................................... 123
Chapter 7: Ethane Cracking ................................................................ 125
Feed Requirements and Thermal Efficiency ............................. 128
Ethylene Production Costs From Ethane .................................. 131
Carbon Emissions from Ethane Cracking ................................. 141
Chapter 8: LPG Cracking .................................................................... 145
Basic Chemistry of LPG Cracking ........................................... 145
Economics of Propane Cracking ............................................... 147
Economics of Butane Cracking ................................................ 152
Isobutane Cracking ................................................................... 155
Carbon Dioxide Emissions in LPG Cracking ........................... 156
Chapter 9: Liquid Feedstock Cracking ............................................... 159
Economics of Naphtha Cracking .............................................. 161
Gas Oil Cracking ...................................................................... 171
Carbon Emissions from Naphtha and LSWR Cracking ............ 175
Chapter 10: Other Routes to Olefins from Hydrocarbons ................... 179
Fluid Cat-Cracking (FCC) ........................................................ 179

Contents xv
Catalytic Cracking to Produce Ethylene ................................... 185
Catalytic Dehydration of Paraffin to Light Olefins .................. 187
Olefin Metathesis ...................................................................... 194
Catalytic Dehydration of Ethanol ............................................. 195
Carbon Emissions from Propane Dehydrogenation .................. 198
Chapter 11: Routes to Olefins from Coal ............................................ 201
Coal to Olefins – Current Technology ...................................... 202
Economics of Olefin Production from Coal and Gas ............... 219
Coal to Acetylene and Olefins .................................................. 222
Carbon Emissions for Gas and Coal to Olefins ........................ 223
Chapter 12: Closing Remarks ............................................................. 225
Production Economics .............................................................. 225
Carbon Emissions ..................................................................... 226
Catalyst Issues ........................................................................... 228
APPENDICES .................................................................................... 229
A1: Abbreviations and Unit Equivalents .................................. 231
A2. Some Useful Conversion Factors for Fuels and Products .. 233
A3. Cost of Utilities .................................................................. 235
A4. Nelson-Farrar Cost Indices ................................................ 235
A5. Location Factors ................................................................. 237
A6. Methodology for Economic Analysis ............................... 237
A7. Indexed Feedstock Costs .................................................... 243
Index ................................................................................................... 247

This page intentionally left blankThis page intentionally left blank

1
CHAPTER 1
WORLD ETHYLENE PRODUCTION BY
STEAM CRACKING
The world ethylene production capacity is approximately 120
million tonnes (2008)1
. The regional break-up is shown in Figure 1.1.
Figure 1.1: World ethylene capacity (120 million tonnes 2008)
In 2008 the ethylene production capacity was still dominated by
the developed economies of North America, the European Union and the
Far East. The Far East is dominated by Japan and Korea but with
significant contributions from the countries of South East Asia.
Emerging and rapidly growing regions of olefin production are China
and the Middle East.
The following is a selected review of the world’s major cracking
operations producing olefins and petrochemicals.
29.9%
29.0%
25.1%
8.7%
7.2%
NORTH AMERICA
EUROPEAN UNION
FAR EAST
MIDDLE EAST
REST OF WORLD

2 Petrochemical Economics
North America
USA
The North American production is dominated by the very large
cracking operations in the USA reflecting the United States position as
the single largest petrochemicals market. It has a large number of fully
integrated plants producing a comprehensive range of petrochemicals. In
2008, the US’s capacity was almost 29 million tonnes per year (t/y)
which is 80% of North America’s operations and 24% of the world’s
total.
Production in the US is on a par with the Far East which has
recently overtaken the USA in nameplate capacity. The USA is also
slightly larger than the expanded European Union which has major
integrated petrochemical operations in Belgium, The Netherlands,
Germany and the UK.
Although the USA is geographically large, the petrochemical
operations are concentrated in Texas and Louisiana. This gives them
easy access to the large oil and gas production facilities in Texas and
Oklahoma and the growing production of oil and gas from the Gulf of
Mexico. This geographical concentration also facilitates the interchange
by pipeline of chemical intermediates (ethylene, etc.) and the
development of large open markets for such interchange.
In the past, natural gas liquids – ethane, propane and butane –
were the favoured feedstock for ethylene production. Propylene was
extracted from the off-gas of some of the world’s largest oil refineries in
the same region. In recent times, naphtha crackers and flexible fuel
crackers have been built (the favoured approach in the Far East and
Europe). However, as the following Figure 1.2 illustrates, natural gas
liquids (ethane, propane and butane) account for the major portion of the
ethylene feedstock.
The product slate from cracking natural gas liquids is dominated
by ethylene. Propylene in the US is made from refinery off-gases (REF
GAS) and there is a small contribution to ethylene from this source as
feed to ethylene cracking operations. Naphtha makes up the balance and

World Ethylene Production by Steam Cracking 3
A
Figure 1.2: US ethylene feedstock (2008)
again much of this is sourced from the natural gasoline fraction of natural
gas liquids (condensate).
The approximately 40 cracking operations are owned by various
corporate entities. Some have several plants across the US. As well as
US majors (Chevron-Phillips, Exxon-Mobil, Dow Chemical, Equistar),
several foreign organisations operate crackers in order to have better
access to the US market. Notables amongst these are BASF-Fina (EU),
Formosa Petrochemical (Taiwan) and Sasol (South Africa).
Of the more than 40 US cracking operations, most are world scale
with an average capacity of over 700,000t/y. The US has some of the
largest plants in the world with several in excess of 1 million tonnes and
one with over 2 million tonnes capacity. Table 1.1 gives a list of the
ethylene cracking operations, the operators, their location and nameplate
capacity in 2008.
As well large integrated plants for producing olefins and resins,
the US chemical complexes can source large volumes of aromatics and
other chemicals from the juxtaposed refinery operations. Because these
are some of the largest refineries in the world, speciality products can
often be simply extracted at a minimum cost. A good example is the
production of linear paraffins (for the production alpha-olefins, which are
used to produce biodegradable detergents). In most parts of the world
this is a costly exercise, but these important intermediates can be
ETHANE PROPANE BUTANE NAPHTHA GAS OIL REF GAS
0%
10%
20%
30%
40%

4 Petrochemical Economics
extracted in the volumes required from the jet-fuel stream of the large
Texas refineries (e.g. Exxon-Mobil’s Baytown refinery has a capacity
523,000bbl/d). The large integrated and open market with many
competitors, easy access to low cost engineering contractors and
equipment, large operations which maximises the economy of scale and
access to low cost feedstock has developed the Gulf region of the USA
as a centre for low cost production of petrochemicals.
The only issue of concern is the reliance on the ready supply of
natural gas liquids and the price of the gas used in their production.
Table 1.1: US Ethylene Plants and Capacity 2008 (tonne/year)
COMPANY LOCATION t/y
BASF FINA Petrochemicals Port Arthur, TX 830000
Chevron Phillips Chemical Cedar Bayou, TX 794000
Chevron Phillips Chemical Port Arthur, TX 794000
Chevron Phillips Chemical Sweeny, TX 923000
Chevron Phillips Chemical Sweeny, TX 673000
Chevron Phillips Chemical Sweeny, TX 272000
Dow Chemical Freeport, TX 630000
Dow Chemical Freeport, TX 1010000
Dow Chemical Plaquemine, LA 520000
Dow Chemical Plaquemine, LA 740000
Dow Chemical Taft, LA 590000
Dow Chemical Taft, LA 410000
Du Pont Orange, TX 680000
Eastman Chemical Longview, TX 781000
Equistar Chemicals LP Channelview, TX 875000
Equistar Chemicals LP Channelview, TX 875000
Equistar Chemicals LP Chocolate Bayou, TX 544000
Equistar Chemicals LP Clinton, Iowa 476000
Equistar Chemicals LP Corpus Christi, TX 771000
Equistar Chemicals LP Laporte, TX 789000
Equistar Chemicals LP Morris, ILL 550000
ExxonMobil Baton Rouge, LA 975000
ExxonMobil Baytown, TX 2197000
ExxonMobil Beaumont, TX 816000
ExxonMobil Houston, TX 102000
Formosa Plastics Corp. USA Point Comfort, TX 725000

World Ethylene Production by Steam Cracking 5
Table 1.1 (continued)
Formosa Plastics Corp. USA Point Comfort, TX 816000
Huntsman Corp. Odessa, TX 360000
Huntsman Corp. Port Arthur, TX 635000
Huntsman Corp. Port Neches, TX 180000
Ineos Olefins and Polymers Chocolate Bayou, TX 1752000
Javelina Corpus Christi, TX 151000
Sasol North America Lake Charles 453515
Shell Chemicals Ltd. Deer Park, TX 1426000
Shell Chemicals Ltd.. Norco, LA 900000
Shell Chemicals Ltd.. Norco, LA 656000
Sun Co. Inc. Marcus Hook, PA 225000
Westlake Petrochemicals Calvert City, KY 195000
Westlake Petrochemicals Sulphur, LA 567000
Westlake Petrochemicals Sulphur, LA 522000
Williams Energy Geismar, LA 612245
However, since 2000 gas prices have spiralled resulting in increased
feedstock costs. In recent times, on an energy basis, the cost of gas in the
US has often exceeded the cost of crude oil. This has led to the erosion of
operating margins for the large number of plants using gas liquids as
feedstock. It has also facilitated exports to the US from low production
cost operations elsewhere, such as the Middle East.
Canada
Canada with a nameplate production capacity of 5.53 million
tonnes of ethylene is a major player in world petrochemicals. Most of the
product is devoted to the US market, particularly the northern states
which are remote from the integrated operation of the US Gulf. Most of
the operations are large gas based operation based in Alberta: Table 1.2.
Mexico
Mexico has a nameplate ethylene capacity of 1.384 million tonnes.
This is produced by three operation owned by Petroeleos Mexicanos. All
operations use ethane feedstock.

6 Petrochemical Economics
Table 1.2: Canadian Petrochemical Operations
COMPANY LOCATION t/y FEEDSTOCK
Dow Chemical Ft. Sask. ALTA 1285000 Ethane
Imperial Oil Products Sarina, ONT 300000 Ethane LPG
Nova Chemicals Corunna, ONT 839002 LPG naphtha
Nova Chemicals Joffre, ALTA (E1) 725624 Ethane
Nova Chemicals Joffre, ALTA (E2) 816327 Ethane
Nova Chemicals Joffre, ALTA (E3) 1269841 Ethane
Petromont Varennes, QUE 295000 LPG naphtha
European Union and Russia
The countries of the European Union (EU) have cracking
operations with an annual nameplate capacity of about 26.4 million
tonnes of ethylene (2008). The breakdown across the E.U. is shown in
Figure 1.3.
Figure 1.3: EU ethylene capacity (26.4 million tonnes 2008)
The pie chart (Figure 1.3) shows that the major operations are in
Germany France, the Benelux countries and the UK. Like the US
cracking operations, which are near refineries, oil and gas producing
facilities of Texas, Louisiana and the US Gulf, many of the EU
21.8%
15.0%
12.8%10.8%
9.3%
8.2%
5.4%
16.7%
GERMANY
NETHERLANDS
FRANCE
UNITED KINGDOM
BELGIUM
ITALY
SPAIN
10 Others

World Ethylene Production by Steam Cracking 7
petrochemical centres are juxtaposed to refinery operations, North Sea
oil & gas producing centres and major ports. This gives them feedstock
integration with refinery and natural gas production.
In contrast to the US, most of the feed used in the production of
petrochemicals is naphtha with a minor portion coming from natural gas
liquids (ethane, propane etc.). There is a minor contribution (just below
10%) from gas oil, much of this being waxy residual fuel oil. The
breakdown of feedstock is shown in Figure 1.4.
Figure 1.4: E.U. ethylene feedstock (2008)
The individual cracking operations across the countries of the EU
and their nameplate capacities are shown in Table 1.3.
Russia
Russia has an annual nameplate ethylene production capacity of
3.49 million tonnes. The plants are scattered across Russia from
European Russia to the Far East (Table 1.4). By world standards most
plants are small with capacities of 400 kt/y or less. A cross section of
feedstocks is used.
ETHANE
PROPANE
BUTANE
NAPHTHA
GAS OIL
REF GAS
OTHER
0.0%
10.0%
20.0%
30.0%
40.0%
50.0%
60.0%
70.0%
80.0%

8 Petrochemical Economics
Table 1.3 European Cracking Operations (Country, Capacity (t/y), Company, Location)
COUNTRY TOTAL COMPANY LOCATIION t/y
Austria 500000 OMV AG Schwechat 500000
Belgium 2460000 BASF Antwerpen NV Antwerp 1080000
Benelux FAO Antwerp 230000
Benelux FAO Antwerp 580000
Benelux FAO Antwerp 570000
Czech Rep. 485000 Chemopetrol AS Litvinov 485000
Finland 330000 Borealis Porvoo 330000
France 3373000 A.P. Feyzin Feyzin 250000
ExxonMobil Notre Dame de
Gravenchon
400000
Naphthachemie Lavera 740000
Polimeri Europa France SNC Dunkerque 370000
Soc. Du Craqueur de
L’Aubette
Berre L’Etang 450000
Total Petrochemicals Carling- St. Avoid 568000
Total Petrochemicals Gonfreville
L’Orcher
520000
Total Petrochemicals Lacq 75000
Germany 5757000 Bassell Polyfine GMBH Wesseling 738000
Bassell Polyfine GMBH Wesseling 305000
BASF AG Ludwigshafen 620000
BP Geisenkirchen 580000
BP Geisenkirchen 480000
INEOS Dormagen 550000
INEOS Dormagen 544000
LyondellBassell Munchmunster 320000
Dow Chemical AG Bohlen 560000
OMV Deutschland GMBH Burghausen 450000
Shell DEA Mineraloel AG Heide 110000
Shell DEA Mineraloel AG Wesseling 500000
Greece 20000 EKO Chemicals Thessalonika 20000
Hungary 660000 Tiszai Vegyi Kombinat Tiszaujvaros 370000
Tiszai Vegyi Kombinat Tiszaujvaros 290000
Italy 2170000 Polimeri Europa Brindisi 440000
Polimeri Europa Gela 245000
Polimeri Europa Porto Marghera 490000
Polimeri Europa Priolo 745000
Syndial Porto Torres 250000

World Ethylene Production by Steam Cracking 9
Table 1.3 (continued)
Netherlands 3975000 Dow Chemical Europe Terneuzen 580000
Dow Chemical Europe Terneuzen 585000
Dow Chemical Europe Terneuzen 635000
SABIC Europetrochemicals Geleen 600000
SABIC Europetrochemicals Geleen 675000
Shell Nederland Chemie Moerdijk 900000
Norway 550000 Noretyl AS Rafnes, Bamble 550000
Poland 700000 PKN Orlen Plock 700000
Portugal 330000 Borealis Sines 330000
Slovakia 200000 Slovnaft Joint Stock Co. Bratislava 200000
Spain 1430000 Dow Chemical Tarragona 580000
Repsol Petroleo SA Puertollano 250000
Repsol Petroleo SA Tarragona 600000
Sweden 625000 Borealis Stenungrund 625000
UK 2855000 INEOS Grangemouth 730000
INEOS Grangemouth 340000
ExxonMobil Chemical CO. Fawley 120000
ExxonMobil Chemical CO. Mossmorran, Fife 800000
Huntsman Wilton 865000
Table 1.4: Russian Petrochemical Operations
COMPANY LOCATION t/y
Angarskneftorgsintez Angarsk, Siberia 60000
Angarskneftorgsintez Angarsk, Siberia 240000
Nizhnekamskneftekhim Nizhnekamsk 450000
Norsy Norsy 300000
Omskykauchuyk Omsk, Siberia 90000
Orgsintez Kazan 140000
Orgsintez Kazan 100000
Orgsintez Kazan 100000
Orgsintez Orsk 45000
Polimir Novopolotsk 150000
Salavatneftorgsintez Salavat 300000
Sibur Himprom Perm 30000
Sibur Neftechim Nizhniy Novgorod 300000
Sintezkauchuk Samara 300000
Stavripolpolymer Prikumsk 350000
Tomsk PCC Tomsk 300000
Uraorgsintes Ufa 235000

10 Petrochemical Economics
Ethylene Production in the Middle East2
Over the past decade (to 2008) there has been an enormous
expansion in the production of olefins and resins in the Middle East. This
has been driven by: (i) the availability of feedstock at low prices as a
consequence of the large oil reserves and (ii) the strategic location of the
Middle East in being able to supply both the Atlantic and Far East
petrochemical demand - in particular the enormous rise in demand from
China.
As of 2008 installed capacity based on ethylene is 10.4 million
tonnes across five nations of the Middle East as illustrated in Figure 1.5.
Figure 1.5: Middle East Ethylene Capacity (10.4 million tonnes 2008)
Most capacity is in Saudi Arabia, which has almost 7 million
tonnes of ethylene capacity mainly using gas based feedstock3
. Current
capacity in Iran, Qatar and Kuwait stands at about 1 million tonnes each
and the UAE has a cracker of 600,000 tonnes. Larger plants are under
construction in Iran4
. The status of the Iraqi petrochemical industry is
unknown.
The feedstock used in the Middle East is illustrated in Figure 1.6.
What distinguishes cracking operations in the Middle East from those of
other regions is the dominance of ethane cracking over other feedstocks.
As is illustrated in the Figure 1.6, ethane is the major feedstock of
the region. Along with propane and butane, ethane is extracted from
natural gas either as gas associated with oil or from large natural gas
fields developed for LNG production, as in Qatar.
65.1%
11.6%
9.9%
7.7%
5.7%
SAUDI ARABIA
IRAN
QATAR
KUWAIT
UAE
IRAQ

World Ethylene Production by Steam Cracking 11
Figure 1.6: Middle East feedstock slate (2008)
A critical factor underpinning the growth in petrochemicals is that
the Middle Eastern governments have made the political decision that the
pricing of gas and its derivatives (ethane, propane and butane) is not
related to the price of crude oil for domestic petrochemical purposes.
This distinguishes the Middle East operations from many of those
elsewhere such as Europe and USA where the pricing of gas derived
feedstock bear a relationship with the prevailing price of crude oil.
When oil price was low (as in the mid 1990s) feedstock costs
where broadly similar across the world. However, in a time of high gas
and oil prices, the Middle East pricing regime has introduced a large
feedstock differential in their favour. This arrangement delivers an
enormous competitive advantage to Middle East producers of ethylene
which use gas based feedstock. This flows through to the production
costs of ethylene derivatives such as polyethylene resins, ethylene glycol,
ethanol and acetic acid. The issue of differential feedstock pricing is of
increasing concern to the EU where a large part of the downstream
products are sold and where domestic EU producers pay much higher
prices for feedstock. The issue is a point of contention in the trade
between the Middle East and the EU.
Also important in future developments are those cracking
operations based on feedstock from the large Qatar North Gas Field5.
Further gas based plants are planned in Saudi Arabia to come on-stream
from 2008. However, one short term issue will be the viability of Iran’s
ETHANE PROPANE BUTANE NAPHTHA GAS OIL REF GAS
0.0%
10.0%
20.0%
30.0%
40.0%
50.0%
60.0%
70.0%
80.0%
12 Petrochemical Economics
industry if the current imbroglio over uranium enrichment results in trade
sanctions.
Should these projects come to fruition, the Middle East producers
will be the lowest cost producers for a wide range of petrochemicals and
derivatives. The major portion of the products would be exported to the
world markets and so will impact on the world price. This will be a
particular concern to most producers in Europe and the Far East with
feedstock (naphtha) linked to the prevailing crude oil price. The cracking
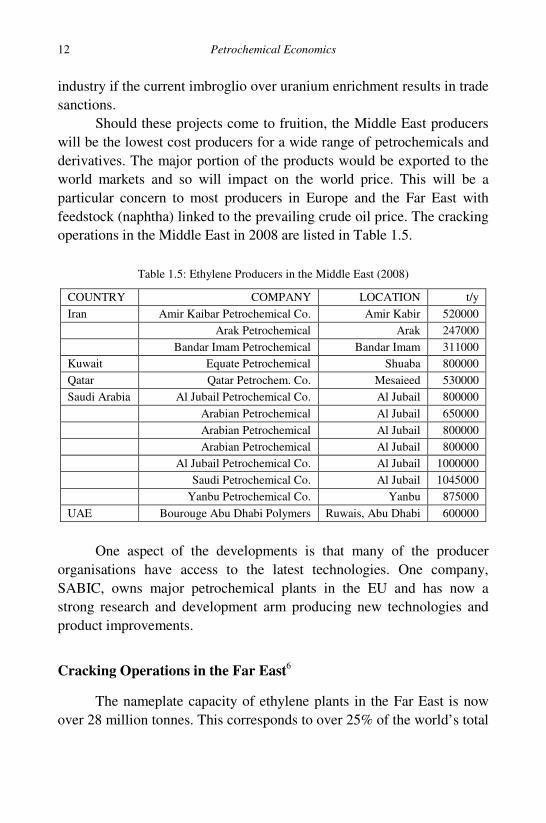
operations in the Middle East in 2008 are listed in Table 1.5.
Table 1.5: Ethylene Producers in the Middle East (2008)
COUNTRY COMPANY LOCATION t/y
Iran Amir Kaibar Petrochemical Co. Amir Kabir 520000
Arak Petrochemical Arak 247000
Bandar Imam Petrochemical Bandar Imam 311000
Kuwait Equate Petrochemical Shuaba 800000
Qatar Qatar Petrochem. Co. Mesaieed 530000
Saudi Arabia Al Jubail Petrochemical Co. Al Jubail 800000
Arabian Petrochemical Al Jubail 650000
Arabian Petrochemical Al Jubail 800000
Arabian Petrochemical Al Jubail 800000
Al Jubail Petrochemical Co. Al Jubail 1000000
Saudi Petrochemical Co. Al Jubail 1045000
Yanbu Petrochemical Co. Yanbu 875000
UAE Bourouge Abu Dhabi Polymers Ruwais, Abu Dhabi 600000
One aspect of the developments is that many of the producer
organisations have access to the latest technologies. One company,
SABIC, owns major petrochemical plants in the EU and has now a
strong research and development arm producing new technologies and
product improvements.
Cracking Operations in the Far East6
The nameplate capacity of ethylene plants in the Far East is now
over 28 million tonnes. This corresponds to over 25% of the world’s total

World Ethylene Production by Steam Cracking 13
ethylene capacity. The countries contributing to this total are shown in
Figure 1.7.
Figure 1.7: Far East Ethylene Capacity (32.9 million tonnes 2008)
Japan remains the country with the highest nameplate capacity
with over 22% of the regions total. China and South Korea follow this
with about 21% and 17% respectively. Taiwan (11%) and India (8%),
Singapore (6%), Malaysia (5%) and Thailand (7%) are significant
players in the region. Indonesia and Australia, with their production
remaining static, remain outsiders to this growth in the region’s ethylene
production capacity (each below 2% of the region’s production capacity).
Over the past decade, the ethylene capacity in the Far East has
grown on average of 9% each year. This is considerably higher than the
world growth rate of 5% over the same period. This growth to 2008 is
illustrated in Figure 1.8.
Most of this growth has concerned the growth of China and
suppliers of commodity resins and chemical intermediates to the rapidly
growing Chinese market.
Table 1.6 lists the 2008 nameplate capacities in the Far East by
country and the average annual growth over the previous decade.
22.1%
21.2%
17.1%
11.0%
7.6%
6.9%
6.0%
5.0%
1.6%1.5%
JAPAN
CHINA
SOUTH KOREA
CHINA TAIWAN
INDIA
THAILAND
SINGAPORE
MALAYSIA
INDONESIA
AUSTRALIA
14 Petrochemical Economics
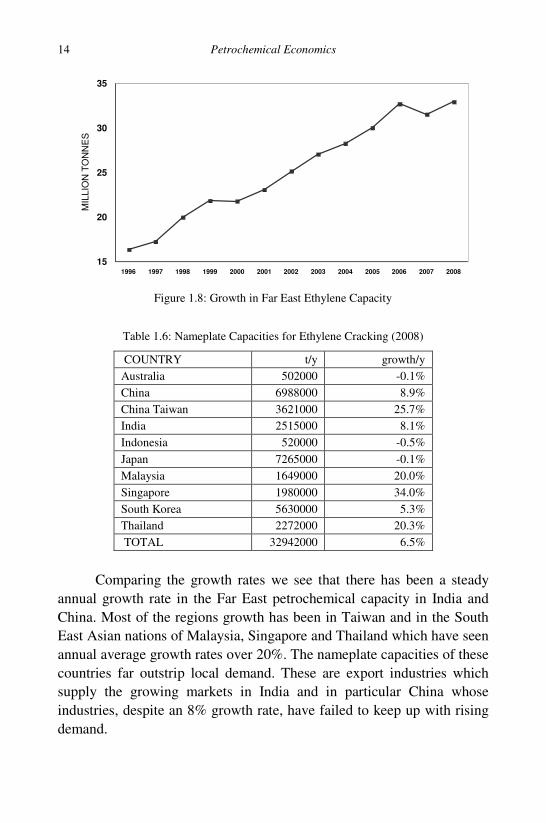
Figure 1.8: Growth in Far East Ethylene Capacity
Table 1.6: Nameplate Capacities for Ethylene Cracking (2008)
COUNTRY t/y growth/y
Australia 502000 -0.1%
China 6988000 8.9%
China Taiwan 3621000 25.7%
India 2515000 8.1%
Indonesia 520000 -0.5%
Japan 7265000 -0.1%
Malaysia 1649000 20.0%
Singapore 1980000 34.0%
South Korea 5630000 5.3%
Thailand 2272000 20.3%
TOTAL 32942000 6.5%
Comparing the growth rates we see that there has been a steady
annual growth rate in the Far East petrochemical capacity in India and
China. Most of the regions growth has been in Taiwan and in the South
East Asian nations of Malaysia, Singapore and Thailand which have seen
annual average growth rates over 20%. The nameplate capacities of these
countries far outstrip local demand. These are export industries which
supply the growing markets in India and in particular China whose
industries, despite an 8% growth rate, have failed to keep up with rising
demand.
1996 1997 1998 1999 2000 2001 2002 2003 2004 2005 2006 2007 2008
15
20
25
30
35M
ILLIO
N T
ON
NE
S

World Ethylene Production by Steam Cracking 15
Over the decade there has been some increase in capacity in South
Korea (5.3%) which is close to the regions average growth rate of 6.5%.
Australia, Indonesia and Japan have not changed significantly in
capacity, the economies of these nations relying more on imports from
South East Asia and the Middle East.
Feedstocks
In the Far East naphtha remains the dominant feedstock. Ethane is
used in several countries, where it is available from local natural gas
developments. There has been a continued decline in the use of gas oil.
LPG is a minor contributor to feedstock in the region. The principal
feedstocks used in the Far East are shown in Figure 1.9.
Figure 1.9: Feedstock breakdown in the Far East
However, there is a considerable variation between countries with
some almost entirely naphtha and some substantially based on ethane and
LPG. The various national breakdowns are shown in Figure 1.10.
Far East Country Survey
Australia (502 kt/y)
There are two major centres one based on Botany Bay near
Sydney and the other at Altona in Melbourne. They produce the bulk of
the ethylene which is made from ethane, with some supplementary LPG
ETHANE
PROPANE
BUTANE
NAPHTHA
GAS OIL
REF. GAS
OTHER
0.0%
10.0%
20.0%
30.0%
40.0%
50.0%
60.0%
70.0%
80.0%

16 Petrochemical Economics
at Altona and naphtha at Botany. A small ethane cracking operation
(32 kt/y) at Footscray (Melbourne) produces ethylene for styrene
manufacture.
Figure 1.10: Feedstock breakdown by country in the Far East
China (6,9880 kt/y)7
The massive expansion of the Chinese economy has had a
profound impact on the production and use of commodity plastics in
China. The first is the considerable growth in demand for polymer
products which have outstripped local supply and as a consequence
China is a major importer. This has had the effect of promoting large
export oriented plants in other Asian countries, with large parts of their
product slate destined for the Chinese market. China is now second to
Japan in the amount of ethylene produced in the Far East. The Chinese
nameplate capacity is almost 7 million tonnes/year.
The plant locations and capacity are listed in Table 1.7. Most of
the Chinese plants are old, with capacities below 200,000 t/y. Many of
these plants were designed to use gas-oil and naphtha as feedstock. This
takes advantage of some of China’s indigenous crude oil, which have
high levels of paraffin wax in the gas-oil fractions. In steam cracking,
such gas-oils give high yields of ethylene and propylene. Newer plants
AU
ST
RA
LIA
CH
INA
CH
INA
(T
AIW
AN
)
IND
IA
IND
ON
ES
IA
JA
PA
N
SIN
GA
PO
RE
SO
UT
H K
OR
EA
MA
LA
YS
IA
TH
AIL
AN
D
0%
20%
40%
60%
80%
100%
ETHANE
PROPANE
BUTANE
NAPHTHA
GAS OIL
OTHER

World Ethylene Production by Steam Cracking 17
are larger and tend to be more naphtha based. One plant (Panjin) uses
ethane as feedstock.
The large growth in demand has spurred a large number of
proposals to increase indigenous capacity. Many of these proposals have
fallen by the wayside. Nevertheless, we would expect to see increasing
capacity coming on-line over the next decade.
Table 1.7: Chinese Petrochemical Operations
COMPANY LOCATION t/y
BASF-YPC Co Ltd. Nanjing 600000
CNOOC Daya Bay, Guangdong 800000
CNOOC Dushanzi 140000
China Petrochem. Industrial Daqing 320000
Dalian Pet. Chem. Dalian 4000
Fushan Pet. Chem Cpx. Fushan 115000
Gaoqiao Petrochem Gaoqiao 14000
Guangzhou Petrochem Guangzhou 150000
Jilin Chemical Jilin 700000
Langzhou Chemical Industrial Langzhou 240000
Panjin Gas Processing Panjin 130000
SINOPEC Beijing 660000
SINOPEC Guangzhou 140000
SINOPEC Maoming 380000
SINOPEC Neijing 650000
SINOPEC Puyang Henan 180000
SINOPEC Qilu 720000
SINOPEC Shanghai #1 145000
SINOPEC Shanghai #2 700000
SINOPEC Tianjin 200000
China Taiwan (3,620 kt/y)
China Taiwan has a nameplate ethylene capacity of 3.6 million
tonnes a year of ethylene. This makes Taiwan the fourth largest producer
of olefins in the Far East. All of the production is from naphtha so that
large volumes of propylene, higher olefins and aromatics are also
produced. These feedstocks are used to produce a range of polymers,
fibre intermediates and petrochemicals in large integrated complexes.

18 Petrochemical Economics
There are only two major players producing olefin monomers: The
China Petrochemical Development Corporation (often referred to as
CPC, but this can lead to confusion with other Taiwan and mainland
Chinese organisations) was the original government owned organisation
(now privatised) charged with development of Taiwan’s petrochemical
industry. It can be regarded as a diversified conglomerate with interest in
housing and construction as well as chemicals. The Formosa
Petrochemical Corporation (FPC) is a subsidiary of the Formosa Plastics
Corporation and has major investments in ethylene and downstream
petrochemical operations. The location and size of the current (2008)
cracking operations are given in Table 1.8.
Table 1.8: Taiwan Petrochemical Operations
COMPANY LOCATION t/y
Chinese Petroleum Corp. Kaohsiung Linyuan 422000
Chinese Petroleum Corp. Linyuan 230000
Chinese Petroleum Corp. Linyuan 419000
Formosa Petrochem. Corp. Mailiao 450000
Formosa Petrochem. Corp. Mailiao 900000
Formosa Petrochem. Corp. Mailiao 1200000
All of the cracking operations use naphtha as feedstock. The future
developments of Taiwan’s petrochemicals business are linked to
developments in the refinery sector which provide the feedstock. Until
recently, the supply of petroleum products was in the hands of the
government owned Chinese Petroleum Corporation (another CPC!)
which operated three refineries and a condensate splitter. These
operations supplied the downstream petrochemical plants with naphtha.
However, the advent of Taiwan’s entry into the WTO has broken this
monopoly and FPC has established itself as Taiwan’s first private refiner.
The FPC refinery was built with the intention of facilitation feed supply
to its new crackers. This opening of the petroleum market is allowing the
entry of other players and some of the world oil majors have begun to
enter the market.
As well as having some of the world’s large integrated facilities,
Taiwan has major world players in the downstream products and

World Ethylene Production by Steam Cracking 19
markets. Some of these operations are wholly owned subsidiaries of the
major ethylene producing companies. However, there are some major
independents that started out in a niche downstream market and have
now expanded to become major players in the Far East chemicals
industry.
Because many of the companies started in the downstream sector
they have been open to further downstream high-tech sector investments.
Furthermore, relative to mainland China, Taiwan’s labour cost are high
and this has seen a slowing of investment in traditional petrochemical
operations in favour of placing such investment in the mainland.
However, there is a major shift underway into the higher added value
engineering plastics, electronic plastics (LCDs) and biotechnology and
biomaterials. These future developments in advanced materials are being
spurred by Japanese investment in joint ventures.
India (2.515 kt/y)8
The past ten years has seen a spectacular growth in the Indian
petrochemicals and polymer industries so that today India is a major
player in the region. India now has a nominal ethylene capacity of 2.5
million tonnes of ethylene, which places it fifth in terms of capacity in
the Far East.
The per capita consumption of polymers at 2.7 kg/y is way below
the world average (c. 19 kg/y; compare the developed world >70 kg/y).
The demand is growing rapidly at about 12% per annum. This means that
most of the new capacity is focused on the increasing domestic demand
rather than in the production of export product (compare with Singapore
with its export oriented industry). However, in the short term there may
be some over-capacity and hence the potential for exports. Most of the
plants are on the western side of India. The principal ethylene producing
facilities are listed in Table 1.9.
Reliance Industries Ltd (RIL) is a large industrial conglomerate
with interests in petrochemicals, refining, textiles, power generation, oil
and gas exploration and telecommunications. RIL is one of the world’s
major manufacturers of plastics and polymers. It has over 50% market
share of the Indian market and claims to be the 6th largest PP producer in

20 Petrochemical Economics
the world with a capacity of 400,000 t/y. It has a large ethylene cracker
(750,000 t/y, naphtha feed) at Hazira and is the majority owner of a very
large refinery at Jamnagar, both in Gujarat. The refinery produces large
volumes of propylene for PP production.
Table 1.9: Indian Petrochemical Operations
COMPANY LOCATION t/y
Gas Authority India Pata, Utta Pradesh 300000
Haldia Petrochemicals Haldia, West Bengal 520000
Indian Petrochemicals Corp. Baroda, Gujarat 130000
Indian Petrochemicals Corp. Gandhar, Gujarat 300000
Indian Petrochemicals Corp. Nagothane 400000
National Organic Chemical Ind. Thane, Maharashtra 75000
Reliance Industries Hazira, Gujarat 790000
Petrochemical operations are vertically integrated through
polyester and fibre intermediates to large textile operations. It is one of
the world’s largest producers of para-xylene and PTA.
Indian Petrochemical Corporation Ltd. (IPCL) is a government
owned corporation with the remit to expand the petrochemical and
plastics production of India. It has a naphtha based ethylene cracker at
Vadodara (132,000 t/y), and large gas based complexes at Nagothane
near Mumbai (Bombay; 400,000 t/y) and Dahej near Bharuch in Gujarat
(300,000 t/y). The company produces polymers, fibre intermediates,
catalysts and absorbents.
Gas Authority of India (GAIL) is a government authority that
markets gas produced by various upstream producing consortia. GAIL
operates a 300,000 t/y ethylene cracker at Pata in Uttar Pradesh. The
ethylene is processed downstream to HDPE and LLDPE.
Haldia Petrochemicals Ltd (HPL) has a large naphtha cracker at
Haldia in eastern India (West Bengal). Downstream the company
operates LLDPE, HDPE and PP plants.
National Organic Chemical Ind. Ltd (NOCIL) was established in
the early 1960s with a series of collaborative agreements with Shell and
UOP and was the first company to set up a naphtha based cracker in

World Ethylene Production by Steam Cracking 21
India at Thane near Mumbai (Bombay). The plant is small by today’s
standards with a capacity of 75,000 t/y ethylene. NOCIL produces
petrochemicals and rubbers.
Oswal Agro Mills Ltd. is an agricultural company with several
fertilizer plants with a small (naphtha) cracker producing 22,000 t/y
ethylene near Mumbai (Bombay). Chemplast Sanmar Ltd. (CSL) is a
small company focusing on the production of chloro-chemicals. Based
in Tamil Nadu, the company has a small ethylene plant which uses
ethanol as a feedstock.
Indonesia (520 kt/y)
Indonesia is currently a minor player in the Far East olefins
industry. The industry is centred on a single world-scale naphtha cracker
at Cilegon in West Java. PT Chandra Asri owns the plant. The feedstock
is entirely naphtha. As built, the plant has an ethylene capacity of
515,000 t/y of ethylene and 240,000 t/y propylene which feeds several
downstream operations.
Japan (7,265 kt/y)9
Japan has a major slice of the ethylene production capacity in the
Far East, with nameplate capacity of approximately 23% of the area’s
total nameplate capacity. Japan has a ethylene production capacity of
about 7 million tonnes per year. This nameplate capacity has been stable
since the mid-1990s and growth is expected to be modest, mainly by de-
bottlenecking operations. This static growth in capacity is in contrast to
most of the other countries in the Far East which have seen large
increases in capacity since the latter part of the 1990s. This has resulted
in Japan’s share of capacity in the Far East falling from 41% in 1995 to
about 23% today.
The production capacity is in the hands of 10 manufacturing
companies. The names, locations and capacities are shown in Table 1.10.
Four companies [Mitsubishi, Mitsui (through Ukishima and Keiyo
Ethylene), Idemetsu and Showa Denko] hold 68% of the nameplate
capacity.

22 Petrochemical Economics
Table 1.10: Japanese Petrochemical Operations
COMPANY LOCATION t/y
Asahi Kasei Corp Kurasiki, Okayama 484000
Idemetsu Petrochem. Chiba 374000
Idemetsu Petrochem. Tokuyama 450000
Keiyo Ethylene Ichihara, Chiba 768000
Maruzen Petrochemicals Chiba 480000
Mitsubishi Chemical Corp. Kashima 375000
Mitsubishi Chemical Corp. Kashima 453000
Mitsubishi Chemical Corp. Mizushima 450000
Mitsui Chemicals Inc. Chiba 553000
Mitsui Chemicals Inc Takaishi City, Osaka 450000
Nippon Petrochemical Kawasaki 450000
Showa Denko Oita 600000
Sumitomo Chemical Co. Ltd. Chiba 380000
Tonen Chemical Corp. Kawasaki 505000
Tosoh Corp. Yokkaichi, Mie 493000
Apart from one plant of Keiyo Ethylene (a subsidiary of Mitsui)
and one plant of Mitsubishi, all of the producing plants are over 10 years
old, most are over 25 years old. This means that most of the capital is
fully depreciated and most plants can operate on a basis ignoring capital
costs. This helps the Japanese operations to survive periods of depressed
ethylene prices.
Of the total ethylene production about 68% is used immediately
near the plant by subsidiary companies and affiliates. About 28% is sold
on the merchant market and about 4% is exported.
The large merchant trade (about 2 million tonnes per year) is
helped by an extensive pipeline system with 88% of ethylene being
delivered by pipeline to the end user. The remaining 12% (about 800,000
t/y) is delivered by ship or barge, to the largely coastal petrochemical
plants in Japan. The fleet dedicated to intra-Japan trade comprises about
11, mostly refrigerated, vessels with a range of capacities from 440
tonnes to 1700 tonnes of ethylene. Shipping terminals for ethylene
facilitate a small import trade in ethylene of about 20,000 t/y.

World Ethylene Production by Steam Cracking 23
The dominant feedstock is naphtha, although in some cases
hydrogenated natural gas liquids (H-NGL or condensates) are used.
However, the choice of condensate is probably restricted to those with a
low end point (i.e. they are very similar to naphtha such as A-180 from
Saudi Arabia). There is a small use of LPG (butane and propane) in
some of the cracking operations.
Like many countries in the Far East, there is a relatively high
demand for propylene. To maximise propylene production from naphtha
cracking, the process plant is operated at low severity. In order to
maintain design levels of ethylene, more naphtha feedstock is required,
with the naphtha requirement being about 3.8 times the weight of
ethylene produced. This creates a large demand of about 750,000 to
800,000 bbl/d for petrochemical (paraffinic) naphtha.
Most naphtha (65%) is imported, the rest is produced domestically
by distilling crude oil in refineries. Due to the large demand and
concomitant international trade, it is the Japanese petrochemical market
that sets the specification for traded naphtha in the Far East - the so-
called “Japanese open spec.”. Most producers of naphtha ensure that
their product meets this specification as is illustrated in by the data in
Table 1.11.
Table 1.11: Japanese Open Spec and Some Typical Naphtha Compositions
B.P. (C) DENSITY (kg/l) PARAFFINS
Japan Open Specification 24 to 204 0.665 to 0.740 65 Min
Cooper (Australia) full range 0.729 69.6
Udang (Indonesia) 32 to 191 0.7264 75.5
Khafji (Kuwait) 32 to 190 0.7201 73.4
A-180 ( Yanbu, Saudi Arabia) 36 to 154 0.6689 93.8
Naphtha cracking provides about 4.3 million tonnes of propylene
per year, which is out of a total demand for propylene in excess of 5.3
million tonnes per year. The difference (about 20%) is made up by
propylene extracted from refinery off-gases, particularly FCC operations
(used to produce gasoline from heavier feed stocks such as heavy gas-oil
or residua).

24 Petrochemical Economics
Korea (5,630 kt/y)
South Korea is a major player in the Far East olefins and poly-
olefins markets with 17% of the regions total ethylene capacity of 32
million tonnes /year.
The current (2008) total nameplate capacity of the South Korean
petrochemical industry is 5.63 million tonnes. The major players,
location and nameplate capacity (2008) are shown in Table 1.12.
Table 1.12: South Korean Petrochemical Industry
COMPANY LOCATION t/y
Honam Peterochemical Yeochun 700000
LG Daesan Petrochemical Daesan 450000
Lotte Daesan Petrochemical Daesan 600000
Korea Petrochem Ind. Ulsan 320000
LG Petrochemical Co. Yeosu City 760000
Samsung General Chemicals Daesan 820000
SK Corp. Ulsan 185000
SK Corp. Ulsan 545000
Yeochon Yeochun 420000
Yeochon Yeochun 480000
Yeochon Yeochun 350000
All of the plants use naphtha as feed and so produce a broad range
of olefins and by-products enabling the production of a large range of
products in large integrated complexes. The domestic demand is less
than 50% of the production that is the petrochemical operations are
export oriented. One aspect of the reliance of the Korean petrochemical
sector on exports is the suspicion that during the depths of the
petrochemical business cycles, the plants operate on a cash-cost basis.
This allows them to undercut rivals having to service debt.
The financial crisis in the Far East during the late 1990s exposed
the high debt levels of the petrochemical operations, which were not
being serviced. This has forced restructuring of the industry in order to
reduce debt levels. For instance some companies had debt/equity ratios
of well over 300%. Since restructuring, these levels have been reduced,

World Ethylene Production by Steam Cracking 25
but are still typically in the 200% region. However, there has been some
criticism of the restructure as involving too much financial engineering
with total debt still similar to 1997 levels. How these operations will fare
in the current crisis of 2009 is moot.
North Korea
As a consequence of the recent political events on the Korean
peninsula, there is increasing interest in how the North Korean economy
can be integrated into the economies in the Far East. North Korea has
permitted some foreign investment in recent years and North Korea has
recently asked the World Bank for guidance in establishing a market
economy.
North Korea has a nominal ethylene capacity of 60,000 t/y at a
plant in Pyongyang. This very small operation could expand should oil
be discovered in offshore blocks currently being explored by western
companies including Australia’s Beach Petroleum.
A more promising basis for the development of chemical and
petrochemical plants in the north might come as a consequence of any
trans-Korean gas-pipeline developments from the very large Russian
Kovylta gas fields at Irkutsk. This might provide both energy and
feedstock (ethane) for future petrochemical developments.
Malaysia (1,649 kt/y)10
Although currently a minor player on the Far East petrochemicals
scene, Malaysia has a strong and growing petrochemical sector with a
nameplate ethylene capacity approaching 1.7 million tonnes per year.
Led by Petronas (the national oil company), Malaysia has attracted over
US$ 7.6 billion since 1997 and a further US$ 5 billion is committed from
2001.
There are three major ethylene plants that feed downstream
operations. All are based on the Malaya Peninsula: Table 1.13.
The oldest plant and largest integrated petrochemical plant is at
Kertih in Terengganu State. This complex uses gas from the major oil
and gas fields off the eastern cost of the Peninsula.

26 Petrochemical Economics
Table 1.13: Malaysian Petrochemical Operations
COMPANY LOCATION t/y
Ethylene Malaysia Kerith 400000
Optimal Olefins Kerith 600000
Titan Petrochemicals Pasir Gudang, Jahor 249000
Titan Petrochemicals Pasir Gudang, Jahor 400000
The other major olefins plants are at Pasir Gudang in Jahor
operated by the Titan Group. These plants utilise naphtha or LPG as
feedstock that can be imported via the large Jahor port. Initially built
around providing feed to poly-olefins plants, these facilities have
expanded to produce aromatics. Clearly there is the potential for these
developments to offer synergy with the large complexes in Singapore.
Many of the downstream operations involve multinational corporations
in a leading role.
Other chemicals operations are in Sarawak. Offshore gas feeds a
large methanol plant (660 kt/y) on Labuan Island and an ammonia plant
at Bintulu. Also at Bintulu is the large Shell Gas to Liquids plant, which
produces high valued linear-paraffins and wax as by-products. The
naphtha fraction from the GTL plant is used as petrochemical naphtha.
The petrochemical complexes in Malaysia are export driven. The
competitive advantages lie in low priced gas feedstock and large
integrated plants based on naphtha. The resulting complexes are able to
deliver chemical intermediates throughout the Far East.
Singapore (1,980 kt/y)
The petrochemical operations in Singapore are based on Jurong
Island. From a cluster of small islands in 1995, the site has been
transformed by massive civil engineering to create a large flat land base
dedicated to the production of petrochemicals and the integrated
downstream industries. These infrastructure works alone have cost the
Singapore government in excess of US$ 6,000 million to date. These
developments are continuing and Singapore continues to attract private
investment lured by the benefits of manufacturing chemicals on a world-
scale fully integrated site in the Far East. The petrochemical operations

World Ethylene Production by Steam Cracking 27
are based around two major naphtha cracking operations. ExxonMobil
Singapore (capacity 900 kt/y ethylene) is now complete and operational
and Petrochemical Corporation of Singapore (PCS) has recently been
expanded to over a million tonnes of ethylene. Another world-scale
cracker is reported to be under consideration by Shell.
Cracker feedstock for the Island is entirely imported. Two large oil
refineries (ExxonMobil Singapore Pte. Ltd. (227,000bbl/d) and
Singapore Refining Company (285,000bbl/d)) supply naphtha to the
main cracking operations and additional feedstock supply can be
obtained from other Singapore refineries (Shell Eastern Petroleum
(405,000bbl/d) on Pulau Bukom and ExxonMobil Oil Singapore
(255,000bbl/d) on the mainland near Jurong). Undersea pipelines
integrate all these facilities.
Juxtaposed to these main facilities are clustered a large number of
chemical processing companies producing intermediates and finished
petrochemical products. In order to achieve the greatest benefits, an
integrated site requires the sharing of utility services. This minimises the
capital requirements for investment by eliminating the need for power,
steam, gas, shipping terminals etc. required for stand-alone facilities.
Jurong Island’s integration is achieved by the existence of a series of
service industries dedicated to providing supporting services and utilities
to the chemical plants.
Thailand (2,272 kt/y)11
There are four main olefins plants at Map Ta Phut in Rayong
Province just south of Bangkok. These plants have a capacity of over 2
million tonnes of ethylene (Table 1.14), making Thailand a major player
in Far East petrochemicals.
Table 1.14: Thai Petrochemical Industry
COMPANY LOCATION t/y FEEDSTOCK
PTT Chemical Map Ta Phut 437000 Ethane LPG
Rayong Olefins Co. Ltd.. Map Ta Phut 800000 LPG naphtha
PTT Chemical Map Ta Phut 350000 Ethane
PTT Chemical Map Ta Phut 385000 LPG naphtha
PTT Chemical Map Ta Phut 300000 Ethane

28 Petrochemical Economics
South America
Although South America is a smaller player in the world
petrochemical industry, three countries have significant and growing
operations. The largest is Brazil (3.5 million tonnes) in six world scale
operations. Feedstock for five of these is naphtha with the other based on
ethane and LPG. Argentina has a nameplate capacity of 838 kt/y. Three
of these plants are small local operations. Venezuela has a nameplate
capacity of 600 kt/y in two operations. The operations, locations and
feedstock are detailed in Table 1.15.
Table 1.15: Some South American Petrochemical Operations
COUNTRY COMPANY LOCATION t/y FEEDSTOCK
Brazil Braskem SA Camacari Bahia 600000 Naphtha
Braskem SA Camacari Bahia 680000 Ethane LPG
Copesul Triunfo, RS 700000 Naphtha
Copesul Triunfo, RS 500000 Naphtha
Petroquimica Uniao SA Santo Andre, SP 500000 Naphtha
Rio Polimeros Duques De Caxais 520000 Naphtha
Argentina Dow Chemical Bahia Blanca 275000 Ethane
Dow Chemical Bahia Blanca 490000 Ethane
Huntsman Corp. San Lorenzo 21000 Propane/
Naphtha
Petrobas Energia Puerto San Martin 32500 Propane
Petrobas Energia San Lorenzo 20000 Propane
Venezuela Pequiven – Petrochima El Tablazo, Zulia 250000 Ethane
Propane
Pequiven – Petrochima El Tablazo, Zulia 350000 Ethane
Africa
There are only a small number of cracking operations in Africa.
The main producers are Egypt, Libya and Nigeria each with a capacity of
about 300,000 t/y and South Africa with a capacity of 585,000 t/y. The
latter production is integrated with the large coal and gas to liquids
operations of Sasol.

World Ethylene Production by Steam Cracking 29
Feedstock and Carbon Emissions
Based on nameplate capacity, the relative amounts of feedstock
used are shown in Figure 1.11. This graph illustrates that the two largest
feedstocks are ethane and naphtha with naphtha accounting for over 50%
of the required feedstock. LPG (propane, butane) and gas oil make a
contribution, but in total this is less than 20%.
Figure 1.11: World ethylene feedstock
A typical naphtha cracking operation will use approximately 3.3
tonne naphtha per tonne of ethylene. Using this as a basis, the world
demand for petrochemical naphtha is almost 200 million tonnes per year
or almost 5 million barrels of naphtha per day. The ethane required is
typically 1.3 tonnes of ethane per tonne of ethylene. This translates into
41 million tonnes of ethane per year. Most of this is derived from natural
gas which (on a weight basis) contains about 10% ethane, hence some
400 million tonnes of natural gas is required to be processed to provide
the world’s petrochemical ethane or about 63 bcf/d of raw natural gas.
Ethylene cracking operations produce carbon dioxide emissions
from fuel oil consumed in furnace operations and losses as a
consequence of operational issues (flaring). Using the above data, the
ETHANE
PROPANE
BUTANE
NAPHTHA
GAS OIL
REF GAS
OTHER
0.0%
10.0%
20.0%
30.0%
40.0%
50.0%
60.0%

30 Petrochemical Economics
estimate of the world’s emissions is 255 million tonnes of carbon
dioxide. The breakdown by feedstock is shown in Figure 1.12.
Ethane and LPG cracking give little product other than ethylene
and propylene. However, naphtha and gas oil produce large quantities of
by-products such as pyrolysis gasoline. Assigning some of the carbon
dioxide produced to these by-products lowers the carbon dioxide
emission attributable to the olefins. Although naphtha produces much
higher levels of carbon dioxide than ethane, distributing the emission
over all the products produced lowers the total emission from naphtha to
appoint where it its lower than for ethane cracking.
Figure 1.12: World carbon dioxide emissions from ethylene production
One of the issues facing the world petrochemical industry is the
issue of placing some sort of emissions charge on carbon dioxide
emitting industries, this is especially true for the developed economies
which generally use naphtha feedstock. The application of a carbon
emission charge would encourage the relocation and investment in many
of the developing countries with emerging petrochemical industries.
Many of these countries, especially in the Middle East, use ethane as the
feedstock and as illustrated such a move may not necessarily result in
lower overall emissions.
ETHANE
PROPANE
BUTANE
NAPHTHA
GAS OIL
REF GAS
0.0
50.0
100.0
150.0
Mill
ion
To
nn
es C
O2
/ye
ar
OLEFINS ONLY
ALL PRODUCTS

World Ethylene Production by Steam Cracking 31
1
Oil & Gas Journal, “International Survey of Ethylene from Steam Crackers”, July
2008; see also W. Sedriks, ibid., Nov. 5, 2001, p. 58
2
A. W. Al-Sa’doun, Oil & Gas Journal, Nov. 13, 2000, p. 52
3
A. M. Aitani, Oil & Gas Journal, Jul. 29, 2002; A.Al-Sa’doun, ibid., Jan 2, 2006, p. 52
and Jan 9, 2006, p. 48
4
M.H. Buffeboir, J.M. Aubury, X. Hurstel, , Oil & Gas Journal, Jan. 19, 2004, p. 60;
A. Aik, S. Adibi, ibid. Mar. 26, 2007, p. 48
5
T. Chang, Oil & Gas Journal, Aug 20, 2001, p. 72
6
See also G. Kin, Hydrocarbon Asia, Jul/Aug 2006, p. 48
7
Wang Yong, Hydrocarbon Asia, Sep. 2002, p.16
8
J. W. King, Oil & Gs Journal, Feb. 11, 2002, p. 58
9
Anon., Hydrocarbon Asia, Jul/Aug 2005, p. 16; idem., Nov/Dec 2002, p. 30
10
Anon., Oil & Gas Journal, Sep. 18, 2000, p. 58; Anon., Hydrocarbon Asia, Nov/Dec
2005, p. 8
11
Anon., Hydrocarbon Asia, Sep/Oct. 2005, p. 10

This page intentionally left blankThis page intentionally left blank

33
CHAPTER 2
CHEMISTRY OF OLEFIN PRODUCTION
The principal olefins for the production of polymers and resins are
ethylene and propylene. These are made by cracking larger molecules,
which for the most part are paraffins. Two processes are involved –
thermal cracking (pyrolysis) and catalytic cracking. Of these two types
the former is the dominant process for the production of ethylene and
propylene whilst the latter makes a significant contribution to the
production of propylene.
The academic and patent literature of hydrocarbon pyrolysis is
very large. An extensive exposition of various aspects of pyrolysis is
given by Albright et al.1
to which the reader is referred for greater detail
of many aspects of the industrial uses of pyrolysis. This chapter gives the
salient features of the chemistry of hydrocarbon pyrolysis as it applies to
describing the key points of the technology and economics of production
of olefins.
We are concerned with the breaking of carbon–carbon and
carbon– hydrogen bonds in large molecules by thermal processes. These
processes occur by the means of free radicals. It is the production of free
radicals and the subsequent rearrangement which produces the products
of the steam cracking plants. The free radical chemistry generally occurs
in the gaseous or liquid phase away from surfaces, and is thus
distinguished from catalytic pyrolysis which requires a usually acidic
surface to proceed. The chemistry of catalytic cracking processes is
important in the production of propylene in fluidized-bed cracking
operations.
The distinguishing feature of thermal (free radical) cracking in the
gaseous phase and acid catalysed processes is that the former leads to
ethylene as a major product. Ethylene is only a minor product in catalytic

34 Petrochemical Economics
processes and where it is present in catalytic processes it can be argued
that this is a consequence of thermal processes. When surfaces are
present in thermal processes, this tends to lead to unwanted formation of
carbon or coke.
A key technical difference between the two approaches is that
thermal cracking of hydrocarbons to ethylene is usually performed at
temperatures in excess of 800o
C, whereas catalytic processes occur
generally below 550o
C.
Thermodynamics of Thermal Cracking
For the most part we are concerned with the breaking of carbon-
carbon and carbon-hydrogen bonds and subsequent rearrangement of
intermediate free radicals to produce ethylene. These bonds are broken
by the simple application of temperature and because the bonds of
interest are strong, high temperatures are required.
Ethylene is produced in large quantities in many countries by the
thermal pyrolysis of ethane with the generalised stoichiometry:
C2H6 = C2H4 + H2
The key features of the thermodynamics of ethane pyrolysis are
illustrated in Figure 2.12
, which shows the free energy relationship of
ethane to the product ethylene and other compounds of interest over a
range of temperatures. This graph illustrates several points which are
central to the technology and production economics of ethylene
production:
Over most of the temperature range, all of the compounds have
positive free energies. This means that they are unstable relative to the
elements. Thus the most favoured thermodynamic products are carbon
and hydrogen.
C2H6 = 2C + 3H2
and
C2H4 = 2C + 2H2
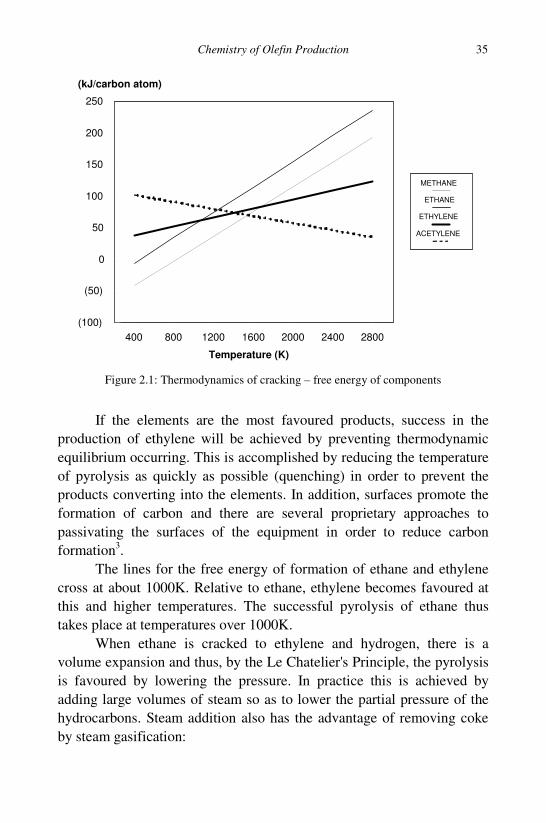
Chemistry of Olefin Production 35
Figure 2.1: Thermodynamics of cracking – free energy of components
If the elements are the most favoured products, success in the
production of ethylene will be achieved by preventing thermodynamic
equilibrium occurring. This is accomplished by reducing the temperature
of pyrolysis as quickly as possible (quenching) in order to prevent the
products converting into the elements. In addition, surfaces promote the
formation of carbon and there are several proprietary approaches to
passivating the surfaces of the equipment in order to reduce carbon
formation3
.
The lines for the free energy of formation of ethane and ethylene
cross at about 1000K. Relative to ethane, ethylene becomes favoured at
this and higher temperatures. The successful pyrolysis of ethane thus
takes place at temperatures over 1000K.
When ethane is cracked to ethylene and hydrogen, there is a
volume expansion and thus, by the Le Chatelier's Principle, the pyrolysis
is favoured by lowering the pressure. In practice this is achieved by
adding large volumes of steam so as to lower the partial pressure of the
hydrocarbons. Steam addition also has the advantage of removing coke
by steam gasification:
400 800 1200 1600 2000 2400 2800
Temperature (K)
(100)
(50)
0
50
100
150
200
250
(kJ/carbon atom)
METHANE
ETHANE
ETHYLENE
ACETYLENE

36 Petrochemical Economics
C + H2O = CO + H2
The Figure 2.1 also shows that up to about 1700K, methane is
more thermodynamically favoured than ethylene and is hence a potential
significant product of the pyrolysis process.
As temperatures rise acetylene becomes an increasingly favoured
product. At temperatures higher than about 1400K, acetylene is more
favoured thermodynamically than ethylene:
C2H6 = C2H2 + 2H2
Minimising the pyrolysis temperature prevents the formation of
acetylene. Conversely, if acetylene is a required product, production is
maximised by high pyrolysis temperatures.
Most ethylene is produced by the pyrolysis cracking of heavier
hydrocarbons such as naphtha. Figure 2.2 illustrates the key
thermodynamic features using heptane as a proxy for the feedstock.
Figure 2.2: Hexane cracking – free energy of products
400 800 1200 1600 2000 2400 2800
Temperature (K)
(100)
(50)
0
50
100
150
200
250
300
(kJ/carbon atom)
METHANE
HEPTANE
ETHYLENE
PROPYLENE
BENZENE

Chemistry of Olefin Production 37
Figure 2.3: Enthalpy of paraffin cracking
In addition to the remarks made for the cracking of ethane, the
graph illustrates the following points pertinent to cracking heavier
molecules.
The cross over point of the free energy curves of heptane and
ethylene occur at a lower temperature than that of ethane, namely at
about 800K. Pyrolysis of naphtha to ethylene can therefore be practiced
at lower temperatures than that required for the pyrolysis of ethane.
Over the temperature range of about 800–1200K, the free energy
of ethylene and propylene are very similar and thus would be
approximately equally favoured, lower temperatures in the range favours
propylene over ethylene.
Benzene is more thermodynamically favoured than the two olefins
and is expected to be a product of the pyrolysis.
Enthalpy of Conversion
The enthalpy of cracking reactions is shown in Figure 2.3. Ethane is seen
to require the highest input of energy to produce ethylene with the
enthalpy falling with increasing molecular weight of the feedstock. The
implication is that higher furnace heat input is required for cracking
300 400 500 600 700 800 900 1000
TEMPERATURE (K)
90
100
110
120
130
140
150kJ/m
ol
EN
TH
ALP
Y C
HA
NG
E P
ER
MO
L C
2H
4
ETHANE
BUTANE
HEXANE
C18H38

38 Petrochemical Economics
lighter feedstock which in turn will lead to higher carbon dioxide
emissions.
Chemical Kinetics4
The thermal pyrolysis of hydrocarbons proceeds by free radical
chain reaction processes. These processes are exceedingly complex and
this overview concentrates on the details as it impacts on the technology
and economics of olefin production.
Radical chain processes comprise three reaction types.
(i) Initiation reactions in which radicals are formed by the
scission of carbon-carbon or carbon-hydrogen bonds.
Reactions such as these involve the breaking of strong
bonds and proceed by overcoming high activation energy
at high temperatures. For example, the cracking of ethane
to form two methyl radicals and the cracking of a
hydrogen-carbon bond in ethane to form an ethyl radical
and hydrogen radical:
C2H6 = 2CH3
.
and
C2H6 = C2H5
. + H
.
(ii) Chain propagation reactions which continue the chain by
transferring a radical from one moiety to another or
rearrangement of a molecule and thereby generating an
intermediate or product. For example, in ethane cracking
reactions which produce methane and hydrogen and
another radical and reactions which produce ethylene and
another radical. These reactions occur at low to moderate
activation energies and involve all possible combinations
of intermediates and products. Because of the low
activation energy and the high temperature required to
initiate propagation these reactions are fast.

Chemistry of Olefin Production 39
CH3
. + C2H6 = CH4 + C2H5
.
H
. + C2H6 = C2H5
. + H2
C2H5
. = C2H3
. + H2
C2H3
. + C2H6 = C2H4 + C2H5
.
(iii) Chain termination reactions which eliminate radicals and
thereby stop the process. These are typically radical
combination reactions which occur at very low activation
energies, hence are immediate when radicals meet, for
example the reaction of a vinyl and a hydrogen radical to
form ethylene.
C2H3
. + H
. = C2H4
Note that in radical chain processes, ethylene is produced by a
series of reactions. The direct conversion of ethane to ethylene and
hydrogen is absent from the scheme:
C2H6 = C2H4
+ H2
To illustrate the complexity of the process of thermal cracking,
Table 2.1 lists some of the more important reactions in the cracking of
propane.
This table illustrates that even for small molecules, the chain
initiation, propagation and termination reactions are extensive. All
possible products can be formed, but again the direct conversion
reactions are absent, namely propane to propylene and hydrogen, or
propane to ethylene and methane.
Another key point to note is that chain transfer and termination by
radical combination leads to radicals and molecules with more carbon
atoms than the feed (propane). Subsequent involvement of these moieties
in the radical chain propagation leads to larger molecules. In practice this
manner of radical cracking of ethane and propane cracking leads to some
C4, C5 and C6+ products forming pyrolysis gasoline.

40 Petrochemical Economics
Table 2.1: Propane Cracking Reactions
INITIATION C3H
8 = CH
3
. + C
2H
5
.
PROPAGATION CH3
. + C
3H
8 = C
3H
7
. + CH
4
C2H
5
. + C
3H
8 = C
3H
7
. + C
2H
6
C2H
5
. = H
. + C
2H
4
CH3
. + H
2 = H
. + CH
4
H. + CH
4 = CH
3
. + H
2
C2H
5
. + H
2 = H
. + C
2H
6
C3H
5
. + C
2H
4 = CH
3
. + C
3H
6
H. + C
2H
4 = C
2H
5
.
C2H
6 = 2CH
3
.
CH3
. + C
2H
6 = C
2H
5
. + CH
4
CH3
. + C
2H
4 = C
2H
7
.
C3H
7
. + C
2H
6 = C
2H
5
. + C
3H
8
H. + C
2H
6 = C
2H
5
. + H
2
H. + C
3H
6 = C
3H
7
.
C3H
7
. = CH
3
. + C
2H
4
C3H
7
. = H
. + C
3H
6
C3H
7
. + H
2 = H
. + C
3H
8
C3H
7
. + CH
4 = CH
3
. + C
3H
8
H. + C
3H
8 = C
3H
7 + H
2
CH3
. + C
3H
6 = C
4H9
.
C2H
5
. + C
2H
4 = C
4H9
.
C4H9
. = H
. + C
4H
8
C4H9
. + H
2 = H
. + C
4H
10
C4H9
. = CH
3
. + C
3H
6
C4H9
. = C
2H
5 + C
2H
4
C2H
5 + C
4H
10 = C
4H
9
. + C
2H
6
C4H
10 = CH
3
. + C
3H
7
.
C4H
10 = 2C
2H
5
.
H. + C
4H
10 = C
4H
9
. + H
2
CH3
. + C
4H
10 = C
4H
9
. + CH
4

Chemistry of Olefin Production 41
Table 2.1 (continued)
TERMINATION 2H. = H
2
H. + CH
3
. = CH
4
H. + C
2H
5
. = C
2H
6
H. + C
3H
7
. = C
3H
8
2CH3
. = C
2H
6
CH3
. + C
2H
5
. = C
3H
8
2C2H
5
. = C
2H
4 + C
2H
6
2C2H
5
. = C
4H
10
CH3
. + C
3H
7
. = CH
4 + C
3H
6
The formation of molecules larger in molecular weight than the
feed is a feature of radical cracking processes. It is clearly demonstrated
in the liquid phase thermal cracking of cetane (C16H34) where olefins
with 32 carbon atoms are formed5
. In fact, in this process some 10% of
the resulting products have higher molecular weight than the feed.
Continuing this process leads to coke precursors and coke, which as
stated above is the thermodynamically favoured product.
Yield of Ethylene and Propylene from Lighter Feedstock
In many parts of the world ethylene and propylene are made from
light gaseous feedstock – ethane, propane and butanes. These are often
derived from large scale gas processing operations. Table 2.2 gives the
typical single pass and ultimate (feed recycled to extinction) yields of
products in steam-cracking processes. All of the products of significance
are shown with ethylene and propylene in bold.
Ethane, as might be expected, shows the highest selectivity to
ethylene. However, note that the pass conversion is low at typically 60%,
with apparently 40% of the ethane feed passing through. This is because
as indicated previously (Figure 2.1) ethane requires a high cracking
temperature. The other products of note are hydrogen and methane which
at 3-4% by weight in the stream occupy a large portion of the stream

42 Petrochemical Economics
Table 2.2: Typical Yields for Gaseous Feedstock
Single Pass Yield Ultimate Yield
C2 C3 n-C4 iso-C4 C2 C3 n-C4 iso-C4
Products
Hydrogen 3.72 1.56 1.49 1.08 6.20 1.68 1.55 1.35
Methane 3.47 23.65 19.90 16.56 5.78 25.43 20.73 20.70
Acetylene 0.42 0.77 1.07 0.72 0.70 0.83 1.11 0.90
Ethylene 48.82 41.42 40.59 5.65 81.37 44.54 42.28 7.06
Ethane 40 3.48 3.82 0.88 0.00 3.74 3.98 1.10
allene/propyne 0.2 1.09 1.07 2.34 0.33 1.17 1.11 2.93
Propylene 0.99 12.88 13.64 26.35 1.65 13.85 14.21 32.94
Propane 0.03 7 0.48 0.38 0.05 0.00 0.50 0.48
Butadiene 1.33 2.82 4.13 1.49 2.22 3.03 4.30 1.86
Isobutene 19.60 0.00 0.00 0.00 24.50
n-butenes 0.25 0.89 1.92 0.42 0.96 2.00 0.00
Isobutane 20.00 0.00 0.00 0.00 0.00
n-butane 4.00 0.00 0.00 0.00 0.00
C5+ aliphatics 0.46 1.37 3.24 2.35 0.77 1.47 3.38 2.94
BTX 0.31 3.07 5.25 2.40 0.52 3.30 5.47 3.00
TOTAL 100 100 100.60 99.80 100.00 100.00 100.62 99.75
C2= & C3= 83.02 58.39 56.49 40.00
volume. Note that even for ethane feed there are measurable quantities of
propylene, butadiene, C5 + aliphatic hydrocarbons and BTX (benzene,
toluene and xylene) produced.
Propane cracking produces a minor amount of propylene in
pyrolysis cracking, the major product olefin being ethylene, with a
commensurate high yield of methane. Pass conversion is much higher
with only 7% of propane in the product stream. Higher molecular weight
products are more prevalent with a significant amount of BTX (over
3%).
Normal-butane gives very similar yields of ethylene and propylene
to propane cracking. Methane is lower and more butadiene, C5 + aliphatic
hydrocarbons and BTX are produced.

Chemistry of Olefin Production 43
Isobutane reverses the relative composition of the olefin products
with the major olefin being propylene (over 30% ultimate yield), double
the yield for propane or n-butane, with a commensurate high methane
yield. A major product is isobutene. The ultimate ethylene yield is only
about 7%.
Note that in the yield of the desired olefins on a weight basis are
about 80% for ethane and less than 60% of the other feeds.
Of the gaseous feeds ethane, propane and n-butane are preferred
for the production of ethylene and high isobutane content should be
avoided. However, for some operations, propylene and isobutene are
valuable products and butane streams of high isobutane content can be
preferred6
.
Thermal Cracking of Larger Molecules
The cracking of naphtha produces most of the world’s ethylene.
Naphtha is the crude oil fraction boiling from about 32o
C to 192o
C. The
composition of naphtha made from crude oil comprises four basic
components: linear paraffins, branched paraffins, naphthenes (cyclo-
paraffins) and aromatics. The relative amount of these in naphtha is
dependent on the source crude oil and varies widely.
The cracking of these larger molecules is extremely complex,
however some important generalisations can be made. These are
illustrated in Figure 2.4 which illustrates what happens when the carbon-
carbon bonds of various types of molecules are ruptured.
Linear Paraffins can break at any of the carbon-carbon bonds
which leads to a relative large number of C2 fragments. For example for
hexane, cracking in the middle (position C in Figure 2.4) gives two C3
moieties. At position B, two C2 and two linear C4 fragments result
because statistically there are two positions. Cracking at position A
similarly gives two C1 and two linear C5 fragments. If these fragments go
on to produce products then the result is that two methane, two ethylene,
two propylene, two butene and two pentene molecules. However, the
linear C4 and C5 moieties have a good chance of further cracking
reactions to produce more ethylene. Molecules like n-hexane have

44 Petrochemical Economics
low octane number (research octane number (RON) is 19 for hexane)
and are less useful to petroleum refiners for the production of motor
gasoline. However, the high yield of C2 fragments on cracking make
linear paraffins attractive to petrochemical operations for producing
ethylene.
Figure 2.4: Fragmentation pathways for pertinent molecular types
Branched paraffins, as illustrated by 2-methylpentane, in a similar
manner leads to three C1 fragments, one C2 fragment, two C3 fragments,
one branched C4 and two linear C5 fragments. Branched paraffins have
relatively high octane (RON is 83 in the case of 3-methylpentane) and
are attractive to refiners for the production of gasoline. The lower level
of C2 formation means they are less attractive to petrochemical
operations.
Naphthenes, as illustrated by methyl-cyclo-pentane, leads to the
formation of one C1 fragment and a cyclo-C5 fragment. The other
possibilities are linear and branched C6 fragments which can ultimately
CH4ABCBA
A
BC
D
CH4
CH4
CH4
EFGH
CH4
I

Chemistry of Olefin Production 45
lead to C2 and C3 products. Naphthenes can have high octane (RON 107
for methyl-cyclo-pentane) and the potential high yield of C2 and C3
makes these molecules attractive to both refiners and petrochemical
operators.
Aromatics, as illustrated by toluene, have very strong bonds in the
ring. Furthermore, benzene is more thermodynamically stable than
ethylene. The main reaction is cracking of the aromatic-aliphatic bonds
to produce benzene and a C1 fragment. These molecules are of little use
to cracking operations but the high octane (RON 124 for toluene) makes
them very attractive for gasoline production.
Olefins are not present in naphtha made from crude oil. However,
some types of naphtha produced as refinery intermediates by thermal or
catalytic cracking processes can contain high levels of olefins. Olefins
tend to lead to high fouling rates in pyrolysis crackers and are usually
avoided as petrochemical feedstock.
There is an extensive international trade in naphtha. The above
discussion illustrates that naphtha attractive to refiners may be less
attractive to petrochemical operators.
Often naphtha is split at about 100o
C into a heavy and a light
fraction. The light fractions tend to have a higher paraffin content and
more attractive to petrochemical operators and the heavy fraction
containing higher levels of naphthenes and aromatics are of interest to
refiners for reforming into high octane blend stock.
As well as naphtha, some operations use gas-oil as the feedstock.
Gas oil is the crude oil fraction boiling typically at 220o
C to 360o
C, and
some processing vacuum gas oils boiling typically at 360o
C to 550o
C.
However, in some instances these crackers have been revamped to use
the atmospheric column bottoms (sometimes called long residua) where
the crude oil being processed has the appropriate properties of high wax
(linear paraffin) content and low metal content (which otherwise
promotes excessive coke formation). This material is often referred to as
Low Sulphur Waxy Residual Fuel Oil (LSWR).
The typical single pass yields to the major products of interest for
these feeds are shown in Table 2.3:

46 Petrochemical Economics
Table 2.3: Cracking Yields from Liquid Feedstock
LIGHT
NAPHTHA
FULL
RANGE
NAPHTHA
GAS OIL VACUUM
GAS OIL
boiling range (C) 36-110o
C 40-164o
C 176-343o
C 335-515o
C
methane 17.4 13.8 11.6 8.9
ethylene 31.0 25.5 24.1 18.9
propylene 18.8 15.3 14.3 13.9
C4 10.0 8.3 8.4 9.7
py-gasoline 14.4 26.9 18.1 19.0
py-fuel oil 2.0 5.1 18.9 24.4
TOTAL 93.6 94.9 95.4 94.8
BTX content 2.6 12.1 24.1 48
The following general remarks can be made about the cracking of
liquids:
• Light naphtha can produce over 30% ethylene with about
half this yield of propylene. Methane yield is also high at
over 17% with production of pyrolysis gasoline lower than
the heavier liquids in the region of 14%. This is
considerably more than the yields of pyrolysis gasoline
(C5+ aliphatic molecules plus BTX) from gaseous feed
stocks discussed above.
• Full range naphtha produces less ethylene but relatively
more propylene. There is a high yield of pyrolysis
gasoline.
• Gas oil produces similar yields of ethylene and propylene
to full range naphtha but there is a large increase in the
production of pyrolysis fuel oil (b.p. >200o
C).
• Vacuum gas oil produces less olefins but relatively more
propylene. The major products are pyrolysis gasoline and
pyrolysis fuel oil.

Chemistry of Olefin Production 47
An important parameter for petrochemical operations is the
relative amount of ethylene and propylene in the product slate. Figure 2.5
summarises the typical relative yields of ethylene to propylene (E/P
ratio) for both gaseous and liquid fuels. Also, it indicates clearly that as
the feed stock gets heavier, the relative amount of propylene rises as
witnessed by a fall in the ethylene/propylene ratio.
Figure 2.5: Typical ethylene/propylene ratios for various feedstocks
Reaction Severity
For liquid feedstock the product slate can be altered by changing
the reaction conditions, particularly the temperature of pyrolysis or the
residence time in the cracking furnace or a combination of the two. This
is generally referred to as changing the severity of the cracking
operation; increasing the cracking furnace temperature leading to higher
severity. The higher temperature leads to more cracking and a higher
yield of ethylene.
The effect on full-range naphtha is illustrated by the data in
Table 2.4. This shows that increasing severity increases the ethylene (and
methane) yield at the expense of propylene and heavier products.
PROPANEBUTANE
ISOBUTANELT NAPHTHA
HV NAPHTHAGAS OIL
VGO0
1
1
2
2
3
3
4
E/P RATIO

48 Petrochemical Economics
Table 2.4: Impact of Cracking Severity on Yields
SEVERITY LOW HIGH
Hydrogen 2.2 3.2
Methane 10.3 15.0
Ethylene 25.8 31.3
Propylene 16.0 12.1
Butadiene 4.5 4.2
C4 7.9 2.8
py-gasoline 27.0 22.0
py-fuel oil 3.0 6.0
TOTAL 96.7 96.6
Computer Modelling of Pyrolysis Cracking
In order to address many of the issues that have been discussed
above there are available proprietary computer modelling programs
which simulate commercial cracking operations. These allow the
operator to simulate changes to furnace cracking operations (severity,
temperature, steam ratio) and changes to feed stock including the relative
amounts of components in the naphtha feed.
The modelling of naphtha cracking in particular is very complex
and the simulation programs make assumptions about the overall
cracking kinetics. These are modified by experience of operation in real
crackers. There are several approaches to developing the models.
Of the various proprietary programs the SKF model is widely used
and is reported to give good matches with commercial experience.
Differences between Pyrolysis and Catalytic Cracking
Catalysts speed up chemical processes; they do not change the
position of thermodynamic equilibrium, so all of the above comments on
the relative thermodynamic position of feed and product molecules
applies to catalytic processes. Because catalysts accelerate chemical
processes (by lowering activation energies) they can be conducted at

Chemistry of Olefin Production 49
considerably lower temperatures than pyrolysis processes and thus
pyrolysis side reactions can be minimised.
For the most part we are concerned with acid catalysed reactions
in which carbonium ions are the key intermediates. Carbonium ions are
formed by the interaction of a feed molecule with an acid site on a
catalyst surface. Carbonium ion chemistry is well defined and has several
features relevant to the production of light olefins. These are illustrated
in Figure 2.6.
Figure 2.6: Carbonium ion reactions
The first reaction involves interaction of a hydrocarbon with the
catalyst surface. Hydride abstraction occurs to form a carbonium ion.
Abstraction can be of any suitable hydrogen atom but if this results in a
primary ion as shown, this will rapidly isomerise by hydrogen shift to the
more thermodynamically stable secondary ion. This may be further
isomerised by carbon shift to a tertiary ion. This contrasts with free
radicals and although isomerisation occurs it is relatively slower. The
carbonium ions can also undergo inter-molecular transfer (not shown)
when a carbonium ion meets another hydrocarbon molecule.
Olefins are formed from carbonium ions by β-scission reaction.
This produces propylene from the secondary ion shown. Isobutene will
+
H
s u r fa c e
s u r fa c e
H
p r im a ry io n
+
H
+
s e c o n d a ryte r t ia ry
+
H Y D R ID E A B S T R A C T IO N
IS O M E R IS A T IO N R E A C T IO N S
+ +
B -S c is s io n
p r im a ry
C R A C K IN G R E A C T IO N S
HYDRIDE ABSTRACTION
primary ion surface
surface
primary
ISOMERISATION REACTIONS
secondary tertiary
CRACKING REACTIONS
B-Scission

50 Petrochemical Economics
be produced from a tertiary ion and small aliphatic molecules also
produced will be branched rather than linear.
Ethylene and methane cannot be produced by β-scission and
ethylene and methane are minor products that may be the consequence of
some radical processes occurring within the spaces between catalyst
particles.
Today much of the propylene used in the world is produced by the
catalytic hydrocarbon cracking in fluid cat-cracking and similar
operations7
.
1 L. F. Albright, B. L. Crynes, W. H. Corcoran (eds.), “Pyrolysis: Theory and Industrial
Practice”, Academic Press, New York, 1983
2 Data was adapted from D. R. Stull, E. F. Westrum, G. C. Sinke, “The Chemical
Thermodynamics of Organic Compounds”, Wiley, 1969
3 D. L. Trimm in “Fundamental Aspects of the Formation and Gasification of Coke” in
L. F. Albright, B. L. Crynes, W. H. Corcoran (eds.), “Pyrolysis: Theory and Industrial
Practice”, Academic Press, New York, 1983
4 L. F. Albright, B. L. Crynes, W. H. Corcoran (eds.), “Pyrolysis: Theory and Industrial
Practice”, Academic Press, New York, 1983
5 T. J. Ford, Ind. Eng. Chem. Fundam., 25, 240, 1986
6 Coastal Isobutane Cracking Process developed by Foster Wheeler
7 P. B. Venuto and E. T. Habib, “Fluid Catalytic Cracking with Zeolite Catalysts”, Marcel
Dekker, New York, 1979
51
CHAPTER 3
GASEOUS FEEDSTOCKS – PRODUCTION
AND PRICE
In this chapter we discuss the methods of production, costs of
production, transport and price of the gaseous feedstocks used to produce
chemicals. The feedstocks of interest fall into two groups – those
produced as by-products of large-scale natural gas developments for
pipeline gas or LNG, and those produced from crude oil.
The first group comprise the natural gas liquids (NGLs), ethane,
propane and butanes. The latter two are often referred to as a LPG and
are often sold as a mixture. These feedstocks are of major interest as
primary feedstock for petrochemical operations for cracking into
ethylene and propylene. Liquids produced from natural gas processing
are often referred to as condensate or natural gasoline. Such liquids are
used in both petrochemical and reefing operations and their use as a
feedstock is discussed in the next chapter.
The second group comprise LPG feedstocks made from crude oil.
These are products of refinery and petrochemical operations processing
heavier feeds such as gas oil and vacuum gas oil and residual fuel oils.
These LPG streams contain materials of direct interest to petrochemical
operations for further processing to other chemicals. With suitable
treatment (hydrogenation) they can be used as cracker feedstock or sold
to other users as an energy fuel.
Gaseous Feed Stocks from Natural Gas
Ethane, LPG and condensate are extracted in large amounts
in the processing of natural gas. When gas comes to the surface it
contains many components which need to be extracted before it can

52 Petrochemical Economics
be used (for example carbon dioxide and hydrogen sulphide). The
components are extracted in different unit operations, the choice and size
of which is dependent upon the raw gas composition and the amount of
component being extracted. Taken together, the different unit operations
are referred to as the gas plant. There are many choices of the design of
the gas plant and all gas plants are unique. For any gas and downstream
application there are usually several viable technical and economic
solutions. An analysis of gas plant design is beyond the scope of this
book and we only consider the principal issues as they concern the
production of NGLs. For further reference the reader is referred to the
author’s book1
on “Gas Usage and Value” and Newman2
, who details 28
approaches to gas plant design, in the “Gas Processes” editions of
Hydrocarbon Processing3
and in the Oil & Gas Journal, which regularly
publishes articles on gas plant design4
. Natural gas which contains large
amounts of nitrogen5
or oxygen6
complicates the design and increases
processing costs.
Liquid products produced from gas come under a variety of
names. Natural gas liquid (NGL) is a generic term for all condensed
products. The C5+ fraction (boiling > 30o
C) is often referred to as
condensate, or sometimes, especially in the US, natural gasoline. The C3
and C4 fraction is liquefied petroleum gas (LPG).
When considering the higher hydrocarbons present in natural gas it
is probably best to recall that a continuum exists in oil and gas reservoirs
from almost pure methane to heavy petroleum oils and waxes. In general,
hydrocarbon deposits do not span to the extremes; higher hydrocarbon
free natural gas is not commonly accounted although there are some very
large natural gas deposits which comprise almost entirely methane7
. Thus
many oil reserves have considerable quantities of associated gas and
most gas reserves have associated with them light oil (condensate)
deposits.
Removal of NGLs is performed sequentially with the highest
boiling fractions being removed first.

Gaseous Feedstocks 53
Removal of Condensate
When raw natural gas comes to the surface it is often saturated
with heavier liquids. Should the gas be cooled, in an undersea-pipeline
for instance, then some of the heavier components condense to form a
slug of liquid in the pipeline. These liquids are removed in a series of
large pipes known as a “slug catcher” – Figure 3.1.
Figure 3.1: Primary gas treatment to remove condensate
Often the gas pressure is sufficient to use a turbo-expander which
cools the gas to below 0o
C and causes further condensation of
hydrocarbon liquids. Because the gas stream also contains water, gas
hydrate and ice formation can be a problem. This is prevented by the
addition of an additive such as methanol. Following the removal of
condensate, the gas stream is dried and if necessary treated further to
remove acid gases such as hydrogen sulphide and carbon dioxide.
Removing excess water from the raw gas is often performed by a
glycol absorption column. In some instances this facility is placed at the
wellhead so that ice and hydrate formation in undersea pipelines is
avoided. In a glycol dehydrator, the glycol absorbs the water which is
then passed to a boiler which boils-off the water and returns cooled
glycol (after heat exchange) to the absorber. There are several variants8
.
SLUG
CATCHER
NGLs
(condensate)
SECONDARY
LIQUIDS REC.
Expander
additive
(methanol)
DRIERTREATED GAS
WELL
HEAD
GAS

54 Petrochemical Economics
In order to remove LPG (propane and butane) from the gas stream,
current processes require the gas stream to be chilled to -20o
C or below.
This requires the complete removal of water and carbon dioxide from the
gas stream.
For the removal of the acid gases, carbon dioxide and hydrogen
sulphide, many choices are available and are very dependent on the
specifics of the gas and the location. Many of the options are described
by Neumann9
and Shaw10
.
After the removal of water and acid gases, the natural gas liquids
can be removed. There are two main processes for the removal of LPG
and ethane: turbo-expansion and refrigerated solvent absorption.
LPG Removal by Turbo-Expansion
The basic flow for a turbo-expander scheme is illustrated in
Figure 3.2. This represents the simplest flow diagram, which can be quite
complex if ethane is to be extracted11
.
Figure 3.2: LPG extraction using turbo-expansion
Gas (known as wet gas because it contains hydrocarbon liquids to
be extracted) enters the turbo-compressor and is compressed to typically
100 bar. The heat of compression is removed in an inter-stage cooler.
The gas is then passed to an expander, which is coupled to the
REBOILER
LPG
CONDENSATE
COOLER
COOLER
INTER-STAGE
COOLER
COMPRESSOR EXPANDERFLASH
VESSEL
WET GAS
DRY GAS

Gaseous Feedstocks 55
compressor in order to recover some of the required shaft power. This
causes the gas stream to cool to below the liquefaction point of the LPG.
Condensed LPG and gas is passed to a flash vessel which
separates the dry gas (i.e. stripped of hydrocarbons) from the liquids. The
liquids are passed to a distillation column where LPG and condensate are
separated. Propane and butane can be separated in an additional column
and a further column is used to separate isobutane and normal butane if
this is required.
Over time turbo-expander systems have improved in efficiency
and can be used to extract ethane by inclusion of gas-to-gas heat
recovery systems12
. These are variously described as cryogenic systems
or cold boxes and are similar in operation to the cryogenic units used for
the production of LNG. The use of cold-boxes permits pre-cooling of the
gas before the turbo-expander and hence an overall colder operation, this
is illustrated in Figure 3.3.
Figure 3.3: Ethane and LPG extraction using cold boxes
Inlet gas enters the first cold box. Here the gas is chilled and
separated liquids are passed to a large de-methaniser column. A second
cold box repeats the process after which the cold gas is expanded to
condense the remaining liquids. The cold gas is now passed to the top of
COLD BOXCOLD BOX
GAS IN
NGLs
GAS OUT

56 Petrochemical Economics
the de-methaniser, where it is used to cool the incoming gas in the cold-
boxes.
Such systems can recover up to about 80% of the ethane present.
Addition of further cooling to the top of the de-methaniser can achieve
over 90% ethane recovery13
.
One point of note is that the use of cold-box technology requires
the removal of mercury from the gas streams. A fire at Santos’ Moomba
facility in Australia in early 2004 was thought to be due to a mercury
attack on the equipment
Straddle Plants
One advantage of the turbo-expander method for separating LPG
from natural gas is that it allows the use of gas-pipelines to transport the
LPG. LPG is costly to store and transport as it requires pressurised or
cryogenic-vessels. By using gas pipelines, the lower cost transport
economics of pipeline gas can be used.
In the straddle plant option, LPG is left in the sales gas at the gas-
plant. The much larger volume of methane dilutes the LPG and the gas
including the LPG meets the pipeline dewpoint specification. The
mixture is then piped over several hundred kilometres to the straddle
plant. This uses a turbo-expander to separate LPG from the gas,
maintaining the residual gas within the heating value specification. There
are several such operations in Canada and Australia which have been
described by Hawkins14
.
Refrigerated Absorption Plants
Before the advent of turbo-expander plants in the early 1970s, the
preferred method for removal of LPG materials from the gas stream was
by absorption in a suitable solvent. To increase the absorption
efficiencies, especially for the recovery of ethane, this technology was
developed by applying refrigerated solvent to the gas stream.
The absorption plants use a hydrocarbon solvent similar to
kerosene in boiling range. This is chilled to about -25o
C or lower
and used to absorb the required components. Because of the low

Gaseous Feedstocks 57
Figure 3.4: Refrigerated absorption plants – main flows
temperatures gas entering the system has to be water dry and low in
carbon dioxide; these components are removed in upstream operations.
Absorption plants comprise three parts: (i) an absorber section,
(ii) a section to remove dissolved gas which is returned to the sales gas
stream and (iii) a distillation unit which expels the absorbed components
and regenerates the solvent. Solvent free of absorbed components is
referred to as lean-oil, solvent containing absorbed components is
referred to as rich-oil. The main flows are illustrated in Figure 3.4.
Water dried, carbon dioxide and hydrogen sulphide free gas i.e.
wet-gas, is chilled (typically to about -35o
C) and enters the bottom of the
absorber tower; there are usually two absorber towers. Condensate
separated in the chiller unit leaves the bottom of the tower, the gas rises
against a chilled falling solvent that has entered the top of the tower (the
lean-oil). The solvent absorbs the heavier constituents while the lighter
sales gas rises to the top of the absorber and exits the top of the tower.
The now rich-oil is collected on an absorber tray above the gas entry
point and passes via heat exchangers to a column (ROD).
The ROD has the duty to remove any sales gas which may have
dissolved and return this to the sales gas stream. The rich-oil enters near
the top of the column and falls against warmed (ca. 50 to 60o
C) rich-oil
SALES GAS
WET GAS
LEAN - OIL
RICH - OIL RICH - OIL
ABSORBERS (2)
ROD ROF
PRODUCTS
condensate
LEAN - OIL

58 Petrochemical Economics
circulating through a heat-exchanger. The degassed oil leaves from the
bottom of the tower and the recovered gas from the top of the tower. This
unit can be operated in two modes. If ethane is not a required product,
the rich-oil is heated sufficiently to expel ethane (ROD means Rich Oil
De-ethaniser) along with methane from the top of the tower. If ethane is
to be extracted, the ROD is warmed to expel mainly methane (ROD
means Rich Oil De-methaniser).
The rich oil passes to the Rich Oil Fractionator (ROF) where the
solvent is boiled regenerating the lean-oil and expelling the LPG (and
ethane) from the top of the tower.
As the fluids pass from the absorber to the ROF, the temperature
rises from ca -35o
C to about 200o
C (boiling point of kerosene). This
temperature difference requires extensive use of heat exchange
equipment between the unit operations within the plant. Furthermore, the
pressure progressively falls from about 100 atm in the absorber to
about 50 atm in the ROD to less than 10 atm. in the ROF. This requires
the lean-oil stream to be pumped against this pressure drop from 10 to
100 atm.
The refrigerated absorber technology is complex and manpower
intensive compared to the turbo-expander technology that has largely
replaced it. However, where they still exist they are particularly useful
for recovering ethane, which is more difficult to extract in turbo-
expander plants without refrigerated cold-boxes15
.
Case Study: Economics of Large Gas Plants
The economics of large gas plants (>1000 MMscfd gas) is of
importance in understanding the production cost of ethane and LPG for
petrochemical feed and to shed light on the economic drivers in refinery
and petrochemicals operations. Because of the large flow of gas, these
plants produce large volumes of natural gas liquids16
.
Natural gas condensate, often called natural gasoline, from these
operations can be used directly as blend-stock for gasoline production.
Its value to the gas plant operation is intimately linked to the prevailing
price of crude oil via the value of gasoline. LPG (propane and butane) is
also linked to the prevailing price of crude oil by the energy market.

Gaseous Feedstocks 59
There are some seasonal factors so the linkage is not as direct for LPG as
is the case for gasoline (these relationships are detailed in a later
chapter).
Ethane (and also propane and butane) is used as a feedstock for the
production of ethylene. For this role it competes with naphtha which has
a direct relationship with oil price.
Large gas plants often have the advantage that when the price of
naphtha (oil) is low relative to the price of gas, ethane can be left in the
gas stream and sold at the gas price thus saving the extraction cost.
Conversely, in time of low gas price and high oil price, ethane can be
extracted and profitably sold.
In this case study we consider a large gas plant with the following
statistics, Table 3.1.
Table 3.1 Statistics for A Large Hypothetical Gas-Plant
INPUT GAS SALES GAS
Flow MMscfd 1000
PJ/y 450 286
Methane vol% 80.20% 94.90%
Ethane vol% 7.00% 1.66%
Propane vol% 4.40% 0.26%
Butane vol% 2.30% 0.03%
C5+ vol% 3.40% 0%
Inerts vol% 2.70% 3.19%
LIQUIDS (t/y) PJ/y
Ethane 650103.9 33.72
Propane 711569.1 35.83
Butane 510951.7 25.3
C5+ 947071.1 46.42
Analysis of recent published data for the construction cost of large
Greenfield gas-plants indicates a cost (2007) of $1078 million17
. The
plant would have the economic parameters given in Table 3.2.

60 Petrochemical Economics
Table 3.2: Economic Statistics for a Large Gas Plant
MMcf/d $/GJ
WELL HEAD GAS COSTS 1000 6.37
kt/y PJ/y MM$/y
CAPEX 1078.26
OPEX (5% CAPEX) 53.91
RECOVERY (10%DCF, 20y, FACTOR 0.143) 154.19
INPUTS
Process Gas 8,409 427.52 2723.28
Fuel and losses (5%) 443 22.50 143.33
TOTAL feed & fuel 8,851 450.02 2866.61
OUTPUTS
Ethane 650 33.72
Propane 712 35.83
Butane 511 25.30
Sales gas 5,589 286.25
Gasoline (C5+) 947 46.42 566.30
TOTAL 8,409 427.52
Thermal Efficiency (%) 95.00%
ALL PRODUCTS
Annual Costs MM$/y 3074.72
Unit Production Cost $/GJ 7.19
Ethane $/t 373.27
Propane $/t 361.76
Butane $/t 352.41
WITH GASOLINE SALES
Annual Costs MM$/y 3074.72
Gasoline Credits MM$/y 566.30
Net production Costs MM$/y 2508.42
Unit production Cost $/GJ 6.58
Ethane $/t 341.61
Propane $/t 331.08
Butane $/t 322.52

Gaseous Feedstocks 61
The typical US well head cost in 2007 was around $6.37/GJ and
this has been used as the basis for the input cost in this case study. The
fixed costs are the non feed operating costs which for a relatively simple
turbo-expander gas plant would be about 5% per annum of the fixed
capital and the capital recovery charge which is placed at 14.3% per
annum of the capital (see Appendix for derivation of this value).
The process gas is supplemented by fuel gas and an operating
allowance which amounts to an addition use of about 5% of the gas
stream. The feedstock costs (raw input gas) dominates the costs of
production.
The plant separates the components into ethane, propane, butane
and natural gasoline and a sales gas which is the principal product. Two
scenarios are developed: the first is when all the processing costs are
assigned to all of the products including gasoline and the second is when
the natural gasoline at the prevailing market price prior to distributing the
costs.
Over all of the products, the production cost is $7.19/GJ. This
produces ethane at $373/t. However, if the natural gasoline is sold
according to the prevailing crude oil price (assumed to be $70/bbl) then
this will generate by-product credit of $556 million; this is based on
valuing the gasoline as naphtha with oil at $70/barrel. The basis of this
oil price as a reference (index) price is discussed in the Appendix. This
approach reduces the production costs and hence the unit ethane and
LPG costs. The ethane production cost is $341/t.
Figures 3.5 and 3.6 give the sensitivity of the liquids production
cost to input gas price and oil price, with gasoline sold prior to the
distribution of the costs. The basis of the costs is in energy terms ($/GJ).
This makes the product cost for ethane, propane and butane very similar
and ethane is chosen as the example.
Figure 3.5 shows the sensitivity to wellhead gas price. This
illustrates that for gas plants using large gas reserves for the production
of LNG which requires the availability of low cost gas (typically <$2/GJ)
will produce ethane below $100/tonne.
Figure 3.6 illustrates that using an input gas price of $4/GJ, there is
a marked inverse sensitivity to rising oil price as the by-product credits
from the natural gasoline rise.

62 Petrochemical Economics
Figure 3.5: Ethane production cost and gas price; oil @ $70/bbl
Figure 3.6: Ethane production cost and oil price; gas @ $4/GJ
The data illustrates that for an input wellhead gas price of $2/GJ or
below, the production cost of the sales gas is about $2.5/GJ. Of interest
are the concomitant production costs of LPG and gasoline, which are
well below the prevailing prices of crude oil derived products. Selling
these at prevailing oil prices makes such operations extremely profitable
at high oil prices. Indeed, the combination of low input gas and high oil
price produces ethane at negative costs. Plants with these statistics occur
in the Middle East and other areas where there is no tangible link
between the wellhead gas price and the prevailing price of energy (oil).
1.00 2.00 3.00 4.00 5.00 6.00 7.00 8.00 9.00
WELL HEAD GAS ($/GJ)
0
100
200
300
400
500
600
ET
HA
NE
CO
ST
S (
$/t
)
30 50 70 90 110 130 150 170 190 210
OIL PRICE ($/BBL)
0
50
100
150
200
250
ET
HA
NE
CO
ST
S (
$/t
)

Gaseous Feedstocks 63
In these cases, such gas plants are often part of integrated refining and
petrochemical complexes and offer the lowest feedstock and hence
petrochemical production costs.
At a wellhead price of $6/GJ or higher, the production cost of the
sales gas and the products are typically over about $6.5/GJ. This is more
typical of the case in the US and Europe where the prices of wellhead gas
are linked to prevailing energy prices. This lowers the operating margin
of the plant.
LPG from Other Sources – LPG Quality
Most LPG is produced by gas plants. However, there are
significant volumes of LPG produced by refinery operations and within
petrochemical operations. These LPG streams have quite different
compositions as illustrated in Table 3.3.
Table 3.3: Composition of Typical LPG Streams
COMPOUND B.P (o
C) Natural
gas
Refinery
(FCC)
Stream
Cracker
Propane -42.1 49% 18.00% 2%
Propylene -47.4 17.40% 53%
Propyne -23.2 trace 3%
Allene -34.5 3%
cyclo-propane -32.7 trace
n-butane -0.5 34% 7.80% 2%
Isobutane -11.7 17% 24.70% 3%
1-butene -6.3 8.20% 3%
cis-2-butene 3.7 6.40% 1%
trans-2-butene 0.9 7.80% 1%
Isobutene -6.9 9.50% 9%
1,3-butadiene -4.4 0.30% 19%
1,2-butadiene 10.8 trace
1-butyne 8.1 trace trace
2-butyne 27 trace trace
but-1-ene-3-yne 5.1 trace
methyl-cyclo-propane 4 to 5 trace
cyclo-butane 12 trace

64 Petrochemical Economics
This illustrates that LPG produced from natural gas comprises
only saturated molecules – propane, normal and isobutane. There is a
large market for these products which are used for refinery operations,
energy fuels and automotive fuel as well as for petrochemical cracking
operations. The properties of these fuels, together with ethane, are given
in Table 3.4.
Table 3.4: Properties of LPG Components
ETHANE PROPANE n-BUTANE iso-BUTANE
Mol Wt 30.07 44.1 58.1 58.1
BP (C) -88.6 -42 -0.5 -11.7
MP (C) -183.3 -187.7 -138.4 -159.6
RVP (psia) -800 190 51.6 72.2
s.g. (liq) 0.3564 0.5077 0.5844 0.5631
HHV (gas, GJ/t) 51.9 50.4 49.5 49.4
HHV (BTU/cf) 1768.8 2517.5 3262.1 3252.7
RON 111.5 112 93.8 101.5
MON 101 97.1 89.6 97.6
Refinery LPG, typically produced from a fluid cat-cracker unit,
contains in addition to paraffins a large amount of olefins particularly
propylene and isobutene. These olefins and isobutane have refinery uses
and are often used in producing additional fuel such as polymer gasoline
and alkylate. Also present are trace quantities of dienes and acetylenes.
If LPG containing olefins and diolefins is to be used as a feed for a
cracking operation then it should be hydro-treated prior to use. This will
prevent olefin polymerisation in the cracking furnace which would lead
to coking. Hydro-treatment of LPG is becoming more common in
refinery operations as the specifications for automotive LPG are
tightened18
.
Changes to refinery operations in countries requiring the
production of high quality gasoline has altered the balance of LPG in
many refineries and many produce LPG for vehicle use or petrochemical
use. Potentially LPG from refineries can be contaminated with dienes
which can lead to excessive coke lay-down in cracking operations.

Gaseous Feedstocks 65
The LPG stream produced by pyrolysis cracking contains all
possible C3 and C4 molecules. As well as olefins, prominent are highly
unsaturated materials such as acetylenes and dienes.
Sometimes propane from natural gas and refinery operations
becomes contaminated with carbonyl sulphide (COS) which is not
removed in acid gas plants. Alternative approaches to removing COS
from liquid propane by sorption processes have been compared by
Wilson et al.19
Ethane and LPG (Propane) from LNG
The enormous growth in the world trade of LNG (liquefied natural
gas) is leading to the idea that re-gasification could generate significant
volumes of ethane and propane. Many of the world’s LNG operations
leave significant amounts of ethane and propane in the LNG in order to
meet the heating specification demanded by the many of the world’s
LNG importers, particularly those in the Far East. However, some
jurisdictions, in particular the US and Europe, in respect to the gas
specification requires the ethane and propane stripped from the gas prior
to distribution. Since the heavier components, ethane and propane, can
constitute 10% of the mass of the LNG then significant volumes of feed
could become available by this route20
.
Use of LPG in the Chemical Industry
The various components of LPG streams are used in a variety of
processes. Propane, butane and isobutane are used as cracker feedstock
for the production of olefins which is discussed in later chapters. In
addition n-butane is used for the production of 1,3-butadiene. This
compound can also be extracted from the C4 cracked gases by extensive
distillation coupled with a selective absorption process.
Butene is used as a co-monomer in the production of LLDPE and
the production of some speciality polymers and ethers. It can be
extracted from C4 cracked gases by distillation or by dehydrogenation of
butane.

66 Petrochemical Economics
Isobutene is also used to produce MTBE. Often the entire C4
cracked gas or FCC C4 stream, which contains isobutene, can be used as
a feed for the MTBE plant without the need to extract the isobutene.
Prices of Gaseous Feed Stocks
Condensate, or natural gasoline, is directly linked in value to
that of crude oil. In many parts of the world it sells at a discount to the
local marker crude oils because its boiling range profile does not easily
fit into normal refinery operations – it contains too much light boiling
fractions relative to typical crude oils. The discount is typically about
$1/bbl but for a given condensate there is considerable variability in the
differential. If the octane is sufficient it may be used as a gasoline blend
stock and this may make it more attractive than crude oil in some
circumstances.
Condensate is often passed to a splitter column and distilled into
light and heavy naphtha for petrochemical operations. This is discussed
further in a later chapter.
Ethane prices are generally determined by local circumstances.
The floor price for ethane is set often priced according to the price of gas
on an energy basis. For example in the US for flexible fuel cracking
operations can use both ethane and naphtha; if demand falls then ethane
can be left in the gas stream and sold as gas. The US Energy Information
Administration collates data for the well-head gas price. The data is
shown in Figure 3.7.
This graph shows collated data from across the US. Prior to about
2000, apart from a few spikes, the prices ranged typically in the range $1
to $2/Mcf. Since 2000, gas prices have been very volatile and as with the
rise in energy prices over the period 2003 onwards there has been a
dramatic rise in the price of well head gas with some extreme peaks over
$10/Mcf.
The ethane “market” price is set by demand, which is influenced
by the relative ratio of oil to gas. In large markets with flexible fuel
cracking operations (US, EU), if oil price is high, ethylene producers
switch to ethane feedstock. If oil price is low, ethylene producers switch

Gaseous Feedstocks 67
to oil (naphtha). However, excess by-products from naphtha can put a
limit onto the extent of the switch.
For some countries the cracking operation is based entirely on
ethane and petrochemical operators enter take or pay contracts for
ethane. Often there is a fixed-variable component in the contract linking
ethane price to the prevailing price of crude oil. Obviously this limits the
benefits to the operator in times of rising oil price with some or all of the
benefit passed on to the ethane supplier.
Figure 3.7: US wellhead gas price
Propane and butane (LPG) price set by reference to the prevailing
LPG market. There is a very large trade in LPG in the major economies.
Its main use is as a commercial energy fuel it is used in very large
amounts to this end. Most of the big producers in the US or the North
Sea sell to the local markets. This leaves Saudi Arabia as the major
swing producer which sells according the supply and demand across
the world. The consequence is that most LPG prices are set relative to
the Saudi Aramco contract price which is set on a monthly basis. The
history of the propane Aramco and US propane price is illustrated in
Figure 3.8.
19
94
19
95
19
96
19
97
19
98
19
99
20
00
20
01
20
02
20
03
20
04
20
05
20
06
20
07
20
08
0
2
4
6
8
10
12
$/M
cf

68 Petrochemical Economics
Figure 3.8: Aramco and US propane prices
Figure 3.9: US propane correlation with oil price (WTI)
The graph illustrates that Aramco and US propane prices
are generally in step with the price ratio average about unity. The graph
also indicates the general rise of prices with time. Since much of the
world’s LPG is used for heating purposes, there is a reasonable
correlation with the prevailing local crude oil marker price. This is
illustrated in Figure 3.9 which plots the US propane price against WTI.
1994
1995
1996
1997
1998
1999
2000
2001
2002
2003
2004
2005
2006
2007
2008
0
100
200
300
400
500
600
700
800
900
1000
1100$/T
onne US PROPANE
ARAMCO
0 50 100 150
WTI ($/BBL)
0
100
200
300
400
500
600
700
800
900
1000
1100
US
PR
OP
AN
E (
$/t)
R-square = 0.957 # pts = 235 y = 31.9 + 7.56x

Gaseous Feedstocks 69
Figure 3.10: Aramco butane and propane correlation
Butane is priced similarly to propane and there is a strong
correlation between propane and butane prices as illustrated in
Figure 3.10 for the Saudi Aramco Contract.
1
D. Seddon, “Gas Usage and Value”, PennWell, Tulsa, Oklahoma, 2006
2
S. A. Newman (ed.) “Acid and Sour Gas Treating Processes”, Gulf Publishing,
Houston, Texas, 1985
3
Gas Processes is published biennially in even years in the April/May editions of
Hydrocarbon Processing
4
For example A. Habibullah, Oil & Gas Journal, June 3, 2002
5
M. J. Healy, A. J. Finn, L. Halford, Oil & Gas Journal, February 1, 1999, p. 36;
M. Mitariten, ibid., April 23, 2001, p. 42; A.S. Padron, J. E. R. Rodriguez, E. B.
Vazquez, A. J. A. Senosiain, G. E. M. Tapia, ibid., December 1 2003, p. 50
6
M. Howard, A. Sargent, Oil & Gas Journal, June 23, 2001, p. 52
7
Coal bed methane (coal seam gas) contains very little hydrocarbon higher than methane.
8
D. W. Choi, Hydrocarbon Processing, July 2006, p. 69
9
S. A. Newman (ed.) “Acid and Sour Gas Treating Processes”, Gulf Publishing,
Houston, Texas, 1995
10
T. P. Shaw and P. W. Hughes, Hydrocarbon Processing, May 2001, p. 53
11
V. Aggarwal, S. Singh, Hydrocarbon Processing, May 2001, p. 41; Y. R. Mehra, Oil
& Gas Journal, October 29, 2001, p. 56; K. L. Jibril, A. I. Al-Humaizi, A. A. Idriss,
A. A. Ibrahim, ibid., March 6, 2006, p. 58
0 100 200 300 400 500 600 700 800 900 1000
ARAMCO PROPANE ($/t)
0
100
200
300
400
500
600
700
800
900
1000A
RA
MC
O B
UT
AN
E (
$/t)
R-square = 0.995 # pts = 183 y = -7.94 + 1.03x
70 Petrochemical Economics
12
R. Chebbi, A. S. Al-Qaydi, A. O. Al-Amery, N. S. Al-Zaabi, H. A. Al-Mansouri, Oil &
Gas Journal , January 26, 2004, p. 64; R. Chebbi, K. A. Al Mazroui, N. M. A. Jabbar,
ibid., December 8, 2008, p. 50
13
A. A. Rahman, A. A. Yusof, J. D. Wilkinson, L. D. Tyler, Oil & Gas Journal, October
25, 2004, p. 58; R. Chebbi, A. S. Al-Qaydi, A. O. Al-Amery, N. S. Al-Zaabi, H. A.
Al-Mansouri, ibid., January 26, 2004, p. 64
14
D. J. Hawkins, Oil & Gas Journal, December 16, 2002, p. 46; ibid., December 23,
2002, p. 54; ibid., January 6, 2003, p. 48; ibid., January 20, 2003
15
S. M. Al-Shahrani and Y. M. Mehra describe an absorbent system for LPG extraction
in Oil & Gas Journal, June 4, 2007, p. 60
16
K. L. Currence, B. C. Price, W. B. Coons, Oil & Gas Journal, April 12, 1999, p. 49
17
Authors analysis of Hydrocarbon Processing “Boxscore” data
18
S. Habibi, J. Nava, Hydrocarbon Processing, July 2007, p. 75
19
S. Wilson, R. Kimmitt, R. B. Rhinesmith, Oil & Gas Journal, September 22, 2003
based on presentation to 82nd
GPA Convention, March 9–12, 2003, San Antonio
20
S. Huang, D. Coyle, J. Cho and C. Durr, Hydrocarbon Processing, July 2004, p. 57;
K. Otto, Hydrocarbon Asia, March/April 2005, p. 20

71
CHAPTER 4
LIQUID FEEDSTOCK, PRODUCTION
AND PRICE
This chapter considers the production and price of liquid feedstock
of interest to the petrochemicals industry. This mainly concerns naphtha,
gas oils and residual fuel oils for both feedstock and energy. These
feedstocks are produced by the primary operations in oil-refining. As a
consequence many petrochemical complexes are juxtaposed to refineries.
For other operations there is a large trade in the required materials and
the feedstock can be purchased on the open market.
Primary Refinery Operations
Here we consider the refinery production of petrochemical
feedstocks. Downstream refinery processes will only be discussed as it
applies to the quality of these feeds.
The primary processes of a refinery operation are illustrated in
Figure 4.1.
Figure 4.1: Primary products from crude oil refining
NAPHTHA
KEROSINE
(30 to 190C)
CRUDEOIL
GAS-OIL
VACUUM GAS-OIL
LPG and FUEL GAS
(190 to 230C)
(230 to 360C)
(360 to 550C)
FUEL OIL
AT
MO
SP
HE
RIC
DIS
TIL
LA
TIO
N
VA
CU
UM
DIS
TIL
LA
TIO
N

72 Petrochemical Economics
Crude oil enters the refinery and is stored and excess salt removed
prior to distillation. Often several different crude oils are co-mingled
before distillation in the atmospheric distillation tower. This has the duty
to separate the crude oil into fractions according to distillation range.
LPG leaves the top of the tower and is passed to a gas-plant where
it is mixed with similar streams from other refinery processes. The
naphtha fraction comes next, boiling between about 30o
C and 190o
C.
Often this stream is split into a light-naphtha (boiling to about 30o
C to
100o
C, often called straight-run gasoline) and a heavy naphtha stream. In
refineries the light naphtha is blended with other streams to produce
gasoline and the heavy naphtha stream is reformed to produce a high
octane stream.
Boiling higher than naphtha is the kerosene fraction, boiling
typically 190 o
C to 230o
C. This fraction is used for the production of jet-
fuel.
The next boiling fractions are the gas-oils, which in the refinery
context are used to produce diesel. In the atmospheric column, the
boiling point of the heaviest fraction is about 360o
C.
The column bottoms are known variously as atmospheric residual
fuel oil or long residua and they contain all of the materials boiling
higher than about 360o
C, including contaminant metals. This material is
often sold as a light fuel oil. If the metal content is low and there is a
high wax content, it can be used as a petrochemical cracker feedstock in
an appropriately configured steam cracking operation.
Shown in Figure 4.2 is a simple refinery flow-sheet. There are
many refineries in the world configured in this manner. These are often
referred to as “simple” refineries. In many of these refineries, the crude
oil column has greater capacity to the downstream processing units and
the refinery sells the excess intermediate streams such as naphtha on the
oil market.
A point of note is that refiners, in meeting the various fuel
specifications, have some flexibility in the distillation cut points and
often change these on a regular basis. This helps the refiner to better
match the output of the column to the demands of the transport fuel
market. For example, if the refiner is faced with an increase in demand
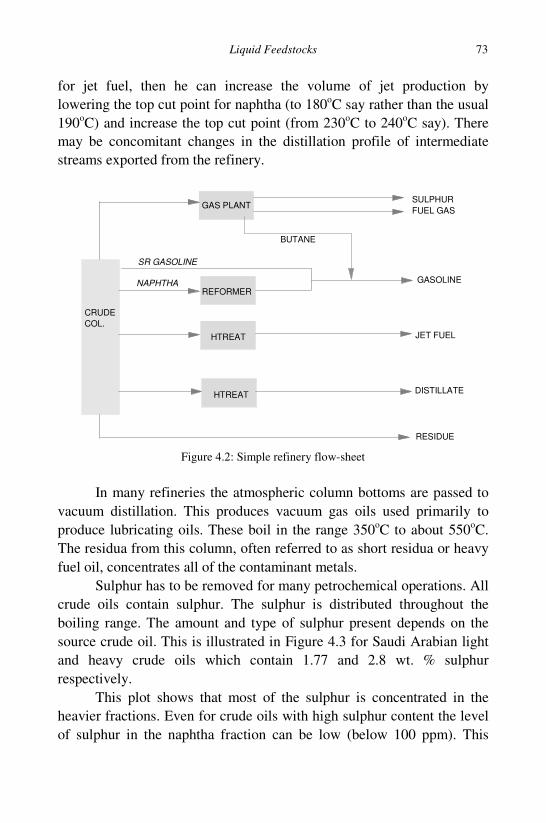
Liquid Feedstocks 73
for jet fuel, then he can increase the volume of jet production by
lowering the top cut point for naphtha (to 180o
C say rather than the usual
190o
C) and increase the top cut point (from 230o
C to 240o
C say). There
may be concomitant changes in the distillation profile of intermediate
streams exported from the refinery.
Figure 4.2: Simple refinery flow-sheet
In many refineries the atmospheric column bottoms are passed to
vacuum distillation. This produces vacuum gas oils used primarily to
produce lubricating oils. These boil in the range 350o
C to about 550o
C.
The residua from this column, often referred to as short residua or heavy
fuel oil, concentrates all of the contaminant metals.
Sulphur has to be removed for many petrochemical operations. All
crude oils contain sulphur. The sulphur is distributed throughout the
boiling range. The amount and type of sulphur present depends on the
source crude oil. This is illustrated in Figure 4.3 for Saudi Arabian light
and heavy crude oils which contain 1.77 and 2.8 wt. % sulphur
respectively.
This plot shows that most of the sulphur is concentrated in the
heavier fractions. Even for crude oils with high sulphur content the level
of sulphur in the naphtha fraction can be low (below 100 ppm). This
GAS PLANT
CRUDE
COL.
REFORMER
HTREAT
HTREAT
SULPHUR
FUEL GAS
GASOLINE
JET FUEL
DISTILLATE
RESIDUE
SR GASOLINE
NAPHTHA
BUTANE

74 Petrochemical Economics
makes the naphtha (commonly referred to as straight-run naphtha) a
particularly attractive feedstock and is used widely to produce synthesis
gas (a mixture of carbon monoxide and hydrogen) for the production of
ammonia, methanol and oxo-alcohols when other low sulphur feed stock
such as natural gas is unavailable1
.
Figure 4.3: Sulphur content and crude fraction; Saudi Arabian crudes
“Complex” refineries build on the simple refinery flow-sheet with
refinery operations with the duty to convert residual fuel into lighter
products (naphtha, kerosene and diesel). Many of these downstream
processes as well as cracking the heavier compounds also introduce
sulphur in the lighter streams. Thus naphtha produced from coking
operations and fluid-cat-crackers are generally higher in sulphur than the
straight-run naphtha. Depending on the fuel quality being produced this
may not be a problem for the refiners but sulphur contamination can be a
problem for petrochemical operations.
Condensate Splitters
Naphtha is also produced from natural gas condensate by
distillation2
. In many condensates there exists a long high boiling tail
which makes it unsuitable for pyrolysis cracking. Further, the relatively
lower value (in mass terms) of condensate relative to naphtha makes it
97.5 235 319 579
MID BOILING POINT (C)
0
1
2
3
4
5
SU
LP
HU
R W
T %
HEAVY (2.80)
LIGHT (1.77)

Liquid Feedstocks 75
economically attractive to distil the condensate. In a typical condensate
splitter, shown figuratively at Figure 4.4, condensate is distilled into a
light and heavy fraction. Light materials and high boiling column
bottoms are used to fuel the distillation furnace if not otherwise used in
other processing activities.
The economics of condensate splitters are variable and depend to a
large extent on an attractive differential between the condensate and
naphtha products.
Figure 4.4: Condensate splitter
Naphtha Quality
The quality of naphtha reflects its source crude oil or condensate
or the refining process that has produced it. From the overview given in
Chapter 2 concerning the selection of naphtha for cracking, it is seen that
petrochemical cracking operations are best served by naphtha with high
linear paraffin and low aromatic content, whereas refinery operations are
best served with naphtha of high branched paraffin and high aromatic
content. Table 4.1 collates the typical properties of various types of
naphtha produced from the distillation of crude oil.
In order to assist buyers of naphtha, parcels are characterised in
terms of this PNA (paraffin, naphthenes and aromatics) analysis. In
addition some organisations use the UOP or Watson K-factor as a
characteristic.
LPG and FUEL GAS
DIS
TIL
LA
TIO
N
LIGHT NAPHTHA (30 - 100C)
HEAVY NAPHTHA
(100 - 190C)
COND.

76 Petrochemical Economics
Table 4.1: Typical Naphtha Properties and Japanese Open Spec.
FRACTION BP (C) DENSITY
(kg/l)
RON P N A K-
factor
FULL RANGE C5 to 200 0.725 52 57 30 13 12.1
LIGHT
NAPHTHA
C5 to 100 0.668 70 82 15 3 12.6
HEAVY
NAPHTHA
100 to 200 0.754 52 55 32 13 11.9
HEAVY 1 100 to 150 0.734 61 55 35 10 12
HEAVY 2 150 to 200 0.773 43 49 36 15 11.8
JAP SPEC 24 to 204 0.665 to
0.740
65
MIN
The UOP K-factor attempts to judge the “paraffinicity” of a
fraction. It can be used for any petroleum fraction as well as naphtha. It
is defined as:
K = Tb
1/3
/s
Where Tb is the molal average boiling point of the fraction in
degrees Rankin and s is the specific gravity of the fraction. The K-factor
can be correlated with other physical parameters of the fraction: API
gravity and viscosity; API gravity and flash point; API gravity and
aniline point; flash point and refractive index.
Paraffinic fractions have K-factors of about 12.5; naphthenes have
K-factors of about 11.5, whereas aromatic fractions have K-factors of
about 10.
The Japanese OPEN Specification
All of Japan and Korea’s large petrochemical industry has been
built around the cracking of naphtha. This has generated a large trade in
naphtha for petrochemical cracking. The naphtha traded conforms to the
so called Japan “open” specification; given in Table 4.1. As may be
deduced, the achievement of this specification is not unduly arduous by
the majority of straight-run naphthas.

Liquid Feedstocks 77
Refinery Intermediate Naphthas
Occasionally naphtha originating from downstream refinery
operations comes onto the naphtha market. The properties of some of
these naphthas (Thermal, Vis-breaker, Coker and Fluid cat-Cracker) are
given in Table 4.2. These intermediate naphthas contain high olefin
content and higher sulphur content than straight-run and should be
avoided in cracking operations because of coke lay-down in the cracking
furnace. Hydro-cracker naphtha has zero sulphur and no olefins but can
still contain significant amounts of naphthenes and aromatics.
Table 4.2: Typical Naphtha Properties (wt%)
S% P O N A RON
Straight run 0.01 50 1 30 19 55
Thermal 0.6 45 25 15 15 75
Vis-breaker 3 23 45 11 11
Coker 2 15 55 3 27 78
Cat-Cracker 0.2 33 44 2 21 91
Hydro-cracker 0 17 0 41 42 84
FT Naphtha SR 0 > 85 < 10 < 2.5 < 2.5 30
FT Naphtha HT 0 > 95 0 < 2.5 < 2.5 20
The properties in the table are representative and there is a range
for each type. Straight-run usually contains 100ppm sulphur or less but
there are some exceptions. Generally straight run has a high level of
paraffins (P), few if any olefins (O) and a varying amount of naphthenes
(N) and aromatics (A). The octane rating (RON) is typically 55 or higher.
Some straight-run naphtha contains high levels of aromatics which do
not make good cracker feed. It has been proposed that such naphtha
could be pre-treated to remove the aromatics prior to the cracking
operation. This would improve ethylene yields and provide additional
aromatics for downstream operations3
.
In recent years there is an interest in converting natural gas or coal
into high quality diesel fuel by the Fischer-Tropsch process (FT). This
produces a significant by-product yield of naphtha with high paraffins

78 Petrochemical Economics
and a poor octane. The straight-run can contain some olefins (typically
10%) and some oxygenates. With post production hydrogenation, which
is usually the case, these are eliminated and the hydro-treated products
(FT naphtha HT) contain almost entirely paraffins making excellent
cracker feedstock.
Mercury, Sulphur and Other Contaminants
Because many petrochemical operations use cryogenic separation
to separate hydrogen in the cracked streams, it is important to maintain
the stream free of mercury. Mercury can contaminate naphtha, especially
if it is derived from natural gas condensate since traces of mercury can
be found in most natural gas4
. Mercury in naphtha is readily removed
using carbon sieve technology5
.
For some uses, even traces of sulphur is a problem and for
reforming there is a wide range of trace contaminants which poison the
precious metal reforming catalyst. For reforming and some cracker
operations, naphtha is hydro-treated immediately prior to use in order to
reduce the level of contaminant to an acceptable level or to assure the
durability of a downstream operation.
Since the addition of a distillation column after hydro-treatment is
relatively easy, sometimes natural gas condensates can be used as a
primary feed to cracking operations.
Price of Naphtha and Other Liquid Feed Stocks
Most naphtha (over 80%) is used in the production of gasoline.
Therefore the price of naphtha is strongly influenced by, on the one hand,
the prevailing price of crude oil and on the other, by the demands of the
gasoline market. The trade in oil, naphtha and gasoline is very large and
transparent.
Crude Oil Prices
Broadly, there are three major world market centres – New York
for the Americas, Rotterdam for Europe and Singapore for the Far East.

Liquid Feedstocks 79
Each market has its local “marker” crude to which other crude oils are
referenced – West Texas Intermediate (WTI), Brent Blend and Tapis
Blend respectively. There is extensive trade between the regions
(arbitrage) which links the global oil and oil derivatives market into one
structure and evens out regional price differentials.
These representative crude oils are of the group of light low
sulphur crude oils, which are easily processed into high quality transport
fuels. They are sought for these properties and sell at a positive
differential to most other crude oils.
Recent experience in the oil price is illustrated in Figure 4.5 for
three marker light and low sulphur crude oils – WTI, Brent and Tapis
considered the reference crude oils in the three regional markets. The
graph shows that the three crude move in unison to events in the oil
market6
.
Figure 4.5: Crude oil prices
Late 1990 saw the first Gulf War which caused a short term spike
in the price of crude which rose to nearly $40/bbl. This was followed by
a progressive decline in its price to a low point of about $10/bbl in late
1998. Since that time there has been a progressive rise in the price of oil
which has accelerated since 2003 to reach over $60/bbl in 2005 then a
1989
1990
1991
1992
1993
1994
1995
1996
1997 ::
1998 ::
1999
2000
2001
2002
2003
2004
2005
2006
2007
2008
0
50
100
150
$U
S/b
bl WTI
BRENT
TAPIS
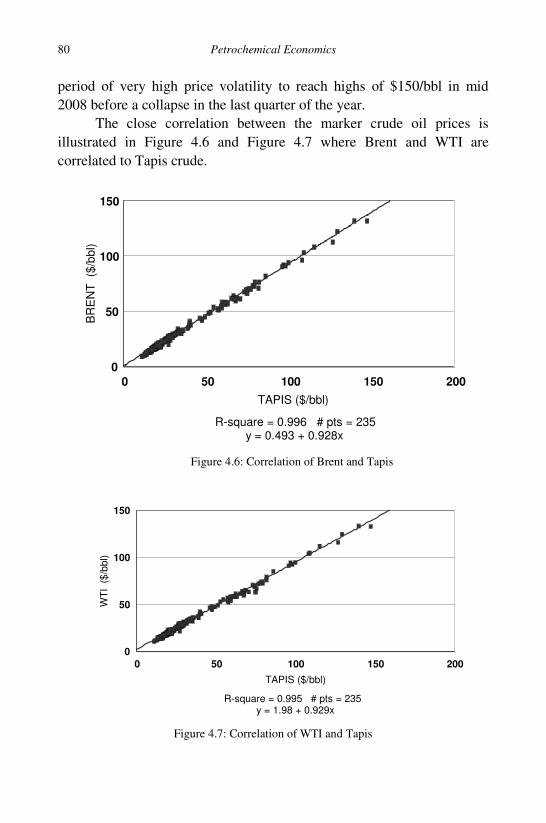
80 Petrochemical Economics
period of very high price volatility to reach highs of $150/bbl in mid
2008 before a collapse in the last quarter of the year.
The close correlation between the marker crude oil prices is
illustrated in Figure 4.6 and Figure 4.7 where Brent and WTI are
correlated to Tapis crude.
Figure 4.6: Correlation of Brent and Tapis
Figure 4.7: Correlation of WTI and Tapis
0 50 100 150 200
TAPIS ($/bbl)
0
50
100
150
BR
EN
T
($/b
bl)
R-square = 0.996 # pts = 235 y = 0.493 + 0.928x
0 50 100 150 200
TAPIS ($/bbl)
0
50
100
150
WT
I (
$/b
bl)
R-square = 0.995 # pts = 235 y = 1.98 + 0.929x

Liquid Feedstocks 81
Figure 4.8: Gasoline and Tapis (Singapore)
Careful examination of the oil price history (Figure 4.5) sees that
during the early part of each year, strong demand in the US (WTI) causes
a small peak in the price of oil which feeds into the other oil markets.
This is due to refiners producing stocks of gasoline for the US driving
season in July and August. This is further illustrated in Figure 4.8 which
shows the gasoline and Tapis prices on the Singapore market showing a
price hike early in the year.
Naphtha Prices
The price of naphtha is strongly linked to the price of crude oil and
will be influenced by the gasoline market. This is illustrated in Figure 4.9
where the European price of naphtha reported by ECN News is correlated
with the price of Brent crude oil price reported by the US EIA. Note the
excellent correlation with a correlation coefficient (R2
) of about 0.98.
Gas Oil and Residual Fuel Oil
To illustrate the price issues concerning other petrochemical feed
stocks, the monthly average price data for the Singapore market is
1989
1990
1991
1992
1993
1994
1995
1996
1997 ::
1998 ::
1999
2000
2001
2002
2003
2004
2005
2006
2007
2008
FROM JUN 1989
0
50
100
150$
US
/bb
l
GASOLINE
TAPIS

82 Petrochemical Economics
Figure 4.9: Correlation of naphtha and Brent
Figure 4.10: Kerosene, gas oil, fuel oil and Tapis (Singapore)
discussed. The historical price trends for kerosene, gas-oil, fuel oil
(180 cSt) and Tapis are illustrated in Figure 4.10.
The figure illustrates that all the products fall and rise in unison.
However there is some discrepancy with fuel oil. The correlations
between gasoline, kerosene and gas oil, fuel oil and Tapis are illustrated
in Figures 4.11, 4.12, 4.13 and 4.14.
0 20 40 60 80 100 120
BRENT ($/bbl)
0
100
200
300
400
500
600
700
800
900
1000N
AP
HT
HA
$/t
onne
R-square = 0.985 # pts = 524 y = 21.4 + 8.58x
19
89
19
90
19
91
19
92
19
93
19
94
19
95
19
96
19
97 ::
19
98 ::
19
99
20
00
20
01
20
02
20
03
20
04
20
05
20
06
20
07
20
08
FROM JUN 1989
0
50
100
150
$U
S/b
bl
KEROSENE
GAS OIL
FUEL OIL
TAPIS

Liquid Feedstocks 83
Figure 4.11: Correlation of gasoline and Tapis (Singapore)
Figure 4.12: Correlation of kerosene and Tapis (Singapore)
Some crude oils are low in sulphur and waxy. Crude oil of this
nature is common in South Asia and is processed in large “simple”
refineries. They produce a fuel oil which is referred to as low sulphur
residual fuel oil (LSWR) for export. LSWR generally sells at a premium
to fuel oil, but the price differential is seasonal with a major market being
0 50 100 150
TAPIS ($/bbl)
0
50
100
150
GA
SO
LIN
E (
$/b
bl)
R-square = 0.982 # pts = 231 y = 5.26 + 0.972x
0 50 100 150 200
TAPIS ($/bbl)
0
50
100
150
200
KE
RO
SIN
E (
$/b
bl)
R-square = 0.988 # pts = 231 y = 1.94 + 1.12x

84 Petrochemical Economics
Figure 4.13: Correlation of gas oil and Tapis (Singapore)
Figure 4.14: Correlation of fuel oil and Tapis (Singapore)
power generation in countries with strict limits to sulphur emissions
where it is used in place of conventional, higher sulphur fuel oil in the
summer months of high electricity demand (particularly in Korea and
Japan). LSWR also differs from conventional fuel oil in having a high
pour point, typically 40o
C. This makes it difficult to store and ship
(requires heating).
0 50 100 150 200
TAPIS ($/bbl)
0
50
100
150
200
GA
S O
IL ($
/bb
l)
R-square = 0.988 # pts = 231 y = 1.15 + 1.1x
0 50 100 150 200
TAPIS ($/bbl)
0
20
40
60
80
100
120
FU
EL
OIL
($
/bbl)
R-square = 0.976 # pts = 231 y = 0.391 + 0.733x

Liquid Feedstocks 85
LSWR is finding increasing use in cracking operations,
particularly those configured to crack gas oil. The high wax content,
indicative of linear paraffins, generates a good ethylene yield and the
pyrolysis fuel oil is low in sulphur and used to produce carbon black.
1
D. Seddon “Gas Usage and Value”, PennWell, Tulsa, Oklahoma, 2006
2
FACTs Inc report on production and condensate splitters is reviewed in Oil & Gas
Journal, Feb. 20, 2006, p. 50
3
V. L. Bhirud, Hydrocarbon Processing, Apr. 2007, p. 69
4
McNamara and Zavora, Hydrocarbon Asia, May/Jun. 1997, p. 76
5
K. Ikushima, N. Akihisa and S. Matumoto, Hydrocarbon Processing, Dec. 2006, p. 97;
D. Young and P.J.H. Carnell, Hydrocarbon Asia, Jul/Aug 1006, p. 42
6
During the early part of 2009 specific features in the US oil market have tended to
change the pattern in the relative value of WTI versus similar crude oils

This page intentionally left blankThis page intentionally left blank

87
CHAPTER 5
VALUE OF PRODUCTS, STORAGE AND
TRANSPORT
In this chapter we consider two subjects which impact the
economic viability of large integrated chemical complexes, the value of
products and by-products produced and the transport of product and by-
product to a distant destination.
Products
We are primarily concerned with the production of the light
olefins ethylene and propylene. In many parts of the world these products
can be sold directly to a user within a petrochemical complex or to third
party users by pipeline. In these cases there is no or minimal transport
cost to be considered.
Traded prices for ethylene and propylene produced and sold on the
pipeline network in Europe are shown in Figure 5.11
. This plots the spot
prices for ethylene and propylene from 1989 to 2008 with the price of
naphtha as bars underneath. The graph shows the following features:
• Ethylene is generally at a higher price than propylene. This is not
always the case and for the Far East propylene is generally worth
more than ethylene.
• Relative to the price of naphtha, the price of olefins is far more
volatile with large peaks and troughs.
• The peaks and troughs represent business cycles in the
petrochemical business; typical peak to peak values are 1.5 to
2.5 years.

88 Petrochemical Economics
• There are many periods of low price with the traded price in the
vicinity of $300/t. This low price can last for long periods. This
effectively sets the floor price which a petrochemical operation
should aim to beat - that is have a production cost below the
floor price.
• From 2003 to late 2008 there was a progressive rise in the price
of oil and hence naphtha. Over the period the price of olefins
also rose. In late 2008 both oil price and olefin prices collapsed
with olefins heading towards the floor price.
Figure 5.1: Olefin and naphtha price trends
Hydrocarbon By-Products
Successful petrochemical projects are characterised by either
eliminating the production of by-products, or if they have to be
produced, by maximising the value of by-products from the process.
Here we are primarily concerned with maximising by-product credits.
The basic value of a hydrocarbon by-product is its value as a fuel
oil substitute for heating process furnace operations. Since fuel oil is
generally the hydrocarbon of lowest value, degrading by-products to fuel
value will result in a cost to the process – high value feedstock is
19
88
19
89
19
90
19
91
19
92
19
93
19
94
19
95
19
96
19
97
19
98
19
99
20
00
20
01
20
02
20
03
20
04
20
05
20
06
20
07
20
08
WEEK FROM JAN 01 1988
0
500
1000
1500
2000
$/t
on
ne
ETHYLENE PROPYLENE NAPHTHA

Product Value, Storage and Transport 89
degraded to fuel oil. This should be avoided if possible, but for some by-
products such as methane from cracking operations its use as a fuel oil
substitute (i.e. fuel gas) may be the only option.
A higher value option for hydrocarbons may be to use them as a
feedstock substitute. In cracking operations, the product slate from the
primary cracking operations contain a lot of ethane, even for naphtha and
gas oil cracking. Rather than degrade the ethane to fuel oil value, ethane
is separated and recycled to a special cracker-furnace which cracks the
ethane to ethylene. The cracker-furnace is separate to the main naphtha
cracking furnaces because, as discussed in Chapter 2, the cracking of
ethane requires a higher temperature than larger naphtha molecules.
A number of petrochemical processes produce significant volumes
of hydrogen as a by-product, including pyrolysis cracking. This can be
used as a fuel oil substitute, but this greatly undervalues hydrogen, and
alternative use in other chemical processes is the better option and
generally pursued by successful operations.
Following is a discussion about the by-products from the various
naphtha cracker streams:
C2 stream
The product of interest is ethylene and this is contaminated with
ethane and acetylene. The most common practice is for acetylene to be
selectively hydrogenated to ethylene using supported palladium
catalysts:
C2H2 + H2 = C2H4
This process produces a small amount of by-product “green oil”
which is degraded to fuel oil2
.
Acetylene itself has considerable value (equivalent to ethylene) for
producing a variety of specialist chemicals as well as the commodity
monomer vinyl chloride (by addition of hydrogen chloride) and its use as
a specialist fuel – acetylene welding. Acetylene is very dangerous in the
liquid state, and is not distilled. In the pure form it has a tendency to
explosively decompose:

90 Petrochemical Economics
C2H2 = 2C + H2
The concentration of acetylene in the C2 stream can be increased
by increasing the severity of cracking. The acetylene is then extracted
using a solvent extraction process (copper solutions are a common
method) to separate the acetylene component from the C2 stream.
C3 Stream
The product of interest is propylene and propane which are
contaminated with propyne (methyl acetylene), allene and cyclo-propane.
A typical composition is given in Table 5.1.
Table 5.1: Typical Composition of a Naphtha Cracker C3 Stream
COMPOUND B.P (o
C) Stream Cracker
Propane -42.1 2%
Propylene -47.4 53%
Propyne -23.2 3%
Allene -34.5 3%
cyclo-propane -32.7 Trace
There are few significant industrial uses3
for these other materials
and they are reduced by selective hydrogenation to propylene and
propane.
Propane is separated by distillation and can be either recycled to
produce cracker feedstock or purified to a saleable LPG product.
C4 Stream
A cracker C4 stream contains all of the possible C4 hydrocarbons
which are listed in Table 5.2. Of these commercial interest focuses on
butenes, isobutene, 1,3-butadiene and butanes. Efficient separation is
impossible by distillation alone and complete separation is by a
combination of distillation, selective hydrogenation and selective
absorption. If butadiene is not required this can be hydrogenated and the
butenes and butane separated by distillation.

Product Value, Storage and Transport 91
Table 5.2 Typical Composition of a Naphtha Cracker C4 Stream
COMPOUND B.P (o
C) Stream Cracker
n-butane -0.5 2%
Isobutane -11.7 3%
1-butene -6.3 3%
cis-2-butene 3.7 1%
trans-2-butene 0.9 1%
Isobutene -6.9 9%
1,3-butadiene -4.4 19%
1,2-butadiene 10.8 trace
1-butyne 8.1 trace
2-butyne 27 trace
but-1-ene-3-yne 5.1 trace
methyl-cyclo-propane 4 to 5 trace
cyclo-butane 12 trace
Both 1-butene and 2-butene can be used as a monomer for
specialist polymers. Of interest to integrated cracking and polymer
production operations is 1-butene for co-polymerisation with ethylene to
produce LLDPE (linear low-density polyethylene)4
. For ethane cracking
operations where the C4 stream maybe insufficient, 1-butene can be made
by from ethylene by dimerisation5
.
Isobutene is used for the production of MTBE (methyl tertiary
butyl ether) which nowadays is used little in the US market but is widely
used as a gasoline octane booster in many countries.
The extraction of butadiene involves solvent extraction and
distillation. In the process shown in Figure 5.26
, a mixed C4 steam enters
a solvent stripping column (1) which strips the butadiene and acetylene
compounds from the stream. A typical solvent is N-methylpyrolidone
(NMP).
A rectifying column (2) removes all of the butenes from the crude
butadiene stream part of which is sent to a second solvent stripper (3)
with the bottoms containing C4 acetylene compounds returned to the
rectifying column. The bottoms from the rectifying column (2) are fed to
the solvent stripping column (4) which returns lean solvent.

92 Petrochemical Economics
Figure 5.2: Butadiene extraction from C4 streams
The butadiene is purified in two columns which removes propyne
(methyl acetylene) and C4+ products which are mainly 1,2-butadiene and
C5 hydrocarbons.
1,3-Butadiene has a considerable demand for use in the production
of synthetic rubber and acrylonitrile-styrene-butadiene (ABS) co-
polymers. It is difficult and costly to separate from the mixed C4 stream
and results in few cracking operations building the necessary plant. The
continued growth in demand7
for butadiene and closing of several
process plants has resulted in a dramatic growth in the value of butadiene
in recent years; Figure 5.3. The figure dramatically illustrates that for
over a decade the average butadiene price was below $500/tonne but
since 2004 there was a steady rise before a dramatic rise in value in
2007/8 before the price collapses in late 2008.
The final product of interest is butane. This can be separated and
either sold as LPG or recycled as a cracker feedstock. All of the C4
stream can be recycled for cracking. However, olefins and especially
dienes and the C4-aceylenes rapidly form coke and the C4 stream is
generally fully hydrogenated to butane.
BUTENES
C4 FEED
SOLVENT
SOLVENT
SOLVENT
PROPYNE
1,3-BUTADIENE
C4+
C4 ACETYLENES
12
3
4
5 6

Product Value, Storage and Transport 93
Figure 5.3: Butadiene price trends
C5 – 190oC Stream – Pyrolysis Gasoline
The C5 to 190o
C stream is often referred to as pyrolysis gasoline.
In naphtha cracking it forms the dominant portion of the liquid products.
The unit value of gasoline is higher than that for naphtha so that
production and sale of pyrolysis gasoline is a profitable option. In the
large operations which are integrated with refineries, the pyrolysis
gasoline is used as a gasoline blend-stock. It can also be used directly as
gasoline in countries which do not require the production of high quality
transport fuels. For other producers pyrolysis gasoline is sold on the open
market usually at a discount to the prevailing gasoline price.
Pyrolysis gasoline contains a large quantity of aromatics –
typically >60% benzene, toluene and mixed xylene (often referred to as
BTX) – which imparts to the fuel a high octane level (typically >95
RON); Table 5.3. Unfortunately, the main component is benzene, which
is no longer favoured as a gasoline component which has led to a decline
in its use.
However, the aromatics, in particular benzene, are highly sought
after as petrochemical intermediates and gasoline additives. Recent price
trends are illustrated in Figure 5.4.
19
88
19
89
19
90
19
91
19
92
19
93
19
94
19
95
19
96
19
97
19
98
19
99
20
00
20
01
20
02
20
03
20
04
20
05
20
06
20
07
20
08
WEEK FROM JAN 01 1988
0
500
1000
1500
2000
2500
3000$
/to
nn
e
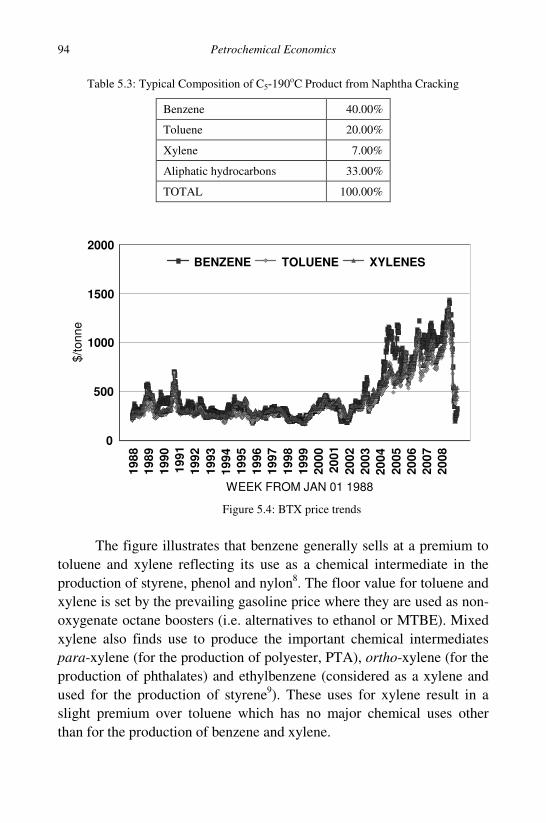
94 Petrochemical Economics
Table 5.3: Typical Composition of C5-190
o
C Product from Naphtha Cracking
Benzene 40.00%
Toluene 20.00%
Xylene 7.00%
Aliphatic hydrocarbons 33.00%
TOTAL 100.00%
Figure 5.4: BTX price trends
The figure illustrates that benzene generally sells at a premium to
toluene and xylene reflecting its use as a chemical intermediate in the
production of styrene, phenol and nylon8
. The floor value for toluene and
xylene is set by the prevailing gasoline price where they are used as non-
oxygenate octane boosters (i.e. alternatives to ethanol or MTBE). Mixed
xylene also finds use to produce the important chemical intermediates
para-xylene (for the production of polyester, PTA), ortho-xylene (for the
production of phthalates) and ethylbenzene (considered as a xylene and
used for the production of styrene9
). These uses for xylene result in a
slight premium over toluene which has no major chemical uses other
than for the production of benzene and xylene.
19
88
19
89
19
90
19
91
19
92
19
93
19
94
19
95
19
96
19
97
19
98
19
99
20
00
20
01
20
02
20
03
20
04
20
05
20
06
20
07
20
08
WEEK FROM JAN 01 1988
0
500
1000
1500
2000
$/t
on
ne
BENZENE TOLUENE XYLENES

Product Value, Storage and Transport 95
The high concentration of these components makes separation of
the BTX an attractive proposition and many naphtha cracking operations
now separate BTX rather than produce pyrolysis gasoline.
The other components are C5+ olefins and dienes and in particular
cyclo-pentadiene which easily dimerises to a C10 compound (di-cyclo-
pentadiene). As well as a strong odour, these materials readily
polymerise to form gum in the gasoline and the raw pyrolysis gasoline is
usually hydro-treated prior to use. In some cases, these C5 dienes are
extracted and used to form low melting resins. One approach to
upgrading the pyrolysis gasoline stream is shown in Figure 5.510
.
Figure 5.5: Upgrading pyrolysis gasoline
In this approach, pyrolysis gasoline first enters a C5/C6+ splitter
which passes the C5 fraction to a di-cyclo-pentadiene unit which
dimerises the cyclo-pentadiene in the C5 stream and the dimer is
extracted. Excess C5 is returned to the system via an isoprene extraction
unit. The mixture is then hydrogenated and olefins are saturated to
paraffins.
A distillation column removes the C5 and cracked gases to a fuel
gas stream. The C5 stream (now devoid of olefins) can be returned to the
cracking furnace. A third column then separates the C10+ products
DCPD DCPDC5
PYROLYSIS
GASOLINE
H2
H2
C6+
FG + C5 FG + H2S
C6-C9 AROMATICS
C6-C9
C10+
ISOPRENE

96 Petrochemical Economics
(mainly aromatic). A second hydrogenation unit has the duty to remove
sulphur and nitrogen from the streams prior to the final distillation to
produce an aromatic stream.
A major portion of the world’s BTX is made by naphtha
reforming. The technology and economics of this route is well reported
in petroleum refinery handbooks11
. Often this route uses extractive
distillation to extract aromatics prior to distillation12
. Reforming
operations are often integrated with ethylene cracking operations to
maximise benzene production from reformate and pyrolysis gasoline13
.
Fraction Boiling over 190oC; Pyrolysis Fuel Oil
The higher boiling fraction from the cracking of liquid feedstock is
generally referred to as pyrolysis fuel oil. Large volumes are produced by
cracking gas oil and residual fuel oils. Pyrolysis fuel oil has a greater
tendency to form coke than conventional fuel oil and is generally poorer
in quality than the fuel oil used as the feedstock. The main use of the fuel
oil is as a fuel in the cracking operation.
If the fuel oil uses as the feedstock is low in sulphur, i.e. LSWR,
then the pyrolysis fuel oil produced will also be low in sulphur and this
makes the product attractive for the production of carbon black.
Storage of LPG
Most liquid feedstock and chemicals such as naphtha or benzene
are stored in above ground steel tanks. In order to prevent the formation
of explosive mixtures in the tank ullage, some organisations use floating
roof tanks, particularly favoured for large tanks in the refining industry,
whereas others use inert gas blanket of nitrogen, particularly favoured for
small tanks in the chemicals industry.
The main concern is the storage of liquefied petroleum gas (LPG)
which in this context can be propane and butane feedstock or product, or
ethylene and propylene. The storage of LPG is costly and there are
various technologies which depend on the amount of material to be
stored.

Product Value, Storage and Transport 97
LPG has been the main source of fuel for some of the
petrochemical industries worst fires and explosions. As a consequence
the safety measures and regulations concerning LPG storage are
extensive and a full discussion of these is beyond the scope of this work.
Storage Tanks
Small volumes of LPG are stored in large cylindrical tanks often
referred to as bullets, with typical volumes <100cm.
Figure 5.6 shows a typical above ground spherical storage in
which the LPG is stored under pressure. These tanks are common for
relatively small volumes of LPG (500 -2,000cm, typically 1,200cm).
Figure 5.6: Typical layout for a LPG storage tank
Because of a major fire and explosion at Feyzin, France 196614
there are extensive regulations concerning the construction and operation
of such pressure spheres. The following are some of the general issues to
be considered.
The sphere is held at sufficient height (A) to allow easy access to
all of the control and operational valves (B), which in general operation
WATER
LPG
AB
RELIEF VALVE
FIRE WATER
REMOTE
CONTROL

98 Petrochemical Economics
are remotely controlled. In normal operation, water contaminating the
LPG collects in the base of the vessel which is periodically drawn off.
The ground under the sphere slopes so that any leakage of LPG flows
away from the area and cannot collect under the sphere. The sphere is
equipped with a relief valve, lagging and water dousing in case of fire.
For larger volumes of LPG storage, some organisations use
cryogenic storage tanks which are constructed in a similar manner to
tanks for the storage of LNG (liquefied natural gas)15
.
LPG Storage in Rock Caverns
For larger volumes of LPG rock caverns can be used. The general
layout is shown in Figure 5.7.
Figure 5.7: Typical layout for a rock cavern
The cavern is constructed by mining out a porous mineral such as
limestone, shale or chalk well below the water table. The roof and sides
of the cavern are supported by multiple plastic coatings to prevent rock
falls. The cavern is sealed hydro-dynamically with the pressure of water
entering the cavern balancing the LPG pressure. A well in the lowest part
of the cavern contains a submerged pump which pumps excess water to
the surface. LPG is removed by pumps higher in the well.
A variation on this is the refrigerated cavern where the ground
water around the cavern is frozen and refrigeration plant on the surface
WATER
LPG
GROUND WATER FLOW
PUMPS

Product Value, Storage and Transport 99
has to be provided to support this. It may take 5 years to freeze the
ground.
LPG Storage in Salt Caverns
Salt caverns can contain up to 300,000 cm of LPG. Salt caverns
were patented in 1916 and have been widely used since the 1950s. They
offer absolute tightness and construction from the surface. The general
layout is shown in Figure 5.8.
Figure 5.8: Typical layout for a salt cavern
A suitably thick salt layer is located at sufficient depth below the
surface. This layer is drilled and water injected and brine extracted which
excavates a cavern. Several stages are usually involved. Sometimes this
brine is used for caustic-chlorine production.
In operation, brine is injected to the base of the cavern (1) to
balance the gas pressure (2). LPG is pumped out of the cavern by the
assistance of a submerged pump (3).
Many older established petrochemical complexes are located near
such suitable salt fields. This allows the operation to store at relatively
modest cost large volumes of ethylene to cover shut-down periods.
LPG
1
2
3
SALT
LPG
surface

100 Petrochemical Economics
Transport
There are three ways to transport chemicals over long distances to
a user:
• By land transport in trucks or railcars. This is used if no other
method exists for transporting large volumes of feed or product.
This is an expensive method and is primarily used as the last link
in a supply chain in moving higher valued products to an end
user and is not discussed further.
• By ship in a range of carriers of different types and sizes. This is
particularly relevant to the international trade in chemicals.
• By pipeline when sufficient volumes of product or feed are to be
moved. This is usually used when large numbers of producers
and users are in a region (e.g. Western Europe).
This section discusses the economics of chemical transport by ship
and pipeline. An overview of the world’s shipping fleet for transporting
the products of interest is given.
Shipping Fleets
At present, contract shippers conduct most shipping of liquids
(chemical and oil derivatives). The merchant fleet is extensive and there
is a variety of contracts available for the regular movement of feed and
product.
Large amounts of liquid product can be moved in large tankers
(>125,000 tonnes). These are generally referred to as dirty cargoes
because the product transported is crude oil and residual fuel oil.
Generally this fleet is unsuitable to transport chemicals, even if sufficient
volumes are available. For the transport of large volumes of chemicals
dedicated ships may be required. This may be provided as a contract
arrangement.
By contrast the clean cargo fleet (chemicals, naphtha, gasoline)
has a wide range of vessel sizes available (10,000 tonnes to over 100,000
tonnes). Transport fuels are typically moved in loads (parcels) of about
80,000 tonnes at a cost of typically $10/tonne (about $0.2/GJ) whereas

Product Value, Storage and Transport 101
most chemicals use smaller ships and costs are higher, typically $25-
30/tonne, or $1 - 1.5/GJ for chemical methanol.
An important point to note is that contract shipping offers financial
advantages over owner operated and dedicated fleets (such as those used
to transport LNG), but the contact price is dependent on the vagaries of
the shipping market which is both cyclic and seasonal.
For LPG and other liquefied hydrocarbon chemicals such as
ethylene, a very large contract merchant fleet is available, although this
is dominated by a small number of key players. The available fleet
typically moves product at about 30 - 40,000 tonne parcels at a typical
cost of $30 - 40/tonne, about $0.6 - 0.8/GJ. However, there are larger
ships available (75,000 tonnes).
The cost of contracts is very dependent on business cycles and the
season (large LPG demand coinciding with the northern winter). In order
to smooth out the costs (from the ship owners perspective) most of the
fleet is capable of transporting ammonia and other chemicals as well as
LPG cargoes. Thus shipping costs also become influenced by the
seasonal nature of ammonia (fertiliser) demand, especially for the US
corn market. Table 5.4 gives an overview of the merchant fleet available
for the transport of chemicals and fuels.
Table 5.4: Comparison of Transport Fleets for Shipping Chemicals and Fuels
Fleet LNG LPG CHEMICAL
CLEAN
FUELS
CRUDE
OIL
Products
shipped LNG only
LPG
ammonia,
chemicals
liquid
chemicals
naphtha,
gasoline,
gas oil
crude oils,
fuel oil
Size
(tonnes) 90,000
10,000 -
75,000
10,000 -
40,000
60,000 -
120,000 > 120,000
Ship
types Cryogenic
Cryogenic
and pressure Sealed tanks Sealed tanks Sealed tanks
Fleet Dedicated Contract Contact Contact and
dedicated
Contract
and
dedicated
Cost
variation Fixed Seasonal
Business
cycle
Business
cycle
Business
cycle

102 Petrochemical Economics
Solids Transport
The large scale transport of solids is conducted in large ocean
going ships and barges with relatively simple off-loading and on-loading
machinery. For example for coal, trans-oceanic transport costs are
relatively low. Typical intercontinental costs are $10/t (Australia - Japan)
or about $0.33/GJ. For smaller parcels of solids – resins etc. – the world
large container fleet can be used.
Estimation of Chemical Shipping Costs
The shipping of chemical methanol is used to illustrate the
underlying costs structure of feedstock and chemical shipping. Methanol
is liquid under ambient conditions and can be shipped like many other
chemicals in closed tanked vessels.
Following the methodology used in this work, two options for
methanol transport are considered. The cost basis is based on studies for
the transport of methanol as an alternative to gasoline performed by US
Department of Energy16
. The first is for a conventional medium sized
tanker of 40,000 t and a very large tanker of 250,000 t. The variation in
shipping cost with distance is illustrated in Figure 5.9 and the statistics
are given in Table 5.5.
Figure 5.9: Typical shipping costs for medium and large cargoes
1000 3000 5000 7000 9000 11000 13000
ONE WAY DISTANCE (km)
0
0.5
1
1.5
2
2.5
TR
AN
SP
OR
T C
OS
T (
$/G
J)
40,000t
250,000t

Product Value, Storage and Transport 103
Table 5.5: Statistics for Shipping Methanol
Ship Capacity DWT 40000 250000
GJ 908000 5675000
Days/year 350 350
One Way Distance km 5000 5000
Speed knots 12 12
Sailing time days 9.37 9.37
Turn around time h 24 24
One way trips/year 33.74 33.74
Sailing days/year 316.26 316.26
Port calls/year 33.74 33.74
Days in port/year 33.74 33.74
Capital Cost MM$ 37.81 106.56
ROC (15y, 10% DCF) % 15.19% 15.19%
Annual Capital Costs MM$/y 5.74 16.81
Labour MM$/y 2.86 3.76
Fuel t/day 20 30
Fuel Costs MM$/y 0.95 1.42
Port Fees/station $ 60000 80000
Port Charges MM$/y 2.02 2.7
Maintenance %Capex 4% 4%
MM$/y 1.51 4.26
Insurances % Opex 15% 15%
MM$/y 1.10 1.82
Misc (victualing etc) %Opex 10% 10%
MM$/y 0.73 1.21
Total OPEX MM$/y 9.18 15.18
TOTAL COSTS MM$/y 14.92 31.36
Quantity Shipped t/y 674748 4217172
PJ/y 15.3 95.7
Shipping Cost $/t 22.11 7.44
$/GJ 0.97 0.33

104 Petrochemical Economics
LPG Shipping
Many chemicals are liquefied by pressure and transported in
tankers similar to the LPG shipping fleet. Transport cost is therefore
similar to that of LPG or ammonia, which are transported in either
pressurised or refrigerated vessels with costs intermediate between
liquids and specialised LNG carriers. LPG shipping costs are seasonal
and dependent on the business cycle. Typical costs for the spot carriage
cost of LPG cargoes are illustrated in Figure 5.1017
for three sizes of
carrier.
Figure 5.10: LPG shipping costs
This figure shows that as the capacity of the ship rises, then
the spot cargo cost falls for a given distance. Interestingly, the cost
variation can be accounted for by scaling with an exponent of 0.65;
namely:
Cost[1]/Cost[2] = {Capacity[1]/Capacity[2]}0.65
The result of this normalisation is illustrated in Figure 5.11.
The trend-line has the formula:
Transport Cost ($/t) = 1.64*Sailing Days + 4.21
0 10 20 30 40
SAILING DAYS
10
20
30
40
50
60
70
$/T
onne 35000 cm
54,000 cm
75,000 cm

Product Value, Storage and Transport 105
Figure 5.11: LPG shipping cost normalised to 75,000cm vessel
Chemical Pipelines
The movement of ethylene by pipeline to interconnect producers
and users is practiced in Europe and the USA. Propylene pipelines are
also under consideration.
Despite their simplicity, pipelines are highly capital intensive. Not
only is pipe laying costly, the cost is split roughly evenly between
materials and labour, but provision of compression stations - necessary
for mass transport over long distances - can contribute 40% of finally
installed capital. Once established, the operations of a pipeline system
can cost 5% of the fixed capital per annum.
The capital cost of a pipeline depends upon such factors as pipe
diameter, distance and the amount of compression required. Undersea
pipelines cost about double land-based pipelines. Operating costs reflect
labour charges and fuel usage in compression if required.
As a rule of thumb, a capital cost of $1 MM/km for land-based
pipelines and $2 MM/km for undersea pipelines can be taken as a guide
to the capital costs of new pipelines.
0 10 20 30 40
SAILING DAYS
0
10
20
30
40
50
60
70$
/To
nn
e 35000 cm
54,000 cm
75,000 cm
trend
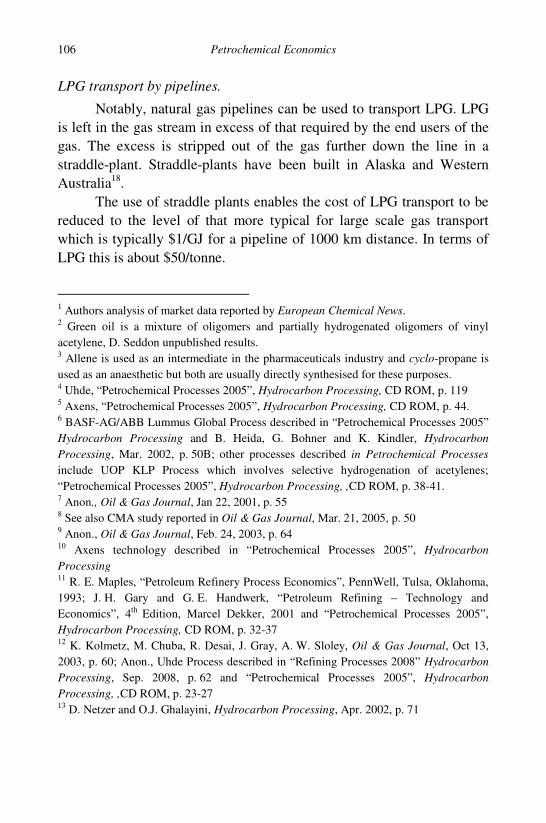
106 Petrochemical Economics
LPG transport by pipelines.
Notably, natural gas pipelines can be used to transport LPG. LPG
is left in the gas stream in excess of that required by the end users of the
gas. The excess is stripped out of the gas further down the line in a
straddle-plant. Straddle-plants have been built in Alaska and Western
Australia18
.
The use of straddle plants enables the cost of LPG transport to be
reduced to the level of that more typical for large scale gas transport
which is typically $1/GJ for a pipeline of 1000 km distance. In terms of
LPG this is about $50/tonne.
1
Authors analysis of market data reported by European Chemical News.
2
Green oil is a mixture of oligomers and partially hydrogenated oligomers of vinyl
acetylene, D. Seddon unpublished results.
3
Allene is used as an intermediate in the pharmaceuticals industry and cyclo-propane is
used as an anaesthetic but both are usually directly synthesised for these purposes.
4
Uhde, “Petrochemical Processes 2005”, Hydrocarbon Processing, CD ROM, p. 119
5
Axens, “Petrochemical Processes 2005”, Hydrocarbon Processing, CD ROM, p. 44.
6
BASF-AG/ABB Lummus Global Process described in “Petrochemical Processes 2005”
Hydrocarbon Processing and B. Heida, G. Bohner and K. Kindler, Hydrocarbon
Processing, Mar. 2002, p. 50B; other processes described in Petrochemical Processes
include UOP KLP Process which involves selective hydrogenation of acetylenes;
“Petrochemical Processes 2005”, Hydrocarbon Processing, ,CD ROM, p. 38-41.
7
Anon., Oil & Gas Journal, Jan 22, 2001, p. 55
8
See also CMA study reported in Oil & Gas Journal, Mar. 21, 2005, p. 50
9
Anon., Oil & Gas Journal, Feb. 24, 2003, p. 64
10
Axens technology described in “Petrochemical Processes 2005”, Hydrocarbon
Processing
11
R. E. Maples, “Petroleum Refinery Process Economics”, PennWell, Tulsa, Oklahoma,
1993; J. H. Gary and G. E. Handwerk, “Petroleum Refining – Technology and
Economics”, 4th
Edition, Marcel Dekker, 2001 and “Petrochemical Processes 2005”,
Hydrocarbon Processing, CD ROM, p. 32-37
12
K. Kolmetz, M. Chuba, R. Desai, J. Gray, A. W. Sloley, Oil & Gas Journal, Oct 13,
2003, p. 60; Anon., Uhde Process described in “Refining Processes 2008” Hydrocarbon
Processing, Sep. 2008, p. 62 and “Petrochemical Processes 2005”, Hydrocarbon
Processing, ,CD ROM, p. 23-27
13
D. Netzer and O.J. Ghalayini, Hydrocarbon Processing, Apr. 2002, p. 71

Product Value, Storage and Transport 107
14
T. A. Kletz, “What Went Wrong, Case Histories of Process Plant Disasters”,
4th
Edition, Gulf Publishing, Houston Texas, 1998
15
LNG storage is discussed in D. Seddon, “Gas Usage and Value,” PennWell, Tulsa
Oklahoma, 2006
16
“Assessment of Costs and Benefits of Flexible and Alternative Fuel Use in the
U.S. Transportation Sector – Technical Report Three: Methanol Production and
Transportation Costs”, US Department of Energy DOE/PE-0093
17
Details from “Waterbourne LPG” 21/06/2001
18
J. Hawkins, Oil & Gas Journal, December 16, 2002, p. 46

This page intentionally left blankThis page intentionally left blank

109
CHAPTER 6
CARBON DIOXIDE EMISSIONS
In the petrochemical industry all of the hydrocarbon waste
products can be used or recycled in someway, including use as fuel. The
principal waste products are water and carbon dioxide. Water is
collected, cleaned and recycled for cooling purposes. This leaves carbon
dioxide as the major emission in most chemical operations.
At the time of writing, there is increasing concern in many
jurisdictions about the emissions of carbon dioxide. This stems from the
belief that the accumulated emissions since the advent of the industrial
revolution are causing a change in the climate. In order to change the
climate it is proposed to limit carbon dioxide emissions. Several methods
have been proposed all resulting on a charge to carbon emitting
industries. These include:
• Carbon geo-sequestration where all or part of carbon dioxide is
captured and stored in deep geological formations.
• A cap and trade mechanism where emitting industries are
required to purchase permits for part or all of the carbon
emissions.
• A tax on the amount of carbon emissions.
Carbon Geo-Sequestration
Prior to geo-sequestration, the carbon dioxide has to be available
in a concentrated form so that it can be compressed and liquefied prior to
disposal. From the standpoint of the petrochemical industry, there are
two types of emissions which we need to consider. The first type is when
carbon dioxide is extracted from a process stream by typically dissolving
the carbon dioxide in a solvent. Here the carbon dioxide is available as a

110 Petrochemical Economics
concentrated stream when the solvent is regenerated. The second type is
associated with fuel burning in the presence of air in furnaces and
process heaters. Here the carbon dioxide is emitted diluted in air and
excess nitrogen from the furnace or heater stack.
Removal of Carbon Dioxide from Process Streams
Carbon dioxide is produced in petrochemical process streams by
reactions with oxygenates (mainly oxygen or water). In steam cracking,
hydrocarbons (e.g. methane) and carbon react with steam, forming
initially carbon monoxide which is then converted into carbon dioxide by
the water-gas-shift reaction:
CH4 + H2O = CO + H2O
C + H2O = CO + H2
and
CO + H2O = CO2 + H2
After cooling and removing liquids, the cracked gases are passed
to an acid gas plant which has the duty to remove carbon dioxide and any
sulphur, which is now present as hydrogen sulphide from the cracked
hydrocarbon gases. A typical layout for carbon dioxide removal is shown
in Figure 6.1.
Gases containing carbon dioxide enter the bottom of an absorption
tower and ascend against the flow of a descending solvent which
preferentially absorbs carbon dioxide. The cracked gases, devoid of
carbon dioxide, exit the top of the column. The carbon dioxide rich
solvent exits the bottom of the tower and is passed to a regenerating
column where typically the solvent is boiled to expel the carbon
dioxide and regenerate the solvent which is passed back to the absorption
tower.

Carbon Dioxide Emissions
111
Figure 6.1: Carbon dioxide absorption
Carbon dioxide is also produced as a by-product to oxidation
processes. For example, as the by-product to the production of ethylene
oxide by oxidation of ethylene with supported silver catalysts:
2C2H4 + O2 = 2C2H4.O
C2H4 + 4O2 = 2CO2 + 2H2O
A similar process can be used to separate the carbon dioxide from
unconverted ethylene and product.
Solvent stripping plants of this general type are available in many
variants. A common technique for removing carbon dioxide is to wash it
with a physical solvent. It is relatively simple but requires a large solvent
flow. The solubility of the various components in the solvents are
roughly proportional to their boiling point as1
:
Log [mole fraction of component (1)] α Tb (K)
The boiling points of the non hydrocarbon components of interest
are shown in Table 6.1. The normal boiling point for carbon dioxide is
treated gas
CO2 gas
rich stream
lean stream
CO2

112 Petrochemical Economics
Table 6.1: Boiling Point of Components of Interest
Gas Boiling Point (Tb)
Kelvin
Comments
H2 20
N2 77
CO 81
A 87
CH4 112
(NO) 2
122 mp. 112K
CO2 (175) Sublimes at 195K, acidic
HCl 188 Acidic
H2S 213 Acidic
COS 223
NH3 240
SO2 263 Acidic
HCN 299 Acidic
H2O 373 mp. 273
extrapolated. If carbon dioxide is the key gas of interest then designing
the operation to remove carbon dioxide will result in removal of the
higher boiling impurities. This includes hydrocarbons higher than
methane which means that the carbon dioxide extraction is usually
applied after hydrocarbons of interest have been separated.
Furthermore, the relative solubilities are determined by differences
in the boiling points:
Log [solubility gas (1)/solubility gas (2)] = Tb(1) –Tb(2)
This can be used to absorb and separate carbon dioxide and
hydrogen sulphide. There are several different solvents commonly in use.
The properties for carbon dioxide absorption for some solvents of
interest are summarized in Table 6.2.
Although the Selexol solvent is an almost ideal solvent for carbon
dioxide, there is very little difference between methanol, propylene
carbonate and Selexol in terms of mass or solvent volume required. This
means in practice there may be little to choose between these alternative
solvents.

Carbon Dioxide Emissions
113
Table 6.2: Relative Capacity for CO2 Uptake of Various Solvents
Water Methanol Propylene
Carbonate
Propylene glycol
dimethyl ether
Technology Rectisol Selexol
Molecular Weight 18 32 102 280
Relative CO2 solubility 2% 12% 35% 100%
Relative CO2 per gm bar 1 3.6 3.1 3.3
Relative CO2 capacity per m
3
bar 1 2.8 3.7 3.3
One discriminator is how the solvent handles water. Many
solvents, e.g. methanol, are miscible with water. Absorbed water can be
removed in a side stream which distils the water from the solvent and
hence controls the water content in the main circuit. Some solvents, such
as propylene carbonate, decompose when heated with water to 100o
C and
are therefore unsuitable for treating water wet gases.
Although the common method for degassing solvent is by counter-
current flow of gas, concern with capturing carbon dioxide for geo-
sequestration purposes may lead to a preference for solvents that can be
easily degassed by boiling. This may give a preference to lower boiling
solvents such as methanol or N-methylpyrolidone (NMP).
Carbon Dioxide Extraction with Solid Absorbents
Solid absorbents can also be used for removing unwanted
materials from gas streams. These can be accomplished by activated
charcoal, molecular sieves and increasingly often by membranes2
.
Surprisingly, the relative selectivity of these absorbents is again
proportional to the relative boiling points. To a large extent these
materials condense liquids by reducing their vapour pressure as a
result of very high negative hydraulic pressures exerted by surface
tension of the liquid in very fine capillaries. Again, focussing on carbon
dioxide removal generally removes higher boiling materials. Activated
charcoal has now largely been replaced by molecular sieves (e.g.
Polybed PSA Process).
Absorbent processes generally work with a high pressure (20–50
bar), with desorbing and bed regeneration at low pressure (1 bar), hence

114 Petrochemical Economics
adiabatic operation. The process can be used to absorb carbon dioxide,
carbon monoxide and methane from hydrogen streams.
The solubility of gases in membranes is again proportional to the
gas boiling point. After dissolution, the absorbed gas diffuses through the
membrane to the lower pressure, lean gas side at rates which are
inversely proportional to the square root of the gas molecular weight.
Multiplying relative solubility by the relative diffusion constant gives
relative permeability. Carbon dioxide is 10 times more permeable than
hydrogen and water is 1,000 times that of hydrogen. However, there is a
problem with the ability of the gases to “wet” the surfaces and this can
greatly reduce the relative permeability from the theoretical values. The
consequence of this is that membranes tend to be used for hydrogen
recovery processes rather than for carbon dioxide extraction per say.
Carbon Dioxide Absorption with Chemical Absorbents
Carbon dioxide and some other gases which require removal from
process streams are acidic. In order to improve the absorptive capacity of
physical solvents, basic (alkaline) chemicals are added. The choice of
chemical additive is determined by the ability to pick up the component
of interest and to be able to release it again in the de-sorber. The
absorption must be reversible and preferably by dropping the pressure.
For carbon dioxide absorption, the heat of absorption could
provide the heat required to desorb the carbon dioxide. The system
would be adiabatic. However, the only effective solvent is the alkaline
carbonate to bicarbonate reaction – The Benfield Process3
.
CO2 + CO2
=
= 2HCO3
-
And for hydrogen sulphide:
H2S + CO2
=
= HCO3
-
+ HS-
The problem is that effective operation is at about 100o
C and the
only possible stripping gas which would not abstract a great deal of heat
from the desorber unit is steam, and hence this process has a very high

Carbon Dioxide Emissions
115
steam demand. The high steam demand lowers the attraction of this
process relative to the newer processes using amines.
The main reagents used for carbon dioxide and hydrogen sulphide
removal are based on alkanolamines. These form amine carbamates:
CO2 + 2R1R2NH = R1R2NCOO-
+ R1R2NH2
+
For MEA and DEA the equilibrium lies to the right so that
regeneration (like Benfield) is conducted at 100o
C. Unfortunately,
amines which would operate at lower temperatures have lower kinetic
factors for carbon dioxide uptake.
The steam requirement in the stripping section of these chemical
absorbent processes is the main disadvantage of these systems relative to
the physical sorption routes. However, a major advantage is that losses of
non acidic gases – hydrocarbons, hydrogen, carbon monoxide etc. – are
much lower because the absorption of these components is not
influenced by the chemicals used.
Because chemical absorbents can be used at low pressure they are
considered the optimum method for extracting the carbon dioxide from
the dilute gases.
Removal of Carbon Dioxide from Flue Gas
Most of the carbon dioxide in the petrochemical industry is
emitted in flue gases as a result of burning fuel oil and fuel gas. The
basic problem can be illustrated by considering the combustion of a fuel
gas considered as methane.
If methane is burned in air the stoichiometric equation is:
CH4 + 2O2 + 8N2 = CO2 + 2H2O + 8N2
On a dry basis, the concentration of carbon dioxide nitrogen in the
flue gases will be 11.1% (1/9). However, in practice excess air is used to
avoid incomplete combustion and the emission of soot from the flue
stack. Excess air serves to reduce the carbon dioxide concentration.

116 Petrochemical Economics
However, the main problem with excess air is that it introduces
oxygen into the flue gas. Typical flue gas concentrations for natural gas
and coal combustion in power production are given in Table 6.3.
Table 6.3: Typical Flue Gas Compositions
NATURAL GAS COAL
CO2 2 – 7.5% 9 – 15%
H2O 9 -10% 6 – 16%
N2 72 – 73% 70%
O2 4.5 – 18% 3 – 21.5%
The excess air’s introduction of oxygen degrades the principal
chemical absorbents (alkanolamines) and increases solvent consumption.
This degradation is also exacerbated by the presence of sulphur in the
flue gas, e.g. from fuel oil. This is illustrated in Figure 6.2 and Table 6.4
which illustrates process flows and utilities consumption for the
reduction of carbon dioxide in a flue gas to below 2% using a standard
sorbent (MEA) and a solvent under development (SH amine)4
.
Figure 6.2: Flue gas stripping unit
FLUE GAS
LEAN GAS
WATER WASH
STEAM
CO2
ABSORBER
STRIPPER
3-15% CO2
<2% CO2
4MJ/kg CO2
PUMPING 20cm/t CO2
45C
115C

Carbon Dioxide Emissions
117
Table 6.4: Typical Utility and Solvent Consumption in Flue Gas Scrubbing
MEA SH amine
Steam for solvent t/t CO2 1.95 to 3.0 1.2
Regeneration GJ/t CO2 4.2 TO 6.5 2.6
Solvent flow cm/t CO2 17 to 25 11
Power (pumps) kWh/t CO2 150 to 300 19.8
Cooling water, cm/t CO2 75 to 165 150
Solvent consumption kg/t CO2 0.45 to 2.0 0.35
SO2 tolerance, ppm 10 to 100 <10
As well as the utility costs shown in Table 6.4, there is the issue of
compressing the flue gas to sufficient extent to be able to flow upward
through the absorber against the falling solvent. This compression cost is
exacerbated by the high levels of nitrogen present.
One of the main concerns with emission reduction is the state of
large central base load power facilities using fossil fuels, in particular
coal. These emit large volumes of carbon dioxide through flue gases. As
a consequence there is extensive research and many demonstration
projects aimed at extracting carbon dioxide from flue gases. As well as
research on better sorbents, other methods are being proposed: this
includes the use of oxygen in place of air in the combustion process.
Strategies for Reducing Carbon Emissions
What is obvious from the data provided above is that the flue
gases can still contain 2% of carbon dioxide. Not only will they attract
emissions charges but they will compromise the goal of zero emissions.
One way of improving the capture of carbon dioxide from the flue gas
would be to use oxygen as opposed to air for the fuel combustion
process. This will eliminate the very large excess of nitrogen in the flue
gas. However, introduction of oxygen would dangerously increase the
furnace combustion temperature. This is proposed to be solved by
recycling a large volume of the flue gas (which would comprise carbon
dioxide and water vapour) to the furnace. The system still leaves

118 Petrochemical Economics
unresolved oxygen and sulphur contamination of the flue gas which will
lead to degradation of the current class of absorbents.
One way to reduce carbon emissions is to use fuels of lower
carbon intensity. The carbon intensity of some fuels of interest is shown
in Table 6.5.
Table 6.5: Carbon Intensity of Some Fuels of Interest
FUEL % CARBON Tonne Carbon/TJ Tonne CO2/TJ
Natural Gas 76 14 51.3
LPG 81 16.4 59.4
Naphtha 87 18.2 66
Fuel Oil 89 19.2 69.7
Brown Coal 25 26.2 95
Black Coal 67 24.8 90
Wood 42 25.9 94
Bagasse 26 26.7 96.8
The first group of fuels, natural gas, LPG, naphtha and fuel oil, are
those which are typically used in furnace operations in the petrochemical
industry. This illustrates that moving from fuel oil to natural gas can
achieve significant reductions in the carbon emission of a site. However,
it must be remembered that on a global (cradle to grave) basis this may
overestimate the benefit as these figures ignore the carbon emission in
production of the fuel. This can be quite substantial for natural gas when
the raw gas in the field is contaminated with carbon dioxide; many fields
contain 30% (mass basis) or more carbon dioxide which is stripped from
the raw gas in gas plant operations in order to produce gas of a quality
that can be piped (typically <2% vol.) carbon dioxide.
A second group is coal which is seen to have much higher carbon
intensity than the liquid or gaseous fuels. Coal is often used by power
generation operations associated with petrochemical operations. This
power is often purchased from a third party and on a global basis should
be counted if power is imported. However, at the present time this type
of carbon counting is not demanded by many jurisdictions leaving the

Carbon Dioxide Emissions
119
option for a petrochemical operation to import power from coal facilities
without incurring the carbon cost. This raises the possibility of a
petrochemical operation converting to oxygen fired furnaces and using
imported power thereby “reducing” the carbon emissions of the site.
The third group of fuels in Table 6.5, wood and bagasse5
, are
representative of renewable fuels. Although these fuels have a high
carbon emission intensity they are considered benign to the climate
change argument and do not count to emissions. One problem with these
fuels for the substitution of black coal is that they have a high water
content and degrade the thermal efficiency of the power generation
process, i.e. less power is produced.
To this list should be added renewable ethanol (i.e. from crops)
and biodiesel which are more easily substituted for liquid fuels. These
can be used to displace fossil fuels used in the furnace and hence lower
the carbon emission. Unfortunately, in the opinion of the author, these
fuels often involve major ecological impacts elsewhere such as
displacement of food producing agricultural land (ethanol) or destruction
of native forests (biodiesel) for the production of a favoured feedstock –
palm oil.
One way to improve carbon emissions and overall efficiency is to
ensure that all furnace operations employ efficient heat recovery from the
flue gas. Ideally the flue gas should be cooled in order to recover the heat
of condensation of the water produced in the combustion process.
Geo-Sequestration
For geo-sequestration of carbon dioxide in flue gas it may be
necessary to first remove sulphur so as to protect the carbon dioxide
solvent. The flow from the flue system has to be modified to include an
additional plant prior to compression, carbon dioxide and geo-
sequestration as illustrated by Figure 6.3.
The first operation is to remove residual heat from the flue gas and
potentially generate steam which can be used in the carbon dioxide
scrubber (MEA). Next, the flue gas is treated with limestone to reduce
the sulphur content of the gas stream. The stream is then compressed to a
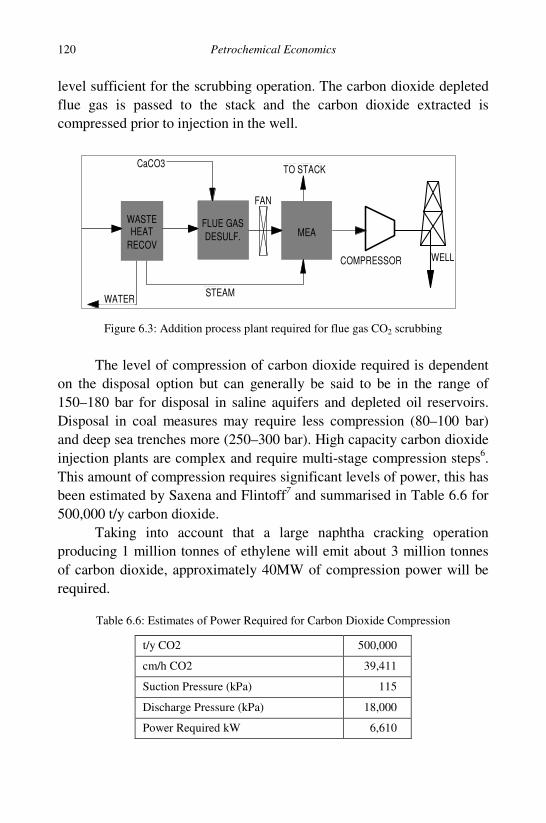
120 Petrochemical Economics
level sufficient for the scrubbing operation. The carbon dioxide depleted
flue gas is passed to the stack and the carbon dioxide extracted is
compressed prior to injection in the well.
Figure 6.3: Addition process plant required for flue gas CO2 scrubbing
The level of compression of carbon dioxide required is dependent
on the disposal option but can generally be said to be in the range of
150–180 bar for disposal in saline aquifers and depleted oil reservoirs.
Disposal in coal measures may require less compression (80–100 bar)
and deep sea trenches more (250–300 bar). High capacity carbon dioxide
injection plants are complex and require multi-stage compression steps6
.
This amount of compression requires significant levels of power, this has
been estimated by Saxena and Flintoff7 and summarised in Table 6.6 for
500,000 t/y carbon dioxide.
Taking into account that a large naphtha cracking operation
producing 1 million tonnes of ethylene will emit about 3 million tonnes
of carbon dioxide, approximately 40MW of compression power will be
required.
Table 6.6: Estimates of Power Required for Carbon Dioxide Compression
t/y CO2 500,000
cm/h CO2 39,411
Suction Pressure (kPa) 115
Discharge Pressure (kPa) 18,000
Power Required kW 6,610
FLUE GAS DESULF.
WASTE
HEAT
RECOV
CaCO3
MEA
STEAM
FAN
COMPRESSOR WELL
WATER
TO STACK
WASTE HEAT
RECOV
FLUE GAS
DESULF. MEA
CaCO3 TO STACK
FAN
COMPRESSOR WELL
STEAM WATER

Carbon Dioxide Emissions
121
At the time of writing, the major unresolved issue is the choice of
a site that can store the quantum of carbon dioxide and guarantee its safe
disposal for many hundreds of years. It is not clear if depleted oil and gas
reservoirs can do this and it may require major exploration for suitable
sites. The problem is further exacerbated by the remoteness of suitable
sites from major producing facilities, often several hundred kilometres8
.
This will incur a further significant pipeline and transport cost.
The Cost of Carbon Geo-sequestration
Some guidance to the cost of carbon geo-sequestration is obtained
by consideration of the costs of using carbon dioxide in enhanced oil
recovery schemes9
. This is in the region of $20-25/tonne of carbon
dioxide after purchase of the gas for this duty.
Taking this as a cost for the disposal part, we can guess that
extraction of the carbon dioxide (as illustrated in Figure 6.3) and
compression would more than double this amount. This gives a ball-park
estimate of $50/tonne at the least. This cost will be further significantly
increased if the disposal site is remote from the facility. At the time of
writing it is worth noting that emission credits are a fraction of this cost.
In order to give an informative account of the likely cost of carbon
abatement of the various petrochemical operations, the carbon emissions
have been estimated and a fixed variable relationship developed with
carbon dioxide disposal cost as the variable. This cost can be either the
cost of geo-sequestration facilities, the cost of purchasing emissions
certificates or carbon tax.
A final note is that some facilities inject both hydrogen sulphide
and carbon dioxide from acid gas plants10
making it feasible to dispose of
both gases simultaneously.
1
This analysis follows work of S. P. S. Andrews at ICI Billingham (private
communication)
2
G. Blizzard, D. Paro and K. Hornback, Oil & Gas Journal, Apr. 11, 2005, p. 48;
A. Callison, G. Davidson, ibid., May 28, 2007, p. 56; J. Marquez, M. Brantana, ibid.,
Jul. 24, 2006

122 Petrochemical Economics
3
“The Benfield Process for Acid Gas Removal”, R. K. Bartoo in “Acid and Sour Gas
Treating Processes”, S. A. Newman (ed.), Gulf Publishing, Houston, Texas,1985
4
Saxena and Flintoff, Hydrocarbon Processing, December 2006, p. 57
5
Sugar cane waste
6
S. Ariyapadi, J. Strickland, J. Rios, Oil & Gas Journal, Sep. 4, 2006, p. 74
7
M. N. Saxena, W. Flintoff, Hydrocarbon Processing, Dec. 2006, p. 57
8
G. Moritis, Oil & Gas Journal, Mar. 3, 3003, p. 39
9
M. K.Dubois, A. P. Byrnes, R. E. Pancake, P. G. Willhite, L. G. Schoeling, Oil & Gas
Journal, June 5, 2000, p. 37; G. Moritis, ibid., May 14, 2001, p. 68; Anon., ibid., May 17,
2004, p. 48
10
S. G. Jones, D. R. Rosa, J.E. Johnson, Oil & Gas Journal, Mar. 1, 2004, p. 54; idem.,
Mar. 8, 2004, p. 45

123
ECONOMIC ANALYSIS

This page intentionally left blankThis page intentionally left blank

125
CHAPTER 7
ETHANE CRACKING
This chapter describes the basic process of ethane steam cracking
operations to produce ethylene and the integration with downstream
operations. The approach to economic analysis for various types of
ethane cracking operations is described and the economic analysis for
ethane cracking in a standardised approach is developed. The production
of olefins from other feed stocks and the economics of production are
developed in later chapters1
.
Ethane cracking is conducted across the world. The scales of
operation range from the smallest, less than 50,000 t/y, when small
amounts of ethylene is required, for example for a stand-alone styrene
plant, to the largest ethylene production operations of over 1 million
tonnes of ethylene. The block flow layout for a small stand-alone ethane
cracking operation is illustrated in Figure 7.1.
Figure 7.1: Typical flow-sheet for ethane cracking
PYROLYSIS QUENCHACID GAS REMOVAL
DRIER
DEMETHANISER
DE-ETHANISERACETYLENE
REMOVAL
ETHANE
REMOVAL
ETHANE
ETHYLENE

126 Petrochemical Economics
Ethane enters the pyrolysis section, which comprises a series of
cracking furnaces. The ethane is heated as quickly as possible to the
cracking temperature and maintained at this temperature for the
minimum residence time. In order to lower the hydrocarbon partial
pressure and mitigate coke forming in the pyrolysis tubes, steam is added
to the ethane prior to entering the pyrolysis section (not shown).
Immediately after cracking, the cracked gases are reduced in
temperature as quickly as possible to stop the cracking processes and
prevent the cracked gases forming coke. This quenching is often referred
to as the transfer-line-heat-exchange (TLE). Excess steam is condensed
and the water recycled (not shown). Heat from the TLE is recovered as
process steam.
Cracking is best conducted at low pressures, whilst product
cleaning and separation is best conducted at higher pressures. The
cracked gases are now compressed and passed to an absorber tower
where acid gases (carbon dioxide, sulphur compounds) are extracted
from the cracked gas stream. The absorbent is regenerated (usually by
heating) and the acid gases are passed to other downstream units for
disposal as may be necessary.
The gases are then compressed further and passed through a drier
to the separation train. The cracked gases now contain only hydrocarbons
and hydrogen.
Ethane cracking produces a range of by-products as well as
ethylene. However, relative to other feed stocks, the amount of by-
products is small and in many small-scale ethane cracking operations
these are used as fuel in the pyrolysis furnace.
The first separation unit is a tower that separates methane and
hydrogen from the C2+ gases (de-methaniser). These are used as fuel in
smaller cracking operations, but can be further separated in the larger
scale crackers to produce a fuel gas and hydrogen.
The second separation tower, known as the de-ethaniser, separates
the C3+ fraction from the C2 cracked gases. In smaller operations the
heavier products are passed to the pyrolysis furnace for fuel.
The C2 cracked gases contain a small amount of acetylene, which
is usually removed in an acetylene hydrogenation unit. To accomplish

Ethane Cracking 127
this, a small portion of hydrogen is added (extracted from the de-
methaniser off-gas) and the gas mixture passed over a palladium catalyst
which selectively removes the acetylene by hydrogenation:
C2H2 + H2 = C2H4
And
C2H2 + 2H2 = C2H6
Acetylene hydrogenation is widely practiced and efficient.
However, a “green-oil” which comprises vinyl acetylene oligomers is
also produced and in some instances can foul the unit. In large cracking
operations, the acetylene may be recovered by absorption processes
based on copper salts, which selectively absorb the acetylene.
The gases are now passed to a splitter column which separates the
ethane and ethylene. Ethane cracking has a relatively low pass
conversion and there are relatively large amounts of ethane present in the
ethylene stream. After separation, the ethane is recycled to the feed
section where it is cracked to extinction. The ethylene is passed to
downstream units for production of other chemicals and resins.
In larger-scale ethane cracking operations, or those integrated into
large chemical complexes, the useful by-products can be separated and
used. In this instance the pyrolysis furnace is fired by fuel oil. Note that
different process licensors have differing approaches to the layout of the
unit operations2
. A typical situation is illustrated in Figure 7.2.
In this configuration, the hydrogen and the methane from the de-
methanizer column are split into their component streams. The hydrogen
is for use in various downstream processes and the methane is used as a
fuel-gas stream. Bottoms from the de-ethaniser are further split into C3
and C4+ stream. The C3 is treated similarly to the C2 to produce polymer
grade propylene. After removing the C4 fraction, which is passed to
downstream separation units, the heavy components form pyrolysis-
gasoline. The latter may be further separated to produce benzene, toluene
and xylene.
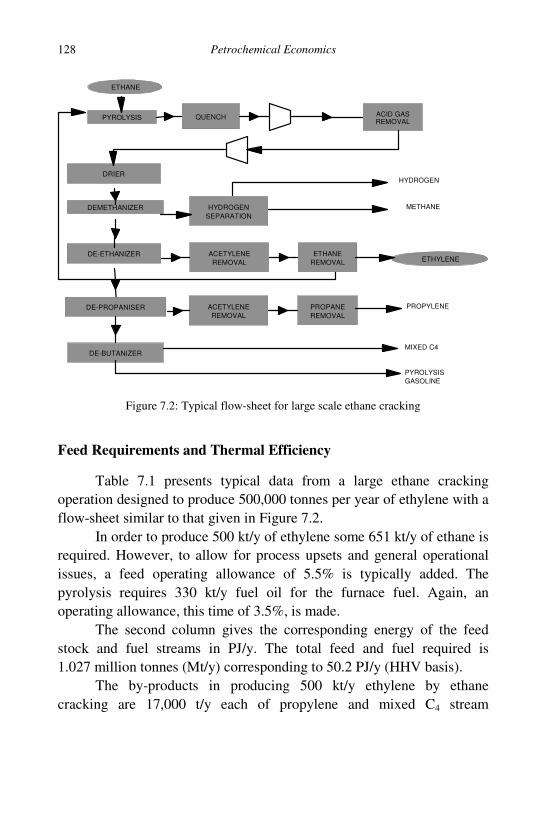
128 Petrochemical Economics
Figure 7.2: Typical flow-sheet for large scale ethane cracking
Feed Requirements and Thermal Efficiency
Table 7.1 presents typical data from a large ethane cracking
operation designed to produce 500,000 tonnes per year of ethylene with a
flow-sheet similar to that given in Figure 7.2.
In order to produce 500 kt/y of ethylene some 651 kt/y of ethane is
required. However, to allow for process upsets and general operational
issues, a feed operating allowance of 5.5% is typically added. The
pyrolysis requires 330 kt/y fuel oil for the furnace fuel. Again, an
operating allowance, this time of 3.5%, is made.
The second column gives the corresponding energy of the feed
stock and fuel streams in PJ/y. The total feed and fuel required is
1.027 million tonnes (Mt/y) corresponding to 50.2 PJ/y (HHV basis).
The by-products in producing 500 kt/y ethylene by ethane
cracking are 17,000 t/y each of propylene and mixed C4 stream
DRIER
DEMETHANIZER
DE-ETHANIZER
DE-BUTANIZER
PYROLYSIS QUENCH ACID GAS REMOVAL
ACETYLENE
REMOVAL
ETHANE
REMOVAL
ETHANE
ETHYLENE
HYDROGEN
SEPARATION
HYDROGEN
METHANE
ACETYLENE
REMOVAL
PROPANE
REMOVAL
PROPYLENE
PYROLYSIS
GASOLINE
DE-PROPANISER
MIXED C4

Ethane Cracking 129
Table 7.1: Ethane Cracking in Integrated Operations
kt/y PJ/y
INPUTS
Feedstock 651 33.787
Operating Feed (5.5%) 36 1.801
Fuel 330 14.157
Operating Fuel (3%) 10 0.425
TOTAL 1027 50.170
OUTPUTS
Ethylene 500 25.150
Propylene 17 0.831
BTD/C4 olefins 17 0.818
Gasoline 11 0.510
Hydrogen 66 9.359
Methane 40 2.220
Propane 0 0.000
Butane 0 0.000
Fuel Oil 0 0.000
TOTAL 651 38.888
THERMAL EFFICIENCY (%) 77.513
comprising butadiene and olefins (BTD/C4), 66,000 t/y hydrogen and
11,000 t/y of pyrolysis gasoline. Moreover, 40,000 t/y methane (fuel gas)
is also produced. The total of ethylene and by-products is 651,000 t/y
corresponding to the required feed without an operating allowance.
The total energy of the products is 38.9 PJ/y. This gives a total
operating efficiency for the plant of 77.5%.
Inspection of the energy available in the by-products indicates that
there is ample energy available for operating the pyrolysis furnaces
without the need to use any fuel oil (as the flow-sheet in Figure 7.1). This
operational method degrades high value propylene and gasoline streams
to fuel oil value. This may be justified for smaller operations, but for

130 Petrochemical Economics
larger scale operations it is then more economically attractive to extract
and sell the propylene and pyrolysis gasoline.
Table 7.2 presents the data for a plant which extracts propylene
and pyrolysis gasoline, but recycles the rest of the products. Of the by-
products the mixed C4 stream is recycled to the feed-side of the cracker
furnaces, with the hydrogen and methane recycled to the fuel-side. The
same quantum of operating allowances for feed and fuel are included in
the statistics.
The result of this by-product recycling is to reduce the feed
demand and almost eliminate the requirement for fuel oil. Operating
allowances are maintained.
Table 7.2: Ethane Cracking with Some By-product Recycle
kt/y PJ/y
INPUTS
Feedstock 635 32.969
Operating Feed (5.5%) 36 1.801
Fuel 60 2.578
Operating Fuel (3%) 10 0.425
TOTAL 741 37.773
OUTPUTS
Ethylene 500 25.150
Propylene 17 0.831
BTD/C4 olefins 0 0.000
Gasoline 11 0.510
Hydrogen 0 0.000
Methane 0 0.000
Propane 0 0.000
Butane 0 0.000
Fuel Oil 0 0.000
TOTAL 528 26.492

Ethane Cracking 131
Ethylene Production Costs From Ethane
Base Case Analysis
The procedure adopted is to establish a base case, which is
representative of the average operation of interest and then to address the
sensitivity of the base case against the key economic variables. The base
case is developed around the production of 500,000 t/y ethylene using
ethane at a cost of $7.19/GJ ($373.3/t). This ethane price is discussed in
an earlier chapter and corresponds to a natural gas price of $6.37/GJ
(average US 2007 price) into a suitably large-scale gas plant.
The capital cost of a 500,000 t/y ethane cracker is $718 million
(2007). The non-feedstock operating costs are taken as 10% of the capital
per annum or $71.8 million per year (MM$/y). If the plant is built in
three years on the basis of a 20 year life with a DCF rate of 10%, annual
return on capital, as detailed in the Appendix, is 14.4% or $102.8MM/y.
The production economics can be estimated as a function of
ethane price using the assumptions:
• Propylene by-product is valued at the 95% value as ethylene
($/t basis).
• The prevailing price of oil (WTI) is set at $70/bbl. This sets the
price for fuel oil and pyrolysis gasoline. The latter is priced at a
$1/bbl discount to refinery gasoline to allow for its poorer
quality relative to regular traded gasoline.
• The other by-products are taken as the 2007 year average or for
mixed C4 stream equivalent to that of naphtha.
The two systems described by Tables 7.1 and 7.2 are evaluated.
For ease of discussion, the flow-sheet described by Table 7.1 where all
possible cracked products are sold at prevailing market prices is referred
to as OPEN. The case where some of the product is recycled to feed or
fuel (Table 7.2) is referred to as CLOSED.
Setting the ethane price to $7.19/GJ (which corresponds to a gas
plant price with gas available at $6.37/GJ) gives the ethylene production
cost of $726/tonne for the OPEN system and $869/tonne for the
CLOSED system. The cash flows are detailed in Table 7.3.

132 Petrochemical Economics
Table 7.3: Ethane Cracking Cash Flows (MM$/y)
kt/y OPEN CLOSED
OPEX (10% CAPEX) 71.88 71.88
RETURN ON WORKING CAP(10%) 7.04 5.56
RECOVERY (10%DCF, 20y, FACTOR 0.143) 102.79 102.79
INPUTS
Feedstock 243.00 237.12
Operating Feed (5.5%) 13.36 13.36
Fuel 118.04 21.50
Operating Fuel (3%) 3.54 3.54
TOTAL 377.94 275.52
OUTPUTS
Ethylene 500
Propylene 17
BTD/C4 olefins 10.17
Gasoline 7.11 7.11
Hydrogen 149.74
Methane 17.76
Propane 0.00
Butane 0.00
Fuel Oil 0.00
TOTAL 184.78 7.11
ANNUAL COSTS 559.64 455.74
BYPRODUCT CREDITS 184.78 7.11
UNIT ETHYLENE PRODUCTION COST ($/t) 726.27 869.19
Comparison of the data in the columns of the OPEN and CLOSED
cases clearly demonstrates that degrading cracked products to feed or
fuel value results in a dramatic increase in the unit production cost.
The break-up of the production costs for the two systems are
illustrated in Figures 7.3 and 7.4 for the OPEN and CLOSED systems
respectively.
The largest cost item of the open system is the feedstock cost,
followed closely by the capital and fuel costs at nearly 20% each. Non
feed and fuel operating costs are about 14% of the total unit production
costs.

Ethane Cracking 133
Figure 7.3: Breakdown of ethylene production costs -ethane feed - OPEN system
Figure 7.4: Breakdown of ethylene production costs -ethane feed - CLOSED system
For the CLOSED system, after feedstock costs, capital charges are
the largest item followed closely by non-feed operating costs. Fuel cost is
very much reduced as the unsold by-products are used to displace the
fuel import into the plant. Fuel cost is only about 6% of the total. Non
feedstock operating costs and fuel costs are about 22% of the total unit
costs.
45.8%
21.7%
18.4%
14.1%
FEEDSTOCK COSTS
FUEL COSTS
CAPITAL CHARGES
OPERATING COSTS
55.0%
22.6%
17.0%
5.5%
FEEDSTOCK COSTS
CAPITAL CHARGES
OPERATING COSTS
FUEL COSTS

134 Petrochemical Economics
Operating Margin
In some cases, analysis of production economics is done from the
standpoint of an operating margin that expresses the difference between
the realised product costs and the cost of feedstock. This method takes no
account of the non feedstock operating costs (labour, maintenance, etc.)
and the cost of capital, both of which are dependent on any particular
facility. The method thus expresses the general profitability of the
operations in a given situation. Analysis of some operating margins is
published by various consultancy service companies3
. Proprietary
furnace models also simulate performance in terms of an operating
margin which allows operators to optimise production costs in real-time4
.
Table 7.4 illustrates a typical operating margin calculation. The
unit operating margin calculated for the OPEN and CLOSED systems
when the value of the feedstock and products are as shown in the table
are $749/t and $606/t respectively.
Inspection of the Table and comparison of the OPEN and
CLOSED cases demonstrates the loss in profitability as valuable by-
products are downgraded to feedstock or fuel value. This is particularly
evident for hydrogen, whose by-product credit makes a significant
contribution to profit.
Sensitivity to Crude Oil Price
The primary impact of rising oil price is on the cost of fuel oil for
cracking and on the value of by-products. This particularly affects the
OPEN system where by-products are on-sold or transferred to other
downstream operations at world parity prices. The sensitivity of ethylene
production cost to oil price in the range $30 to $230/bbl is illustrated in
Figure 7.5, which shows the cost of increasing oil price on the OPEN
system. At $70/bbl the base production cost is about $726/t and falls to
about $666/t with oil at $50/bbl and rises to $964/t with oil at $150/bbl.
For the CLOSED system sensitivity curve has a flat or slightly
rising profile because the by-products are used to displace fuel oil and as
the price of oil rises the value of the former rises faster than the latter.

Ethane Cracking 135
Table 7.4: Margin Calculations using Ethane Feedstock
OPEN CLOSED
$/t kt/y MM$/y kt/y MM$/y
FEEDSTOCK & FUEL
PURCHASES
Feedstock 373.27 651 243.00 635 237.12
Operating Feed (5.0%) 373.27 36 13.36 36 13.36
Fuel 357.68 330 118.04 60 21.50
Operating Fuel (3%) 357.68 10 3.54 10 3.54
TOTAL 1027 377.94 738 275.52
OUTPUTS
Ethylene 1278.00 500 639.00 500 639.00
Propylene 1214.00 17 20.64 17 20.64
BTD/C4 olefins 597.95 17 10.17 0 0.00
Gasoline 646.37 11 7.11 11 7.11
Hydrogen 2268.80 66 149.74 0 0.00
Methane 444.00 40 17.76 0 0.00
Propane 561.90 0 0.00 0 0.00
Butane 533.42 0 0.00 0 0.00
Fuel Oil 357.68 0 0.00 0 0.00
TOTAL 651 844.41 528 666.75
MARGIN MM$ 387.56 352.95
$/t 749.63 606.95
c/lb 34.00 27.53
The production cost remains at about $870/t over the range of $35 to
$100/bbl oil.
Sensitivity to Ethane Price
For ethane feedstock, of most interest is the sensitivity of the
production cost to the price of ethane. In many jurisdictions, the ethane
price is related to the price of gas. In turn this is related in many parts of
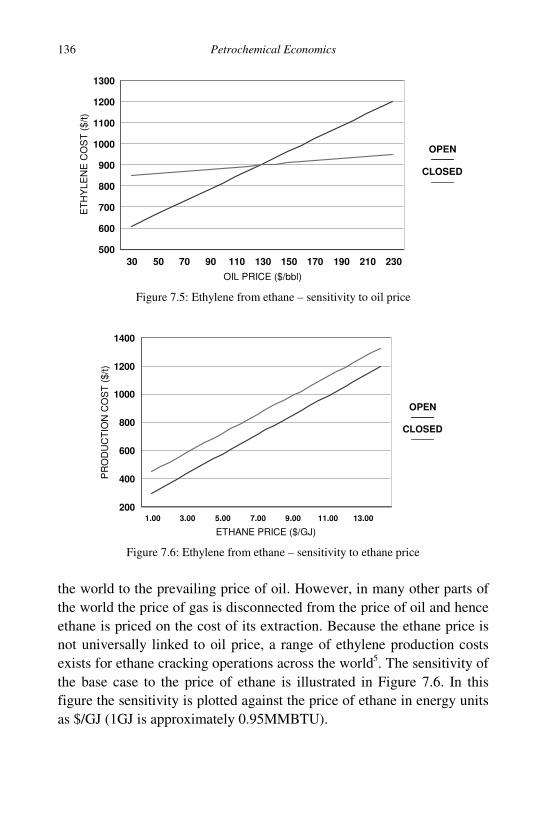
136 Petrochemical Economics
Figure 7.5: Ethylene from ethane – sensitivity to oil price
Figure 7.6: Ethylene from ethane – sensitivity to ethane price
the world to the prevailing price of oil. However, in many other parts of
the world the price of gas is disconnected from the price of oil and hence
ethane is priced on the cost of its extraction. Because the ethane price is
not universally linked to oil price, a range of ethylene production costs
exists for ethane cracking operations across the world5
. The sensitivity of
the base case to the price of ethane is illustrated in Figure 7.6. In this
figure the sensitivity is plotted against the price of ethane in energy units
as $/GJ (1GJ is approximately 0.95MMBTU).
30 50 70 90 110 130 150 170 190 210 230
OIL PRICE ($/bbl)
500
600
700
800
900
1000
1100
1200
1300E
TH
YL
EN
E C
OS
T (
$/t
)
OPEN
CLOSED
1.00 3.00 5.00 7.00 9.00 11.00 13.00
ETHANE PRICE ($/GJ)
200
400
600
800
1000
1200
1400
PR
OD
UC
TIO
N C
OS
T (
$/t
)
OPEN
CLOSED

Ethane Cracking 137
Figure 7.7: Ethylene from ethane – sensitivity of margin to ethane price
The figure illustrates the rise in production cost with the rise of
feedstock price for the base case. For the OPEN system (all by-products
sold), doubling the price of ethane from the base value (about $7/GJ)
results in a production cost rise from about $710/t to about $1200/t.
However, more critically, lowering the price of ethane to about $2/GJ
results in ethylene production costs below $400/t. For the CLOSED
system (some by-products recycled), the production costs line runs
parallel to the OPEN system line, but at about $150/t higher. For low
price ethane ($2/GJ); the production cost of ethylene is about $500/t. The
influence of changing the ethane price on the operating margin is shown
in Figure 7.7. This illustrates that as the ethane price rises from $2.50/GJ,
roughly corresponding to well head gas of $2/GJ into a gas plant, to
$7.50/GJ, roughly corresponding to the opportunity value of leaving
the gas in pipeline gas in developed economies at high oil price, the
operating margin halves.
Sensitivity to Scale of Production
The sensitivity of ethane production cost to the scale of operation
at two representative ethane prices for the OPEN and CLOSED systems
are shown in Figure 7.8. The graphs span the range of production
capacities from the largest to the smallest ethane cracking operations.
The graphs have been derived assuming capital cost vary according to a
1.00 3.00 5.00 7.00 9.00 11.00 13.00
ETHANE PRICE ($/GJ)
0
200
400
600
800
1000
1200
1400M
AR
GIN
($
/t)
OPEN
CLOSED

138 Petrochemical Economics
Figure 7.8: Ethylene production cost – impact of scale of operation
power function with an exponent factor of 0.7. Both the OPEN and
CLOSED systems are evaluated at a high and a low ethane price
($7.19/GJ and $2.50/GJ).
Relative to the base case with a production capacity 500,000 t/y,
production costs fall by $100/t in both the OPEN and CLOSED systems
with capacity increases to 1.2 million tonnes per year. Conversely,
smaller scale operations see increases in production costs of about $350/t
for small scale (50,000 t/y) output.
Small scale operations are widely used to produce small amounts
of ethylene for a specific purpose (e.g. styrene). This graph illustrates
that high ethane prices are a significant threat to these operations because
the cost of ethylene transport from a larger operation (typically $100/t for
ship based transport) is lower than the rise in production cost due to the
loss of economy of scale.
Comparing the smaller scale operations with access to low ethane
prices shows that these are competitive with much larger operations
paying high ethane prices.
Production of Polymer
Many cracker operations are integrated into the downstream
production of polymers and resins. For ethane cracking this usually
means integration into the production of various polyethylene grades.
0 200 400 600 800 1000 1200
NOMINAL ETHYLENE PRODUCTION CAPACITY (kt/y)
200
300
400
500
600
700
800
900
1000
1100
1200
1300E
TH
YL
EN
E P
RO
DU
CT
ION
CO
ST
($
/to
nn
e)
$7.19/GJ OPEN
$7.19/GJ CLOSED
$2.50/GJ OPEN
$2.50/GJ CLOSED

Ethane Cracking 139
Integration with polypropylene manufacture can occur in those cases
when production is very large, or there is some cracking of heavier
material or else additional propylene can be sourced from a local refinery
or a propylene specific production operation.
The reason for this integration is that extra product value can
be captured with modest additional capital expenditure. This case is
especially found in smaller stand-alone cracking operations (CLOSED
case) where there is little opportunity to dispose of the minor by-products
Table 7.5: Polymer Production Cost and Operating Margin
$/tonne kt/y MM$/y MM$/y
CAPEX $960.11
OPEX (10% CAPEX) 96.01
RETURN ON WORKING CAP (10%) $7.38
RECOVERY (10%DCF, 20y, FACTOR 0.143) 137.3
FEEDSTOCK & FUEL PURCHASES
Feedstock 373.27 635 $237.12 $237.12
Operating Feed (5.5%) 373.27 33 $13.36 $13.36
Fuel 357.68 60 $21.50 $21.50
Operating Fuel (3%) 357.68 10 $3.54 $3.54
TOTAL 738 $275.52 $275.52
OUTPUTS
Polyethylene 1702.4 500 851.20
Polypropylene 1590.4 17 27.04
Py-Gasoline 646.37 11 7.11 7.11
TOTAL 528 7.11 885.35
ANNUAL COSTS 516.20 378.91
BYPRODUCT CREDITS 7.11
POLYMER PRODUCTION COST ($/t) 986.84
MARGIN 506.44
$/t 978.58
c/lb 44.43
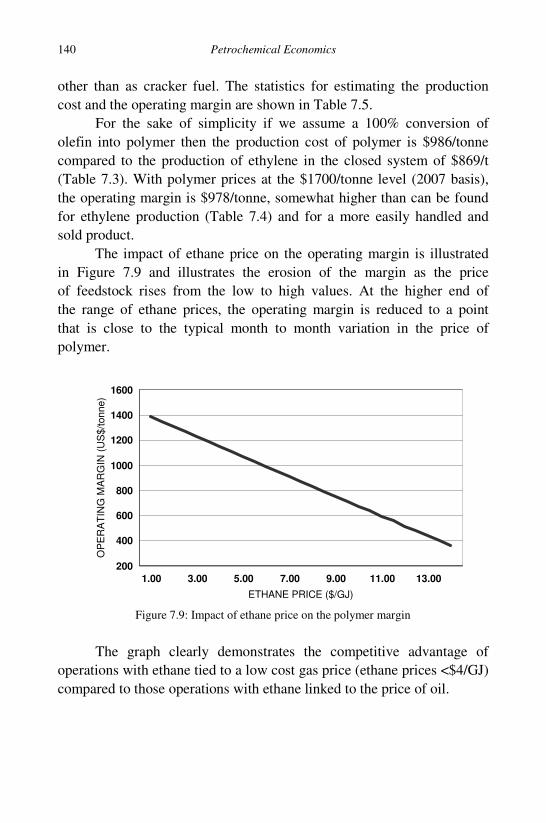
140 Petrochemical Economics
other than as cracker fuel. The statistics for estimating the production
cost and the operating margin are shown in Table 7.5.
For the sake of simplicity if we assume a 100% conversion of
olefin into polymer then the production cost of polymer is $986/tonne
compared to the production of ethylene in the closed system of $869/t
(Table 7.3). With polymer prices at the $1700/tonne level (2007 basis),
the operating margin is $978/tonne, somewhat higher than can be found
for ethylene production (Table 7.4) and for a more easily handled and
sold product.
The impact of ethane price on the operating margin is illustrated
in Figure 7.9 and illustrates the erosion of the margin as the price
of feedstock rises from the low to high values. At the higher end of
the range of ethane prices, the operating margin is reduced to a point
that is close to the typical month to month variation in the price of
polymer.
Figure 7.9: Impact of ethane price on the polymer margin
The graph clearly demonstrates the competitive advantage of
operations with ethane tied to a low cost gas price (ethane prices <$4/GJ)
compared to those operations with ethane linked to the price of oil.
1.00 3.00 5.00 7.00 9.00 11.00 13.00
ETHANE PRICE ($/GJ)
200
400
600
800
1000
1200
1400
1600
OP
ER
AT
ING
MA
RG
IN (
US
$/t
onne)

Ethane Cracking 141
Carbon Emissions from Ethane Cracking
If we assume that all utility steam is raised from heat exchange of
hot furnace gases and that excess steam is used to generate all of the
power required by the cracking plant, then carbon emissions come from
two major sources:
• The fuel used to heat the furnace and drive the cracking reactions
and
• Operational losses which result in the flaring of feed stock or
product.
The estimated emissions from these two sources in ethane
cracking are set out in Table 7.6:
Table 7.6: Estimated Carbon Emissions from Ethane Cracking
OPEN CLOSED
Fuel Used Mt/y PJ/y MtCO2/y Mt/y PJ/y MtCO2/y
Methane 2.22 0.114
LPG
Fuel Oil 0.34 14.582 1.016 0.07 3.003 0.209
Total 0.34 14.582 1.016 0.07 3.003 0.209
Emissions/t (C2= + C3= ) 1.966 0.405
Flaring
Ethane 0.036 1.801 0.100 0.036 1.801 0.1
tCO2/t (C2= + C3=) 0.193 0.193
Total Emissions 1.116 0.309
tCO2/t (C2= + C3=) 2.159 0.598
Additional cost @ $35/t $75.55 $20.92
Production cost ($/t) $726.27 $869.19
Including carbon cost ($/t) $801.83 $890.11
For the OPEN system all of the fuel used is assumed to be fuel oil.
Including an operating allowance, this produces about 1 million tonnes
of carbon dioxide for the production of 0.5 million tonnes of ethylene.

142 Petrochemical Economics
On a unit basis this is approximately 2 tonnes of carbon dioxide per
tonne of olefins (as ethylene plus propylene). Operational losses add a
further 100,000 tonnes of carbon dioxide making the total emissions of
carbon dioxide per tonne of olefin an estimated 2.159 t/t.
If the cost of carbon emission is $35/tonne6
, then the additional
cost is $75.55 million which lifts the ethylene production cost from
$726/t to $801/t.
For the CLOSED system many of the by-products are recycled to
either fuel or feedstock. The fuel in the furnaces is now hydrogen,
methane and some fuel oil. A major portion of the fuel is hydrogen
which does not appear in Table 7.6 because it does not contribute to
carbon emissions.
After allowance is made for ethane flaring and the carbon dioxide
emissions, the CLOSED system produces approximately 0.6 tonne of
carbon dioxide per tonne of olefin. Using the same cost of carbon
dioxide the result is that production cost is lifted from $869 to
$890/tonne.
This use of hydrogen as a furnace fuel can dramatically change the
relative economics of the OPEN and CLOSED systems as the cost of
carbon emissions increases. This is demonstrated in Figure 7.10.
Figure 7.10: Ethylene from ethane - sensitivity to carbon emission cost
0 10 20 30 40 50 60 70 80
CARBON COST ($/tCO2)
500
600
700
800
900
1000
PR
OD
UC
TIO
N C
OS
T (
$/t)
OPEN
CLOSED

Ethane Cracking 143
As is demonstrated by this figure, the use of hydrogen as a fuel
can close the relative gap between the OPEN and CLOSED system, but
this requires a carbon cost in excess of $80/tonne when the ethylene
production cost is forced over $900/tonne.
1
“Petrochemical Processes 2005”, Hydrocarbon Processing, CD ROM, p. 71-81
2
See Hydrocarbon Processes 2005, Hydrocarbon Processes, CD ROM, p. 71-75
3
Muse Stancil & Co ethylene margins for US Gulf operations are published monthly in
the Oil & Gas Journal and described in Oil & Gas Journal, September 16, 2002
4
S. K. Kapur, A. S. Laghate and W. M. Nouwen, Hydrocarbon Asia, Sept. 1996, p. 110
discuses the use of the SPYRO model in optimising cracker operations.
5
J. H. Vautrain, K. A. Barrow, Oil & Gas Journal, Sep. 6, 2004, p. 52; see also
A. Keller, Oil & Gas Journal, Aug. 20, 2001, p. 75
6
At the time of writing this about double the traded emissions cost for carbon dioxide but
much less than the cost of disposal by geo-sequestration.

This page intentionally left blankThis page intentionally left blank

145
CHAPTER 8
LPG CRACKING
This chapter deals with the technology and economics of pyrolysis
cracking of the natural gas liquids propane, butane and isobutane
commonly known as LPG (liquefied petroleum gas). Often, LPG is
separated into its main components and the cracking of these components
will be discussed separately. Sometimes mixtures of the components are
cracked and the outcome is the sum of the relative amounts of the
individual components. In the 1970s and 80s, LPG was obtainable at a
lower cost relative to naphtha and in that era many steam crackers were
built to take advantage of this by cracking both naphtha and LPG. In
some parts of the world where LPG feedstock remains relatively cheap it
is still used in large volumes as a cracker feedstock. In other parts of the
world “multi-feedstock” crackers can take advantage of periodic low cost
supplies of LPG.
Basic Chemistry of LPG Cracking
The steam pyrolysis of LPG follows the same pathway of that for
ethane, namely by a complex branching chain free radical mechanism.
This can be divided into initiation, chain propagation and chain
termination reactions. This gives rise to a large number of intermediates
and products. As with ethane, products of higher carbon number than the
feed are formed.
Because the cracking process involves the rupture of carbon-
carbon bonds, products of the same carbon number as the feedstock
are low in concentration. Thus for propane, the major product of
cracking is ethylene and methane rather than propylene. Normal butane
gives more propylene, but the main end product is again ethylene.

146 Petrochemical Economics
The branched nature of isobutane, however, makes propylene the
major product. Table 8.1 gives the single pass yields for ethane, propane,
normal and isobutane to illustrate these points.
Table 8.1: Products from the Cracking of Gaseous Feeds
FEED ETHANE PROPANE n-BUTANE ISOBUTANE
Hydrogen 3.72 1.56 1.49 1.08
Methane 3.47 23.65 19.9 16.56
Acetylene 0.42 0.77 1.07 0.72
Ethylene 48.82 41.42 40.59 5.65
Ethane 40 3.48 3.82 0.88
allene/propyne 0.2 1.09 1.07 2.34
Propylene 0.99 12.88 13.64 26.35
Propane 0.03 7 0.48 0.38
Butadiene 1.33 2.82 4.13 1.49
Isobutene 19.6
n-butenes 0.25 0.89 1.92
Isobutane 20
n-butane 4
py-gasoline 0.46 1.37 3.24 2.35
BTX 0.31 3.07 5.25 2.4
TOTAL 100 100 100.6 99.8
The practical outcome is re-emphasised in Figure 8.1, which
illustrates the relative amounts of ethylene to propylene when cracking
LPG feedstock to that of the liquid feeds such as naphtha and vacuum
gas oil (VGO).
Practical Aspects of LPG Cracking
Because the formation of heavy liquid products is low, LPG is
cracked in a very similar process to ethane cracking. Often LPG can be
co-fed to the pyrolysis furnace with ethane and there is no need for an
additional process plant.
However, if the LPG is from a refinery operation or downstream
petrochemical production, olefins are often present and these can lead to
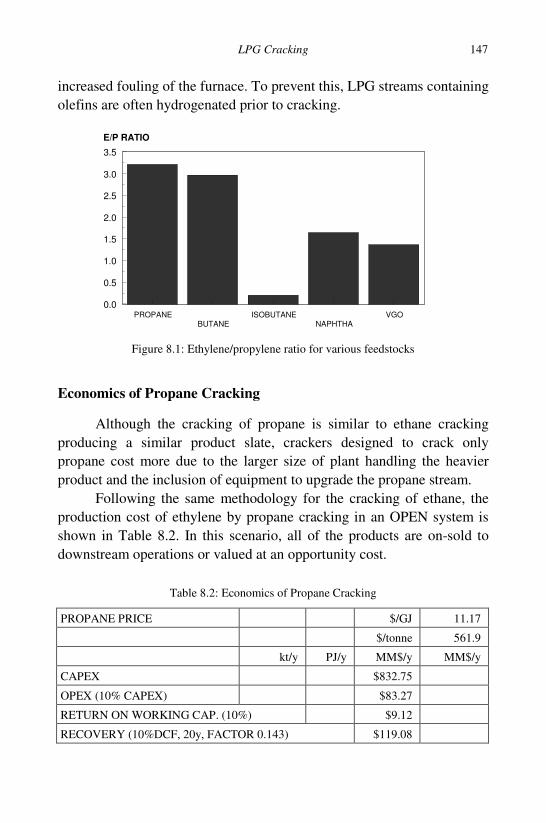
LPG Cracking 147
increased fouling of the furnace. To prevent this, LPG streams containing
olefins are often hydrogenated prior to cracking.
Figure 8.1: Ethylene/propylene ratio for various feedstocks
Economics of Propane Cracking
Although the cracking of propane is similar to ethane cracking
producing a similar product slate, crackers designed to crack only
propane cost more due to the larger size of plant handling the heavier
product and the inclusion of equipment to upgrade the propane stream.
Following the same methodology for the cracking of ethane, the
production cost of ethylene by propane cracking in an OPEN system is
shown in Table 8.2. In this scenario, all of the products are on-sold to
downstream operations or valued at an opportunity cost.
Table 8.2: Economics of Propane Cracking
PROPANE PRICE $/GJ 11.17
$/tonne 561.9
kt/y PJ/y MM$/y MM$/y
CAPEX $832.75
OPEX (10% CAPEX) $83.27
RETURN ON WORKING CAP. (10%) $9.12
RECOVERY (10%DCF, 20y, FACTOR 0.143) $119.08
PROPANEBUTANE
ISOBUTANENAPHTHA
VGO
0.0
0.5
1.0
1.5
2.0
2.5
3.0
3.5
E/P RATIO

148 Petrochemical Economics
Table 8.2 (continued)
FEEDSTOCK & FUEL PURCHASES
Feedstock 1129 56.79 $634.39 $634.39
Operating Feed (5.5%) 62 3.12 $34.89 $34.89
Fuel 330 14.16 $118.04 $118.04
Operating Fuel (3%) 10 0.42 $3.54 $3.54
TOTAL 1531 74.49 $790.85 $790.85
OUTPUTS
Ethylene 500 25.15 $639.00
Propylene 155 7.58 $188.17
BTD/C4 olefins 45 2.16 $26.91 $26.91
Gasoline 17 0.79 $10.99 $10.99
Hydrogen 19 2.69 $43.11 $43.11
$0.00
Methane 295 16.37 $130.98 $130.98
Propane 98 4.93 $55.07 $55.07
Butane 0 0 $0.00 $0.00
Fuel Oil 0 0 $0.00 $0.00
TOTAL 1129 59.68 $267.05 $1,094.22
THERMAL EFFICIENCY (%) 80.1%
ANNUAL COSTS $1,002.33 $883.25
BYPRODUCT CREDITS $267.05
UNIT ETHYLENE PRODUCTION COST ($/t) $1,136.03
MARGIN $210.97
$/t $322.10
c/lb 14.61
THERMAL EFFICIENCY 81.1%
ANNUAL COSTS $987.64 $850.67
BYPRODUCT CREDITS $263.35
UNIT ETHYLENE PRODUCTION COST ($/t) $1,098.10
MARGIN $255.64
$/t $382.69

LPG Cracking 149
The first row of the table gives the price of propane which is
linked to the prevailing crude oil price which is assumed to be $70/bbl.
By-products are also priced with this value of crude oil. The scale is set
for the production of 500,000 t/y of ethylene with other outputs given
in the first column. The other main products are propylene (155 kt/y),
a butadiene and C4 stream (45 kt/y), pyrolysis gasoline (17 kt/y) and
hydrogen (19 kt/y). A large portion of the overall cracking stoichiometry
for propane cracking is to produce ethylene and methane, rather than
ethylene and hydrogen for ethane cracking. The consequence is that
propane cracking produces much less hydrogen (19 kt/y versus 66 kt/y)
but considerably more methane (295 kt/y) than ethane feedstock
(40 kt/y).
The second column gives the calculation of the thermal efficiency
of the cracking operation which is 80.1%. This is higher than that for
ethane cracking which reflects the overall lower cracking temperature.
The third column gives the estimation of the ethylene production cost
and the forth column an estimate of the operating margin with the price
for ethylene at $1278/t and propylene at $1214/t.
Following the basic methodology, the production cost for ethylene
is estimated at about $1136/tonne. Using the basic values of the products,
the unit operating margin is estimated at $322/tonne (14.61 cents/lb). The
latter calculation takes no account of non feed operating costs and capital
charges. This result is inferior to the ethane cracking outcome principally
due to the higher feedstock costs. As illustrated in Figure 8.2, the
production costs are dominated by the cost of feedstock.
The representative data for the OPEN, CLOSED and for the
integration with polymer production is illustrated in Table 8.3. This
illustrates that for the closed system when some of the valuable by-
products are degraded into fuel value streams, results in the operating
margin are significantly reduced. This is restored to higher values when
production is integrated with the downstream production of polymer as
the product is sold.
Under these conditions, the cracking of propane is seen as a less
profitable operation relative to other feedstocks. This agrees with the
trend over the past decade that as the relative cost of propane has risen,

150 Petrochemical Economics
Figure 8.2: Production cost breakdown for propane cracking - OPEN system
Table 8.3: Comparison of Margins for Propane Cracking
OPEN CLOSED polymer
UNIT ETHYLENE PRODUCTION COST ($/t) $1,136.03 $1,218 $1,341
UNIT OPERATING MARGIN ($/t) $322.10 $241.02 $603.94
UNIT OPERATING MARGIN (cents/lb) 14.61 $10.93 $27.39
there has been progressively less cracking of propane. However in
several parts of the world, propane is available at prices well below the
world parity price.
Sensitivity to Oil Price
As discussed previously, the world traded price for propane is
dependent on the prevailing price of crude oil, as are the values of
downstream products such as pyrolysis gasoline. Keeping all other
variables constant, the impact of changing the price of oil on the
economics of cracking propane is illustrated in Figure 8.3, which shows
how the production cost rises with increasing oil price.
As is illustrated by this figure, the cost of production for the three
scenarios considered is very sensitive to oil price. In this analysis there is
little difference between the three scenarios. On close inspection it is
seen that at low oil price, the OPEN system produces a lower cost as
minor by-products are degraded to fuel value in the CLOSED system.
66.8%
12.1%
11.9%
9.2%
FEEDSTOCK COSTS
FUEL COSTS
CAPITAL CHARGES
OPERATING COSTS

LPG Cracking 151
However, as oil price rises the gap closes as increasing oil price impacts
on the higher fuel cost in the OPEN system.
Figure 8.3: Sensitivity of ethylene production cost by propane cracking to oil price
Figure 8.4: Sensitivity of ethylene production cost to propane price
Sensitivity to the Price of Propane
Keeping all other values the same, with oil at $70/bbl, the
sensitivity of the production cost to the price of propane is illustrated
in Figure 8.4. This plots the cost of propane from $1/GJ to $17/GJ
approximately from $50 to $900/tonne.
5.00 7.00 9.00 11.00 13.00 15.00 17.00
PROPANE PRICE ($/GJ)
500
1000
1500
2000
ET
HY
LE
NE
CO
ST
($/t)
OPEN
CLOSED
0 50 100 150 200 250
OIL PRICE ($/bbl)
0
500
1000
1500
2000
2500
3000
3500
4000
ET
HY
LE
NE
CO
ST
($/t
)
OPEN
CLOSED
polymer

152 Petrochemical Economics
The higher values correspond to the situation of high oil price and
import parity pricing for propane. The lower end expresses the situation
where propane is priced on a cost of recovery basis from large gas plants
in the Middle East. These figures clearly indicate the competitive
advantage of the latter operations.
Economics of Butane Cracking
The cracking of normal butane is very similar to that for
propane and is accomplished in plants similar in design to that for
ethane cracking. Capital costs are slightly higher (at $850 million for
500,000 t/y ethylene capacity, to account for the handling of heavier
products and any feed hydrogenation that may be required. The basic
statistics are shown in Table 8.4 for the OPEN system.
Relative to other gaseous feeds, butane cracking produces more of
the heavier products; for instance in producing 500 kt ethylene, butane
cracking produces more pyrolysis gasoline (40 kt) compared to propane
(17 kt) and ethane (11 kt). Propylene is also produced in increased
quantities: 168 kt versus 155 kt for propane. The temperatures required
to produce the products are lower than that required for ethane, which
results in the thermal efficiency rising to about 81% from 78% for
ethane. Relative to propane, butane cracking has a slightly improved
thermal efficiency.
Compared to propane cracking, despite a slightly higher capital
cost, the ethylene production cost is lower at $1098/t versus 1136/t. The
improvement is a consequence of a higher propylene and gasoline
production and less methane. Together these improve the amount of by-
product credit. Under the base case conditions with butane linked to the
prevailing oil price set at $70/bbl, the operating margin is about $380/t.
With butane priced a world parity and oil at $70/bbl, feedstock
prices dominate the production cost. This is illustrated in Figure 8.5 for
an OPEN system (all products sold at opportunity value).
The sensitivity on the price of oil is illustrated in Figure 8.6 which
plots the production cost for the OPEN and CLOSED system against the
oil price.

LPG Cracking 153
Table 8.4: Statistics for n-Butane Cracking (OPEN)
BUTANE PRICE $/GJ 10.89
$/tonne 533.4
CAPEX MM$ $850.79
OPEX (10% CAPEX) MM$/y $85.08
RETURN ON WOR. CAP MM$/y 9.22
RECOVERY (10%DCF, 20y, FACTOR 0.143) MM$/y $136.98
FEEDSTOCK & FUEL PURCHASES
kt/y PJ/y MM$/y MM$/y
Feedstock 1128 55.27 $601.70 $601.70
Operating Feed (5.5%) 62 3.04 $33.09 $33.09
Fuel 330 14.16 $118.04 $118.04
Operating Fuel (3%) 10 0.42 $3.54 $3.54
TOTAL 1530 72.89 $756.37 $756.37
OUTPUTS
Ethylene 500 25.15 $639.00
Propylene 168 8.22 $203.95
BTD/C4 olefins 75 3.61 $44.85 $44.85
Gasoline 40 1.86 $25.85 $25.85
Hydrogen 18 2.55 $40.84 $40.84
Methane 259 14.37 $115.00 $115.00
Propane 19 0.96 $10.68 $10.68
Butane 49 2.4 $26.14 $26.14
Fuel Oil 0 0 $0.00 $0.00
TOTAL 1128 59.11 $263.35 $1,106.30
Figure 8.5: Production cost breakdown for butane cracking - OPEN system
73.0%
16.2%
10.9%
FEEDSTOCK COSTS
CAPITAL CHARGES
OPERATING COSTS
FUEL COSTS

154 Petrochemical Economics
Figure 8.6: Sensitivity of ethylene production cost by butane cracking to oil price
Table 8.5: Comparison of Margins for Butane Cracking
OPEN CLOSED POLYMER
CAPEX (MM$) 850 850 1,084
UNIT PRODUCTION COST ($/t) 1,098 1,246 1,353
UNIT OPERATING MARGIN ($/t) 382 236 605
UNIT OPERATING MARGIN (cents/lb) 17.4 10.71 27.40
At low oil price, the OPEN system produces a lower cost as minor
by-products are degraded to fuel value in the CLOSED system.
However, as oil price rises the gap closes as increasing oil price impacts
on the higher fuel cost in the OPEN system.
The POLYMER case is developed from the closed system when
the ethylene and propylene streams are integrated with polymer
production. The relevant statistics are given in Table 8.5 comparing all
three scenarios.
The impact of the price of butane is shown in Figures 8.7, which
shows how the ethylene production cost are influenced by a change in
the butane price.
The graph illustrates the lowering of the production cost as the
butane price falls away from the parity price influenced by the price of
oil.
0 50 100 150 200 250
OIL PRICE ($/bbl)
0
500
1000
1500
2000
2500
3000
3500
ET
HY
LE
NE
CO
ST
($/t
)
OPEN
CLOSED
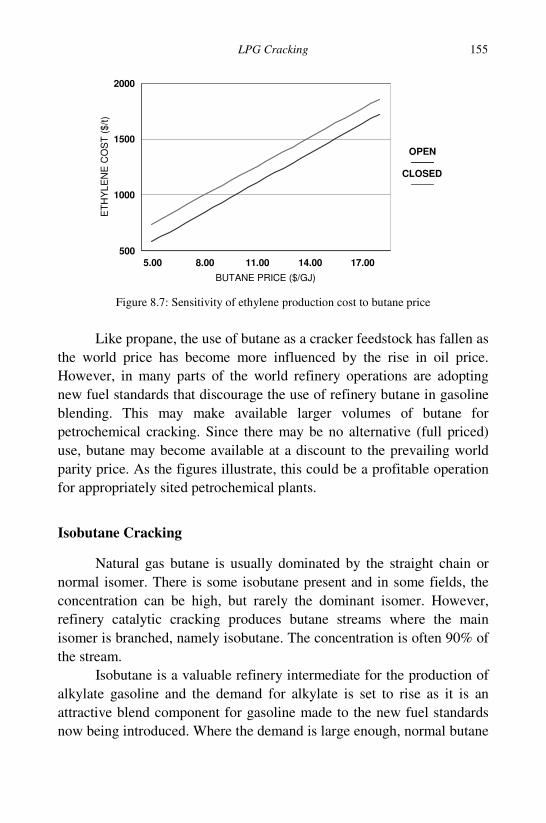
LPG Cracking 155
Figure 8.7: Sensitivity of ethylene production cost to butane price
Like propane, the use of butane as a cracker feedstock has fallen as
the world price has become more influenced by the rise in oil price.
However, in many parts of the world refinery operations are adopting
new fuel standards that discourage the use of refinery butane in gasoline
blending. This may make available larger volumes of butane for
petrochemical cracking. Since there may be no alternative (full priced)
use, butane may become available at a discount to the prevailing world
parity price. As the figures illustrate, this could be a profitable operation
for appropriately sited petrochemical plants.
Isobutane Cracking
Natural gas butane is usually dominated by the straight chain or
normal isomer. There is some isobutane present and in some fields, the
concentration can be high, but rarely the dominant isomer. However,
refinery catalytic cracking produces butane streams where the main
isomer is branched, namely isobutane. The concentration is often 90% of
the stream.
Isobutane is a valuable refinery intermediate for the production of
alkylate gasoline and the demand for alkylate is set to rise as it is an
attractive blend component for gasoline made to the new fuel standards
now being introduced. Where the demand is large enough, normal butane
5.00 8.00 11.00 14.00 17.00
BUTANE PRICE ($/GJ)
500
1000
1500
2000
ET
HY
LE
NE
CO
ST
($
/t)
OPEN
CLOSED

156 Petrochemical Economics
can be isomerised into the branched isomer to capture its generally
higher value.
Because the cracking product slate is quite different between
normal and isobutane, it is important to take cognisance of the isobutane
concentration in a butane stream used for cracking. The difference is
illustrated in Table 8.6.
Table 8.6: Product Slate for Butane Isomers
normal Iso
Ethylene 41.66 7.67
Propylene 14.71 34.57
BTD/C4 olefins 6.05 25.41
Gasoline 8.49 5.72
Hydrogen 1.49 1.30
Fuel Gas 23.72 21.01
Propane 0.48 0.46
Butane 4.00 3.86
Fuel Oil 0.00 0.00
TOTAL 100.6 100
The data has been adapted from Table 8.1 to show the relative
amounts of products at similar conversion levels. This indicates that the
differences are mainly the considerably lower ethylene yield and higher
propylene and C4 olefin yield (with the branched isomer dominant).
Thus, an operation able to crack butane would be able to lift
propylene yields if the increased amounts of isobutane were to be fed
into the system. This could be by either isobutane purchases or
isomerisation of n-butane feedstock. This gives a gas cracking operation
some flexibility in altering the ethylene/propylene split which is
otherwise difficult with gaseous feedstock.
Carbon Dioxide Emissions in LPG Cracking
In the CLOSED scenario (in which some of the products are used
as fuel or feedstock) there is an excess of methane and hydrogen over
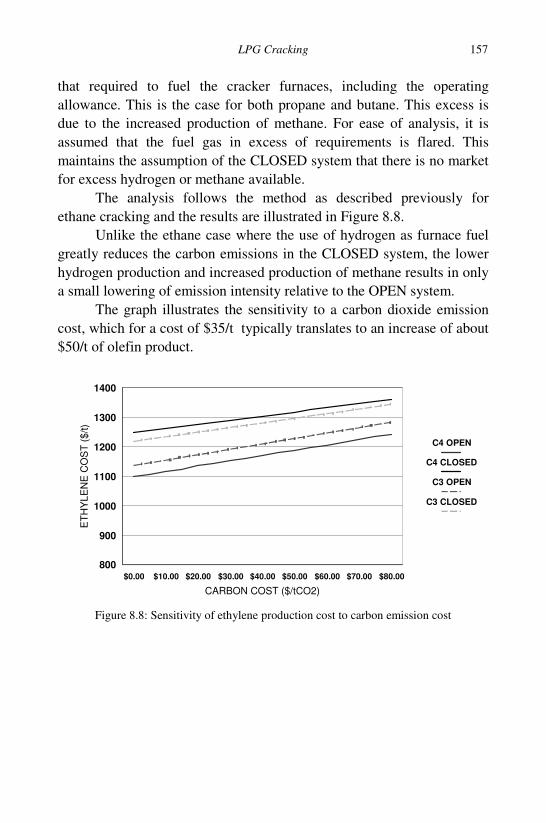
LPG Cracking 157
that required to fuel the cracker furnaces, including the operating
allowance. This is the case for both propane and butane. This excess is
due to the increased production of methane. For ease of analysis, it is
assumed that the fuel gas in excess of requirements is flared. This
maintains the assumption of the CLOSED system that there is no market
for excess hydrogen or methane available.
The analysis follows the method as described previously for
ethane cracking and the results are illustrated in Figure 8.8.
Unlike the ethane case where the use of hydrogen as furnace fuel
greatly reduces the carbon emissions in the CLOSED system, the lower
hydrogen production and increased production of methane results in only
a small lowering of emission intensity relative to the OPEN system.
The graph illustrates the sensitivity to a carbon dioxide emission
cost, which for a cost of $35/t typically translates to an increase of about
$50/t of olefin product.
Figure 8.8: Sensitivity of ethylene production cost to carbon emission cost
$0.00 $10.00 $20.00 $30.00 $40.00 $50.00 $60.00 $70.00 $80.00
CARBON COST ($/tCO2)
800
900
1000
1100
1200
1300
1400
ET
HY
LE
NE
CO
ST
($
/t)
C4 OPEN
C4 CLOSED
C3 OPEN
C3 CLOSED

This page intentionally left blankThis page intentionally left blank

159
CHAPTER 9
LIQUID FEEDSTOCK CRACKING
This chapter focuses on the economics of cracking naphtha and
gas oil. The cracking of liquid feedstock produces most of the world’s
ethylene. This is dominated by naphtha cracking, the character of which
has been discussed previously. Where available, there is some cracking
of gas oil.
The cracking of naphtha is carried out in all regions. The nominal
capacity of the operations ranges from about 250 kt/y ethylene to
operations producing over 1 million tonnes ethylene. There is good
economy of scale and today’s world scale crackers have a typical scale of
500 to 1000 kt/y ethylene, typically 850 kt/y.
A distinguishing feature of naphtha operations relative to gas
feedstock crackers is the production of heavier products. This requires a
considerable amount of process plant at the front end and the back end of
the plant to handle them. A typical process block flow is illustrated in
Figure 9.1.
Figure 9.1: Typical unit operations for pyrolysis of naphtha and gas oil
F E E DP Y R O L Y S IS G A S O L IN E
F U E L O IL
P Y R O L Y S IS Q U E N C H C O M P . A C ID G A S C O M PD E -H Y D R A T IO ND E -M E T H A N IZ E RD E -E T H A N IZ E RD E -P R O P A N IZ E R A C E T Y L E N ER E M O V A L E T H Y L E N ET O W E RR E M O V A LP R O P Y N ER E M O V A L P R O P Y L E N ET O W E R E T H Y L E N EP R O P Y L E N EC 4 S T R E A M
F U E L G A SD E -B U T A N IZ E R
P Y R O L Y S IS P R IM A R YF R A C T IO N A T O RG A S

160 Petrochemical Economics
Feedstock (after pre-treatment if necessary) is passed along with
steam to the pyrolysis furnace. This cracks the compounds in the
naphtha, producing a full range of products which are extremely
complex. As with gas feedstock, heavier products are produced, but in
increased volumes. After quenching a primary fractionator (not present
in gas crackers) separates the heavy pyrolysis fuel oil from the cracked
gases.
One of the issues that concern liquid feedstock cracking operations
is a higher rate of fouling. This is not only a consequence of heavier coke
forming precursors, but also as a consequence of long lived free radicals
which act as agents for the formation of a polymer (often referred to as
pop-corn polymer) in the primary fractionator and downstream units. For
instance, free radicals based on styrene or indene have sufficiently long
half-lives to pass from the pyrolysis section into the primary fractionator.
These can concentrate in this unit and produce polymer (free radical
polymerisation) when sufficient amounts of suitable olefins are present,
in particular styrene itself and di-olefins such as cyclo-pentadiene or
butadiene.
After primary separation, the cracked gases are compressed, acid
gases are removed, the product gases are recompressed and dried then
light gases – methane and hydrogen – are removed in the de-methaniser
tower. These light fuel gases are often separated in a cryogenic cold-box.
This is adversely affected if mercury is present in the naphtha; there has
been a move in recent times to introduce mercury removal as a pre-
treatment step to the naphtha feed1
. This is usually not an issue for gas
feedstock, because large gas plants separating ethane often employ cold-
box technology and hence require mercury removal upstream of the
petrochemical plant.
This is followed by separation of the cracked gases according to
carbon number in much the same was as that for gaseous feedstock. As
well as larger volumes in of C3 products, there are large volumes of
material in the C4 and pyrolysis gasoline fractions. These are sent to
downstream processing units for further separation and upgrading.
One of the features of liquid feedstock cracking is the production
of large volumes of ethane. These are collected by the de-ethanizer tower
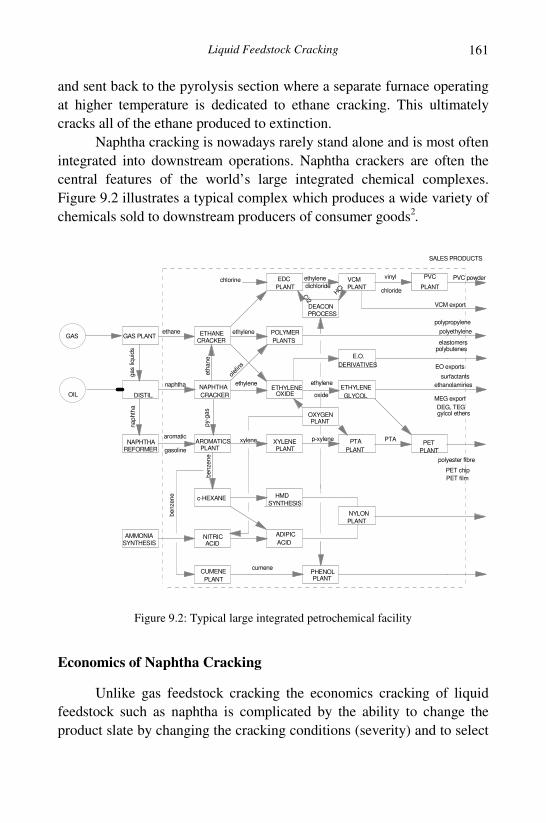
Liquid Feedstock Cracking
161
and sent back to the pyrolysis section where a separate furnace operating
at higher temperature is dedicated to ethane cracking. This ultimately
cracks all of the ethane produced to extinction.
Naphtha cracking is nowadays rarely stand alone and is most often
integrated into downstream operations. Naphtha crackers are often the
central features of the world’s large integrated chemical complexes.
Figure 9.2 illustrates a typical complex which produces a wide variety of
chemicals sold to downstream producers of consumer goods2
.
Figure 9.2: Typical large integrated petrochemical facility
Economics of Naphtha Cracking
Unlike gas feedstock cracking the economics cracking of liquid
feedstock such as naphtha is complicated by the ability to change the
product slate by changing the cracking conditions (severity) and to select
PVC powder
polyester fibre
SALES PRODUCTS
PET
PLANT
PVC
PLANT
vinyl
chloride
VCM export
polyethylene
polypropylene
polybuteneselastomers
ethanolamines
EO exports
surfactants
gylcol ethers
MEG export
DEG, TEG
PET chip
PET film
GAS
OIL
GAS PLANT
DISTIL.
ETHANECRACKER
NAPHTHA
CRACKER
ethane
naphtha
NAPHTHAREFORMER
AROMATICSPLANT
nap
hth
a
aromatic
gasoline
eth
an
e
gas liq
uid
s
py-g
as
XYLENEPLANT
ETHYLENEOXIDE
ethylene
POLYMER
PLANTS
ethylene
ETHYLENE
GLYCOL
PTA
PLANT
ethylene
oxide
E.O.
DERIVATIVES
p-xylene PTA
OXYGENPLANT
xylene
CUMENE
PLANT
PHENOLPLANT
benzen
e
cumene
olef
ins
EDC
PLANT
VCM
PLANT
DEACONPROCESS
HCl
Cl2
chlorine ethylene
dichloride
AMMONIASYNTHESIS
NITRICACID
c-HEXANE HMD
SYNTHESIS
ADIPIC
ACID
benzene
NYLON
PLANT
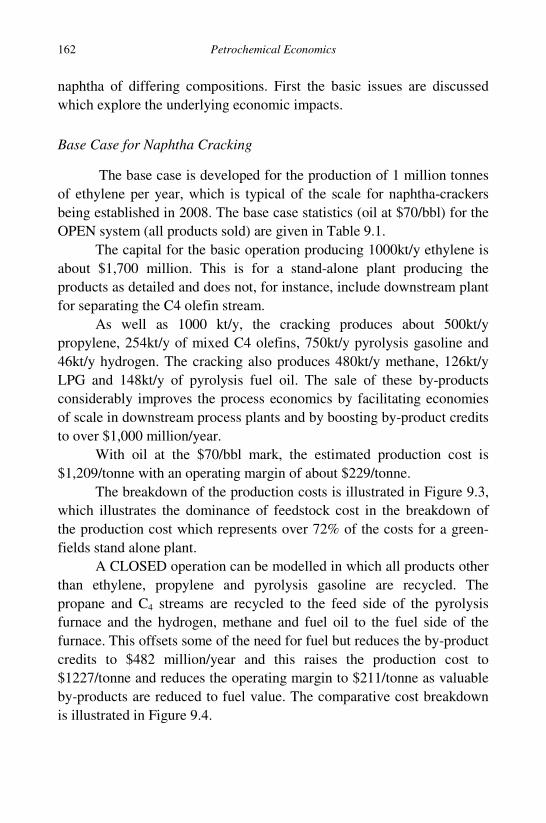
162 Petrochemical Economics
naphtha of differing compositions. First the basic issues are discussed
which explore the underlying economic impacts.
Base Case for Naphtha Cracking
The base case is developed for the production of 1 million tonnes
of ethylene per year, which is typical of the scale for naphtha-crackers
being established in 2008. The base case statistics (oil at $70/bbl) for the
OPEN system (all products sold) are given in Table 9.1.
The capital for the basic operation producing 1000kt/y ethylene is
about $1,700 million. This is for a stand-alone plant producing the
products as detailed and does not, for instance, include downstream plant
for separating the C4 olefin stream.
As well as 1000 kt/y, the cracking produces about 500kt/y
propylene, 254kt/y of mixed C4 olefins, 750kt/y pyrolysis gasoline and
46kt/y hydrogen. The cracking also produces 480kt/y methane, 126kt/y
LPG and 148kt/y of pyrolysis fuel oil. The sale of these by-products
considerably improves the process economics by facilitating economies
of scale in downstream process plants and by boosting by-product credits
to over $1,000 million/year.
With oil at the $70/bbl mark, the estimated production cost is
$1,209/tonne with an operating margin of about $229/tonne.
The breakdown of the production costs is illustrated in Figure 9.3,
which illustrates the dominance of feedstock cost in the breakdown of
the production cost which represents over 72% of the costs for a green-
fields stand alone plant.
A CLOSED operation can be modelled in which all products other
than ethylene, propylene and pyrolysis gasoline are recycled. The
propane and C4 streams are recycled to the feed side of the pyrolysis
furnace and the hydrogen, methane and fuel oil to the fuel side of the
furnace. This offsets some of the need for fuel but reduces the by-product
credits to $482 million/year and this raises the production cost to
$1227/tonne and reduces the operating margin to $211/tonne as valuable
by-products are reduced to fuel value. The comparative cost breakdown
is illustrated in Figure 9.4.
Liquid Feedstock Cracking
163
Table 9.1: Statistics for Naphtha Cracking
CAPEX MM$ $1,708.80
OPEX (10% CAPEX) MM$/y $170.88 $170.88
RETURN ON WOR. CAP MM$/y $24.77 $24.77
RECOVERY (10%DCF, 20y,
FACTOR 0.143)
MM$/y $244.36
kt/y PJ/y MM$/y MM$/y
FEEDSTOCK & FUEL
PURCHASES
Feedstock 3312 159.31 $1,980.40 $1,980.40
Operating Feed (5.5%) 182 8.76 $108.92 $108.92
Fuel 926 39.73 $331.21 $331.21
Operating Fuel (3%) 28 1.19 $9.94 $9.94
TOTAL 4448 208.99 $2,430.47 $2,430.47
OUTPUTS
Ethylene 1000 50.30 $1,278.00
Propylene 512 25.04 $621.57
BTD/C4 olefins 254 12.22 $151.88 $151.88
Gasoline 746 34.61 $482.19 $482.19
Hydrogen 46 6.52 $104.36 $104.36
Methane 480 26.64 $213.12 $213.12
Propane 40 2.01 $22.48 $22.48
Butane 86 4.21 $45.87 $45.87
Fuel Oil 148 6.35 $52.94 $52.94
TOTAL 3312 167.91 $1,072.84 $1,072.84
THERMAL EFFICIENCY (%) 80.34%
ANNUAL COSTS $2,870.48 $2,626.12
BYPRODUCT CREDITS $1,072.84
UNIT ETHYLENE
PRODUCTION COST ($/t)
$1,209.42
MARGIN $346.29
$/t $229.03
c/lb 10.39

164 Petrochemical Economics
Figure 9.3: Breakdown of ethylene production cost using naphtha
feedstock – OPEN system
Figure 9.4: Breakdown of ethylene production cost using naphtha
feedstock – CLOSED system
Sensitivity to Oil Price
The price of oil influences the cracking economics by changing
both the price of feedstock and fuel and changing the value for pyrolysis
gasoline and fuel oil. The sensitivity of the unit production is illustrated
in Figure 9.5.
72.8%
11.9%
8.5%
6.8%
FEEDSTOCK COSTS
FUEL COSTS
CAPITAL CHARGES
OPERATING COSTS
76.0%
10.6%
8.3%
5.2%
FEEDSTOCK COSTS
CAPITAL CHARGES
OPERATING COSTS
FUEL COSTS

Liquid Feedstock Cracking
165
Figure 9.5: Sensitivity of ethylene production cost from naphtha to oil price
With oil at $70/bbl, the production cost is about $1,200/t for
both OPEN and CLOSED scenarios. This sensitivity analysis suggests
that as the oil price rises above $70/bbl the CLOSED system becomes
progressively more economic (representing the upgrading of some of the
by-products and naphtha to gasoline). However, this may not eventuate
in practice because this modelling may be over-simplified with recycled
LPG being modelled as giving the same product slate as naphtha.
Sensitivity to the Relative Value of Ethylene and Propylene
One of the main features of cracking liquids is the high yield of
propylene. In the world market there are often marked regional
differences in the relative demand and hence price of ethylene and
propylene. In the EU, propylene generally trades at a lower value that
ethylene, whereas in the Far East this is reversed.
The basic economics are quite sensitive to the relative value of
propylene to ethylene. This is illustrated in Figure 9.6, which shows how
the production cost of ethylene changes with the relative value propylene
and ethylene.
The base case economics assumes the unit values of ethylene
and propylene have a ratio of 0.95, similar to typical EU experience.
The graph shows that when the propylene value is higher than the value
of ethylene there is a progressive fall in the production cost of ethylene.
0 50 100 150 200 250
OIL PRICE ($/bbl)
0
500
1000
1500
2000
2500
3000
3500
4000
ET
HY
LE
NE
CO
ST
($
/t)
OPEN
CLOSED
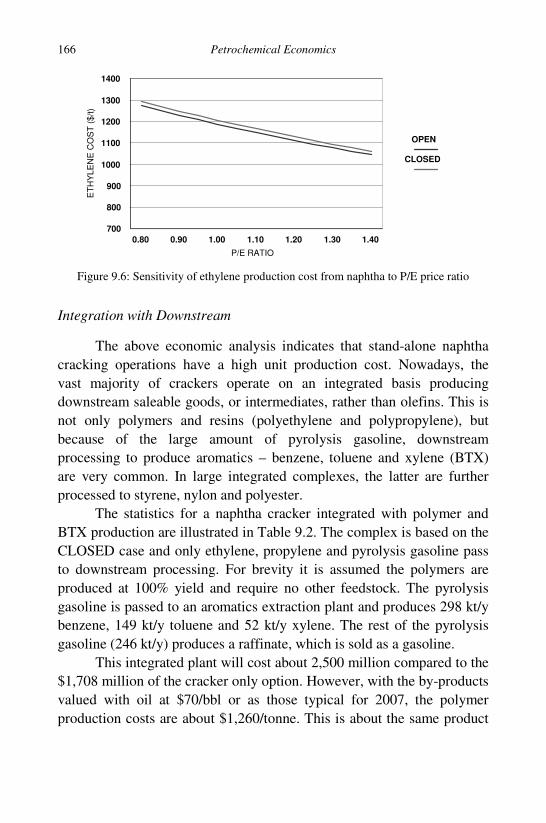
166 Petrochemical Economics
Figure 9.6: Sensitivity of ethylene production cost from naphtha to P/E price ratio
Integration with Downstream
The above economic analysis indicates that stand-alone naphtha
cracking operations have a high unit production cost. Nowadays, the
vast majority of crackers operate on an integrated basis producing
downstream saleable goods, or intermediates, rather than olefins. This is
not only polymers and resins (polyethylene and polypropylene), but
because of the large amount of pyrolysis gasoline, downstream
processing to produce aromatics – benzene, toluene and xylene (BTX)
are very common. In large integrated complexes, the latter are further
processed to styrene, nylon and polyester.
The statistics for a naphtha cracker integrated with polymer and
BTX production are illustrated in Table 9.2. The complex is based on the
CLOSED case and only ethylene, propylene and pyrolysis gasoline pass
to downstream processing. For brevity it is assumed the polymers are
produced at 100% yield and require no other feedstock. The pyrolysis
gasoline is passed to an aromatics extraction plant and produces 298 kt/y
benzene, 149 kt/y toluene and 52 kt/y xylene. The rest of the pyrolysis
gasoline (246 kt/y) produces a raffinate, which is sold as a gasoline.
This integrated plant will cost about 2,500 million compared to the
$1,708 million of the cracker only option. However, with the by-products
valued with oil at $70/bbl or as those typical for 2007, the polymer
production costs are about $1,260/tonne. This is about the same product
0.80 0.90 1.00 1.10 1.20 1.30 1.40
P/E RATIO
700
800
900
1000
1100
1200
1300
1400E
TH
YLE
NE
CO
ST
($/t)
OPEN
CLOSED

Liquid Feedstock Cracking
167
Table 9.2: Naphtha Cracking to Polymer and BTX
Capital Costs kt/y MM$ MM$/y
Naphtha cracker Capex 1708.80
Polyethylene Capex 1000 466.76
Polypropylene Capex 512 238.98
BTX Capex 746 84.21
Total Capex $2,498.75
Opex (10% Capex) $249.88
Return on Working Capital 26.32
ROC (DCF, 20y, FACTOR 0.143) $357.32
Feedstock and Fuel Purchases kt/y MM$/y MM$/y
Feedstock 2929 $1,751.12 $1,751.12
Operating Feed (5.5%) 182 $108.92 $108.92
Fuel 5 $1.78 $1.78
Operating Fuel (3%) 28 $9.94 $9.94
Total 3143 $1,871.76
Polyethylene 1000 $1,702.40
Polypropylene 512 $814.28
Gasoline 246 $159.12 $159.12
Benzene 298 $313.62 $313.62
Toluene 149 $121.75 $121.75
Xylene 52 $46.84 $46.84
Total 2258 $641.33 $3,158.01
Annual Costs $2,505.27 $2,147.95
By-product Credits $641.33
Polymer Production Cost ($/t) $1,260.86
MARGIN $1,010.06
$/t $668.03
production cost as the CLOSED case for a more valuable product. With
polyethylene prices at the $1,700/tonne mark, the operating margin is
$668/tonne considerably higher that the $220/tonne for a stand alone
cracker producing only olefins. The breakdown of the production costs
are illustrated in Figure 9.7.
This illustrates that the further integration with downstream
operations results in a lessening of the dependence of feedstock
compared to the non integrated cases above. These results clearly

168 Petrochemical Economics
indicate the benefits of integration with downstream. Further
improvements in profitability can be made by producing higher-grade
polymers such as LLDPE and further upgrading of the raffinate from the
aromatics plant. The sensitivity of this integrated case to the prevailing
oil price is illustrated in Figure 9.8.
Figure 9.7: Production cost breakdown for polymer and BTX using naphtha
Figure 9.8: Sensitivity of polymer production cost from naphtha to oil price
70.0%
14.3%
11.0%
4.7%
FEEDSTOCK COSTS
CAPITAL CHARGES
OPERATING COSTS
FUEL COSTS
0 50 100 150 200 250
OIL PRICE ($/bbl)
0
1
2
3
4
Thousands
PO
LY
ET
HY
LE
NE
CO
ST
($/t
)

Liquid Feedstock Cracking
169
Impact of Cracking Severity
A distinguishing feature of liquid feedstock cracking in contrast to
cracking using a gas feedstock is the ability to increase the ethylene to
propylene ratio in the product slate by increasing the cracking
temperature. This is generally known as increasing the cracking severity.
The outcome is illustrated in Table 9.3, which compares the same
naphtha feedstock cracked at high and low severity to produce 500 kt/y
ethylene.
Table 9.3: Naphtha Cracking at High and Low Severity
HIGH SEVERITY LOW SEVERITY
kt/y PJ/y kt/y PJ/y
FEEDSTOCK & FUEL PURCHASES
Feedstock 1613 70.97 1872 82.37
Operating Feed (5.5%) 98 3.91 103 4.54
Fuel 688 29.52 611 26.21
Operating Fuel (3%) 21 0.89 18 0.79
TOTAL 2410 105.28 2604 113.91
OUTPUTS
Ethylene 500 25.15 500 25.15
Propylene 193 9.44 310 15.16
BTD/C4 olefins 105 5.05 174 8.37
Gasoline 351 16.29 523 24.27
Hydrogen 26 3.69 21 2.98
Methane 300 16.65 200 11.1
Propane 20 1.01 20 1.01
Butane 22 1.08 66 3.23
Fuel Oil 96 4.12 58 2.49
TOTAL 1613 82.46 1872 93.76
THERMAL EFFICIENCY (%) 78.32% 82.31%

170 Petrochemical Economics
The high severity option uses a high temperature to produce
500 kt/y ethylene. This requires more fuel but less naphtha feedstock
than the low severity case. This is reflected in the lower thermal
efficiency for higher severity products.
The high severity operation increases the production of ethylene
by increasing the cracking of heavier components and by-products.
Consequently all of the other products, other than methane and hydrogen,
are reduced relative to the low severity operation.
These changes result in lower feedstock costs, but higher fuel costs
and lower by-product credits for the lower severity case. The typical
range in outcomes as the oil price changes for the OPEN system is
illustrated in Figure 9.9. This indicates that with oil at $70/bbl and using
factored base case statistics for capital, feed and by-product credits, the
difference in ethylene production costs range over $150/t. Figure 9.10
illustrates the effect of changing the value of propylene relative to
ethylene (P/E) on the ethylene production costs. These figures illustrate
the advantage of low severity operation in producing high valued
propylene with the concomitant advantage of producing higher volumes
of pyrolysis gasoline.
Figure 9.9: Sensitivity of ethylene production cost from naphtha to oil
price – OPEN system
0 50 100 150 200 250
OIL PRICE ($/bbl)
0
1
2
3
4
Thousands
ET
HY
LE
NE
CO
ST
($/t
)
HIGH SEVERITY
LOW SEVERITY
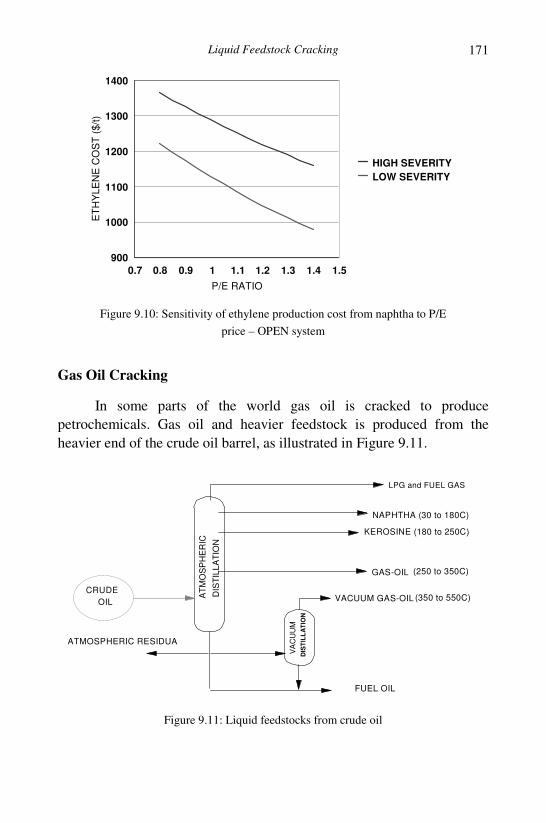
Liquid Feedstock Cracking
171
Figure 9.10: Sensitivity of ethylene production cost from naphtha to P/E
price – OPEN system
Gas Oil Cracking
In some parts of the world gas oil is cracked to produce
petrochemicals. Gas oil and heavier feedstock is produced from the
heavier end of the crude oil barrel, as illustrated in Figure 9.11.
Figure 9.11: Liquid feedstocks from crude oil
0.7 0.8 0.9 1 1.1 1.2 1.3 1.4 1.5
P/E RATIO
900
1000
1100
1200
1300
1400
ET
HY
LE
NE
CO
ST
($/t
)
HIGH SEVERITY
LOW SEVERITY
FUEL OIL
LPG and FUEL GAS
NAPHTHA (30 to 180C)
KEROSINE (180 to 250C)
CRUDE
OIL VACUUM GAS-OIL
GAS-OIL (250 to 350C)
(350 to 550C)AT
MO
SP
HE
RIC
DIS
TIL
LA
TIO
N
VA
CU
UM
DIS
TIL
LA
TIO
N
ATMOSPHERIC RESIDUA

172 Petrochemical Economics
Crude oil is distilled in a distillation column operating near to
atmospheric pressure to produce naphtha (b.p. 30o
C – 180o
C) and gas oil
(b.p. 25o
C – 360o
C). The bottoms of the column, known as atmospheric
residua, are passed to a vacuum distillation column which produces
vacuum gas oil (b.p. 350o
C – 550o
C). Any of these distilled liquid feeds
can be used to produce petrochemicals.
If gas oil and heavier feedstock are used as a cracker feedstock, the
most important difference relative to naphtha is in the production of
heavier materials, especially pyrolysis fuel oil, which requires more plant
and equipment for handling. Fouling rates in the process plant exposed to
the heavier materials are higher than those experienced for cracking
naphtha.
However, gas oil is used in refineries to produce diesel transport
fuel and has consequently a high value and a product slate too poor to
make it an attractive feedstock relative to naphtha. In recent years, many
gas oil crackers have been reconfigured to crack lighter feedstock or
heavier feedstock such as atmospheric residual fuel (b.p. > 360o
C).
The enhanced fouling rates and metal contamination (from the
crude oil) generally makes atmospheric residua unsuitable as a cracker
feedstock. However, some crude oils produce a waxy residual of low
metal content (often referred to as low sulphur waxy residua, LSWR).
Although more expensive than fuel oil, LSWR is considerably cheaper
than gas oil and is an attractive feedstock for some gas oil cracker
operations.
Gas oil cracking has all of the characteristics of naphtha cracking.
The typical statistics are given in Table 9.4. Relative to naphtha, the gas
oil cracking requires considerably more feed for the same ethylene
output (500 kt/y) and at the same time produces increased volumes of
pyrolysis gasoline and more particularly pyrolysis fuel oil. This requires
an increase in the fixed capital to naphtha for the same scale of operation.
For any given oil price, gas oil sells at a higher value because of its
demand for motor diesel, whereas fuel oil sells at a price lower than the
crude oil price (WTI, Tapis, Brent etc.). LSWR is linked to fuel oil prices
usually (but not always) and sells at a slightly higher price but still well
below the crude oil price.

Liquid Feedstock Cracking
173
Table 9.4: Statistics for Gas Oil Cracking at High and Low Severity
HIGH SEVERITY LOW SEVERITY
INPUTS kt/y PJ/y kt/y PJ/y
Feedstock 1864 82.02 2479 109.08
Operating Feed (5.5%) 103 4.51 136 6
Fuel 625 26.81 650 27.89
Operating Fuel (3%) 19 0.8 20 0.84
TOTAL 2610 114.14 3285 143.8
OUTPUTS
Ethylene 500 25.15 500 25.15
Propylene 173 8.46 359 17.56
BTD/C4 olefins 100 4.81 197 9.48
Gasoline 396 18.37 531 24.64
Hydrogen 21 2.98 21 2.98
Methane 263 14.6 205 11.38
Propane 27 1.36 25 1.26
Butane 19 0.93 82 4.02
Fuel Oil 365 15.66 559 23.98
TOTAL 1864 92.32 2479 120.43
THERMAL EFFICIENCY (%) 80.88 83.75
The sensitivity of the production economics for LSWR is
illustrated in Figure 9.12 for the open system (all products sold at market
price). This shows the production cost is very sensitive to the prevailing
price of the feedstock. However, despite an increase in capital relative to
the naphtha case, the production cost for ethylene is lower than the
naphtha case due to the marked lower feedstock price by about $200/t for
each of the scenarios.
Again the production cost is sensitive to the relative price of
propylene and ethylene which is illustrated in Figure 9.13. One of the
features of heavy oil cracking is the high propylene yield at low severity.
This serves to further reduce ethylene production cost as the relative
value of propylene rises.

174 Petrochemical Economics
Figure 9.12: Sensitivity of ethylene production cost from LSWR to oil price
Figure 9.13: Sensitivity of ethylene production cost from LSWR to P/E price
The LSWR’s availability is limited and can show high price
volatility3 so that few operations are totally dedicated to this feedstock. A
more common scenario is to adapt some of the furnaces operations of a
naphtha cracker to take heavier fuels on an occasional basis when the
feedstock becomes available.
0 50 100 150 200 250
OIL PRICE ($/bbl)
0
500
1000
1500
2000
2500
3000
ET
HY
LE
NE
CO
ST
($/t
)
HIGH SEVERITY
LOW SEVERITY
0.80 0.90 1.00 1.10 1.20 1.30 1.40
P/E RATIO
200
300
400
500
600
700
800
900
1000
1100
1200
ET
HY
LE
NE
CO
ST
($/t
)
HIGH SEVERITY
LOW SEVERITY

Liquid Feedstock Cracking
175
Carbon Emissions from Naphtha and LSWR Cracking
As well as OPEN and CLOSED operations, for liquid feedstocks
there are several issues to be addressed which are not relevant or have
little impact on the economics of olefin production from gas feedstocks.
These are:
• How emissions are to be distributed across all of the products
produced, and
• The impact of severity of operation on the emissions
OPEN versus CLOSED operations
Table 9.5 gives the statistics for cracking naphtha (1 million
tonnes of ethylene/year) for the OPEN and CLOSED systems. The first
column gives the mass of fuel and feed contributing to on-site emissions.
The second column, the energy (HHV basis) for fuel and feed used. The
third column gives the carbon dioxide emissions and when calculated on
a unit basis this emission is attributed to the principal olefin products
(ethylene and propylene). The fourth column gives the pertinent unit
emissions when the carbon dioxide emission is distributed across all of
the products.
The sensitivities to the carbon disposal cost are shown in
Figure 9.14. Within error of this type of analysis, these cost curves are
the same with the suggestion that as carbon disposal cost rises, the
CLOSED system becomes more cost competitive than the OPEN system
because high carbon intensity fuels are backed out in favour of hydrogen
and methane.
Emission Distribution across Products
Also given in Table 9.5 is the effect of distributing the cost of
carbon emissions across only the olefins (ethylene and propylene) versus
distributing this cost over all of the saleable products, i.e. that pyrolysis
gasoline and other products should receive some of the carbon charge.
The cost curves for the various scenarios are shown in Figure 9.15.

176 Petrochemical Economics
Table 9.5: Carbon Emissions from Naphtha Cracking
OPEN CLOSED
Mt/y PJ/y
Mt
CO2/y
Mt
CO2/y
MT/y PJ/y
Mt
CO2/y
Mt
CO2/y
Fuel Used Olefins
only
All
products
Olefins
only
All
products
Natural gas 26.640 1.367
LPG 0 0
Fuel oil 0.954 40.917 2.852 7.754 0.512
Total 0.954 40.917 2.852 34.394 1.878
tCO2/t products 1.886 0.861 1.242 0.832
Flaring
Naphtha 0.182 8.762 0.578 0.182 8.762 0.578
tCO2/t products 0.382 0.175 0.382 0.256
Total Emissions 3.430 2.457
tCO2/t product 2.269 1.036 1.625 1.088
$/t $/t $/t
CO2 cost/t
product
79.4 36.2 56.9 38.1
Ethylene
production cost
free of CO2 cost
1209.4 1209.4 1227.6 1227.6
Production cost
including CO2
1288.8 1245.7 1284.5 1265.7
Figure 9.14: Sensitivity of ethylene production cost from naphtha to carbon emission
cost – OPEN and CLOSED systems
$0.00
$10.00
$20.00
$30.00
$40.00
$50.00
$60.00
$70.00
$80.00
CARBON COST ($/tCO2)
1000
1100
1200
1300
1400
PR
OD
UC
TIO
N C
OS
T (
$/t
)
OPEN
CLOSED

Liquid Feedstock Cracking
177
Figure 9.15: Sensitivity of ethylene production cost from naphtha to carbon emission cost
distributed over olefins only and over all of the products
This figure illustrates the benefit of being able to distribute the cost of
carbon emissions across all of the products rather than just the olefin
stream.
How this would work in practice is moot since for the most part
these by-products (pyrolysis gasoline, fuel oil, and methane) compete in
markets where alternative sources are produced by other, potentially less
carbon intense means. It may be that all of the additional cost of
production cannot be passed on to the by-product stream and the impact
on the olefin production cost will be somewhere between the two levels.
Severity
The impact of severity is illustrated in Table 9.6 which gives the
four scenarios of interest. As can be seen, there is over 1 t/t of carbon to
be saved by going from a high severity OPEN system to a low severity
CLOSED system.
Table 9.6: Carbon Emissions at High and Low Severity
System OPEN OPEN CLOSED CLOSED
Severity High Low High Low
CO2 (t/t olefin) 2.762 2.029 2.053 1.520
$0.00
$10.00
$20.00
$30.00
$40.00
$50.00
$60.00
$70.00
$80.00
CARBON COST ($/tCO2)
1000
1100
1200
1300
1400
PR
OD
UC
TIO
N C
OS
T (
$/t
)
OPEN OLEFINS
CLOSED OLEFINS
OPEN ALL
CLOSED ALL

178 Petrochemical Economics
1
Axens, “Petrochemical Processes 2005”, Hydrocarbon Processing, ,CD ROM, p. 82
2
K. Weissermel, H.-J. Arpe, “Industrial Organic Chemistry” VCH Publishers, 2 edition
1993 details many downstream process operations.
3
LSWR finds use in power generation in the Far East which is constrained by the
sulphur emissions. It is used to displace higher sulphur fuel oils and coal in periods
of high power demand.

179
CHAPTER 10
OTHER ROUTES TO OLEFINS FROM
HYDROCARBONS
In this chapter we consider other commercially important routes to
the production of olefins other than by thermal steam cracking.
Alternative processes generally involve catalytic processes rather than
homogeneous gas-phase cracking. Although there have been proposals to
develop catalytic processes for the production of ethylene, most of these
alternative processes aim to produce propylene rather than ethylene.
Some process economics of some of these routes have been compared by
Houdek and Anderson1
and Nextant Inc.2
Fluid Cat-Cracking (FCC)
Fluid catalytic cracking, fluid cat-cracking or FCC, is a common
oil refinery process. The duty of an FCC unit is to take a heavy low value
gas oil or fuel oil and convert this to higher valued liquid products,
particularly gasoline blend-stock. The process also produces diesel fuel
blend-stock and a gas by-product stream. The gaseous by-products are
rich in olefins and in particular propylene and isobutene. Ethylene is a
minor component.
FCC unit operations are the central feature of many refineries.
Often it is physically the largest unit present in a refinery. It has been
under development over many decades and has developed to use residual
fuel oil rather than gas oil as the feedstock. In another development,
catalysts have been developed to lift the level of propylene produced so
that an FCC unit can produce considerable quantities of propylene as
well as gasoline blend-stock3
. FCC units produce a major portion of the
chemical propylene in many countries such as the USA and Australia.

180 Petrochemical Economics
Fluid Cat-Cracking Operations
Figure 10.1 shows the general layout of the process. The
feedstock, usually residual fuel oil, is heated to about 500o
C prior to
entering the unit. The feed enters a pipe where it is mixed with hot
catalyst from the regenerator. Feed undergoes immediate and rapid
cracking as it rises in the pipe (known as the riser) and enters the
separation unit.
Figure 10.1: Schematic for a fluid cat-cracker
In the separator unit, steam separates the catalyst from the
hydrocarbon products. The internals of the stripping unit contain
cyclones which remove residual catalyst from the hydrocarbon fluids.
The fluids flow to a distillation column which separates the products into
various fractions.
The column bottoms (referred to as slurry decant oil) pass to heavy
oil processing units or are blended into heavy fuel oil. The heavy gas oil
fraction (sometimes called heavy cycle oil) is recycled or used as blend-
stock for heavy diesel or industrial fuel oil. The light gas oil (sometimes
called light cycle oil) is used for diesel blend-stock. The most important
product is the gasoline component which goes to gasoline blending. The
FRESH
FEED
CATALYST
REGENERATOR
CATALYST
DISENGAGEMENT
STRIPPING
STEAM
AIR
PURGE GAS
GASOLINE
LIGHT GAS OIL
HEAVY GAS OIL
SLURRY DECANT OIL
RECYCLE
GAS
RISER

Other Routes from Hydrocarbons
181
gas fraction (which can be rich in propylene) goes to the refinery gas
plant where the olefins are separated.
Propylene exiting the gas plant is suitable for many refinery
and chemical operations. For polypropylene manufacturing further
purification is required to protect downstream units from traces of
acetylenes and allene which may be produced.
Catalyst falling to the bottom of the separator is passed by an air-
lift to a regenerator unit. Here, the air burns carbon deposited on the
catalyst and reheats the catalyst before its return to the riser pipe. In some
systems, and to prevent overheating in the regenerator, the oxidation of
carbon proceeds only to carbon monoxide and carbon monoxide
combustion to carbon dioxide occurs in a second regenerator.
Excessive heat generation in the regenerator is a particular
problem when using residual feed when coke formation is higher.
Residual fuel FCC operations generally have additional heat removal
mechanisms in the regenerator. This can be steam raising coils or
external catalyst coolers.
Gas expansion in the regenerator is used to produce power in a
downstream gas turbine before the carbon dioxide is discharged to the
atmosphere.
Catalysts
The basic catalysts used in FCC operations are highly acidic
solids. Prior to FCC, cracking technology depended on amorphous silica-
alumina which has an acidic character and upon which the chemistry is
based. The discovery of crystalline alumina-silicates, the zeolites, that
are stable at the cracking temperatures revolutionised cracking
technology. The main catalyst is a stabilised zeolite-Y crystals which are
held within an amorphous silica-alumina matrix. Stabilisation of zeolite-
Y involves exchanging with rare earths (commonly noted as RE-Y)
followed by a steaming process.
Zeolite-Y has very large diameter pores which permit the entry of
the large feedstock molecules. These interact with the acid sites and at
the temperature of operation (typically 550o
C) result in cracking of the
molecules into smaller molecules. As well as cracking, hydrogen transfer

182 Petrochemical Economics
occurs so that the products produced are smaller molecules, with higher
hydrogen to carbon ratio than the feedstock, and carbon, which is in the
form of coke on the catalyst.
Because the process is dominated by acidic catalysis, if the
cracking processes are taken to the extreme, the cracking reactions
(known as β-scission) result in propylene and branched olefins such as
isobutene. These olefins dominate the light gas products. Ethylene is a
very minor component and its presence may be due to a small amount of
thermal cracking taking place.
In order to improve the olefin yield, zeolites which are more acidic
than zeolite-Y are added to the matrix. These are mainly based on the
smaller pored zeolite ZSM-5. This zeolite processes smaller molecules
produced by the main cracking process and continues the cracking to
smaller olefins and aromatics.
Product Yields
A typical product slate is given in Table 10.1; the data is taken
from Maples4
. The yields are dependent on the nature of the feedstock
and the severity of the operation. Because the objective of FCC operation
is the production of liquid fuels, particularly gasoline, there is a wide
range of practical outcomes for propylene yield. The data in the table is
considered typical and shows a propylene yield of 5.5% (wt.) on feed.
Table 10.1: Typical FCC Cracking Yields
Vol% Mass % Mass %
C3 1.56 1.10% 0.99
C3= 8.56 6.07% 5.50
iC4- 4.05 3.26% 2.96
nC4 1.10 0.82% 0.74
C4= 9.94 8.01% 7.26
GASOLINE 54.19 54.99% 49.81
LCO 14.54 18.07% 16.37
HCO 6.16 7.68% 6.95
Gas % 2.99
Coke% 6.43
TOTAL 100% 100% 100.00

Other Routes from Hydrocarbons
183
Table 10.2: FCC Cracking to Propylene
T(o
C) Cat/Oil C3= % Coke%
Base 532.2 8.5 4.6 5.44
Case 1 543.3 9.1 6.9 5.58
Case 2 548.9 9.4 9.3 5.65
Case 3 554.4 9.6 12.4 5.70
FCC units are very large operations typically taking 30,000 bbl/d
of feedstock. This generates about 80,000 t/y of propylene. This is
sufficient to give enough propylene for a modest sized polypropylene
unit.
A more systematic study has been produced by Golden et alia5
with representative data given in Table 10.2. The table illustrates that
higher propylene yield is a consequence of increasing severity in the
FCC operation; that is increasing temperature and the catalyst to oil ratio
increases the propylene yield. There is a concomitant increase in the
amount of coke deposited on the catalyst.
The consequence of this is that since there is a correlation between
the propylene yields and coke; higher propylene yields are associated
with higher carbon dioxide emissions as the coke is burnt-off in the FCC
regenerator.
Fujiyama et alia6
have proposed reconfiguring FCC operations to
increase propylene yield. The group have demonstrated a down-flow
reactor system operating at high catalyst to oil ratios (>15), high reaction
temperature (> 550o
C) and short residence time (< 0.5 sec) and obtained
propylene yields over 15%.
In the past few years workers at Sinopec have been prominent in
developing FCC operations which target propylene as a major product.
The increased propylene yield is a function of catalyst developments and
increasing the cracking temperature. This variation is known as Deep
Catalytic Cracking (DCC) and there are two main variants. Table 10.3
illustrates typical yields that can be achieved7
.
The results indicate that at cracking temperatures of about 550o
C,
about 20% of the product can be propylene. As well propylene there is a
larger portion of ethylene produced. This may be due to either increased

184 Petrochemical Economics
Table 10.3: Propylene Yield Using Special Catalysts and High Temperatures
Refinery Daqing Anqing TPI Jinan Jinan
Mode DCC -1 DCC -1 DCC -1 DCC -1 DCC - II
Feed Para -
VGOa
Nap –
VGOb
Arab VGO
DAO +
WAXc
VGO +
DAOd
Temperature (C) 545 550 565 564 530
Ethylene (wt%) 3.7 3.5 5.3 5.3 1.8
Propylene (wt%) 23.0 18.6 18.5 19.2 14.4
Butenes (wt%) 17.3 13.8 13.3 13.2 11.4
of which Isobutene 6.9 5.7 5.9 5.2 4.8
Isopentene 5.9
(a) paraffinic vacuum gas oil, (b) naphthenic vacuum gas oil (c) Arabian vacuum gas oil
plus de-asphalted oil plus wax, (d) vacuum gas oil plus de-asphalted oil
Table 10.4: Ethylene and Propylene from Low Value Naphtha Streams
Feedstock
Yield (wt%) FCC Naphtha Coker Naphtha Pyrolysis C4 Pyrolysis C5
Fuel gas 13.6 11.6 7.2 12.0
Ethylene 20.0 19.8 22.5 22.1
Propylene 40.1 38.7 48.2 43.8
Propane 6.6 7.0 5.3 6.5
C6+ gasoline 19.7 22.9 16.8 15.6
homogeneous cracking in this system or the catalyst promoting non-
classical acid cracking to form ethylene.
Recently a new FCC catalytic system has been proposed which
will generate ethylene and propylene from low value olefin rich naphtha
feedstock8
.
Typical yields are given in Table 10.4.
In essence this process builds on the ability of zeolites catalysts
such as ZSM-5 to establish equilibrium between olefin homologues.
Thus when fed a long chain olefin (say octene) at high temperature
(typically 500o
C), lighter olefins (ethylene and propylene) will be
produced. This is essentially the reverse of the olefin polymerisation
process which works at lower temperatures to produce polymer gasoline
and light diesel from light olefins, such as propylene or butene, using
acid catalysts, such as phosphoric acid supported on silica.

Other Routes from Hydrocarbons
185
Economics of FCC Cracking
We are concerned with the economics of FCC cracking from the
perspective of the production of propylene. This is complicated by the
fact that the duty of the FCC unit is to maximise the production of
gasoline for blending; propylene is only a minor product. Clearly the
minimum production cost is the cost of production of gasoline. In this, it
should be recalled that many refinery operations use the propylene as
feedstock for the production of gasoline either by oligomerisation (poly-
gasoline) or by reaction with isobutane (alkylate). From the refiners
perspective if a price obtained for propylene is higher than gasoline, this
bodes well because the overall production cost of gasoline (the objective)
will be reduced. For oil at $70/bbl, the gasoline price approximates to
$654/t and this can be taken as the indicative production cost (value) for
propylene by FCC.
The cost/benefit of producing additional propylene is then the
relative loss of volume in the production of gasoline versus the higher
price obtained. This is further complicated in the DCC type operations
because there is insufficient data available to attest to the quality of the
gasoline and cycle oil by-products.
Fixed-Bed Cracking
One variant of this route is the use of ZSM-5 family zeolites to
interconvert olefins; this is broadly similar to the Superflex process. The
usual approach is to feed a high olefin (olefinic naphtha) to a fixed-bed
catalyst operating at a relatively high temperature (> 400o
C). This
establishes an equilibrium favouring lighter olefins and in particular
propylene. One proposal is to use C4 and C5 olefins to generate ethylene
and propylene9
.
Catalytic Cracking to Produce Ethylene
There are several objectives to produce ethylene by catalytic
cracking, namely:
• To reduce energy demand

186 Petrochemical Economics
• To reduce greenhouse emissions
• To allow the use of heavier feedstock such as crude oil.
Attempts realise these objectives are based on catalysts able to
handle heavy feedstock at relatively low temperatures (550o
C versus the
850o
C for steam cracking).
However there are several major hurdles. The most common
catalysts are based on acid catalysis with Bronsted or Lewis acid sites;
these sites promote the formation of propylene rather than ethylene as is
witnessed by conventional FCC operations. Ethylene is promoted by free
radical processes. Catalysis of free radical reactions is rare, but not
unknown10
. One route is to take a conventional acid catalysis and to
neutralise the acid sites with alkaline metals (magnesium, calcium) or
phosphorus or a mixture of such. This can generate a further problem, in
that the catalyst promotes the formation of carbon (coke) and hydrogen
which are thermodynamically favoured at the reaction temperatures.
The higher ethylene yields observed in the DCC type processes
has led developments towards the catalytic cracking of heavy oils to
ethylene. A typical yield from cracking a gas oil (b.p. 229-340o
C) with
45% paraffins, 35.7% naphthenes and aromatics 18.2% is illustrated in
Table 10.511
.
Table 10.5: Catalytic Cracking to Ethylene at 660o
C
Ethylene wt% 21.86%
Propylene wt% 15.04%
BTD/C4 olefins wt% 5.70%
Gasoline + wt% 26.92%
Hydrogen/ethane wt% 15.52%
Methane wt% 2.96%
Propane wt% 0.23%
Butane wt% 0.23%
Coke and losses wt% 11.55%
TOTAL wt% 100.00%
The higher ethylene yield is delivered by a high temperature
(660o
C). This is high compared to normal FCC type operations, but
considerably lower than the temperatures typical for steam cracking

Other Routes from Hydrocarbons
187
(880o
C). In theory this should lead to a lower unit energy demand which
may reduce the total amount of carbon dioxide emitted.
Unlike FCC, the process requires a high level of steam included in
the cracking unit. This is lower than the amount of steam in steam-
cracking, but the presence of the steam at the high reaction temperatures
could lead to poor catalyst stability.
The catalyst is based on high levels of a ZSM-5 type zeolite which
has been doped with a combination of phosphorus, magnesium and
calcium. This type of formulation has been used to produce ethylene and
propylene from methanol and is known to promote olefin formation from
a wide variety of feeds12
.
There is a relatively large amount of coke formed (11.5%). This
means that in practice this technology will require a large regeneration
unit, much like that in an FCC operation. It is not clear if this level of
coke, which will go on to produce carbon dioxide, will result in lower
greenhouse emissions than the conventional routes using higher
temperature steam cracking operations.
Catalytic Dehydration of Paraffin to Light Olefins
We are primarily concerned with the production of propylene,
butene, isobutene and butadiene from a paraffin of the same carbon chain
length. Early technology concentrated on the production of butadiene
from n-butane by dehydrogenation over a chromia catalyst – Houdry
Catadiene Process. During the 1970s there arose a large market for
MTBE (methyl-tertiary-butyl-ether) as a gasoline additive. This requires
isobutene as a feedstock and the large volumes justified the conversion
of n-butane from gas field developments, firstly to isobutane and then the
dehydrogenation to isobutene by the Catofin Process, which is variation
of the Catadiene Process.
This early process is very capital and maintenance intensive and
spurred improvements to catalysts and technology. The Oleflex process
(UOP) has been commercialised to dehydrogenate propane to propylene
using a platinum supported catalyst. Philips has developed a process
using steam as a diluent and uses a tin-platinum catalyst.

188 Petrochemical Economics
Thermodynamics
Under normal pressure, the conversion of paraffins to olefins and
hydrogen is not favoured thermodynamically until temperatures are in
the region of 900 K (630o
C) or higher: Figures 10.2A and B.
The first figure illustrates that ethane and propane
dehydrogenation becomes favourable at temperatures over about
900 K under ambient pressures. For the conversion of butane (C4)
to butadiene (BD), higher temperatures are required.
Figure 10.2A: Free energy changes of paraffin dehydrogenation
Figure 10.2B: Enthalpy changes of paraffin dehydrogenation
300 400 500 600 700 800 900 1000
TEMPERATURE (K)
-50
0
50
100
150
200
(kJ/m
ol)
FR
EE
EN
ER
GY
PE
R M
OL O
LE
FIN
ETHANE
PROPANE
C4- to BD
300 400 500 600 700 800 900 1000
TEMPERATURE (K)
100
150
200
250
300
(kJ/m
ol)
EN
TH
AL
PY
PE
R M
OL
OL
EF
IN
ETHANE
PROPANE
C4- to BD

Other Routes from Hydrocarbons
189
Since the conversion of paraffins to olefins is accompanied by an
increase in volume, higher conversions are improved at lower pressures.
This is achieved by either using low pressure converters or diluting the
feed in a large volume of steam. Furthermore, the reaction is very
endothermic as illustrated in the second figure, so a large amount of
reaction heat has to be provided.
Houdry Process
The outline of the process is shown in Figure 10.313
. The process
is described for the conversion of n-butane to butadiene. Typically a C4
feed is heated to the required temperature (typically over 500o
C). This is
led at low pressure to a series of converters (1) operating in parallel
charged with chromia catalyst. These reactors contain hot catalyst from
the regeneration step. As the reaction proceeds the catalyst cools and
cokes. The catalyst is taken off-line (typically on-line times are 15
minutes). There is then a short period when inert gas (nitrogen) is passed
through the catalyst to remove any hydrocarbon present before a blast of
air regenerates the catalyst by burning off the coke. This combustion
reheats the catalyst to the operating temperature. Another short period of
inert gas removes any air that is present before going back on-line.
Figure 10.3: Catofin/Catadiene process
START
3 46
52
Butadiene
To wasteheat boiler
Recycle
Air evac.
C4
Preheated air
Fuel gas
1

190 Petrochemical Economics
Product gases are passed to separators. For butadiene there is a
wash step to remove heavy by-products (2), this is omitted in the Catofin
versions of the process. The product gases are passed to a compressor
(3). The suction-side of the compressor ensures the upstream units
operate under vacuum and the compressor exit side raises the pressure to
facilitate separation. The compressed gas is separated (4) into the
required C4 stream and hydrogen rich gases which are purged from the
system. A column (5) removes lighter olefins and (6) separates
unconverted feedstock from the butadiene product. The unconverted
butane is recycled and the hydrogen and light gases produced from
cracking are passed to form a fuel gas. The butadiene process produces a
lot of by-product hydrogen, which for optimum economic outcomes
should be extracted and used elsewhere or sold.
UOP Oleflex Process
The outline of the process is shown in Figure 10.414
. Fresh feed
and recycle feed are combined at low pressure and heated to the required
temperature (3) and are then passed to a reactor (1). Conversion cools the
gases which are then reheated before passing to a second and then a third
reactor.
Figure 10.4: Oleflex process
2
3
START
1
5
6
4
Turboexpander
7
Lightends
offgas
H2 recycle gasFresh feed
Recycle feed
H2 PROPYLENE
C4

Other Routes from Hydrocarbons
191
The catalyst progressively cokes and this is handled by continually
moving the catalyst through the system until it is finally passed to
regenerator unit (2). Regenerated catalyst is passed to the beginning of
the process.
The product gases are cooled and compressed (4) to facilitate
separation of products and by-products. The suction-side of the
compressor ensures that upstream units operate at a low pressure. The
product gases are first dried (5) and the cooled product passed to a
cryogenic separator (6) which removes hydrogen from the system. Some
is recycled with the other portion passed-on for other uses. A selective
hydrogenation unit (7) removes dienes and acetylenes. A final distillation
train removes light hydrocarbon (C2-), propylene product, propane, which
is recycled, and a C4 by-product.
STAR Process
In the STAR process (steam active reforming) feed is heated and
mixed with steam before passing to the reactor. This avoids the use of
pumping to lower the partial pressure of the reactants. The outline of the
process is shown in Figure 10.515
.
Figure 10.5: Star process
START
1
STARboiler
M. P. steam
23
4 H2 rich gas
Fuel gas
STARproduct
Recyclecondensate
Boiler feedwater
H. P. steam
Fuel gas

192 Petrochemical Economics
The catalyst (supported platinum promoted with tin) is held in
tubes which are held within a furnace arrangement. This avoids catalyst
cooling and keeps the catalyst online until coking forces a regeneration
step. This is achieved by passing steam through the catalyst to force out
hydrocarbon before air is used to burn off the coke. A further steam blast
removes air before the catalyst comes back on line. The furnace
arrangement is such that some tubes are in operation, some in steaming
and some in regeneration mode.
Economics of Paraffin Dehydrogenation
For this analysis the Oleflex technology is used as a base16
. This
has been translated to give the statistics given in Table 10.6. Capital for
the production of 350 kt/y of propylene is estimated at $280 million. This
requires 412 kt/y of propane. Hydrogen is considered as the only
significant by-product which is assumed sold at energy equivalent prices.
Table 10.6: Economics of Propylene Production by Propane Dehydrogenation
Mt/y PJ/y MM$/y MM$/y
CAPEX 280.24
OPEX (10% CAPEX) 28.02 28.02
RETURN ON WC (10%) 3.82 3.82
RECOVERY (10%DCF, 20y, FACTOR 0.143) 40.07
FEEDSTOCK & FUEL PURCHASES
Feedstock 0.412 20.712 231.37 231.37
Operating Feed (5.5%) 0.023 1.139 12.73 12.73
Fuel (for power) 0.020 0.858 7.15 7.15
Operating Fuel (3%) 0.001 0.027 0.21 0.21
TOTAL 0.455 22.736 251.46
OUTPUTS
Propylene 0.350 16.835 424.90
BTD/C4 olefins
Gasoline
Hydrogen 0.015 0.769 33.63 33.63
Methane 0 0.00 0.00

Other Routes from Hydrocarbons
193
Table 10.6 (continued)
Propane
Butane
Fuel Oil
TOTAL 0.365 17.604 33.63 458.53
THERMAL EFFICIENCY (%) 77.4%
ANNUAL COSTS 323.38 283.31
BYPRODUCT CREDITS 33.63
UNIT PROPYLENE PRODUCTION COST ($/t) 827.86
MARGIN 175.2
$/t 500.6
c/lb 22.7
Figure 10.6: Sensitivity of propylene production cost by dehydrogenation to oil price
The production cost is estimated at $827/tonne with an operating
margin at 2007 prices at $500/t. The sensitivity to the oil price (which
impacts on the price of propane) is illustrated in Figure 10.6.
This figure shows that propylene production cost increases rapidly
with increasing oil price. This is based on the assumption that propane is
priced according to the world parity price for LPG. In some parts of the
world, propane comes from large scale gas developments and is not
necessary priced on a world parity basis and this offers lower production
0 50 100 150 200 250
OIL PRICE ($/bbl)
0
500
1000
1500
2000
2500
PR
OD
UC
TIO
N
CO
ST
($
/t)

194 Petrochemical Economics
cost compared to similar process operations paying parity prices for
propane.
Olefin Metathesis
Olefin metathesis offers a means of shifting olefins to olefins with
a different number of carbon atoms. Olefin metathesis is the
disproportionation or dismutation of olefins over a catalyst, usually based
on molybdenum or tungsten. For example, propylene gives ethylene and
2-butene:
2C3H6 = C2H4 + C4H8
In this case two molecules of propylene form one molecule each of
ethylene and 2-butene. Thus, if a petrochemical complex has an excess
of propylene (say) this can be converted into ethylene and butene.
Similarly, butenes can be used to produce ethylene, propylene and
hexene.
The reaction is reversible so that ethylene and butene can be
converted into propylene. At present the most common use is to produce
additional propylene by reacting butene with an excess of ethylene.
The catalyst has some isomerisation activity so the product linear
olefins can have the double bond in any position, similarly any linear
isomer can be used as a feedstock. Branched olefins (e.g. isobutene) are
not usually converted.
The process layout for production of propylene from ethylene and
butene is shown in Figure 10.717
.
Ethylene and butenes enter the system and are mixed with
recycle streams. A guard bed is present to prevent dienes and acetylenes
entering the system. The mixed feed is heated and passed to the
metathesis reactor which converts ethylene and 2-butene to propylene;
1-butene is isomerised in situ to 2-butene. The product is fractionated,
first to remove and recycle ethylene and purge lighter gases, and then to
produce the polymer grade propylene. Excess butenes are recycled and
heavier products removed by a purge.

Other Routes from Hydrocarbons
195
Figure 10.7: Olefin metathesis process
Catalytic Dehydration of Ethanol
Prior to the advent of the petrochemical age, ethylene was made
from ethanol by dehydration:
C2H5OH = C2H4 + H2O
Nowadays large volumes of ethanol are made by the reverse
reaction, namely acid catalysed hydration of ethylene. However, concern
with carbon emissions from other processes and the fact that ethanol is
made in very large volumes by fermentation processes, is leading to a
new interest in the concept for the production of “renewable” ethylene
and hence renewable plastic. The equilibrium of the reaction is shown in
Figure 10.8.
The figure illustrates that below 400K (120o
C) the equilibrium
favours the hydration of ethylene. Higher temperatures favour the
dehydration of ethanol with temperatures over 200o
C placing the
equilibrium well to the favour of ethylene.
C4 feed C4 recycle
purgePropylene
purge
ethylene
GUARD
BED
REACTOR
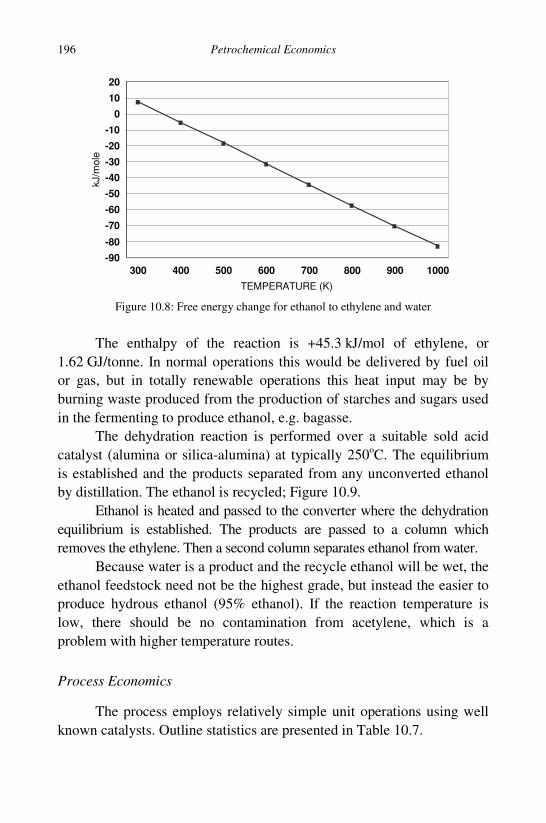
196 Petrochemical Economics
Figure 10.8: Free energy change for ethanol to ethylene and water
The enthalpy of the reaction is +45.3 kJ/mol of ethylene, or
1.62 GJ/tonne. In normal operations this would be delivered by fuel oil
or gas, but in totally renewable operations this heat input may be by
burning waste produced from the production of starches and sugars used
in the fermenting to produce ethanol, e.g. bagasse.
The dehydration reaction is performed over a suitable sold acid
catalyst (alumina or silica-alumina) at typically 250o
C. The equilibrium
is established and the products separated from any unconverted ethanol
by distillation. The ethanol is recycled; Figure 10.9.
Ethanol is heated and passed to the converter where the dehydration
equilibrium is established. The products are passed to a column which
removes the ethylene. Then a second column separates ethanol from water.
Because water is a product and the recycle ethanol will be wet, the
ethanol feedstock need not be the highest grade, but instead the easier to
produce hydrous ethanol (95% ethanol). If the reaction temperature is
low, there should be no contamination from acetylene, which is a
problem with higher temperature routes.
Process Economics
The process employs relatively simple unit operations using well
known catalysts. Outline statistics are presented in Table 10.7.
300 400 500 600 700 800 900 1000
TEMPERATURE (K)
-90
-80
-70
-60
-50
-40
-30
-20
-10
0
10
20kJ/m
ole
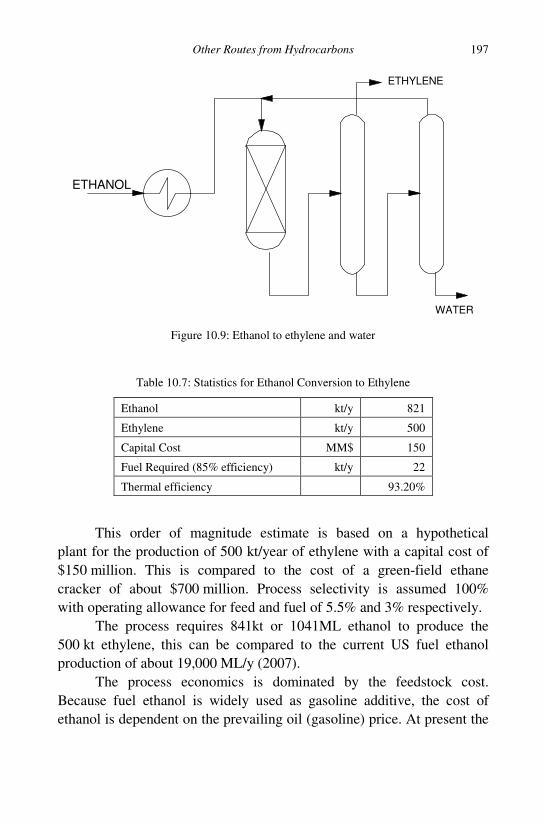
Other Routes from Hydrocarbons
197
Figure 10.9: Ethanol to ethylene and water
Table 10.7: Statistics for Ethanol Conversion to Ethylene
Ethanol kt/y 821
Ethylene kt/y 500
Capital Cost MM$ 150
Fuel Required (85% efficiency) kt/y 22
Thermal efficiency 93.20%
This order of magnitude estimate is based on a hypothetical
plant for the production of 500 kt/year of ethylene with a capital cost of
$150 million. This is compared to the cost of a green-field ethane
cracker of about $700 million. Process selectivity is assumed 100%
with operating allowance for feed and fuel of 5.5% and 3% respectively.
The process requires 841kt or 1041ML ethanol to produce the
500 kt ethylene, this can be compared to the current US fuel ethanol
production of about 19,000 ML/y (2007).
The process economics is dominated by the feedstock cost.
Because fuel ethanol is widely used as gasoline additive, the cost of
ethanol is dependent on the prevailing oil (gasoline) price. At present the
ETHANOL
ETHYLENE
WATER

198 Petrochemical Economics
price of ethanol is at a premium to gasoline, but as more plants come on
stream and absorption into the gasoline pool increases, ethanol may sell
at a discount18
. The fixed variable equation for the production of ethylene
from ethanol is shown in Figure 10.10.
With oil at $70/bbl, the price of gasoline is about $655/t. On an
energy equivalent basis, ethanol would be valued at $423/tonne. The
graph illustrates that with an ethanol price of $500/tonne, the ethylene
production cost will be in the vicinity of $970/tonne.
Figure 10.10: Sensitivity of ethylene production cost to ethanol price
Carbon Emissions from Propane Dehydrogenation
The carbon dioxide emissions from propane dehydrogenation is
estimated at about 0.9tCO2/t propylene; Table 10.8. The data is derived
from the descriptions for the Oleflex process.
This table estimates the carbon dioxide emissions from propane
dehydrogenation at about 0.9 t/t of propylene. This should be compared
to the value for naphtha which is less than 0.4 t/t. This results from the
lower thermodynamic efficiency of the process. However, again
emission costs could be lowered by distributing some of the emissions to
the hydrogen by-product.
200 300 400 500 600 700 800 900 1000
ETHANOL PRICE ($/t)
0
500
1000
1500
2000
ET
HY
LE
NE
PR
OD
UC
TIO
N C
OS
T (
$/t
)

Other Routes from Hydrocarbons
199
Table 10.8: Carbon Dioxide Emissions for Propane Dehydrogenation
Fuel Used Mt/y PJ/y MtCO2/y
Natural gas
LPG 0.062 3.107 0.185
Fuel oil 0.021 0.885 0.062
Total 0.082 3.992 0.246
Unit emissions (tCO2/t propylene) 0.704
Flaring
Propane 0.023 1.139 0.068
Unit emission (tCO2/t propylene) 0.193
Total emissions 0.314
Unit emissions (tCO2/t propylene) 0.897
1
M. Houdek and J. Anderson, Hydrocarbon Asia, Nov./Dec. 2005, p. 34; Jan./Feb. 2006,
p. 34
2
Report reviewed in Oil & Gas Journal, Feb. 23, 2004, p. 50
3
M. Walther, Oil & Gas Journal, Jan. 27, 2003, p. 52; S. Golden, R. Pulley and
C. F. Dean, ibid., Oct. 4, 2004, p. 44 and P. K. Niccum, M. F. Gilbert, M. J. Tallman and
C. R. Santner, Hydrocarbon Processing, Nov. 2001, p. 47
4
R. E. Maples, “Petroleum Refinery Process Economics”, PennWell Books, Tulsa,
Oklahoma, 1993; Table 12-1
5
S. Golden, R. Pulley, C. F. Dean, Oil & Gas Journal, Oct. 4, 2004, p. 44
6
Y. Fujiyama, H. H. Redhwi, A. M. Aitani, M. R. Saeed, C. F. Dean, Oil & Gas Journal,
Sep. 26, 2005, p. 54; Hydrocarbon Asia, May/June 2006 p. 20
7
D. Dharia, W. Letzsch, H. Kim, D. McCue, L. Chaplin; Hydrocarbon Processing,
April 2004, p.61; see also Hydrocarbon Asia, Oct./Sep. 2005, May/June 2006; L. Wang,
B. Yang, G. Wang, H. Tang, Z. Li, J. Wei, Oil & Gas Journal, Feb. 10, 2003, p. 52
8
Hydrocarbon Processing, “Petrochemical processes 2005”, Lyondell SUPERFLEX`
Process and ATOFINA/UOP Olefin Cracking Process.
9
H.V. Bolt and S. Ganz, Hydrocarbon Processing, Dec. 2002, p. 77; J. Teng and
Z. Xie, Hydrocarbon Asia, May/June 2006, p. 26; see also KBR SUPERFLEX Process
“Petrochemical Processes 2005”, Hydrocarbon Processing, ,CD ROM, p.178
10
I. E. Maxwell, “Non Acid Catalysis by Zeolites” in Advances in Catalysis, No. 31,
Academic Press, 1982
11
US Patent, 6, 211, 104
12
R. J. McIntosh, D. Seddon, Applied Catal., 6, 1983, p. 307-314 and references therein
13
Hydrocarbon Processing, March 1997, p. 116

200 Petrochemical Economics
14
Hydrocarbon Processing, March 1995, p. 104; Hydrocarbon Processing “Petro-
chemical Processes 2005”, AAB Lummus Global CATOFIN Process.
15
Hydrocarbon Processing, March 1997, p. 142
16
The economics of Oleflex technology is described in Hydrocarbon Processing of
March 2001. The data is scaled to 2007.
17
Hydrocarbon Processing, Petrochemical Processes 2005; ABB Lummus Global OCT
process and Axens CCR-Met-4 process.
18
L. Kumins, Oil & Gas Journal, Nov. 26, 2007, p. 18; S.D. Jenson, D.C. Tamm, Oil &
Gas Journal, May 8, 2006, p. 54

201
CHAPTER 11
ROUTES TO OLEFINS FROM COAL
In this chapter we consider some commercial routes and emerging
technology for the production of olefins from coal. For the most part
olefins are made from natural gas and crude oil derivatives - LPG,
naphtha, gas oil or residual fuel oil. The cost of these feed-stocks are tied
one way or another to the prevailing price of crude oil and the
petrochemical operations have to bid for feedstock against the oil-
refiners demand for them to produce transport fuels. For example, a
major feedstock is ethane. In developed economies the price of ethane is
directly linked to the prevailing price of crude oil or indirectly via the
natural gas price, which is linked one way or another to the price of
crude oil.
Methane (the major component of natural gas) can also be
converted into olefins via methanol or the Fischer-Tropsch process.
These routes have much in common with the coal to olefins routes in that
gas is converted into synthesis gas. Except for comparative production
costs the gas based routes are only briefly discussed here1
.
In addition to price considerations, there is the issue of strategic
supply. With most of the oil reserves being held in OPEC member
countries, particularly in the Middle East, and the major natural gas
reserves held jointly between Russia and OPEC, there is concern about
supply to many developed countries. By contrast, coal is available across
the developed world with major reserves in the USA and China. Even
Europe has substantial reserves of coal. Furthermore, the known coal
reserves far exceed those of oil and natural gas combined. Indeed, in
many coal rich countries, e.g. Australia, prospecting for new coal
resources is hardly encountered – the world’s coal reserves may be much
higher than published statistics.
202 Petrochemical Economics
As a consequence of this, there is now a major focus on the use of
coal as a source for fuels and olefins. Coal has a far higher level of
carbon than petroleum fuels and natural gas and this inevitably leads to
higher emissions of carbon dioxide in the production of fuels and olefins.
As a consequence there are research and development projects concerned
with the capture of carbon dioxide from coal based operations and the
geo-sequestration of the carbon dioxide.
In addition to all this, at the time of writing, there is a major
disconnect between the energy price of coal and oil, with coal being
much cheaper than oil on an energy equivalent basis. This makes the
production of olefins from coal increasingly an attractive option.
Coal to Olefins – Current Technology
Prior to the petrochemical age, ethylene was obtained from coal-
gas which was produced by the pyrolysis of coal. Coal pyrolysis was
widespread for the production of town gas and is still conducted on a
large scale for the production of coke in steel production.
Coke and Town Gas
Technology for the production of coke has been known for many
hundreds of years. There are many forms of the process; the two main
ones are for the production of coke for iron manufacture and for the
production of gas and chemicals.
Carbonization refers to the heating of bituminous coal in ovens
or retorts sealed from air to form coke. The process involves
thermal decomposition of the coal with distillation of the products.
Various technologies are used which perform the process at (i) low
temperature (500-750o
C), (ii) medium temperature (750-900o
C) and
(iii) high temperature (900-1175o
C). High temperature operation
generally favours the production of coke for iron making.
Coke Ovens and Gas Retorts
The coke ovens are held in batteries of many ovens producing
coke on a batch basis. A typical coke oven is about 40 ft long, 14ft high

Coal to Olefins
203
with an average width of 17 inches. The coke oven is tapered to facilitate
coke removal. The ends of the oven are closed with removable doors.
The oven is filled from charge holes at the top of the oven. Volatile
products leave the oven from openings in the top which transfer the
volatile materials to collecting mains. The coke oven is heated with coke
oven gas burned in the oven walls. Typically 35% of the coke oven gas is
used in this process. When carbonisation is complete, a pusher machine
pushes the hot incandescent coke out of the oven into a receiving truck.
For the production of town gas, the operation is similar.
Carbonization is usually performed at a lower temperature and the ovens
are smaller and generally referred to as retorts.
After production, the volatile matter is passed to a downstream
processing train which removes the products. This is similar for
both coke ovens and gas retorts. The general layout is illustrated in
Figure 11.1.
Figure 11.1: Layout for producing coke or town gas
The coke oven or coal retort is heated using a portion of the
produced gas. The system for coke ovens generally operates at slightly
reduced pressure and the exhaust pump draws the gas and liquids
through a condensation system and liquid knock-out. The gases are water
washed free of entrained liquids. The liquids comprise a hydrocarbon
(tar) phase and an aqueous phase (ammoniacal liquor).
COKE OVEN
CONDENSER
EXHAUST PUMPSCRUBBER
PURIFIERS
WASHER
COAL TARAMMONIACAL LIQUOR
GAS

204 Petrochemical Economics
The coal tars are worked up to produce coal chemicals: naphtha,
cresols and phenols. The ammoniacal liquor is distilled to produce
ammonia (which is often converted into ammonium sulphate).
In carbonisation systems, coke forming in the absence of oxygen
restricts the formation of carbon oxides to what can be formed from
water and oxygen present in the coal. Some hydrogen is formed by the
water gas shift reaction but most (and the methane formed) is a
consequence of decomposition of the large coal hydrocarbons into the
elements. The typical gas composition is shown in Table 11.1.
Table 11.1: Typical Composition of Coal Gas
Vol %
Carbon Monoxide 6.8
Hydrogen 47.3
Methane 33.9
Carbon Dioxide 2.2
Nitrogen 6.0
Ethylene etc. 3.8
Fuel Value MJ/m3
22.0
As can be seen, there is a small portion of ethylene produced in the
gas. This small amount of olefin was sufficient for the early days of the
chemical industry but soon became displaced by the larger production
volume of olefins by steam cracking of ethane, LPG and naphtha from
oil and gas sources.
Currently there is active work on new coal pyrolysis technology.
These processes are primarily focussed on upgrading low quality coal
resources such as lignite. These pyrolysis routes produce a carbon rich
solid, which has higher and more useful specific energy density than the
feedstock, and a pyrolysis liquid which can be used as a substitute for
fuel oil. A portion of the gas produced is used in the pyrolysis and excess
is available for other uses. The potential is that these routes could be
conducted on a very large scale and significant volumes of pyrolysis gas
containing some olefins would be produced.

Coal to Olefins
205
Indirect Conversion of Coal to Olefins
More olefins are produced by routes which convert the coal into an
intermediate product which is subsequently converted into olefins. This
could be a liquid, which is then subject to pyrolysis cracking. Most
interest focuses on the gasification of coal into carbon monoxide and
hydrogen, commonly known as synthesis gas. From synthesis gas olefins
can be produced directly or via further intermediates, such as naphtha or
methanol.
Coal Gasification
The gasification of coal has been practiced for many years and the
subject of major research and demonstration programs. The main aims of
this gasification work are the efficient production of synthesis gas for the
production of electricity, fuels and chemicals.
The gasification process involves the combustion of coal with a
restricted amount of oxygen. For the most part the oxygen is provided by
a separate air separation unit (ASU) rather than air which would
otherwise introduce a large amount of nitrogen into the synthesis gas.
The principal chemical reactions are:
Solid – Gas Reactions:
Combustion: C + O2 = CO2
Steam Carbon: C+ H2O = CO + H2
Hydro-gasification: C + 2H2 = CH4
The Boudouard Reaction: C + CO2 = 2CO
Gas Phase Reactions
Water-Gas-Shift: CO + H2O = CO2 + H2
Methanation: CO + 3H2 = CH4 + H2O

206 Petrochemical Economics
As well as these reactions, large coal molecules undergo pyrolysis
and hydro-pyrolysis to smaller molecules.
There are many variations on the gasifier, but most fall into three
main categories – moving-bed, fluidised bed and entrained-bed gasifiers.
These are shown diagrammatically in Figure 11.2.
Figure 11.2: Gasifier types
In moving-bed gasifiers, relatively large lumps of coal (6 to
25mm) are added through a hopper system at the top of the gasifier and
fall onto a bed of burning coal. Steam and oxygen enter the bottom of the
gasifier and move upwards through the burning coals. As it burns the
coal moves down the burning bed and comprises only ash when it
reaches the bottom.
A feature of this type of gasifier is that the temperature in the
bed peaks sharply in a burning (gasification) zone about a third of
the way up the coal bed. The maximum temperature is about 1,300o
C.
ROTATING GRID
STEAMOXYGEN
COAL
COAL BED
SYN-GAS
STEAMOXYGEN
QUENCHWATER
SLAG
STEAMOXYGEN
CHAR
COAL
COAL BED
SYN-GAS
CARRY OVER
SLAG
COAL
OXYGEN
COAL
OXYGEN
SYNTHESIS GAS
DOUBLE WALL
MOVING-BED
FLUID-BED
ENTRAINED-BED

Coal to Olefins
207
A consequence of this is that fresh coal falling on top of the hot coals
undergoes pyrolysis and emits coal gas products – hydrogen, methane,
ethylene, light and heavy hydrocarbons and coal tar products – which
contaminate the synthesis gas.
Ash falls out of the bottom of the bed through a rotating grate
which prevents clogging. Synthesis gas exits a side arm near the top of
the gasifier. Older versions of this gasifier were usually non-slagging
(i.e. the ash does not melt), however, slagging versions of the gasifier are
now available.
In the fluidised-bed gasifier, finely ground coal particles (<5mm)
enter the top and are fluidised in upward flowing steam and oxygen, fed
from the bottom of the gasifier. Fluidisation results in some carry-over of
particles which are separated from the synthesis gas in a cyclone and
returned to the gasifier.
Combustion occurs over a larger range in the gasifier which is
almost homogeneous in temperature at about 1,000o
C. Because of the
nature of the fluidised bed there is a relatively high level of unconverted
carbon present in the ash. The ash and unconverted coal (char) exit the
bottom of the vessel. This gasifier is represented by gasifiers of the
Winkler type.
In the entrained-bed gasifier, very fine coal (< 1 mm), sometimes
as a water slurry, enters the gasifier and is mixed with steam and oxygen.
Combustion is immediate and a very high temperature is achieved
(1,800o
C). Most of the ash melts and forms a slag over the inner wall of
the vessel. The slag runs down the walls into a collector. Some ash is
entrained in the synthesis gas which typically exits the top of the reactor.
Heat is recovered by a waste heat boiler and the ash is then removed by
means of a cyclone.
There are several variants of this type of gasifier. Shell and Uhde
separately offer a gasifier based on the Shell-Koppers development with
coal being delivered by nitrogen and steam. The Siemens gasifier is
similar. The GE gasifier (formerly Texaco gasifier) introduces the coal in
water slurry. The Conoco-Philips gasifier is similar. The KBR gasifier
uses a complex pipe system to circulate combustion products similar to
that in a Fluid Cat-Cracker.

208 Petrochemical Economics
Table 11.2: Performance of Different Gasifiers with Illinois No.6
Lurgi BG/L KRW Texaco Shell
Type of bed Moving Moving Fluid Entrained Entrained
Pressure (MPa) 0.101 2.82 2.82 4.22 2.46
Ash type ash slag aggloma. slag slag
H2 52.2 26.4 27.7 30.3 26.7
CO 29.5 45.8 54.6 39.6 63.1
CO2 5.6 2.9 4.7 10.8 1.5
CH4 4.4 3.8 5.8 0.1 0.03
Other hydrocarbons 0.3 0.2 <0.01 Nil Nil
H2S 0.9 1.0 1.3 1.0 1.3
H2S/COS 20/1 11/1 9/1 42/1 9/1
N2 + A 1.5 3.3 1.7 1.6 5.2
H2O 5.1 16.3 4.4 16.5 2.0
NH3 + HCN 0.5 0.2 .08 0.1 0.02
a agglomerates
The different gasifier types have differing operating temperatures,
pressures and residence times2
. These factors influence the product slate
out of the gasifier. Table 11.2 illustrates the impact of using the same
black coal source (after Perry T27-11)3
.
The Lurgi gasifier is the older version of the moving-bed gasifier
operating at near atmospheric pressure. This gasifier is “non-slagging”.
The newer versions of this gasifier are the British Gas/Lurgi and the
Sasol/Lurgi gasifiers. These are high pressure gasifiers operating at about
30bar. The coal bed is hotter and the ash forms a molten slag. Both these
gasifiers produce significant amounts of methane, other hydrocarbons,
ammonia and hydrogen cyanide.
These other products represent carbon lost to products other than
synthesis gas. They have to be extracted downstream and disposed of. In
the “other hydrocarbons” category are coal tar products – phenol and
cresols – and can be extracted and sold as by-product. Otherwise the by-
products need to be separated and burned to produce electricity.
The fluid-bed and entrained-bed gasifiers generally operate at
higher and more homogeneous temperatures. This eliminates the

Coal to Olefins
209
production of the higher hydrocarbons and reduces the formation of
ammonia and hydrogen cyanide. However, the fluid-type still produces a
significant amount of methane.
Of the main product gases (H2, CO, CO2 and H2O) the key
differences are in the amount of deep oxidation products that are formed
(CO2 and H2O). The BG/L and the Texaco produce high levels (about
20%) of these gases which suggest relatively high oxygen consumption.
The relative amounts of H2 and CO (synthesis gas stoichiometric
ratio) are immaterial at this juncture since application of water-gas-shift
(WGS) moves carbon monoxide to hydrogen or vice versa if required.
CO + H2O = CO2 + H2
Synthesis-gas Clean-Up
The design of the system clean-up operations and the selection of
appropriate carbon dioxide extraction technology is dependent on the
gasifier type and the amount of non-synthesis gas present which has to be
removed.
In a typical process, after production, the synthesis gas is “shifted”
to the stoichiometric ratio required for the downstream operation using
the WGS process. This is followed by carbon dioxide removal using an
acid-gas type solvent extraction system. The block-flow of the system is
typically as shown in Figure 11.3.
Figure 11.3: Layout for post gasifier synthesis gas clean-up
HT WGS
COOLER
STEAM
BFW
HEATER ACID GAS
CLAUS
COS
CO2WATER
NAPHTHA
COOLER
STEAM TURBINE
SULPHUR
WGS BY-PASS

210 Petrochemical Economics
Sulphur in the coal contaminates the synthesis gas as hydrogen
sulphide, this is also removed in the acid gas plant. Carbonyl sulphide
(COS) can also be present and this is reduced to acceptable levels
by hydrolysis with steam in a unit prior to the acid-gas plant by the
reaction:
COS + H2O = CO2 + H2S
Hydrogen sulphide can be either passed to a Claus unit4
with the
duty to convert the hydrogen sulphide to sulphur or mixed with the
carbon dioxide for geo-sequestration. This latter system is in operation at
the Dakota Coal Gasification plant in the USA with carbon dioxide and
hydrogen sulphide passed by pipeline to a geo-sequestration facility
in Canada.
Fischer-Tropsch Process
The Fischer-Tropsch process converts synthesis gas into
hydrocarbon products. It was extensively used by Germany in the
Second World War and developed in South Africa during the Apartheid
years. It is now subject to extensive research and development for the
conversion of coal into liquid fuels as an alternative to crude oil. The
general process flow-sheet is shown in Figure 11.4.
Figure 11.4: General layout for Fischer-Tropsch process
OXYGEN
COAL FEEDSTOCK
RECYCLE GAS
WATER
PURGE GAS
SYNCRUDESYN GAS
CLEAN UP
FISCHER TROPSCH
SEPARATIONGASIFIER

Coal to Olefins
211
In the Fischer-Tropsch process the coal gasifier produces synthesis
gas. This goes to water-gas shift and acid gas removal of carbon dioxide
and hydrogen sulphide. The Fischer-Tropsch synthesis converts the
synthesis gas into hydrocarbons (-[CH2]-) and water:
CO + 2H2 = -[CH2]- + H2O
Some process variants produce carbon dioxide instead of water:
2CO + H2 = -[CH2]- + CO2
The separator produces a water phase, a hydrocarbon liquid phase
(which can be regarded as a synthetic crude oil) and a recycle gas. Part of
the synthesis gas is purged to stop the build up of inert materials such as
nitrogen. The recycle gas contains light hydrocarbon gases, unconverted
synthesis gas and carbon dioxide produced in the process. This is sent to
a gas treatment plant for recovery of synthesis gas. This operation may
be integrated into the gas clean-up operation of the fresh synthesis gas
from the gasifier.
The synthetic crude is passed to a refining section where the
various hydrocarbons are separated and processed to produce transport
fuels.
The Fischer-Tropsch process has several variants one of which
(a high temperature process) produces significant volumes of olefins.
This particular variant, known as the Synthol Process, is used to produce
fuels from both coal and natural gas in South Africa. A recent
development of this process (The Sasol High Temperature Process5) has
replaced the original entrained-bed reactors with fluid-bed reactors. The
product breakdown is shown in Table 11.3.
As well as liquids (gasoline, C5 -160o
C; diesel, 160-350o
C) the
process produces a large quantity of light olefins, 24.7% of the products.
It should also be noted that the gasoline fraction also contains a large
quantity of olefins – pentenes, hexenes etc. carbon lost to the water phase
include alcohols, ketones, acids and esters.
This high temperature process has been optimised for the
production of liquid products. It is feasible that the process could be

212 Petrochemical Economics
Table 11.3: Typical Product Distribution from High Temperature Fischer-Tropsch
Wt%
Ethylene 4.0
Propylene 11.4
Butenes 9.3
Fuel Gas 17.8
C5 to 160°C 32.5
160-350°C 13.0
> 350°C 5.4
Losses to Water 6.5
TOTAL 99.9
Total Olefins 24.7
further refined and optimised for the olefins, for example by higher
temperature operation and lowering the stoichiometric ratio of the
synthesis gas.
The high temperature process is the only commercially proven
process for the production of olefins and liquids from coal. Current
developments favour a low temperature process which is commercially
proven to produce liquids and wax from coal or gas. The low
temperature process produces a waxy synthetic crude oil which is
cracked to produce diesel of high cetane and naphtha. The naphtha,
which has high level of linear paraffins, is sold on the petrochemical
naphtha market rather than conversion into gasoline. The conversion of
this naphtha into olefins by steam cracking has been addressed in
previous chapters.
Alpha Olefins
One intriguing aspect of the Fischer-Tropsch process is the
production of linear alpha-olefins. These can be separated as inter-
mediates in the process and in theory the process could be optimised to
produce these valuable products from coal or gas.

Coal to Olefins
213
Methanol
Another indirect route to olefins is via methanol6
. For methanol
synthesis, a synthesis gas containing some carbon dioxide is acceptable
so that a certain quantum can be left in the gas. Figure 11.5 illustrates the
route from synthesis gas which is typically tailored to a stoichiometric
ratio of 2/1 (H2/CO) with about 3-4% carbon dioxide left in the feed gas.
Figure 11.5: Layout for methanol synthesis
Sulphur is detrimental to the synthesis and trace amounts of
sulphur are removed using zinc oxide prior to synthesis. After the
production of synthesis gas, the methanol synthesis requires compression
to about 100bar. The methanol synthesis loop comprises a reactor, a
separator and recompression of the recycle gas. A purge gas can be used
to produce power supplemented by steam raised in the methanol reactor
and the coal gasifier. The crude methanol produced can be upgraded to
chemical grade product by distillation. The intermediate methanol is
passed into storage. The reaction stoichiometry is:
CO + 2H2 = CH3OH
And
CO2 + 3H2 = CH3OH + H2O
To a good approximation, the quantity of water in the raw
methanol is given by the second equation relating the water content to
the concentration of carbon dioxide in the synthesis gas.
COMPRESSOR
COOLERZnO METHANOL SYNTHESIS
BFW
STEAM SYSTEM
COMPRESSOR DISTIL
WATER
STORAGE
PURGE

214 Petrochemical Economics
The fact that the methanol is stored as an intermediate brings
strength to this route as it de-couples the methanol synthesis from the
subsequent conversion of methanol into olefins.
Methanol to Olefins
The conversion of methanol into olefins is similar to the
commercially proven methanol to gasoline (MTG) which was
commercialised using natural gas as the feedstock in New Zealand. The
variant generally uses similar catalysts to produce light olefins only,
rather than the iso-paraffins and aromatics of the MTG process. This
leads to the prospect of coal or gas conversion into resins (solids). These
high value products may be easier to transport and sell than liquid fuels;
Figure 11.6 illustrates the basic unit operations for the process.
Figure 11.6: Process steps for converting methanol into gasoline and olefins and resins
The methanol, which need not be the highest grade chemical
methanol, is produced and stored prior to feeding to the methanol to
olefins (MTO) plant. The conversion of methanol into olefins is highly
exothermic and in order to help control heat evolution some processes
use a primary reactor to convert some of the methanol into dimethyl
ether (DME) by the reaction:
2CH3OH = CH3.O.CH3 + H2O
The methanol to olefins (MTO) route can be optimized to produce
either ethylene and propylene or solely propylene for which there is
strong and increasing demand. The basic stoichiometry for ethylene is:
METHANOL
SYNTHESISMTG GASOLINEDME
METHANOL
SYNTHESISMTODME RESINS
POLYETHYLENE
and/or
POLYPROPYLENE

Coal to Olefins
215
2CH3OH = C2H4 + 2H2O
Higher olefins are produced by reaction of ethylene with
methanol:
CH3OH + C2H4 = C3H6 + H2O
However, in detail the conversion of methanol into olefins is quite
complex.
Early Mobil Methanol to Olefins Processes (MTO)
Early attempts to convert methanol into olefins were based on the
zeolite ZSM-5. The Mobil MTO process was based on the fluidised bed
version of the MTG technology. Conversion took place at about 500o
C
allegedly producing almost complete methanol conversion. However,
careful reading of the patent literature indicates that complete methanol
conversion may not have been achieved by this means. Because of
incomplete conversion, there would be a necessity to strip methanol and
dimethyl ether from water and hydrocarbon products in order to recycle
unconverted methanol. In this variant, the total olefin yield is less than
20% of the products of which ethylene is a minor but not insignificant
product. The major product is gasoline. Ethylene is difficult to process
and has to be treated specially. Claims that it is possible that ethylene
can be recycled to extinction conflict with the known behaviour of
ethylene in zeolite catalyst systems and have to be viewed with some
suspicion.
The MTC process was primarily designed to produce ethylene by
operating a MTG type catalyst and process at low pass conversion in a
fixed bed reactor. The route was developed by A.E.C.I. in South Africa
who demonstrated the process to pilot plant scale.
The principal reaction is brought about at low conversion in a
series of reactors, (10% conversion per reactor with ca. 40% conversion
overall). The products, both aqueous and hydrocarbon phases, are
heavily laden with methanol and dimethyl ether and as a consequence
extensive extraction and recycle is required.
216 Petrochemical Economics
The principal product is ethylene. The higher products are rich in
olefins (66% olefins in C3 + C4 which are 41% of total). Like Mobil
MTO, this process also produces a good quality gasoline and a heavy
gasoline which may require hydro-treatment prior to use.
UOP Methanol to Olefins Process
The UOP process, developed jointly with Norsk Hydro/Statoil7
,
and has been developed to semi-commercial scale in Norway. The
process uses proprietary catalysts based on a SAPO molecular sieve.
Two variants of the process are available, one maximising
ethylene and the other propylene. The performance appears to be similar
to that of the conversion of methanol to olefins using small pore zeolites.
Such systems suffer from high methane yield (which has to be recycled
back to a reformer) and high coke yields. The formation of olefins is
promoted by using crude methanol, which can contain up to about 17%
water.
The coke formation leads to catalyst fouling. This is solved in the
UOP Process by continuously removing a portion of the catalyst and
passing this to a separate regenerator. After regeneration by combustion
of the coke in air, the catalyst is sent back to the main reactor. In concept
this is similar to fluid-cat cracking of refinery stocks. The process layout
is illustrated in the Figure 11.7.
After separation of the mixed olefins the product work up is
similar to that in a steam cracker using LPG feedstock. Small amounts of
carbon dioxide are removed and the hydrocarbon gases are dried before
passing to a de-ethaniser column. The C2- fraction is passed to an
acetylene removal unit before methane is removed from the C2 stream.
This comprises 98+% ethylene, the remainder being ethane. The C3+
stream is split between the C3 fraction (98% propylene) and C4+ . The
work up of the C4 stream to produce linear butenes (not shown in the
figure) is likely to be less problematic than the corresponding C4 stream
from steam crackers, which is highly complex and cannot be separated
by fractionation alone. The process produces little product above C5.

Coal to Olefins
217
Figure 11.7: UOP MTO process scheme
The Lurgi Methanol to Propylene (MTP) Process
The process has been demonstrated on a pilot scale by Lurgi and
Statoil. Sufficient propylene has been produced to make polypropylene
resin product by Borealis8
. This process appears to use an oxide doped
ZSM-5 zeolite catalyst in fixed bed reactors. The oxide doping promotes
the methanol conversion to olefins. All olefins, other than propylene, are
recycled to extinction or purged as fuel gas or produced as naphtha. The
flow sheet is illustrated in the Figure 11.8.
Because fixed bed reactors are used, the heat of reaction must be
removed. This is achieved by firstly converting some of the methanol to
DME in a first reactor (similar to MTG) and then splitting the feed to a
series of reactors. Overall, the method resembles the operation of a
methanol quench converter where fresh feed is introduced at different
points within a single reactor. Operation is at about 500o
C at which
temperature propylene is favoured over ethylene. Overall promotion of
CO2
WATER
DRIER
CO2 STRIPPER
REACTOR REGENERATOR
AIR
MeOH
DE-ETHANISER
CH4
ETHYLENE
PROPYLENE
C4+
ACETYLENE
REMOVAL
DE-METHANISER
DE-PROPANISER

218 Petrochemical Economics
olefin yield is obtained by adding steam. Downstream of the reactors are
separation columns, which separate the C3 product (ca. 80% propylene)
from naphtha and fuel gases.
Figure 11.8: Lurgi MTP process
Comparison of Alternative Routes
A comparison of the yield of olefins from the routes discussed
above is shown in Table 11.4.
The methanol to gasoline process (MTG) is aimed at producing
gasoline (C5 to 160o
C cut). In the process, the light olefins are generally
recycled or extracted as LPG. The MTC process (methanol to chemicals)
produces high yields of light olefins and aromatic naphtha which can be
worked-up to extract aromatics. This product slate is very similar to that
for naphtha cracking. The product slate for the UOP/Statoil MTO
process can be swung between ethylene rich and propylene rich products.
Liquid products are greatly reduced, but there is carbon loss to coke. In
the Lurgi methanol to propylene process (MTP), all of the light olefins
are recycled to extinction, but this increases the amount of fuel gas and
naphtha product. For comparison the high temperature Fischer-Tropsch
(HT-FT) process is included.
steam
fuel gas
PROPYLENE
METHANOL
C8+ NAPHTHA
WATER
C4+ NAPHTHA
DME REACTOR
REACTORS

Coal to Olefins
219
Table 11.4: Comparison of Olefin Producing Processes
MTG MTC UOP
MTO
UOP
MTO
MTP HT-FT
Ethylene 3.2 25.2 45.6 33.6 0.0 4.0
Propylene 4.7 16.5 29.6 44.6 67.9 11.4
Butenes 8.3 5.0 9.5 12.8 0.0 9.3
TOTAL OLEFINS 16.2 46.7 84.7 91.0 67.9 24.7
Fuel Gas 21.2 15.6 5.6 2.0 6.1 17.8
C5 - 160
o
C 58.0 33.0 5.5 5.5 26.0 32.6
160 - 350o
C 5.0 1.0 13.0
>350o
C 5.4
water phase or coke 3.7 4.2 1.5 0.0 6.5
Economics of Olefin Production from Coal and Gas
The route via methanol is analysed. The economics of olefin
production for coal and gas is considered in two parts, first the
production cost of methanol and then the conversion of methanol into
olefins.
For methanol, three scenarios are considered: two large scale gas
plants and one from coal. The estimate is made for the production of AA
grade which is not usually necessary for the conversion to olefins. This
may save a modest amount (5%) of the capital cost. The statistics are
given in Table 11.5.
Table 11.5: Statistics for Methanol Production
Feedstock GAS GAS COAL
Production kt/y 850 1700 1424.9
CAPEX MM$ 428.29 511.48 1193.24
Construction period years 3 3 4
Plant life years 15 15 20
Return on capital %/y 16.34 16.34 15.15
Non feed operating cost MM$/y 104.62 126.71 258.27
Gas or coal usage PJ/y 32.16 64.32 45.54
By-products credits MM$/y 0 0 11.55

220 Petrochemical Economics
A typical world scale plant produces 850 kt/y (2,500 t/d) methanol
and requires about 32 PJ/y of gas9
. Typical construction period is three
years with a lifetime of 15 years. Recently, some plants have been
constructed at double this capacity (5,000 t/d) and claim much reduced
capital costs, which is detailed in the second column. However, although
economy of scale applies, some of the reduction in capital claimed
probably comes from importing oxygen into the complex to run an auto-
thermal gasifier. The coal case produces about 1.4 million tonnes of
methanol and is based on the optimum size of an entrained-bed gasifier
and requires 45PJ (about 1.8 million tonnes) of black coal. The coal
option produces by-products of sulphur, ash and electricity. The fixed
variable relationship plotted in Figure 11.9.
Figure 11.9: Sensitivity of methanol production cost to feedstock price
A typical long-term average traded price for methanol is in the
vicinity of $150/tonne. For this, gas prices have to be below $2/GJ and
preferably in the vicinity of $1/GJ. At this time, a typical traded price of
gas is in the range of $5/GJ and this has stressed many operations which
are force to pay this price. For this reason new gas-based world scale
methanol plants have migrated to regions of low gas prices in the Middle
East.
0.00 0.50 1.00 1.50 2.00 2.50 3.00 3.50 4.00 4.50 5.00 5.50 6.00
FEEDSTOCK ($/GJ)
50
100
150
200
250
300
350
400
ME
TH
AN
OL
CO
ST
$/t
2500 T/D
5000 T/D
COAL

Coal to Olefins
221
Table 11.6: Statistics for Conversion of Methanol into Olefins (MTO)
kt/y
Methanol Used 100.0% 1700
ethylene 19.9% 338.967
propylene 13.0% 220.3285
butenes 4.2% 70.61812
naphtha 2.4% 40.95851
fuel gas 2.5% 41.80592
TOTAL Products 41.9% 712.678
Figure 11.10: Sensitivity of olefins production cost to methanol price
Coal based plants have a higher relative capital cost and the fixed
variable curve is at a higher level than for gas based operations.
However, coal is widely available at $0.5/GJ (c. $10/t) or less which
reduces the production cost to below $200/t.
The fixed variable relationship for the conversion of methanol into
olefins using the statistics shown in Table 11.6 is shown in Figure 11.10.
The analysis is based on a capital cost of for the methanol to olefin step
of $300 million (2007).
This analysis is sensitive to the prevailing price of crude oil and
by-products (butenes and naphtha) which change in relation to the oil
price. With oil at $70/bbl, which is used as the basis for the sensitivity,
the by-products, butenes and naphtha, are valued at $600/t. The fixed
0 50 100 150 200 250 300 350 400
METHANOL PRICE ($/t)
0
500
1000
1500
PR
OD
UC
T P
RO
DU
CT
ION
CO
ST
($
/t)

222 Petrochemical Economics
variable relationship shows that if methanol is available below $200/t
then the olefin production cost is below about $750/t.
Coal to Acetylene and Olefins
Coal can be converted into acetylene via calcium carbide. This is
used to produce vinyl chloride monomer (VCM) on a large scale in
China. In theory, selective reduction of acetylene could give a route to
ethylene for coal.
The production of VCM for PVC manufacture proceeds in three
steps. The first is the production of calcium carbide by the electrolytic
reduction of coke (produced from coal) and calcium oxide in an
electrochemical cell.
CaO + 3C = CaC2 + CO
The calcium oxide is produced immediately prior to reduction
from high purity limestone. This enthalpy of the reaction is +465.6kJ/mol
and is provided by electric power and results in the consumption of
Soderberg electrodes made from anthracite. The cell is tapped to release
the molten carbide which is produced in 80% purity. The off-gas from
the cell is typically 80% carbon monoxide and about 10% hydrogen.
Following the production of calcium carbide, acetylene is produced by
addition of water to the carbide:
CaC2 + H2O = C2H2 + Ca(OH)2
This reaction is exothermic (125.1kJ/mol) and produces about
308kg of acetylene per tonne of 80% carbide. Acetylene is then
converted into VCM by addition of hydrogen chloride:
C2H2 + HCl = CH2:CHCl
The economics of this process is dependent on the availability of
low cost coal for the production of carbide and power. The production of
80% calcium carbide requires the resources detailed in Table 11.7; using
approximate costs, the cost of acetylene production is estimated at
$681/t.

Coal to Olefins
223
Table 11.7: Carbide and Acetylene Production from Coal
Carbide is 80% CaC2 $/unit $/tCaC2
Calcium Oxide Kg/t 950
Lime stone Kg/t 1484 20 29.6875
Coke Kg/t 550 50 27.5
Electrode C kg/t 30 100 3
Power MWh/t 3 50 150
210.1875
CARBIDE to ACETYLENE kg/kg 0.308 681.34
Carbon Emissions for Gas and Coal to Olefins
By far, the major portion of carbon dioxide emissions in the MTO
route is in the production of methanol from either gas or coal. The gas
route is less carbon intensive as is illustrated in Figure 11.11, which plots
the increase in methanol production cost against carbon price.
Figure 11.11: Sensitivity of methanol production cost to carbon emission cost
The base statistics for the lines in the figure are for a gas price
of $2/GJ and a coal price of $0.5/GJ. These give production costs in
the vicinity of $200/t for both cases in the absence of carbon charges.
0 20 40 60 80 100
CARBON DIOXIDE COST ($/t)
150
200
250
300
350
ME
TH
AN
OL
CO
ST
($
/t)
GAS to METHANOL
COAL to METHANOL

224 Petrochemical Economics
The graph shows that a $40/tonne carbon dioxide charge will increase
the production cost from coal by approximately 25% to around $250/t.
For the same impact on gas based operations, a carbon dioxide cost of
$70/t will be required.
1
For further information on gas to olefins see D. Seddon, “Gas Usage and Value”
PennWell, Tulsa, Oklahoma, 2006
2
G. Bhandarkar, Hydrocarbon Asia, Nov./Dec. 2001, p. 46
3
Perry’s Chemical Engineer’s Handbook, 7th
Edition (Perry & Green, eds.), McGraw
Hill 1997
4
B. Zarenezhad, Hydrocarbon Processing, Oct. 2008, p. 109
5
T. Chang, Oil & Gas Journal, Jan. 10, 2000, p. 42
6
M. Sutton and P. Roberts, Hydrocarbon Processing, July 2007, p. 89
7
“Petrochemical Processes 99”, Hydrocarbon Processing, Mar. 1999, p. 125
8
Borealis A/S, Press Release Sep. 16, 2003, “First polypropylene product made from
natural gas”
9
D. Seddon, “Gas Usage and Value” PennWell, Tulsa, Oklahoma, 2006

225
CHAPTER 12
CLOSING REMARKS
Production Economics
From the above analysis of the various competing technologies
and feedstock we can make several observations:
• It is clear that economies of scale count so that petrochemical
cracking operations have progressively increased over the years.
There seems to be no technical reason why this should not
continue over the coming years. A variation on this is the
progressive increase in the scale of operation of existing sites,
with expansions and de-bottlenecking operations of existing
plants going on continuously in many parts of the world.
• The preferred feedstock is ethane, obtained as a by-product to
large natural gas operations either for mass delivery into pipeline
networks or to service the ever expanding LNG industry.
In many jurisdictions ethane from gas is related to the value
of the gas and is not directly connected to the prevailing
price of crude oil. To-date, this generally leads to ethane based
plants producing ethylene, and hence polyethylene resins, at
significantly lower cost than liquid cracking operations.
• The favoured position of gas-priced ethane as feedstock has led
to a marked increase in the cracking operations based in the
Middle East. There appears no reason for this trend to cease.
• Natural gas liquids, such as propane and butane, have a value
which is now clearly linked to the prevailing price of crude oil.
This has meant that propane and butane cracking are restricted to
special situations in time and place when the feedstocks are in
excess and prices are depressed relative to their long term
relationship to oil.
226 Petrochemical Economics
• The problem for all gas based (ethane, propane, butane) cracking
operations remains the very low or poor production of propylene.
It seems inevitable that if more ethylene is produced from gas
feedstock, more propylene will have to be made from other
sources and by other routes. This means a continued growth in
catalytic processes for the conversion of paraffins into
propylene. Of the diverse range of technologies available, the
continued growth in refinery produced propylene by FCC
operations would appear the best route, though again propane
dehydrogenation will have a role in specific situations.
• Naphtha is likely to remain the main feedstock for petrochemical
operations because of the ability of the feedstock to not only
deliver both ethylene and propylene, but also BTX aromatics
from the rapidly growing fires and speciality polymers markets
(nylons, polyester etc.).
• A problem with the use of naphtha is that with all of the
downstream plants required, the capital cost for new world-scale
operations is very large. However, as demonstrated by the
establishment and growth of the integrated complex on
Singapore’s Jurong Island, this cost can be spread across many
organisations.
• When available, the use of waxy residual fuel as a feedstock for
cracking will continue. This is a consequence of the price
differential between it and naphtha. This price differential
compensates for the increased downstream processing costs
associated with cracking of heavier feedstock.
• Coal based routes are likely to be established over the next
decade. This is predicated on the availability of low cost coal in
mainly the world’s major economies.
Carbon Emissions
From the above analysis of the various competing technologies
and feedstock we can make several observations:

Closing Remarks 227
• Carbon emissions are inversely proportional to the thermal
efficiency of the process. Minimisation of carbon emissions for
existing operations revolves around the mundane tasks of good
housekeeping and maintaining all process operations at or better
than design capacity.
• From the above, the lighter the feedstock the poorer the thermal
efficiency and therefore the higher the carbon emissions. This is
counter to the move to increase ethylene production from ethane
from natural gas operations.
• Dehydrogenation routes to propylene also increase the amount of
carbon emissions relative to the production of propylene from
naphtha. Increasing propylene output from FCC operations also
increases emissions. Although this is the case for a standalone
facility, it is not clear if a full cradle-to-grave analysis would
ameliorate or exacerbate the emissions relative to naphtha
cracking.
• Prima-facie the simplest way to decrease carbon emissions is to
use by-product hydrogen as a fuel in the cracking furnace. This
denies the use of hydrogen to downstream uses. Generally
downstream involves relatively high-added value operations and
the use of hydrogen in this way, is in general counter to optimum
production economics. Nevertheless, for some operations
hydrogen production is well in excess of the downstream needs
and recycling to furnace gas would make a significant
contribution to reducing emissions.
• A less effective, but more economically viable method, would be
to recycle all low-value hydrocarbon by-products to the cracker
furnace. This particularly focuses on methane which within the
confines of an operation is typically valued relative to the fuel oil
price. However, this equally applies to ethane and propane which
are generally recycled to the feedstock side of the cracking
furnace. Depending on the relative value, it may be optimal for
minimising carbon emissions in some operations to use ethane as
a fuel rather than a feedstock.

228 Petrochemical Economics
Catalyst Issues
From the above analysis of the various competing technologies
and feedstock we can make several observations:
• Thermal cracking operations are not catalyst intensive. However,
the use of special coatings to prevent the formation of carbon in
the furnace tubes and downstream inter-changers is important.
The thermodynamics of the process favours coke formation and
it will be important to constantly improve the current coatings
and additives used to prevent unwanted reactions in the cracker.
• For downstream cracking operations, the main catalytic process
of interest is the selective hydrogenation of acetylene and related
compounds. The process is considered to be selective and to only
form ethylene, but this could be improved because there is some
evidence (including the formation of green oil) that the process is
not as selective as generally claimed. It is not clear that the small
amount of acetylene present is in fact reduced to ethane rather
than ethylene. It is clear there is some room for improvement.
• A more effective acetylene hydrogenation catalyst to ethylene
would also facilitate the development of coal to ethylene via the
acetylene route, which is at present restricted to the use of
acetylene for the production of vinyl chloride.

229
APPENDICES
A1: Abbreviations and Unit Equivalents
A2: Some Useful Conversion Factors and Properties of Feedstock
and Products.
A3: Cost of Utilities
A4: Nelson Farrar Cost Indices
A5: Location Factors
A6: Methodology of Economic Analysis
A7: Indexed Feedstock Costs

This page intentionally left blankThis page intentionally left blank

Appendices 231
A1: Abbreviations and Unit Equivalents
A1.1: Abbreviations
Table A1.1: Abbreviations
ASU Air separation unit
AVTUR Aviation turbine fuel - Jet fuel
a annum (year)
bbl petroleum barrel
bbl/d barrels per day
bcfd billions of cubic feed per day
BTU British Thermal Unit
BTX benzene, toluene and xylene mixture
C Degrees Centigrade (Celsius)
Cf cubic foot
Cif container, insurance and freight (destination port price)
Cm cubic meter
DME Dimethyl ether
E/P ethylene to propylene production ratio
F Degrees Fahrenheit
Fob free on board (embarkation port price)
GJ Gigajoule
HDPE high density polyethylene
HHV higher heating value (gross)
HP horse power
K Degrees Kelvin (absolute temperature scale)
K-factor UOP or Watson paraffinicity factor
kt/y thousand metric tonnes per year
kW kilowatt
kWh kilowatt hour
L Litre
Lb Pound
LDPE low density polyethylene
LHV lower heating value (net)
LLDPE linear low density polyethylene

232 Petrochemical Economics
Table A1.1 (continued)
LPG Liquefied petroleum gas (usually propane and butane)
Mcf Thousand cubic feet
MM$ million US dollars (2007)
MMBTU million (US Customary) BTU
Mt million metric tonnes
NGL natural gas liquids
PJ peta joule (1015
joules)
PONA paraffins, olefins, naphthenes and aromatics
PP polypropylene
PVC polyvinylchloride
R Degrees Rankin (absolute temperature scale in oF)
S.I. Système International d’Unités; metric units
T metric tonne
t/y metric tonnes per year
VCM Vinyl chloride monomer
VGO vacuum gas oil
A1: Unit equivalents
Table A1.2: Equivalents Between S.I. and US Customary Units
S.I Unit US Customary
kilo (k) thousand M
Mega (M) million MM
Giga (G) 10^9 Billion
Tera (T) 10^12 Trillion
Peta (P) 10^15 Quadrillion

Appendices 233
A2. Some Useful Conversion Factors for Fuels and Products
Table A2.1: Basic Conversion Factors
FROM TO
Cm 35.315 cf
cm@15C 35.383 cf@60F
GJ 0.9478 MMBTU
$/GJ 1.055 $/MMBTU
1 kWh 3.6 MJ
kg 2.2046 lb
HP 0.7457 kW
tonne (metric) 1.102 ton (short)
Table A2.2: Temperature Conversions
C F
Absolute zero -273.15 -459.67
Normal 15 59
STP (metric) 0 32
Standard 15.56 60
Table A2.3: Specific Volumes and Heating Values of Liquid Fuels
L/t bbl/t
HHV
GJ/t
ETHANE 2654
PROPANE 1998
BUTANES 1928 12.13 49.6
NAPHTHA 1534 9.00 48.1
GASOLINE 1360 8.56 46.4
AVTUR 1261 7.93 46.4
DIESEL 1182 7.43 45.6
FUEL OIL (LS) 1110 6.98 44.1
CRUDE OIL (35API) 1177 7.40 45
CRUDE OIL (40 API) 1212 7.62

234 Petrochemical Economics
Table A2.4: Energy Values of Some Products and Intermediates
HHV (GJ/t) LHV (GJ/t)
CARBON MONOXIDE 10.1 10.1
BUTENES 48.1 45
ETHYLENE 50.3 47.2
HYDROGEN 141.8 120
METHANOL 22.7 19.5
PROPYLENE 48.9 45.8
DME 31 28.4
CARBON 32.8 32.8
AMMONIA 22.5 18.6
Table A2.5: Properties of Some Coals
TYPE Wyoming Witbank
Illinois
No 6 Wyodak
German
Brown
Ultimate Analysis (DAF)
Carbon wt.% 74.45% 81.25% 78.10% 75.60% 67.50%
Hydrogen wt% 5.10% 5.00% 5.50% 6.00% 5.00%
Oxygen wt% 19.25% 10.00% 10.90% 16.80% 26.50%
Nitrogen wt% 0.75% 2.50% 1.20% 0.70% 0.50%
Sulphur wt% 0.45% 1.25% 4.30% 0.90% 0.50%
100.00% 100.00% 100.00% 100.00% 100.00%
Ash (as received) wt% 12.0% 5.9% 6.4%
Moistrure (as rec) wt% 6.5% 35.0% 5.0%
As received Basis
Carbon wt.% 65.91% 53.66% 60.59%
Hydrogen wt% 4.64% 4.26% 4.49%
Oxygen wt% 9.20% 11.92% 23.79%
Nitrogen wt% 1.01% 0.50% 0.45%
Sulphur wt% 3.63% 0.64% 0.45%
Ash (as received) wt% 10.13% 4.19% 5.75%
Moistrure (as rec) wt% 5.49% 24.84% 4.49%
100.00% 100.00% 100.00%
LHV (as received) GJ/t 25.80 17.16 9.90
HHV (as received) GJ/t 26.82 18.10 10.89
LHV (DAF) GJ/t 30.57 24.18 11.03
HHV (DAF) GJ/t 29.6 31.4 31.79 25.50 12.13
Appendices 235
A3. Cost of Utilities
Table A3.1: Utility Costs
Days per year 340
Hours per year 8160
Electricity
Purchases c/kWh 5.0
Export c/kWh 3.0
Steam
High pressure $/t 2.04
Medium pressure $/t 1.81
Low pressure $/t 1.36
A4. Nelson-Farrar Cost Indices
Table A4.1: Nelson Farrer Refinery Cost Indices
YEAR MATERIAL EQUIP. LABOUR INDEX NF FACTOR
weight 0.4 0.0 0.6
1946 100.0 100.0 100.0 100.0 21.0670
1947 122.4 114.2 113.5 117.1 17.9968
1948 139.5 122.1 128.0 132.6 15.8876
1949 143.6 121.6 137.1 139.7 15.0802
1950 149.5 126.2 144.0 146.2 14.4097
1951 164.0 145.0 152.5 157.1 13.4099
1952 164.3 153.1 163.1 163.6 12.8787
1953 172.4 158.8 174.2 173.5 12.1438
1954 174.6 160.7 183.3 179.8 11.7156
1955 176.1 161.5 189.6 184.2 11.4370
1956 190.4 180.5 198.2 195.1 10.7992
1957 201.9 192.1 208.6 205.9 10.2307
1958 204.1 192.4 220.4 213.9 9.8499
1959 207.8 196.1 231.6 222.1 9.4862
1960 207.6 200.0 241.9 228.2 9.2326
1961 207.7 199.5 249.4 232.7 9.0525
1962 205.9 198.8 258.8 237.6 8.8651
1963 206.3 201.4 268.4 243.6 8.6496
1964 209.6 206.8 280.5 252.1 8.3553
1965 212.0 211.6 294.4 261.4 8.0581

236 Petrochemical Economics
Table A4.1 (continued)
1966 216.2 220.9 310.9 273.0 7.7163
1967 219.7 226.1 331.3 286.7 7.3491
1968 224.1 228.8 357.4 304.1 6.9281
1969 234.9 239.3 391.8 329.0 6.4026
1970 250.5 254.3 441.1 364.9 5.7740
1971 265.2 268.7 499.9 406.0 5.1887
1972 277.8 278.0 545.6 438.5 4.8046
1973 292.3 291.4 585.2 468.0 4.5011
1974 373.3 361.8 623.6 523.5 4.0244
1975 421.0 415.9 678.5 575.5 3.6606
1976 445.2 423.8 729.4 615.7 3.4215
1977 471.3 438.2 774.1 653.0 3.2263
1978 516.7 474.1 824.1 701.1 3.0047
1979 573.1 515.4 879.0 756.6 2.7843
1980 629.2 578.1 951.9 822.8 2.5603
1981 693.2 647.9 1044.2 903.8 2.3309
1982 707.6 662.8 1154.2 975.6 2.1595
1983 712.4 656.8 1234.8 1025.8 2.0536
1984 735.3 665.6 1278.1 1061.0 1.9856
1985 739.6 673.4 1297.6 1074.4 1.9608
1986 730.0 684.4 1330.0 1090.0 1.9328
1987 748.9 703.1 1370.0 1121.6 1.8784
1988 802.8 732.5 1405.6 1164.5 1.8091
1989 829.2 769.9 1440.4 1195.9 1.7616
1990 832.8 797.5 1487.7 1225.7 1.7187
1991 832.3 827.5 1533.3 1252.9 1.6815
1992 824.6 837.6 1579.2 1277.4 1.6493
1993 846.5 842.8 1620.2 1310.7 1.6073
1994 877.2 851.1 1664.7 1349.7 1.5609
1995 918.0 879.5 1708.1 1392.1 1.5133
1996 917.1 903.5 1753.5 1419.0 1.4846
1997 923.9 910.5 1799.5 1449.2 1.4537
1998 917.5 933.2 1851.0 1477.6 1.4258
1999 883.5 920.3 1906.3 1497.2 1.4071
2000 896.1 917.8 1973.7 1542.7 1.3656
2001 877.7 939.3 2047.7 1579.7 1.3336
2002 899.7 951.3 2137.2 1642.2 1.2829
2003 933.8 956.7 2228.1 1710.4 1.2317
2004 993.8 1112.7 2314.2 1833.6 1.1489
2005 1179.8 1062.1 2411.6 1918.8 1.0979
2006 1273.5 1113.3 2497.8 2008.1 1.0491
2007 1364.8 1189.3 2601.4 2106.7 1.0000

Appendices 237
A5. Location Factors
Location factors developed through US DoE Studies1
relative to
US Gulf.
Table A5.1: Location Factors
1 2 3 4
Climate/Terrain Benign difficult difficult extreme
Gas Transmission Present present no no
Fresh Water Present present no no
Ship Loading Present present no no
Employee Housing Present present no no
Labour Costs Low high high high
Relative Capex 1.000 1.155 1.562 2.250
Relative Opex 1.000 1.139 1.520 2.039
Examples US Gulf
Urban
Australia Remote FE Offshore
Canada New Zealand
Remote
Aus Arctic
Developed FE
Papua New
Guinea
Middle East
A6. Methodology for Economic Analysis
What is required is a rapid approach to the determination of the
economic viability of a particular technology of interest, namely a
concept analysis where speed is not gained at the expense of accuracy.
This requires a systematic approach in which various technologies and
approaches are treated in the same manner so that the economics from
one route to olefins can be compared to another.
The methodology described was devised by ICI PLC in order to
evaluate all of the diverse routes to the production of ethylene from any
feedstock using widely disparate technologies with different plant
construction periods and lives of operation. The methodology has been
published by Stratton et alia2
and is generally applicable for energy
intensive industries. The basic economic equation is:
238 Petrochemical Economics
P = F + C + O
Where P, the unit production cost of the production of interest
(ethylene say), is equal to the sum of the unit feedstock costs (F), the unit
capital costs (C) and the unit non feedstock operating costs (O). This can
be expressed as a fixed-variable equation with the fixed part of the
equation representing the return on capital (the unit capital costs, C,
independent of tax considerations) together with all the unit non-
feedstock operating costs (O).
Capital Costs (C)3
The capital costs are developed for green-field projects completely
isolated from other facilities. All the costs associated with utilities
(unless otherwise accounted) are allowed for in the capital cost. Some
processes require small amounts of power. This is considered as an
import.
Capital is estimated using published information, and using the
location factors and Nelson-Farrer Indices given above, it is adjusted to
the US Gulf site and 2007 costs for all processes. Scaling uses the
exponent method namely:
Capital of Plant [1]/Capital of Plant [2]
= {Capacity of Plant [1]/Capacity of Plant [2]}n
where n is a constant with a value which is typically 0.7.
Capital Recovery Factors
For a plant with a capital cost of Co, the plant investment cost, C,
capitalises the return on investment during construction of the plant –
it takes account of expenditure and the required return during the
construction period.
p
p-s
o
s 0
C = C a(s)(1+ i)
=
∑

Appendices 239
where a(s) represents the breakdown of capital expended over the
construction period; p is the first year of production; and s is a general
year of the project starting with s = 0, with construction complete at
s = p. The return on investment is i. The values of a(s) are given in
Table A6.1.
Table A6.1: Values for a(s)
Construction.
Period (years) 1 2 3 4 5
a(0) 100% 50% 30% 17% 4%
a(1) 50% 45% 32% 14%
a(2) 25% 26% 32%
a(3) 25% 36%
a(4) 14%
The general DCF equation can be written:
N
r
r=1
C = ((Rr – FCr – VC ) / (1 + i) ) r∑
where r is the production year, with N the final production year and Rr
is the total product revenue in year r, FCr is the fixed costs in year r,
VCr is the variable cost in year r.
This equation is simplified by assuming that there is no build up to
full production and full production is achieved as soon as construction is
complete. This is followed by N years of full production. Hence:
N
r
r=1
C (1 + i) (Rr – FCr – VCr) 1/ (1 + i)= ∑
This is rearranged to give:
Rr = FCr + VCr + K(1 + i) C
where K is the sum of the geometric series:
K = i (1 + i)N/[(1 + i)N – 1]

240 Petrochemical Economics
Values of K for various values of i and N are given in Table A6.2:
Table A6.2: Values for K
N 10 15 20 25 30
interest (i)
5.00% 0.1295 0.0963 0.0802 0.071 0.0651
7.50% 0.1457 0.1133 0.0981 0.0897 0.0847
10.00% 0.1627 0.1315 0.1175 0.1102 0.1061
12.50% 0.1806 0.1508 0.1381 0.1319 0.1288
The capital recovery factor (Ko) is then:
Ko = K (1 + i) C
and from A6.2, we get:
p
p-s
S=0
Ko = K (1 + i) Co a(s)(1+ i)∑
Values for the Return on Capital (ROC) or Ko/Co are given in
Tables A6.3 and A6.4 for a royalty free basis and one encompassing a
2% royalty to the process licensor, respectively. Table A6.3 has been
used for typical non-process items (pipelines, ships etc.) and Table A6.4
for licensed processes.
The selection of a rate of capital return is dependent on many
factors including the nature of the industry in question. For upstream oil
and gas developments, or relatively small scale process plant, high rates
of capital return are often demanded by the investors to offset short
operational lives or perceived higher levels of risk. For very long term
(30 year) infrastructure projects often accessing government funds, far
lower rates of return are required. Many Greenfield operations in the
chemicals industry are planned for a lifetime of 15 to 20 years and rates
of return are as appropriate. Commonly used values for the return on
capital in this work are emboldened in the tables.

Appendices 241
Table A6.3: Values for Annual Return on Capital (Royalty Free Basis)
1y construction N 10 15 20 25 30
Interest( i)
5.00% 13.60% 10.12% 8.43% 7.45% 6.83%
7.50% 15.66% 12.18% 10.54% 9.64% 9.10%
10.00% 17.90% 14.46% 12.92% 12.12% 11.67%
12.50% 20.32% 16.96% 15.54% 14.84% 14.49%
15.00% 22.91% 19.67% 18.37% 17.79% 17.51%
2y construction N 10 15 20 25 30
interest (i)
5.00% 13.94% 10.37% 8.64% 7.64% 7.00%
7.50% 16.25% 12.64% 10.94% 10.01% 9.44%
10.00% 18.80% 15.19% 13.57% 12.72% 12.25%
12.50% 21.59% 18.02% 16.51% 15.77% 15.39%
15.00% 24.63% 21.14% 19.75% 19.12% 18.83%
3y construction N 10 15 20 25 30
interest (i)
5.00% 14.32% 10.65% 8.87% 7.85% 7.19%
7.50% 16.92% 13.16% 11.39% 10.42% 9.83%
10.00% 19.84% 16.02% 14.32% 13.43% 12.93%
12.50% 23.08% 19.27% 17.65% 16.86% 16.45%
15.00% 26.68% 22.90% 21.39% 20.71% 20.39%
4y construction N 10 15 20 25 30
interest (i)
5.00% 14.59% 10.85% 9.04% 7.99% 7.33%
7.50% 17.39% 13.52% 11.71% 10.71% 10.11%
10.00% 20.58% 16.62% 14.85% 13.93% 13.41%
12.50% 24.17% 20.18% 18.48% 17.66% 17.23%
15.00% 28.20% 24.21% 22.61% 21.90% 21.56%
5y construction N 10 15 20 25 30
interest (i)
5.00% 14.71% 10.94% 9.11% 8.06% 7.39%
7.50% 17.61% 13.69% 11.85% 10.84% 10.23%
10.00% 20.91% 16.89% 15.09% 14.16% 13.63%
12.50% 24.66% 20.58% 18.85% 18.01% 17.58%
15.00% 28.87% 24.78% 23.15% 22.42% 22.07%

242 Petrochemical Economics
Table A6.4: Values for Annual Return on Capital with 2% Royalty
1y construction N 10 15 20 25 30
interest (i)
5.00% 13.87% 10.32% 8.59% 7.60% 6.97%
7.50% 15.97% 12.42% 10.76% 9.84% 9.28%
10.00% 18.26% 14.75% 13.18% 12.36% 11.90%
12.50% 20.73% 17.30% 15.85% 15.14% 14.78%
15.00% 23.37% 20.06% 18.74% 18.15% 17.86%
2y construction N 10 15 20 25 30
interest (i)
5.00% 14.22% 10.58% 8.81% 7.79% 7.14%
7.50% 16.57% 12.89% 11.16% 10.21% 9.63%
10.00% 19.17% 15.49% 13.84% 12.98% 12.50%
12.50% 22.02% 18.38% 16.84% 16.09% 15.70%
15.00% 25.13% 21.56% 20.15% 19.51% 19.20%
3y construction N 10 15 20 25 30
interest (i)
5.00% 14.61% 10.87% 9.05% 8.00% 7.34%
7.50% 17.26% 13.42% 11.62% 10.63% 10.03%
10.00% 20.23% 16.34% 14.60% 13.70% 13.19%
12.50% 23.54% 19.65% 18.00% 17.20% 16.78%
15.00% 27.21% 23.36% 21.82% 21.13% 20.80%
4y construction N 10 15 20 25 30
interest (i)
5.00% 14.88% 11.07% 9.22% 8.15% 7.47%
7.50% 17.74% 13.79% 11.94% 10.92% 10.31%
10.00% 20.99% 16.96% 15.15% 14.21% 13.68%
12.50% 24.66% 20.58% 18.85% 18.01% 17.58%
15.00% 28.77% 24.69% 23.06% 22.33% 21.99%
5y construction N 10 15 20 25 30
interest (i)
5.00% 15.00% 11.16% 9.29% 8.22% 7.53%
7.50% 17.96% 13.96% 12.09% 11.06% 10.44%
10.00% 21.33% 17.23% 15.39% 14.44% 13.90%
12.50% 25.15% 20.99% 19.23% 18.37% 17.93%
15.00% 29.45% 25.28% 23.61% 22.87% 22.51%

Appendices 243
Fixed Operating Costs (O)
Working Capital. Rather than capitalise the working capital and
handling it with the project capital (Stratton), the working capital is
treated as an annual operating cost. The reasoning behind this is that
working capital is normally borrowed against the business and is fully
recovered at the end of the project. The outgoings are the interest on the
debt. The value of working capital can be taken as 5% of the plant capital
or 30 days stock. The latter is generally smaller than the former and was
used when sufficient data permitted its calculation.
Labour, Maintenance and Administrative Costs. As a general
rule, labour and maintenance were each charged at the rate 3% of the
capital per annum. For labour, this included both direct and indirect
labour costs. For maintenance, this included both materials and labour.
Over the past decades, many companies have made attempts to reduce
the operating labour and maintenance charges. Labour can be reduced by
extensive computer control. However, the success or otherwise, in
reducing the maintenance charge is difficult to quantify, several
operations have suffered major problems claimed to be due to the
cutbacks in maintenance costs. Administrative costs are basically
insurance and local land taxes. A value of 1.5% of the fixed capital as an
annual charge was used.
Catalysts and Chemicals. Most plants require some chemicals for
water treatment purposes. Catalyst charges are based on a 3 to 5 year
turnaround.
Other Operating Costs. Some processes require inputs other than
the principal hydrocarbon feed. This is usually electric power and typical
average values were used.
A7. Indexed Feedstock Costs
For the most part, we are concerned with hydrocarbon feedstock
which is related to the prevailing crude oil price. For some feedstock and
hydrocarbon by-product, this is a strong linear relationship.

244 Petrochemical Economics
We are also concerned with how construction costs change with
time. Work by H. W. Parker4
has shown relationship in refinery
operations between the construction cost index and the refinery fuel cost
index. Plotted in the logarithmic form, this relationship has a high
linearity with a slope of approximately unity. The relationship is
illustrated in Figure A7.1.
1.5 2 2.5 3 3.5
COST INDEX
1
1.5
2
2.5
3
3.5
FU
EL I
ND
EX
R-square = 0.942 # pts = 78 y = -0.318 + 1.01x
Figure A7.1: Plot of refinery construction cost index against fuel index
(after H.W. Parker)
Since we know that most fuels show a linear correlation with
the prevailing crude oil price, we can develop a construction cost
crude oil price relationship which is illustrated in Figure A7.2. This
shows a correlation plot of the construction cost index against an index
based on the price of WTI crude oil. As may be expected, there is more
variation in this correlation, but it still shows a correlation factor or
nearly 0.9.
Using this correlation we can impute crude oil price corresponding
to a particular construction cost index. Using the 2007 value for the
construction cost implies an equivalent oil price of $70 per barrel. This is
used as the base price for oil and derivatives in the analysis.

Appendices 245
Figure A7.2: Plot of cost index against WTI index
1 Assessment of Cost Benefits of Flexible and Alternative Fuel Use in the US
Transportation Sector – Technical Report Three – Methanol Production and
Transportation Costs, United States Department of Energy, November 1989. 2
A. Stratton “A Simplified Method of Calculating product Cost” Technical Note 3,
Economic Assessment Service, IEA Coal Research, London 1982
3
See also T. R. Brown, Hydrocarbon Processing, Oct. 2000, p. 93 for a discussion of
various cost estimating methods and J. T. Summerfeld , ibid., Jun 2001, p. 103 for
an analysis of estimation accuracy.
4 H.W. Parker, Oil & Gas Journal, Aug. 4, 2008
1.5 2 2.5 3 3.5 4
LOG WTI INDEX
1.5
2
2.5
3
3.5L
OG
CO
ST
IN
DE
X
R-square = 0.898 # pts = 62 y = 0.561 + 0.773x

This page intentionally left blankThis page intentionally left blank

247
INDEX
Acetylene
from coal, 222
hydrogenation, 126
in ethylene cracking, 89
Africa
cracking operations, 28
Australia
cracking operations, 15
BTX
from naphtha cracking, 46, 166
from pyrolysis gasoline, 93
in gas cracking, 42
Butadiene, 48, 92
Butane cracking
economics, 152
selectivity, 42
Butenes, 184
C3 stream
from cracking, 90
C4 Stream
from cracking, 90
Canada
cracking operations, 5
Carbon Dioxide
absorption, 110
geo-sequestration, 119
costs, 121
in flue gas, 115
Carbon Emissions, 109
carbon intensity of fuels, 118
coal to olefins, 223
from cracking worldwide, 29
geo-sequestration, 109
impact of severity, 177
LPG cracking, 156
Naphtha and LSWR cracking,
175
propane dehydrogenations, 198
Catalysts, 48, 50
FCC, 181
China
cracking operations, 16
Coal to Olefins, 201
comparison of alternatives, 218
economics, 219
gasification, 205
synthesis gas clean up, 209
via methanol, 213
Condensate, 51
slug catchers, 53
splitters, 74
Cracking
catalytic, 48
kinetics, 38
radical chains, 38
severity, 47
simulation models, 48
thermodynamics, 34
248 Petrochemical Economics
Crude Oil Price, 79
Ethane
cost from LNG, 61
cracking, 37
cracking
selectivity, 41
cracking, 125
cracking
thermal efficiency, 128
from absorption plants, 58
from LNG, 65
from natural gas, 51
price, 37, 66
production cost, 58
selectivity, 128
Ethanol to Ethylene, 195
Ethylene
by catalytic cracking, 185
ethane operating margin, 134
from ethane
impact of scale, 137
sensitivity to ethane price,
135
sensitivity to oil price, 134
gas oil
economics, 171
impact of carbon emssions, 141
integration wth polymer
production, 138
naphtha
economics, 161
sensitivity to oil price, 164
Production cost
from ethane, 131
Ethylene/Propylene Yield, 147
gaseous feeds, 41
naphtha
severity, 47
EU
cracking operaions, 6
Far East
cracking operations, 12
feedstock, 15
Fluid Cat-Cracking, 179
economics, 185
yields, 182
Gas Oil
composition, 45
cracking
economics, 171
from refineries, 72
India
cracking operations, 19
Indonesia
cracking operations, 21
Isobutane cracking, 155
Japan
"open spec" naphtha, 23, 76
cracking operations, 21
Korea
cracking operations, 24
Liquids Cracking, 159
LNG, 101, 104
LPG
carbon emissions, 156
composition, 51, 63
cracking, 145
from absorption plants, 56
from natural gas, 51
from refineries, 72
from straddle plants, 56
price, 67
production cost, 58

Index 249
shipping, 101
shipping costs, 104
storage, 96
rock caverns, 98
salt caverns, 99
tanks, 97
straddle plants, 106
Malaysia
cracking operations, 25
Metathesis, 194
Mexico
cracking operations, 5
Middle East
cracking operations, 10
feedstock, 10
Naphtha
composition, 43, 75, 77
cracking
economics, 161
impact of severity, 169
integration with downstream,
166
sensitivity to E/P price, 165
cracking selectivity, 43
from refineries, 72
mercury in, 78
price, 78
sulphur content, 73
Natural Gas Liquids (NGL). See
condensate, LPG
Paraffin Dehydrogenation, 187
economics, 192
Pipelines, 105
Prices
ethane, 66
ethylene and propylene, 87
gas oil and fuel oil, 81
LPG, 67
naphtha, 87
Propane
COS contamination, 65
cracking
selectivity, 42
cracking, 39
cracking
economics, 147
cracking
sensitivity to oil price, 150
from LNG, 65
price, 67, 68
Propylene
from FCC operations, 182
Pyrolysis Fuel Oil, 96
Pyrolysis Gasoline, 46, 93
Russia
cracking operations, 7
Severity. See Naphtha,
Ethylene/Propylene Yield
Shipping Chemicals, 100
shipping costs, 102
Singapore
cracking operations, 26
oil market, 78, 81
South Africa
coal to fuels, 211
South America
cracking operations, 28
Taiwan
cracking operations, 17
Thailand, 27
cracking operations, 27
USA
cracking operations, 2
feedstock, 2