petri böckerman empirical studies on working hours and …epub.lib.aalto.fi/pdf/diss/a216.pdf ·...
TRANSCRIPT

Petri Böckerman
EMPIRICAL STUDIES ON WORKING
HOURS AND LABOUR MARKET FLOWS
PETRI B
ÖC
KER
MA
N: EM
PIRIC
AL STU
DIES O
N W
OR
KIN
G H
OU
RS A
ND
LAB
OU
R M
AR
KET FLO
WS
A-216
HELSINKI SCHOOL OF ECONOMICS
ACTA UNIVERSITATIS OECONOMICAE HELSINGIENSIS
A-216
ISSN 1237-556XISBN 951-791-760-0
2003

HELSINKI SCHOOL OF ECONOMICS
ACTA UNIVERSITATIS OECONOMICAE HELSINGIENSIS
A-216
Petri Böckerman
EMPIRICAL STUdIES ON WORKING
HOURS ANd LABOUR MARKET FLOWS

© Petri Böckerman and
Helsinki School of Economics
ISSN 1237-556X
ISBN-10: 951-791-760-0
ISBN-13: 978-951-791-760-5
E-version:
ISBN-10: 952-488-043-1
ISBN-13: 978-952-488-043-5
Helsinki School of Economics -
HSE Print 2006

3
Preface
This collection of essays consists of five articles from journals and an introduction that
provides the selected background and the motivation for the following investigations and
summarizes the contributions of the empirical studies. The list of the essays is as follows:
1. Petri Böckerman and Jaakko Kiander: ”Determination of average working time in Fin-
land”. Labour: Review of Labour Economics and Industrial Relations, 16:3, 557–568.
2. Petri Böckerman: ”Overtime in Finland”. Finnish Economic Papers, 15:1, 36–53.
3. Petri Böckerman and Mika Maliranta: ”Regional disparities in gross job and worker
flows in Finland”. Finnish Economic Papers, 14:2, 84–103.
4. Petri Böckerman: ”Unravelling the mystery of regional unemployment in Finland”.
Regional Studies, 37:4, 333–342.
5. Petri Böckerman: ”Perception of job instability in Europe”. Social Indicators Research,
(Forthcoming).
I am grateful to Pekka Ilmakunnas for his encouraging guidance and insightful comments
during the process. I have benefited from the comments of my pre-examiners (Aki Kangas-
harju and Hannu Tervo). I am grateful to the Labour Institute for Economic Research, my
employer. The institute has provided excellent research facilities. I am grateful to my co-
authors Jaakko Kiander and Mika Maliranta for productive co-operation. I am grateful
to Blackwell Publishing to be able to include an article from their journal (Labour: Review
of Labour Economics and Industrial Relations). I am grateful to Carfax Publishing (Taylor
& Francis Publishing Group) for an opportunity to include an article from their journal
(Regional Studies). In addition, I am grateful to Kluwer Academic Publishers to be able
to include a forthcoming article from their journal (Social Indicators Research). Paul A.
Dillingham has kindly checked the language. Financial support from the Academy of Fin-
land (Project 50950: Creation and Econometric Analysis of Linked Employer-Employee
Data in Industrial and Labor Economics) and from the Yrjö Jahnsson Foundation (Grants
4628 and 4803) is gratefully acknowledged. This collection of essays is dedicated to the
memory of my mother (1937–2001).
Helsinki, June 2nd, 2003
Petri Böckerman

4

5
Contents
1. Introduction ................................................................................................. 7
1.1. The Finnish labour markets during the 1990s ....................................... 8
1.2. The selected themes of labour markets ................................................ 10
1.2.1. Working hours ......................................................................... 10
1.2.2. Regional labour markets .......................................................... 14
1.2.3. Perception of job instability ..................................................... 19
1.3. Summary of findings ............................................................................. 22
Essay 1: Determination of average working time in Finland ................................ 30
Essay 2: Overtime in Finland .............................................................................. 42
Essay 3: Regional disparities in gross job and worker flows in Finland .............. 74
Essay 4: Unravelling the mystery of regional unemployment in Finland............... 109
Essay 5: Perception of job instability in Europe .................................................. 133

6

7
1. Introduction
There is a solid foundation upon which to argue that the labour market is the most important
market of modern economies (see, for example, Elliott 1991). The reason for this arises
from the well-known fact that, by a wide margin, most individuals derive their current
income flow from selling their labour services. This applies to the Finnish labour markets,
which have gained growing interest during the 1990s.1 The prominent reason for the interest
has been the empirical feature that the unemployment rate soared during the so-called
great slump of the early 1990s.2 Since then, according to a number of commentators on
public affairs, unemployment has been the most important economic and social problem
in Finland. In this respect, the situation is nowadays much the same across the whole of
the European labour markets.3 As a consequence of this development of the 1990s, the
issues associated with the Finnish labour markets constitute a topical research theme.
Despite the apparent importance of labour markets, there is rather limited empirical
knowledge of a number of particularities that characterize the Finnish labour markets.
Oswald (2000) strongly argues that the search for reliable empirical patterns in economic
data should constitute the core of economic research. These notions constitute the broad
starting points of the following essays.
This collection of empirical investigations consists of five essays. These essays aim to
provide evidence on interesting empirical patterns of the Finnish labour markets based on
various data sets. The essays fall into three categories. The first two essays investigate the
selected aspects of working hours in Finland. These essays investigate the determination
of average working time from the long-term perspective and overtime at the individual
level in Finnish manufacturing. The following two essays concentrate on the dynamics of
regional labour markets in Finland. These essays focus on gross job and worker flows of
the Finnish regions and address the connection between unemployment and reorganization
from the regional perspective. The last essay in this collection deals with the issue of the
perception of job instability among workers in Europe by using survey data. The essay
aims to provide a contribution to the ongoing discussion about the fundamental aspects of
the European labour markets. The perception of job instability is related to working hours
and labour market flows. The perception of job instability (i.e. the fear of nullification of
hours of work entirely) constitutes an antithesis to overtime. Moreover, an investigation
into the perception of job instability induced by involuntary worker flows completes the
picture painted by the studies that focus on gross flows of jobs and workers from a
broader perspective.

8
1.1. The Finnish labour markets during the 1990s
Finland is, without dispute, one of the Nordic welfare states with high labour taxes, extensive
social benefits and one of the highest rates of trade union membership and coverage of
collective wage agreements in the OECD. Minimum nominal increases in wages and reductions
in average working time are, for the most part, determined within the framework of collective
bargaining (Layard and Nickell 1999).4 Finland provides an example, par excellence, of a
corporatist political and economic system.5 The Finnish labour market policy is therefore
the result of a close and long-term interplay between social partners and the government.
About 80% of the salaried labour force in Finland belongs to unions. The high unionisation
rate is partly explained by the fact that membership fees are tax deductible and the fees are
mainly collected by employers and by the involvement of the unions in the administration of
unemployment insurance benefits.6 The structure of Finnish wage bargaining usually involves
a high degree of coordination between unions and employers, with a framework agreement
being determined centrally on a one- or two-year basis, followed by union-level bargains.
As a consequence of collective wage agreements, the distribution of wages across
individuals tends to be compressed in Finland.7 This apparent narrowness of certain
distributions of economic variables fails to extend to all dimensions of the Finnish labour
markets. A certain amount of flexibility is generated into the Finnish wage formation by
the so-called wage drift, which has, historically, accounted for approximately 30% of the
total increase in earnings.8 The following discussion focuses on additional aspects that
have facilitated adjustment in the labour market and that are relevant for this collection of
empirical investigations.
The total hours of work consists of several components. There is a rather large scope for
the utililization of overtime hours at the individual level of the Finnish economy despite the
fact that the so-called standard hours are stipulated by the binding collective agreements.
In particular, overtime hours have traditionally been applied in manufacturing. This is due
to the fact that non-manufacturing represents other forms of less stable labour relations
such as part-time work and various temporary employment contracts. These instruments
can be considered to be substitutes for the implementation of overtime from the perspective
of companies. Paid overtime therefore constitutes an important part of the adjustment of
the total hours of work in Finnish manufacturing.9
The adjustment of the Finnish labour markets carries an interesting regional dimension.
The regional disparities of labour markets have been sharp and persistent in Finland. For
instance, an empirical investigation by OECD (2000) into the issue reveals that the regional

9
disparities of the unemployment rates in Finland are among the highest in the European
Union. In particular, the unemployment rate has been at a higher level in Eastern and
Northern Finland compared with Southern Finland during the past few decades.
The following essays examine overtime and regional labour markets in Finland, especially
in the turbulent decade of the 1990s. The great depression of the 1930s is usually seen as
the most severe peacetime economic crisis of the twentieth century in most industrialized
countries. However, Finland suffered its worst recession of the twentieth century not in
the 1930s but in the early 1990s. In the years 1991–1993 output fell by 10% and the
unemployment rate reached its all-time high (i.e. almost 20% of the Finnish labour force
as measured by Statistics Finland). Indeed, these figures were much worse than those
recorded during the great depression of the 1930s.10
Despite the fact that Finland’s experience in the early 1990s was unique in the context of
the OECD countries, other Nordic countries and the United Kingdom had certain
qualitative similarities in their economic development at the same time. In particular,
deregulation of financial markets lead to overlending by banks, which caused an
unsustainable boom in consumption, investment spending and asset prices. In Finland,
however, the slowdown of the early 1990s was much worse than elsewhere when measured
by the aggregate indicators of economic activity. An exogenous factor that partially explains
this is the fact that, in addition to the asset market collapse and the deep fall in domestic
consumption, there was almost a complete disappearance of the Soviet trade in 1990–
1991. The reasons behind the great Finnish depression of the early 1990s have, therefore,
been aptly described as “bad luck, bad banking, and bad policies”.
Since 1994 there has been a strong export-led recovery of aggregate economic activity in
Finland. Despite this recovery, the great slump has shaped most of the economic outcomes
during the period of the 1990s that is included in the empirical investigations of the following
essays on the Finnish labour markets. The exceptional magnitude of the slump helps to
identify interesting empirical patterns that would be hard to detect during normal business
cycle fluctuations.
The macroeconomic impulses shaped the labour market outcomes. For instance, there
was a notable decline in overtime in manufacturing during the great slump of the early
1990s. Due to the collapse of labour demand, there was a substantial fall in the net rate of
employment change across the Finnish regions. Thus, the data that covers this period
provides an opportunity to investigate the establishment-level adjustment of regional labour
markets during an episode of sharp fluctuations. The evolution of employment was

10
associated with restructuring in terms of job creation and destruction.11 In addition, there
was an increase in the magnitude of the external reorganization of regional labour markets
measured by migration flows that started in 1994 (see, for example, Pekkala and Ritsilä
2000). Concerning the impacts on self-reported subjective wellbeing of individuals, there
was an increase in the perception of job instability among workers in Finland during the
slump, which is a natural consequence of a rapid increase in the unemployment rate.12
This particular pattern highlights the enormous costs associated with the high unemployment
trap in the European labour markets.
1.2. The selected themes of labour markets
1.2.1. Working hours
Working hours have provided interesting puzzles and research questions to economists
ever since Adam Smith (see, for example, Contensou and Vranceanu 2000). The
determination of working time is usually investigated in terms of standard neoclassical
economics. In principle, working time is, in this context, determined according to the
supply side of the labour market. The analysis is based on the maximization of utility
derived from two homogeneous commodities, which are called consumption and leisure,
that eventually determine the optimal level of working time (i.e. the individual level of the
labour supply).13 In turn, this basic elaboration of working hours can be extended to
cover more complicated situations that introduce various constraints for the determination
of working time induced by the demand for the hours of work by companies.14 This
means that firms’ decisions can put constraints on the choices of individuals.
Determination of working hours is a topical issue in the context of the European labour
markets (including Finland). An important reason for this is that Europe’s high
unemployment trap has induced a great number of ambitious plans to solve the dilemma.
One of them is known as “work-sharing”. The idea of work-sharing is to redistribute the
available work to more people and thereby give a stake for the unemployed persons.
Work-sharing works when there is a tradeoff between average working time and
employment. This means that a reduction in average working hours delivers an increase in
employment.15 The idea has been put into practice in many OECD countries, where the
average annual working time has been reduced either by contracts or by legislation. There
have therefore been a great number of empirical investigations into the relationship between
employment and average annual working time. In a nutshell, the empirical studies on
working time and employment tend to discover that the supposed positive impact of a

11
reduction in working time on employment is a small one (see, for example, Hart 1987;
Hamermesh 1996; Kapteyn, Kalwij and Zaidi 2000).16 This means that work-sharing
schemes seem not to be the solution to the European unemployment problem.
Despite the enduring interest by the economic research on working time issues there are
uncovered and neglected research questions. For instance, there have been certain interesting
long-term trends and patterns in the average working time across industrialized countries.
Voth (2000) observes that there was an increase in the length of the average annual working
time during the early stages of industrialization. The trend was reversed during the late 1800s.
This feature means that there has been a continuing decline in the average working time
during the 1900s (Maddison 1995). Along with these international trends across industrialized
countries, there has been a sharp decline in the average working hours in Finland during the
past few decades. For instance, the length of the average working time has declined in
Finnish manufacturing by approximately 400 hours during the period from 1960 to 1996.
This long-term decline in the average working time needs to be explained by the economic
fundamentals in the context of a Nordic welfare state.17 The issue can be explored by using
industry-level data on the average working time and economic fundamentals.
A well-known distinction in the investigation of working time deals with the adjustment
margin of labour input from the perspective of companies (see, for example, Hamermesh
1996). The notion is based on the analysis of the standard profit maximization of a firm with
respect to labour services, which consist of two components that are employment and working
time (see, for example, Contensou and Vranceanu 2000). The extensive margin refers to
the sensitivity of profits with respect to employment. On the other hand, the intensive margin
refers to the sensitivity of profits with respect to working time. In principle, firms use overtime
hours (in other words, the intensive margin of labour utilization in contrast to the extensive
margin of labour utilization), because of the presence of the quasi-fixed cost of employment,
i.e. hiring and training costs and various employee benefits that are related to employment
but not to performed working hours. In contrast, from the perspective of individuals, overtime
is one way to induce flexibility to the total hours of work along with dual job holding.18
However, the determination of the share of overtime has been one of the uncovered
issues in the context of empirical studies on the European labour markets. The issue is
highly interesting, owing to the stylized feature that, despite the persistent unemployment
in Europe, there are a great number of employees that provide overtime hours at the same
time. In other words, an interesting empirical pattern of the European labour markets is
that the total hours of work are extremely unequally distributed across individuals and
households. Overtime hours contribute to this particular pattern of labour markets. This

12
same discrepancy is evident in Finland, where the unemployment rate has been at a high
level despite the recovery from the great slump of the early 1990s. At the same time,
there has been a rebound in overtime hours in Finnish manufacturing. In addition, the
determination of overtime is closely related to the issue of work-sharing, because a
reduction in standard working hours may increase the costs per worker in relation to the
cost of overtime. This means that companies may actually substitute overtime for workers.
This substitution effect may reduce employment when output is fixed by demand. In
response to this, there has been a discussion on the need for binding overtime ceilings.
The empirical studies that uncover the determination of overtime hours need to be based
on individual-level data.
The first essay on working hours explores the determination of the average working time
in the context of a Nordic welfare state, Finland, from the long-term perspective (Essay
1). The motivation of the study arises from the fact that the issue of work-sharing is
debated in Europe, but extremely little is known about the economic fundamentals that
have contributed to a decline in the average working time during the past few decades. It
is especially interesting to investigate the decline of the average working time tied in with
rising productivity and increasing labour taxes, which constitute the key elements of the
Nordic welfare states. The study aims to provide a coherent picture of these elements of
economic progress. The issue is studied by dividing the Finnish economy into six main
sectors. The sectoral panel data is based on the yearly observations from 1960 to 1996
and is obtained from National Accounts. The estimation results are based on fixed effects
models. The main empirical finding of the study is that both an increase in labour
productivity and a widening of the tax wedge have contributed to a decline in the average
working time in Finland during the past few decades. In particular, a rise in labour
productivity over time means that people become richer and as a consequence they demand
more leisure. Reductions in working time are therefore one way of distributing increased
prosperity. On the other hand, a widening of the tax wedge over time has meant that for
workers it is more attractive to take the fruits of increased productivity as an increase in
leisure. These observations are consistent with the predictions of a theoretical model that
is based on the notion of equilibrium working hours.
The second essay on working hours deals with the determination of the share of overtime
hours at the individual level in Finnish manufacturing (Essay 2). The total hours of work
consist of two major components. The so-called standard hours are determined by binding
collective agreements in Finland. On the other hand, the overtime hours are determined at
the individual level of the economy. This means that the hours of overtime can vary from
individual to individual for a variety of reasons. The aim of this study is to characterize the

13
incidence of overtime hours in Finnish manufacturing. The study also sheds light on the
incidence of overtime induced by the heterogeneity of establishments. In addition, the study
considers the impact of the degree of tightness in regional labour markets on overtime hours.
The study is based on individual-level data from manufacturing that covers the last quarter
of the year from 1989 to 1995. The individual-level data is from the records of the Con-
federation of Finnish Industry and Employers (Teollisuus ja Työnantajat, TT). The data
contain about 56000 observations. The data is based on the fact that each year TT conducts
a survey among its member employers and gathers information on paid wages, salaries
and the hours of work of employees. This means that the data contain detailed and accurate
division of the total hours of work into various components (including overtime). The
share of overtime is, by definition, a variable bounded by (0, 1). Indeed, there are a great
number of employees that do not do overtime in Finnish manufacturing. Thus, the estimation
results are based on Tobit specifications.
The study is able to uncover a number of interesting empirical patterns concerning the
determination of the share of overtime hours in Finnish manufacturing. Overtime covers
roughly 3% of the total hours of work and the share of overtime has been strongly
procyclical over the period of investigation. The hours of overtime divided by the total
number of hours decline as an employee ages. The overtime hours also decline in wage
per straight-time hours and in straight-time hours. These results are broadly in line with
those obtained from the empirical studies that use UK data of overtime hours at the
individual level. In addition, the estimation results show that males and newcomers (i.e.
employees that were not in the industry one year previously) tend to work more overtime,
but leavers (i.e. employees that leave the industry between this year and the next) work
less overtime. The share of women in the establishment has a negative effect on the incidence
of overtime hours. The degree of tightness in regional labour markets had no overall
impact on overtime from 1991 to 1995. This observation can be rationalized by noting
that the Finnish economy experienced an extreme economic slowdown during the early
1990s. There was therefore no shortage of employees. However, the impact of the regional
unemployment rate on the incidence of overtime hours differed sharply between the
population of the small plants (i.e. plants that have fewer than twenty employees) and the
rest of the plants in Finnish manufacturing.
The stylized feature emerges according to which the hours of overtime are more frequent
in the population of small establishments. The size effect did not collapse during the great
slump of the early 1990s, but the magnitude of this effect has been procyclical from 1989
to 1995. These observations mean that the small plants seem to react differently to

14
variations in product demand, which mostly varies with time. The result that overtime
hours are more common among small establishments is not driven by the smallest plants,
either. In addition, the overtime equation was estimated separately for the five industries
in Finnish manufacturing. These results support the perspective that the more flexible
working hours in terms of overtime hours are used within the capital-intensive industries
in order to take full advantage of establishments’ accumulated capital stock in the volatile
environment in which small establishments are positioned.
1.2.2. Regional labour markets
Labour markets have a distinct regional dimension. This feature is especially apparent in
Finland. Regional labour markets have gained growing interest in Finland, because there
has been an increase in the regional disparities of the unemployment rates as part of the
export-led recovery from the great slump of the early 1990s.19 Thus, the regional
unemployment disparities across the twenty Finnish provinces measured by the standard
deviation of the unemployment rates were about four times higher in 1997 compared with
the situation before the recession (Figure 1). This pattern of regional adjustment has been
in conflict with the earlier stylized feature of the Finnish regional labour markets, according
to which there tends to be a decline in the absolute regional disparities of the unemployment
rates measured by the standard deviation during the times of rapid economic growth. In
1996
1995 1994
1993
1992
1991
1990
19971998
1999
2000
0
1
2
3
4
5
2 4 6 8 10 12 14 16 18
The unemployment rate in the Finnish economy, %
Stan
dard
dev
iatio
n
Figure 1. The standard deviation of the unemployment rates across the twenty provinces
of Finland and the unemployment rate in the Finnish economy during the 1990s (Source:
Statistics Finland; Labour Force Survey).
15
other words, the period of the late 1990s constitutes an important exception to this pattern
of regional labour markets.
During the past ten years a growing body of literature within labour economics has emerged
that employs longitudinal, linked employer-employee data in analysing the pace of job
reallocation and worker flows (see, for example, Abowd and Kramarz 1999; Haltiwanger
et al. 1999). In particular, the dynamics of labour market adjustment at the plant level of
the economy can be captured by applying the measures of gross job and worker flows
(see, for example, Davis and Haltiwanger 1999).20 Joseph A. Schumpeter (1942) called
this process of capitalism “creative destruction”. Indeed, according to the growing number
of detailed establishment-level studies, it is fair to say that the reallocation and the
reorganization of scarce resources culminates in the turbulence of labour markets, where
the reallocation of resources takes the form of gross job flows (i.e. job creation and
destruction), and gross worker flows (i.e. hirings and separations of workers).
Gross job and worker flows decompose the net rate of employment change into
components. Thus, the net rate of employment change is the job creation rate minus the
job destruction rate (or the hiring rate minus the separation rate of workers). The job
creation rate is defined as the sum of positive employment changes, divided by the average
number of employees. In contrast, the job destruction rate is defined as the absolute
value of the sum of negative employment changes, divided by the average number of
employees. The sum of job creation and destruction rates is called the job reallocation
rate. The excess job reallocation rate equals the job reallocation rate minus the absolute
value of the net rate of employment change. This means that excess job reallocation is an
index of simultaneous job creation and destruction.
Comparison of information in two consecutive years can be used for calculating the
number of employees who have entered a plant during the year and are still working at
the same plant. The sum of these employees over all plants is worker inflow, or hiring.
In addition, it is possible to identify those employees who are no longer working at a
plant. This means that the sum of these employees is worker outflow, or separation.
The excess worker turnover rate (i.e. the churning rate) compares gross worker flows
with gross job flows; the larger the magnitude of the churning rate the larger the worker
flows (hirings and separations of workers) compared with job flows (creation and
destruction of jobs).
The earlier empirical studies on regional labour markets have neglected the fact that regional
economies are in a state of continuous turbulence (see, for example, Elhorst 2003). There

16
are therefore a great number of uncovered research questions in the investigation of regional
labour markets in Finland that are linked to gross job and worker flows. In other words,
the earlier empirical studies on the Finnish regional labour markets have been conducted
by using aggregate data on (net) employment changes.21 The main shortcoming of these
traditional investigations of the aggregate outcome is that they entirely mask the
establishment-level dynamics of labour-demand adjustment and provide an incomplete
and potentially misleading picture of the Finnish regional labour markets.
Empirical studies that aim to relate the regional unemployment disparities to the economic
fundamentals in Finland have not been available. A panel of the Finnish regions is highly
suitable for the investigation of this issue. In particular, the existing studies exclude an
evaluation of the impact of reorganization in terms of gross flows of jobs and workers on
the regional unemployment rates. This same notion seems to extend to the whole of the
empirical literature on regional unemployment disparities despite the fact that starting from
Lowry’s (1966) contribution there have been a great number of studies that focus on
gross migration flows (see, for example, Elhorst 2003; OECD 2000). Indeed, the measures
of gross migration flows complement the picture painted by the measures of gross job
and worker flows from the perspective of regional reorganization.
The internal reorganization of the Finnish regional labour markets can therefore be captured
by using the measures of gross flows of jobs and workers that are calculated from plant-
level micro data. In contrast, the reorganization between regional labour markets can be
described by using the measures of gross migration flows.22 Indeed, the turnover between
regional labour markets can be measured in the same way as the rate of excess job
reallocation. This means that a measure of external turnover can be based on the notion
that the magnitude of simultaneous gross migration flows is an appropriate measure for
the intensiveness of reorganization across regional labour markets.
The first essay on regional labour markets deals with the issue of gross job and worker
flows in Finland (Essay 3). The motivation of the study is based on the fact that there has
been a bulk of research on gross job and worker flows based on cross-country
comparisons. In contrast to available cross-country comparisons, the study provides
detailed empirical evidence for the perspective that there are differences in gross job and
worker flows within the same country despite the presence of the same institutional
characteristics (including labour market regulations) across regions. In particular, the study
explores the disparities in the regional labour market adjustment during an episode of
extreme turbulence in the Finnish economy. In addition, the genuine regional elements in
gross job and worker flows are separated from the effects of the industry structure.

17
Gross job and worker flows are calculated from establishment-level data from 1990 to
1997 and are then aggregated to the Finnish regions. The applied establishment-level
data covers more than 80% of the total employment in the non-farming business sector of
the Finnish economy. Thus, the data contain 1.1 million employees in about 100 000
plants. The geographical division of Finland is based on NUTS3 regions. The number of
these regions is twenty.
The magnitude of gross job and worker flows is large, relative to the net employment
change in the Finnish regions. This observation is consistent with stylized features of the
literature. There is therefore a great deal of gross job creation in the declining regions with
high average unemployment in Eastern and Northern Finland. On the other hand, there is
a great amount of gross job destruction in the growing regions with low average
unemployment in Southern Finland. In other words, the study provides extensive evidence
for the perspective that stresses the enormous heterogeneity of regional labour market
adjustment in Finland in contrast to the earlier literature that has been focused solely on
(net) employment changes. The entry and exit of establishments covers about 2–3% of all
employees each year. This means that the regional disparities in gross job and worker
flows in Finland are driven mainly by continuing establishments.
Gross job and worker flows provide an insight into the adjustment of regional labour
markets during the great slump of the early 1990s and the following recovery of economic
activity. The rapid rise in regional unemployment rate disparities from 1991 to 1993 can
be explained by the sharp rise in the regional disparities in job destruction rates and in
separation rates of workers. There was a decline in regional disparities in job creation
rates and in hiring rates of workers at the same time. The highest level of job destruction
at the bottom of the slump was in the provinces of Eastern and Northern Finland. In
contrast to the adjustment of labour markets in the slump, during the recovery from 1994
to 1997, there has been a decline in the regional disparities in job destruction rates and in
separation rates of workers, but a rise in the regional disparities of job creation rates and
hiring rates of workers.
There are genuine regional elements in gross job and worker flows despite the fact that
the extreme volatility of economic activity over the period of the investigation means
that much of the explained variation in gross job and worker flows can be attributed to
years (and also to industries). The role of these genuine regional elements is most
important in the case of the churning rate (i.e. the excess worker turnover rate). In
particular, the patterns of gross job and worker flows that are characterized in this
study cannot be explained by the industry structure of the Finnish regions. In contrast,

18
the regional differences in net employment growth rates in the period from 1990 to
1997 can be reduced mainly to the differences in the industry structures of the regions.
This pattern highlights the fact that the focus on gross flows of job and workers can
indeed provide important insights into the adjustment of the Finnish regional labour
markets.
The second essay on regional labour markets aims to relate the regional unemployment
disparities to the economic fundamentals in Finland (Essay 4). Along with the conventional
economic fundamentals suggested by the available empirical literature on regional
unemployment disparities, the study considers the measures of gross job and worker
flows based on the establishment-level dynamics of labour-demand adjustment in the
Finnish regional labour markets. In addition, the study includes an elaboration of the
impact of gross migration flows on the regional unemployment rates. By doing this, the
study fills an important gap in the literature on regional labour markets in Finland and
provides empirical evidence for the importance of the reorganization of regional labour
markets based on gross flows of jobs and workers. The evaluation of regional labour
markets is based on regional panel data that is created by matching the conventional
economic fundamentals with the measures based on gross flows of jobs and workers.
The data covers the period from 1989 to 1996. The geographical division of Finland is
based on NUTS4 regions. The number of these regions is 85. The estimation results
are based on various panel data models. In particular, a dynamic model is considered,
because adjustment of the key variables of interest is not necessarily immediate.
The Kernel density estimates for the distribution of the unemployment rate across the
Finnish regions for the year 1991 (i.e. the bottom of the slump measured by the net rate of
employment change) and the year 1996 reveal that there have not been substantial changes
in the shape of the distributions of the unemployment rates despite the fact that there has
been a sharp increase in the average unemployment rate with a rise in the dispersion of
the unemployment rates at the same time. In particular, there is no empirical evidence for
the bipolarization of the distribution of the regional unemployment rates during the 1990s.
The striking empirical finding from the panel data estimations is that the reorganization of
labour markets lowers the unemployment rate in the Finnish regions. In other words, the
reallocation of labour resources seems to be good for regional employment. The essential
role of reorganization in the determination of regional unemployment has some direct
relevance for regional policy. In particular, this finding provides empirical support for the
perspective that various public measures should not be aimed at aiding contracting plants
since restructuring at the establishment level of the economy will eventually yield a lower
unemployment rate.

19
1.2.3. Perception of job instability
There was an important and well-known switch from the framework of measurable cardinal
utility to a theory based on a preference index of ordinal utility in microeconomics during
the 1930s (see Frey and Stutzer 2002a; 2002b). Since then the mainstream perspective
of economics has been that utility cannot be measured and there is usually no sense in the
evaluation of various measures of self-reported subjective wellbeing by individuals. This
switch has also had a deep impact on labour economics.
There is a long and equally well-established tradition of analysis that applies various
subjective survey responses within the professions of psychology and sociology. Moreover,
within the field of standard labour economics, it has always been common to apply labour
force surveys that can be utilized, for instance, in the empirical studies of gross worker
flows. However, along with the mainstream tradition of economics, labour economists
have not focused on the investigation of the measures of self-reported subjective wellbeing
by individuals.23 The neglect of the measures of the subjective wellbeing of individuals is
at least partly related to the fact that economists are usually sceptical about the use of this
kind of individual-level survey data owing to non-random measurement errors. For instance,
Berthard and Mullainathan (2001) provide selected empirical evidence on the issue that
the measument error of often applied surveys tends to correlate with a large number of
individuals’ characteristics such as education.
However, this traditional pattern of the literature changed rapidly during the 1990s.24
There have therefore been an increasing number of empirical studies by economists based
on the self-reported measures of subjective wellbeing by individuals. These studies aim to
explain, for instance, various measures of happiness and job satisfaction (see Clark and
Oswald 2002; Frey and Stutzer 2002a; 2002b). In particular, within the context of labour
economics, one of the most important empirical findings has been that unemployed persons
report substantially lower levels of happiness than employed persons (see, for example,
Oswald 1997). Indeed, this piece of empirical evidence is highly important from the
economic policy perspective due to the fact that the observation underlines the notion
that unemployment is involuntary by its nature for most of the unemployed.
The perception of job instability constitutes an important subjective measure of wellbeing
by individuals owing to the fact that for the large majority of employees only one match
with an employer comprises most of the current earnings, making their welfare closely
related to the potential risk of losing their job in the presence of incomplete insurance
against shocks. In other words, the very nature of the labour markets itself gives rise to a

20
perception of job instability among employees. This problem is apparent in the context of
the persistent European unemployment problem.
The perception of job instability is not disconnected from the issues of working hours and
labour market flows. In particular, the perception of job instability is related to the unequal
distribution of working hours across individuals and households in Europe that is highlighted
in the pattern of overtime. Indeed, the perception of job instability (i.e. the fear of
nullification of hours of work entirely) constitutes an antithesis to overtime. Moreover, an
investigation into the perception of job instability completes the picture painted by the
studies that focus on gross flows of jobs and workers covering European countries. The
recent studies that underline the enormous magnitude of gross flows of jobs and workers
usually fail to differentiate between voluntary and involuntary flows. An investigation that
focuses on the perception of job instability among workers is able to focus more deeply
on the determination of involuntary flows of workers that are directly related to the
European unemployment problem.
There have been a great number of empirical studies on job instability that aim to document
and investigate the realized patterns of job instability by individuals. Those studies, for
instance, focus on the tenure structure over the past few decades (see, for example,
OECD 1997). In contrast, there are a rather limited number of empirical studies that aim
to investigate the empirical determination of perceived job instability from individual to
individual. The latter empirical studies require survey data. In particular, there have not
been empirical investigations that aim to evaluate the economic fundamentals of the
perception of job instability in the European labour markets. The focus of the available
empirical literature on perceived job instability has been heavily on the unregulated Anglo-
Saxon labour markets. Thus, there is an urgent need to understand the pattern of the
perception of job instability in the context of the European labour markets that have been
characterized by the persistent unemployment problem.
The last essay in this collection investigates the perception of job instability among workers
in Europe (Essay 5). In particular, the aim of this study is to investigate the empirical
determination of the subjective probability of the job instability of individuals by using
unique survey data from all the 15 member states of the European Union and Norway.
The survey was conducted in 1998 and it contains 5435 individuals. The question about
the perception of job instability is formulated in the survey as follows: ”Do you worry
about the security of your present work?”. The answers to the question can be either
”yes” or ”no”. Thus, the estimation results are based on Probit models. The study provides
detailed empirical evidence, for example, on the individual characteristics such as age and

21
education that are related to the perceived job instability of individuals in European labour
markets. In addition, the study includes a consideration of job and firm characteristics
and their role in the determination of the perception of job instability. Thus, the survey
data enables us to evaluate the whole spectrum of economic fundamentals that give rise to
a perception of job instability. There tends to be a rather vague relationship between
institutional features and the perception of job instability among workers. However, the
patterns of perceived job instability and the institutional features of European countries
are not consistent with the popular notion that the perception of job instability declines as
the strictness of labour standards and the strictness of employment protection increase.
This pattern emerges despite the stylized feature of the earlier literature that the magnitude
of gross job and worker flows of the economies declines as the strictness of labour
standards and employment protection increases. This means that the perception of job
instability and the underlying gross flows of job and workers need not be closely correlated.
The estimation results reveal that perceived job instability increases with age. In other
words, there is evidence for the perspective that it is the job loss wage penalty more than
the job loss incidence that drives the perception of job instability among European workers.
The conclusion on the role of job loss incidence is based on the fact that the turnover of
workers is higher among young workers. An increase in the educational level, on the
other hand, leads to a decline in the perception of job instability. There are no differences
in the perceptions of job instability between males and females. An occurrence of
unemployment during the past five years delivers a substantial rise in the perception of job
instability. The empirical finding that the unemployment history strongly matters is consistent
with the notion that an unemployment episode provides private information about the
unobservable productivity of an employee. The most striking result is that a temporary
contract as such does not yield an additional increase in the perception of job instability at
the individual level of the economy. However, the perception of job instability is more
common in manufacturing and there is some evidence for the perspective that it increases
according to the size of the firm. There are also strong country effects. For instance, the
perception of job instability among workers is lower in Denmark and higher in Spain than
in Norway even after taking into account the controls included for the incidence of job
instability at the individual level of the economy in European labour markets.

22
1.3. Summary of findings
• An increase in labour productivity and a widening of the tax wedge have contributed to
a decline in the average working time in Finland from the long-run perspective. These
observations are consistent with the predictions of a theoretical model that is based on
the notion of equilibrium working hours.
• Overtime hours have an interesting role in the adjustment of total hours of work in
Finnish manufacturing. The stylized feature emerges according to which overtime hours
are more frequent in the population of small establishments.
• Gross job and worker flows reveal the enormous heterogeneity in the plant-level
adjustment of labour demand in the Finnish regional labour markets in contrast to the
earlier empirical literature that has focused on the elaboration of the net rate of employment
change.
• The internal and external reorganization of labour markets lowers the unemployment
rate in the Finnish regions. This means that the reallocation of labour resources at the
plant-level of the regions seems to be good for regional employment in contrast to the
earlier empirical literature that has stressed the notion according to which restructuring is
an important source of the regional unemployment problem.
• The unemployment history of workers strongly matters for the perception of job instability
in European labour markets. This pattern highlights the substantial costs associated with
the high unemployment trap.
References
Abowd, J.M. and F. Kramarz (1999), “The analysis of labor markets using matched
employer-employee data.” In Handbook of Labour Economics, Vol. 3B, 2629–2710.
Eds. O. Ashenfelter and D. Card. Amsterdam: North-Holland.
Bean, C. (1994), ”European unemployment: a survey.” Journal of Economic Literature
32, 573–619.

23
Bertrand, M. and S. Mullainathan (2001), ”Do people mean what they say? Implications
for subjective survey data.” The American Economic Review 91, 67–72.
Blundell, R. and T. McCurdy (1999), ”Labor supply: a review of alternative approaches.”
In Handbook of Labour Economics, Vol. 3A, 1559–1695. Eds. O. Ashenfelter and D.
Card. Amsterdam: North-Holland.
Böckerman, P. (2000), “Suomen työttömyys: Alueellinen näkökulma.” (in Finnish). In
Suomalaisen sosiaalipolitiikan alueellinen rakenne, 72–92. Eds. H.A. Loikkanen and
J. Saari. Helsinki: Sosiaali- ja terveysturvan keskusliitto ry.
Böckerman, P. and J. Kiander (2002a), ”Labour markets in Finland during the great depressions
of the twentieth century.” Scandinavian Economic History Review 50, 55–70.
Böckerman, P. and J. Kiander (2002b), ”Has work-sharing worked in Finland?” Applied
Economics Letters 9, 39–41.
Böckerman, P. and M. Maliranta (2003), ”The micro-level dynamics of regional
productivity growth: the source of divergence in Finland.” Discussion Papers,
(Forthcoming). The Research Institute of the Finnish Economy.
Clark, A.E. and A.J. Oswald (2002), “A simple statistical method for measuring how life
events affect happiness.” International Journal of Epidemiology 31, 1139–1144.
Contensou, F. and R. Vranceanu (2000), Working Time. Theory and Policy Implications.
Cheltenham: Edward Elgar.
Davis, S.J. and J. Haltiwanger (1999), “Gross job flows.” In Handbook of Labour Economics,
Vol. 3B, 2711–2805. Eds. O. Ashenfelter and D. Card. Amsterdam: North-Holland.
Elhorst, J.P. (2003), ”The mystery of regional unemployment differentials: a survey of
theoretical and empirical explanations.” Journal of Economic Surveys, (Forthcoming).
Elliott, R.F. (1991), Labor Economics. A Comparative Text. London: McGraw-Hill
Book Company.
Frey, B.S. and A. Stutzer (2002a), Happiness & Economics. How the Economy and
Institutions Affect Human Well-Being. Princeton: Princeton University Press.

24
Frey, B.S. and A. Stutzer (2002b), ”What can economists learn from happiness research?”
Journal of Economic Literature 40, 402–435.
Haltiwanger, J.C., J. Lane, J. R. Spletzer, J.J.M. Theeuwes and K.R. Troske (1999), (eds.)
The Creation and Analysis of Employer-Employee Matched Data. Amsterdam: Elsevier.
Hamermesh, D.S. (1996), Labor Demand. Princeton: Princeton University Press.
Hart, R.A. (1987), Working Time and Employment. London: Allen & Urwin.
Hetemäki, M. (2002), “Työttömyyden taloudelliset ja inhimilliset kustannukset.” (in Fin-
nish). PTT-Katsaus 23, 19–24.
Hicks, J.R. (1963), The Theory of Wages. London: MacMillan.
Honkapohja, S. and E. Koskela (1999), “The economic crisis of the 1990s in Finland.”
Economic Policy 14, 400–436.
Holm, P. and J. Kiander (1993), ”The effects of work-sharing on employment and overtime
in Finnish Manufacturing 1960–1987.” Applied Economics 25, 801–810.
Ilmakunnas, P. (1995), ”Working time and labour demand in Finnish manufacturing: short-
run and long-run effects.” Applied Economics 27, 995–1002.
Ilmakunnas, P. and M. Maliranta (2003), ”The turnover of jobs and workers in a deep
recession: evidence from the Finnish business sector.” International Journal of Manpower
24, (Forthcoming).
Ilmakunnas, S. (1997), ”Female labour supply and work incentives.” Studies 68. Labour
Institute for Economic Research.
Ilmakunnas, S. (2001) (ed.), ”Työmarkkinat testissä.” (in Finnish). VATT Publications
30. Government Institute for Economic Research.
Ilmakunnas, S. and E. Koskela (2002) (eds.), ”Towards higher employment. The role of
labour market institutions.” VATT Publications 32. Government Institute for Economic
Research.

25
Kangasharju, A. and J. Pehkonen (2001), ”Employment-output link in Finland: evidence
from regional data.” Finnish Economic Papers 14, 41–50.
Kapteyn, A., A. Kalwij and A. Zaidi (2000), ”The myth of worksharing.” 23/2002. CentER
Discussion Papers.
Kiander, J. (2001), ”Laman opetukset.” (in Finnish). VATT-Publications 27:5. Government
Institute for Economic Research.
Kiander, J. and P. Vartia (1996), “The great depression of the 1990s in Finland.” Finnish
Economic Papers 9, 72–88.
Koskela, E. and R. Uusitalo (2003), ”The un-intented convergence: how the Finnish
unemployment reached the European level.” Discussion Papers 188. Labour Institute for
Economic Research.
Layard, R. and S. Nickell (1999), ”Labor market institutions and economic performance.”
In Handbook of Labour Economics, Vol. 3C, 3029–3084. Eds. O. Ashenfelter and D.
Card. Amsterdam: North-Holland.
Lilja, R. (1991), “The problematic and unproblematic second job.” Discussion Papers
107. Labour Institute for Economic Research.
Lowry, I.S. (1966), Migration and Metropolitan Growth: Two Analytical Models.
San Francisco: Chandler Publishing Company.
Maddison, A. (1995), Monitoring the World Economy, 1820–1992. Paris: OECD.
Maliranta, M. (2001), “Productivity growth and micro-level restructuring. Finnish
experiences during the turbulent decades.” Discussion Papers 757. The Research Institu-
te of the Finnish Economy.
Maliranta, M. (2002), “From R&D to productivity through plant-level restructuring.”
Discussion Papers 795. The Research Institute of the Finnish Economy.
Maliranta, M. (2003), “Micro-level dynamics of productivity growth. An empirical analysis
of the great leap in the Finnish manufacturing productivity in 1975–2000.” (Forthcoming).
The Research Institute of the Finnish Economy.

26
Marjanen, R. (2002), ”Palkkaratkaisujen sisältö ja toteuttaminen tulopolitiikan aikakau-
della.” (in Finnish). B 188 Series. The Research Institute of the Finnish Economy.
Nätti, J., Kinnunen, U., Happonen, M. and Mauno, S. (2001), ”Perceived job insecurity
among Finnish employees in 1980-2000: prevalence and antecedents.” In 1990s Economic
Crisis. The Research Programme on the Economic Crisis of the 1990s in Finland:
Down from the Heavens, Up from the Ashes. The Finnish Economic Crisis of the
1990s in the Light of Economic and Social Research, 484-506. Eds. K. Kalela, J.
Kiander, U. Kivikuru, H.A. Loikkanen and J. Simpura. Helsinki: Government Institute
for Economic Research, Helsinki.
OECD (1997), Employment Outlook. Paris: OECD.
OECD (2000), Employment Outlook. Paris: OECD.
Oswald, A.J. (1997), ”Happiness and economic performance.” The Economic Journal
107, 1815–1831.
Oswald, A.J. (2000), ”Defending economics.” Royal Economic Society Newsletter 110, 8.
Pehkonen, J. and H. Tanninen (1997), ”Institutions, incentives and trade union membership.”
Labour: Review of Labour Economics and Industrial Relations 11, 579–597.
Pehkonen J. and H. Tervo (1998), ”Persistence and turnover in regional unemployment
disparities.” Regional Studies 32, 445–458.
Pekkala, S. and Ritsilä, J. (2000), “A macroeconomic analysis of regional migration in
Finland 1975–95.” Review of Regional Studies 29, 71–85.
Pohjola, M. (1998) (ed.), Suomalainen työttömyys. (in Finnish). Helsinki: Taloustieto Oy.
Prescott, E.D. (2002), ”Prosperity and depression.” The American Economic Review
92, 1–21.
Prime Minister’s Office (2000), ”Alueellinen kehitys ja aluepolitiikka Suomessa.” (in Fin-
nish). Publications 2000/6. Prime Minister’s Office.

27
Santamäki-Vuori, T. and S. Parviainen (1996), “The labour market in Finland.” Studies
64. Labour Institute for Economic Research.
Schumpeter, J.A. (1942), Capitalism, Socialism, and Democracy. Harvard: Harper
and Row.
Tervo H. (1998), ”The development of regional unemployment differentials in Finland in
the 1990s.” Finnish Economic Papers 11, 37–49.
Uusitalo, R. (2002), ”Changes in the Finnish wage structure: will demand and supply
do?” Scandinavian Journal of Economics 104, 69–85.
Van Praag, B.M.S., Frijters, P., Ferrer-i-Carbonell, A. (2001), ”The anatomy of subjective
well-being.” Discussion Papers 265. DIW.
Vartiainen, J. (1998), ”The labour market in Finland: institutions and outcomes.”
Publications Series, 1998/2. Prime Minister’s Office.
Voth, H.-J. (2000), Time and Work in England 1750-1830. Oxford: Clarendon Press.

28
1 The collections of empirical studies on the Finnish labour markets include Pohjola (1998)and Ilmakunnas (2001).
2 Kiander and Vartia (1996), Honkapohja and Koskela (1999), and Kiander (2001) providedescriptions of the great slump of the early 1990s.
3 Bean (1994) provides a survey of the European unemployment problem. Ilmakunnas andKoskela (2002) contains a collection of articles on the European unemployment problem.Koskela and Uusitalo (2003) provides a discussion of the Finnish unemployment problem inthe European context.
4 Santamäki and Parviainen (1996), Vartiainen (1998), and Marjanen (2002) providedescriptions of the Finnish labour markets.
5 Vartiainen (1998) provides a description.
6 Pehkonen and Tanninen (1997) studies this issue.
7 Uusitalo (2002) provides evidence for the perspective that the distribution of wages hasbeen more compressed during the times of collective agreements in Finland.
8 Marjanen (2002) documents the evolution of wage drift in Finland during the past fewdecades.
9 In addition, non-manual workers provide a great number of unpaid overtime hours.
10 Böckerman and Kiander (2002a) provide a comparision of adjustment of the Finnishlabour markets during the great depressions of the twentieth century.
11 Maliranta (2001; 2002; 2003) reports that job destruction in low productivity and jobcreation in high productivity plants has positively contributed to the aggregate productivitygrowth rate of Finnish manufacturing. Böckerman and Maliranta (2003) focus on the regionaldimension of productivity growth in Finland.
12 Nätti et al. (2001) provide an empirical investigation on the perception of job instability inFinland during the 1990s.
13 Blundell and McCurdy (1999) summarizes the literature.
14 Ilmakunnas (1997) provides an empirical study on this issue in the Finnish context.
15 Economists have usually had a sceptical perspective concerning the positive impacts ofwork-sharing schemes on employment. Hicks (1963) is among the few economists whohave been a modest supporter of work-sharing schemes.
16 The Finnish studies on work-sharing include Holm and Kiander (1993), Ilmakunnas (1995),and Böckerman and Kiander (2002b).
17 Prescott (2002) argues that the large difference in labour suppy between France and theUnited States can be explained due to differences in the tax systems of those countries.The argument is based on the distortion induced by the intertemporal tax wedge that ismore severe in France. Hetemäki (2002) provides empirical evidence for the perspectivethat an increase in the tax wedge yields a decline in average working hours in the OECDcountries.
18 Lilja (1991) provides a study on dual job holding in Finland.

29
19 Pehkonen and Tervo (1998), and Tervo (1998) provide studies on the regional disparitiesof the Finnish labour markets. Böckerman (2000) provides a summary of the literature.The Prime Minister’s Office (2000) provides a summary of the development of the regionaldisparities during the 1990s.
20 Ilmakunnas and Maliranta (2003) summarizes the Finnish evidence on gross flows of jobsand workers.
21 For instance, Kangasharju and Pehkonen (2001) provide an analysis of growth andemployment in the Finnish regions.
22 The Finnish studies on migration have not focused on gross flows of migration (see, forexample, Pekkala and Ritsilä 2000).
23 Van Praag, Frijters and Ferrer-i-Carbonell (2001) provides a survey of the field.
24 Frey and Stutzer (2002a; 2002b) provide a summary of the literature.

30
Determination of average working time in Finland
Petri Böckerman*Jaakko Kiander**
*Labour Institute for Economic Research. Pitkänsillanranta 3A, FIN-00530 Helsinki,
Finland. Fax: +358-9-2535 7332. Tel.: +358-9-2535 7330. E-mail:
**Government Institute for Economic Research. Hämeentie 3, FIN-00531 Helsinki,
Finland. E-mail: [email protected]
Abstract
This study explores the determination of average working time in the context of a Nordic
welfare state. The study is focused on the Finnish case. The issue is explored by using
data from six industries from 1960 to 1996. The main empirical result is that both an
increase in labour productivity and a widening of the tax wedge have contributed to a
decline in average working time in Finland. These observations are consistent with the
predictions of a theoretical model that is based on the notion of equilibrium working
hours.
JEL-code: J21
Keywords: working hours, work-sharing, tax wedge

31
1. Introduction
Europe’s high unemployment trap has generated a great number of ambitious plans to
solve the dilemma. One of them is known as “work-sharing” (see e.g. Contensou and
Vranceanu 2000). The idea has also been put into practice in many OECD countries,
where the average annual working time has been reduced either by contracts or by
legislation.1 The issue of work-sharing is debated in Europe, but little is known about the
underlying economic fundamentals that have contributed to a decline in average working
time during the past few decades.
There have indeed been certain interesting long-term trends in average working time across
industrialized countries. Voth (2000) observes that there was a sharp increase in the length
of average annual working time during the early stages of industrialization in England. This
trend was reversed during the late 1800s. Maddison (1995) shows that average hours of
work in advanced OECD countries fell from around 3000 hours a year in 1870 to between
1500 and 2000 hours a year by 1990. Evans, Lippoldt and Marianna (2001) note that
the long-term decline in average annual hours has slowed down in almost all OECD
countries in recent years.
In this study we focus on the determination of average working time in Finland. Economic
development in Finland has been rapid since the Second World War. Rising productivity
has definitely been the most important driving force of economic growth as in most other
industrialized countries (see e.g. Hjerppe 1989). Along with the rapid growth in the post-
war era, the public sector expanded, the tax wedge increased and average annual working
time was gradually reduced. Nowadays, Finland is one of the Nordic welfare states,
characterized by high labour taxes and a short average annual working time compared
with the United States. These broad features of economic development mean that it is
especially interesting to investigate the decline of average working time tied in with rising
productivity and increasing labour taxes at the same time, which constitute the key elements
of the Nordic welfare states. Thus, the following study aims to provide a coherent picture
of these underlying elements of economic progress.
A standard microeconomic theory of individual labour supply suggests that labour supply
and, hence, average working hours should decline when real incomes rise.2 In reality
individuals tend to supply the prevailing number of standard hours. In Finland, and in
other Nordic countries, the standard hours are not decided on an individual or firm basis
but instead collectively, either by binding collective agreements or by legislation. However,
it can be argued that pressures for such agreements will grow when the individual demand

32
for leisure increases and that the pressures are reflected in collective bargaining over
standard hours. In fact, an application of the representative agent framework can be
motivated by noting that the following investigation is focused on the determination of
average working time during the past few decades. Namely, the case can be made for the
view that in democratic societies the demand for different types of working time arragements
is aggregated without serious biases in the long-term. The underlying differences in
preferences of individuals with respect to leisure can therefore be omitted and the issue
can be elaborated by using the representative agent framework.
Thus, in this study we use a simple model of individual labour supply to capture the effects
of productivity growth and labour taxation. It is assumed that the real labour cost equals
labour productivity and that the desired leisure increases with total incomes. There is a
public sector in the model which produces public goods and gives income transfers to
households. This feature is motivated by noting that the study is about the determination
of average working time in a Nordic welfare state. The public sector has a binding budget
constraint and hence it has to finance its expenditure by taxing labour input. The effects of
the payroll taxes and income taxes are identical in the model.
The aim of this study is therefore to elaborate the economic fundamentals that have
contributed to a decline in average working time at the aggregate level in the case of
Finland. The empirical investigation is conducted through the use of a panel data set
consisting of six industries, from 1960 to 1996. The main empirical result of this study is
that both an increase in labour productivity and a widening of the tax wedge have
contributed to a decline in average working time. The study appears in five sections. The
next section presents a simple model of labour demand and wage setting which tries to
illuminate some basic feedback mechanisms between productivity, the tax wedge and
average working time. The third section contains a short description of the data set along
with an international comparison of annual hours, and provides a justification for the choice
of variables. The fourth section reports the empirical results from a number of panel data
estimations. The last section concludes with a few remarks.
2. The model
Consider a simple model of individual labour supply. We first assume that firms are on their
labour demand curves, and hence the labour cost is equal to the marginal product of labour,
or
(1)( )1+ =s W Q ,

33
where W is the hourly wage and payroll tax is denoted by s. For simplicity we assume that
in the long run the marginal product of labour (Q) is equal to the average product of
labour. Hence Q can be interpreted as average labour productivity, which increases with
time-dependent technical progress, A(t), and capital-labour ratio (K/N):
(2)
For simplicity we take the capital stock here as an exogenous constant. The workers are
assumed to get utility from consumption of goods and of leisure. For simplicity we assume
that there is no saving. Hence the utility function of the workers is given by
, (3)
where the income tax rate is denoted by t. The income consists of after-tax labour income
and the money value of a bundle of public goods and income transfers provided by the
government (G). The number of hours worked is H, and T is the number of total hours.
Public expenditure is determined by a political process which is treated as exogenous.
Substituting equation (1) for equation (3) yields
(4)
where is a measure of the tax wedge.
The government covers its expenditure by taxing employers and employees. Hence its
budget constraint is given by
(5)
where Y is the aggregate output per capita.
Let us use the following logarithmic specification of the utility function to derive the
comparative statics results:
(6)
where B is the weight of leisure. We assume that B is a increasing function of aggregate
output:
V V C L V WH t G T H= = − + −( , ) [ ( ) , ]1
Θ =+−
≥11
1st
Q A t FKN
=
( ) ,
V VQH
G T H= + −
Θ
, ,
G s t WH QH Y= + =−
=−
( )Θ
ΘΘ
Θ1 1
,
VQH
G B QH T H= +
+ −log ( ) log( )
Θ ,

34
(7)
The optimal labour supply can now be derived from the first-order condition of utility
maximation:
(8)
The effect of increased productivity on individual working time can be derived by
differentiating the first-order condition:
(9)
since . Whether this expression is negative or positive is an empirical question.
Theoretically, it depends on the sign and the size of B”. However, it is clear that the
average productivity has a negative effect on working time when the total output per
worker is sufficiently low. In fact, the expression (9) is always negative if we assume that
the equation (6) can be maximized by treating B(QH) as given, because this leads to
dropping the first terms on the RHS of the equations (8)–(9). Thus, it is evident that an
increase in average productivity yields a decline in average working time.
In addition, it is interesting to examine the corner solutions of the maximization of (6)
concerning B, which is the weight of leisure in the utility function of the representative
agent. If B=0, then an increase in productivity has no effect at all on the determination of
average working time. This result means that if the following empirical investigation shows
that working time declines as productivity rises, there is, in fact, empirical evidence for
the view that people put more weight on leisure as they get richer.
Similarily, it can be clearly shown that an increase in the tax wedge also reduces the
working hours:
(10)
The size of this effect increases with the size of the public sector. If B=0, then an increase
in the magnitude of the tax wedge still leads to a decrease in average working time.
Remembering that the average productivity consists of technical progress and capital
intensity, one can write:
∂∂
VH
B Q LQ
QH GB
T H= − +
+−
−=' ( log )
Θ0
G G Q− =Θ 0
∂∂ ∂
2
2 0V
HG G
QH GΘΘ
ΘΘ= −
++
<( )
( )
,0'),( >= BQHBB
∂∂ ∂
2
2
VH Q
B L B H LB H
T HG G Q
QH G= − − −
−+
−+
' log ' ' log' ( )
( )Θ
ΘΘ
= − − −−
B L B H LB H
T H' log ' ' log
'< 0,

35
(11)
Or in words, the equilibrium working time depends on productivity and the tax wedge.
3. The data
An international comparison indicates that there are certain interesting differences in the
evolution of standard annual hours across industrialized countries that need to be addressed
(Table 1). A well-known stylized feature of international patterns is the fact that the level
of average working time is lower in Europe compared with the United States. There has
been a decline in annual hours for full-time manufacturing workers in most of the European
Union countries. In contrast, there there has been essentially no reduction in annual hours
in the United States.3 This comparison reveals that Finland definitely belongs to the group
of European countries in which there has also been a substantial decline in annual hours
from 1984 to 1995. Thus, the following empirical investigation is able to contribute to the
discussion on the reasons for these large disparities across countries from the perspective
of a Nordic welfare state.
The determination of average working time in Finland is studied by dividing the economy
into six main sectors.4 The sectors are agriculture, forestry and logging (SIC95: A-B),
manufacturing (SIC95: C-E), construction (SIC95: F), the wholesale and retail trades
(SIC95: G), transportation (SIC95: I) and public activities (SIC95: L-N).5 The study is
based on the yearly observations from 1960 to 1996.
A short description and the source of the variables is provided in Table 2. Through the
use of a panel data estimation, average working time is explained by labour productivity,
the tax wedge and gross capital formation. The decline in hours per worker is evident in
the case of all sectors from 1960 to 1996. However, it is important to note that there also
exists an interesting variation in the behaviour of hours per worker across the sectors.
This variation is naturally masked in the aggregate data. An important feature of the data
set is that the sectoral variation in a tax wedge variable is totally generated by one
component of the tax wedge, namely by “social security contributions / wages”. The
reported results are robust with respect to this specification.
H H A tKN
=
( ), ,Θ
∂∂
∂∂
∂∂
HA t
HK N
for QH Q H andH
for all( )
,( / )
* *< < <0 0Θ
Θ .

36
The study also contains a potential weakness, because it is not possible to get disaggregated
data on standard hours and overtime covering the whole period from 1960 to 1996. This
means that we have to use data on actual average working hours.6 However, this is not a
major problem, because - as noted by Holm and Kiander (1993) and Ilmakunnas (1995)
– in the long run the time path of actual working hours closely follows that of standard
hours, at least in the case of Finnish manufacturing.7 Figure 1 illustrates the evolution of
standard hours and actual hours per worker in the Finnish manufacturing industry from
1960 to 1996. The permanent gap between standard hours and actual hours per worker
is mainly due to sickness and parental leaves. The rapid fall in actual hours per worker
during the great slump of the early 1990s is a consequence of sweeping layoffs. The
relationship of standard hours and actual hours per worker in other sectors of economy is
not known, but there is no particular reason to think that firms could use overtime as a
long-term arrangement in the other sectors of the economy. The reason is that a permanent
increase in overtime is due to the high overtime premia: a far too expensive way to adjust
labour input from the point of view of firms. Thus, the (minimum) premium for daily overtime
is 50% for the first two hours and 100% for each following hour in Finland. The premium
for weekly overtime is 50%, irrespective of the number of hours.8
Table 1. Standard annual hours for full-time manufacturing workers in selected countries,
1995 (Hunt 1998).
Country Standard annual hours Percent change, 1984–1995
Finland 1716 -5.9Denmark 1672 -7.9Sweden 1808 0.0Norway 1725 -6.7Western Germany 1602 -9.0France 1755 -1.6Portugal 1882 -7.1United Kingdom 1762 -1.3United States 1896 -0.1

37
Table 2. The description of the variables and their sources. “Direct taxes / household
income” (TAXW1) and “Indirect taxes / consumption expenditures” (TAXW2) are not
sectoral variables. The sectoral variation in the tax wedge (TAXWEDGE = TAXW1 +
TAXW2 + TAXW3) is totally generated by “social security contributions / wages”
(TAXW3).9
Variable Source
Value added in basic values (Q) National Accounts
Direct taxes / household income (TAXW1) National AccountsIndirect taxes / consumption expenditures (TAXW2)Social security contributions / wages (TAXW3)
TAXWEDGE = TAXW1 + TAXW2 + TAXW3
Performed working hours (WH) National Accounts
Employed persons (NI) National Accounts
Gross capital formation (K) National Accounts
Figure 1. An evolution of employment (thousand persons, left-hand scale), and standard
hours and annual actual average working hours (right-hand scale) in manufacturing from
1960 to 1996 (Source: The Confederation of Finnish Industry and Employers & National
Accounts).
350
400
450
500
550
600
1960 1970 1980 1990
1500
1600
1700
1800
1900
2000
2100
Employment Actual hours Standard hours
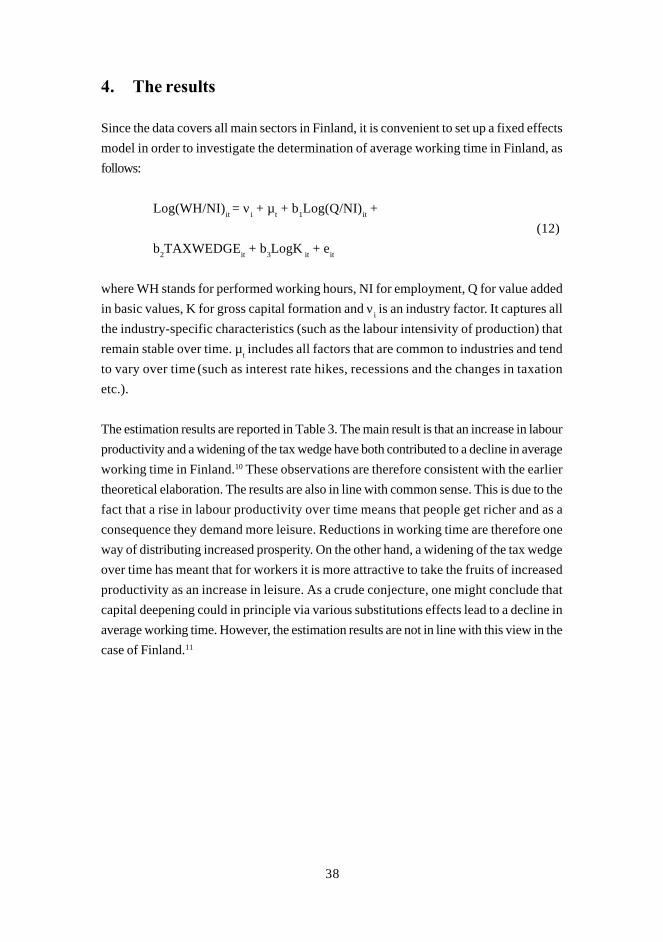
38
4. The results
Since the data covers all main sectors in Finland, it is convenient to set up a fixed effects
model in order to investigate the determination of average working time in Finland, as
follows:
Log(WH/NI)it = νi + µt + b1Log(Q/NI)it +
(12)
b2TAXWEDGEit + b3LogK it + eit
where WH stands for performed working hours, NI for employment, Q for value added
in basic values, K for gross capital formation and νi is an industry factor. It captures all
the industry-specific characteristics (such as the labour intensivity of production) that
remain stable over time. µt includes all factors that are common to industries and tend
to vary over time (such as interest rate hikes, recessions and the changes in taxation
etc.).
The estimation results are reported in Table 3. The main result is that an increase in labour
productivity and a widening of the tax wedge have both contributed to a decline in average
working time in Finland.10 These observations are therefore consistent with the earlier
theoretical elaboration. The results are also in line with common sense. This is due to the
fact that a rise in labour productivity over time means that people get richer and as a
consequence they demand more leisure. Reductions in working time are therefore one
way of distributing increased prosperity. On the other hand, a widening of the tax wedge
over time has meant that for workers it is more attractive to take the fruits of increased
productivity as an increase in leisure. As a crude conjecture, one might conclude that
capital deepening could in principle via various substitutions effects lead to a decline in
average working time. However, the estimation results are not in line with this view in the
case of Finland.11

39
5. Concluding remarks
The determination of average working time in Finland was studied by means of annual
data from six industries from 1960 to 1996. As a starting point for the empirical investigation
we formulated a simple model of average working time determination. The basic idea of
the model is that higher incomes and higher taxes induce working time reduction in the
context of a Nordic welfare state. The main empirical result is that both an increase in
labour productivity and a widening of the tax wedge have indeed contributed to a decline
in average working time in Finland. These observations are therefore consistent with the
predictions of a theoretical model that is based on the notion of equilibrium working hours
and provide a coherent explanation for the decline in average working time in Nordic
welfare states during the past few decades.
References
Bell L.A. and Freeman, R.B. (2001), ”The Incentive for Working Hard: Explaining Hours
Worked Differences in the U.S. and Germany”, Labour Economics, 8: 181–202.
Contensou F. and Vranceanu, R. (2000), Working Time. Theory and Policy Implications,
Cheltenham: Edward Elgar.
Table 3. The estimation results of the fixed effects model for average working time in
Finland, from 1960 to 1996 (dependent variable: average working time). The estimated
model includes the year dummies and a constant.
Variables Coefficients t-statistics
Log(Q/NI) -0.034 -2.38TAXWEDGE -0.392 -3.57LogK 0.013 1.73
R2 0.86F(39, 177) 27.17Number of observations 216

40
Evans J.M., Lippoldt, D.C. and Marianna, P. (2001), ”Trends in Working Hours in OECD
Countries”, Labour Market and Social Policy – Occasional Papers 45. OECD.
Hjerppe R. (1989), The Finnish Economy 1860–1985, Helsinki: Government Printing
Centre.
Holm P. and Kiander, J. (1993), “The Effects of Work-sharing on Employment and
Overtime in Finnish Manufacturing 1960–1987”, Applied Economics, 25: 801–810.
Hunt J. (1998), “Hours Reductions as Work-sharing”, Brookings Papers on Economic
Activity, 1: 339–381.
Ilmakunnas P. (1995), “Working Time and Labour Demand in Finnish Manufacturing:
Short Run and Long Run Effects”, Applied Economics, 27: 995–1002.
Jacobson T. and Ohlsson, H. (1996), “Working Time, Employment, and Work Sharing:
Evidence from Sweden”, Working Paper Series in Economics and Finance 135. Stock-
holm School of Economics.
Johansen S. (1995), Likelihood-based Inference in Cointegrated Vector Autoregressive
Models, Oxford: Oxford University Press.
Layard R., Nickell, S. and Jackman, R. (1991), Unemployment. Macroeconomic
Performance and the Labour Market, Oxford: Oxford University Press.
Maddison A. (1995), Monitoring the World Economy, 1820–1992, Paris: OECD.
Pencavel J. (1986), “Labour Supply of Men: A Survey”. In Ashenfelter, O. and Layard,
R. (eds.) Handbook of Labour Economics, Vol. 1. Amsterdam: North-Holland, 3–102.
Santamäki-Vuori T. and Parviainen, S. (1996), ”The Labour Market in Finland”, Studies
64. Labour Institute for Economic Research.
Voth H.-J. (2000), Time and Work in England 1750-1830, Oxford: Clarendon Press.

41
1 In German manufacturing industries a 35-hour week was adopted in the 1980s as a resultof negotiations between unions and employers. In France, a 35-hour week has been legallyenforced in order to alleviate the unemployment. Hunt (1998) provides a detailed discussionof work-sharing across industrialized countries.
2 See e.g. Pencavel (1986).
3 Bell and Freeman (2001) argue that workers choose hours of work in order to gainpromotions and advance in the distribution of earnings. This means that the more unequallydistributed U.S. earnings generate more hours than the German earnings distribution.
4 Unfortunately, it is not possible to include in an empirical investigation variables thatcapture the composition of the labour force in Finland. This is due to the fact that the studytakes a long-term view on average working time from 1960 to 1996 based on NationalAccounts. Employment Statistics by Statistics Finland, which includes detailed informationabout the composition of the labour force, was created in 1987. Thus, the motivation for anapplication of the representative agent framework can be strengthened by the fact that theempirical part of the study cannot take into account the composition of the labour force inFinland. This means that an application of the representative agent framework in thetheoretical part of the study is indeed consistent with the following empirical investigationof the study.
5 SIC refers to Standard Industry Classification.
6 In other words, we use actual average working hours as a proxy variable for standardhours.
7 However, an application of Johansen’s (1995) procedure reveals that the log of standardhours and the log of actual working hours per worker in Finnish manufacturing are notcointegrated variables. This result is not generated purely by the observations from thegreat slump of the early 1990s. Jacobson and Ohlsson (1996) have investigated the long-run relationship of standard hours and actual hours per worker in the case of the Swedishprivate sector from 1963:1–1993:4. They concluded that the log of standard hours and thelog of actual hours per worker are cointegrated variables.
8 Santamäki and Parviainen (1996) provide a detailed description of the Finnish labourmarkets.
9 Layard, Nickell and Jackman (1991) prefer this specification.
10 The results are almost identical in the case of the random effects model with respect toreported ones.
11 The specification of capital deepening as log(K/NI) yields the coefficient 0.020 withcorresponding t-statistics of 2.51. This observation provides support to the perspective thatcapital deepening has produced an increase in average working time in Finland. The rest ofthe estimation results remain the same.
42
Overtime in Finland*
Petri Böckerman**
*I am grateful to Mika Haapanen, Pekka Ilmakunnas, Reija Lilja and Ralf Ramm-Schmidt
for comments. I am grateful to Reijo Marjanen for the information about the data. I would
like to thank two anonymous referees and the editor for valuable comments and suggestions
that have greatly improved the study. Paul A. Dillingham has kindly checked the language.
The usual disclaimer applies.
**Labour Institute for Economic Research, Pitkänsillanranta 3A, FIN–00530 Helsinki,
Finland
Abstract
The study is about the incidence of overtime hours in Finland. The investigation uses
individual-level data from the manufacturing industries from 1989 to 1995. The results
show that the hours of overtime divided by the number of total hours decline as an employee
ages. The overtime hours decline in wage per straight-time hours and in straight-time
hours. Males and newcomers tend to work more overtime, but leavers work less overtime.
The overtime hours are definitely more frequent in the population of small establishments.
The degree of tightness in regional labour markets had no overall impact on the incidence
of overtime from 1991 to 1995. There are strong industry effects.
JEL-code: J22
Keywords: working hours, overtime, manufacturing

43
1. Introduction
Despite the persistent unemployment in Europe, there are also a great number of employees
that perform overtime hours. This same discrepancy is evident in Finland, where the
unemployment rate has been at a high level despite the recovery from the great slump of
the early 1990s.1 At the same time, there has been a rise in overtime hours in Finland. The
total hours of work consist of two major components. The so-called standard hours are
determined by binding collective agreements. On the other hand, the overtime hours are
determined at the individual level of the economy. Thus, the hours of overtime can vary
from individual to individual for a variety of reasons.
However, the underlying empirical incidence of overtime hours has not been focused
upon by labour market research in Europe.2 The aim of this study is to characterize the
incidence of overtime hours in Finland by using unique individual-level data from
manufacturing industries from 1989 to 1995. The study also sheds light on the incidence
of overtime induced by the heterogeneity of establishments. In addition, the study considers
the impact of the degree of tightness in regional labour markets on overtime hours. This
empirical investigation fills therefore a gap in the existing Finnish literature on working-
time issues.
The study appears in six sections. The first section of the study clarifies the key conceptual
questions and provides selected theoretical considerations of the issue of overtime hours.
The most important elements of overtime regulation by the Finnish institutions are also
discussed. The second section provides a brief snapshot of earlier empirical investigations
into the issues of overtime hours in Europe. Thus, the motivation of the selected variables
in the estimated overtime equation is based on previous literature on the incidence of
overtime hours at the individual level. In addition, an elaboration is focused on the available
Finnish studies on the hours of work in the manufacturing industries. The third section
provides a description of the individual-level data. The fourth section includes a
characterization of paid overtime hours in a nutshell by illustrating the distributions of the
most important variables and by applying a kernel-density estimation. The fifth section
provides an analysis of the incidence of overtime hours by applying regression techniques.
In particular, the study includes a consideration of establishment characteristics on the
incidence of overtime hours at the individual level, which has been a largely neglected
issue in the earlier literature on overtime hours. The last section concludes.

44
2. Background
The appearance of overtime hours can be explained by following Bauer and Zimmermann
(1999). Firms use overtime hours (in other words, the intensive margin of labour utilization in
contrast to the extensive margin of labour utilization), because of the presence of the quasi-
fixed cost of employment, i.e. hiring and training costs and various employee benefits that are
related to employment but not to performed working hours. In practice, firms can utilize overtime
hours in different ways. There are two major types of overtime. The so-called transitory overtime
hours are compensated for with free time for the employees involved. In this case, overtime
hours are often used in order to increase the flexibility of a firm’s operations. On the other
hand, there are definite overtime hours which are not compensated for with free time. These
definite overtime hours can further be divided into paid and unpaid overtime.
The literature usually focuses only on the paid definite overtime hours. This study is not an
exception, because there is no information on the number of unpaid overtime hours in the
Finnish manufacturing industries. The focus of the study on the incidence of the overtime
hours of manual workers means that the exclusion of unpaid overtime hours is not a
severe problem. This is due to the fact that, among manual workers, there are hardly any
incentives to perform unpaid overtime hours. Bell et al. (2000) provide various reasons
for performing unpaid overtime hours. The reasons (for example, the conjecture that unpaid
overtime work represents a form of gift exchange à la Akerlof) point out that the incidence
of unpaid overtime should be much more common among non-manual workers. However,
the information compiled by Statistics Finland (1995) indicates that there was an increase
in unpaid overtime hours during the great slump of the early 1990s.
Employers usually pay a substantial overtime premium. Hart and Ma (2000) provide a
recent theoretical investigation into the presence of an overtime premium. The model
indicates that the wage premium serves to achieve contract efficiency within the framework
of asymmetric information. The result is based on the notion that with both extensive and
intensive margins of labour utilization, the wage rate alone cannot be set to achieve both
optimal separation and optimal worker utilization. Thus, the presence of an overtime
premium provides an additional instrument that can solve the problem.
The productivity of performed overtime hours is an important element that affects the
demand for overtime hours by firms. Ilmakunnas (1994) provides empirical evidence
about the productivity of overtime hours for the Finnish manufacturing industries based on
national accounts. The results indicate that the productivity of overtime hours is about the
same as that of standard hours.

45
There is a potential role for establishment characteristics in the incidence of overtime
hours. In particular, small establishments should use more overtime hours. This observation
would be consistent with one of the well-known stylized features in the industrial
organisation literature, which states that the variance of growth rates in employment, sales
or some other key measures of economic activity tend to decline with the size of an
establishment (see Caves 1998). Thus, small establishments should utilize more overtime,
because they encounter more volatility in demand and production.
The institutional setup of the Finnish labour markets is relevant for the regulation of working
time and for the overtime compensation schemes. Labour market policy is the result of a
close and long-term interplay between organised agents and the government. In fact,
Finland provides an example, par excellence, of a corporatist political and economic
system (see, for example, Vartiainen 1998). The regulation of working time in Finland is
therefore based on the Working Hours Act, which is prepared on a tripartite basis (Santa-
mäki-Vuori and Parviainen 1996). This means that representatives of employers, employees
and government are involved in the reforms of the Working Hours Act. The Working
Hours Act is a general law, supplemented in many sectors by more specific acts. Under
the Act, there are upper limits of 8 regular working hours per day and 40 per week.3
According to the Working Hours Act, overtime comprises the time in excess of the regular
hours, on either a daily or weekly basis. If the latter is used, overtime on individual days
is not counted. Employees must also be paid extra for overtime hours in Finland. The
(minimum) premium for daily overtime is 50% for the first two hours and 100% for each
following hour. The premium for weekly overtime is 50%, irrespective of the number of
hours.
3. Previous related studies
There are some empirical investigations into the issues of overtime hours. In particular,
Green and McIntosh (2001) provide evidence on the intensification of labour effort in
Europe. This snapshot of the existing literature is focused on the studies that look at the
incidence of overtime hours at the individual-level of the economy.
The unregulated UK labour markets provide an interesting opportunity to investi-gate the
incidence of overtime hours. Bell and Hart (1999) provide an analysis of the incidence of
overtime hours in the UK by applying individual-level data on male non-managerial workers.
The results can be summarized as follows. The straight-time wage exerts a negative influence
on overtime incidence, which is consistent with an income effect. An increase in overtime

46
hours at the individual level as the wage per straight-time hours rises would be consistent
with the notion of the substitution effect. Straight-time weekly hours are also negatively
related to the incidence of overtime hours. The number of overtime hours rises with age
up to the late 40s before declining. Thus, there is an inverted U-profile. Central and local
government workers work significantly fewer weekly overtime hours compared with the
private sector workers, which is in line with the notion that various production fluctuations
are more frequent in the private sector of the economy.4 In addition, the results indicate
that collective bargaining agreements succeed in reducing straight time while raising
overtime hours with respect to uncovered workers.5 This feature enchances the covered/
uncovered wage differential in the UK. Green (2001) reports that the dispersion of working
hours has indeed recently increased in the UK. Thus, working hours have been
concentrated in fewer households.
Bell et al. (2000) observe that the quantitative significance of both paid and unpaid overtime
is greater in the UK with respect to Germany. They present overtime hours equations by
applying the Tobit estimating procedure. The results indicate that paid overtime is more
common among manual workers. In addition, the study includes company size as a potential
factor in explaining overtime hours. Based on a priori reasoning, it would be expected
that larger firms would more typically formalise their work arrangements. This is done in
an effort to reduce various transaction costs associated with operations. Larger firms
should therefore use more paid overtime hours, but fewer unpaid overtime hours due to
more formal work arrangements. However, the empirical results by Bell et al. (2000) are
mixed in this respect and do not provide solid evidence for the hypothesis that the share
of paid overtime hours is higher among large firms.
A well-known empirical regularity says that overtime hours rapidly adjust to the scale of
economic activity.6 Hart (2001) provides an elaboration of overtime hours based on a
panel of 28 local labour markets for the period 1926-1938. The results reveal that the
British engineering industry adjusted to the severe falls in demand during the 1930s by
cutting the hours of work. Kalwij and Gregory (2000) investigate the issue of overtime
hours in Great Britain during the period from 1975 to 1999. The study indicates that as in
a number of other countries the incidence of overtime indeed shows a distinct procyclical
movement during the period of investigation. The easiest way to capture this feature of
overtime hours is simply to introduce year dummies into the estimated overtime equations.7
Working time issues have been debated in Germany. Thus, there are studies of overtime
hours with German data. Bauer and Zimmermann (1999) provide a detailed elaboration
of overtime hours in Germany by applying individual-level data. The estimated overtime

47
equations are similar Tobit specifications, as in the investigation by Bell and Hart (1999).
The results reveal that individuals working in small firms have a higher probability of
working overtime hours. Levels of skill play an important role in the incidence of overtime
hours. In particular, skilled blue-collar workers are more likely to work overtime than
unskilled blue-collar workers.8 Bauer and Zimmermann (1999) also note that the share of
overtime has declined sharply in Germany during the past few decades. Bell and Freeman
(2001) argue that workers choose hours of work in order to gain promotions and advance
in the distribution of earnings. The more unequally distributed U.S. earnings therefore
generate more overtime hours than the German earnings distribution.
The earlier empirical research on working time issues has mainly focused on one feature
of the overtime hours in Finland. Thus, Holm and Kiander (1993), and Ilmakunnas (1995)
conclude that reductions in standard working time have had a slight employment-increasing
effect, but no effect on overtime hours. This means that there has been no rise in the share
of paid overtime hours within the Finnish manufacturing industries during the past few
decades (Figure 1).9 In other words, in the long run the time path of actual working hours
closely follows that of standard hours working, at least in the case of the Finnish
manufacturing industries. This is due to the fact that a permanent increase in overtime is a
far too expensive way to adjust labour input from the point of view of firms.
Figure 1. A share of overtime hours with respect to the total working time in the Finnish
manufacturing industries from 1950 to 1999 (%) (Source: The Confederation of Finnish
Industry and Employers).
1
2
3
4
5
1950 1955 1960 1965 1970 1975 1980 1985 1990 1995

48
However, there is one earlier study that applies detailed individual-level data in the elaboration
of overtime hours in the Finnish economy. Asplund (1995) has investigated the underlying
incidence of overtime hours in Finland from 1980 to 1993 by applying the same individual-
level data covering the manufacturing industries as in this study. However, the article by
Asplund (1995) does not include tabulation of the estimation results concerning the incidence
of overtime hours at the individual level. The unreported results are said to be based on
various specifications of Tobit and Probit regressions. The main focus in the investigation by
Asplund (1995) is on the underlying sectoral composition of overtime hours and the individual
characteristics in the incidence of overtime hours. The results based on the individual-level
data indicate that there are some key factors that explain most of the incidence of overtime
hours within the Finnish manufacturing industries. These factors are, by nature, rather similar
to the variables applied in the empirical studies by other countries’ data. These variables
include age (i.e. young employees tend to work more overtime hours than older ones) and
gender (i.e. men tend to work more overtime than women). The results also reveal that
newcomers tend to work more overtime than the rest of the personnel within manufacturing
firms. In addition, there was a sharp decline in overtime hours during the great slump of the
1990s in Finland. However, the study by Asplund (1995) does not include the elaboration
of establishments’ characteristics (such as the size of the establishment) as a potential element
of the underlying incidence of overtime hours in the manufacturing industries in Finland. The
effect of establishment size on the incidence of overtime hours is an interesting question to
address, because Hohti (2000) has recently discovered that there was an episode of
convergence in the actual average working hours across the size categories of establishments
within the Finnish manufacturing industries from 1990 to 1994.
4. The data
The empirical investigation is based on yearly observations from 1989 to 1995. The data
covers the manufacturing industries in the Finnish economy. This narrow focus of the
study on the manufacturing industries is dictated by the availability of data. It is a major
drawback, due to the well-known empirical regularity, that in the modern industrial
economies the contribution of manufacturing industries to GDP has declined considerably
during the past few decades. Thus, the modern economies have strongly tended to draw
away from the manufacturing industries toward the service sectors. This stylized fact of
structural change in the composition of economic activity applies to Finland.
However, despite this apparent erosion in the relative strength of the manufacturing
industries, manufacturing still represents a more important role in the Finnish economy
49
compared with most of the European countries. In addition, non-manufacturing industries
represent other forms of less stable labour relations such as part-time work and various
temporary employment contracts (see Kauhanen 2000), which can be considered to be
substitutes for the implementation of overtime hours from the point of view of firms.
The individual-level data is from the records of the Confederation of Finnish Industry and
Employers (Teollisuus ja Työnantajat, TT). Approximately 5600 companies are members
of the Confederation. These companies employ nearly 470000 persons. The member
companies account for more than 75% of the nation’s industrial value added and export
income. The data is based on the fact that each year TT conducts a survey among its
member employers and gathers detailed information on paid wages, salaries and the hours
of work of employees (see Kettunen and Marjanen 1992; Kettunen and Vartiainen 1993;
Vartiainen 1993; Asplund 1994). The sample contains all the workers who are employed
in a firm that is affiliated to TT. Year 1990 was chosen as the base year and within each
firm the workers were put in order according to their mean pay and every 15th worker
was then selected for the sample. Longitudinal data was then created from 1990 onwards
and backwards by applying unique personal codes that identify the workers of the
manufacturing industries in Finland. The applied version of the data covers the situation
during the last quarter of each year from 1989 to 1995. Thus, the data does not contain,
for example, students that work only during the summer vacations. The data contains 56
135 observations.
The individual-level data is originally from 1980 to 1995. However, in this analysis of the
incidence of overtime hours it is important to take into account the characteristics of
establishments, which are available only from 1989 onwards. Thus, the applied version of
the data in the following elaboration is from 1989 to 1995. In addition, it is important to
stress that the data is not complete linked employer-employee data, because it contains
only the size of establishment and the share of women in the establishment.
The applied variables of the analysis are summarized in Table 1. The Appendix provides
the selected descriptive statistics for the most important variables in the estimated overtime
equations. In the following analysis of the incidence of overtime hours an effort is made to
explain a share of overtime hours in the total hours of work at the individual level
(OVERTIME). The share of overtime is, by definition, a variable bounded by [0, 1].
However, the upper bound of the variable is reached if and only if an individual does not
perform standard hours of work at all, which is in practice out of the question owing to
the overtime regulations in the Finnish manufacturing industries.

50
Table 1. Descriptions of the selected variables.
Variable Definition/measurement
Individual-level characteristics:
OVERTIME Hours of overtime divided by the number of total hours
AGE Age of an employeeAGE2 AGE squaredWAGE A log of the wage of an employee divided by the
straight-time hoursWAGE2 WAGE squaredTIME Straight-time hoursTIME2 TIME squaredGENDER 1=female, 0=maleNEWCOMER Employee that was not in the industry one year
previously, 1=newcomer, 0 otherwise.LEAVER Employee that leaves the industry between this year
and the next, leaver=1, 0 otherwiseEXPERIENCE Total number of years in which the worker appears in
the applied data from 1980 to 1995. The variableprovides a crude measure of the professionality of anindividual in the manufacturing industries.
METROPOLITAN The collective agreement stipulates slightly higher pay in the metropolitan areas where the costs of living(such as housing) are presumably higher; a person isliving in the metropolitan area=1, 0 otherwise.
Establishments’ characteristics:
SIZE Size of establishment measured by the number ofemployees
SIZE2 SIZE squaredWOMEN Share of women in the establishment
Additional regional variable:
UN The regional unemployment rate (%) is for the 85Finnish subregions (the so-called NUTS4–level of theEuropean Union).
Dummy variables:
INDUSTRIES 5–1, attached to employees based on the union codeof an employee.
YEARS 7–1, from 1989 to 1995OCCUPATIONS 428–1

51
Most of the selected variables are (almost) self-evident. The variable WAGE does not
include any earnings from overtime hours, because then it would be an endogenous variable
in the overtime equation. The variable NEWCOMER captures the new employees in the
industry and the variable LEAVER captures the employees that leave the industry. It can
be argued that the newcomers and the leavers are more “volatile persons” that represent
more loose matches between employees and establishments.10 The newcomers want to
signal their high level of ability to their employers by extending the hours of overtime.
Theory suggests that overtime is a credible signal, because it is costly to the employee in
terms of lost leisure. Altonji and Paxson (1988; 1992) interpret the variable that indicates
a quit in the hours equation as an indication of the underlying feature of labour markets
that there are various hours restrictions within jobs induced by employers. This means
that the desire to reduce or increase hours could not be acted upon in the current match.
The applied variable EXPERIENCE is a crude measure of how attached an employee is
to the population of manufacturing establishments in Finland. The variable EXPERIENCE
is calculated covering the whole period from 1980 to 1995. The applied variable is an
imperfect and also downward biased measure of genuine labour market experience,
because it does not capture at all employees’ experience outside the manufacturing
industries in Finland.
There is an additional regional variable from 1991 to 1995, namely, the regional
unemployment rate (UN). In principle, there are two basic hypotheses concerning the
effect of the regional unemployment rate on the incidence of overtime hours. The first
hypothesis is based on the notion that the regional unemployment rate can be considered
to be a proxy variable for local demand conditions. In other words, strong local demand
for products of manufacturing industries could deliver a low level of unemployment and a
high level of hours of overtime at the same time. However, this hypothesis is not on solid
foundations, because most of the manufacturing industries are not selling their final products
to the region in which they are located. The second hypothesis, which is more appealing,
stipulates that the regional unemployment rate is an indicator of the degree of tightness in
regional labour markets. In other words, a low level of regional unemployment could then
be associated with a shortage of labour resources and deliver a strong demand for overtime
hours at the establishment-level of the economy.
The applied data contains no industry classification as such. However, by using the code
that delivers the information about the attachment of the employee to the collective
agreements it is possible to create good proxies for the industry dummies. The industries
of this study are as follows: (i) metal industries, (ii) textile industries, (iii) apparel industries,
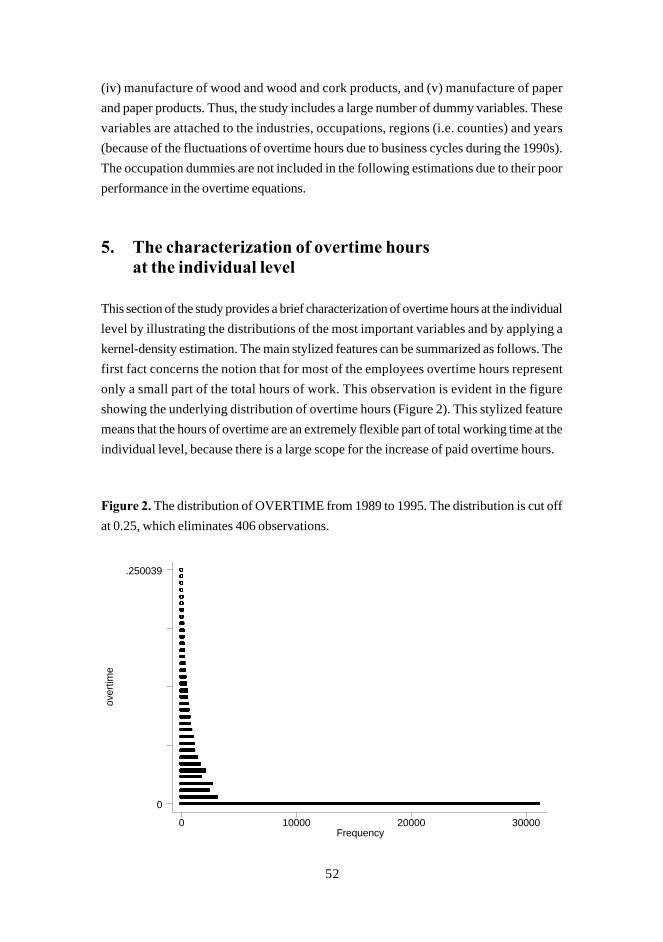
52
(iv) manufacture of wood and wood and cork products, and (v) manufacture of paper
and paper products. Thus, the study includes a large number of dummy variables. These
variables are attached to the industries, occupations, regions (i.e. counties) and years
(because of the fluctuations of overtime hours due to business cycles during the 1990s).
The occupation dummies are not included in the following estimations due to their poor
performance in the overtime equations.
5. The characterization of overtime hoursat the individual level
This section of the study provides a brief characterization of overtime hours at the individual
level by illustrating the distributions of the most important variables and by applying a
kernel-density estimation. The main stylized features can be summarized as follows. The
first fact concerns the notion that for most of the employees overtime hours represent
only a small part of the total hours of work. This observation is evident in the figure
showing the underlying distribution of overtime hours (Figure 2). This stylized feature
means that the hours of overtime are an extremely flexible part of total working time at the
individual level, because there is a large scope for the increase of paid overtime hours.
over
time
Frequency0 10000 20000 30000
0
.250039
Figure 2. The distribution of OVERTIME from 1989 to 1995. The distribution is cut off
at 0.25, which eliminates 406 observations.

53
In other words, according to the data, overtime compensation from 1989 to 1995 covers
on average only about 1.8% of the total salary of manual workers in the Finnish manufacturing
industries.11 Thus, it seems reasonable to relate the incidence of overtime hours to various
measurable characteristics held by individuals and establishments. The limited use of overtime
means that there must be certain underlying economic fundamentals that give rise to the
utilization of overtime hours and determine the distribution of overtime among individuals.
This feature of overtime hours also means that the various reforms of taxation that affect the
supply of hours of work should have a large impact on overtime hours.
The distributions of the share of the overtime hours at the individual level tend to give support
to the notion that the share of overtime is negatively related to the age of an employee within
the Finnish manufacturing industries (Tables 2a–2b). This pattern seems to be in contrast
with a number of earlier empirical studies on the incidence of overtime hours that have found
an inverted U-shape relation of overtime hours in terms of age in the European labour
Table 2a. The distribution of share of overtime hours across AGE groups.
AGE groups 15–30 31–45 46–65
Mean 0.03090 0.02870 0.0237525th percentile 0 0 050th percentile 0 0 075th percentile 0.04270 0.03797 0.0297095th percentile 0.13805 0.13514 0.11688Number of observations 12 223 28 266 18 945
AGE groups 15–30 31–45 46–65
Mean 0.06171 0.05974 0.0541825th percentile 0.01887 0.01805 0.0161350th percentile 0.04308 0.04043 0.0367075th percentile 0.08444 0.08309 0.0752395th percentile 0.18036 0.17684 0.15777Number of observations 6 054 12 885 7 258
Table 2b. The distribution of share of overtime hours across AGE groups for the population
of employees who have performed overtime hours.

54
markets. However, Graversen and Smith (1998) document the inverted U-profile in terms
of age for Danish men, but are unable to find it for Danish women.
Stewart and Swaffield (1997) provide an explanation for an inverted U-shape pattern of
overtime hours with respect to age, which is based on the notion that over a third of
manual workers in the UK would prefer to work fewer hours at the prevailing wage than
they do. The inverted U-profile of overtime hours can therefore be rationalized as a result
of deviations between desired and actual hours, i.e. employees are forced to work more
hours than they want to because of institutional forces, job insecurity etc. Steward and
Swaffield (1997) further argue that the fact that the age profile of desired hours is not
matched by that in actual hours means that employers set constraints of hours above
employee preferences. Ilmakunnas (1997) provides evidence that there exist a great
number of disparities in desired and actual hours of work even in Finland.12
The share of the overtime hours at the individual level seems to be positively related to the
variable WAGE (Tables 3a–3b). The distributions suggest that the overtime hours tend
to rise at the individual level as the wage per straight-time hours rises, which is consistent
with the notion of the substitution effect. Graversen and Smith (1998) observe the positive
association for Danish workers between overtime hours and wage per straight-time hours.
Finally, the share of the overtime hours seems to be negatively related to the size of the
establishment (Tables 4a–4b). Thus, there is preliminary evidence that the employees in
the population of small establishments tend to work more overtime than the rest of the
workers in the manufacturing industries in Finland.13
Table 3a. The distribution of share of overtime hours across WAGE groups.
WAGE groups 7.65–8.5 8.51–9.0 9.1–11.8
Mean 0.01298 0.03351 0.1367725th percentile 0 0 0.0047250th percentile 0 0.00645 0.1042075th percentile 0.01220 0.05048 0.2262895th percentile 0.07356 0.14113 0.39098
Number of observations 22 769 30 224 887

55
Table 3b. The distribution of share of overtime hours across WAGE groups for the
population of employees who have performed overtime hours.
WAGE groups 7.65–8.5 8.51–9.0 9.1–11.8
Mean 0.03814 0.06147 0.1781425th percentile 0.01124 0.02041 0.0681350th percentile 0.02778 0.04511 0.1574475th percentile 0.05328 0.08811 0.2612195th percentile 0.11111 0.16901 0.41304
Number of observations 7 751 16 475 681
Table 4a. The distribution of share of overtime hours across SIZE groups.
SIZE groups 1–20 21–100 101–200
Mean 0.02793 0.02735 0.0234425th percentile 0 0 050th percentile 0 0 075th percentile 0.03562 0.03793 0.0322695th percentile 0.13636 0.12453 0.10972
Number of observations 30 779 21 533 3 756
Table 4b. The distribution of share of overtime hours across SIZE groups for the population
of employees who have performed overtime hours.
SIZE groups 1–20 21–100 101–200
Mean 0.06216 0.05581 0.0485125th percentile 0.01786 0.01778 0.0172450th percentile 0.04167 0.03904 0.0339075th percentile 0.08571 0.07818 0.0661295th percentile 0.18505 0.16117 0.14504
Number of observations 13 829 10 553 1 815

56
The distribution of straight-time hours reveals additional features. Thus, Figure 3 depicts
the kernel-density estimate of straight-time hours from 1989 to 1995.14 The applied variable
TIME does not match the definition of so-called standard hours stipulated by the collective
agreements in the Finnish manufacturing industries. The reason is that the data covers
manual workers that have worked only a part of the last quarter from 1989 to 1995.
Thus, the data contains, for example, workers that have had sick leaves during the period
of the sample. The temporary employment contracts associated with Christmas holidays
are an additional reason for the fact that the variable TIME does not correspond to stan-
dard hours during the last quarters.
Figure 3. Kernel density estimate for TIME from 1989 to 1995.
Den
sity
.time
-8.96183 836.962
4.8e-07
.005207

57
6. The results
Because the share of overtime is, by definition, a variable bounded by (0, 1), it is convenient
to estimate a Tobit specification following the recent empirical studies by Bauer and
Zimmermann (1999), and Bell and Hart (1999) as follows:
(1) OVERTIMEi = β’Xi + εi if β’Xi + εi > 0
0 if β’Xi + εi 0,
where the dependent variable OVERTIMEi refers to the share of overtime hours with respect
to the individual i, Xi is a vector of explanatory variables, β is a vector of the estimated
coefficients, and εi is a normal distributed error term with mean 0 and variance σ2.
The estimation results are summarized in Table 5. The results reveal that the hours of
overtime divided by the number of total hours decline as an employee ages.15 The overtime
hours tend to decline at the individual-level as the wage per straight-time hours rises. This
negative effect from wage per straight-hours to overtime hours is an indication of the
income effect. However, a specification of the overtime equation that includes regional
dummies (reported as Model 2 in Table 5) implies that there is, in fact, an increase in the
share of overtime hours as the wage per straight-time rises, which is indeed consistent
with a substitution effect. An increase in the straight-time hours gives a mild decline in the
overtime hours. The Finnish results are therefore in line with the observations by Bell and
Hart (1999) that straight-time weekly hours are negatively related to the incidence of
overtime hours in the UK.
–<

58
Table 5. The results from Tobit regressions (dependent variable: OVERTIME).
Model 1 Model 2Coefficients t-statistics Coefficients t-statistics
AGE 0.00118 2.33 0.00121 2.41AGE2 -0.02087 -3.35 -0.02028 -3.28WAGE 0.69359 6.96 0.38551 3.89WAGE2 -2.88209 -4.90 -0.98603 -1.68TIME 0.00027 11.65 0.00027 11.79TIME2 -0.00386 -5.12 -0.00388 -5.19GENDER -0.00707 -6.98 -0.00621 -6.07NEWCOMER 0.01700 12.74 0.01620 12.34LEAVER -0.00368 -3.01 -0.00353 -2.91EXPERIENCE -0.00114 -10.91 -0.00122 -11.41METROPOLITAN 0.00001 0.08 -0.00331 -0.69
SIZE -0.00025 -23.86 -0.00026 -15.39WOMEN -0.00014 -2.21 -0.00011 -1.75
Constant 2.60830 3.01 -0.31172 -0.36
Dummy variables:
INDUSTRIES Yes Yes
YEARS Yes Yes
OCCUPATIONS No No
REGIONS No Yes
Log-likelihood 14518.8 15906.1
Observations 55 896 55 896
Censored observations 29 776 29 776
The observation that a decline in straight hours would lead (other things being equal) to an
increase in overtime hours is not favourable to the conduct of work-sharing in the Finnish
manufacturing industries.16 However, the variation in the variable TIME comes, in addition

59
to negotiated working-time reductions, from part-time work, absence due to sick leaves,
holidays etc., and from the inclusion of the employees that are newcomers and leavers
during the last quarters.17
Males work more overtime.18 The reason can be the division of labour within families.
Thus, families like to extend the hours of work by males, because males typically have
higher hourly wage prospects. Females often have looser connections to the labour mar-
ket in Finland too, at least during their childbearing years, when they, to a larger extent
than males, work part-time or are out of the labour force (for example, due to maternity
leaves).19
Newcomers tend to work more overtime, but leavers work less overtime. The results are
therefore in line with the notion that newcomers want to signal their high level of ability to
their employers by extending the hours of overtime. The observation that leavers work
less overtime is in line with the conjecture that a decline in overtime hours could serve as
a signal that the employee is about to separate from the current match. The results
concerning newcomers and leavers mean that the enormous magnitude of gross worker
flows in the economies can perhaps partly be explained by the fact that there are hours
restrictions within jobs induced by employers.20 More experienced employees tend to
work fewer overtime hours in the Finnish manufacturing industries. An explanation of this
feature of the incidence of overtime hours could be that senior workers tend to work
more unpaid overtime, because they occupy higher positions within establishments. The
variable METROPOLITAN is not a statistically significant factor to explain the incidence
of overtime hours.
As to the establishment characteristics, the hours of overtime are definitely more frequent
in the population of small establishments in the Finnish manufacturing industries.21 This
particular observation is consistent with a stylized feature that was discussed earlier,
according to which the variance of growth rates in the measures of economic activity tend
to decline with the size of an establishment. Small establishments therefore utilize more
overtime due to the fact that they encounter more volatility in demand and production.
The following focuses more closely on this establishment size effect by using different
specifications and illustrating how this effect interacts with economic factors. The estimation
results indicate that there is no empirical evidence for the presence of a quadratic effect
for the establishment size within the manufacturing industries in Finland (reported as Model
3 in Table 6). Thus, the simple linear specification of the overtime equation captures the
effect.
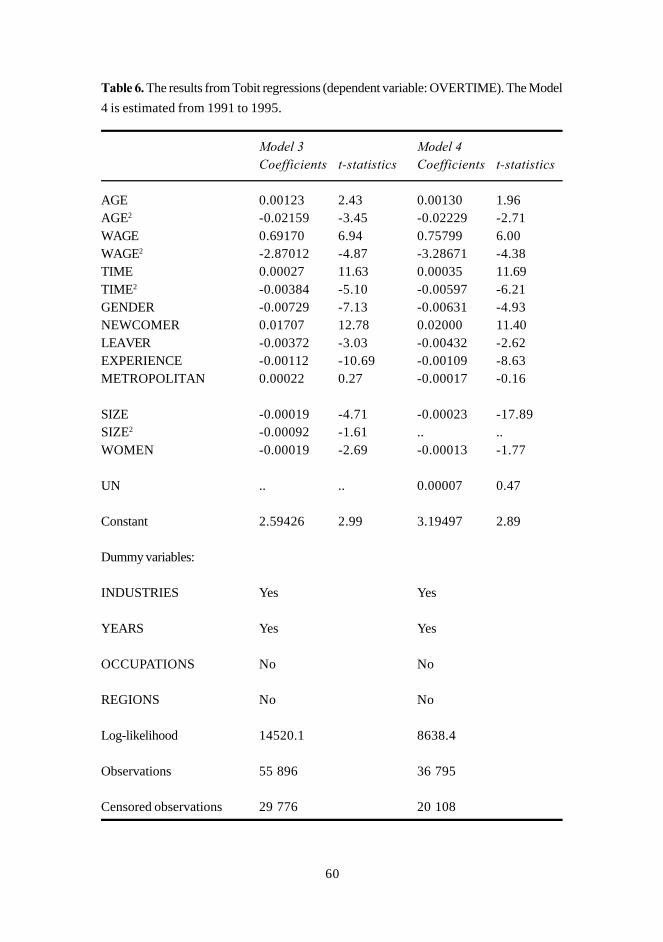
60
Table 6. The results from Tobit regressions (dependent variable: OVERTIME). The Model
4 is estimated from 1991 to 1995.
Model 3 Model 4Coefficients t-statistics Coefficients t-statistics
AGE 0.00123 2.43 0.00130 1.96AGE2 -0.02159 -3.45 -0.02229 -2.71WAGE 0.69170 6.94 0.75799 6.00WAGE2 -2.87012 -4.87 -3.28671 -4.38TIME 0.00027 11.63 0.00035 11.69TIME2 -0.00384 -5.10 -0.00597 -6.21GENDER -0.00729 -7.13 -0.00631 -4.93NEWCOMER 0.01707 12.78 0.02000 11.40LEAVER -0.00372 -3.03 -0.00432 -2.62EXPERIENCE -0.00112 -10.69 -0.00109 -8.63METROPOLITAN 0.00022 0.27 -0.00017 -0.16
SIZE -0.00019 -4.71 -0.00023 -17.89SIZE2 -0.00092 -1.61 .. ..WOMEN -0.00019 -2.69 -0.00013 -1.77
UN .. .. 0.00007 0.47
Constant 2.59426 2.99 3.19497 2.89
Dummy variables:
INDUSTRIES Yes Yes
YEARS Yes Yes
OCCUPATIONS No No
REGIONS No No
Log-likelihood 14520.1 8638.4
Observations 55 896 36 795
Censored observations 29 776 20 108

61
In order to investigate the business cycle effects, the relationship of overtime hours and
the size of an establishment were estimated separately for each year from 1989 to 1995
(Table 7). The year 1991 constituted the bottom of the great Finnish slump of the early
1990s measured by the net rate of employment change. The results therefore reveal that
the observation that overtime hours decline in the size of an establishment also held during
the great depression.
Table 7. The results from Tobit regressions (dependent variable: OVERTIME). The Tobit
regressions are estimated separately for each year from 1989 to 1995. To save space
only the estimated coefficients for the variable SIZE are shown. (The detailed results are
available from the author upon request.) The control variables are the same (excluding
year dummies) as the ones in Model 1 reported in Table 5.
Variable Coefficient t-statistics Number ofobservations
SIZE (year=1989) -0.00033 -13.59 9 868
SIZE (year=1990) -0.00023 -8.62 9 233
SIZE (year=1991) -0.00013 -4.31 8 155
SIZE (year=1992) -0.00018 -5.78 7 399
SIZE (year=1993) -0.00030 -9.71 6 799
SIZE (year=1994) -0.00036 -13.57 7 129
SIZE (year=1995) -0.00024 -8.20 7 313
However, the conclusion based on the 95% confidence intervals of the estimated
coefficients of the variable SIZE indicates that the effect of establishments’ size on overtime
hours was slightly milder at the bottom of the slump of the early 1990s than before and
after the depression. This feature of adjustment means that the population of small
establishments tailored labour input downwards proportionally more via reducing the hours
of overtime during the great slump of the early 1990s. This pattern of overtime hours is
consistent with an earlier observation by Hohti (2000) for the Finnish manufacturing

62
industries, according to which there was an episode of convergence in the actual average
working hours across the size categories of establishments from 1990 to 1994. An
explanation for this feature of overtime is that the hours of overtime are, for small
establishments, a natural starting point when downsizing labour input, owing to the smallness
of these establishments in terms of aggregate employment when slumps occur. Thus, the
stylized feature that paid overtime hours are more common among small establishments
does not collapse during times of extreme economic slowdown, and the magnitude of this
effect has definitely been procyclical from 1989 to 1995. These observations mean that
the small plants seem to react differently to variations in product demand, which mostly
varies with time.
The establishments that have less than twenty employees were omitted from the data, but
the result according to which overtime hours are more common among small establishments
remained.22 In this case, the estimated coefficient for the variable SIZE is -0.00010 with
corresponding t-statistics of -6.92.23 Thus, the stylized feature according to which overtime
hours are more common among small establishments is not driven by the smallest plants,
either.
The overtime equation was estimated separately for the five industries of this study (Table
8). The estimations reveal that overtime hours are more common among small
establishments within the metal industries, the manufacture of wood and wood and cork
products, and the manufacture of paper and paper products that constitute the major
parts of the Finnish manufacturing industries. In contrast, there is no relationship between
overtime hours and the size of an establishment at all within the textile industries. In addition,
within the apparel industries the hours of overtime are actually more common among
larger establishments.
The basic difference between these industries is the fact that the metal industries, the
manufacture of wood and wood and cork products, and the manufacture of paper and
paper products are more capital-intensive by nature than the textile industries and the
apparel industries. Thus, the more flexible working hours in terms of overtime hours are
used within these capital-intensive industries in order to take full advantage of
establishments’ accumulated capital stock in the volatile environment in which small
establishments are positioned.

63
Table 8. The results from Tobit regressions (dependent variable: OVERTIME). The Tobit
regressions are estimated separately for each industries of the data from 1989 to 1995.
To save space only the estimated coefficients for the variable SIZE are shown. (The
detailed results are available from the author upon request.) The control variables are the
same (excluding industry dummies) as the ones in Model 1 reported in Table 5.
Industry Coefficient t-statistics Number ofobservations
The metal industries -0.00026 -19.62 31 085
The textile industries 0.00028 1.10 2 650
The apparel industries 0.00085 3.42 2 356
The manufacture of woodand wood and cork products -0.00011 -5.70 13 342
The manufacture of paper andpaper products -0.00049 -4.48 6 463
All in all, the estimation results suggest that the preferred estimate of the SIZE effect
seems to be around 0.00025. The estimated effect is moderate by its magnitude, because
it implies that the average share of overtime hours would be 0.04 percentage points lower
in establishments that have 180 employees compared with the establishments that have
only twenty employees. The magnitude of the estimated SIZE effect is therefore nicely in
line with the distributions of overtime hours across the SIZE groups that were reported in
Tables 4a-4b.
The results further show that the regional unemployment rate has no overall role in the
determination of overtime hours (reported as Model 4 in Table 6). In other words, the
degree of tightness in regional labour markets had no impact on the incidence of overtime
hours from 1991 to 1995. The result can be rationalized by noting that the Finnish economy
experienced an extreme economic slowdown during the early 1990s. There was therefore
no shortage of employees. In fact, the regional unemployment rate has no impact on the
incidence of overtime hours even when the overtime equation is estimated separately for
the year 1995, which constituted the second year of the recovery from the great slump of
the early 1990s measured by the net rate of employment change. Thus, in this case the

64
estimated coefficient for the variable UN is -0.00020 with corresponding t-statistics of -
0.64.24 An additional reason for the fact that the regional unemployment rate had no
impact on the incidence of overtime hours is that there was an increase in the pace of
interregional migration that started in 1994 (see, for example, Pekkala and Ritsilä 2001),
which loosened the constraints given by regional labour markets.
However, an investigation of the interaction of establishment size with the regional
unemployment rate reveals an interesting pattern of adjustment in overtime hours. There
is, namely, a positive effect from the regional unemployment rate to the share of overtime
hours in the population of the small plants that have less than twenty employees (Table 9).
The result may arise at least partly due to the fact that the data of this study does not
contain variables that capture features such as the profitability of an establishment. The
population of the small plants can therefore be more profitable and thus utilize more
overtime hours despite the fact that they are located in the regions of the high unemployment
rate. Another possible interpretation is that an increase in the regional unemployment rate
yields an increase in the perception of job instability that induces workers to extend their
overtime in order to signal their commitment to their employer in the population of the
small plants. In contrast, there is a negative relationship between the share of overtime
hours and the regional unemployment rate in the population of the plants that have more
than twenty employees. In other words, these plants indeed utilize less overtime in the
regions of a high unemployment rate, which is consistent with an earlier notion that a low
level of the regional unemployment rate is associated with a shortage of labour resources
and yields a strong demand for overtime hours. The results therefore underline the feature
that the small plants react differently to regional labour market tightness.
Table 9. The results from Tobit regressions (dependent variable: OVERTIME). The Tobit
regression are estimated separately for the population of the small plants (i.e. plants that
have less than twenty employees) and for the rest of the plants from 1991 to 1995. To
save space only the estimated coefficients for the variable UN (the regional unemployment
rate) are shown. (The detailed results are available from the author upon request.) The
control variables are the same as the ones in Model 1 reported in Table 5.
Coefficient t-statistics Number ofobservations
The small plants 0.00064 2.99 19 984
The rest of the plants -0.00071 -3.21 16 135

65
The share of women in the establishment has a negative effect on the incidence of overtime
hours in the Finnish manufacturing industries. All industry and year dummies included are
statistically significant ones. Thus, there are strong industry effects. In particular, the
incidence of overtime hours is (other things being equal) more frequent in the manufacture
of paper and paper products. This notion is in line with common sense, because the
manufacture of paper and paper products is characterized by strong fluctuations in demand
and the high capital intensivity of production means that labour costs are only a minor part
of the total costs for the establishments in this industry.
For the sake of robustness, the overtime equation was estimated from 1980 to 1995
without the establishments’ characteristics. The period from 1980 to 1995 includes 150
161 observations. All other results remained the same except the feature that the estimation
covering the period from 1980 to 1995 does not give statistically significant results for the
variable LEAVER. Thus, the applied data covering the period from 1980 to 1995 is not
in line with the view that leavers tend to work fewer overtime hours in the Finnish
manufacturing industries.
The overtime equation was also estimated by including dummies in regions (i.e. counties)
of the Finnish economy. These estimation results (reported as Model 2 in Table 5) are
the same as the above except for the notion that the variables WOMEN and WAGE2
are not statistically significant in this specification of the overtime equation. The inclusion
of dummies in regions therefore dispels the notion that the share of women in the
establishment delivers a negative effect to the incidence of overtime hours in the Finnish
manufacturing industries.
7. Conclusions
The study used individual-level data based on the Finnish manufacturing industries from
1989 to 1995 to address the incidence of overtime hours. The results show that the hours
of overtime divided by the number of total hours decline as an employee ages. The overtime
hours also decline in wage per straight-time hours and in straight-time hours. The results
are broadly in line with those obtained from the empirical studies that use UK data in
overtime hours at the individual level. In addition, the estimation results show that males
and newcomers tend to work more overtime, but leavers work less overtime.
As to the establishment characteristics, the hours of overtime are definitely more frequent
in the population of small establishments. The share of women in the establishment has

66
a negative effect on the incidence of overtime hours in the Finnish manufacturing
industries. The degree of tightness in regional labour markets had no overall impact on
the incidence of overtime hours from 1991 to 1995, but the impact of the regional
unemployment rate on the incidence of overtime hours differed sharply between the
population of the small plants (i.e. plants that have less than twenty employees) and the
rest of the plants.
References
Altonji, J.G. and C.H. Paxson (1988), ”Labor supply preferences, hours constraints, and
hours-wage trade-offs.” Journal of Labor Economics 6, 254–276.
Altonji, J.G. and C.H. Paxson (1992), ”Labor supply, hours constraints, and job mobility.”
The Journal of Human Resources 27, 256–278.
Asplund, R. (1994), ”Teollisuuden työntekijöiden palkat ja inhimillinen pääoma.” (in Fin-
nish). Discussion Papers 484. The Research Institute of the Finnish Economy.
Asplund, R. (1995), ”Teollisuustyöntekijöiden ylityöt 1980-1993.” (in Finnish). Kansan-
taloudellinen aikakauskirja 91, 127–135.
Bauer, T. and K.F. Zimmermann (1999), ”Overtime work and overtime compensation in
Germany.” Scottish Journal of Political Economy 46, 419–436.
Bell, D.N.F. and R.A. Hart (1999), ”Overtime working in an unregulated labour market.”
IZA Discussion Papers 44. The Institute for the Study of Labor.
Bell, D.N.F., R.A. Hart, O. Hubler and W. Schwerdt (2000), ”Paid and unpaid overtime
working in Germany and the UK.” IZA Discussion Papers 133. The Institute for the
Study of Labor.
Bell, L.A. and R.B. Freeman (2001), ”The incentive for working hard: explaining hours
worked differences in the U.S. and Germany.” Labour Economics 8, 181–202.
Calmfors, L. and M. Hoel (1988), ”Work sharing and overtime.” The Scandinavian
Journal of Economics 90, 45–62.

67
Caves, R.E. (1998), “Industrial organization and new findings on the turnover and mobility
of firms.” Journal of Economic Literature 36, 1947–1982.
Clark, A.E. (1998), ”Measures of job satisfaction. What makes a good job? Evidence from
OECD countries.” Labour Market and Social Policy – Occasional Papers 34. OECD, Paris.
Contensou, F. and R. Vranceanu (2000), Working Time. Theory and Policy Implications.
Cheltenham: Edward Elgar.
Davis, S.J. and J. Haltiwanger (1999), “Gross job flows.” In Handbook of Labour
Economics, Vol. 3B, 2711–2805. Eds. O. Ashenfelter and D. Card. Amsterdam: North-
Holland.
DiNardo, J. and J.L. Tobias (2001), “Nonparametric density and regression estimation.”
Journal of Economic Perspectives 15, 11–28.
Eriksson, T. and S. Fellman (1995), ”Determinants of firms’ operating times – Some evidence
from firm-level data.” Discussion Papers 542. The Research Institute of the Finnish Economy.
Evans, J.M., D.C. Lippoldt and P. Marianna (2001), ”Trends in working hours in OECD
countries.” Labour Market and Social Policy Occasional Papers 45. OECD, Paris.
Graversen, E.K. and N. Smith (1998), ”Labour supply, overtime work and taxation in
Denmark.” Working Papers 98–06. Centre for Labour Market and Social Research.
Golden, L. and S. Glosser (1994), ”Average working hours as a leading economic variable
in U.S. manufacturing.” Working Papers #11–94–3–CES. The Pennsylvania State Uni-
versity, Department of Economics.
Green, F. (2001), ”It’s been a hard day’s night: The role of concentration and intensification of
work in late twentieth-century Britain.” British Journal of Industrial Relations 39, 53–80.
Green, F. and S. McIntosh (2001), ”The intensification of work in Europe.” Labour
Economics 8, 291–308.
Hamermesh, D.S. (1993), Labor Demand. Princeton: Princeton University Press.

68
Hart, R.A. (2001), ”Hours and wages in the Depression: British engineering, 1926–1938.”
Explorations in Economic History 38, 478–502.
Hart, R.A. and Y. Ma (2000), ”Why do firms pay an overtime premium?” IZA Discussion
Papers 163. The Institute for the Study of Labor.
Hohti, S. (2000), ”Job flows and job quality by establishment size in the Finnish
manufacturing sector 1980–94.” Small Business Economics 15, 265–281.
Holm, P. and J. Kiander (1993), ”The effects of work-sharing on employment and overtime
in Finnish Manufacturing 1960-1987.” Applied Economics 25, 801–810.
Hunt, J. (1998), ”Hours reductions as work-sharing.” Brookings Papers on Economic
Activity 1, 339–381.
Hunt, J. (1999), ”Has work-sharing worked in Germany?” The Quarterly Journal of
Economics CXII, 117–148.
Ilmakunnas, P. (1994), ”Returns to workers and hours in Finnish manufacturing.”
Empirical Economics 19, 533–553.
Ilmakunnas, P. (1995), ”Working time and labour demand in Finnish manufacturing: short-
run and long-run effects.” Applied Economics 27, 995–1002.
Ilmakunnas, S. (1997), ”Female labour supply and work incentives.” Studies 68. Labour
Institute for Economic Research.
Kalwij, A.S. and M. Gregory (2000), ”Overtime in Great Britain over the period 1975–1999:
a panel data analysis.” Working Papers 27/2000. University of Oxford, Department of
Economics.
Kauhanen, M. (2000), ”Määräaikaiset työsuhteet ja sosiaaliturvajärjestelmän kestävyys.”
(in Finnish). Selvityksiä, 2000:9. Sosiaali- ja terveysministeriö.
Kettunen, J. and R. Marjanen (1992), ”Suomen Työnantajain Keskusliiton palkkatilastot:
Syntyhistoria, sisältö ja käyttötarkoitus.” (in Finnish). Discussion Papers 425. The Research
Institute of the Finnish Economy.

69
Kettunen, J. and J. Vartiainen (1993), ”Suomen teollisuuden työntekijöiden palkkarakenne.”
(in Finnish). Discussion Papers 431. The Research Institute of the Finnish Economy.
Kiander, J. and P. Vartia (1996), “The great depression of the 1990s in Finland.” Finnish
Economic Papers 1, 72–88.
Lazear, E.P. (1998), ”Hiring risky workers.” In Internal Labour Markets, Incentives and
Employment, 143–158. Eds. I. Ohashi and T. Tachibanaki. London: Macmillan Press.
Maddison, A. (1995), Monitoring the World Economy, 1820–1992. Paris: OECD.
Pekkala, S. and J. Ritsilä (2001), “A macroeconomic analysis of regional migration in
Finland, 1975-95.” The Review of Regional Studies 29, 71–85.
Santamäki-Vuori, T. and S. Parviainen (1996), “The labour market in Finland.” Studies
64. Labour Institute for Economic Research.
Skans, O.N. (2001), ”The Effects of working time reductions on wages, actual hours and
equilibrium unemployment.” Working Papers, 2001:8. IFAU – Office of Labour Market
Policy Evaluation.
Statistics Finland (1995), ”Työvoiman liikkuvuus ja työelämän joustot.” (in Finnish). Labour
Market Statistics 1995:12. Helsinki.
Stewart, M.B. and J.K. Swaffield (1997), ”Constraints on the desired hours of work of
British men.” The Economic Journal 107, 520–535.
Torp, H. and E. Barth (2001), ”Actual and preferred working time. Regulations, incentives and
the present debate on working time in Norway.” Report 3:2001. Institute for Social Research.
Vartiainen, J. (1993), ”Metalliteollisuuden työntekijöiden palkanmuodostus työeh-
tosopimuksen valossa.” (in Finnish). Studies 44. Labour Institute for Economic Research.
Vartiainen, J. (1998), ”The labour market in Finland: institutions and outcomes.”
Publications Series, 1998/2. Prime Minister’s Office.
Voth, H.-J. (2000), Time and Work in England 1750–1830. Oxford: Clarendon Press.

70
Appendix
Selected descriptive statistics (from 1989 to 1995). The descriptive statistics for the
regional unemployment rate (UN) are from 1991 to 1995.
Variable MEAN STD MIN MAX
OVERTIME 0.027 0.050 0 0.93
AGE 39.5 10.1 15 65
WAGE 8.56 0.27 7.65 11.8
TIME 362.5 101.2 1 827
EXPERIENCE 10.0 4.95 1 16
SIZE 32.3 37.6 1 200
WOMEN 3.34 7.06 0 100
UN 18.3 5.7 4.8 33.4

71
1 Kiander and Vartia (1996) provide a description of the great slump of the early 1990s.
2 Contensou and Vranceanu (2000) provide an elaboration of working time issues.
3 Voth (2000) observes that there was a sharp increase in the length of average annualworking time during the early stages of industrialization in England. This trend was reversedduring the late 1800s. Maddison (1995) shows that average hours of work in advancedOECD countries fell from around 3000 hours a year in 1870 to between 1500 and 2000hours a year by 1990. Evans, Lippoldt and Marianna (2001) note that the long-term declinein average annual hours has slowed down in almost all the OECD countries in recent years.Hunt (1998) provides an international comparision of standard hours for full-timemanufacturing workers in selected industrialized countries. The shortest standard weeklyhours are performed in Western Germany, where standard weekly hours consists of 36.4hours.
4 This notion is a tautology in the case of Finland, because the output of the public sector isdefined as a sum of hours by Statistics Finland. The other reasons for the low share ofovertime hours within the public sector may include tight labour contracts and tight budgetceilings, which do not allow paid overtime hours. Overtime hours could be used even in thetotal absence of fluctuations in production, due to the fixed costs of hiring and training newemployees. Fluctuations may increase the utilization of overtime hours without increasingthe total working time if overtime hours are compensated for with time off instead ofincreased earnings. The latter case corresponds to the so-called transitory overtime hoursthat are used to increase the flexibility of a firm’s operations.
5 The consideration of collective agreements on the incidence of overtime hours in theFinnish manufacturing industries is not possible, because the binding collective agreementscover the whole of the manufacturing industries in Finland.
6 Overtime hours are sometimes used as a leading indicator of economic activity. Goldenand Glosser (1994) observe that the length of the average working week in the U.S.manufacturing industries has become less associated with the business cycle over the pastfew decades.
7 The following analysis of overtime hours within the Finnish manufacturing industries doesnot incorporate macroeconomic indicators, because the focus of the study is on the incidenceof overtime hours at the individual level.
8 The consideration of education of workers on the incidence of overtime is not possible dueto the fact that the data does not contain an education code at all. However, it can beargued that education is not important in the incidence of overtime hours owing to thehomogeneity of the labour force within the Finnish manufacturing industries.
9 Figure 1 implies that the average for the variable OVERTIME from 1989 to 1995 is 3.3%.In contrast, the applied version of the individual-level data implies that the average for thevariable OVERTIME is 2.7% for the same period (see Appendix). This discrepancy is dueto the fact that the applied individual-level data covers only the last quarter of each yearfrom 1989 to 1995. According to Skans (2001), the share of overtime hours was on average2.85% for daytime workers within Swedish manufacturing industries during the secondquarter from 1989 to 1992 and 3.7% for 2-shift workers.
10 In fact, Lazear (1998) argues that firms like to hire risky workers in order to cash optionvalues. Risky workers have some additional value from the point of view of firms becausea better-than-expected worker can be kept and a worse-than-expected can be forced outof the match via layoff. This feature of the optimal hiring policy is due to the fact thatincomplete information between employer and employee means that the underlying qualityof a new match will reveal itself only through experimentation. In particular, firms in growing

72
industries should prefer young, high variance workers and be characterized by high workerturnover rates.
11 The unreported results show that overtime compensation divided by overtime hours ishigher in the smaller plants in the Finnish manufacturing industries. Bauer and Zimmermann(1999) investigate the determination of overtime compensation in Germany.
12 Clark (1998) and Evans, Lippoldt and Marianna (2001) report that the disparity betweenactual and desired hours is common across OECD countries. Torp and Barth (2001) reportthat full-time workers typically want shorter working hours and part-time workers wantlonger working hours. Hunt (1998) observes that the gap between actual and desired hourshas been narrowed by reductions in standard hours in Germany.
13 The impression is biased by the fact that the turnover in terms of entry and exit is muchhigher among small plants. Naturally, overtime hours are observed only in the case that it isa number above zero. In addition, it can be argued that the result according to which thereis a decline in the share of overtime hours in the size establishment is based on simplearithmetics, because it is not possible for small establishments to make proportionatelysmall changes in the number of their personnel. However, this discreteness of adjustmentof labour input in the population of small establishments does not make the feature lessinteresting and it must also be noted that the distinction between paid and unpaid overtimehours complicates this simple pattern.
14 The Epanechnikov is the applied kernel density estimate. It has the property that it is themost efficient in minimizing the mean integrated squared error. DiNardo and Tobias (2001)provide a survey of nonparametric density and regression estimation.
15 The derivation of the estimated equation with respect to the variable AGE reveals thefact that all observations of the data are on the declining section of the estimated parable.This same pattern extends to the variables WAGE and TIME.
16 In fact, an increase in paid or unpaid overtime hours can even reverse the supposedpositive employment effects of work-sharing. Hamermesh (1993) provides a summary ofthe empirical studies.
17 The inclusion of year dummies diminishes the variation in the TIME variable that comesfrom the reductions in standard working hours, because the Finnish manufacturing industriesare characterized by binding collective agreements. Calmfors and Hoel (1988) provide atheoretical analysis of the employment effects of reduced standard working hours whenovertime is allowed to adjust in firms. Calmfors and Hoel (1988) stress that a reduction instandard working hours may increase the costs per worker in relation to the cost of overtime.Thus, firms substitute overtime for workers. This substitution effect may reduce employmentwhen output is fixed by demand. Hunt (1999) is able to exploit the cross-industry variationin standard hours in order to study the effects of work-sharing in Germany.
18 About 73% of employees are males in the Finnish manufacturing industries.
19 Ilmakunnas (1997) provides a recent study on Finnish female labour supply.
20 Davis and Haltiwanger (1999) provide a survey of the literature on gross job and workerflows.
21 The result is somewhat contradictory with the observation by Eriksson and Fellman (1995),according to which operating hours of firms tend to rise in plant size within the Finnishmanufacturing industries.
22 This restriction eliminates 29 722 observations.

73
23 The specification applies the same control variables as Model 1 that is reported in Table 5.
24 The specification applies the same control variables (excluding year dummies) as Model1 that is reported in Table 5.

74
Regional disparities in gross job and workerflows in Finland*
Petri Böckerman**Mika Maliranta***
*Financial support from the Foundation for Municipal Development (Kunnallisalan
Kehittämissäätiö) is gratefully acknowledged. This paper is also a part of Helsinki School
of Economics and Business Administration and Statistics Finland joint project: “Labour
Demand and Wage Formation in SMEs and Clusters” financed by the Academy of Fin-
land. We would like to thank two anonymous referees for valuable comments and
suggestions. Paul A. Dillingham has kindly checked the language. The usual disclaimer
applies.
**Labour Institute for Economic Research, Pitkänsillanranta 3A, FIN-00530 Helsinki,
Finland
***Statistics Finland, FIN-00022 Helsinki, Finland
Abstract
The aim of this study is to characterize the structure and the evolution of Finnish regional
labour markets in terms of gross job and worker flows using establishment-level data.
There is no solid evidence that the gross job creation rate is on average lower in Eastern
and Northern Finland. The rapid rise in regional unemployment disparities in the 1990s
can be explained via the rise in the disparities in the gross job destruction rates across
regions during the great slump of the early 1990s. There are also distinct regional differences
in the adjustment of labour demand at the establishment level.
JEL-code: J23, R23
Keywords: gross flows, regional labour markets, unemployment

75
1. Introduction
Market economies are in a state of continuous turbulence. Joseph A. Schumpeter (1942)
called this underlying process of capitalism “creative destruction”. In fact, according to
the growing number of establishment-level studies, it is fair to say that the continuous
reallocation and the reorganisation of scarce resources culminates in the function of labour
markets, where the reallocation of resources takes the form of gross job flows (i.e. job
creation and destruction), and gross worker flows (i.e. hirings and separations of workers).
This reorganisation view of labour markets underlines the fact that the pool of available
jobs is not stagnant over time. Instead, the labour markets are subject to simultaneous
job creation and destruction. There are two broad approaches to characterize this structural
change in labour markets in terms of gross job and worker flows. The so-called excess
job reallocation provides a measure of structural change among the plants of the economy.
In contrast, the fact that the available vacancies of the labour markets are also subject to
various idiosyncratic shocks within plants is captured by the so-called churning rate. These
key concepts of the underlying structural change of labour markets are defined in the
following section of this study.
There has been a bulk of research on gross job and worker flows based on cross-country
comparisions.1 In particular, according to the theoretical model by Bertola and Rogerson
(1997), the rate of job reallocation should be a decreasing function in wage dispersion.
This feature of gross job flows explains part of the widely observed puzzle that the
underlying turnover rates of the economies are roughly equal in Europe with respect to
the United States despite the stylized fact that labour markets tend to be more regulated
in Europe.2 In contrast to these cross-country comparisions, the following study provides
detailed empirical evidence for the view that there are differences in gross job and worker
flows within the same country despite the presence of the same institutional characteristics
(including labour market regulations) across regions. The major advantage of the
comparision of gross job and worker flows within the same country with respect to available
cross-country studies is the fact that the measurement of gross job and worker flows is
based on the same data across regions. This means that the emergence of measurement
problems and conceptual differences do not hamper the comparision of gross and worker
flows across regions.
The issues concerning regional labour markets have gained growing interest in Finland,
because there has been a rapid rise in the regional disparities in unemployment rates as a
part of the export-led recovery from the great depression of the early 1990s (see, for

76
example, Böckerman 1998; Tervo 1998; Huovari 1999). However, the available empirical
studies on Finnish regional labour markets have been conducted by using aggregate data
on (net) employment changes.2 The main shortcoming of these traditional investigations of
aggregate outcome is that they mask the underlying establishment-level dynamics of labour-
demand adjustment in Finnish regional labour markets. In other words, the existing empirical
studies that focus solely on (net) employment changes provide an incomplete and potentially
misleading picture of regional labour markets in Finland. As will be shown in the following
sections of this study, the focus on (net) employment changes gives, for instance, far too
dismal a picture of the nature of high unemployment in Eastern and Northern Finland.
The aim of this study is to characterize the structure and the evolution of Finnish regional
labour markets in terms of gross job and worker flows. The study explores the disparities
in the regional labour market adjustment during an episode of extreme turbulence in the
Finnish economy. In particular, the study is focused on the blow of the great slump of the
early 1990s and the following recovery from 1994 to 1997. In addition, the genuine
regional elements in gross job and worker flows are separated from the effects of industry
structure. Thus, this study fills an important gap in the literature on the regional labour
markets in Finland. The evaluation of gross job and worker flows decomposes the net
employment change and constitutes a coherent picture of regional labour markets in Fin-
land. The study is based on detailed establishment-level analysis. The sectoral composition
of the study also goes, as in Ilmakunnas and Maliranta (2000a), beyond narrow
“manucentrism”, which has been a typical feature of earlier empirical investigations into
gross job and worker flows.
This study appears in eight sections. The first section of the study provides the applied
measures of gross job and worker flows. The second section provides a brief snapshot of
the so-called “basic facts” of the literature on job creation and destruction and gross
worker flows. These basic facts of the literature constitute the hypotheses about gross
job and worker flows. The third section of the study articulates the most important
underlying properties of the establishment-level data. The fourth section is an investigation
of gross job flows in Finnish regional labour markets. The fifth section of the study includes
the elaboration of gross worker flows and the so-called churning rate. The sixth section
provides an elaboration of genuine regional elements in gross job and worker flows by
applying regression techniques. In addition, the section provides a discussion about the
extent to which some important patterns of regional gross job and worker flows can be
reduced to the differences in the industry structure of the Finnish regions by applying the
2-digit standard industry classification. The last section concludes the study.

77
2. The applied measures of gross job and worker flows
The gross flows of jobs and workers are measured as the number of jobs created or
destroyed or workers moving in and out of establishments (i.e. hirings and separations of
workers). This means that the measure of the job creation rate is calculated as follows:
+(1) JCt = ∑i∆Eit / ((∑i Eit + ∑ i Ei, t-1) /2),
where E denotes employment in firm i year t and the superscript “+” refers to positive
changes. The number of employees is measured by the average of period t and t-1
employment. In other words, to convert time-t job creation and destruction measures to
rates, job creation and destruction are divided by the average of employment at t and t-
1 in order to achieve several technical advantages over more conventional growth rate
measures (see, for example, Davis, Haltiwanger and Schuh 1996, 189-190).
Unlike the conventional growth rate measures, which divide employment change by lagged
employment and range from –1.0 to ∞, the applied growth rate measure ranges from –
2.0 to 2.0 and the growth rate measure is symmetric around zero. In addition, Baldwin
and Picot (1995) argue that this average measurement also removes part of the bias
induced by transitory movements of the economy.5
The measure of the job destruction rate is calculated as follows:
-(2) JDt = ∑i∆E it / ((∑ i Eit + ∑ i Ei, t-1) /2)
Thus, the job destruction rate is defined as the absolute value of the sum of negative
employment changes, divided by the average number of employees. The superscript “-”
refers to negative changes.
The definitions of job creation and destruction mean that the net rate of change of
employment (NET) is simply the difference of the measures of job creation and destruction:
(3) NETt = JCt - JDt
The sum of job creation and destruction rates is called the gross job reallocation rate
(JR):
(4) JRt = JCt + JDt

78
The excess job reallocation rate (EJR) equals (gross) job reallocation minus the absolute
value of the net employment change:
(5) EJRt = JRt - NETt
This means that excess job reallocation is an index of simultaneous job creation and
destruction in the economy. Thus, it is also a natural measure of heterogeneity in the plant-
level employment outcome among plants. In other words, if excess job reallocation is
above zero, then the magnitude of (gross) job reallocation is above what has been necessary
to accommodate the net employment changes of the regional labour markets.
Comparison of information in two consecutive years can be used for calculating the number
of employees who have entered a plant during the year and are still working at the same
plant (see, for example, Ilmakunnas, Laaksonen and Maliranta 1999). The sum of these
employees over all plants is worker inflow, or hiring. It is also possible to identify those
employees who are no longer working at a plant. This means that the sum of these
employees is worker outflow, or separation.
Dividing the worker inflow and outflow in a period of time by the average of employment
in periods t and t-1 delivers the worker inflow rate (WIF) and the worker outflow rate
(WOF). The difference between WIF and WOF is the net rate of change in employment:
(6) NETt = WIFt - WOFt
Also, the worker flow rate (WF) is simply the sum of the hiring (WIF) and separation
rates (WOF). In addition, the so-called churning rate (CF) can be defined as follows:
(7) CFt = WFt - JRt
The churning rate can also be called by the expression “excess worker turnover rate” for
obvious reasons. These definitions mean that the churning rate ties worker flows and job
flows together and, therefore, completes the picture of the underlying dynamics of labour
adjustment at the establishment level in Finnish regional labour markets. In addition, the
churning rate is a natural measure of the underlying structural change of regional labour
markets within plants.

79
3. The “basic facts” of the literature
The empirical literature on gross job and worker flows contains a number of so-called
“basic facts”. It is highly important to note that due to the limited availability of data, the
key empirical findings of gross job and worker flows refer mainly to the (U.S.) manufacturing
industries (so-called “manucentrism”).6
The first basic fact of the literature concerns the magnitude of measured gross job flows.
For example, using annual data, roughly 1 in 10 jobs are created and another 1 in 10 are
destroyed each year in the U.S. manufacturing industries. It has become clear that the
gross flows are large, relative to the net employment change. Job reallocation is also a
large part of the total worker reallocation. In fact, most studies indicate job reallocation is
about half of the total worker reallocation.
The second basic fact of the literature on job creation and destruction is the dominant role
of pure plant-specific and firm-specific factors in accounting for the largely observed
magnitudes of gross job and worker flows (see, for example, Haltiwanger 1997). In other
words, the idiosyncratic component is predominant and most of the excess reallocation is
within narrowly defined sectors. This means that the restructuring between various sectors
is only a small portion of the total reallocation of the economy (so-called “sectoral shifts”).
The third fact is that most of the reallocation reflects the persistence of underlying employment
changes. For example, Davis, Haltiwanger and Schuh (1996) report that roughly seven in
ten newly created jobs survive for at least one year, and roughly eight in ten newly destroyed
jobs fail to reappear one year later in the case of U.S. manufacturing industries. After two
years, the persistence of annual job creation and destruction falls to 54% and 74%,
respectively. This feature of job creation and destruction means that to the extent that plant-
level employment changes are also persistent for continuing plants, they must be associated
with long-term joblessness or worker reallocation across plants.
The fourth basic fact is the concentration and the lumpiness of underlying employ-ment
movements. In particular, many empirical investigations find that births and deaths account
for large fractions of job creation and destruction. Births and deaths are simply the
extremes of an underlying growth-rate distribution. From a regional point of view, a
high concentration of job creation and destruction may accentuate various negative
feedback effects on local economies.7

80
The fifth basic fact is about the distinct cyclicality of job creation and destruction. In the
case of U.S. manufacturing, a noteworthy feature of plant-level data is the relatively volatile
nature of job destruction. In particular, job destruction is more responsive to changes in
activity than is the rate of job creation (see, for example, Hall 1999). The available sample
period of the longitudinal data sets for many European countries is, on the other hand,
quite short, which means that a definite conclusion about relative volatility on job creation
and destruction is hard to reach with existing data sets.
The sixth fact is that gross job flows indicate some systematic differences by underlying
plant characteristics. In particular, the most important stylized fact is that the excess
reallocation rate decreases in the size and age of the firm in the case of U.S. manufacturing
industries. These systematic differences by plant characteristics are also found in a number
of other countries. However, Haltiwanger and Krizan (1999) stress that the dominance of
the idiosyncratic element serves as an important caution in attributing net growth to plants
classified by any observable plant characteristics.
The list of these “basic facts” of the literature on gross job and worker flows reflects
the underlying feature that the analysis of regional labour markets in terms of these
measures is almost a neglected issue.8 Thus, this study aims to provide the most
fundamental stylized facts about Finnish regional labour markets in terms of gross job
and worker flows.
4. The Data
The Nordic countries, along with Finland, seem to have a number of advantages for the
use of linked employer-employee data compared with other nations (see, for example,
Ilmakunnas, Maliranta and Vainiomäki 2001). In particular, the size of the country is quite
small, which makes it possible to form various registers which cover the entire population
of establishments and employees. This means that the linking process of the registers and
other data sets is quite manageable.
This study uses a large longitudinal data of employees over the period from 1989 to
1997 (see Ilmakunnas and Maliranta 2000a).9 The calculation of gross job and worker
flows is based on detailed establishment-level analysis, and Finland is divided into 20
provinces (the so-called NUTS3-level in the EU).10 Figure 1 shows the geographic
location of these provinces in Finland. The economic activity of the Finnish economy is
heavily concentrated in Southern Finland. Thus, Appendix provides selected

81
background statistics in a nutshell about the underlying economic structure of the Fin-
nish provinces.
The study provides a representative and comprehensive picture of gross job and worker
flows in Finland. The public sector is excluded from the analysis owing to the great number
of practical problems in deriving the measures of gross job and worker flows. Thus, the
study includes the non-farming business sector of the Finnish economy excluding social
and personal services.11 The applied plant-level data covers more than 80% of the total
employment in the non-farming business sector of the Finnish economy.
Employment Statistics constitutes the backbone of this study. It compiles information
about the economic activity of individuals and their background characteristics from a
16
21
20
05
01
07
08
06
15
14
04
09
17
19
13
18
02
10
12
11
01 Uusimaa20 Itä-Uusimaa02 Varsinais-Suomi04 Satakunta05 Kanta-Häme06 Pirkanmaa07 Päijät-Häme08 Kymenlaakso09 Etelä-Karjala10 Etelä-Savo11 Pohjois-Savo12 Pohjois-Karjala13 Keski-Suomi14 Etelä-Pohjanmaa15 Pohjanmaa16 Keski-Pohjanmaa17 Pohjois-Pohjanmaa18 Kainuu19 Lappi21 Ahvenanmaa
Figure 1. The location of provinces in Finland (Source: Statistics Finland).

82
large number of administrative registers. Employment Statistics covers information on the
employment status of the entire population in the last week of December. In the non-
farming business sector of the Finnish economy there are more than 1.1 million employees
in about 100 000 plants.
Employment Statistics is amended by several available registers held by Statistics Fin-
land, for example, the Business Register.12 The Business Register is a data base that
covers registered employers and enterprises subject to VAT and their plants in Finland. In
particular, the unique plant identification codes are taken from the Business Register. In
addition, the Business Register follows changes in the demographic structure of plants.
The entry and exit of establishments covers about 2–3% of all employees each year.13
This means that the regional disparities in gross job and worker flows in Finland are
driven mainly by continuing establishments.
The employer-employee links are determined in Employment Statistics. Thus, for each
person an unique plant appearing in the Business Register is determined based on his/her
primary employer during the last week of each year. The calculation of underlying gross
job flows naturally requires the setup of a base year. Thus, the annual measures of gross
job and worker flows are calculated from 1990 to 1997.
Figure 2. The evolution of gross job creation (JC), gross job destruction (JD), and the
net rate of employment change (NET=JC-JD) in the Finnish economy.
-15
-10
-5
0
5
10
15
20
25
1990 1991 1992 1993 1994 1995 1996 1997
JC JD NET

83
The period of this study includes the great depression of the early 1990s, which dominates
the evolution of regional gross job and worker flows in Finland.14 For instance, the slump
caused a rapid decline in gross job creation and a sharp rise in the gross job destruction
in the Finnish economy (Figure 2). As the figure indicates, 1991 was the year of the
steepest decline in employment during the recession. The recovery from the bottom level
of employment started in 1994. These movements are also heavily present in the regional
measures of gross job and worker flows. It is therefore interesting to investigate the
underlying fluctuations of gross job and worker flows and, in particular, to explore the
disparities in the regional labour market adjustment at the establishment-level of the Fin-
nish economy.
5. Gross job flows
5.1. Creation
The job creation rate was highest in the period from 1990 to 1997 in Pohjois-Pohjan-
maa, Lappi, Etelä-Pohjanmaa and Uusimaa (Table 1). The outstanding success of Poh-
jois-Pohjanmaa in terms of job creation can mainly be explained by the cluster of information
technology around the region of Oulu. In contrast, the lowest job creation rate was in
Ahvenanmaa, Satakunta and Päijät-Häme from 1990 to 1997. During the great depres-
sion of the early 1990s there was a sharp decline in the job creation rate across all provinces
of Finland. In addition, Kainuu experienced a kind of “double dip” in terms of job creation
during the 1990s.
One interesting fact is that there was no substantial rise in regional disparities as measured
by employment-weighted standard deviation in terms of the job creation rate from 1990
to 1997. The level of regional disparities was lowest during the great depression of the
1990s. Also, the results indicate that there is no solid evidence at all for the widely held
view that, compared with Southern Finland, the job creation rate is lower in Eastern and
Northern Finland, where the average unemployment rate has been much higher than in
Southern Finland during the past few decades.

84
Table 1. Job creation rate in the regions of Finland.
1990 1991 1992 1993 1994 1995 1996 1997 AVG
Uusimaa 18.39 10.29 10.13 10.98 16.92 17.97 15.84 18.95 14.93
Varsinais-Suomi 16.59 10.51 9.62 10.56 19.99 18.49 14.60 17.85 14.78
Satakunta 13.55 9.90 10.17 8.35 18.26 12.66 10.33 13.39 12.08
Kanta-Häme 15.84 8.25 7.21 9.67 15.03 18.67 14.12 17.25 13.26
Pirkanmaa 20.29 9.66 9.66 11.11 17.00 16.59 12.99 15.40 14.09
Päijät-Häme 14.39 7.64 8.43 10.71 14.83 13.75 12.37 15.54 12.21
Kymenlaakso 13.72 9.13 8.55 11.13 15.07 16.52 12.65 13.51 12.54
Etelä-Karjala 19.56 10.11 9.54 10.74 15.88 16.79 14.22 14.81 13.96
Etelä-Savo 14.78 8.78 11.13 7.88 17.77 18.76 13.88 15.11 13.51
Pohjois-Savo 15.90 9.22 9.44 11.37 17.27 16.12 16.29 17.57 14.15
Pohjois-Karjala 15.19 9.28 8.32 10.74 16.03 17.10 12.70 14.97 13.04
Keski-Suomi 18.01 9.35 10.44 9.64 15.53 16.32 12.87 15.58 13.47
Etelä-Pohjanmaa 16.66 10.05 11.01 10.87 20.70 19.01 13.93 17.47 14.96
Pohjanmaa 16.58 9.34 10.52 11.12 16.68 14.71 16.08 16.51 13.94
Keski-Pohjanmaa 16.04 9.51 11.22 8.34 15.06 17.49 12.54 18.96 13.65
Pohjois-Pohjanmaa 15.99 11.12 11.90 12.39 19.04 22.35 16.57 19.92 16.16
Kainuu 12.76 10.04 18.43 9.53 16.02 12.14 9.86 19.26 13.51
Lappi 18.82 11.28 13.07 8.59 17.52 18.33 16.33 17.24 15.15
Itä-Uusimaa 15.08 6.52 10.01 9.45 15.78 11.08 15.66 15.42 12.38
Ahvenanmaa 14.84 7.87 12.82 5.50 8.98 8.25 7.43 12.11 9.73
STD 2.81 1.55 2.40 1.98 2.94 3.82 2.95 2.87
AVG 17.00 9.88 11.09 10.46 17.32 17.01 14.29 17.20
VCF 0.16 0.16 0.22 0.19 0.17 0.22 0.21 0.17
“STD” refers to employment-weighted standard deviation, “AVG” refers to employment-weighted average and “VCF” refers to employment-weighted variation coefficient.
5.2. Destruction
The job destruction rate was, on average, highest in Lappi in the period from 1990 to
1997, and lowest in Ahvenanmaa (Table 2). In addition, there is no evidence at all for the
equally widely held view that the job destruction rate is, on average, higher in Eastern and
Northern Finland.
During the great depression of the early 1990s, there was a sharp rise in the job destruction
rate in all provinces. The highest level of the job destruction rate was reached during

85
1991 or 1992; there were no clear-cut disparities in this respect across the provinces of
Finland, except in Ahvenanmaa. The highest level of the job destruction rate was in Kai-
nuu during the great slump of the 1990s.
The regional disparities in terms of the job destruction rate were highest during the dep-
ression. Thus, the results indicate that during the great slump of the early 1990s there was
a decline in the disparities in the job creation rate across all provinces of Finland, but the
pattern of job destruction was more concentrated across provinces.
Table 2. Job destruction rate in the regions of Finland.
1990 1991 1992 1993 1994 1995 1996 1997 AVG
Uusimaa 16.78 21.86 20.77 19.23 14.87 14.16 12.64 12.17 16.56
Varsinais-Suomi 17.65 20.51 20.36 20.05 12.82 13.54 13.27 10.08 16.04
Satakunta 16.55 20.85 22.12 15.72 11.42 11.13 12.09 8.45 14.79
Kanta-Häme 16.58 19.78 21.03 18.51 11.78 14.76 12.85 10.44 15.72
Pirkanmaa 18.65 23.51 19.87 18.49 12.25 12.37 11.63 9.40 15.77
Päijät-Häme 19.13 21.07 21.58 19.34 11.21 12.18 12.51 9.50 15.82
Kymenlaakso 16.67 20.06 19.57 17.76 9.29 14.94 11.98 7.89 14.77
Etelä-Karjala 15.49 24.15 20.54 18.13 13.23 13.90 14.73 10.42 16.32
Etelä-Savo 17.67 22.37 22.16 18.72 13.37 19.25 13.34 10.03 17.11
Pohjois-Savo 18.69 23.58 24.31 18.22 14.46 15.18 14.08 11.83 17.54
Pohjois-Karjala 16.64 23.67 20.54 18.62 12.08 16.71 13.21 9.05 16.32
Keski-Suomi 19.68 20.67 24.03 18.77 12.12 13.99 10.01 8.81 16.01
Etelä-Pohjanmaa 17.75 24.79 24.68 20.90 12.32 15.96 10.91 9.51 17.10
Pohjanmaa 18.45 20.26 21.70 17.90 12.41 12.05 10.82 10.64 15.53
Keski-Pohjanmaa 20.79 24.40 18.59 19.22 13.27 13.81 10.33 12.85 16.66
Pohjois-Pohjanmaa 20.27 22.50 22.91 19.26 14.52 15.92 13.26 10.87 17.44
Kainuu 17.82 31.10 21.31 16.77 10.06 15.34 13.32 9.31 16.88
Lappi 22.88 25.35 23.94 20.38 14.93 17.57 13.64 12.43 18.89
Itä-Uusimaa 14.38 17.67 19.20 16.20 11.65 13.93 13.20 12.5 14.84
Ahvenanmaa 18.01 12.45 10.07 12.22 8.63 5.91 12.84 5.94 10.76
STD 2.18 3.95 3.55 2.59 2.35 2.95 1.57 2.14
AVG 18.91 23.13 22.02 19.16 13.00 14.83 13.16 10.64
VCF 0.12 0.17 0.16 0.14 0.18 0.20 0.12 0.20
“STD” refers to employment-weighted standard deviation, “AVG” refers to employment-weighted average and “VCF” refers to employment-weighted variation coefficient.

86
5.3. Job reallocation
The magnitude of gross job reallocation was highest in Lappi, Pohjois-Pohjanmaa, and
Etelä-Pohjanmaa in the period from 1990 to 1997 (Table 3). Ahvenanmaa, especially,
has been “an island of sleepy life” in terms of the reallocation of regional labour markets.
There is some evidence that the lowest level of regional disparities in terms of gross job
reallocation was reached during the great depression of the early 1990s.
The results also indicate that the underlying fluctuations of gross job reallocation were not
countercyclical in the Finnish regions from 1990 to 1997. This result of the fluctuations of
gross job flows is in sharp contrast with one of the leading models on gross job flows by
Davis and Haltiwanger (1990), which argues that recessions are intensive times of
restructuring in labour markets.15

87
Table 3. Gross job reallocation rate in the regions of Finland.
1990 1991 1992 1993 1994 1995 1996 1997 AVG
Uusimaa 35.17 32.15 30.90 30.21 31.79 32.13 28.49 32.83 31.71
Varsinais-Suomi 34.24 31.02 29.98 30.61 32.81 32.03 27.86 32.37 31.37
Satakunta 30.10 30.75 32.29 24.07 29.68 23.78 22.42 29.76 27.86
Kanta-Häme 32.42 28.03 28.25 28.18 26.81 33.43 26.98 31.04 29.39
Pirkanmaa 38.95 33.17 29.52 29.61 29.24 28.96 24.63 32.60 30.84
Päijät-Häme 33.52 28.71 30.01 30.05 26.04 25.93 24.88 29.88 28.63
Kymenlaakso 30.39 29.19 28.11 28.90 24.36 31.46 24.64 28.91 28.25
Etelä-Karjala 35.06 34.25 30.08 28.86 29.11 30.69 28.95 32.46 31.18
Etelä-Savo 32.45 31.16 33.29 26.59 31.14 38.01 27.22 32.68 31.57
Pohjois-Savo 34.59 32.79 33.75 29.60 31.73 31.31 30.37 32.67 32.10
Pohjois-Karjala 31.82 32.96 28.86 29.36 28.11 33.81 25.91 30.89 30.22
Keski-Suomi 37.69 30.03 34.47 28.41 27.65 30.31 22.88 31.30 30.34
Etelä-Pohjanmaa 34.42 34.84 35.69 31.77 33.01 34.97 24.83 34.71 33.03
Pohjanmaa 35.03 29.60 32.22 29.02 29.09 26.76 26.90 32.84 30.18
Keski-Pohjanmaa 36.83 33.91 29.81 27.56 28.33 31.30 22.87 31.26 30.23
Pohjois-Pohjanmaa 36.26 33.62 34.80 31.64 33.56 38.27 29.83 34.49 34.06
Kainuu 30.59 41.14 39.74 26.31 26.07 27.48 23.18 30.51 30.63
Lappi 41.70 36.63 37.01 28.96 32.45 35.89 29.97 34.41 34.63
Itä-Uusimaa 29.46 24.19 29.21 25.65 27.43 25.01 28.86 29.16 27.37
Ahvenanmaa 32.85 20.32 22.88 17.73 17.60 14.16 20.27 21.25 20.88
STD 4.34 5.11 4.32 4.28 4.92 6.33 3.94 4.14
AVG 35.92 33.01 33.11 29.62 30.32 31.85 27.45 32.91
VCF 0.12 0.15 0.13 0.14 0.16 0.2 0.14 0.13
“STD” refers to employment-weighted standard deviation, “AVG” refers to employment-weighted average and “VCF” refers to employment-weighted variation coefficient.
5.4. Excess reallocation
The lowest level of excess reallocation (i.e. simultaneous job creation and destruction)
was, on average, in Ahvenanmaa, Satakunta and Päijät-Häme from 1990 to 1997 (Table
4). The underlying magnitude of excess reallocation has not been stronger in Southern
Finland with respect to Eastern and Northern Finland. In fact, the highest level of average
excess reallocation has been in the province of Lappi.

88
There has been no continuous rise in regional disparities in terms of excess reallocation
across provinces in Finland. However, the patterns with respect to the fluctuations of
excess reallocation were not identical across provinces from 1990 to 1997. In some
provinces (for example, the province of Keski-Suomi), there was a decline in excess
reallocation during the depression, but in some provinces (for example, the province of
Kainuu), there was, in fact, a rise in excess reallocation during the slump of the early
1990s. This means that the structural change of regional labour markets among plants
was halted in Keski-Suomi during the depression, but in the province of Kainuu there
was, instead, an acceleration of structural change among plants during the economic
slowdown.
Table 4. Excess reallocation rate in the regions of Finland.
1990 1991 1992 1993 1994 1995 1996 1997 AVG
Uusimaa 33.56 20.57 20.27 21.96 29.74 28.33 25.29 24.34 25.51Varsinais-Suomi 33.18 21.02 19.24 21.12 25.63 27.09 26.53 20.17 24.25Satakunta 27.09 19.81 20.34 16.69 22.84 22.25 20.66 16.91 20.82Kanta-Häme 31.67 16.49 14.43 19.34 23.55 29.52 25.71 20.87 22.70Pirkanmaa 37.30 19.32 19.31 22.22 24.50 24.74 23.27 18.80 23.68Päijät-Häme 28.77 15.29 16.85 21.42 22.41 24.36 24.74 19.00 21.61Kymenlaakso 27.43 18.25 17.09 22.27 18.59 29.89 23.96 15.78 21.66Etelä-Karjala 30.99 20.21 19.08 21.47 26.46 27.80 28.43 20.84 24.41Etelä-Savo 29.56 17.57 22.26 15.75 26.74 37.52 26.69 20.06 24.52Pohjois-Savo 31.79 18.44 18.88 22.74 28.91 30.37 28.16 23.66 25.37Pohjois-Karjala 30.38 18.56 16.63 21.48 24.16 33.42 25.40 18.10 23.52Keski-Suomi 36.02 18.71 20.88 19.29 24.24 27.98 20.03 17.63 23.10Etelä-Pohjanmaa 33.33 20.10 22.02 21.74 24.63 31.91 21.81 19.03 24.32Pohjanmaa 33.16 18.68 21.05 22.25 24.81 24.11 21.64 21.27 23.37Keski-Pohjanmaa 32.08 19.02 22.44 16.69 26.54 27.62 20.65 25.70 23.84Pohjois-Pohjanmaa 31.97 22.24 23.80 24.78 29.05 31.85 26.52 21.74 26.49Kainuu 25.52 20.07 36.86 19.07 20.12 24.28 19.72 18.63 23.03Lappi 37.64 22.56 26.14 17.18 29.86 35.13 27.28 24.86 27.58Itä-Uusimaa 28.75 13.04 20.02 18.89 23.29 22.15 26.39 25.00 22.19Ahvenanmaa 29.68 15.74 20.13 11.01 17.26 11.82 14.85 11.87 16.55STD 4.56 3.10 4.74 3.97 4.71 6.10 4.23 4.28AVG 33.13 19.77 21.90 20.92 25.99 29.00 25.12 21.28
VCF 0.14 0.16 0.22 0.19 0.18 0.21 0.17 0.20
“STD” refers to employment-weighted standard deviation, “AVG” refers to employment-weighted average and “VCF” refers to employment-weighted variation coefficient.

89
6. Gross worker flows
6.1 Hiring
The hiring rate is a measure of the inflow of workers into the population of establishments.
There were no major changes in the hiring rate from the point of view of regional disparities
from 1990 to 1997 (Table 5). The lowest level of hiring is on average in Ahvenanmaa and
Satakunta, and the highest in Uusimaa and Pohjois-Pohjanmaa. During the great slump of
the early 1990s there was also a sharp decline in the hiring rate in all provinces of the
Finnish economy.
The hiring rate can be decomposed by the sources of worker inflow. The worker inflow
rate from unemployment (WIFU) displays a distinct regional pattern (Table 6). In particular,
the worker inflow rate from unemployment seems to be at a higher level in Eastern and
Northern Finland compared with Southern Finland. This regional pattern of the worker
inflow from unemployment is a reflection of the fact that the average duration of
unemployment spells is substantially shorter in Eastern and Northern Finland compared
with Southern Finland due to the allocation of various active labour market measures to
the high unemployment provinces of Eastern and Northern Finland.

90
Table 5. Hiring rate in the regions of Finland.
1990 1991 1992 1993 1994 1995 1996 1997 AVG
Uusimaa 35.51 22.63 20.68 21.14 28.69 31.89 29.14 32.70 27.80
Varsinais-Suomi 30.17 20.81 18.50 19.80 31.01 29.13 24.97 30.12 25.56
Satakunta 25.26 18.94 18.18 16.22 27.04 22.87 19.56 23.64 21.46
Kanta-Häme 29.55 17.59 14.86 18.78 24.31 28.00 24.01 28.43 23.19
Pirkanmaa 33.15 19.02 18.04 19.30 26.59 27.14 22.39 25.97 23.95
Päijät-Häme 27.91 17.65 16.53 18.94 25.05 24.21 22.20 25.70 22.27
Kymenlaakso 25.87 18.63 16.40 19.55 24.31 26.01 22.49 23.49 22.09
Etelä-Karjala 31.86 18.48 16.82 18.12 23.78 27.47 24.08 24.64 23.16
Etelä-Savo 27.10 17.44 18.74 15.25 26.50 28.19 22.59 24.47 22.54
Pohjois-Savo 31.72 21.56 19.75 21.74 28.18 27.64 25.40 27.33 25.42
Pohjois-Karjala 28.67 18.16 15.91 17.87 25.89 25.93 20.84 24.07 22.17
Keski-Suomi 31.13 19.58 18.52 18.70 25.07 26.16 22.56 25.63 23.42
Etelä-Pohjanmaa 28.22 19.13 19.50 18.95 29.98 28.28 22.46 26.66 24.15
Pohjanmaa 30.91 17.33 19.72 17.74 24.57 23.62 26.79 25.83 23.31
Keski-Pohjanmaa 29.22 19.39 19.25 15.11 24.16 26.71 22.23 28.10 23.02
Pohjois-Pohjanmaa 28.94 21.39 22.15 22.47 28.69 32.46 26.83 31.25 26.77
Kainuu 25.17 18.14 26.80 16.46 25.40 20.07 17.73 28.49 22.28
Lappi 31.78 22.12 21.35 16.64 27.94 28.43 26.49 28.18 25.37
Itä-Uusimaa 27.91 16.44 18.55 16.18 26.29 19.47 23.96 25.88 21.84
Ahvenanmaa 29.10 18.72 21.35 13.82 18.76 19.23 16.46 22.12 19.95
STD 4.59 2.93 3.16 3.27 3.94 5.15 4.54 4.52
AVG 31.03 20.18 20.05 19.12 27.48 27.57 24.42 28.07
VCF 0.15 0.15 0.16 0.17 0.14 0.19 0.19 0.16
“STD” refers to employment-weighted standard deviation, “AVG” refers to employment-weighted average and “VCF” refers to employment-weighted variation coefficient.
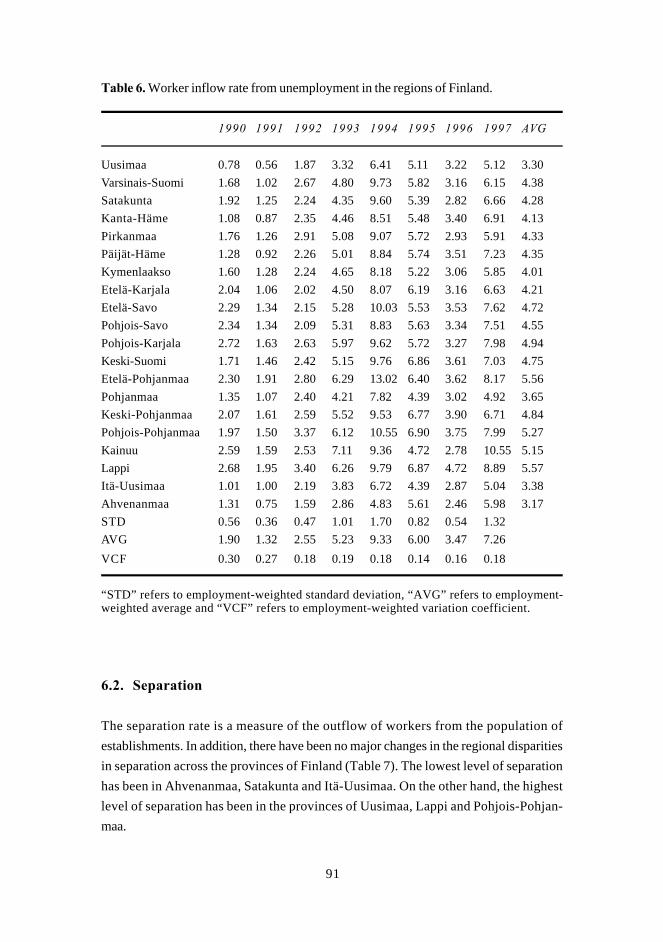
91
Table 6. Worker inflow rate from unemployment in the regions of Finland.
1990 1991 1992 1993 1994 1995 1996 1997 AVG
Uusimaa 0.78 0.56 1.87 3.32 6.41 5.11 3.22 5.12 3.30
Varsinais-Suomi 1.68 1.02 2.67 4.80 9.73 5.82 3.16 6.15 4.38
Satakunta 1.92 1.25 2.24 4.35 9.60 5.39 2.82 6.66 4.28
Kanta-Häme 1.08 0.87 2.35 4.46 8.51 5.48 3.40 6.91 4.13
Pirkanmaa 1.76 1.26 2.91 5.08 9.07 5.72 2.93 5.91 4.33
Päijät-Häme 1.28 0.92 2.26 5.01 8.84 5.74 3.51 7.23 4.35
Kymenlaakso 1.60 1.28 2.24 4.65 8.18 5.22 3.06 5.85 4.01
Etelä-Karjala 2.04 1.06 2.02 4.50 8.07 6.19 3.16 6.63 4.21
Etelä-Savo 2.29 1.34 2.15 5.28 10.03 5.53 3.53 7.62 4.72
Pohjois-Savo 2.34 1.34 2.09 5.31 8.83 5.63 3.34 7.51 4.55
Pohjois-Karjala 2.72 1.63 2.63 5.97 9.62 5.72 3.27 7.98 4.94
Keski-Suomi 1.71 1.46 2.42 5.15 9.76 6.86 3.61 7.03 4.75
Etelä-Pohjanmaa 2.30 1.91 2.80 6.29 13.02 6.40 3.62 8.17 5.56
Pohjanmaa 1.35 1.07 2.40 4.21 7.82 4.39 3.02 4.92 3.65
Keski-Pohjanmaa 2.07 1.61 2.59 5.52 9.53 6.77 3.90 6.71 4.84
Pohjois-Pohjanmaa 1.97 1.50 3.37 6.12 10.55 6.90 3.75 7.99 5.27
Kainuu 2.59 1.59 2.53 7.11 9.36 4.72 2.78 10.55 5.15
Lappi 2.68 1.95 3.40 6.26 9.79 6.87 4.72 8.89 5.57
Itä-Uusimaa 1.01 1.00 2.19 3.83 6.72 4.39 2.87 5.04 3.38
Ahvenanmaa 1.31 0.75 1.59 2.86 4.83 5.61 2.46 5.98 3.17
STD 0.56 0.36 0.47 1.01 1.70 0.82 0.54 1.32
AVG 1.90 1.32 2.55 5.23 9.33 6.00 3.47 7.26
VCF 0.30 0.27 0.18 0.19 0.18 0.14 0.16 0.18
“STD” refers to employment-weighted standard deviation, “AVG” refers to employment-weighted average and “VCF” refers to employment-weighted variation coefficient.
6.2. Separation
The separation rate is a measure of the outflow of workers from the population of
establishments. In addition, there have been no major changes in the regional disparities
in separation across the provinces of Finland (Table 7). The lowest level of separation
has been in Ahvenanmaa, Satakunta and Itä-Uusimaa. On the other hand, the highest
level of separation has been in the provinces of Uusimaa, Lappi and Pohjois-Pohjan-
maa.

92
Labour demand by firms can be tailored downwards during the depression at the
establishment level either by reducing hirings (i.e. worker inflow) or by increasing
separation (i.e. worker outflow). The results indicate that there were indeed interesting
differences in the adjustment of labour demand during the great depression of the early
1990s. For example, the rapid rise in unemployment in Kainuu can be explained by a
rise in the separation rate and a decline in the hiring rate during the great depression in
Finland.16 In contrast, during the same period there was no rise at all in the separation
rate in the province of Uusimaa. This means that the rise in the unemployment rate in
Uusimaa can be explained by a decline in the hiring rate, which, from the point of view
of the province, is an “easier” mechanism to adjust the labour demand than a rise in the
separation rate.
The variation of the hiring rate instead of the separation rate is, from the point of view of
union and firm insiders, a much more desirable way for establishments to tailor downwards
their demand of labour during depressions. In fact, the decline in the hiring rate means that
the relative bargaining position of union and firm insiders becomes even stronger during
the times of economic slowdown. This is due to the fact that the inflow of unemployed
workers into establishments does not in this case deteriorate the bargaining power of
insiders, because the wage claims by recently unemployed workers are not as high as
whose by union and firm insiders that have long-term contracts.
The separation rate can also be decomposed by the destinations of worker outflow. The
worker outflow rate into unemployment (WOFU) reveals some interesting features (Table
8). The results indicate that the worker outflow rate into unemployment is highest in the
province of Lappi. This observation is consistent with the earlier notion about the role of
various active labour market measures in Eastern and Northern Finland.17 In addition, it is
interesting to note that by 1997 the worker outflow rate into unemployment had not yet
declined to the levels before the great slump of the 1990s.

93
Table 7. Separation rate in the regions of Finland.
1990 1991 1992 1993 1994 1995 1996 1997 AVG
Uusimaa 33.90 34.20 31.31 29.39 26.64 28.09 25.94 25.93 29.43
Varsinais-Suomi 31.23 30.81 29.24 29.29 23.84 24.18 23.64 22.36 26.82
Satakunta 28.26 29.89 30.13 23.59 20.20 21.34 21.32 18.71 24.18
Kanta-Häme 30.30 29.13 28.68 27.62 21.05 24.09 22.74 21.62 25.65
Pirkanmaa 31.51 32.87 28.26 26.68 21.84 22.91 21.03 19.97 25.63
Päijät-Häme 32.65 31.07 29.68 27.57 21.42 22.64 22.34 19.66 25.88
Kymenlaakso 28.82 29.57 27.42 26.18 18.53 24.43 21.82 17.87 24.33
Etelä-Karjala 27.79 32.52 27.82 25.51 21.12 24.58 24.59 20.25 25.52
Etelä-Savo 29.99 31.02 29.77 26.09 22.10 28.68 22.06 19.39 26.14
Pohjois-Savo 34.52 35.92 34.62 28.59 25.36 26.70 23.19 21.59 28.81
Pohjois-Karjala 30.12 32.55 28.13 25.75 21.94 25.54 21.35 18.15 25.44
Keski-Suomi 32.80 30.90 32.12 27.82 21.67 23.83 19.70 18.86 25.96
Etelä-Pohjanmaa 29.31 33.87 33.17 28.98 21.60 25.23 19.44 18.70 26.29
Pohjanmaa 32.78 28.24 30.90 24.52 20.29 20.97 21.54 19.95 24.90
Keski-Pohjanmaa 33.97 34.28 26.63 25.99 22.37 23.03 20.01 21.99 26.03
Pohjois-Pohjanmaa 33.23 32.77 33.16 29.34 24.18 26.04 23.53 22.20 28.06
Kainuu 30.23 39.21 29.68 23.70 19.44 23.27 21.20 18.54 25.66
Lappi 35.84 36.19 32.23 28.42 25.35 27.67 23.80 23.37 29.11
Itä-Uusimaa 27.21 27.59 27.74 22.93 22.15 22.32 21.50 22.96 24.30
Ahvenanmaa 32.27 23.30 18.60 20.54 18.41 16.89 21.87 15.94 20.98
STD 3.79 4.59 4.43 3.82 3.60 3.90 3.08 3.75
AVG 32.94 33.42 30.99 27.81 23.15 25.39 23.3 21.51
VCF 0.12 0.14 0.14 0.14 0.16 0.15 0.13 0.17
“STD” refers to employment-weighted standard deviation, “AVG” refers to employment-weighted average and “VCF” refers to employment-weighted variation coefficient.
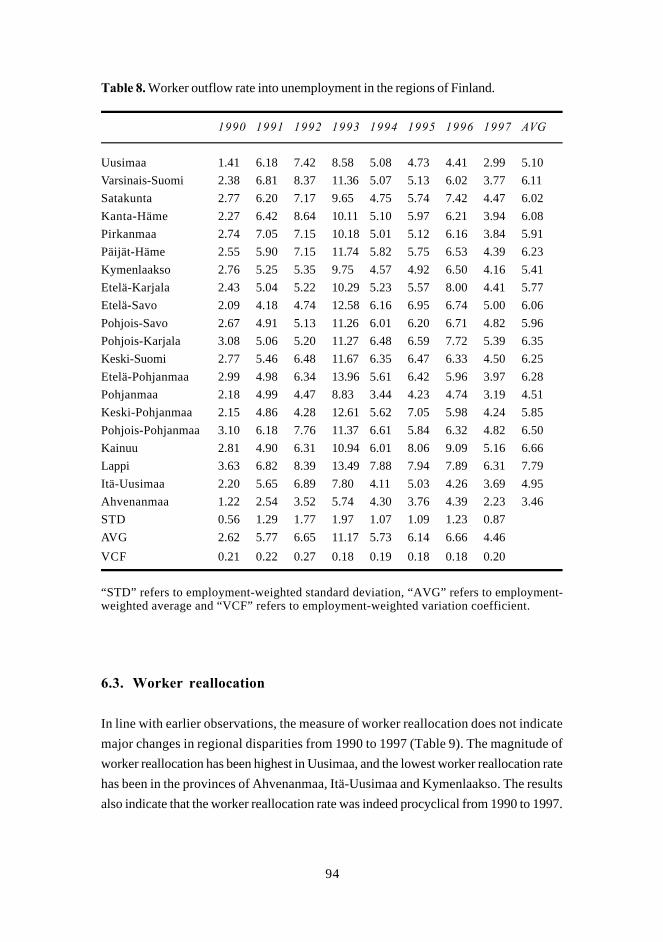
94
Table 8. Worker outflow rate into unemployment in the regions of Finland.
1990 1991 1992 1993 1994 1995 1996 1997 AVG
Uusimaa 1.41 6.18 7.42 8.58 5.08 4.73 4.41 2.99 5.10
Varsinais-Suomi 2.38 6.81 8.37 11.36 5.07 5.13 6.02 3.77 6.11
Satakunta 2.77 6.20 7.17 9.65 4.75 5.74 7.42 4.47 6.02
Kanta-Häme 2.27 6.42 8.64 10.11 5.10 5.97 6.21 3.94 6.08
Pirkanmaa 2.74 7.05 7.15 10.18 5.01 5.12 6.16 3.84 5.91
Päijät-Häme 2.55 5.90 7.15 11.74 5.82 5.75 6.53 4.39 6.23
Kymenlaakso 2.76 5.25 5.35 9.75 4.57 4.92 6.50 4.16 5.41
Etelä-Karjala 2.43 5.04 5.22 10.29 5.23 5.57 8.00 4.41 5.77
Etelä-Savo 2.09 4.18 4.74 12.58 6.16 6.95 6.74 5.00 6.06
Pohjois-Savo 2.67 4.91 5.13 11.26 6.01 6.20 6.71 4.82 5.96
Pohjois-Karjala 3.08 5.06 5.20 11.27 6.48 6.59 7.72 5.39 6.35
Keski-Suomi 2.77 5.46 6.48 11.67 6.35 6.47 6.33 4.50 6.25
Etelä-Pohjanmaa 2.99 4.98 6.34 13.96 5.61 6.42 5.96 3.97 6.28
Pohjanmaa 2.18 4.99 4.47 8.83 3.44 4.23 4.74 3.19 4.51
Keski-Pohjanmaa 2.15 4.86 4.28 12.61 5.62 7.05 5.98 4.24 5.85
Pohjois-Pohjanmaa 3.10 6.18 7.76 11.37 6.61 5.84 6.32 4.82 6.50
Kainuu 2.81 4.90 6.31 10.94 6.01 8.06 9.09 5.16 6.66
Lappi 3.63 6.82 8.39 13.49 7.88 7.94 7.89 6.31 7.79
Itä-Uusimaa 2.20 5.65 6.89 7.80 4.11 5.03 4.26 3.69 4.95
Ahvenanmaa 1.22 2.54 3.52 5.74 4.30 3.76 4.39 2.23 3.46
STD 0.56 1.29 1.77 1.97 1.07 1.09 1.23 0.87
AVG 2.62 5.77 6.65 11.17 5.73 6.14 6.66 4.46
VCF 0.21 0.22 0.27 0.18 0.19 0.18 0.18 0.20
“STD” refers to employment-weighted standard deviation, “AVG” refers to employment-weighted average and “VCF” refers to employment-weighted variation coefficient.
6.3. Worker reallocation
In line with earlier observations, the measure of worker reallocation does not indicate
major changes in regional disparities from 1990 to 1997 (Table 9). The magnitude of
worker reallocation has been highest in Uusimaa, and the lowest worker reallocation rate
has been in the provinces of Ahvenanmaa, Itä-Uusimaa and Kymenlaakso. The results
also indicate that the worker reallocation rate was indeed procyclical from 1990 to 1997.

95
Table 9. Worker reallocation rate in the regions of Finland.
1990 1991 1992 1993 1994 1995 1996 1997 AVG
Uusimaa 69.41 56.84 51.98 50.52 55.34 59.98 55.07 58.63 57.22
Varsinais-Suomi 61.40 51.62 47.74 49.08 54.85 53.30 48.60 52.48 52.38
Satakunta 53.52 48.83 48.31 39.81 47.23 44.20 40.88 42.35 45.64
Kanta-Häme 59.85 46.72 43.54 46.40 45.36 52.10 46.75 50.06 48.85
Pirkanmaa 64.65 51.89 46.30 45.98 48.43 50.04 43.43 45.95 49.58
Päijät-Häme 60.56 48.72 46.21 46.51 46.47 46.86 44.54 45.37 48.16
Kymenlaakso 54.69 48.20 43.83 45.73 42.84 50.45 44.31 41.36 46.43
Etelä-Karjala 59.66 50.99 44.63 43.63 44.90 52.04 48.67 44.89 48.68
Etelä-Savo 57.09 48.46 48.51 41.34 48.60 56.87 44.65 43.86 48.67
Pohjois-Savo 66.23 57.48 54.38 50.32 53.55 54.33 48.59 48.92 54.23
Pohjois-Karjala 58.80 50.70 44.04 43.62 47.83 51.47 42.19 42.23 47.61
Keski-Suomi 63.94 50.48 50.64 46.52 46.74 50.00 42.26 44.48 49.38
Etelä-Pohjanmaa 57.52 52.99 52.68 47.93 51.58 53.51 41.90 45.36 50.43
Pohjanmaa 63.69 45.57 50.62 42.26 44.85 44.59 48.33 45.78 48.21
Keski-Pohjanmaa 63.18 53.67 45.88 41.10 46.53 49.74 42.24 50.09 49.05
Pohjois-Pohjanmaa 62.17 54.15 55.31 51.81 52.87 58.50 50.36 53.44 54.83
Kainuu 55.40 57.35 56.47 40.15 44.84 43.34 38.93 47.03 47.94
Lappi 67.61 58.31 53.58 45.06 53.28 56.09 50.29 51.55 54.47
Itä-Uusimaa 55.12 44.03 46.29 39.12 48.44 41.79 45.46 48.84 46.14
Ahvenanmaa 61.38 42.02 39.95 34.36 37.17 36.12 38.33 38.05 40.92
STD 8.03 7.03 6.42 6.89 7.27 8.77 7.30 8.11
AVG 63.98 53.60 51.03 46.93 50.64 52.96 47.72 49.59
VCF 0.13 0.13 0.13 0.15 0.14 0.17 0.15 0.16
“STD” refers to employment-weighted standard deviation, “AVG” refers to employment-weighted average and “VCF” refers to employment-weighted variation coefficient.
6.4. Churning
The elaboration of gross job and worker flows together delivers a complete picture of
labour demand adjustment in the regional labour markets of Finland. As noted earlier, the
so-called churning rate is also a natural measure of underlying structural change within
plants. The magnitude of structural change measured by the churning rate is high in Uusi-
maa compared with the other regions of Finland (Table 10). This means that the intensity
of structural change within plants is indeed high in Uusimaa, where the unemployment rate

96
has been low with respect to the other provinces of Finland. In addition, there was a
sharp decline in the churning rate in all provinces during the great depression of the 1990s.
The level of the churning rate has been permanently lower since the great slump of the
early 1990s.
The high churning rate in Uusimaa can be explained by the high level of education of
workers, the diversity of the production structure, and the large geographical scope of
regional labour markets. In addition, migration from the rest of the country to Uusimaa
can give a boost to churning in Uusimaa, because most of the immigrants are young and
well-educated.18 In contrast, Kainuu has the lowest level of the churning rate, where the
unemployment rate has been highest among the regions of Finland during the past few
decades.
The results therefore support the view that one of the most important underlying structural
features that explain the high unemployment rate of Kainuu is the fact that structural change
does not “revitalize” the economic structure of the region enough. In fact, the recent
empirical investigation by Ilmakunnas, Maliranta and Vainiomäki (1999) indicates that a
rise in the churning rate gives a boost to the productivity at the establishment level after
controlling for other key factors (such as the education of workers) that affect the
productivity of establishments. This observation is in line with productivity measures based
on regional GDP data that indicate that labour productivity is indeed higher in Uusimaa
with respect to the other provinces of Finland. In fact, an investigation of regional disparities
in labour productivity by Maliranta (1997) indicates that the level of productivity in Uusi-
maa is much higher compared with the other regions of Finland after controlling for other
key factors. Thus, it can be argued that the underlying disparities in churning rates is one
of the missing pieces of the productivity puzzle of Finnish regions.

97
Table 10. Churning rate in the regions of Finland.
1990 1991 1992 1993 1994 1995 1996 1997 AVG
Uusimaa 34.24 24.69 21.08 20.32 23.55 27.85 26.59 27.51 25.73
Varsinais-Suomi 27.16 20.60 17.76 18.47 22.05 21.27 20.74 24.54 21.57
Satakunta 23.42 18.08 16.02 15.74 17.55 20.42 18.46 20.51 18.78
Kanta-Häme 27.43 18.69 15.29 18.21 18.55 18.66 19.78 22.37 19.87
Pirkanmaa 25.71 18.72 16.78 16.37 19.18 21.08 18.80 21.15 19.72
Päijät-Häme 27.04 20.01 16.20 16.46 20.44 20.93 19.66 20.33 20.13
Kymenlaakso 24.30 19.01 15.71 16.84 18.48 18.98 19.67 19.97 19.12
Etelä-Karjala 24.60 16.74 14.55 14.77 15.79 21.35 19.72 19.65 18.40
Etelä-Savo 24.63 17.30 15.22 14.75 17.46 18.86 17.43 18.72 18.05
Pohjois-Savo 31.64 24.69 20.63 20.73 21.82 23.02 18.21 19.52 22.53
Pohjois-Karjala 26.97 17.75 15.18 14.26 19.72 17.66 16.28 18.21 18.25
Keski-Suomi 26.25 20.45 16.17 18.11 19.09 19.69 19.38 20.09 19.90
Etelä-Pohjanmaa 23.10 18.15 16.98 16.16 18.57 18.54 17.07 18.38 18.37
Pohjanmaa 28.66 15.97 18.40 13.24 15.76 17.83 21.43 18.63 18.74
Keski-Pohjanmaa 26.36 19.76 16.07 13.53 18.20 18.44 19.37 18.29 18.75
Pohjois-Pohjanmaa 25.92 20.54 20.51 20.16 19.30 20.23 20.53 22.65 21.23
Kainuu 24.82 16.21 16.73 13.85 18.77 15.86 15.75 18.45 17.56
Lappi 25.92 21.68 16.57 16.10 20.84 20.20 20.32 21.89 20.44
Itä-Uusimaa 25.66 19.84 17.08 13.47 21.02 16.79 16.60 20.91 18.92
Ahvenanmaa 28.53 21.70 17.07 16.64 19.57 21.97 18.07 20.00 20.44
STD 4.59 3.67 2.99 3.32 3.21 4.27 4.00 4.09
AVG 28.06 20.59 17.92 17.31 20.32 21.11 20.28 21.74
VCF 0.16 0.18 0.17 0.19 0.16 0.20 0.20 0.19
“STD” refers to employment-weighted standard deviation, “AVG” refers to employment-weighted average and “VCF” refers to employment-weighted variation coefficient.
7. The elements of gross job and worker flows
This section separates the genuine regional elements in the measures of gross job and
worker flows from the effects of years and industry-structure in the Finnish regions. The
ANOVA is based on the 2-digit standard industry classification that includes 46 industries
in twenty provinces of Finland over the period from 1990 to 1997. The results from the
employment-weighted regressions in which the regional measures of gross job and worker
flows along with the net rate of employment change are explained by dummy variables
that are attached to years, industries and regions are summarized in Table 11. Several
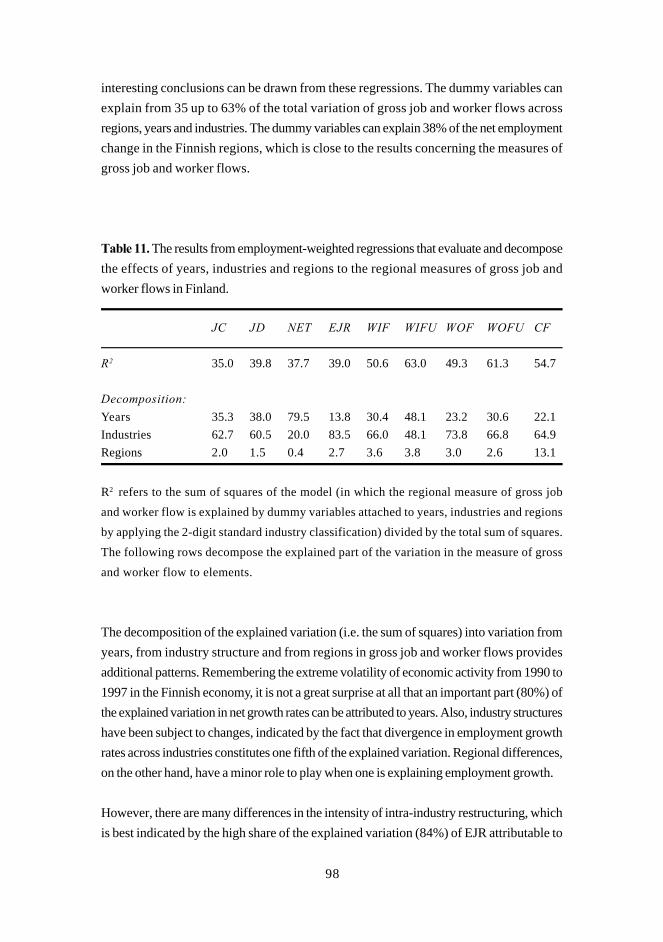
98
interesting conclusions can be drawn from these regressions. The dummy variables can
explain from 35 up to 63% of the total variation of gross job and worker flows across
regions, years and industries. The dummy variables can explain 38% of the net employment
change in the Finnish regions, which is close to the results concerning the measures of
gross job and worker flows.
Table 11. The results from employment-weighted regressions that evaluate and decompose
the effects of years, industries and regions to the regional measures of gross job and
worker flows in Finland.
JC JD NET EJR WIF WIFU WOF WOFU CF
R2 35.0 39.8 37.7 39.0 50.6 63.0 49.3 61.3 54.7
Decomposition:
Years 35.3 38.0 79.5 13.8 30.4 48.1 23.2 30.6 22.1
Industries 62.7 60.5 20.0 83.5 66.0 48.1 73.8 66.8 64.9
Regions 2.0 1.5 0.4 2.7 3.6 3.8 3.0 2.6 13.1
R2 refers to the sum of squares of the model (in which the regional measure of gross job
and worker flow is explained by dummy variables attached to years, industries and regions
by applying the 2-digit standard industry classification) divided by the total sum of squares.
The following rows decompose the explained part of the variation in the measure of gross
and worker flow to elements.
The decomposition of the explained variation (i.e. the sum of squares) into variation from
years, from industry structure and from regions in gross job and worker flows provides
additional patterns. Remembering the extreme volatility of economic activity from 1990 to
1997 in the Finnish economy, it is not a great surprise at all that an important part (80%) of
the explained variation in net growth rates can be attributed to years. Also, industry structures
have been subject to changes, indicated by the fact that divergence in employment growth
rates across industries constitutes one fifth of the explained variation. Regional differences,
on the other hand, have a minor role to play when one is explaining employment growth.
However, there are many differences in the intensity of intra-industry restructuring, which
is best indicated by the high share of the explained variation (84%) of EJR attributable to
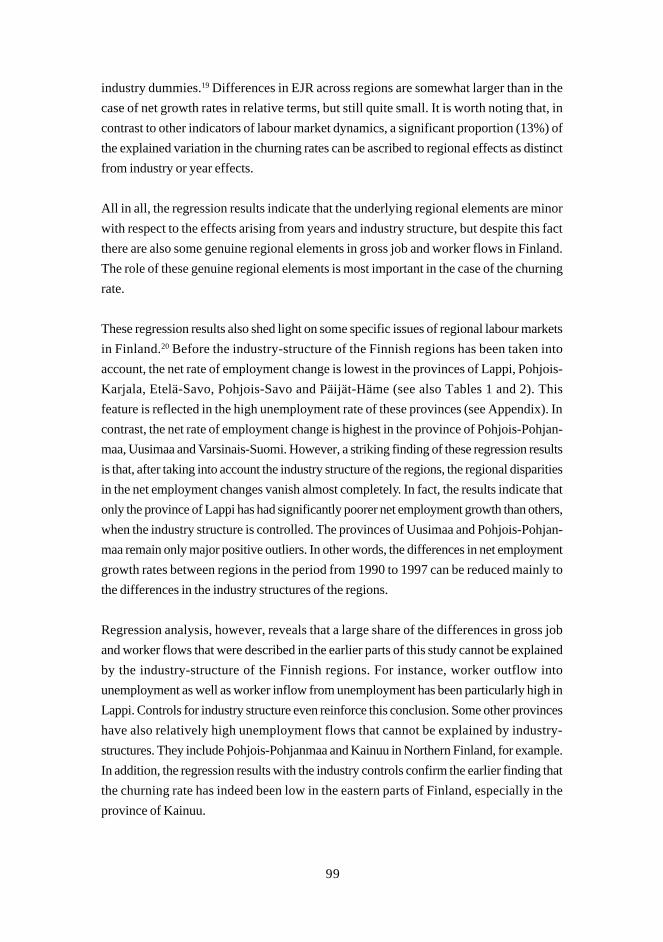
99
industry dummies.19 Differences in EJR across regions are somewhat larger than in the
case of net growth rates in relative terms, but still quite small. It is worth noting that, in
contrast to other indicators of labour market dynamics, a significant proportion (13%) of
the explained variation in the churning rates can be ascribed to regional effects as distinct
from industry or year effects.
All in all, the regression results indicate that the underlying regional elements are minor
with respect to the effects arising from years and industry structure, but despite this fact
there are also some genuine regional elements in gross job and worker flows in Finland.
The role of these genuine regional elements is most important in the case of the churning
rate.
These regression results also shed light on some specific issues of regional labour markets
in Finland.20 Before the industry-structure of the Finnish regions has been taken into
account, the net rate of employment change is lowest in the provinces of Lappi, Pohjois-
Karjala, Etelä-Savo, Pohjois-Savo and Päijät-Häme (see also Tables 1 and 2). This
feature is reflected in the high unemployment rate of these provinces (see Appendix). In
contrast, the net rate of employment change is highest in the province of Pohjois-Pohjan-
maa, Uusimaa and Varsinais-Suomi. However, a striking finding of these regression results
is that, after taking into account the industry structure of the regions, the regional disparities
in the net employment changes vanish almost completely. In fact, the results indicate that
only the province of Lappi has had significantly poorer net employment growth than others,
when the industry structure is controlled. The provinces of Uusimaa and Pohjois-Pohjan-
maa remain only major positive outliers. In other words, the differences in net employment
growth rates between regions in the period from 1990 to 1997 can be reduced mainly to
the differences in the industry structures of the regions.
Regression analysis, however, reveals that a large share of the differences in gross job
and worker flows that were described in the earlier parts of this study cannot be explained
by the industry-structure of the Finnish regions. For instance, worker outflow into
unemployment as well as worker inflow from unemployment has been particularly high in
Lappi. Controls for industry structure even reinforce this conclusion. Some other provinces
have also relatively high unemployment flows that cannot be explained by industry-
structures. They include Pohjois-Pohjanmaa and Kainuu in Northern Finland, for example.
In addition, the regression results with the industry controls confirm the earlier finding that
the churning rate has indeed been low in the eastern parts of Finland, especially in the
province of Kainuu.

100
8. Conclusions
The magnitude of gross job and worker flows is large, relative to net employment change
in the Finnish economy from the regional point of view. This observation corresponds to
the first so-called basic fact in the literature on gross job and worker flows. This means
that there is a great deal of gross job creation in the declining regions with a high average
unemployment rate in Eastern and Northern Finland. In addition, there is a great amount
of gross job destruction in the growing regions with low average unemployment in Sout-
hern Finland. The earlier empirical literature on the Finnish regional labour markets has
been totally silent about this underlying dynamics at the establishment level of the economy.
Thus, this study provided extensive evidence for the view that stresses the enormous
heterogeneity of regional labour market adjustment in Finland in contrast to the earlier
literature that has been focused solely on (net) employment changes.
The gross job reallocation rate has not been countercyclical by using establishment-level
data from the provinces of Finland. This observation is not in line with the established
“basic facts” of the literature on gross job and worker flows. One explanation is that the
establishment-level data of this study includes a number of non-manufacturing industries.21
In addition, the extreme depression of the 1990s caused a sharp crash in gross job creation
rates across the Finnish regions. The fluctuation of worker reallocation has been procyclical
in the Finnish regions over the period of investigation as in a number of other countries. In
addition, job reallocation is a large part of total worker reallocation in the Finnish regions.
The elaboration of gross job and worker flows reveals a number of regional patterns that
are impossible to detect by focusing solely on (net) employment changes. These patterns
of gross job and worker flows emerge despite the presence of the same institutional
characteristics (including labour market regulations) across regions in Finland. However,
there are distinct regional differencies, for example, in the intensity of active labour mar-
ket measures. In particular, there is no solid evidence at all for the widely held view that
the job creation rate is, on average, lower in Eastern and Northern Finland, where the
unemployment rate has been much higher than in Southern Finland during the past few
decades.
The rapid rise in regional unemployment rate disparities during the slump of the early
1990s (from 1991 to 1993) can be explained by the sharp rise in the regional disparities
in job destruction rates and in separation rates of workers. In contrast, during the slump
of the 1990s, there was a decline in regional disparities in job creation rates and in hiring
rates of workers. The highest level of job destruction at the bottom of the slump was in

101
the provinces of Eastern and Northern Finland. In fact, in 1991 almost a third of the jobs
in the selected industries of this study were destroyed in the province of Kainuu. In contrast
to the adjustment of labour markets in the slump of the early 1990s, during the recovery
of the economy (from 1994 to 1997), there has been a decline in the regional disparities
in job destruction rates and in separation rates of workers, but a rise in the regional
disparities of job creation rates and hiring rates of workers.
An explanation of this regional concentration of job destruction during the slump of the
early 1990s is the presence of the fatter left-hand tail of low-productivity jobs in Eastern
and Northern Finland. Thus, the extreme economic slowdown of the early 1990s that hit
all regions of Finland caused perhaps a more intensive time of “cleansing” in Eastern and
Northern Finland compared with Southern Finland, outlined in the model by Caballero
and Hammour (1994), when outdated or unprofitable techniques were pruned out of the
production system. Findings about the concentration of job creation, in turn, suggests that
jobs destroyed during the slump are disproportionally reallocated during the recovery to
regions that have favourable conditions for job creation. Those factors are likely to include
a skilled labour force and technological spillovers from surrounding firms that are fuelled
by agglomeration, to list the two most obvious candidates. In fact, Maliranta (2001) has
argued that job destruction in low and job creation in high productivity plants have positively
contributed the aggregate productivity of Finnish manufacturing since the late 1980s. These
empirical findings obtained are in keeping with the conjecture that this productivity-
enhancing restructuring at the plant level has had an interesting regional dimension.
There are interesting differences in the adjustment of labour demand during the great
slump of the early 1990s. For example, the rapid rise in unemployment in Kainuu can be
explained by a rise in the separation rate and a decline in the hiring rate during the great
depression in Finland. In contrast, during the same period there was no rise at all in the
separation rate in the province of Uusimaa, which constitutes the core of economic activity
in Finland. This means that the rise in the unemployment rate in Uusimaa can be explained
by a decline in the hiring rate, which, from the point of view of the province, is a less
painful mechanism to adjust the labour demand than a rise in the separation rate.
The magnitude of structural change measured by the churning rate is high in Uusimaa
compared with the other provinces of Finland. This means that the intensity of structural
change within plants is indeed high in Uusimaa, where the unemployment rate has been
low with respect to the other regions of Finland. On the other hand, Kainuu has the
lowest level of the churning rate, and the unemployment rate has been highest during the
past few decades. This observation is in line with the matching models in the tradition by

102
Mortensen and Pissarides (1994), according to which the high level of churning (i.e.
excess worker reallocation) is a manifestation of an intensive matching process, which
eventually delivers a lower equilibrium unemployment rate. The regression results indicate
that these differences cannot be reduced to the industry structure of the regions. Thus, the
results support the view that one of the most important underlying structural features that
explain the high unemployment rate of Kainuu is the fact that the structural change within
plants does not “revitalize” the economic structure of the region enough.
There are genuine regional elements in gross job and worker flows after taking account of
the variation of these measures from years and from industry structure despite the fact
that the extreme volatility of economic activity over the period of the investigation means
that much of the explained variation in gross job and worker flows can be attributed to
years (and also to industries). The role of these genuine regional elements is most important
in the case of the churning rate. In particular, the patterns of gross job and worker flows
that were characterized in this study cannot be explained by the industry structure of the
Finnish regions. In contrast, the regional differences in net employment growth rates in the
period from 1990 to 1997 can be reduced mainly to the differences in the industry structures
of the regions.
References
Abowd, J.M., P. Corbel and F. Kramarz (1999), “The entry and exit of workers and the
growth of employment: An analysis of French establishments.” The Review of Economics
and Statistics 81, 170–187.
Baldwin J., R. Dupuy and W. Penner (1992), “Development of longitudinal panel data
from business register: Canadian experience.” Statistical Journal of the United Nations
ECE 9, 289–303.
Baldwin, J.R. and G. Picot (1995), “Employment generation by small producers in the
Canadian manufacturing sector.” Small Business Economics 7, 317–331.
Bertola, G. and R. Rogerson (1997), ”Institutions and labor reallocation.” European
Economic Review 41, 1147–1171.
Burda, M. and C. Wyplosz (1994), “Gross worker and job flows in Europe.” European
Economic Review 38, 1287–1315.

103
Burgess, S., J. Lane and D. Stevens (1994), “Job flows, worker flows and churning.”
Discussion Papers 1125. Centre for Economic Policy Research.
Böckerman, P. (1998), “Alueet työttömyyden kurimuksessa.” (in Finnish). Studies 14.
The Foundation for Municipal Development.
- (2000), “Suomen työttömyys: Alueellinen näkökulma.” (in Finnish). In Suomalaisen
sosiaalipolitiikan alueellinen rakenne, 72–92. Eds. H.A. Loikkanen and J. Saari. Hel-
sinki: Sosiaali- ja terveysturvan keskusliitto ry.
Böckerman, P. and H. Piekkola (2001), “On whom falls the burden of restructuring?
Evidence from Finland.” In Nordic Labour Market Research on Register Data. Eds.
A. Holm and T.P. Jensen. Forthcoming.
Caballero, R.J. and M.L. Hammour (1994), “The cleansing effect of recessions.” The
American Economic Review 5, 1350–1368.
- (2000), “Institutions, restructuring, and macroeconomic performance.” Unpublished. MIT.
Davis, S.J. and J. Haltiwanger (1990), “Gross job creation and destruction: Microeconomic
evidence and macroeconomic implications.” NBER Macroeconomics Annual 5, 123–
168.
- (1999), “Gross job flows.” In Handbook of Labour Economics, Vol. 3B, 2711–2805.
Eds. O. Ashenfelter and D. Card. Amsterdam: North-Holland.
Davis, S.J., J. Haltiwanger and S. Schuh (1996), Job Creation and Destruction. Cam-
bridge, Mass.: The M.I.T. Press.
Devereux, M.P., R. Griffith and H. Simpson (1999), “The geographic distribution of
production activity in the UK.” Unpublished. Institute for Fiscal Studies.
Eberts, R.W. and E. Montgomery (1995), “Cyclical versus secular movements in
employment creation and destruction.” Working Papers 5162. National Bureau of
Economic Research.
Hall, R.E. (1999), “The concentration of job destruction.” Working Papers 7025. National
Bureau of Economic Research.

104
Haltiwanger, J.C. (1997), “Measuring and analyzing aggregate fluctuations: The importance
of building from microeconomic evidence.” Federal Reserve Bank of St. Louis May/
June, 55–77.
Haltiwanger, J.C. and C.J. Krizan (1999), “Small business and job creation in the United
States: The role of new and young businesses.” In Are Small Firms Important? Their
Role and Impact, 79–97. Ed. Z.J. Acs. Boston: Kluewer Academic Publishers.
Honkapohja, S. and E. Koskela (1999), “The economic crisis of the 1990s in Finland.”
Economic Policy 14, 400–436.
Huovari, J. (1999), “Alueelliset työttömyys- ja työllisyyserot.” (in Finnish). Working Papers
27. Pellervo Economic Research Institute.
Ilmakunnas, P., S. Laaksonen and M. Maliranta (1999), “Enterprise demography and
worker flows.” In Statistics, Registries, and Science. Experience from Finland, 73–
88. Ed. J. Alho. Helsinki: Statistics Finland.
Ilmakunnas, P. and M. Maliranta (2000a), “Työpaikkojen syntyminen ja häviäminen ja
työvoiman vaihtuvuus.” (in Finnish). Studies 209. Ministry of Labour.
- (2000b), “Työpaikkojen ja työntekijöiden vaihtuvuus laman ja elpymisen aikana.” (in
Finnish). Kansantaloudellinen aikakauskirja 96, 233–248.
- (2001), “The turnover of jobs and workers in a deep recession: Evidence from the Finnish
business sector.” Discussion Papers 747. The Research Institute of the Finnish Economy.
Ilmakunnas, P., M. Maliranta and J. Vainiomäki (1999), “The roles of employer and
employee characteristics for plant productivity.” Working Papers W–223. Helsinki School
of Economics and Business Administration.
Kangasharju, A. and J. Pehkonen (2001), ”Employment-output link in Finland: Evidence
from regional data.” Finnish Economic Papers 14, 41–50.
Maliranta, M. (1997), “Productivity performance in regions. Some findings from Finnish
manufacturing.” Unpublished. The Research Institute of the Finnish Economy.

105
- (2001), “Productivity growth and micro-level restructuring. Finnish experiences during
the turbulent decades.” Discussion Papers 757. The Research Institute of the Finnish
Economy.
Mortensen, D.T. and C.A. Pissarides (1994), “Job creation and destruction in the theory
of unemployment.” Review of Economic Studies 3, 397–415.
Nickell, S. (1998), ”Job tenure and labour reallocation.” Discussion Paper Series 32.
The Labour Market Consequences of Technical and Structural Change, Centre for
Economic Performance.
Ramey, V. and M. Shapiro (1998), “Displaced capital.” Discussion Papers 98–24. Uni-
versity of California, San Diego.
Romppanen, A. (1974), “Teollisuuden työpaikkojen uusiutuminen 1960-luvulla.” (in Fin-
nish). Erillisselvitys 8/1974. Taloudellinen suunnitelukeskus.
Schumpeter, J.A. (1942), Capitalism, Socialism, and Democracy. Harvard: Harper
and Row.
Tervo, H. (1998) “The development of regional unemployment differentials in Finland in
the 1990s.” Finnish Economic Papers 11, 37–49.

106
Appendix
Selected background statistics for the provinces of Finland (NUTS3).
Uusimaa 32.79 8.9 0.7 14.8 5.7 28.4 27.5 23.0
Varsinais-Suomi 9.00 10.4 4.9 26.0 6.8 20.8 17.7 23.9
Satakunta 4.71 13.1 6.4 28.9 6.0 19.9 15.5 23.3
Kanta-Häme 2.89 11.3 6.0 24.7 6.5 19.7 17.2 26.0
Pirkanmaa 8.86 12.7 3.4 27.9 6.1 20.0 18.4 24.2
Päijät-Häme 4.15 14.2 4.4 28.0 6.8 20.9 17.2 22.7
Kymenlaakso 3.85 12.7 5.4 23.8 6.8 23.4 16.5 24.1
Etelä-Karjala 2.66 12.7 6.3 24.7 6.7 21.6 16.7 24.1
Etelä-Savo 2.31 13.2 11.8 17.7 5.9 20.1 15.9 28.6
Pohjois-Savo 3.73 13.8 9.5 18.2 5.3 19.7 18.3 29.1
Pohjois-Karjala 2.25 15.6 9.3 20.0 5.6 18.9 16.6 29.5
Keski-Suomi 4.09 14.7 6.3 23.4 6.2 18.5 18.5 27.1
Etelä-Pohjanmaa 2.84 12.3 12.8 23.1 5.9 19.7 14.3 24.3
Pohjanmaa 3.19 9.3 8.9 26.5 4.9 18.2 15.9 25.6
Keski-Pohjanmaa 1.07 11.7 12.5 20.2 6.3 20.2 15.4 25.4
Pohjois-Pohjanmaa 5.36 14.1 6.9 24.1 6.2 19.2 16.9 26.8
Kainuu 1.14 17.7 9.4 16.8 5.5 19.4 18.1 30.7
Lappi 2.67 17.2 6.3 16.4 6.3 22.1 18.3 30.7
Itä-Uusimaa 1.68 8.2 6.0 28.4 7.8 19.4 16.7 21.8
Ahvenanmaa 0.72 2.7 4.7 8.7 5.4 43.0 15.4 22.8
*This column refers to the average share of employment in the province from 1988 to 1997
with respect to the whole Finnish economy. (These calculations by authors cover the selected
industries of this study.)
**This column refers to the average unemployment rate from 1990 to 1999 (Source: Statistics
Finland).
***The following columns about the employment shares of the main sectors in the Finnish
provinces (NUTS3) are based on the situation in 2000. The primary sectors cover agriculture,
forestry and fishing (A; B). (Source: Statistics Finland).
Sha
re o
fem
ploy
men
tin
the
Fin
nish
econ
omy*
, %A
vera
geun
empl
oym
ent
rate
**,
%
Em
ploy
men
tin
the
prim
ary
sect
ors*
**,
%
Em
ploy
men
t in
man
ufac
turi
ng, %
Em
ploy
men
tin
con
stru
ctio
n, % E
mpl
oym
ent
in t
rade
and
tran
spor
tati
on,
%
Em
ploy
men
tin
pri
vate
serv
ices
, %
Em
ploy
men
tin
pub
lic
serv
ices
, %

107
1 Davis and Haltiwanger (1999) provide a summary of the literature and a discussion aboutvarious measurement and conceptual differences that hamper available comparisions ofgross job and worker flows across countries.
2 For example, Nickell (1998) provides some evidence for this view.
3 Kangasharju and Pehkonen (2001) provide a recent analysis of growth and employmentin the Finnish regions. Böckerman (2000) provides a summary of the literature.
4 Caballero and Hammour (2000) stress the dynamic and the cumulative nature ofrestructuring in the economies.
5 An important feature of the measures of job creation and destruction is fact that all jobsare considered to be equal. In other words, these measures do not take into account theunderlying quality of jobs that are created and destroyed in the Finnish regions.
6 Davis and Haltiwanger (1999) provide a list of “basic facts” of the literature on reallocationwith additional references. Burda and Wyplosz (1994) provide empirical evidence on themagnitude of gross job and worker flows in Europe.
7 Ramey and Shapiro (1998) provide a number of interesting case studies on the fact thatreallocation can be very costly to the local economy. For example, they find by using informationon auction values that in the case of the closure of a Californian aerospace plant, the equipmentresale prices averaged only 35 percent of net-of-depreciation purchase values.
8 However, Eberts and Montgomery (1995) provide an analysis of job creation and destructionfor the U.S. states. A major finding of the study is that over time employment fluctuationsare associated primarily with job destruction, but across regions employment differencesare associated more with job creation. In addition, Devereux, Griffith and Simpson (1999)provide regional measures of job creation and destruction for the UK from the point ofview of agglomeration.
9 The data covers the period from 1987 to 1997. Linking employees to plants is a laboriousand challenging task to do and it seems that in the first two or three years, when theEmployment Statistics system was under construction, links were not always perfect.Consequently, worker and job flows derived from this data source may be somewhat biasedupward in these years. Indeed, a comparison of job flows with Business Register datasuggests that job creation and destruction rates are to some degree higher in EmploymentStatistics up to the year 1990, but henceforth these rates are closely in agreement witheach other between two data sources (see Ilmakunnas and Maliranta 2000b). The inclusionof the years 1988 and 1989 may thus yield a spurious view about the downward trend in thejob reallocation rate.
10 Romppanen (1974) provides an early investigation into gross job flows in the Finnisheconomy. The study covers manufacturing industries and it is based on Industrial Statistics.The study also provides some regional measures of gross job creation and destruction.However, a comparision of these results with the ones reported in the following sections ofthis study is not directly possible, because Romppanen (1974) has calculated the rates ofgross job creation and destruction simply by dividing t-1 employment. In addition, the regionsinvestigated by Romppanen (1974) are not the same ones as in this study.
11 The applied definition of the non-farming business sector excluding social and personalservices is, in detail, as follows: mining (C), manufacturing (D), energy etc. (E), construction(F), trade (G), hotels and restaurants (H), transportation etc. (I), finance (J), and realestate, business services etc. (K). This means that agriculture, forestry and fishing (A; B),public administration (L), education (M), health and social work (N), other social and personal

108
services (O), international organizations (Q), and industry unknown (X) are exluded fromthe evaluation of the regional gross job and worker flows. Ilmakunnas, Maliranta and Vainio-mäki (1999) contains a more detailed elaboration of the applied data. In addition, Ilmakunnasand Maliranta (2001, 3–4) provide a discussion of the establishment-level data.
12 Ilmakunnas, Maliranta and Vainiomäki (1999) provide a detailed illustration of linkageprocedures in the case of Finnish manufacturing industries.
13 This estimate is somewhat sensitive to the applied source of calculations. Business registersin Finland cover even the smallest establishments. A part of the entry and the exit ofestablishments is masked due to the fact exits of establishments also happen between themeasurement points of the data and employment is measured as an average in businessregisters.
14 Honkapohja and Koskela (1999) provide a detailed analysis of the great slump of theearly 1990s in Finland.
15 The fundamental tradeoff in the model by Davis and Haltiwanger (1990) is that a drop inpresent consumption due to reallocation activity delivers a rise in future consumption. Inother words, in a recession, it is more valuable to invest in reallocation, which is an essentialpart of solid long-term growth. Thus, the structural change in the economy will be moreintensive during recessions. This means that in terms of gross job flows, economic slowdownsare times of large job destruction and a mild decline in job creation.
16 Ilmakunnas and Maliranta (2000a) conclude that the volatility of the hiring rate wasstronger than the volatility of the separation rate during the great depression of the early1990s in the Finnish economy. The observation is in line with a recent study using Frenchestablishment-level data by Abowd, Corbel and Kramarz (1999), which concludes that theadjustment of employment is made primarily by reducing hires, not by changing the separationrates.
17 The allocation of active labour market measures is indeed heavily concentrated in Easternand Northern Finland. The strong regional correlation of WIFU and WOFU can emerge atleast for three reasons. The first reason is that the heavy doses of active labour marketmeasures can displace other employees into the pool of unemployed persons. The secondreason is that the allocation of active labour market measures can create a great number ofvarious short-term contracts that generate the high level of worker flows into and out ofunemployment. The third reason is that the during the 1990s it was possible to use activelabour market measures to renew unemployment benefits that were tied to past wages.
18 A related study, by Böckerman and Piekkola (2001), finds that the churning rate is higherfor employees with a higher university education compared with employees with only basiceducation. The churning rate is also higher for the young employees of the Finnish economy.
19 This finding may reflect the fact that the amount of intra-industry heterogeneity variesacross industries identified in the classification scheme that is applied here. It containsindustries whose plants are relatively homogeneous in the sense that the industry is specialisedin the production of few types of products. Some other industries, on the other hand, arecharacterised by large product variety and heterogenous plants specialised in the productionof different products. Divergence in the employment growth among plants can be expectedto be higher when plants operate different markets.
20 The detailed results from these regressions are available upon request from the authors.
21 In particular, a survey of the literature by Davis and Haltiwanger (1999) indicates thatmanufacturing industries tend to exhibit greater volatility of job destruction relative to jobcreation than non-manufacturing industries.

109
Unravelling the mystery of regional unemploymentin Finland
Petri Böckerman*
*Labour Institute for Economic Research. Pitkänsillanranta 3A,
FIN-00530 Helsinki, Finland. Fax: +358-9-2535 7332. Tel.: +358-9-2535 7330.
E-mail: [email protected]
Abstract
The study explores the determination of regional unemployment in Finland. The evaluation
of regional labour markets is based on unique, linked panel data that is created by matching
the conventional economic fundamentals with the measures based on gross flows of jobs
and workers. The striking empirical finding is that the reorganization of labour markets
lowers the unemployment rate in the Finnish regions. In other words, the reallocation of
labour resources seems to be good for regional employment.
JEL-code: J23, R23
Keywords: restructuring, reorganization, unemployment, gross flows, regional labour
markets

110
Introduction
Regional labour markets have gained a growing interest in Finland. The reason is that
there has been a rapid rise in the regional disparities in unemployment rates as part of the
export-led recovery from the great slump of the early 1990s (see, for example, Pehkonen
and Tervo 1998; Tervo 1998). As a consequence of this development, the regional
unemployment disparities across the twenty Finnish provinces measured by the standard
deviation of unemployment rates were approximately four times higher in 1997 compared
with the situation before the great slump of the early 1990s.1
Despite the apparent importance of regional labour markets, detailed empirical studies
that aim to relate the regional unemployment disparities to the underlying economic
fundamentals in Finland have not been available. In particular, the existing empirical
studies exclude an evaluation of the impact of restructuring in terms of gross flows of
jobs and workers on the regional unemployment rates.2 This notion seems to extend to
the whole of the literature on regional unemployment disparities (see, for example, Elhorst
2003).
Regional economies are in a state of continuous turbulence. The continuous reallocation
and the reorganization of scarce resources culminate in the functioning of labour markets,
where the reallocation of resources takes the form of gross job flows (i.e. job creation
and destruction), and gross worker flows (i.e. hirings and separations of workers) (see,
for example, Davis and Haltiwanger 1999). The reorganization view of regional labour
markets underlines the stylized feature that the pool of available jobs is not stagnant over
time. This restructuring at the plant level of the regions is most likely linked to the regional
unemployment problem.
This empirical study aims, therefore, to relate the regional unemployment disparities to
the economic fundamentals in Finland. Along with the conventional economic fundamentals
suggested by the available empirical literature on regional unemployment disparities, the
study considers the internal turnover in the regional labour markets measured by gross
job and worker flows based on the establishment-level dynamics of labour-demand
adjustment. In addition, the study includes an elaboration of the turnover between regional
labour markets measured by gross migration flows on the regional unemployment rates.3
By doing this, the study fills an important gap in the literature on regional labour markets
in Finland and provides detailed empirical evidence for the importance of restructuring
from the regional perspective.

111
The rest of the study is organized as follows. The second section provides the definitions
of gross flows of jobs and workers. The third section provides a survey of the literature
that has analyzed the connection of restructuring and unemployment from the regional
perspective. The fourth section provides a theoretical background and motivation for the
role of restructuring based on gross flows of jobs and workers. The fifth section of the
study includes a description of the linked data that is used to address the determination of
the unemployment rate in the Finnish regions. The sixth section reports the results and the
last section concludes.
Gross flows of jobs and workers
The gross flows of jobs and workers are measured as the number of jobs created or
destroyed or workers moving in and out of establishments (i.e. hirings and separations of
workers) (see Davis, Haltiwanger and Schuh 1996). This means that the measure of the
job creation rate is calculated as follows:
+JCt = ∑i∆Eit / ((∑i Eit + ∑ i Ei, t-1) /2), (1)
where E denotes employment in plant i year t and the superscript “+” refers to positive
changes. To convert time-t job flow measures to rates, job creation and destruction are
divided by the average of employment at t and t-1 in order to achieve technical advantages
over more conventional growth rate measures.4
The measure of the job destruction rate is calculated as follows:
-JDt = ∑i∆Eit / ((∑ i Eit + ∑ i Ei, t-1) /2) (2)
Thus, the job destruction rate is defined as the absolute value of the sum of negative
employment changes, divided by the average number of employees. The superscript “-”
refers to negative changes. Appendix 1 provides an example of the calculation of regional
gross flows of jobs.5
The definitions of job creation and destruction mean that the net rate of change of
employment (NET) is simply the difference of the measures of job creation and destruction:
NETt = JCt - JDt (3)

112
The sum of job creation and destruction rates is called the gross job reallocation rate
(JR):
JRt = JCt + JDt (4)
The excess job reallocation rate (EJR) equals (gross) job reallocation minus the absolute
value of the net employment change:
EJRt = JRt - NETt (5)
This means that the excess job reallocation rate is an index of simultaneous gross job
creation and destruction. Caballero (1998) notes that, for this reason, it is appropriate to
measure the magnitude of restructuring by the excess reallocation rate. In other words,
so-called excess job reallocation provides a coherent measure of structural change or
restructuring among the plants of the regions. In addition, it is a natural measure of
heterogeneity in the plant-level employment outcome among plants. If excess job
reallocation is above zero, then the magnitude of gross job reallocation is above what has
been necessary to accommodate the net employment changes of regional labour markets.6
The excess job reallocation rate is, therefore, a measure that captures the internal
reorganization of the regions. The novelty of the following empirical investigation is that
the turnover between regional labour markets is measured in the same way as the rate of
excess job reallocation. This means that the applied measure of external turnover is based
on the notion that the magnitude of simultaneous gross migration flows is an appropriate
measure for the intensiveness of reorganization across regional labour markets.
Comparison of information in two consecutive years can be used for calculating the number
of employees who have entered a plant during the year and are still working at the same
plant. The sum of these employees over all plants is worker inflow, or hiring. It is also
possible to identify those employees who are no longer working at a plant. This means
that the sum of these employees is worker outflow, or separation.
Dividing the worker inflow and outflow in a period of time by the average of employment
in periods t and t-1 delivers the worker inflow rate (WIF) and the worker outflow rate
(WOF). The difference between WIF and WOF is the net rate of change in employment:
NETt = WIFt - WOFt (6)

113
The worker flow rate (WF) is simply the sum of the hiring (WIF) and separation (WOF)
rates. In addition, the so-called churning rate (CF) can be defined as follows:
CFt = WFt - JRt (7)
These definitions mean that the churning rate ties worker flows and job flows together
and, therefore, completes the picture of the dynamics of labour adjustment at the
establishment level. In particular, the churning rate is an appropriate measure of the internal
reorganization of the regional labour markets, because the measure captures the fact that
the available vacancies of regional labour markets are subject to various idiosyncratic
shocks within plants. This is due to the comparision of worker flows with job flows. The
churning rate can indeed be called the “excess worker turnover rate”. Thus, an increase in
the rate of churning means that there is more reshuffling by workers that is not directly
related to job creation and destruction.
Previous related studies
Naturally, there have been a great number of earlier empirical studies on the nature and
consequences of the so-called structural change on the levels of employment and
unemployment. Those studies heavily emphasize the notion that the reallocation of labour
resources is one of the most important sources of unemployment. Restructuring is typically
associated with shifts in the shares of industries or certain components of labour demand.
In particular, Lilien (1982) documented a strong, positive time-series relationship between
aggregate unemployment and the cross-industry dispersion of employment growth rates
as an indication of large-scale sectoral shifts of the U.S. economy. Afterwards, Abraham
and Katz (1986) questioned this interpretation of the correlation.7
However, the available empirical applications based on the tradition started by Lilien
(1982) tend to apply aggregate data. In addition, the number of empirical studies that
look at restructuring and employment from the regional perspective is limited. The main
conclusion of the existing literature is that an increase in the rate of labour reallocation is
also a source of regional unemployment. However, the literature has certainly not stressed
the issue of restructuring by applying the concepts of gross flows of jobs and workers
that can be used to capture structural change at the plant level of the regions.
The existing literature can be summarized in a nutshell as follows. Holzer (1991) pays
attention to restructuring in connection with regional unemployment. The study analyzes

114
the effects of demand shifts within and between local labour markets on employment and
unemployment outcomes. The study is based on sales growth data at the firm or industry
level in the U.S. states. The key finding of the study is that demand shifts between local
areas account for large fractions of the observed variation in the unemployment and
employment levels. Samsom (1994) considers the role of demand shifts in the determination
of regional disparities of unemployment in Canada. The study is based on the shifts of the
Beveridge curves and it applies quarterly data on the vacancy rates and the unemployment
rates in the Canadian provinces. The study shows that the reallocation of labour resources
tends to yield an increase in the unemployment rates and the vacancy rates.
In particular, Hyclak (1996) has applied the measures of gross flows in the investigation
of restructuring by using data from 200 U.S. metropolitan areas. The measures of
restructuring include job reallocation. The evidence is, therefore, based on the measures
of gross job creation and destruction. However, Hyclak (1996) does not measure the
magnitude of restructuring by using the excess job reallocation rate. In addition, the study
does not pay attention at all to gross flows of workers. The evidence is limited to
manufacturing firms. Hyclak (1996) discovers empirical evidence for the notion that
structural changes in labour demand have played an important role in increasing the U.S.
urban unemployment rates in the first half of the 1980s. In contrast, the following empirical
investigation that applies data from the Finnish regions provides a different perspective on
the role of restructuring in the determination of unemployment rates. The turnover between
regional labour markets is captured by using the measures of gross flows of migration,
and the investigation of the Finnish case covers all regions of the country.
Theoretical underpinnings
The creation and destruction of jobs require workers to switch employers and to shuffle
between employment and joblessness. This means that unemployed workers are in a
state of reallocation. Reallocation of resources is indeed essential for the growth of modern
economies. Caballero and Hammour (1994) stress that restructuring of labour resources
is associated at the plant level of the economy with the adaptation of technology. In
particular, Caballero and Hammour (1994) argue that the newest technology can be
obtained only by creating new jobs, and the adoption of superior new technology requires
the destruction of old relationships. Under this perspective cyclical variation in job creation
and destruction is tightly linked to technological advance and obsolescence. This means
that restructuring by means of gross flows of jobs and workers revitalizes the economy.9
Moreover, Contini and Revelli (1997) argue that the underlying movements of jobs and

115
workers are tightly connected via the so-called “vacancy chain”. This mechanism means
that the hiring of a worker who is employed in another firm launches a whole sequence of
separations and hirings and, thereby, adjustment of jobs and workers at the establishment
level of the regions. This adjustment cannot be captured in detail by applying solely the
measure of the net rate of employment change. In particular, this adjustment of labour
demand can eventually cause large cumulative effects on employment and unemployment.
In addition, Acemoglu (2002) argues that churning is associated with the adaptation of
new vintages of technology. Technological progress at the plant-level of the regions provides
employment opportunities. In a nutshell, these features of economic progress mean that
the impact of restructuring at the plant level on unemployment is an empirical matter.
The data
Finland is divided into 85 sub-regions (the so-called NUTS-4 level in the European Uni-
on), the borders of which follow those of commuting districts quite closely. The yearly
observations cover the period from 1989 to 1996. The variables that are used to explain
regional unemployment rates can be divided into four broad categories. Thus, there are
variables that characterize (i) the industry structure of the regions, (ii) the structure of
labour force and gross migration flows, (iii) the intensity of restructuring at the establishment
level of the regions, and (iv) macroeconomic evolution of the Finnish economy during the
period of the investigation. In addition, there are selected additional regional variables
that include the productivity of the Finnish regions. The motivation for these variables
directly arises from the existing empirical studies that have investigated the determination
of the regional unemployment problem (see Elhorst 2003). Table 1 contains a description
of the variables and Appendix 2 provides selected descriptive statistics.

116
Table 1. The description of the applied variables.
Variable Definition/measurement
UN The number of unemployed in region i / labour force in region i (i.e. unemploy-ment is measured as fractions. For example, 34-percent unemployment isrepresented as 0.34)
a. The measures of industry structure:AGRI Value added by agriculture in region i / GDP in region i (reference)MANU Value added by manufacturing industries in region i / GDP in region iMETA Value added by metal industries in region i / GDP in region iELEC Value added by electronics in region i / GDP in region iSERV Value added by private services in region i / GDP in region iPUBL Value added by public sector in region i / GDP in region iHIGH Value added by high-tech manufacturing in region i / GDP in region iHISE Value added by high-tech services in region i / GDP in region i
b. The measures of labour force and gross migration flows:AGED The number of employees aged from 55 to 65+ in labour force in region
i / labour force in region iUNSK The number of employees with basic education only in labour force in region
i / labour force in region iDENS The number of employees in region i divided by surface area in region i (km2)MIG1 Gross inward migration of employees with higher university degrees to region
i / gross inward migration of employees (total) to region iMIG2 (Gross inward migration to region i + gross outward migration from region i)
– gross inward migration to region i – gross outward migration from i dividedby average population in region i. Thus, MIG2 is an index of simultaneousgross inward and outward migration.
c. The measures of restructuring at the establishment level of the regions:EJR The excess job reallocation rate in region iCF The churning rate in region i
d. The additional regional variables:PROD Value added in region i divided by average population in region iDEBT Long-term municipal debt held in region i divided by average population in
region i
e. The macroeconomic indicators:TERM Terms of trade (export price index divided by import price index) (Source:
Statistics Finland)REAL Real average lending rate by the Finnish banks (deflated by production price
index) (Source: Bank of Finland and Statistics Finland)

117
The variables that characterize the industry structure and the properties of the labour
force (including gross migration flows) across regions are collected by using aggregate
data from Statistics Finland. The measurement of regional gross job and worker flows is
based on large longitudinal data of employees during the period from 1988 to 1996 (see
Böckerman and Maliranta 2001). This kind of data is indeed rarely available for the
elaboration of regional dynamics. For instance, it is not at all possible to calculate gross
flows of workers at the state level of the U.S. economy (see Shimer 2001). The applied
measures of gross job and worker flows cover the non-farming business sector of the
Finnish economy excluding social and personal services, which includes more than 1.1
million employees in about 100 000 plants.
The following evaluation of regional labour markets in Finland is based on this linked
panel data set that is created by matching the conventional economic fundamentals with
the measures based on gross job and worker flows of the regions. The business cycle
movements of the Finnish economy are captured by including the key macroeconomic
indicators. However, the inclusion of year dummies instead of the macroeconomic indicators
yields the same results as the ones reported in the following section of this study (i.e.
Table 3 and Appendix 3), because the coefficients of the macroeconomic variables are
estimated by using time-series variation only in the following regression models.
Based on the applied data, regional disparities are definitely sharp in Finland. Figure 1
provides the Kernel density estimates for the distribution of the unemployment rate for
the year 1991 (i.e. the bottom of the great slump of the early 1990s) and the year 1996.10
The figure reveals that there have not been major changes in the shape of the distributions
of the unemployment rates across the Finnish regions despite the fact that there has been
a sharp increase in the average unemployment rate with a rise in the dispersion of the
unemployment rates at the same time. In particular, there is no empirical evidence for the
bipolarization of the underlying distribution of the regional unemployment rates during the
1990s. Figures 2 and 3 provide the distributions of the excess job reallocation rate and
the churning rate in 1991 and in 1996.11 There is evidently a great deal of variation in
these measures of restructuring. In particular, the excess job reallocation rate shows
procyclical movements. There is also a certain amount of persistence in the applied measures
of reallocation. In particular, the churning rate has been at a lower level in Eastern and
Northern Finland compared with Southern Finland over the period of investigation. In
contrast, the underlying regional disparities of the excess job reallocation rate have not
been as persistent as the churning rate. Table 2 provides the correlation coefficients between
the applied measures of restructuring and the unemployment rate. There seems to be
selected preliminary empirical evidence for the perspective that an intensive pace of

118
restructuring at the plant level of the Finnish regions is associated with low levels of the
unemployment rate, which would be in conflict with the earlier empirical literature that has
heavily underlined the role of restructuring as an important source of the regional
unemployment problem.
Fig. 1. Kernel density estimates for the distribution of the unemployment rate in the Fin-
nish regions for the year 1991 and the year 1996.
Fig. 2. The distribution of the excess job reallocation rate across the Finnish regions in
1991 and 1996.
UN
year 1991 year 1996
0 .1 .2 .3 .4
0
5
10
15
0
10
20
30
40
50
60
1 6 11 16 21 26 31 36 41 46 51 56 61 66 71 76 81
1991 1996

119
Fig. 3. The distribution of the churning rate in the Finnish regions in 1991 and 1996.
Table 2. The correlation coefficients.
UN EJR CF MIG2
UN 1.00EJR -0.25 1.00CF -0.50 0.37 1.00
MIG2 0.04 0.09 0.12 1.00
Empirical strategy and the results
Since the linked panel data of the study cover all NUTS4 regions in Finland, the
determination of the regional unemployment rates can be captured by applying a fixed
effects model, as follows:
UNit = a + νi + b’Xit + eit (8)
where i = 1,…,85; t = 1,…,8, and UN stands for the applied measure of the unemployment
rate. X is a vector of the conventional regional economic fundamentals and the measures
0
5
10
15
20
25
30
35
40
45
1 6 11 16 21 26 31 36 41 46 51 56 61 66 71 76 81
1991 1996

120
of restructuring based on gross flows of jobs and workers. In addition, νi represents fixed
effects measure by the regional dummies and eit is a normally distributed error term.
The estimation results that are robust for the inclusion of the macroeconomic indicators
can be summarized as follows (Table 3). The high volume of simultaneous gross inward
and outward migration lowers the regional unemployment rate in Finland owing to more
efficient matching between employees and establishments. The measures of job and worker
turnover are indeed linked to the regional unemployment problem. In particular, the results
concerning structural change indicate that the high level of restructuring in terms of excess
job reallocation and churning lowers the unemployment rate. In other words, there is
empirical evidence for the notion that a high degree of simultaneous gross job creation
and destruction and excess worker turnover pushes down the unemployment rate in the
Finnish regions.

121
Table 3. The results from the fixed effects model (dependent variable: UN).
Variables Coefficients t-statistics
Constant 1.1806** 16.30
MANU 0.0077 0.16META 0.0073 0.17ELEC -0.0944 -1.08SERV 0.0386 0.56PUBL 0.2147** 2.90HIGH 0.0804 0.92HISE -0.6440** -3.99
AGED 1.4910** 10.00UNSK -1.3774** -21.18DENS -0.0009** -2.04MIG1 0.0161 0.40MIG2 -1.2519** -8.13
EJR -0.0243** -2.15CF -0.1103** -5.11
PROD -0.4956** -2.42DEBT 0.0048** 5.39
TERM -0.0060** -18.81REAL -0.0033** -8.57
R2 0.94
F(18,663) 595.53
Notes: ** (*) indicates that the parameter estimate is statistically significant at the 5 (10)per cent significance level. The inclusion of year dummies instead of the macroeconomicindicators (i.e. the variables TERM and REAL) produces the same results as the onesreported in the table.
The empirical evidence, therefore, supports the perspective that restructuring at the
establishment level of the economy in terms of the so-called “creative destruction” by
Schumpeter (1942) seems to yield a decline in the regional unemployment rates in Fin-
land. These results differ from the earlier empirical studies that emphasize the role of

122
restructuring as an important source of the regional unemployment problem. This means
that the measures that capture a plant-level adjustment of labour demand can indeed
provide an interesting perspective on the nature and the consequences of the underlying
reorganization of regional labour resources.
The rest of the estimation results from Table 3 can be summarized in a nutshell as follows.
The industry structure is not an important determinant of the regional unemployment rates.
However, the results support the view that a high share of the public sector pushes up the
unemployment rate. This result is in line with a simple correlation applying aggregate data
from the Finnish provinces, because the share of the public sector is higher in Eastern and
Northern Finland, where the unemployment rate has indeed been higher than in Southern
Finland during the past few decades. However, this feature does not necessary imply
strong policy conclusions, because the role of the industry structure in modelling the
determination of the unemployment rate across the Finnish regions is rather that of a
control variable. As Appendix 2 reveals, there is a large regional variation in the share of
subsectors of manufacturing industries (i.e. metal industries and electronics) across the
Finnish regions. However, there is no effect from these subsectors on regional
unemployment rates. An increase in the share of rapidly growing high-tech services pushes
down unemployment, owing to the labour-intensive character of these activities.13 In
addition, an increase in the share of so-called aged employees raises unemployment, but
an increase in the share of unskilled employees pushes down the unemployment rate.14
The result remains in the case where the share of unskilled employees is divided by the
average population. This seems to suggest that the so-called “discouraged worker effect”
is not behind the result that an increase in the share of unskilled employees pushes down
the unemployment rate. There is empirical evidence that an increase in the density of
economy activity leads to a decline in the unemployment rate. This effect is probably due
to the so-called thick market externalities via regional labour market pooling.15 A high
level of productivity lowers the unemployment rate. In contrast, a high level of public debt
held by municipalities leads to an increase in the unemployment rate. This effect is most
likely due to the fact that the high level of regional public debt tends to coincide with the
high level of taxation that depresses economic activity. Another possible interpretation of
the result is that a sluggish economic growth with an increase in unemployment yields a
decline in tax revenues and therefore induces a rise in regional public debt.
In addition to an application of the earlier static model that is based on the fixed effects
that are measured by the regional dummies, the regional unemployment problem can
elaborated by means of the following dynamic specification:16

123
(9)
The model set up in the equation (9) can be estimated by employing the GMM method
presented by Arellano and Bond (1991) for the first differenced equation. Although
differencing eliminates the regional effects, it induces a negative correlation between the
lagged dependent variable, ∆Yit-1, and the disturbance term ∆εit. The lagged values of
the variables in levels are therefore used as instruments. Strongly exogenous variables are
allowed to influence the rate of regional unemployment from periods t-1 and t-2. In the
case of endogenous variables, the effects are allowed to arise from the current period, t,
and from the period t-1.
In the context of regional unemployment, there are three endogenous variables, viz. the
excess job reallocation rate, the churning rate and the measure of simultaneous gross
migration flows across the regions of Finland. There is earlier empirical evidence that the
regional excess job reallocation rates exhibit procyclical movements over the period of
the investigation (see Böckerman and Maliranta 2001). In particular, an increase in the
unemployment rate may induce a decline in the excess job reallocation rate. This means
that there is a potential two-way causal relationship between the unemployment rate and
the excess job reallocation rate that needs to be taken into account. In other words, the
specification is able to incorporate the dynamics and the endogeneity of the variables that
are used to capture the reorganization of regional labour markets.
The estimation results of the equation (9) are reported in Appendix 3. The reported
specification survives the Sargan test for the validity of the instruments. The estimation
results support the perspective that the industry structure of the regions is not an important
element in the determination of regional unemployment in Finland. In particular, the earlier
conclusion about the role of simultaneous gross migration flows and the churning rate
survives a dynamic specification of the relationship. In other words, there is additional
empirical evidence for the notion that an intensive pace of reorganization in regional labour
markets is indeed linked to the low level of unemployment in Finland. However, based on
the dynamic specification reported in Appendix 3, there is, in fact, no empirical evidence
for the view that an increase in the excess job reallocation rate is able to yield a decline in
the regional unemployment rates. This result arises most likely due to the endogeneity of
the excess job reallocation rate.17 Moreover, the share of unskilled employees yields a
different conclusion as a lagged variable in comparison with the earlier static model that
incorporates the fixed effects.
∑∑=
−=
− ε+η+β+α=P
0kitikt,ip
P
1kkt,ipit XUNUN .

124
Conclusions
The study explored the determination of the unemployment rates by using data from the
regions of Finland. The striking empirical finding based on gross flows of jobs and workers
is that the internal and the external reorganization of labour markets lowers the
unemployment rate in the Finnish regions. The essential role of restructuring in the
determination of regional unemployment has some direct relevance for regional policy. In
particular, these findings provide empirical support for the perspective that various public
measures should not be aimed at aiding contracting plants since restructuring at the
establishment level of the economy will eventually yield a lower unemployment rate. In a
nutshell, the reallocation of labour resources seems to be good for regional employment.
Acknowledgements – I am grateful to Pekka Ilmakunnas, Reija Lilja and Mika
Maliranta for comments. In addition, I would like to thank two anonymous referees for
valuable comments and suggestions. Paul A. Dillingham has kindly checked the language.
The usual disclaimer applies.

125
Appendix 1.
The calculation of gross flows of jobs and the net rate of employment change.
Let us assume that there are two regions and two plants in the economy. The plants are
called A and B. Plant A has 7 employees in Region 1 and 3 employees in Region 2 in the
period t-1. Plant B has 1 employee in Region 1 and 4 employees in Region 2 in the period
t. The set-up of the example is given in the following table:
Plant Period t-1 Period t
Region 1 Region 2 Region 1 Region 2
A 7 3 14 6B 2 8 1 4
SUM 9 11 15 10
This means that the total number of jobs has doubled in Plant A. In contrast, in the case of
Plant B, the total number of jobs has decreased by 50%. The applied measures of gross
job flows and the net rate of employment change for the regions are as follows:
Region 1 Region 2
JC (14-7)/((9+15)/2)=0.58 (6-3)/((11+10)/2)=0.29JD |(1-2)|/((9+15)/2)=0.08 |(4-8)|/((11+10)/2)=0.38NET 0.58-0.08=0.5 0.29-0.38=-0.10
EJR (0.58+0.08)-|0.5|=0.17 (0.29+0.38)-|-0.1|)=0.57

126
Appendix 2.
The selected descriptive statistics.
Variables Mean STD MIN MAX
UN 0.17 0.08 0.01 0.34
AGRI 0.15 0.09 0.00 0.42MANU 0.32 0.12 0.07 0.64META 0.05 0.06 0.00 0.54ELEC 0.03 0.03 0.00 0.41SERV 0.32 0.07 0.18 0.64PUBL 0.19 0.06 0.07 0.39HIGH 0.01 0.03 0.00 0.35HISE 0.01 0.01 0.00 0.06
AGED 0.11 0.02 0.07 0.21UNSK 0.36 0.05 0.21 0.53DENS 10.89 20.25 0.20 186.24MIG1 0.15 0.03 0.07 0.27MIG2 0.05 0.02 0.02 0.11
EJR 0.26 0.08 0.10 0.84CF 0.21 0.06 0.07 0.52
PROD 0.20 0.04 0.10 0.41DEBT 4667 1431 1374 10608
TERM 97.30 3.33 91.70 101.50
REAL 7.53 2.72 4.18 12.47

127
Appendix 3.
The GMM estimation results (dependent variable: UN).
Variables Coefficients t-statistics
Constant 0.0186** 3.85
Dependentt-1 0.2825** 2.67
MANU t-1 -0.0394 -0.85MANU t-2 -0.0092 -0.19METAt-1 0.0252 0.48METAt-2 0.0140 0.28ELEC t-1 0.1076 1.47ELEC t-2 -0.0246 -0.31SERV t-1 0.1143 1.36SERV t-2 0.0014 0.02PUBL t-1 0.1141* 1.65PUBL t-2 0.0030 0.04HIGH t-1 -0.0392 -0.60HIGH t-2 -0.0100 -0.19HISE t-1 -0.0968 -0.66HISE t-2 -0.0555 -0.35
AGED t-1 -0.1990 -0.76AGED t-2 0.7298** 3.42UNSK t-1 0.8232** 3.19UNSK t-2 -0.1150 -0.44DENS t-1 -0.0005 -0.40DENS t-2 0.0003 0.30MIG1t-1 1.2910** 3.12MIG1t-2 0.7169* 1.78MIG2+
t -5.0125** -2.85MIG2+
t-1 -4.9203** -2.66
EJR+t 0.0159 0.77
EJR+t-1 0.0130 0.95
CF+t -0.1121** -2.55
CF+t-1 -0.0027 -0.10
PROD t-1 -0.0390** -5.23PROD t-2 0.0008 0.13DEBT t-1 -0.0001 -0.12DEBT t-2 -0.0004 -0.36

128
TERMt-1 -0.0027** -4.43TERM t-2 0.0006 1.45REALt-1 -0.0014** -2.16REAL t-2 0.0059** 9.63
Test statisticsWALD 8140.71SARGAN 0.21AR(2) 0.98
Instruments
Lag length 1
Notes: ** (*) indicates that the parameter estimate is statistically significant at the 5 (10)per cent significance level. The reported estimation results correspond to the 1-step estimates.The WALD test is a test for the joint significance of the explanatory variables. The SARGANtest is a test for overidentifying restrictions and it refers to the 2-step estimates. The AR(2)test refers to the second order autocorrelation of the residuals that correspond to the 2-stepestimates. The SARGAN and the AR(2) test statistics are reported as p-values. Thesuperscript ‘+’ indicates that the variable is instrumented. Instruments indicate the numberof lags of the dependent variable (i.e. the regional unemployment rate). The inclusion ofyear dummies instead of the macroeconomic indicators (i.e. the variables TERM and REAL)produces the same results as the ones reported in the table.
References
Abraham, K. G. and Katz, L. F. (1986), Cyclical unemployment: sectoral shifts or aggregate
disturbances?, J. Pol. Econ. 84, 367–388.
Acemoglu, D. (2002), Technical change, inequality and the labor market, J. Econ. Lit.
40, 7–72.
Arellano, M. and Bond, S. R. (1991), Some tests of specification for panel data: Monte
Carlo evidence and an application to employment equations, Review of Economic Stuies
58, 277–297.
Bond, S. (2002), Dynamic panel data models: a guide to micro data methods and practice.
Working paper CWP09/02. The Institute for Fiscal Studies, London.
Böckerman, P. and Maliranta, M. (2001), Regional disparities in gross job and worker
flows in Finland, Finnish Economic Papers 14, 84–103.

129
Böckerman, P. and Piekkola, H. (2001), On whom falls the burden of restructuring?
Evidence from Finland, in Jensen T. P. and Holm A. (eds.) Nordic Labour Market
Research on Register Data, 73–117. Nordic Council of Ministers, TemaNord
2001:593, Copenhagen.
Caballero, R. (1998), Comments, in Fuhrer J. C. and Schuh S. (Eds) Beyond Shocks:
What Causes Business Cycles?, 338–348. Federal Reserve Bank of Boston, Conference
Series 42, Boston.
Caballero, R. and Hammour, M. (1994), The cleansing effect of recessions, Am. Econ.
Rev. 84, 1350–1368.
Chalmers, J. A. and Greenwood, M. J. (1985), The regional labour market adjustment
process: determinants of changes in rates of labor force participation, unemployment, and
migration, The Annals of Regional Science 19, 1–17.
Contini, B. and Revelli, R. (1997), Gross flows vs. net flows in the labour market: what is
there to be learned?, Labour Economics 4, 245–263.
Davis, S. J. and Haltiwanger, J. (1999), Gross job flows, in Ashenfelter O. and Card D.
(Eds) Handbook of Labour Economics, Vol. 3B, 2711–2805. North-Holland, Amster-
dam.
Davis, S. J., Haltiwanger, J. and Schuh, S. (1996), Job Creation and Destruction. The
MIT Press, Cambridge, MA.
De Long, J. B. (1990), Liquidation cycles: old-fashioned real business cycle theory and
the Great Depression. Working Papers 3546. National Bureau of Economic Research,
Cambridge, MA.
DiNardo, J. and Tobias, J. L. (2001), Nonparametric density and regression estimation,
Journal of Economic Perspectives 15, 11–28.
Elhorst, J. P. (2003), The mystery of regional unemployment differentials: A survey of
theoretical and empirical explanations, Journal of Economic Surveys, (Forthcoming).
Fujita, M., Krugman, P. and Venables, A. J. (1999), The Spatial Economy. The MIT
Press, Cambridge, MA.

130
Holzer, H. J. (1991), Employment, unemployment and demand shifts in local labor markets,
The Review of Economics and Statistics 73, 25–32.
Hyclak, T. (1996), Structural changes in labor demand and unemployment in local labor
markets, J. Reg. Science 36, 653–663.
Ilmakunnas, P. and Pesola, H. (2002), Matching functions and efficiency analysis. Working
Papers W–308. Helsinki School of Economics.
Kiander, J. and Vartia, P. (1996), The great depression of the 1990s in Finland, Finnish
Economic Papers 9, 72–88.
Lilien, D. M. (1982), Sectoral shifts and cyclical unemployment, J. Pol. Econ. 80, 777–
793.
Loungani, P., Rush M. and Tave, W. (1990), Stock market dispersion and unemployment,
Journal of Monetary Economics 26, 367–388.
Pehkonen, J. (1999), Unemployment and home-ownership, Applied Economic Letters
6, 263–265.
Pehkonen, J. and Tervo, H. (1998), Persistence and turnover in regional unemployment
disparities, Reg. Studies 32, 445–458.
Samsom, L. (1994), The Beveridge curve and regional disparities in Canada, Applied
Economics 26, 937–947.
Schumpeter, J. A. (1942), Capitalism, Socialism, and Democracy. Harper and Row,
Harvard.
Shimer, R. (2001), The impact of young workers on the aggregate labor market, The
Quarterly Journal of Economics 116, 969–1007.
Tervo, H. (1998), The development of regional unemployment differentials in Finland in
the 1990s, Finnish Economic Papers 11, 37–49.

131
1 Kiander and Vartia (1996) provide a survey of the great slump of the early 1990s inFinland.
2 Pehkonen (1999) provides an empirical evaluation for the factors in the Finnish regionalunemployment rates by applying cross-sectional data from 1991 that covers thirteen labourdistricts. The study does not include a consideration of the industry structure nor theelaboration of restructuring at the establishment level of the Finnish regions.
3 There have been some earlier empirical studies that investigate the effect of net in-migrationon the regional unemployment rates (see Elhorst 2003), but these studies exclude the use ofgross migration flows as a measure of reorganization between regions. In particular,Chalmers and Greenwood (1985) argue that the effect of net in-migration on regionalunemployment is an empirical question and cannot be solved by theoretical considerationsowing to the fact that net in-migration causes both regional labour supply and demand toincrease.
4 Unlike the conventional growth rate measures, which divide employment change by laggedemployment and range from -1.0 to ∞, the applied growth rate measure ranges from -2.0to 2.0 and the growth rate measure is symmetric around zero.
5 The measures of gross job and worker flows are calculated from a plant-level micro dataand they are then aggregated to correspond to the so-called NUTS-4 level of the EuropeanUnion.
6 In addition, the external turnover of regional labour markets is measured by the share ofgross inward migration of employees with higher university degrees. The motivation forthis is that the underlying mobility rates have been found to be higher for employees with ahigher university education compared with employees with only basic education (seeBöckerman and Piekkola 2001).
7 There has been a large body of empirical research to find better proxies for allocativeshocks. For example, Loungani, Rush and Tave (1990) argue that dispersion in stock pricescould be used to identify allocative shocks across sectors. In particular, they claim that thestock market dispersion index is less contaminated by aggregate demand influences thanthe employment dispersion index by Lilien (1982) because sectoral stock prices are likelyto react to disturbances that are perceived to be permanent by nature, which need not betrue of sectoral employment changes.
8 Thus, the model neglects the notion that new technologies can also be adopted by peoplewithin their jobs.
9 In fact, the way of thinking that economic slowdowns tend to revitalize the economy wasprominent in pre-Keynesian economic theory (see, for example, De Long 1990).
10 Epanechnikov is the applied kernel density estimate. It has the property that it is the mostefficient in minimizing the mean integrated squared error. DiNardo and Tobias (2001) providean introduction to kernel density estimates.
11 The figures may give an impression that there are certain outliers in the distributions ofthe excess job reallocation rate and the churning rate. However, it must be rememberedthat some of the NUTS4 regions are indeed small measured by the number of employeesand therefore large fluctuations can be understood as a consequence of an episode ofextreme business cycle movements in Finland during the 1990s.
12 A related empirical study by Ilmakunnas and Pesola (2002) discovers that a high churningflow improves matching in the Finnish regions.

132
13 The so-called new economy would be a dubious cure for the regional unemploymentproblem in Finland owing to the fact these high-tech services typically require skills thatunemployed persons lack.
14 The reported specification includes selected measures of industry structure and themeasures of gross migration flows. The results concerning the variable that captures theshare of unskilled employees are therefore not directly affected by the regional dispersionof the industry structure. In other words, the share of unskilled employees is not simply aproxy variable for the industry structure of the regions.
15 The models based on the ideas of the so-called new economic geography stress theseeffects (see, for example, Fujita, Krugman and Venables 1999).
16 Bond (2002) provides a summary of dynamic panel data models.
17 The fixed effects and the GMM estimation results differ for two reasons. The first pointis that the fixed effects model assumes that the explanatory variables are strictly exogenous,i.e. uncorrelated with the past, present and future realisations of eit. The second point isthat the within-group estimator generates inconsistent estimates in dynamic specificationsif the number of time periods is fixed.

133
Perception of job instability in Europe*
Petri Böckerman**
*Financial support from the Yrjö Jahnsson Foundation is gratefully acknowledged. I am
grateful to the European Foundation for the Improvement of Living and Working Conditions
for allowing me to use their Employment Options Survey Data in this study. I am grateful
to Pekka Ilmakunnas, Erkki Koskela and Reija Lilja for comments. In addition, I am
grateful for comments at the 17th Annual Congress of the European Economic Associati-
on in Venice. Paul A. Dillingham has kindly checked the language. The usual disclaimer
applies.
**Labour Institute for Economic Research, Pitkänsillanranta 3A, FIN-00530 Helsinki,
Finland.
Abstract
The perception of job instability is an important measure of the subjective wellbeing of
individuals, because most people derive their income from selling their labour services.
The study explores the determination of the perception of job instability in Europe. The
study is based on a large-scale survey from the year 1998. There are evidently large
differences in the amount of perceived job instability from country to country. The lowest
level of perceived job instability is in Denmark (9%). In contrast, the highest level of
perceived job instability is in Spain (63%). Perceived job instability increases with age
and an earlier unemployment episode. An increase in the educational level, on the other
hand, leads to a decline in the perception of job instability. In addition, a temporary
contract as such does not yield an additional increase in the perception of job instability.
The perception of job instability is more common within manufacturing industries and
there is some evidence for the view that it increases according to the size of the firm.
JEL-code: J63
Keywords: gross flows, job instability, job insecurity

134
1. Introduction
The empirical evidence on the dynamics of labour demand by firms suggests that market
economies are definitely in a state of continuous turbulence. Each year, on the one hand,
many businesses expand (and succeed), while, on the other hand, many others contract
(and fail). Joseph A. Schumpeter (1942) called this underlying process of capitalism by
the expression “creative destruction”. The reallocation and the reorganisation of resources
therefore culminates in the functioning of labour markets, where the reallocation of scarce
resources takes the form of gross job and worker flows.1 The magnitude of these gross
flows is enormous in comparison to the net rate of employment change. Davis and
Haltiwanger (1999) report that in most Western economies roughly ten per cent of jobs
are created/destroyed each year. Gross worker flows are even larger in magnitude.
Gottschalk and Moffitt (1998) stress that the implicit normative assumption behind much
of the public discussion of job and worker turnover is that turnover is undesirable, because
it is either ”involuntary” or leads to worsened outcomes, such as an increase in the
probability of unemployment or a decrease in wages.
However, this apparent job instability implied by the enormous magnitude of job turnover
and gross worker flows is not as such a malaise, because a large part of the gross worker
flows is, in fact, inherently voluntary by nature. For example, the voluntary turnover of
workers is often related to career concerns of individuals. In fact, this feature of labour
markets suggests that the realized patterns of gross job and worker turnover and the
perception of job instability among workers are not necessarily closely correlated with
each other. However, the perception of job instability is closely linked to the underlying
welfare of individuals, which should be the ultimate focus of any economic policy exercise.
This is due to the fact that for the large majority of employees only one match with an
employer comprises most of the current earnings, making their welfare closely related to
the potential risk of losing their job in the presence of incomplete insurance against shocks
(i.e. the so-called replacement rate of unemployment insurance is almost always less than
100%).2 The perception of job instability therefore constitutes an important measure of
the subjective wellbeing of individuals. This means that it is indeed interesting to investigate
what the most important underlying fundamentals that determine the distribution of the
perception of job instability at the individual level are. By doing this, the following empirical
investigation complements the picture of European labour markets painted by a large
number of recent empirical studies on gross job and worker flows.
The aim of this study is therefore to investigate the empirical determination of the perception
of job instability by using unique survey data from all the 15 member states of the European

135
Union and Norway.3 This means that the following study provides detailed empirical
evidence, for example, on the individual characteristics such as age and education that
are related to the perceived job instability of individuals in European labour markets. In
addition, the study includes a consideration of job and firm characteristics and their role
in the determination of the perception of job instability. In other words, this unexploited
data makes it possible to evaluate the whole spectrum of economic fundamentals that
give rise to the perception of job instability among European workers. The following
empirical results are indeed somewhat different with respect to ones obtained recently by
using U.S. surveys. Thus, the study is able to contribute to the current discussion on the
differences of European-style labour markets compared with the U.S. labour markets.4
This study appears in four sections. The first section of the study provides a brief overview
of earlier empirical investigations into the perceived job instability of individuals. The
motivation of the selected variables in the estimated equation is therefore broadly based
on previous empirical literature on the incidence of perceived job instability at the individual
level of the economy. The second section provides a description of individual-level survey
data that is used to assess the current characteristics of job instability in the context of
European labour markets. The third section of the study provides a detailed analysis of
the incidence of perceived job instability by applying Probit models. In addition, it contains
an elaboration of the robustness of the empirical patterns. The fourth section concludes.
2. Previous related studies
There have indeed been a great number of empirical studies on with the aim to document
and investigate the realized patterns of job instability.5 However, there are a rather limited
number of empirical investigations that aim to investigate the empirical determination of
perceived job instability of individual workers. The latter studies require detailed survey
data. In addition, the focus of the available empirical literature on the perceived job instability
has been heavily on the unregulated Anglo-Saxon labour markets. The following
investigation concerning the determination of perceived job instability in all the 15 member
states of the European Union and Norway provides an interesting opportunity for cross-
country comparison and fills an important gap in the earlier literature.6
The perception of job insecurity is indeed a fact of life and it is not possible to remove a
major part of job instability by holding a diversified portfolio of publicly traded assets.
For example, Davis and Willen (1999) have studied the correlation between earnings
shocks and asset returns in the context of the U.S. labour markets. According to the

136
results, the correlation between returns on the S&P 500 and earnings shocks exceeds
0.4 for older, college-educated women, ranges from 0.1 to 0.3 over most of the life cycle
for college-educated men and is roughly -0.25 for men who did not finish high school.
This means that trade in a broad-based equity index enables individuals to hedge only a
small portion of the group-level earnings risk induced by the underlying heterogeneity of
individuals.
There has been a lively discussion on the issue of perceived job instability in the U.S.
Schmidt (1999) provides empirical evidence for the commonly held view that there has
been a rise in the perception of job loss among workers as a whole during the 1990s.
Aaronson and Sullivan (1998) present empirical evidence of individual characteristics
that are related to the incidence of job insecurity. Dominitz and Manski (1996), and
Gottschalk and Moffitt (1998) present additional empirical evidence. Manski and Straub
(2000) provide the most recent detailed investigation on the issue. Worker perceptions of
job insecurity peaked in 1995.7 According to the results concerning individual
characteristics of American workers, the expectations of job insecurity are not related to
the age of individuals. Subjective probabilities of job loss tend to decline with additional
years of schooling, which is strongly in line with common sense.8 In other words, education
seems to provide at least a partial ”shield” against job instability in the U.S. labour markets.
In addition, the perceptions of job loss vary little by gender. However, the subjective
probability of job loss among black people is almost double that of white people.
The UK empirical evidence in terms of perceived job instability can be summarized as
follows. Green et al. (2000) provide empirical evidence for the view that the perceived risk
of job loss, in aggregate, changed rather little between 1986 and 1997 in the UK. Green et
al. (2000) further show that the overall perception of job insecurity was fairly stable between
1996 and 1997, but it did indeed rise, relative to the overall rate of unemployment, which
was substantially lower in 1997 than in 1996. There has also been the same kind of
redistribution of job insecurity as in the U.S. (i.e. professional workers have become much
more insecure about the jobs they hold). In particular, the results reported by Green et al.
(2000) indicate that unions have no observable impact on the magnitude of job insecurity. In
addition, Green et al. (2001) provide detailed empirical evidence on the determination of
the perception of job loss. The perception of job loss is definitely common in the UK. Thus,
in 1996 and 1997, approximately 1 in 10 British workers thought that it was either likely or
very likely that they would lose their job within 12 months.
However, Green et al. (2001) argue that workers tend to overestimate the likelihood of
job loss. In particular, the empirical investigation of the perception of job instability by

137
Green et al. (2001) includes four sets of potential determinants: the workers’ personal
unemployment experience and environment, the objective characteristics of the jobs they
hold, human capital indicators and, finally, relevant attitudinal variables. The empirical
results presented by Green et al. (2001) indicate that the past unemployment experience
increases the subjective probability of job loss among men. An increase in the regional
unemployment rate yields a rise in the subjective probability of job loss. In addition, the
perception of job insecurity is not related to the establishment size. The older workers
express higher levels of job insecurity. The attitudinal variables included are also important
in the determination of the perception of job instability. The empirical evidence therefore
indicates that job dissatisfaction is strongly associated with job insecurity in the UK.9
3. The data
The data of this study is drawn from a large-scale survey (Employment Options for the
Future). The survey covers the 15 European Union members and Norway.10 The survey
was originally designed to find out who wanted to work and who did not want to work.
Thus, the major strength of the survey is that it contains a great number of detailed questions
about the underlying preferences of individuals with respect to labour market conditions
in Europe. In addition, the survey also includes more detailed information than has been
typical in the earlier investigations about job characteristics, which has a potential role in
the empirical determination of the perception of job instability. The survey was conducted
in 1998 and it was framed for the residential population aged from 16 to 64 years. The
fieldwork was carried out between May and September 1998 in all 16 countries included.
The survey was done for about 1500 individuals for most of the countries included in
Europe. Table A1 contains the tabulation of the number of interviews in each country
included in the survey. However, the individuals unemployed and the economically inactive
persons at the time of the interview are omitted from the data, because the perception of
job instability is not relevant for those persons.11 In addition, the following analysis includes
only employees. In other words, self-employed persons are omitted from the following
analysis due to the notion that the empirical determination of the perception of job instability
ought to be different among them with respect to employees.12 This means that the data
that is used in the following estimations covers 5435 persons after also eliminating a small
number of inconsistent answers to the questions of the survey.
The key variable of the survey from the point of view of this study is, of course, the perception
of job instability at the individual level of the economy. This question of the survey is formulated

138
as follows: ”Do you worry about the security of your present work?” In particular, in the
conduct of the survey the notion that ”job security” was equal to ”job stability” was heavily
underlined. The answers to the question can be either ”yes” or ”no”. The formulation of the
question means that the applied measure of the perception of job instability confounds two
components, which are the chance of job loss and the consequences of job loss (see, for
example, Dominitz and Manski, 1997). This particular feature of the applied measure of the
perception of job instability have to be taken into account in the discussion of the following
estimation results. One potential problem of the applied question of the survey is that it does
not define the exact time span of fear about job instability. However, the following analysis
of the survey also includes a number of variables (such as education) that can broadly be
interpreted as indicators of the individuals’ time preference.
The basic distribution of perceived job instability in Europe based on the applied survey
of this study is shown in Table 1. There are indeed large differences in the amount of
perceived job instability from country to country. The lowest level of perceived job instability
is in Denmark (9%). In contrast, the highest level of perceived job instability is in Spain
(63%). According to the survey, the perception of job instability is more common in the
UK than the empirical results reported in Green et al. (2001) indicate for 1997 and 1998.

139
Table 1. The frequence of worry about the security of one’s present work in Europe (i.e.
an answer to the question: ”Do you worry about the security of your present work?”).
”UN” refers to the standardized unemployment rate in 1998 (Source: OECD, 1999).
Country ”YES” ”NO” UN (%)
Austria 23 77 6.4
Belgium 25 75 11.7
Denmark 9.0 90 6.3
Finland 17 83 11.4
France 28 72 11.8
Germany 36 63 11.2
Greece 60 39 10.1
Ireland 19 81 7.7
Italy 48 52 12.2
Luxembourg 22 78 3.1
Netherlands 20 80 4.2
Portugal 12 84 5.0
Spain 63 36 18.8
Sweden 20 80 6.5
United Kingdom 26 74 6.2
Norway 15 85 3.2
The average unemployment rate in the countries included in the survey is in positive relation
with the perception of job instability (Figure 1). The underlying correlation of the perception
of job instability and the unemployment rate is in line with the recent notions based on
gross flows of jobs and workers, because the rate of worker outflow into unemployment
tends to be at the higher level in the segments of the economy that are characterized by
the high unemployment rate. However, the correlation of the perception of job instability
and the unemployment rate is far from perfect across the countries of the survey.13 Thus,
there tends to be about the same amount of perceived job instability among workers
despite the fact that the average unemployment rate is far from equal in certain pairs of
countries. For instance, the perception of job instability among employed workers is at
about the same level in Finland and Norway despite the fact that the unemployment rate
was 11.4% in Finland in 1998 and only 3.2% in Norway.

140
Figure 1. A scatterplot of ”yes” answers (to the question: ”Do you worry about the
security of your present work?”) and the standardized unemployment rate (UN) in 1998
in European countries.
Figures 2–3 relate the incidence of job instability to the strictness of labour standards and
to the strictness of employment protection.14 These figures are not consistent with the
popular notion that the perception of job instability declines as the strictness of labour
standards and the strictness of employment protection increase in European labour
markets.15 This pattern emerges despite the stylized feature of the literature that the
underlying magnitude of gross job and worker flows of the economies declines as the
strictness of labour standards and employment protection increases.16 An explanation for
this particular pattern is that strong employment protection may be associated with lower
job loss probabilities but with greater difficulty in finding an equally good job conditional
on losing the current one.
0
10
20
30
40
50
60
70
0 5 10 15 20
UN (%)
"yes
" (%
)
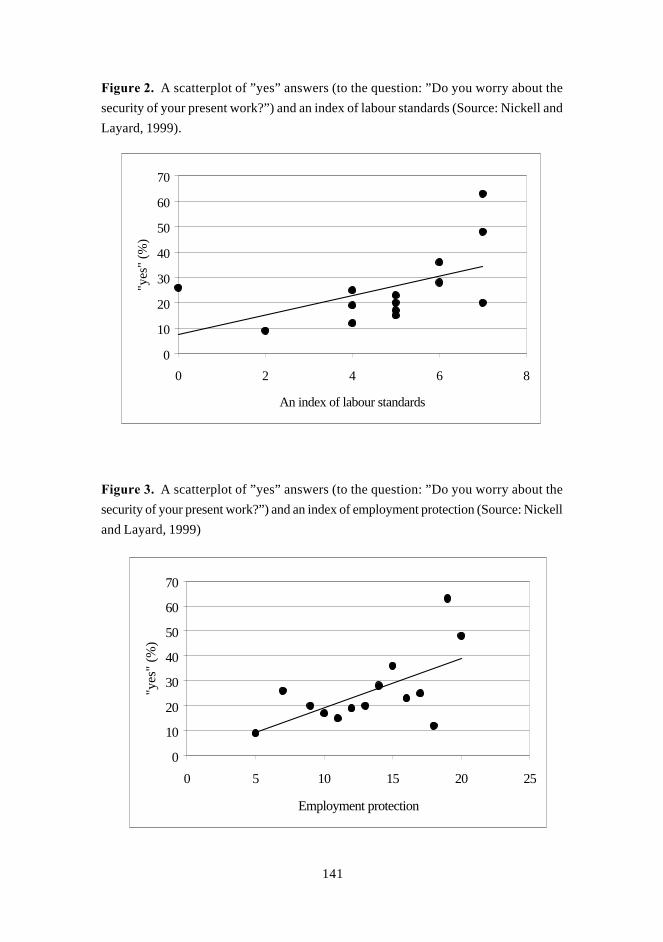
141
Figure 2. A scatterplot of ”yes” answers (to the question: ”Do you worry about the
security of your present work?”) and an index of labour standards (Source: Nickell and
Layard, 1999).
Figure 3. A scatterplot of ”yes” answers (to the question: ”Do you worry about the
security of your present work?”) and an index of employment protection (Source: Nickell
and Layard, 1999)
0
10
20
30
40
50
60
70
0 2 4 6 8
An index of labour standards
"yes
" (%
)
0
10
20
30
40
50
60
70
0 5 10 15 20 25
Employment protection
"yes
" (%
)

142
In addition, Figure 4 depicts the relationship between the incidence of the perception of
job instability and the replacement rate across countries.17 There therefore seems to be
some weak empirical evidence for the view that the perception of job instability is at a
lower level in the countries that have high replacement rates. In particular, in the UK there
is a low replacement rate and also a high level of the perception of job instability compared
with the Nordic countries.
Figure 4. A scatterplot of ”yes” answers (to the question: ”Do you worry about the
security of your present work?”) and an index of the replacement rate (Source: OECD,
1998)
The survey includes a great number of individual characteristics and other variables that
facilitate the investigation of the determination of the perceived job instability in Europe.
The applied variables of the following analysis are summarized in Table 2. In addition,
Table A2 provides summary statistics of the most important variables. Most of the applied
variables are (almost) self-evident. The variables are divided into three broad categories.
Thus, there are variables that characterize (i) individuals (such as education), (ii) jobs that
individuals hold (such as the number of jobs that an individual currently holds) and also
(iii) variables that capture some key characteristics of firms (such as the size of the company
at which the individual is currently working). In addition, the following Probit models
0
10
20
30
40
50
60
70
40 50 60 70 80 90 100
replacement rate (%)
"yes
" (%
)

143
include country dummies owing to the fact that there are evidently large differences in the
perceived job instability from country to country within Europe.
Table 2. The description of the selected variables.
Variable Definition/measurement
Individual characteristics:
WORRIED Individual is worried about the security of his/her present job=1,
otherwise=0
AGE Age of an employee
AGE2 AGE squared
GENDER 1=male, 0=female
DEGREE Individual has a university degree/college degree=1, otherwise=0
MARRIED Individual is married=1, otherwise=0
PARTNER Partner is not currently in paid work=1, otherwise=0
CHILDREN Individual has children=1, otherwise=0
EXPERIENCE Individual has been in paid work over 10 years=1, otherwise=0
TENURE Individual has worked over 10 years for current employer=1,
otherwise=0
UNEMPLOYED Individual has been unemployed during the past five years=1,
otherwise=0
GENOPTIMISTIC Individual thinks that the general economic situation is currently
’very good’=1, otherwise=0
PEROPTIMISTIC Individual thinks that his/her personal economic situation is currently
’very good’=1, otherwise=0
Job characteristics:
JOBS Individual has currently only one job=1, otherwise=0
HOME Individual would like to work at home=1, otherwise=0
PART Individual has currently a part-time job=1, otherwise=0
OVERTIME Individual has recently done paid or unpaid overtime=1, otherwise=0
TEMPORARY Individual has currently a temporary contract=1, otherwise=0
MANUAL Individual has a manual job=1, otherwise=0
MANAGER Individual has managerial duties in his/her current job=1,
otherwise=0
HOURS The number of hours that individual works per week on average
METROPOLITAN Individual is living in or close to a large city with more than
100 000 inhabitants=1, otherwise=0
Firm characteristics:
MANU Individual is currently employed in manufacturing industries
(including mining and construction)=1, otherwise=0

144
SERVICE Individual is currently employed in service sectors (including public
services)=1, otherwise=0
SIZE1 Size of company measured by the number of employees is less
than 9=1, otherwise=0
SIZE2 Size of company measured by the number of employees is from
10 to 49=1, otherwise=0
SIZE3 Size of company measured by the number of employees is from
50 to 499, otherwise=0
SIZE4 Size of company measured by the number of employees is more
than 500=1, otherwise=0 (reference)
Country dummy variables:
AUSTRIA Individual is currently living in Austria=1, otherwise=0
BELGIUM Individual is currently living in Belgium=1, otherwise=0
DENMARK Individual is currently living in Demark=1, otherwise=0
FINLAND Individual is currently living in Finland=1, otherwise=0
FRANCE Individual is currently living in France=1, otherwise=0
GERMANY Individual is currently living in Germany=1, otherwise=0
GREECE Individual is currently living in Greece=1, otherwise=0
IRELAND Individual is currently living in Ireland=1, otherwise=0
ITALY Individual is currently living in Italy=1, otherwise=0
LUXEMBOURG Individual is currently living in Luxembourg=1, otherwise=0
NETHERLANDS Individual is currently living in the Netherlands=1, otherwise=0
PORTUGAL Individual is currently living in Portugal=1, otherwise=0
SPAIN Individual is currently living in Spain=1, otherwise=0
SWEDEN Individual is currently living in Sweden=1, otherwise=0
UNITED KINGDOM Individual is currently living in the United Kingdom=1, otherwise=0
NORWAY Individual is currently living in Norway=1, otherwise=0 (reference)
4. The results
Owing to the fact that the applied variable WORRIED can, by definition, have only two
values (0 or 1), it is convenient to estimate a Probit specification as follows:18
Prob (WORRIEDi =1) = Φ(β’x) + εi, (1)
where WORRIEDi is a dichotomous variable obtaining the values of an answer to the
question: ”Do you worry about the security of your present work?” for the individual i of
the survey. Thus, if WORRIEDi is 1, then an individual is worried about his/her present
job, and if WORRIEDi is 0, then an individual is not worried about his/her present job. x

145
is a vector of explanatory variables, β is a vector of the estimated coefficients and Φ is
the cumulative standard normal distribution function. εi is a normally distributed error term
with mean 0 and variance σ2.
The estimation results are summarized in Tables 3–4. The following assessment of the
estimation results is focused on the results that cover the whole population (reported in
Table 3). The probit model was also estimated separately for the subpopulation of females
(reported in Table 4).19 This is due to the fact females hold quite different jobs compared
with the jobs that are held by males. In particular, most of the part-time workers included
in the survey are females.
Table 3. The estimation results from the Probit model with marginal effects (DF/dx) for
the whole population of workers (dependent variable: WORRIED). DF/dx is for dummy
variables an impact of discrete change from 0 to 1 on the probability of the perception of
job instability.
DF/dx z-statistics
AGE 0.02389 4.37AGE2 -0.00023 -3.51GENDER 0.02156 1.50DEGREE -0.03529 -2.14MARRIED -0.05703 -0.44PARTNER -0.05537 -0.44CHILDREN 0.00811 0.47EXPERIENCE -0.02951 -1.44TENURE 0.03447 2.06UNEMPLOYED 0.06930 4.27GENOPTIMISTIC -0.03335 -1.32PEROPTIMISTIC -0.07363 -3.43
JOBS -0.00205 -0.07HOME 0.00359 0.17PART -0.04574 -2.05OVERTIME 0.04981 3.50TEMPORARY -0.14925 -7.87
MANUAL 0.02408 1.64MANAGER -0.03664 -2.63HOURS -0.00136 -1.61
METROPOLITAN -0.01313 -0.97
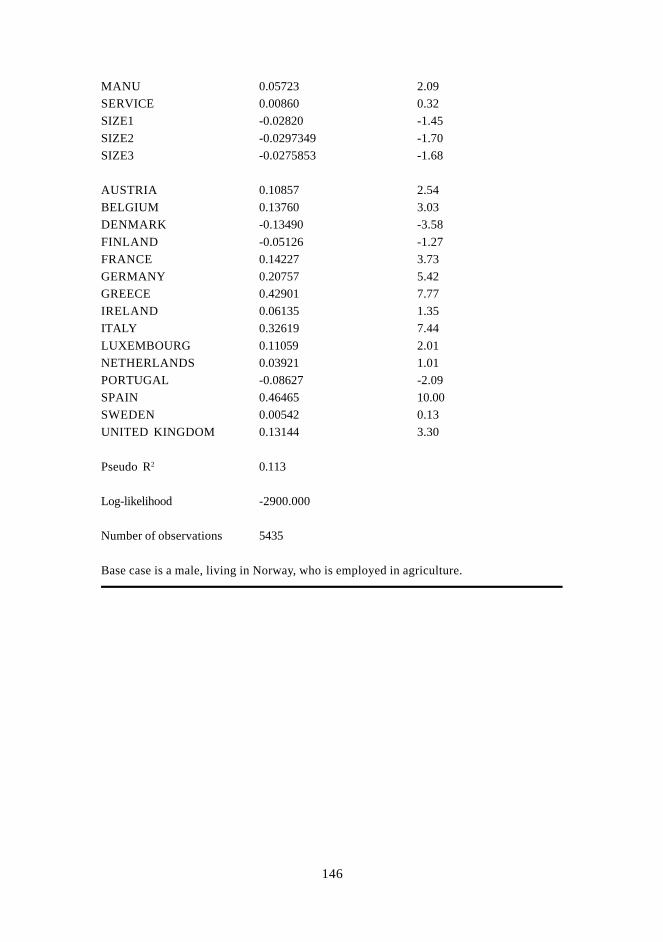
146
MANU 0.05723 2.09SERVICE 0.00860 0.32SIZE1 -0.02820 -1.45SIZE2 -0.0297349 -1.70SIZE3 -0.0275853 -1.68
AUSTRIA 0.10857 2.54BELGIUM 0.13760 3.03DENMARK -0.13490 -3.58FINLAND -0.05126 -1.27FRANCE 0.14227 3.73GERMANY 0.20757 5.42GREECE 0.42901 7.77IRELAND 0.06135 1.35ITALY 0.32619 7.44LUXEMBOURG 0.11059 2.01NETHERLANDS 0.03921 1.01PORTUGAL -0.08627 -2.09SPAIN 0.46465 10.00SWEDEN 0.00542 0.13UNITED KINGDOM 0.13144 3.30
Pseudo R2 0.113
Log-likelihood -2900.000
Number of observations 5435
Base case is a male, living in Norway, who is employed in agriculture.

147
Table 4. The estimation results from the Probit model with marginal effects (DF/dx) for
the subpopulation of females (dependent variable: WORRIED). DF/dx is for dummy
variables an impact of discrete change from 0 to 1 on the probability of the perception of
job instability.
DF/dx z-statistics
AGE 0.01887 2.46
AGE2 -0.00022 -2.25
DEGREE -0.06498 -2.68
MARRIED -0.20308 -1.28
PARTNER -0.16004 -1.08
CHILDREN 0.03467 1.37
EXPERIENCE -0.00189 -0.07
TENURE 0.00854 0.34
UNEMPLOYED 0.03895 1.67
GENOPTIMISTIC -0.06214 -1.30
PEROPTIMISTIC -0.08399 -2.40
JOBS 0.01953 0.49
HOME 0.01208 0.36
PART -0.02461 -0.81
OVERTIME 0.04812 2.33
TEMPORARY -0.17390 -6.42
MANUAL 0.00093 0.04
MANAGER -0.02302 -1.06
HOURS 0.00015 0.11
METROPOLITAN -0.03247 -1.56
MANU 0.11134 2.55
SERVICE 0.05415 1.37
SIZE1 -0.03263 -1.15
SIZE2 -0.05722 -2.14
SIZE3 -0.06804 -2.67
AUSTRIA 0.10379 1.54
BELGIUM 0.17152 2.40
DENMARK -0.15936 -2.68
FINLAND -0.01736 -0.27
FRANCE 0.13734 2.25
GERMANY 0.22063 3.57
GREECE 0.41291 5.23

148
IRELAND -0.01420 -0.19
ITALY 0.33785 4.76
LUXEMBOURG 0.18643 2.19
NETHERLANDS -0.00101 -0.02
PORTUGAL -0.11909 -2.02
SPAIN 0.44884 6.10
SWEDEN 0.02801 0.39
UNITED KINGDOM 0.07185 1.16
Pseudo R2 0.126
Log-likelihood -1316.268
Number of observations 2472
Base case is living in Norway and employed in agriculture.
The individual characteristics are obviously an important element in the empirical
determination of the perception of job instability in Europe. In particular, the results reveal
that the perception of job instability is indeed higher among older workers than among
young workers despite the stylized feature of labour markets that the turnover of jobs and
workers is more intensive among young employees.20 The results are therefore consistent
with the popular notion that job instability is more of a problem for aged employees and
that the turnover of jobs among young employees is mainly due to the voluntary quits,
which are often related to career concerns. The result is also in line with a recent
investigation by Blanchflower and Oswald (1999), according to which there is an increase
in the perception of job insecurity as an employee ages. In addition, the observation is in
line with the stylized fact that job displacements tend to cause much larger wage losses
for the older worker (see, for example, Kuhn, 2001). This variation of wage losses across
age groups of workers may reflect the feature that a greater fraction of older workers’
skills are specific to an occupation or industry, thus exposing them to a much ”thinner”
labour market, compared with the young workers with more general labour market
engagement. In other words, the result is in line with the notion that it is the job loss wage
penalty more than the job loss incidence that drives the perception of job instability among
workers in Europe.
There are no differences in the perceptions of job instability between males and females.
This result is nicely in line with observations by Manski and Straub (2000) for the U.S.,
Green et al. (2001) for the UK and OECD (1997) for Europe, but in disagreement with

149
an empirical study by Clark (1997), according to which males rank job security more
highly than females, applying the British Household Panel Survey.
The perception of job instability does decline as an individual gets additional years of
schooling. In other words, education provides a kind of ”shield” against job instability in
Europe. This particular result is in line with earlier empirical studies from Anglo-Saxon
labour markets elaborated in the earlier section of this study. In other words, the European
labour markets, as a whole, and the Anglo-Saxon labour markets seem to be similiar in
this respect. The breakdown of job insecurity by OECD (1997) reveals only weak empirical
evidence for the view that there are differences in the perception of job instability based
on the years of education in Europe.21
In principle, there should be less perception of job instability if an individual is married and,
in particular, if the partner is currently in paid work. This is due to the fact that the partner’s
income provides at least a partial shield against job insecurity in the presence of imperfect
private insurance markets. However, the estimation results are not in line with this line of
thinking. In addition, the results do not support the view that the presence of children increases
the perception of job instability. In principle, the perception of job instability, other things
being equal, should rise if the individual has children, because childrens’ wellbeing is almost
totally dependent on the stability of their parents’ income stream. The hypothesis that the
presence of children should, other things being equal, yield an increase in the perception of
job instability does not hold even for the subpopulation of females (see Table 4).
According to the results, a long attachment to labour markets in terms of general experience
fails to deliver a decline in perceived job instability among European workers. The convential
wisdom says that job tenure can be considered to be a proxy variable for the firm-specific
human capital of individuals. This means that a long tenure should yield a decrease in job
instability at the individual level of the economy, because firms typically follow the policy
of ”last in, first out”. In fact, Green et al. (2000) provide empirical evidence for this kind
of reasoning in the context of the UK. However, the results indicate that a long tenure (i.e.
a long-term attachment to the same firm of the economy) does not yield a decline in the
perception of job instability in European labour markets.22 In other words, the results are
therefore in keeping with the view that human capital is mostly general by its nature.
An occurrence of unemployment during the past five years yields a substantial rise in the
perception of job instability. However, this pattern does not hold for females (see Table
4). The results is therefore closely in line with the recent observations by Green et al.
(2001) for the UK. In addition, Aaronson and Sullivan (1998) have discovered that

150
individuals that have previously had an unemployment period are more prone to job
insecurity in the U.S. labour markets.23 In principle, there can be both real and
psychological reasons for this correlation. The real reasons arise from the fact that there
is an episode of deaccumulation of human capital during the periods of unemployment.
The occurrence of unemployment therefore yields a decline in the future probability of
finding a job. On the other hand, the psychological effects are based on the notion that
past experience tends to heighten the ”availability” of that particular option to the
individual.24 In addition, the result concerning the effect of past unemployment on the
perception of job instability is connected to the emerging economic literature that stresses
the notion that unemployment is a significant contributor to the unhappiness of individuals
across industrialized countries (see, for example, Di Tella et al., 2001). A part of the
contribution of unemployment to unhappiness can therefore be realized via the increase in
the perception of job instability in the case that individuals are risk-averters.
The empirical finding that the unemployment history strongly matters for the perception of
job instability is also consistent with the notion that an unemployment episode provides
private information about the unobservable productivity of an employee. Thus, a layoff of
an individual worker in contrast to a quit or a closure of whole plant is indeed a credible
signal about the low productivity of an employee (see, for example, Gibbons and Katz,
1991).25 This means that unemployment tends to bring future unemployment at the individual
level of the economy (see, for example, Arulampalam et al., 2001). The welfare losses
associated with unemployment episodes can manifest themselves in extreme form. In fact,
Charles and Stephens (2001) observe that a layoff yields an increase in the future divorce
probability of individuals in the U.S.
The results further reveal that an optimistic view of the general economic conditions in the
country of an individual has no effect at all on the perception of job instability, but an
optimistic view about one’s personal economic conditions is associated with a decline in
the perception of job instability. The estimation results therefore underline the view that
the perception of job instability is a deeply personal matter.
There are a number of job characteristics that are essential in the determination of the
perception of job instability in the context of the European labour markets. In principle,
the fact that an individual holds more than just one current job should decrease the perception
of job instability, because the presence of multiple jobs should diversify various risks
induced by labour markets, owing to the fact that the idiosyncratic shocks that affect
these jobs are not perfectly correlated with each other.26 However, this line of reasoning
is not in line with the estimation results.

151
Green et al. (2001) observe that the various measures of job dissatisfaction are positively
related to the perception of job instability in the unregulated UK labour markets. In addition,
Blanchflower and Oswald (1999) discover that both U.S. evidence and European data
point out that there is a strong positive correlation between feeling secure and saying one
is satisfied with a job. In fact, the HOME variable of this study can be interpreted as an
indication of job dissatisfaction. The estimation results are therefore not in line with the
earlier UK empirical evidence.
The perception of job instability is negatively related to the presence of a part-time contract
and positively related to the past overtime hours.27 In principle, the presence of earlier
overtime hours could put more faith in the stability of the current match, because overtime
hours are often implemented in the case of robust demand for the products and services
of the particular firm, but the estimation results are not in line with this kind of reasoning.
In contrast, the estimated impact of overtime hours on the perception of job instability is
in line with the notion that hours of work are adjusted before the adjustment of the number
of employees, as there is an increase in demand. Thus, the implementation of overtime
hours reflects, in fact, the underlying uncertainty about the firms’ current environment that
is also reflected in the perception of job instability among employees. The results further
indicate that the effect of a part-time contract on the perception of job instability disappears
within the subpopulation of females (see Table 4).
However, the most striking result of this study is that the perception of job instability is
negatively related with the variable that captures the individuals that have a temporary
contract.28 The estimation result also holds for the subpopulation of females (see Table
4). The result can be interpreted as an indication of the feature in the European labour
markets that persons who have started a temporary contact have already discounted the
high-subjective probability of job loss when they accept that type of contract. This means
that a temporary contract as such does not yield an additional increase in the perception
of job instability at the individual level of the economy, other things being equal. The
above result is not in line with the observations by Green et al. (2001), according to
which individuals holding short-term employment contracts are found to report the greatest
levels of job insecurity in the UK. However, the result can be rationalized by noting that
temporary contracts often provide a path towards more stable employment relationships.29
This effect is especially relevant in the context of the European unemployment problem.
The perception of job instability is not related at all to the fact that an individual is a
manual worker, but negatively related to the feature that an individual has managerial
duties in his/her current job. The latter can be rationalized by the notion that individuals

152
who have managerial duties also have at least some power to decide about the separations
of employees. In addition, the weekly hours of work are not related to the perception of
job instability, despite the fact that long hours of work by employees could serve as an
indicator that the demand for firms’ goods and services is relatively robust in the current
market conditions. The perception of job instability is not more common in large cities
with more than 100 000 inhabitants. This may reflect the stylized feature that an increase
in the density of economy activity leads to more efficient matching within regional labour
markets via the so-called thick market externalities, despite the fact that large cities have
pockets of high unemployment rates.
The survey includes a limited number of variables that aim to characterize the firms’ position
in the economy. The results show that the perception of job instability is more common
within manufacturing industries. This result is in line with the observations by Aaronson
and Sullivan (1998) for the U.S., according to which job insecurity is substantially higher
in the manufacturing sector than in all other major industries, but the breakdown of job
insecurity by OECD (1997) is not able to find differences in the magnitude of the perception
of job instability between industries and services in the context of European labour markets.
However, the above result, according to which the perception of job instability is more
common within manufacturing industries, is not in line with the stylized features presented
in the recent literature on gross job and worker flows. The magnitude of gross job and
worker flows tends to be higher in non-manufacturing industries compared with
manufacturing industries (see, for example, Davis and Haltiwanger, 1999).
In addition, there is some empirical evidence for the view that the perception of job
instability by individuals increases according to the size of the firm. This effect is most
notable for the subpopulation of females (see Table 4). The perception of job instability
therefore seems to be less common in small establishments. This result is not in line with
the realized patterns of turnover, either, because the turnover of jobs and workers tends
to decline as firms’ size increases.30 However, this observation can be rationalized by
noting that there is almost always a low hierarchy in small firms compared with large
companies with a great number of separate establishments, which facilitates a more efficient
and detailed flow of information about the position of firms in the population of small
firms.
Finally, the country dummies that we included indicate that there are genuine differences
in the perception of job instability from country to country in Europe after taking account
of various factors that contribute to the incidence of job instability. For instance, the
perception of job instability is lower in Denmark and higher in Spain than in Norway even

153
after taking into account the controls included for the incidence of job instability at the
individual level of the economy. This same pattern of job instability holds for the
subpopulation of females (Table 4). There are also unobservable idiosyncratic elements
that affect the incidence of job instability in European labour markets.
4.1. The robustness of the reported results
Along with the reported estimation results in Tables 3-4, a version of the Probit model
was estimated that included the gender-specific unemployment rate by Eurostat (2000)
for the European Union countries in 1998. The unemployment variable was not statistically
significant with the country dummies including the same control variables as the models
reported in Tables 3–4. The reason for this feature is that there is no temporal variation in
unemployment rates within countries at all, because the applied survey of this study provides
cross-country information only for the single year 1998. This feature of estimation naturally
extends to another variables by a similiar nature (including the variables that capture the
institutional characteristics of European labour markets that were discussed at the end of
the third section of the study). This means that there is no point in trying to include
institutional features as an additional explanatory variable to the reported Probit models
of the study.
Without the country dummies, the results indicated that an increase in the gender-specific
unemployment rate yields an increase in the perception of job instability among workers,
which is, of course, deeply in line with common sense. The result is also in line with Figure
1. The rest of the results remained the same as the reported ones in Tables 3–4. The same
results as the ones with the gender-specific unemployment rate hold in the case that the
unemployment rate was replaced by the gender-specific share of long-term unemployed
of all unemployed individuals for the European Union countries excluding Luxembourg
and Ireland provided by Eurostat (2000). The motivation for that particular specification
was the fact that long-term unemployment definitely yields extremely high private costs to
individuals in terms of lost human capital in the context of European labour markets.
Another point concerning the robustness of the reported results in Tables 3–4 can be
summarized in a nutshell as follows. Without the country dummies, the estimation results
remained the same, but the GENOPTIMISTIC variable turned out to be statistically
significant with a negative sign as a priori expected. Thus, an increase in the optimistic
perception about the aggregate economy definitely delivers a decline in the perception of
job instability at the individual level of the economy. In addition, the JOBS variable did

154
get a negative sign. This means that there is some evidence for the view that an increase in
the number of jobs is able to reduce the perception of job instability at the individual level
of the economy. The exclusion of the PEROPTIMISTIC and GENOPTIMISTIC variables
yielded the same results as the reported ones in Tables 3–4.
The survey includes a question about the employee’s view about his/her labour market
position from five years after the interview (the question 109a in the manual of the interview,
see Infratest Burke Sozialforschung, 1999a). The estimation results showed that the
perception of job instability is highly correlated with the notion that an employee thinks
that he/she is in the pool of unemployed individuals from five years after the interview.
This fact is in line with thinking that workers are indeed able to deliver consistent answers
to the questions about the perception of job instability at the individual level of the economy.
5. Conclusions
The study explored the empirical determination of perceived job instability in Europe.
The study was based on the large-scale survey from the year 1998 covering 15 member
states of the European Union and Norway. All in all, there tends to be a rather vague
relationship between institutional features and the perception of job instability among
workers. However, the patterns of perceived job instability and the institutional features
of European countries are not consistent with the popular notion that the perception of
job instability declines as the strictness of labour standards and the strictness of employment
protection increase in European labour markets. This pattern emerges despite the stylized
feature of the earlier literature that the underlying magnitude of gross job and worker
flows of the economies declines as the strictness of labour standards and employment
protection increases. This means that the perception of job instability and the underlying
gross flows of job and workers need not be closely correlated.
The results show that perceived job instability increases with age. In other words, there is
evidence for the view that it is the job loss wage penalty more than the job loss incidence
that drives the perception of job instability among workers. An increase in the educational
level, on the other hand, leads to a decline in the perception of job instability. There are
no differences in the perceptions of job instability between males and females. An
occurrence of unemployment during the past five years delivers a substantial rise in the
perception of job instability. The empirical finding that the unemployment history strongly
matters for the perception of job instability is consistent with the notion that an unemployment
episode provides private information about the unobservable productivity of an employee.

155
The most striking result was that a temporary contract as such does not yield an additional
increase to the perception of job instability at the individual level of the economy. However,
the perception of job instability is more common within manufacturing industries and there
is some evidence for the view that it increases according to the size of the firm. There are
also strong country effects.

156
Table A1. The number of interviews across countries.
Country Number of interviews
Austria 1501Belgium 1510Denmark 1485Finland 1504France 3026Germany 2998Greece 1506Ireland 1400Italy 2992Luxembourg 822Netherlands 1500Norway 1500Portugal 1501Spain 3000Sweden 1312United Kingdom 3000

157
Table A2. Selected descriptive statistics for the whole population of employees.
Variable MEAN STD MIN MAX
WORRIED 0.27703 0.44755 0 1AGE 38.43222 10.93591 16 64GENDER 0.51688 0.49974 0 1DEGREE 0.29214 0.45477 0 1MARRIED 0.65463 0.47551 0 1PARTNER 0.34134 0.47418 0 1CHILDREN 0.61717 0.48610 0 1EXPERIENCE 0.71911 0.44945 0 1TENURE 0.41225 0.49226 0 1UNEMPLOYED 0.19785 0.39840 0 1GENOPTIMISTIC 0.09970 0.29961 0 1PEROPTIMISTIC 0.10992 0.31280 0 1JOBS 0.93188 0.25196 0 1HOME 0.09980 0.29975 0 1PART 0.19287 0.39457 0 1OVERTIME 0.64088 0.47976 0 1TEMPORARY 0.83084 0.37491 0 1MANUAL 0.36214 0.48064 0 1MANAGER 0.37767 0.48483 0 1HOURS 39.03729 12.0639 1 88METROPOLITAN 0.42980 0.49507 0 1MANU 0.24377 0.42938 0 1SERVICE 0.71599 0.45096 0 1SIZE1 0.17435 0.37944 0 1SIZE2 0.24815 0.43197 0 1
SIZE3 0.29471 0.45595 0 1

158
References
Aaronson, D. and D.G. Sullivan (1998), ‘The decline in job security in the 1990s:
displacement, anxiety, and their effect on wage growth’, Federal Bank of Chicago,
Economic Perspectives 22, 17–43.
Agell, J. (1999), ‘On the benefits from rigid labour markets: Norms, market failures, and
social insurance’, The Economic Journal 109, F143–F164.
Alesina, A., E. Glaeser and B. Sacerdote (2001), ’Why doesn’t the U.S. have a European
style welfare system?’, Working Paper 8524 (National Bureau of Economic Research,
Cambridge MA).
Arulampalam, W., P. Gregg and M. Gregory (2001), ’Unemployment scarring’, The
Economic Journal 111, F577–F584.
Bell, D., R.E. Wright and R.A. Hart (1997), Multiple job holding as a ’hedge’ against
unemployment, Discussion Paper 1626 (Centre for Economic Policy Research, Lon-
don).
Bertola, G. (1992), ’Labour turnover costs and average labour demand’, Journal of
Labor Economics 10, 389–411.
Blanchflower, D. G. and A.J. Oswald (1999), Well-being, insecurity and the decline in
American job satisfaction, Unpublished paper (Department of Economics, University of
Warwick).
Burda, M. and C. Wyplosz (1994), ’Gross worker and job flows in Europe’, European
Economic Review 38: 1287–1315.
Charles, K.K. and M. Stephens (2001), Job displacement, disability and divorce, Working
Paper 8578 (National Bureau of Economic Research, Cambridge MA).
Clark, A.E. (1997), ’Job satisfaction and gender’, Labour Economics 4, 341–372.
Davis, S.J. and J. Haltiwanger (1999), ’Gross job flows’, in O. Ashenfelter and D. Card (eds.),
Handbook of Labour Economics, Vol. 3C (North-Holland, Amsterdam), 2711–2805.

159
Davis, S.J. and P. Willen (1999), Using financial assets to hedge labor income risks: Estimating
the benefits, Unpublished paper. (Department of Economics, University of Chicago).
Di Tella R., R.J. MacCulloch and A.J. Oswald (2001), ’Preferences over inflation and
unemployment: Evidence from survey of happiness’, The American Economic Review
91, 335–341.
Domenighetti, G., B. D’Avanzo and B. Bisig (2000), ’Health effects of job insecurity
among employees in the Swiss general population’, International Journal of Health
Services 30, 477–490.
Dominitz, J. and C.F. Manski (1996), Perceptions of economic insecurity: Evidence from
the survey of economic expectations, Discussion Paper 1105–96 (Institute for Research
on Poverty, The University of Wisconsin-Madison).
Dominitz, J. and C.F. Manski (1997), ’Perceptions of economic insecurity’, Public
Opinion Quarterly 61, 261–287.
Eurostat (2000), Eurostat Yearbook. A Statistical Eye on Europe. Data 1988–1998
(European Commission, Brussel).
Farber, H.S. (1999), ’Mobility and stability: The dynamics of job change in labor markets’,
in O. Ashenfelter and D. Card (eds.), Handbook of Labour Economics, Vol. 3C (North-
Holland, Amsterdam), 2439–2483.
Garibaldi, P. (1998), ’Job flow dynamics and firing restrictions’, European Economic
Review 42, 245–275.
Garibaldi, P., J. Konings and C. Pissarides (1997), ’Gross job reallocation and labour
market policy’, in D.J. Snower and G. de la Dehesa G. (eds.), Unemployment Policy:
Government Options for the Labour Market (Cambridge University Press, Cambrid-
ge), 467–498.
Gibbons, R. and L. F. Katz (1991), ’Layoffs and lemons’, Journal of Labor Economics
4, 351–380.
Givord, P. and E. Maurin (2001), Changes in job stability and their causes: An empirical
analysis method applied to France, 1982–2000, Unpublished (INSEE, Paris).

160
Gottschalk, P. and R. Moffitt (1998), Job instability and insecurity for males and females
in the 1980s and 1990s, Working Papers in Economics 408 (Department of Economics,
Boston College).
Green, F., A. Felstead and B. Burchell (2000), ’Job insecurity and the difficulty of regaining
employment: An empirical study of unemployment expectations’, Oxford Bulletin of
Economics and Statistics 62, 857–885.
Green, F., D. Campbell, A. Carruth, and A. Dickerson (2001), An analysis of subjective
views of job insecurity, Working Paper 08/01 (University of Kent at Canterbury).
Hall, R.E. (1995), ’Lost jobs’, Brookings Papers on Economic Activity 1, 221–256.
Horowitz, J.L. and N.E. Savin (2001), ’Binary response models: Logits, probits and
semiparametrics’, Journal of Economic Perspectives 15, 43–56.
Houseman S.N. (1998), ’Why employers use flexible staffing arrangements: Evidence
from an establishment survey, Working Papers 01–67 (W.E. Upjohn Institute, Michigan).
Infratest Burke Sozialforschung (1999a), Employment options of the future. Representative
survey in all 15 member states and in Norway – documentation of questionnaires. Volume
1–2, (IBS, Munich).
Infratest Burke Sozialforschung (1999b), Employment options of the future. Representative
survey in all 15 member states and in Norway. Additional cross-tabulations – Volume A-
B, (IBS, Munich).
Infratest Burke Sozialforschung (1999c), Employment options of the future. Representative survey
in all 15 member states and in Norway. Field report and cross-Tabulations, (IBS, Munich).
Infratest Burke Sozialforschung (1999d), Employment options of the future: High demand
for new jobs in Europe – high interest in non-standard work-forms. First results from a
representative survey in all 15 member states and in Norway, (IBS, Munich).
Keyssar, A. (1986), Out of Work: The First Century of Unemployment in
Massachusetts (Cambridge University Press, Cambridge).
Kletzer, L. (1998), ’Job displacement’, Journal of Economic Perspectives 12, 115–136.

161
Kuhn, P. (2001), ’Summary and Synthesis’, in P. Kuhn P. (ed.), Losing Work, Moving
On: Worker Displacement in an International Perspective, (W.E. Upjohn Institute for
Employment Research, Michigan), 1–72.
Lupi, C. and P. Ordine (2002), ’Unemployment scarring in high unemployment regions’,
Economics Bulletin 10, 1–8.
Manski, C.F. and J.D. Straub (2000), ’Worker perceptions of job insecurity in the mid-
1990s. Evidence from the survey of economic expectations’, The Journal of Human
Resources 35, 447–479.
Neumark, D., D. Polsky and D. Hansen (1999), ’Has job stability declined yet? New
evidence for the 1990s’, Journal of Labor Economics 17, S29–S64.
Nickell S. and R. Layard (1999), ’Labor market institutions and economic performance’,
in O. Ashenfelter and D. Card (eds.), Handbook of Labour Economics, Vol. 3C (North-
Holland, Amsterdam), 3029–3084.
Nickell, S., T. Jones and G. Quintini (2002), ’A picture of job insecurity facing British
men’, The Economic Journal 112, 1–27.
OECD (1997), Employment Outlook, (OECD, Paris).
OECD (1998), Benefit Systems and Work Incentives, (OECD, Paris).
OECD (1999), OECD Economic Outlook, (OECD, Paris).
Ruhm, C. (1991), ’Are workers permanently scarred by job displacements?’, The
American Economic Review 81, 319–324.
Ryan, P. (2001), ’The school-to-work transition: Cross-country perspective’, Journal
of Economic Literature 39, 34–92.
Salvanes, K.G. (1997), ’Market rigidities and labour market flexibility: An international
comparison’, Scandinavian Journal of Economics 99, 315–333.
Schmidt, S.R. (1999), ’Long-run trends in workers’ beliefs about their own job security:
Evidence from the general social survey’, Journal of Labor Economics 17, S127–S141.

162
Tversky, A. and D. Kahneman (1982), ’Chapter one’, in A. Tversky A. and D. Kahneman
(eds.), Judgement and Uncertainty: Heuristics and Biases (Cambridge University Press,
Cambridge), 1–27.
Van Praag, B.M.S., P. Frijters and A. Ferrer-i-Carbonell (2001), The anatomy of subjective
well-being, Discussion Paper 265 (DIW, Berlin).

163
1 Davis and Haltiwanger (1999) provide a survey of the literature on gross job and workerflows. Burda and Wyplosz (1994) provide empirical evidence on the magnitude of gross joband worker flows in Europe.
2 In addition, Aaronson and Sullivan (1998) argue that the trends in job security are muchmore relevant to the discussion of whether special factors might be restraining wage inflationthan are the trends in realized job stability. In particular, if declines in job stability are lessdramatic than declines in job security, it must largely be because workers are less likely toleave jobs voluntarily, and a decreased tendency to quit jobs may itself signal workerinsecurity.
3 The survey was commissioned by the European Foundation for the Improvement of Livingand Working Conditions, Dublin, and the Norwegian Royal Ministry of Labour andGovernment Administration, Oslo. Fieldwork was co-ordinated by Infratest BurkeSozialforschung, which also prepared the initial analyses of the survey.
4 Alesina et al. (2001) provide a recent study on the differences of European and U.S.welfare systems.
5 Neumark et al. (1999) summarize the evidence on job instability in the United States.OECD (1997) provide empirical evidence on the evolution and the causes of job instabilityfor Europe. In addition, Givord and Maurin (2001) provide recent evidence on the rise inmagnitude of job instability in France.
6 OECD (1997) provides a breakdown of perceived job insecurity in Europe based on theEurobarometer Survey for 1996. Blanchflower and Oswald (1999) provide an investigationinto job insecurity by applying the ISSP (International Social Survey Program) including alarge group of countries. In addition, Domenighetti et al. (2000) provide empirical evidencefor the view that job insecurity generates substantial negative health effects (for example,sleeplessness).
7 Aaronson and Sullivan (1998) provide additional evidence on this issue.
8 However, the empirical evidence presented by Aaronson and Sullivan (1998) reveals thatan increase in the perceived likelihood of job loss has been especially great among white-collar workers during the 1990s. Thus, there has been a kind of ”democratization” of jobinsecurity in the U.S.
9 Green et al. (2001) also find that increased job insecurity, relative to the aggregateunemployment rate, has contributed in part to wage restraint in the UK. Aaronson andSullivan (1998) have earlier reported similiar empirical results for the U.S. by using theGeneral Social Survey (GSS). Nickell et al. (2002) provide additional evidence on the issueof job insecurity in the UK.
10 Infratest Burke Sozialforschung (1999a, 1999b, 1999c, 1999d) provides the detaileddocumentation of the survey.
11 The total number of telephone-assisted interviews was 30557. The number of non-employedindividuals and economically inactive persons was 17908.
12 Self-employed persons are defined as persons who declare themselves to be self-employed.
13 Green et al. (2001) present similiar scatterplots by using the International Social SurveyProgramme (ISSP) and find that there is a positive association between job insecurity andthe aggregate unemployment rate across countries.

164
14 Greece and Luxembourg are excluded from Figures 2-3 due to the fact that indexes oflabour standards and employment protection are not available for these countries. Theseindexes are adapted from Nickell and Layard (1999, p. 3040). The index of labour standardstrictness is originally by OECD. Each country is scored from 0 (lax or no legislation) to 2(strict legislation) on five dimensions: working hours, fixed-term contracts, employmentprotection, minimum wages and employees’ representation rights. The scores are thentotalled, generating an index ranging from 0 to 10. The OECD employment protection indexis based on the strength of the legal framework governing hiring and firing of workers.Countries are ranked from 1 to 20, with 20 being the most strictly regulated.
15 Another possible interpretation of the correlation is that the demand for employmentprotection rises if there is a great deal of perception of job instability among employees.Agell (1999) provides an elaboration along this line of thinking.
16 Bertola (1992), Garibaldi et al. (1997), Salvanes (1997) and Garibaldi (1998) providepresentations of this view of labour market adjustment.
17 Greece is excluded from the figure owing to the fact that the replacement rate is notavailable for that particular country. The replacement rates are adapted from OECD (1998)and calculated as an average of the first four columns in Table 3.1, which report replacementrates for four family types (i.e. single, married couple, couple with two children and loneparent with two children).
18 Horowitz and Savin (2001) provide a survey of binary response models.
19 A limited number of observations does not make it possible to estimate the specificationsseparately for each country of the survey.
20 Ryan (2001) provides a survey of these issues.
21 However, the measure of education in the investigation by OECD (1997) is far from perfect,because education is proxied by the age at which the individual first left full-time education.
22 This result is not in line with a stylized fact in the literature on gross worker flows,according to which the probability of a job ending, in fact, declines with tenure (see, forexample, Farber, 1999). A potential problem with the conclusion that a long tenure does notyield a decline in the perception of job instability is the fact that the age of an employee andthe length of the tenure tend to be positively correlated across individuals.
23 A related study by Ruhm (1991) finds that job losers continue to experience lasting wagereductions in the U.S. This suggests that there are significant worker attachments to specificjobs. In addition, Hall (1995) focuses on the permanent effects of job losses in the U.S.Kletzer (1998) provides a summary of empirical findings.
24 Tversky and Kahneman (1982) provide a discussion of these effects.
25 Lupi and Ordine (2002) report that individual unemployment experiences tend to scarringonly in the northern regions of Italy, where the aggregate unemployment rate is relativelylow compared with that in southern parts of the country.
26 Another possibility is that employees that have, by nature, a substantial risk of losing theirjobs should they hold more than just one current job. Bell et al. (1997) observe by using theBritish Household Panel Study that multiple job holding is an incomplete ’hedge’ againstfinancial insecurity in the UK. Keyssar (1986) provides an interesting discussion ofunemployment in Massachusetts in the 19th century. According to Keyssar (1986) manypeople held many jobs as a mechanism of self-insurance.

165
27 The results concerning the effect of a part-time job on insecurity is in conflict with theobservations by Green et al. (2000) for the UK, according to which part-time jobs tend toyield an increase in the perception of job insecurity in low wage occupations.
28 Temporary employment is defined as non-permanent employment (including fixed-termand temporary agency contracts).
29 Houseman (1998) provides empirical evidence on this feature of labour markets for theU.S.
30 Davis and Haltiwanger (1999) provide a survey of the literature.


HELSINGIN KAUPPAKORKEAKOULUN JULKAISUJAPublications of the Helsinki School of Economics
A-SARJA: VÄITÖSKIRJOJA - DOCTORAL DISSERTATIONS. ISSN 1237-556X.
A:184. JUKKA VESALA: Technological Transformation and Retail Banking Competition: Implications and Measurement. 2001. ISBN 951-791-518-7.
A:185. JOHANNA MOISANDER: Representation of Green Consumerism: A Constructionist Critique. 2001. ISBN 951-791-602-7.
A:186. JUHANI VAIVIO: Non-financial Measurement in an Organizational Context. Three Perspec-tives. 2001. ISBN 951-791-604-3.
A:187. ARJA JUNTUNEN: Audience Members’ Goals of Media Use and Processing of Advertise-ments. 2001. ISBN 951-791-608-6.
A:188. TIMO KUOSMANEN: The Role of Production Assumptions in Data Envelopment Analysis. 2001. ISBN 951-791-610-8.
A:189. ISMO TEIKARI: Poisson Mixture Sampling in Controlling the Distribution of Response Burden in Longitudinal and Cross Section Business Surveys. 2001.
ISBN 951-791-611-6.
A:190. LIISA ROHWEDER: Ympäristökasvatus ammattikorkeakoulussa. Opetussuunnitelma-teoreet-tisen mallin kehittäminen liiketalouden koulutukseen. 2001. ISBN 951-791-613-2.
A:191. PEKKA SULAMAA: Essays in Deregulated Finnish and Nordic Electricity Markets. 2001. ISBN 951-791-617-5.
A:192. SUSAN MERILÄINEN: Changing Gendered Practices: A PAR Project within an Academic Work Community. 2001. ISBN 951-791-640-X.
A:193. A. MAARIT I. KALLIO: Studies on Competition in the Finnish Wood Market. 2001. ISBN 951-791-643-4.
A:194. KALEVI EURO: Locational Changes of Headquarters of Multinational Corporations. A Theo-retical Study on The Motives and Reasons for Relocating Finnish Divisional Headquarters Abroad. 2001. ISBN 951-791-646-9.
A:195. VELI-PEKKA HEIKKINEN: Modelling Timber Harvesting Decisions as a Part of the Manage-ment of a Mixed Asset Portfolio. 2001. ISBN 951-791-656-6.
A:196. NIINA PAUTOLA-MOL: The Baltic States’ Integration into the European Union – Institutional Approach. 2001. ISBN 951-791-657-4.
A:197. ANSSI ÖÖRNI: Consumer Search in Electronic Markets. 2002. ISBN 951-791-680-9.
A:198. ARI MATIKKA: Measuring the Performance of Owner-Managed Firms: A systems approach. 2002. ISBN 951-791-685-X.

A:199. RIITTA KOSONEN: Governance, the Local Regulation Process, and Enterprise Adaptation in Post-Socialism. The Case of Vyborg. 2002. ISBN 951-791-692-2.
A:200. SUSANNE SUHONEN: Industry Evolution and Shakeout Mechanisms: The Case of the Internet Service Provider Industry. 2002. ISBN 951-791-693-0.
A:201. MATTI TUOMINEN: Market-Driven Capabilities and Operational Performance. Theoretical Foundations and Managerial Practices. 2002. ISBN 95-791-694-9.
A:202. JUSSI KARHUNEN: Essays on Tender Offers and Share Repurchases. 2002. ISBN 951-791-696-5.
A:203. HENNAMARI MIKKOLA: Empirical Studies on Finnish Hospital Pricing Methods. 2002.ISBN 951-791-714-7.
A:204. MIKA KORTELAINEN: EDGE: a Model of the Euro Area with Applications to Monetary Policy. 2002. ISBN 951-791-715-5.
A:205. TOMI LAAMANEN: Essays on Technology Investments and Valuation. 2002. ISBN 951-791-716-3.
A:206. MINNA SÖDERQVIST: Internationalisation and its Management at Higher-Education Institutions. Applying Conceptual, Content and Discourse Analysis. 2002.
ISBN 951-791-718-X.
A:207. TARJA PIETILÄINEN: Moninainen yrittäminen. Sukupuoli ja yrittäjänaisten toimintatila tietoteollisuudessa. 2002. ISBN 951-791-719-8.
A:208. BIRGIT KLEYMANN: The Development of Multilateral Alliances. The Case of the Airline Industry. 2002. ISBN 951-791-720-1.
A:209. MIKAEL EPSTEIN: Risk Management of Innovative R&D Project. Development of Analysys Model. A Systematic Approach for the Early Detection of Complex Problems(EDCP) in R&D Projects in Order to Increase Success in Enterprises. 2002.
ISBN 951-791-717-9.
A:210. SAMI KAJALO: Deregulation of Retail Hours in Finland: Historical and Empirical Perspectives.2002. ISBN 951-791-734-1.
A:211. TOMMI KASURINEN: Exploring Management Accounting Change in the Balanced Scorecard Context. Three Perspectives. 2003. ISBN 951-791-736-8.
A:212. LASSE NIEMI: Essays on Audit Pricing. 2003. ISBN 951-791-751-1.
A:213. MARKKU KAUSTIA: Essays on Investor Behavior and Psychological Reference Prices. 2003. ISBN 951-791-754-6.
A:214. TEEMU YLIKOSKI: Access Denied: Patterns of Consumer Internet Information Search and the Effects of Internet Search Expertise. 2003. ISBN 951-791-755-4.
A:215. PETRI HALLIKAINEN: Evaluation of Information System Investments. 2003. ISBN 951-791-758-9.
A:216. PETRI BÖCKERMAN: Empirical Studies on Working Hours and Labour Market Flows. 2003. ISBN 951-791-760-0.

A-SARJA: MUITA JULKAISUJA - OTHER PUBLICATIONS
Väitöskirjojen tiivistelmät 1996-2001. Helsingin kauppakorkeakoulun 12. promootion juhlajulkaisu. 2001. ISBN 951-791-617-5. ANNE HERBERT: The Paradoxes of Action Learning: An Interpretive and Critical Inquiry
into Vocational Educators’ Professional Development. 2002. ISBN 951-791-684-1.
B-SARJA: TUTKIMUKSIA - RESEARCH REPORTS. ISSN 0356-889X.
B:31. HEIDI MOISIO – ANNUKKA JYRÄMÄ: Helsingin kulttuurikaupunkisäätiön ja tuotan-toyhtiöiden välinen yhteistyö. 2001. ISBN 951-791-607-8.
B:32. KRISTIINA KORHONEN: Role of government intervention in foreign direct investment: Case of South Korea. 2001. ISBN 951-791-620-5.
B:33. MINNA SÖDERQVIST: The Internationalisation and Strategic Planning of Higher-Education Institutions. An Analysis of Finnish EPS Strategies. 2001. ISBN 951-791-623-X.
B:34. KATJA LEPPÄLÄ – HANNA PÄIVIÖ: Kauppatieteiden opiskelijoiden moraalijärjestys: Nar-ratiivinen tutkimus kolmen eri pääaineen opiskelusta Helsingin kauppakorkeakoulussa. 2001. ISBN 951-791-629-9.
B:35. EERO W. ARTTO: Performance and International Competitiveness of Listed Paper Industry Groups 1992-2000. Finland vs Sweden, Canada and USA. 2001. ISBN 951-791-635-3.
B:36. ARJA KALMARI – JOHANNA MARKKANEN: Erektiohäiriölääke Viagran saama julkisuus Suomessa vuosina 1998 - 2000. 2001. ISBN 951-791-647-7.
B:37. ANTERO HONKASALO: Ekotehokkuus, tuotepolitiikka ja ympäristöpolitiikan ohjauskeinot. 2001. ISBN 951-791-653-1.
B:38. KRISTIINA KORHONEN(ed.): Current Reflections on the Pacific Rim. 2002. ISBN 951-791-661-2.
B:39. RISTO Y. JUURMAA: Performance and International Competitiveness of Listed Metal and Telecommunication Industry Groups 1992 - 2000. Finland vs Sweden and Germany. 2002. ISBN 951-791-668-X.
B:40. KAIJA TUOMI – SINIKKA VANHALA (toim.): Yrityksen toiminta, menestyminen ja hen-kilöstön hyvinvointi. Seurantatutkimus metalliteollisuudessa ja vähittäiskaupan alalla. 2002. ISBN 951-791-674-4.
B:41. ANNE ÄYVÄRI: Verkottuneen pienyrityksen markkinointikyvykkyys. 2002. ISBN 951-791-682-5.
B:42. RIKU OKSMAN: Intohimoa ja ammattitaitoa: puheenvuoroja tuottajan työstä. 2002. ISBN 951-791-700-7.

B:43. RISTO TAINIO – KARI LILJA – TIMO SANTALAINEN: Organizational Learning in the Context of Corporate Growth and Decline: A Case Study of a Major Finnish Bank. 2002. ISBN 951-791-717-1
B:44. ELINA HENTTONEN – PÄIVI ERIKSSON – SUSAN MERILÄINEN: Teknologiayrittämisen sukupuoli. Naiset miesten maailmassa. 2003. ISBN 951-791-737-6.
B:45. KIRSI KORPIAHO: “Kyllä siinä pitää elää mukana!” Kirjanpitäjien tarinoita työstä, osaami-sesta ja oppimisesta työyhteisönäkökulmasta analysoituna. 2003. ISBN 951-791-742-2.
B:46. NIILO HOME (toim.): Puheenvuoroja ECR-toiminnasta. Discussions on ECR – Summaries.2003. ISBN 951-791-749-X.
B:47. PÄIVI KARHUNEN – RIITTA KOSONEN – MALLA PAAJANEN: Gateway-käsitteen elinkaari Venäjän-matkailussa. Etelä-Suomi Pietarin-matkailun väylänä. 2003. ISBN 951-791-756-2.
CKIR-SARJA: HELSINKI SCHOOL OF ECONOMICS. CENTER FOR KNOWLEDGE AND INNOVATION RESEARCH. CKIR WORKING PAPERS. ISSN 1458-5189.
CKIR:1. SATINDER P. GILL: The Engagement Space and Parallel Coordinated Movement: Case of a Conceptual Drawing Task. 2002. ISBN 951-791-660-4.
CKIR:2 PEKKA ISOTALUS – HANNI MUUKKONEN: How Do Users of Pda’s React to an Animated Human Character in Online News? 2002. ISBN 951-791-664-7.
E-SARJA: SELVITYKSIÄ - REPORTS AND CATALOGUES. ISSN 1237-5330.
E:100. JUHA KINNUNEN: Opiskelijoiden valikoituminen pääaineisiin Helsingin kauppakorkeak-oulussa. Pääainetoiveita ja niihin vaikuttavia tekijöitä kartoittava kyselytutkimus vuosina 1995-2000 opintonsa aloittaneista. 2002. ISBN 951-791-669-8.
E:101. Research Catalogue 2000 – 2002. Projects and Publications. 2002. ISBN 951-791-670-1.
N-SARJA: HELSINKI SCHOOL OF ECONOMICS. MIKKELI BUSINESS CAMPUS PUBLICATIONS.ISSN 1458-5383
N:1 PÄIVI KARHUNEN: Etelä-Savon yritysten ulkomaankauppa 2000. 2001. ISBN 951-791-648-5.
N:2. PÄIVI KARHUNEN: Etelä-Savon yritysten Venäjän-kauppa 2002. 2001. ISBN 951-791-649-3.
N:3. RIITTA ERONEN: Selvitys venäläismatkailua koskevasta tutkimustiedosta. 2001. ISBN 951-791-650-7.

N:4. MARITA HEIKKINEN-RUMMUKAINEN: Venäläläismatkailu Etelä-Savossa. 2001. ISBN 951-791-651-5.
N:5. PÄIVI KARHUNEN: Metalliteollisuuden alinhankintamahdollisuudet Venäjällä. Eteläsavolaisten ja pietarilaisten yritysten kokemuksia tuotannollisesta yhteistyöstä. 2001. ISBN 951-791-652-3.
N:6 JUHA SIIKAVUO: Taloushallinon opas alkavalle yrittäjälle. 2002. ISBN 951-791-686-8.
N:7. JOHANNA NISKANEN: Etelä-Savon pk-yritysten vienti Tanskaan: ulkomaankaupan erityis-raportti 2001. 2002. ISBN 951-791-687-6.
N:8. MIKKO NUMMI: Etelä-Savon pk-yritysten vienti Saksaan: ulkomaankaupan erityisraportti 2001. 2002. ISBN 951-791-688-4.
N:9. NOORA RUOHONEN – RIIKKA OLLI: Etelä-Savon pk-yritysten vienti Tsekkiin: ulkomaankaupan erityisraportti 2001. 2002. ISBN 951-791-689-2.
N:10. ANNA HÄKKINEN – ESKO LÄIKKÖ: Etelä-Savon pk-yritysten vientikohteena USA: ulkom-aankaupan erityisraportti 2001. 2002. ISBN 951-791-690-6.
N:11. JUHA SIIKAVUO: Verkko-oppimisympäristön kehittäminen. Esimerkkinä HA Boctok Venäjän-kaupan erikoistumisopintojen yksi moduuli, vuosi: 2002. 2002.
ISBN 951-791-695-7.
N:12. JUHO PETTER PUHAKAINEN: German Venture Capitalists’ Decision Criteria in NewVenture Evaluation. 2002. ISBN 951-791-650-7.
N:13. MILJA LEMMETYINEN: Suomalaisyrityksen etabloituminen Saksaan. Ulkomaankaupan erityisraportti 2002. 2002. ISBN 951-791-730-9.
N:14. TAPIO PALLASVIRTA: Pk-yritysten vienti Espanjaan. Ulkomaankaupan erityisraportti 2002. 2002. ISBN 951-791-731-7.
N:15. ELINA HAVERINEN: Etelä-Savon pk-yritysten Viron kauppa. Ulkomaankaupan erityisraportti 2003. ISBN 951-791-732-5.
N:16. REETA RÖNKKÖ: Latinalainen Amerikka markkina-alueena Argentiina ja Brasilia. Ulko-maankaupan erityisraportti 2003. ISBN 951-791-733-3.
N:17. JAAKKO VARVIKKO – JUHA SIIKAVUO: Koulutus, oppiminen ja akateeminen yrittäjyys. 2003. ISBN 951-791-745-7.
W-SARJA: TYÖPAPEREITA - WORKING PAPERS . ISSN 1235-5674.
W:275. JOHANNA MOISANDER – LIISA UUSITALO: Motivation and Social Contingency of Envi-ronmental Consumer Choices. 2001. ISBN 951-791-516-0.
W:276. MIRJAMI FAGERSTRÖM: Suhdemarkkinoinnin hyödyntäminen kuluttajatuotteiden mark-kinoinnissa. Kuluttajasuhdemarkkinoinnin tutkimuksen kirjallisuusanalyysi. 2001.
ISBN 951-791-518-7.

W:277. JUHANI VAIVIO: “Provocative” Non-Financial Measures in Knowledge Creation. 2001. ISBN 951-791-603-5.
W:278. HANNU KIVIJÄRVI – MARKKU KUULA: A Finnish Forest Sector Model. 2001. ISBN 951-791-606-X.
W:279. VIRPI KRISTIINA TUUNAINEN (Edit.): Proceedings of The Third Electronic GroceryShopping (EGS) Workshop. Brisbane, Australia, December 13, 2000. In Connection with The 21st International Conference on Information Systems (ICIS). 2001.
ISBN 951-791-609-4.
W:280. JUSSI V. KOIVISTO: Conceptualising Cross-Culturall Organisations: Cultural Crossing with its Locus, Modus And Focus. 2001. ISBN 951-791-612-4.
W:281. JUKKA KALLIO – TIMO SAARINEN – MARKKU TINNILÄ: Efficient Change Strategies-matching Drivers and Tracers in Change Projects. 2001. ISBN 951-791-614-0.
W:282. JUKKA KALLIO – TIMO SAARINEN – MARKKU TINNILÄ – VIRPI TUUNAINEN: Elektronisen kaupankäynnin vaikutukset kaupan ja palveluiden arvoketjuihin, liiketoimintaprosesseihin ja työtehtäviin. 2001. ISBN 951-791-615-9.
W:283. TIMO KUOSMANEN: Stochastic Dominance Efficiency Tests Under Diversification. 2001. ISBN 951-791-618-3.
W:284. EERO KIVIMÄKI: Yritysstrategian mittaus. Strategia-analyysien luotettavuus ja käyttökelpoisuus kilpailukyvyn, laadun- ja pienyrityksen näkökulmista. 2001. ISBN 951-791-619-1.
W:285. INKERI HIRVENSALO – TERO LAUSALA: Foreign Direct Investments in the Russian Ter-ritories of the Barents Region. 2001. ISBN 951-791-621-3.
W:286. SEPPO SALO – OLLI TAHVONEN: Optimal Evolution of Forest Age-Classes and Land Allocation Between Forestry and Agriculture. 2001. ISBN: 951-791-622-1.
W:287. TARU LEHTONEN: In Search of Efficiency – Norddrg Based Pricing and Case-Mix Accounting. 2001. ISBN 951-791-625-6.
W:288. JUSSI V. KOIVISTO – MATTI LAMPINEN: Crossing National and Corporate Cultures.In-Depth Analysis of the Cross-Cultural Organisation in the Integration of a Finnish Firm s Acquisition Case in Hong Kong. 2001. ISBN 951-791-627-2.
W:289. ANU H. BASK – JARI JUGA – JOUNI LAINE: Evolution of Container Transport: Services, Management and Technologies. 2001. ISBN 951-791-631-0.
W:290. MATTI LISKI – ANNE TOPPINEN: Stochastic versus Deterministic Trends in Carbon Dioxide Time Series. 2001. ISBN 951-791-632-9.
W:291. MATTI LISKI: Market Opening in Search Equilibrium: Should Licences to Pollute be Tradable? 2001. ISBN 951-791-633-7.
W:292. MATTI LISKI – OLLI TAHVONEN: Can Carbon Tax Eat Opec’s Rents? 2001. ISBN 951-791-634-5.
W:293. PEKKA KORHONEN – MIKKO SYRJÄNEN: Resource Allocation Based on Efficiency Analysis. 2001. ISBN 951-791-636-1.

W:294. BIRGIT KLEYMANN: A Resource Dependence Perspective on Multilateral Alliances. The Case of the Airline Industry. 2001. ISBN 951-791-637-X.
W:295. JUSSI V. KOIVISTO – MATTI LAMPINEN: Acquisition of Strategic Technology through International Corporate M&A in Finnish High Technology Sectors. 2001.
ISBN 951-791-638-8.
W:296. PERTTI HAAPARANTA – LEENA KERKELÄ – MATTI LISKI – TONI RIIPINEN – PEKKA SULAMAA: Climate Change Policies, World Markets and Finland - Simulation Results. 2001. ISBN 951-791-639-6.
W:297. MAARIT KALLIO – MARKKU KALLIO: Nonparametric Models for Evaluating Economic Efficiency and Imperfect Competition – with an Application to Competition in the Forest Sector. 2001. ISBN 951-791-641-8.
W:298. TOMI DAHLBERG – JENS HØRLÜCK: Internet Hype Overreaction - And What We Can Learn from it. 2001. ISBN 951-791-642-6.
W:299. ANTTI SÄÄSKILAHTI: Epäjatkuvuuden hallinta. 2001. ISBN 951-791-644-2.
W:300. VELI-PEKKA HEIKKINEN: Timber Harvesting Decisions Based On Multi-period Stochastic Portfolio Optimisation. 2001. ISBN 951-791-645-0.
W:301. PEKKA KORHONEN – SARI RYTÖKOSKI – MIKKO SYRJÄNEN: Multiple Objective Approach as an Alternative to Radial Projection in DEA. 2001. ISBN 951-791-654-X.
W:302. JUSSI KARHUNEN: What Determines Actual Open Market Repurchases? Evidence from Finland. 2001. ISBN 951-791-658-2.
W:303. JUSSI KARHUNEN: Who Accepts Tender Offers? 2001. ISBN 951-791-659-0.
W:304. PETRI BÖCKERMAN – KARI HÄMÄLÄINEN – MIKA MALIRANTA: Explaining Regional Job and Worker Flows. 2002. ISBN 951-791.662-0.
W:305. PEKKA KORHONEN – MIKKO SYRJÄNEN: Evaluation of Cost Efficiency in Finnish Electricity Distribution. 2002. ISBN 951-791-663-9.
W:306. SATU NURMI: The Determinants of Plant Survival in Finnish Manufacturing. 2002. ISBN 951-791-665-5.
W:307. JUSSI KARHUNEN: Taking Stock of Themselves. An Analysis of the Motives and the Market Reaction in Finnish Share Repurchase Programs 2002. ISBN 951-791-666-3.
W:308. PEKKA ILMAKUNNAS – HANNA PESOLA: Matching Functions and Efficiency Analysis. 2002. ISBN 951-791-671-X.
W:309. MARKKU SÄÄKSJÄRVI: Software Application Platforms: From Product Architecture to Integrated Application Strategy. 2002. ISBN 951-791-672-8.
W:310. MILLA HUURROS – HANNU SERISTÖ: Alliancing for Mobile Commerce: Convergence of Financial Institutions and Mobile Operators. 2002. ISBN 951-791-673-6.
W:311. ANSSI ÖÖRNI: Objectives of Search and Combination of Information Channels in Electronic Consumer Markets: An Explorative Study. 2002. ISBN 951-791-675-2.

W:312. ANSSI ÖÖRNI: Consumer Search in Electronic Markets: Experimental Analysis of Travel Services. 2002. ISBN 951-791-676-0.
W:313. ANSSI ÖÖRNI: Dominant Search Pattern in Electronic Markets: Simultaneous or Sequential Search. 2002. ISBN 951-791-677-9.
W:314. ANSSI ÖÖRNI: The Amount of Search in Electronic Consumer Markets. 2002. ISBN 951-791-678-7.
W:315. KLAUS KULTTI – TUOMAS TAKALO – TANJA TANAYAMA: R&d Spillovers and Information Exchange: A Case Study. 2002. ISBN 951-791-681-7.
W:316. OLLI TAHVONEN: Timber Production v.s. Old Growth Conservation with Endogenous Prices and Forest Age Classes. 2002. ISBN 951-791-691-4.
W:317. KLAUS KULTTI – JUHA VIRRANKOSKI: Price Distribution in a Symmetric Economy. 2002. ISBN 951-791-697-3.
W:318. KLAUS KULTTI – TONI RIIPINEN: Multilateral and Bilateral Meetings with Production Heterogeneity. 2002. ISBN 951-791-698-1.
W:319. MARKKU KAUSTIA: Psychological Reference Levels and IPO Stock Returns. 2002. ISBN 951-791-699-X.
W:320. MERVI LINDQVIST: Possible Research Issues in Management and Control of New Economy Companies. 2002. ISBN 951-791-701-5.
W:321. MARKO LINDROOS: Coalitions in Fisheries. 2002. ISBN 951-791-702-3.
W:322. MIKKO SYRJÄNEN: Non-discretionary and Discretionary Factors and Scale in Data Envel-opment Analysis. 2002. ISBN 951-791-705-8.
W:323. KLAUS KULTTI – HANNU VARTIAINEN: VonNeumann-Morgenstern Solution to the Cake Division Problem. 2002. ISBN 951-791-708-2.
W:324. TOM LAHTI: A Review of the Principal-agent Theory and the Theory of Incomplete Contracts: An Examination of the Venture Capital Context. 2002. ISBN 951-791-709-0.
W:325. KRISTIAN MÖLLER – PEKKA TÖRRÖNEN: Business Suppliers’ Value-Creation Potential: A Capability-based Analysis. 2002. ISBN 951-791-710-4.
W:326. KRISTIAN MÖLLER – ARTO RAJALA – SENJA SVAHN: Strategic Business Nets – Their Types and Management. 2002. ISBN 951-791-711-2.
W:327. KRISTIAN MÖLLER – SENJA SVAHN – ARTO RAJALA: Network Management as a Set of Dynamic Capabilities. 2002. ISBN 951-791-712-0.
W:328. PANU KALMI: Employee Ownership and Degeneration. Evidence from Estonian case studies. 2002. ISBN 951-791-713-9.
W:329. ANNELI NORDBERG: Yrittäjyys, johtajuus ja johtaminen – uuden talouden innovatiivisia haasteita. 2002. ISBN 951-791-721-X.
W:330. LEENA LOUHIALA-SALMINEN: Communication and language use in merged corporations: Cases Stora Enso and Nordea. 2002. ISBN 951-791-722-8.

W:331. TOMMI KASURINEN: Conceptualising the Encoding Process Related to Institutionalisation in Organisations. From Key Performance Indicator Scorecard to a Strategic Balanced Scorecard. 2002. ISBN 951-791-723-6.
W:332. PEKKA KORHONEN – HELENA TOPDAGI: Performance of the AHP in Comparison of Gains and Losses. 2002. ISBN 951-791-724-4.
W:333. TARJA JORO – PEKKA KORHONEN – STANLEY ZIONTS: An Interactive Approach to ImproveEstimates of Value Efficiency in Data Envelopment Analysis. 2002. ISBN 951-791-725-2.
W:334. JUHA-PEKKA TOLVANEN – JEFF GRAY – MATTI ROSSI (edit.): Proceedings of the Second- Domain Specific Modeling Languages Workshop. 2002. ISBN 951-791-726-0.
W:335. SATU NURMI: Sectoral Differences In Plant Start-up Size. 2003. ISBN 951-791-738-4.
W:336. SATU NURMI: Plant Size, Age And Growth In Finnish Manufacturing. 2003. ISBN 951-791-739-2.
W:337. PETRI HALLIKAINEN – HANNU KIVIJÄRVI: Appraisal of Strategic it Investments: Payoffs And Tradeoffs. 2003. ISBN 951-791-740-6.
W:338. SENJA SVAHN: Knowledge Creation in Business Networks – A Dynamic-capability Perspective. 2003. ISBN 951-791-743-0.
W:339. KRISTIAN MÖLLER – SENJA SVAHN: Role of Knowledge in the Value Creation in Business Nets. 2003. ISBN 951-791-744-9.
W:340. ELI MOEN – KARI LILJA: European Works Councils in M-Real and Norske Skog: The Impact of National Traditions in Industrial Relations. 2003. ISBN 951-791-750-3.
W:341. KJELD MÖLLER: Salatulla ”arvopaperistamisella” tuhottiin yrittäjyyttä. 2003. ISBN 951 791-752-X
W:342. ATSO ANDERSEN: Competition Between European Stock Exchanges. 2003. ISBN 951-791-753-8.
W:343. MARKO MERISAVO: The Effects of Digital Marketing on Customer Relationships. 2003. ISBN 951-791-757-0.
W:344. KLAUS KULTTI – JUHA VIRRANKOSKI: Price Distribution in a Random Matching Model. 2003. ISBN 951-791-759-7.
Y-SARJA: HELSINKI SCHOOL OF ECONOMICS. CENTRE FOR INTERNATIONAL BUSINESS RESEARCH. CIBR RESEARCH PAPERS. ISBN 1237-394X.
Y:6. MIKA GABRIELSSON – V. H. MANEK KIRPALANI – REIJO LUOSTARINEN: Multiple Chan-nel Strategies in the European PC Industry. 2001. ISBN 951-791-628-0.

Y:7. ZUHAIR AL-OBAIDI – MIKA GABRIELSSON: Multiple Sales Channel Strategies in Export Marketing of High Tech SMEs. 2002. ISBN 951-791-703-1.
Z-SARJA: HELSINKI SCHOOL OF ECONOMICS.CENTRE FOR INTERNATIONAL BUSINESS RESEARCH. CIBR WORKING PAPERS. ISSN 1235-3931.
Z:9. V.H. MANEK KIRPALANI – MIKA GABRIELSSON: Worldwide Evolution of Channels Policy. 2002. ISBN 951-791-704-X.
Kaikkia Helsingin kauppakorkeakoulun julkaisusarjassa ilmestyneitä julkaisuja voi tilata osoitteella:
KY-Palvelu Oy Helsingin kauppakorkeakouluKirjakauppa JulkaisutoimittajaRuneberginkatu 14-16 PL 121000100 Helsinki 00101 HelsinkiPuh. (09) 4313 8310, fax (09) 495 617 Puh. (09) 4313 8579, fax (09) 4313 8305Sähköposti: [email protected] Sähköposti: [email protected]
All the publications can be ordered from
Helsinki School of EconomicsPublications officerP.O.Box 1210FIN-00101 HelsinkiPhone +358-9-4313 8579, fax +358-9-4313 8305 E-mail: [email protected]