perusahaan umum listrik negara appraisal of the fourth...
TRANSCRIPT
Report No. 766-IND FILE COPYIndonesiaPerusahaan Umum Listrik NegaraAppraisal of the Fourth Power ProjectMay 20, 1975
East Asia and Pacific Projects DepartmentPower Division
Not for Public Use
Document of the International Bank for Reconstruction and DevelopmentInternational Development Association
This report was prepared for official use only by the Bank Group. It may notbe published, quoted or cited without Bank Group authorization. The Bank Group doesnot accept responsibility for the accuracy or completeness of the report
Pub
lic D
iscl
osur
e A
utho
rized
Pub
lic D
iscl
osur
e A
utho
rized
Pub
lic D
iscl
osur
e A
utho
rized
Pub
lic D
iscl
osur
e A
utho
rized
Pub
lic D
iscl
osur
e A
utho
rized
Pub
lic D
iscl
osur
e A
utho
rized
Pub
lic D
iscl
osur
e A
utho
rized
Pub
lic D
iscl
osur
e A
utho
rized
CURRENCY EQUIVALENTS
US$1 - Indonesia Rupiah (Rp) 415Rp 100 - US$0.241Rp 1 million - US$2,410
UNITS AND EQUIVALENTS
1 kilometer (km) 2 ' 0.6214 miles (mi)1 square kilometer (km ) - 0.3861 square miles (sq. mi.)1 liter (1) ' 0.0063 barrels1 kilovolt (kV) - 1,000 volts (V)1 megavolt - ampere (MVA) - 1,000 kilovolt-amperes (kVA)1 kilovolt - ampere (kVA) - 1,000 volt-amperes (VA)1 megawatt (MW) - 1,000 kilowatts (kW)1 gigawatt hour (GWh) - 1 million kilowatt hours (kWh)1 kilo calorie (kcal) - 3.968 British thermal units (BTU)
ABBREVIATIONS AND ACRONYMS
BAPPENAS - National Planning AgencyBVI - Black and Veatch International
(Engineering Consultants)EPA - Environmental Protection AgencyGDP - Gross Domestic ProductIGGI - Inter-Governmental Group for IndonesiaPERTAMINA - National Oil CompanyREPELITA - Development PlanSOFRELEC - Engineering and Management Consultants
PLN's FISCAL YEARS
1971-1973 - January 1 - December 311974/75 onward - April 1 - March 31
INDONESIA
PERUSAHAAN UMUM LISTRIK NEGARA
APPRAISAL OF THEFOURTH POWER PROJECT
TABLE OF CONTENTS
Page No.
SUMMARY AND CONCLUSIONS . . . i-ii
I. INTRODUCTION ....................... 1
II. THE POWER SECTOR ........................................ 1
Economic Background . . ........................ . 1Sector Organization ...... ...................... 2Existing Public Power Facilities ............... ... 2Sector Planning ................................... 3The Power Market *............................... 3Development Plan ........ ...................... 4
III. THE BENEFICIARY ................... 5 S
PLN's Corporate Existence ... ...................... 5Organization ....... ............................... 6Management Consulting Effort and
Recovery Plan ...... ........................ 6Government Procedures ..... ....................... 9
IV. THE PROJECT ......... ................................... 10
Description of the Project ..... ................... 10Cost Estimate ..................................... 11Amount of Loan .................................... 12Engineering and Construction .. ..................... 12Procurement and Disbursement . ..................... 13
Ecology ........................................... 14
V. JUSTIFICATION .......................................... 14
Power Market in West Java ....................... 14Economic Justification ...... ...................... 16
This report was prepared by Messrs. H. Maeda and K. Stichenwirth and isbased on information obtained with the cooperation of Mr. E. B. Arnoldduring the mission to Indonesia in November/December 1974.

- 2 -
VI. FINANCIAL ASPECTS ....... ............................... 16
PLN's Financial Situation .................... ..... 16Subsidiary Loan ................................... 19Debt Service Limitation ..... ...................... 19Tariffs ........................................... 20Audit ... 20Accounting, Billing and Collection ............. ... 21Insurance ......................................... 21
VII. AGREEMENTS REACHED AND RECOMMENDATION .................. 22
ANNEXES
1. PLN's Organization Chart2. Installed Generating Capacity as of March 31, 19743. Peak Demand, Generation and Sales 19734. Energy Sales by Consumer Categories5. Actual and Forecast Generation (incl. Purchases) and Sales 1967-1978/796. Project Cost Estimate7. Economic Justification8. Construction Cost of Muara Karang Project (Units 1 and 2)-Analysis
of Cost Overruns9. Schedule of Disbursements10. Tariffs11. Personnel12. Investment Program of the Second Five-Year Development Plan
1974/75-1978/79(a) Planned(b) Modified
13. Actual and Forecast Income Statements 1971-1978/7914. Actual and Forecast Sources and Applications of Funds Statements
1971-1978/7915. Actual and Forecast Balance Sheets 1971-1978/7916. Status of Activities on Management Improvement
MAPS
IBRD-3912 RlIBRD-10304 R

INDONESIA
PERUSAHAAN UMUM LISTRIK NEGARA
APPRAISAL OF THE
FOURTH POWER PROJECT
SUMMARY AND CONCLUSIONS
(i) This report covers the appraisal of the Fourth Power Project con-sisting of the third 100 MW oil-fired generating unit of the Muara Karang
thermal power development, consulting services for the design of the fourthunit (200 MW) of the same station as well as for site investigation of afuture development, and advisory services and training. Total cost is
estimated at US$69.5 million equivalent, of which US$50.4 million is in theforeign exchange component. A Bank Loan of US$41 million equivalent isproposed representing the Project's foreign exchange cost excluding equip-ment for the training centers and interest on the Bank Loan during con-struction. Bank financing would cover 59% of the project cost.
(ii) The Project is the extension of the Muara Karang development,located on the bank of the Java sea in Jakarta, for which IDA had providedfinancing of the foreign exchange component of Units 1 and 2 through Credit399-IND (US$46 million equivalent). Since the appraisal of Credit 399 inlate-1972 dramatic cost increases have occurred. Based on results of bidsfor major equipment and a required design change of common facilities (inparticular the intake structure for cooling water), the total estimatedcost increased from $52 million to $106 million or by about US$54 millionout of which US$30 million are foreign exchange. It was decided that theBank Group would not finance any part of the cost overrun and the Governmentand PLN would have to raise the funds. Consequently, IDA financing ofUnits 1 and 2 represents 42% of the total cost. For all three units togetherBank Group financing amounts to 49%.
(iii) The potential growth of the power market is very high; it has been
estimated that PLN would have to increase sales by about 30% per year in theWest Java-area to catch up with the demand it is supposed to satisfy, whichpresently has to be covered through captive plant or is suppressed. Due tofinancial as well as physical constraints present assumptions are that PLN
is likely to be able to satisfy at most sales increases from about 14%(1974/75) to 30% (1983/84) in West Java (location of the Project) and 14% to25% in other areas.
(iv) The Muara Karang scileme is an essential element in the provisionof urgently required base load capacity in West Java. Despite the above-mentioned cost increases, the internal economic return of the first three100 MW units including investments required to market the station's output

- ii -
is about 17%. For the Project alone the respective return is 19%, reflectingthat investments for common facilities are included in Units 1 and 2. Further-more, the Project represents the least-cost solution for discount rates up to23%.
(v) Procurement of the goods and services financed from proceeds ofthe proposed Loan will be carried out on the basis of international com-petitive bidding under Bank Guidelines. Local preference in bid evaluationwill apply to purchases of equipment and material. It is expected that usecan be made of the options quoted for major equipment in the bidding forUnits 1 and 2.
(vi) The Financial Recovery Plan as included in the Credit 399-INDdocuments is underway and PLN is expected to achieve the financial targetsstipulated therein. Positive results have been achieved in most of themanagement improvement activities, particularly in the fields of training,operation and finance. Unfortunately the efforts to improve constructionmanagement activities are lagging behind. They will be the subject ofcontinued close supervision in future. Special training and managementconsulting efforts included in the proposed Loan are expected to furtherenhance PLN's development.
(vii) The engineering consultants' investigations indicate that noecological problems are foreseen. Design standards match the ones of theUS Environmental Protection Agency (EPA) since Indonesia has not yetestablished its own standards for environmental quality.
(viii) The proposed Loan would not only assist in financing badly neededexpansion of generating capacity, it would also provide the vehicle forcontinued Bank Group involvement in the process of institution building inPLN which started successfully with the previous Credits. Therefore,with agreements reached during negotiations, a loan of US$41 million witha 25 year term (including 5 years of grace) is recommended.
INDONESIA
PERUSAHAAN UMUM LISTRIK NEGARA
APPRAISAL OF THE
FOURTH POWER PROJECT
I. INTRODUCTION
1.01 The Government of Indonesia has requested financial assistance fora Project consisting of the third 100 MW unit for the oil-fired Muara Karangstation (Jakarta) including engineering consulting services for Unit 4, siteinvestigation of a future development, and advisory services and training.Consequently, a loan of US$41 million equivalent for a term of 25 years inclu-ding 5 years of grace covering the expected foreign exchange cost of theProject, exclusive of equipment for the training centers and interest on theBank Loan during construction, is proposed. The Loan would be granted tothe Government of Indonesia which will loan the funds to Perusahaan UmumListrik Negara (PLN), the Beneficiary, at terms equivalent to the Bank Loan.
1.02 The Loan would be the fourth Bank Group operation in the powersector with PLN as the beneficiary in all cases. The first two credits (165and 334-IND) were made to help finance the rehabilitation and expansion ofthe Jakarta electricity distribution system, whereas Credit 399-IND contri-buted to the construction of Units 1 and 2 of the Muara Karang development.
1.03 All three credits provide for a comprehensive managementand accounting consulting effort aimed at making PLN a sound public utility.Credits 165 and 334 provided the funds required for financing the consultantsand initiated the basic activities such as drafting laws and accountingsystems, and making a tariff study. With the successful completion of thesetasks, Credit 399-IND introduced an organized system of activities aimed atleading PLN to financial recovery in fiscal year 1978/79. The proposed Loancontinues the institution building effort through financing the foreign costof management advisers, training specialists and overseas fellowships.
1.04 This report was prepared by Messrs. H. Maeda and K. Stichenwirthand is based on information obtained with the cooperation of Mr. E. B. Arnoldduring the mission to Indonesia in November/December 1974.
II. THE POWER SECTOR
Economic Background
2.01 Indonesia has a total land area of approximately 1.9 million km2.But because the archipelago extends over a sea surface about 5 times larger,

- 2 -
distances are much longer than the country's size suggests-about 5,000 kmeast-west and 2,000 km north-south. Latest estimates place the populationat 130 million, growing at an annual rate of about 2.5%. The populationis distributed unevenly; almost two-thirds live on the island of Java whichrepresents only 7% of the total land area. The population density on Javais about 600 inhabitants per km2, one of the highest in the world.
2.02 The Second Five-Year Development Plan 1974/75-1978/79 (Repelita II)aimed originally at annual economic growth targets in real terms of 7.5%,with 13% for industry and 9% for mining and construction. With the increasein oil revenues and Indonesia's debt service capacity, the rate of invest-ment and consequent rate of growth are both likely to be reversed upwardduring the 5 year Plan period. With an estimated annual per capita GDPof US$125 in 1973, Indonesia ranks among the very poor countries in the world.Lasting improvements to the economy will require substantial and widespreadinvestment in agriculture and also in the industrial, mining and constructionsectors for which a well functioning power system will be crucial. Thepresent installed capacity of the public sector is only about 7 watts perinhabitant, and per capita annual consumption amounts to only 17 kwh (1973).These are among the lowest in the world.
Sector Organization
2.03 With certain exceptions (para. 2.04), the public power sector issynonymous with PLN, a Government-owned enterprise, responsible for genera-tion, transmission and distribution throughout the country. It was createdin 1961 through the merger of three nationalized utilities which in turn hadsucceeded Dutch owned private electricity corporations.
2.04 Although PLN has the exclusive right for generating, transmittingand distributing electric power, companies or individuals are allowed tobuild and operate generating stations for their own purposes if PLN isunable to provide service. In special cases, these auto-producers areallowed to distribute electricity to consumers in the surrounding areas.Generating stations below 50,000 kVA can be licensed by PLN but largerstations require approval by the Minister of Public Works and Power. Heacts upon PLN's recommendation.
2.05 Inadequate and unreliable public power supply has resulted incaptive plant installations representing an estimated 40% to 60% of the totalinstalled capacity (public plus captive). These installations representuneconomic investments, but despite PLN's very large investment program(para. 2.15), it will take years for this situation to normalize.
Existing Public Power Facilities
2.06 PLN's total installed capacity amounted to 792 MW by end-1973(exclusive of the 125 MW Juanda hydro station operated by the JatiluhurAuthority from which PLN purchases the output). Including Juanda, it con-sisted of 43% hydro, 25% steam and 32% diesel and gas turbine capacity.
-3-
The installations are scattered throughout the country, some in small unitsand stations. The system's largest plant is the 150 MW Tanjung Priok ins-tallation in Jakarta. Details are given in Annex 2.
2.07 With the exception of a 150 kV link between Jakarta and Bandung,even major load centers are not interconnected, resulting in high productioncosts and poor reliability. PLN's transmission facilities include about3,000 km of lines ranging from 25 kV to 150 kV, and an aggregate transformercapacity of about 1,350 MVA.
Sector Planning
2.08 Past sector planning was partly determined by the foreign assistanceavailable and the domestic need to exchange capacity and gave insufficientemphasis to system standardization or the need for future interconnection.PLN's sector planning still needs strengthening. Apparently as a consequenceof the 1972 drought with subsequent blackouts due to lack of reserve capacity,PLN's development plan as incorporated in Repelita II (Annex 12 (a)) emphasizesgeneration investment but does not provide sufficient transmission anddistribution facilities to market the energy.
2.09 In order to create a sound basis for sector development on theimportant island of Java, Credit 399-IND includes funds for a system devel-opment study for the entire island. Consultants (Preece, Cardew and Rider)have been selected and the study started in November 1974. It is scheduledfor completion in July 1976. The objective is a system development planwhich will provide the guidelines for future power development and establishan appropriately balanced sector investment program.
The Power Market
2.10 As indicated in Annex 5, power consumption showed an increasinggrowth trend between 1967 and 1973, interrupted only in 1972, a severedrought year with generation cutbacks and blackouts. The first quarterof 1974 again indicates a slowdown, but this is because demand is approachingthe system's supply capability. New connections are severely repressed andthis situation is expected to continue until 1975/76 when new facilitieswill have been commissioned.
2.11 Development of power sales in the public power sector varied amongthe supply regions, with larger increases in West Java than in other areas;West Java, where the proposed Project is located, accounts for about 50%of the total market. Past results are summarized below:

-4-
TOTAL INDONESIA WEST JAVA
Generation 1/ Sales Annual Generation 1/ Sales Annual(GWh) (GWh) Sales Increase (Gwh) (GWh) Sales Increase
1967 1,607 1,158 - 789 529 -
1968 1,766 1,204 4% 846 537 2%
1969 1,872 1,454 21% 895 695 29%1970 2,084 1,589 9% 1,014 773 11%
1971 2,354 1,786 12% 1,175 898 16%1972 2,498 1,893 6% 1,268 960 7%
1973 2,932 2,175 15% 1,548 1,144 19%
1/ Including energy purchases.
2.12 By the end of the first quarter of 1974 PLN's customers totalled
about 1,031,000, of which about 90% were residential. The breakdown ofsales by consumer classes is shown in Annex 4. The strikingly low proportionof industrial sales underscores the extent of captive plant.
Development Plan
2.13 Future sales development will largely depend on PLN's capabilityto satisfy demand. Should it wish to meet by 1982 all the demand expectedby a recent West Java market study, installations to handle annual supplyincreases of about 30% would have to be commissioned during the next 7years. While this level of demand increase is entirely plausible, PLN isincapable of providing the necessary facilities due to physical as well asprobable financial constraints. The maximum satisfiable market developmentis judged to be about (Annex 5):
(i) West Java 14% annual increase in 1975/76 risinggradually to 30% in 1983/84; and
(ii) Other Areas : 14% annual increase in 1975/76 risinggradually to 25% in 1983/84.
These assumptions result in sales increases averaging about 14% (7% in1974/75) during Repelita II (1974/75 - 1978/79).
2.14 To permit the above sales increases, the following investments
will have to be made during the next several years (Annex 12 (b)):

-5 -
Total Cost of Investment Expendituresthe Program Before During Repelita II After
Repelita II (1974/75-1978/79) Repelita II
(1969/70-1973/74)3
(US$ million equivalent)
Foreign Cost 1,907 59 983 865
Local Cost 963 36 557 370
Total 2,870 95 1,540 1,235
This program would add about 3,000 MW to the existing 800 MW generation capa-city plus transmission and distribution. Although smaller than theinvestment planned by PLN (para. 2.15), it is very heavy and even if the moneybecomes available, it may be beyond PLN's capability to execute.
2.15 For the purpose of comparison, following is a summary of PLN'sinvestments as included in Repelita II (Annex 12(a)):
Total Cost of Investment Expendituresthe Program Before During Repelita II After
Repelita II (1974/75-1978/79) Repelita II(1969/70-1973/74) __
(US$ million equivalent)
Foreign Cost 2,268 59 1,387 822Local Cost 1,131 36 738 357
Total 3,399 95 2,125 1,179
This would add about 4,900 MW generation capacity and transmission/distribu-tion facilities.
III. THE BENEFICIARY
PLN's Corporate Existence
3.01 PLN's corporate existence is based on the 1972 Electricity Actwhich was issued as a Government decree within the framework of variousexisting laws. The charter does not provide the company with completelyindependent authority; important matters such as borrowing power, investmentpolicy, valuation of assets, personnel policy and salary structure and levelsare decided by the Government, represented in most cases by the Minister ofPublic Works and Power. However, such Government control over importantsectors of the economy and over Government enterprises is regarded as neces-sary and, with PLN's progressing impro-ement, the Government role in many

- 6 -
aspects of management i;as diminished. The covenant requiring Bank Groupconcurrence in material changes in governing laws affecting PLN has beenrepeated in the documents of the proposed Loan.
3.02 In matters of major importance the Minister is assisted by anAdvisory Board consisting of the Ministers of Finance, Industry, and NationalDevelopment Planning (Chairman of BAPPENAS, the Government planning agency).The Advisory Board provides a useful forum for officials concerned witheconomic matters to meet on problems of power sector development.
Organization
3.03 PLN's management (Board of Directors) is defined as the "represent-ative of the Minister, to carry out all basic management functions of theenterprise." It consists of a President Director and at least two otherDirectors. In addition to the President Director, there are presently four,responsible for planning, construction, operation,. and administration(including accounting and finances). The members of the Board are appointedand dismissed by the President of Indonesia upon recommendation by theMinister. They normally serve for a five-year term, but may be re-appointed.The President Director is responsible to the Minister and the Directors reportin their respective fields to the President Director. Decisions are commonlymade by consensus of the whole Board, a common feature in Indonesia.
3.04 PLN's regional organization (Annex 1) comprises 8 constructionregions (Construksi), 3 generation regions (Generasi), 4 distribution regions(Distribusi) and 11 operation tegions (Exploitasi); the latter cover areaswhere activities are too small to justify subdivision. The organizationalstructure is oriented towards practical needs.
3.05 As of March 1974 PLN had a total staff of 21,160 (Annex 11), ofwhich 5,211 were temporary. Although the number of employees is high bynormal standards, reductions are unlikely because of the size of the supplyarea and the Government's employment-oriented policies. Despite the largenumber employed PLN suffers from a severe shortage of qualified staff; forinstance, its personnel upgrading program would require more civil andelectro-mechanical engineers annually than are presently graduating from alltechnical universities in Indonesia. The scholarship program included inthe Projec; is designed to alleviate this pressing problem by upgradingthe professional skill of graduated engineers (para. 3.11).
Management Consulting Effort and Recovery Plan
3.06 PLN was in a clearly chaotic state at the time of the Bank Group'sfirst involvement in the power sector (1969). The division of responsibilitybetween the Government and PLI was not defined, PLN's legal basis was un-satisfactory, records were unavailable and the financial situation, althoughconfused was clearly bad. To help remedy the situation, the Bank Grouphelped finance through Credits 165 and 334-IND a comprehensive managementconsulting effort, for which the French firm of SOFRELEC was selected.SOFRELEC was assisted in accounting matters by Peat, Marwick and Mitchell.

3.07 It took time before SOFRELEC could formulate recommendations withrespect to PLN's problems. Records had to be reconstructed and assetsphysically identified; large outstanding consumer accounts had to beverified and means found for their settlement; tariff levels and structurehad to be studied. The initial phase of the consultant's work took abouttwo years and consisted to a considerable degree of essential fact finding.The main accomplishments during the period included:
(i) draft of the Electricity Act (promulgated in 1972 after exten-sive discussions with representatives of the Bank Group);
(ii) recommendations on a new structure and level of tariffs(introduced with a general increase of 40% in June 1973);
(iii) draft of a functional organization (introduced with somemodifications in March 1973);
(iv) preparation of an accounting system and recommendations oncash management and control, inventory control, consumeradministration, mechanization and budgeting (in the processof implementation throughout the enterprise);
(v) revaluation of assets (introduced as of December 31,1971; and
(vi) recommendations on personnel regulations and administration,job analysis, salary'structure and training (some of therecommendations have been implemented, others are underdiscussion. A number of the recommendations meet withGovernment resistance since although suitable fora commercially oriented entity like PLN they often conflictwith regulations applicable to Government agencies).
3.08 At the time of appraisal for Credit 399-IND in late 1972 PLN'sproblems were better identified than previously and recommendations fortheir solution were in hand. SOFRELEC's investigations had revealed thatPLN's financial situation was worse than anticipated with high operatinglosses and very low internal cash generation. Consequently a "recoveryplan" designed to improve PLN's management capabilities and to overcome itsfinancial weaknesses over time was made a part of the project and incor-porated in the 399-IND documents. Its main features include:
(i) a detailed plan of activities designed to improve PLN'soperations and, as a consequence, its financial position;
(ii) annual programs of the activities to be taken towardsimprovement. These programs are discussed with andclosely supervised by Bank staff; and

-8-
(iii) improvement of PLN's finances to the point where alloperating expenses would be covered by revenues byFY 1978/79. PLN agreed to make all efforts to meetinterim targets of 80% revenue/cost coverage in FY 1974/75and 90% in FY 1976/77.
3.09 On July 16, 1974 the Association's Board received at its requesta status report on the recovery plan (Memorandum on the Progress under theRecovery Plan - IDA/SecM 74-230). Annex 16 describes the present situationand Annex 13 summarizes the prospects of meeting the financial targets.In summary:
(i) activities to strengthen system planning are underway.However, progress is slow as it is with personnel trainingin general because of a severe shortage of adequately qualifiedpersonnel to be trained. Problems also arise from Governmentregulations concerning salary levels and structures, andpromotions, which make incentive oriented plans difficult toimplement;
(ii) good progress has been made in improving accounting andfinancial control. Only occasional assistance by theconsultants is now required;
(iii) efforts to improve the management of construction activitieshave shown fewer results than the other activities. This isparticularly disappointing since improved project implement-ation capability is essential for PLN's full recovery. Whilenot entirely PLN's fault, as complex and cumbersome Governmentregulations seriously delay project implementation, there is stillmuch that could be done within PLN itself to overcome these prob-lems. They will be the subject of continued supervision;
(iv) good results have been achieved in operations (maintenanceprocedures and steam plant operation). Further progress incost economizing requires accelerated system improvements, andthis is directly linked to progress of the constructiongroup; and
(v) preliminary results indicate that the first 80% revenue/costtarget in EY1974/75 was reached and expectations are that fullfinancial recovery will be attained by FY1978/79 as scheduled.
3.10 The efforts made to date to turn PLN into a sound public utilityhave yielded positive resultj despite temporary setbacks. On balance theyhave been successful. Future activities will continue to concentrate onmanagement improvement largely through day to day assistance by the con-sultants, and on personnel training. Among other points, PLN will inaccordance with the recovery plan concentrate during the next year on (fordetails see Annex 16):
-9-
(i) training of about 500 employees in PLN-owned trainingcenters, and on-the-job;
(ii) introducing a comprehensive insurance system; and
(iii) improving the construction department (in particularprocurement and contract management, and streamliningof budget procedures) and strengthening the organizationin the regional construction offices (Construksi).
3.11 To help strengthen PLN's organization and to overcome at least toa certain degree the shortage of trained personnel, funds for financing theforeign exchange cost of the following management consulting and trainingelements in addition to those contained in the financial recovery plan havebeen included in the proposed Loan:
(i) employment of three training specialists for about twoyears with the aim of training local tutors particularlyfor the planned training centers in Medan, Ujung Pandangand Semarang;
(ii) employment of six management advisers in the fields ofgeneration, transmission, distribution, construction,planning, and administration and accounting. Theirassignment would be for about two years. After initiallyworking together with SOFRELEC, they would gradually takeover the responsibility of supervising the implementationof SOFRELEC's management plans through day-to-day assistance;and
(iii) overseas fellowships for special training of about 26 middlemanagement executives.
It has been agreed during negotiations that qualification, experience andterms and conditions of employment of the above-mentioned specialists shouldbe satisfactory to the Bank.
Government Procedures
3.12 Factors which severely hinder efficient project implementationinclude:
(i) customs clearance at Tanjung Priok harbor in about 50%of the cases investigated averaged about 70 days, in twocases about 250 days;
(ii) budget control procedures (see below); and
(iii) procedures for establishing letters of credit and issuingimport licenses which take up to 6 months.

- 10 -
Until mid-1974, budgeted local expenditure funds were disbursed to PLN itemby item through regional treasury offices, a most cumbersome process. How-ever, recently the Government agreed to advance budgeted funds quarterly toprovide PLN with more flexibility than before in fund management. This isa step in the right direction and this mechanism should be refined so as toincrease further PLN's financial flexibility.
3.13 The problems associated with the customs clearance procedureswere discussed during negotiations. An understanding was reached that inthe course of the next year the Ministry of Public Works and Power will developspecific recommendations for improvement which will be discussed with theBank and that an effort will be made to institute the recommended improve-ments. This improvement effort will in the end benefit all sectors of theeconomy.
IV. THE PROJECT
Description of the Project
4.01 The proposed Project consists of:
(a) construction of a third unit (100 MW) at the Muara Karangthermal power plant including engineering design for afourth unit (para 4.02);
A
(b) physical investigations of the site of a new thermal powerplant in West Java (para 4.03); and
(c) advisory services and training, including fellowships(para 3.11).
4.02 The project site, located in the northwest outskirts of Jakarta,will provide an ultimate capacity of 700 MW with five units installed. Thefirst two 100 MW units are being financed under Credit 399-IND and arepresently under construction. The severe inflation which has taken placesince project appraisal in late-1972 has doubled the project cost; theforeign comaponent is now expected to be about 70% higher than the originalestimate (Annex 8). However, no supplemental financing by the Bank isproposed. The No. 3 unit will be a non-reheat, oil-fired type, identicalto the first two units. It will supply the Jakarta area by 150 kV transmissionlines included in the first stage of the project (Units 1 and 2). Alsoincluded are engineering services for a detailed design of Unit 4 (200 MW)which should be initiated immediately.
4.03 PLN will need a new site for the next thermal power plant to becommissioned in the early 1980's when the Muara Karang site will have beenfully developed. The most probable sites presently under consideration are

- 11 -
Cilincing, in the eastern suburbs of Jakarta, and Cirebon, about 200 km eastof Jakarta. The consultants for the on-going Java System Development Studyfinanced under Credit 399-IND will determine the site priority and optimumdevelopment scheme for the station from the viewpoint of overall systemplanning. The proposed study would concentrate on physical investigationsof the first priority site such as geology, oceanography, environment andtransportation requirement and would include a preliminary design and costestimate of the plant.
Cost Estimate
4.04 The detailed cost estimate of the Project is given in Annex 6and summarized below:
Billions of Rupiahs Millions of US DollarsLocal Foreign Total Local Foreign Total
Muara Karang Unit 3
Site Development 1.46 - 1.46 3.52 - 3.52General Construction 1.74 3.62 5.36 4.19 8.72 12.91Equipment and Materials 0.05 7.76 7.81 0.11 18.71 18.82Engineering 0.13 1.48 1.61 0.31 3.57 3.88
Base Cost Estimate 3.38 12.86 16.24 8.13 31.00 39.13
Contingencies:Physical 0.32 0.83 1.15 0.77 2.00 2.77Price 1.44 2.24 3.68 3.48 5.40 8.88
Sub-total 5.14 15.93 21.07 12.38 38.40 50.78
Study 0.12 0.29 0.41 0.30 0.70 1.00
Advisory Services andTraining 2.68 1.35 4.03 6.45 3.25 9.70
Total 7.94 17.57 25.51 19.13 42.35 61.48
Interest cfuringConstruction on BankLoan - 3.32 3.32 - 8.00 8.00
Grand Total 7.94 20.89 28.83 19.13 50.35 69.48_ . = _
4.05 The cost estimate for the Muara Karang project was prepared byBlack & Veatch International (BVI) of U.S.A., the consultant retained for thefirst stage. The cost of the major equipment is based on bid prices forUnits 1 and 2 which included an option for Unit 3. Other costs of supplyand construction including the local component are based on recent experiencesof a similar project at Semarang, Central Java, and the local bidding on

- 12 -
civil works for the Muara Karang Units 1 and 2. They represent early-1975prices. About two-thirds of the engineering cost are for detailed designof Unit 4 which will be 200 MW. Since the project design is in an advancedstage, a physical contingency of 5% for equipment and 10% for constructionshould prove adequate. Price contingencies averaging about 8% for majorequipment supply are based on escalation provisions included in the proposals.Tnis is low because some suppliers offered firm prices for certain items.For other items annual inflation rates of 12% in 1975, 10% in 1976 and 8%thereafter for equipment and 16% in 1975, 14% in 1976 and 12% in later yearsfor civil works have been applied. The overall price contingency amounts to21% of the project cost including the physical contingency.
4.06 The estimated total cost of Unit 3 amounts to US$47.8 millionequivalent after deducting the engineering cost for Unit 4 and interest onBank loan during construction. This represents a unit cost of US$478/kWinstalled. Adding to this the revised cost of Units 1 and 2 (Annex 8) thetotal cost for 3 x 100 MW is now estimated at US$153.8 million. This includesthe cost of transmission and other common facilities required for the finalcapacity of 700 MW. If adjustments are made for the cost of common facilities,the average cost for the three 100 MW units is US$397/kW and US$442/kW in-stalled, , before and after price escalation. This is of the correct orderof magnitude for 100 MW and similar sized oil-fired units at early 1975 prices.
4.07 The cost estimates for the study, advisory services and traininghave been prepared by PLN based on man-months required for such activitiesand recent experiences of building similar training centers.
Amount of Loan
4.08 The Project's foreign exchange component of US$50.4 million equiv-alent represents 72% of the total cost of US$69.5 million equivalent includinginterest during construction on the Bank loan. This percentage is highbecause major civil works are included in the first stage project partiallyfinanced by Credit 399 IND. The proposed Loan would cover the foreign ex-change cost of the Project, except for the supply of the equipment for thetraining centers which is not suitable for international competitive biddingand the interest on the Bank Loan during construction; these items would befinanced by PLN and the Government. The total amount of the Loan would beUS$41 million, representing 59% of the total capital cost of the Project,including interest during construction on the Bank Loan.
Engineering and Construction
4.09 Credit 399-IND prov des financing for engineering services of Units1 and 2. PLN has retained BVI for this purpose and intends to extend thecontract to cover Units 3 and 4. The service for Unit 3 is for the detaileddesign and construction supervision with an estimated man-month requirementof 255. The service for Unit 4 will cover the detailed design, preparationof bidding documents and bid evaluation with an estimated man-month require-ment of 626; this is high because of a new design required for a larger unit.

- 13 -
This arrangement is satisfactory to the Bank and the proposed Loan includesfinancing of this contract extension.
4.10 Major items of site development such as site fill and buildingan intake canal are being carried out by local contractors under the firststage. The second stage site development including piling, minor mechanicalworks and some preparation works for Unit 4 will also be locally contracted.These works are financed by PLN. However, as with Units 1 and 2, generalconstruction contractor will be employed for structural, mechanical andelectrical construction including erection of major equipment. The contractsinclude sizeable foreign exchange costs which will be financed under theproposed Loan. In the interest of expediting and economizing the constructionwork, it was agreed during negotiations that the general constructioncontract(s) would cover the erection of all three units (paras 4.14-4.15).
4.11 PLN has established a construction team for the Project within itsheadquarters. Unit 3 is scheduled for completion in mid-1979, one year afterthe commissioning of Unit 2.
4.12 The study of the next thermal power site will be carried out byengineering consultants satisfactory to the Bank under a separate contract.The study is expected to take about one year with an estimated man-monthrequirement of 100.
Procurement and Disbursement
4.13 Bids for the supply of major equipment for Units 1 and 2 includedoption offers for Unit 3 valid until November 1975. PLN intends to exercisethe options since prices are reasonable under the present market situationand, more importantly, the construction period would be shortened by at leastsix months; additional advantages can be expected through equipment standard-ization and simplified engineering and construction work.
4.14 Assuming PLN exercises the option for major equipment, remainingitems to be procured are control equipment, structural equipment and thegeneral construction contract. Procurement will follow internationalcompetitive bidding in accordance with the Bank's Guidelines. During nego-tiations PLN agreed to let the general construction contract(s) covering allthree units under international competitive bidding since the Bank financesa portion of the foreign exchange cost of the contract(s). Since somestructural equipment could be supplied by local industries, the Loandocuments include the usual margin of preference for local manufacturers.Some civil works will be financed locally and the general construction con-tract, which will likely be beyond local capability, will largely be a supplyand erection type with some local subcontractor participation. Hence, thereare no grounds for a local preference for civil contractors and none isprovided.
4.15 Disbursement will be made against the full foreign exchange costof equipment, materials and consulting services. Should local manufacturers

- 14 -
win contracts for equipment and materials, disbursement would be made against95% of the ex-factory price, the remaining 5% representing the estimatedaverage of local taxes. For the general construction contract(s) coveringall three units, disbursement will be made against 30% of the total expend-itures up to US$12.4 million. This would represent the full foreign exchangecost for Unit 3 included in the contract(s). No disbursement will be madefor expenditures prior to Loan signing. The estimated schedule of disburse-ments of the proposed Loan is shown in Annex 9. Any surplus funds remainingafter completion of the Project will be cancelled, unless there are goodreasons for applying savings to related works.
Ecology
4.16 No major ecological problems are expected. The consultants havecarried out surveys on meteorological and oceanographic conditions, andthe flora and fauna in the vicinity of the project area. Since Indonesiahas not yet ruled on matters of environmental quality, the US EnvironmentalProtection Agency (EPA) standards have been used as design criteria. Thecalculated maximum particulate concentration at ground level due to powerplant exhaust gases is well below the EPA standards and a mechanical preci-pitator will be sufficient to remove solid particles in the gas. Space isprovided for future installation of electrostatic precipitators, should itbecome necessary. A 75 meter stack will keep the sulphur dioxide pollutionbelow EPA ambient air standards even for the high-sulphur mid-eastern oilwhich PLN might use instead of more valuable low-sulphur indigenous oil.Cooling water from the plant will be discharged directly into the Java Seawhich forms a very shallow Area with a mudsilt for about one kilometer fromthe shoreline. The thermal plume of the discharged water is expected todissipate before it reaches the area where any consumable fish or shellfishof significant value exist.
V. JUSTIFICATION
Power Market in West Java
5.01 During the First Five-Year Plan period (1969-1973) electricitysales in West Java increased at an average rate of 16.3% per year. Thisgrowth rate, although high,does not reflect the economy's real needs forpower. It would have been much higher if PLN had been able to satisfy allthe potential demand. PLN severely restricts consumer connections in orderto keep the maximum demand within its capability. This has given rise to asubstantial installation of expensive self-generating plant by industries,commercial buildings, hotels and even by domestic consumers. Although exactfigures for these captive plants are not known, the total installed capacityis estimated to equal the supply capability of PLN. A 100 MW addition tosystem capability in 1972 was loaded in less than two years and at the endof 1974 maximum system demand was 300 MW against a total capability of325 MW, leaving little operating reserve.

- 15 -
5.02 As of November, 1974 PLN had applications for new connection inWest Java of 330 1VA for 1975 and 210 MIVA for 1976. This alone wouldrequire tripling of generating capacity in two years. It is apparent thatduring the next few years demand growth will depend entirely on PLN'scapability to supply. According to a study done by consultants (Chas. T.Main) PLN would have to increase its supply capability at an annual rateof 32% in Central and West Java, to fully satisfy suppressed demand by 1982.Based on this, PLN will try to fill the supply/demand gap as much as possibleby installing gas turbines until the first base-load Muara Karang unit iscommissioned in late 1977. PLN has already secured financing for 13 gasturbines with a total capacity of 284 MW; three have been commissioned.It is seeking financing for an additional 200 MW. However, consideringPLN's weakness in construction management and its inadequate distributionsystems, a more realistic assumption of satisfiable demand increase wouldbe 14-20%"o per year up to 1980 and 25-30% thereafter. The market forecastfor 1979 when Unit 3 will be commissioned would therefore be as follows:
Fiscal Year 1974 1979 Rate of Growth% p.a.
West Java
Energy Pequirement (GWh) 1,693 3,708 17.0Peak Demand (MW) 322 705 17.0
Central Java
Energy Requirement (GWh) 342 699 15.4Peak Demand (MW) 65 133 15.4
/1Combined-
Energy Requirement (GWh) - 4,407 -Peak Demand (MW) - 838 -
/1 The first interconnection between Central and West Java is expectedto be completed by December, 1978.
5.03 -The investment program based on this forecast (Annnex 12 (b)) showsthat generation capacity of the combined system at the end of 1978 will con-sist of 38% steam, 37% gas turbine and 25% hydro power. Heavy dependenceon gas turbines which consume about 50% more fuel than steam power toproduce the same amount of electric energy indicates the urgent need forbaseload steam power. Hydro alternatives presently under investigation willin the future replace gas turbines, which will then be transferred to othersmall, isolated systems.

- 16 -
Economic Justification
5.04 Although the proposed Project is the only realistic solution to
provide badly needed base-load capacity in 1979, a comparison was nevertheless
made of the Project with gas turbines as a possible alternative. The Muara
Karang project is more economic than gas turbines for discount rates up to
23%.
5.05 The economic value of alleviating acute power shortage by
investing in the proposed Project cannot be fully quantified and is thusnot expressed in any estimate of return on investment. Consumers are willing
to pay more for the power supplies. This is evidenced by the large amount
of expensive self-generation and by the number of applications for new
connection (paras 5.01-5.02). A minimum estimate of the economic return on
investment was calculated by comparing the costs attributable to the Project
(net of duties and taxes) -- including the cost of transmission/distributionassociated with the marketing of the project output -- to the additionalrevenues derived from it at tariffs expected to be in effect at the time of
project commissioning. In doing this the fuel cost was adjusted to reflectworld market prices which are about 65% higher than the controlled price in
Indonesia. On this basis the return of the Muara Karang project is 19% forUnit 3 and 17% for all three units (Annex 7). The return for Unit 3 ishigher than for three units combined because certain common facilities have
been included in Units 1 and 2.
VI. FINANCIAL ASPECTS
PLN' Financial Situation
6.01 Since 1971 when the first annual accounts based on SOFRELEC's
comprehensive inventory and revaluation program were available, gradualimprovement has been made in line with the objectives of the recovery program(paras. 3.06 - 3.10).
- 17 -
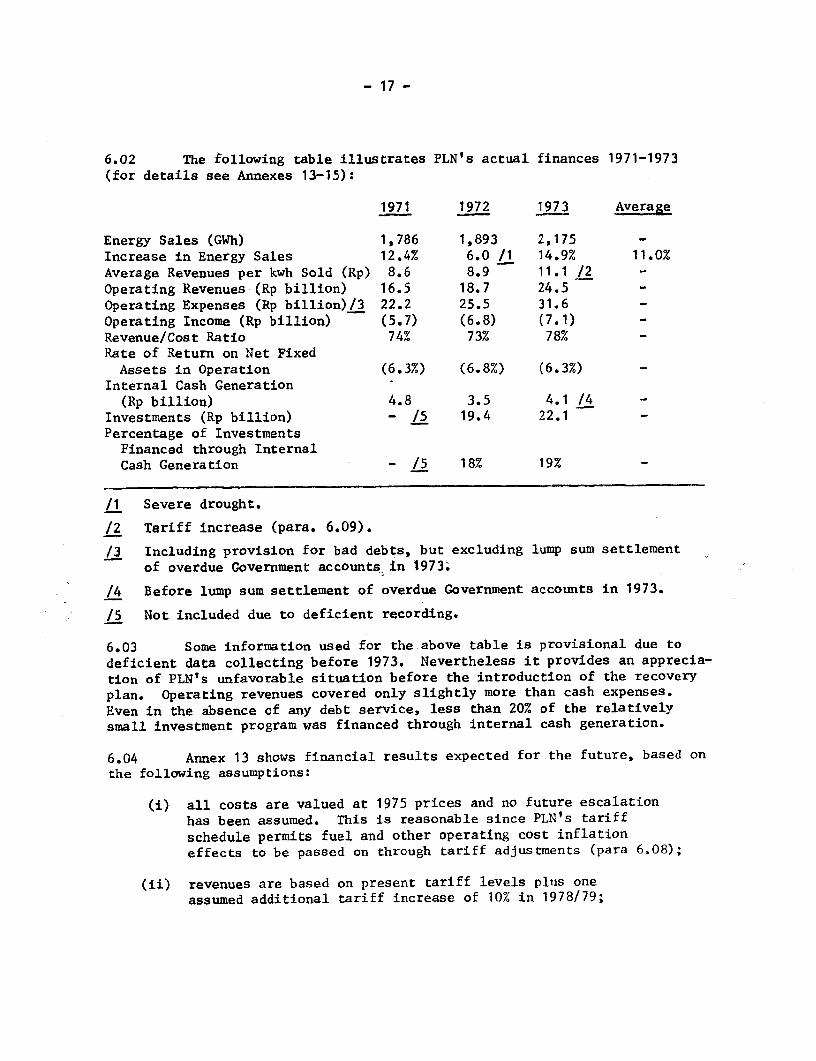
6.02 The following table illustrates PLN's actual finances 1971-1973
(for details see Annexes 13-15):
1971 1972 1973 Average
Energy Sales (GWh) 1,786 1,893 2,175 _
Increase in Energy Sales 12.4% 6.0 /1 14.9% 11.0%
Average Revenues per kwh Sold (Rp) 8.6 8.9 11.1 /2 -Operating Revenues (Rp billion) 16.5 18.7 24.5 -
Operating Expenses (Rp billion)/3 22.2 25.5 31.6 _
Operating Income (Rp billion) (5.7) (6.8) (7.1) _Revenue/Cost Ratio 74% 73% 78% -
Rate of Return on Net FixedAssets in Operation (6.3%) (6.8%) (6.3%) _
Internal Cash Generation(Rp billion) 4.8 3.5 4.1 /4 -
Investments (Rp billion) - /5 19.4 22.1
Percentage of InvestmentsFinanced through InternalCash Generation - /5 18% 19%
/1 Severe drought.
/2 Tariff increase (para. 6.09).
/3 Including provision for bad debts, but excluding lump sum settlement
of overdue Government accounts in 1973.-
/4 Before lump sum settlement of overdue Government accounts in 1973.
/5 Not included due to deficient recording.
6.03 Some information used for the above table is provisional due to
deficient data collecting before 1973. Nevertheless it provides an apprecia-
tion of PLN's unfavorable situation before the introduction of the recovery
plan. Operating revenues covered only slightly more than cash expenses.
Even in the absence of any debt service, less than 20% of the relatively
small investment program was financed through internal cash generation.
6.04 Annex 13 shows financial results expected for the future, based on
the following assumptions:
(i) all costs are valued at 1975 prices and no future escalation
has been assumed. This is reasonable since PLN's tariff
schedule permits fuel and other operating cost inflation
effects to be passed on through tariff adjustments (para 6.08);
(ii) revenues are based on present tariff levels plus one
assumed additional tariff increase of 10% in 1978/79;

- 18 -
(iii) PLN's progress in improving its finances permits on-lendingof funds provided by the Government rather than equity con-tribution as was required by the documents of Credit 399-IND.Consequently it was assumed that Government financing forinvestments committed after the date of signing of the proposedLoan would be in the form of loans rather than equity. This isthe most pessimistic assumption since it is likely that part ofthe Government funds will in fact be provided as equity. Inno case will PLN be liable to make debt service payments before1978/79 (end of the recovery period). Financing for projectscommitted before signing of the proposed Loan would continueto be provided as equity;
(iv) the modified investment program (para. 2.14) has been usedfor projecting capital costs;
(v) comparatively high personnel and material expenses have beenprojected. These are due to planned personnel upgradingprograms involving salary increases and termination payments,and a heavy equipment replacement program; and
(vi) fuel expenses include the price adjustments effectiveApril 2, 1975 (Annex 13).
A summary of the projected financial results during the recovery period ispresented below (Annex 13-15):
/11974/75/ 1975/76 1976/77 1977/78 1978/79 Average
Energy Sales (GWh) 2,611 2,972 3,423 3,954 4,699 -Increase in Energy Sales 7.1% 13.8% 15.2% 15.5% 18.8% 14.0%Average Revenues perkwh Sold (Rp) 15.1 20.0 /3 19.9 19.8 21.8 -
Operating Revenues(Rp billion) 39.8 60.3 69.0 79.2 103.3 -
Operating Expenses(Rp billion) 47.2 67.6 /2 76.6 85.2 99.7 -
Operating Income(Rp billion) (7.4) (7.3) (7.6) (6.0) 3.6 -
Revenue/Cost Ratio 84% 89% 90% 93% 104% -Rate of Return on NetFixed Assets inOperation (5.6%) (4.5%) (3.5%) (2.1%) 1.0% -
/1 First semester actual.
/2 Including extraordinary personnel termination payments.
/3 Adjusted to reflect fuel cost increase effective April 2, 1975 (Annex 13).
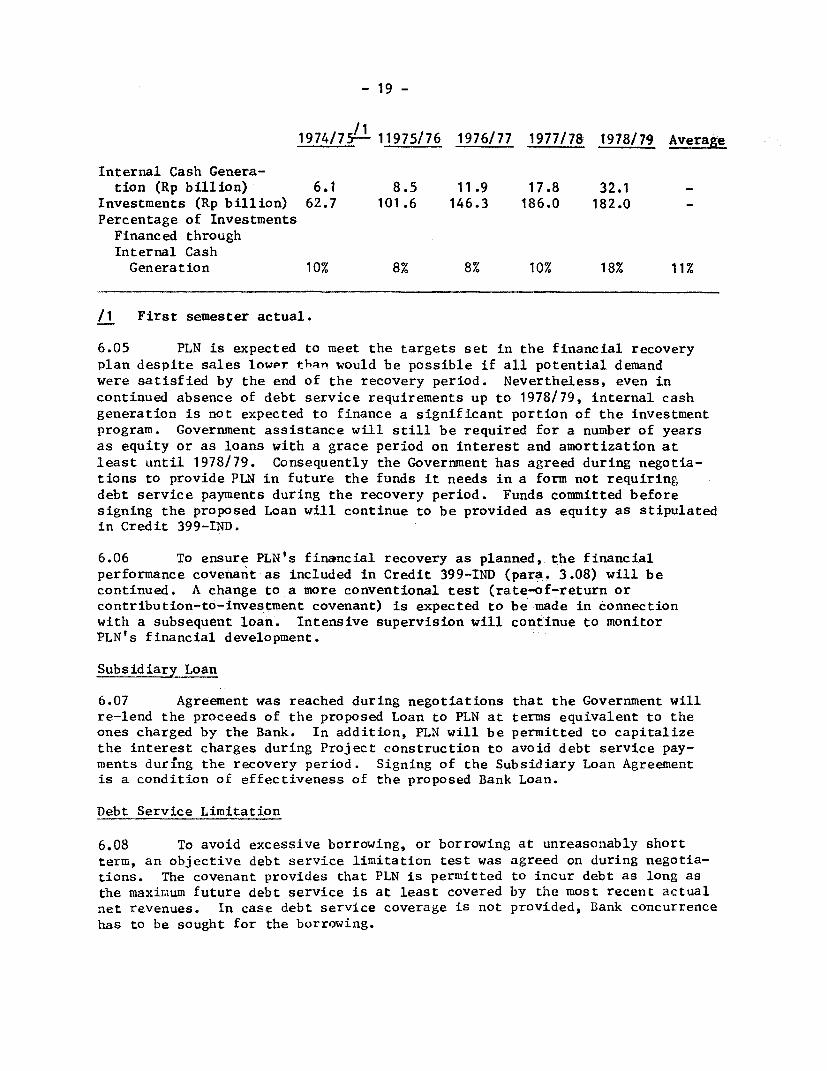
- 19 -
1974/75- 11975/76 1976/77 1977/78 1978/79 Average
Internal Cash Genera-tion (Rp billion) 6.1 8.5 11.9 17.8 32.1 -
Investments (Rp billion) 62.7 101.6 146.3 186.0 182.0 -
Percentage of InvestmentsFinanced throughInternal CashGeneration 10% 8% 8% 10% 18% 11%
/1 First semester actual.
6.05 PLN is expected to meet the targets set in the financial recoveryplan despite sales lower than would be possible if all potential demandwere satisfied by the end of the recovery period. Nevertheless, even incontinued absence of debt service requirements up to 1978/79, internal cashgeneration is not expected to finance a significant portion of the investmentprogram. Government assistance will still be required for a number of yearsas equity or as loans with a grace period on interest and amortization atleast until 1978/79. Consequently the Government has agreed during negotia-tions to provide PLN in future the funds it needs in a form not requiringdebt service payments during the recovery period. Funds committed beforesigning the proposed Loan will continue to be provided as equity as stipulatedin Credit 399-IND.
6.06 To ensure PLN's financial recovery as planned, the financialperformance covenant as included in Credit 399-IND (para. 3.08) will becontinued. A change to a more conventional test (rate-of-return orcontribution-to-investment covenant) is expected to be made in connectionwith a subsequent loan. Intensive supervision will continue to monitorPLN's financial development.
Subsidiary Loan
6.07 Agreement was reached during negotiations that the Government willre-lend the proceeds of the proposed Loan to PLN at terms equivalent to theones charged by the Bank. In addition, PLN will be permitted to capitalizethe interest charges during Project construction to avoid debt service pay-ments during the recovery period. Signing of the Subsidiary Loan Agreementis a condition of effectiveness of the proposed Bank Loan.
Debt Service Limitation
6.08 To avoid excessive borrowing, or borrowing at unreasonably shortterm, an objective debt service limitation test was agreed on during negotia-tions. The covenant provides that PLN is permitted to incur debt as long asthe maximum future debt service is at least covered by the most recent actualnet revenues. In case debt service coverage is not provided, Bank concurrencehas to be sought for the borrowing.

- 20 -
Tariffs
6.09 The tariff structure proposed by SOFRELEC introduced low and mediumvoltage charges to conform with the cost of service and changed the blockstructure from increasing to decreasing unit prices for incremental con-sumption. In addition, peak load tariffs were applied to a larger number ofconsumer classes than before. This was put in force on June 12, 1973 inslightly modified form. Annex 10 shows the new tariff and compares it tothe earlier one.
6.10 PLN's charges to its customers consist of:
(i) the basic tariff as shown in Annex 10;
(ii) transportation cost of fuel from PERTAMINA's terminal to thelocation of consumption; and
(iii) interim price adjustments for increases in the price of fueland other current expenses.
Government approval is required for adjustment of the basic tariff butcharges under (ii) and (iii) can be made after informing the Government.
6.11 Together with the introduction of the new structure, the tarifflevel was increased by 40% with the understanding that additional increaseswould be required for meeting the financial targets. However, the primeemphasis of the recovery plan is cost economizing and the need for tariffincreases will depend on the rate at which PLN is able to improve its opera-tional efficiency. This matter will be a subject of close and continuingreview to ensure that PLN will adjust its tariff level as may be necessary.
Audit
6.12 According to its Act, PLN must be audited by the DirectorateGeneral of State Financial Control. This is a sub-directorate of the Govern-ment's Supreme Audit Council in charge of auditing state enterprises operatedon a commercial basis. A second sub-directorate deals with Government ac-counting audits (for instance ministries and Government departments).
6.13 PLN is audited on a permanent basis with the help of local auditoffices (branches of the audit council) in the provinces and sometimessub-contracted local auditors in headquarters if sufficient audit staff isnot available. In addition to routine control special audits are carriedout irregularly upon request of the Government.
6.14 The state auditor's office has a staff of about 500 accountants.Judging from discussions which included the scope of the reports the Bankwishes to receive, and from a preliminary report, audits are carried outcompetently. Although PLN would not object to additional audit by aprivate firm, it is felt that such audit would not contribute substantiallyto the understanding and efficiency of PLN's operations. A private firm
- 21 -
would be particularly hampered by the long distances involved and lack of
regional offices. Consequently the standard audit covenant has been includedin the documents of the proposed Loan with the understanding that the DirectorateGeneral of State Financial Control is acceptable to the Bank. Audit reportswill be sent to the Bank annually not later than 6 months after the closeof the fiscal year.
Accounting, Billing and Collection
6.15 The consultants have designed a modern accounting system and thishas been introduced throughout PLN's operations. The important areas (Java
and parts of Sumatra) are in the process of mechanization and computeriza-tion with good results so far. The distances and sometimes primitivetransport facilities make it difficult to get records from outlying areas
to headquarters in time to permit timely closing of the books but this is
being overcome by dispatching accountants from headquarters to the regionaloffice to assist in finalizing the accounts and to handcarry the results
back to headquarters.
6.16 At the time of previous appraisals, large arrears in accountsreceivable posed a serious problem. This was particularly true for variousGovernment agencies. Consequently, in the course of negotiations for
Credit 334-IND, the Government agreed to settle its debt and has since doneso. Outstanding amounts from non-government consumers have been kept withinacceptable levels. By the end of FY 1973 accounts receivable representedabout 3-months billing. To ensure that billing and collection continue to
be handled efficiently:
(i) the covenant requiring the Government agencies to payits debts to PLN promptly when due has been repeated; and
(ii) PLN agreed during negotiations to restrict accountsreceivable of customers other than Government agenciesat the end of any month to not more than the amountbilled during the previous 3-months period.
6.17 PLN is generally slow in settling its accounts payable and this
has adversely affected its reputation with suppliers, very likely resultingin higher price quotations than would have otherwise been the case.Consequently the convenant requiring PLN to settle its debt within onemonth after they are due has been repeated. The one-month time allowanceshould be sufficient for settling most disputes.
Insurance
6.18 PLN does not presently insure its property in operation althoughinsurance against hazards of acquisition and transportation and delivery ofgoods is regularly arranged. However, SOFRELEC is preparing an insurance

- 22 -
proposal which is expected to form the general basis for asset insurance.As an interim measure agreement was reached in Credit 399-IND that theGovernment will provide PLN with the funds required to cover normallyinsurable damage minus an amount equivalent to US$100,000. This stipulationhas been repeated in the documents of the prospective Loan.
VII. AGREEMENTS REACHED AND RECOMMENDATION
7.01 During Loan negotiations, agreement was reached on the following:
(a) Bank concurrence will be sought before amendments to legis-lation affecting PLN are introduced (para. 3.01);
(b) consultants acceptable to the Bank will be retained fordesign, procurement and construction supervision of theMuara Karang 3 unit, design for Muara Karang 4, and siteinvestigation work for a new thermal power site (paras.4.09 and 4.12). Appointment of competent training specialistsand management advisers will be on terms and conditionssatisfactory to the Bank (para. 3.11);
(c) local preference will be taken into account in bid evaluationfor equipment (para 4.14);
(d) all future funds provided by the Government to PLN will bemade available in a form not requiring debt service paymentsduring the recovery period. Funds committed before Loansigning will continue to be provided as equity (para. 6.05);
(e) the financial recovery plan as included in the documentsof Credit 399-IND will continue to prevail (para. 6.06);
(f) the Government will re-lend the proceeds of the Loan to PLN.Signing of the Subsidiary Loan Agreement between the Governmentand PLN is a condition of effectiveness of the proposed BankLoan (para. 6.07);
(g) PLN will not incur debt without Bank concurrence unless itsmaximum future debt service is at least covered by historicnet revenues (para. 6.08);
(h) PLN will have its accounts audited annually by independentauditors acceptable to the Bank (para. 6.14);
(i) the Government and its agencies will pay their debts whendue (para. 6.16);
- 23 -
(j) the aggregate amounts outstanding from sales of power tonon-Government customers at the last working day of eachmonth will not exceed the amount of billing issued inrespect of the 3-months period terminating on such day(para. 6.16);
(k) PLN will pay its debts within one month after their respectivedue dates (para 6.17); and
(1) satisfactory insurance arrangements will be made by Governmentand PLN (para. 6.18).
7.02 With the agreements reached on the above, the Project would besuitable for a Bank Loan of US$41 million equivalent, on terms of 25 years,with a 5-year grace period.


_~~~~~~~~~~~~~~~~~~~~~ - - - - - - -L
s~~~~~~~~~~~~~~~~ ~ 5- -a52il3i - - -- -- -- -- - -- - -- i
35A 13=
' T _ r _ _ _ _ _ _ _ _ _ _ | _ =
3,,Q3,q,,5,,gg,,,.~~~~~~~~~~- -T-

Annex 2
INDONESIA
Penisahaan Umuim Listrik Negara (PLN)
Fourth Power Project
Installed Generating Capacity as of March 31, 1974
(kW)
Regions Hydro Steam Diesel Gas Turbine Total
Exploitasi I - - 7,644 - 7,644Exploitasi II 150 - 27,371 14,000 41,521Exploitasi III 70 - 20,097 - 20,167Exploitasi IV 1,320 - 26,694 14.,000 42,014Exploitasi V - - 7,890 - 7,890Exploitasi VI 20,000 - 13,923 - 33,923Exploitasi VII 8,940 - 7,561 - 16,501Exploitasi VIII - 25,000 17,802 - 42,802Exploitasi IX - - 4,165 - 4,165Exploitasi X - - 10,683 - 10,683Exploitasi XI 80 _ 14,498 - 14,578
Generasi I 109g,652 50,000 20,130 - 179,782Generasi II 42,300 - 36,642 14,000 92,942Generasi III 91,000 11150,000 14,564 20,000 275,564
Distribution I 572 - 895 - 1,467Distribution II - - 312 - 312
Total 274,o84 225,000 230,871 62,000 791,955
1/ Excluding the 125,000 kW Juanda hydro station owned and operated by theJatiluhur Authority.
INDONESIA
Perusahaan Umum Listrik Negara (PLN)
Fourth Power Project
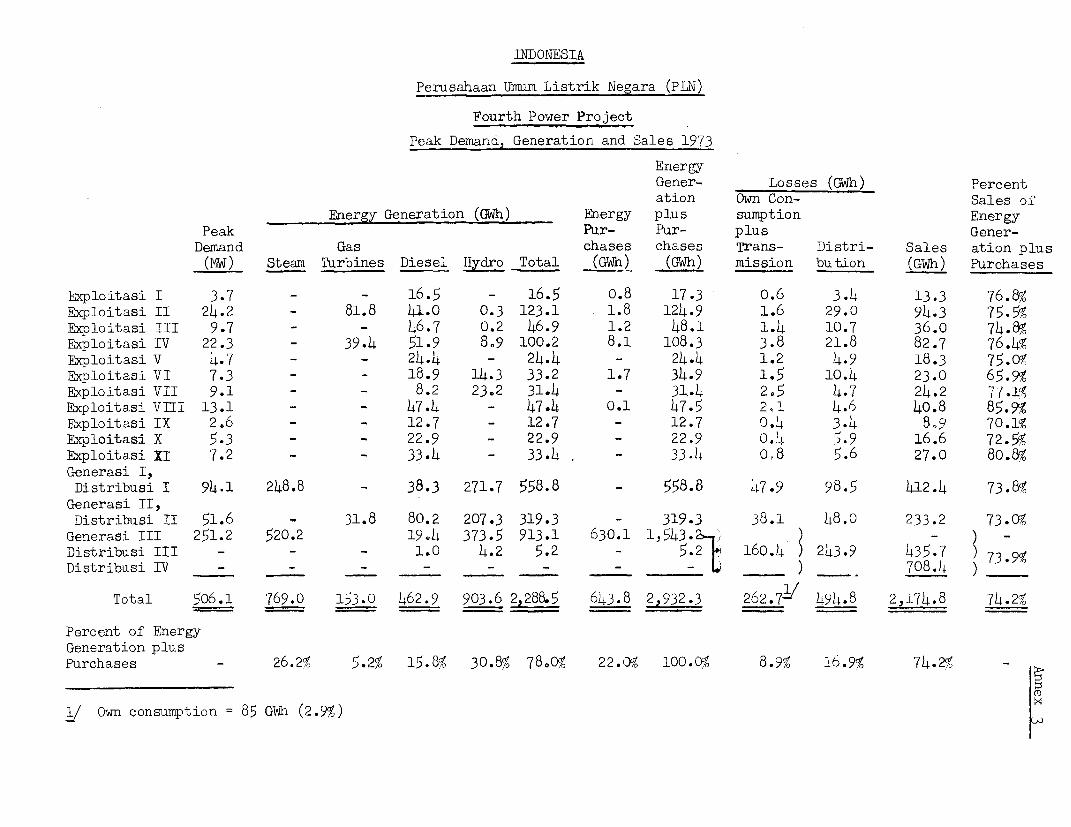
Peak Demand, Generation and Sales 1973
EnergyGener- Losses (GWh) Percent
ation Own Con- Sales of
Energy Generation (GWh) Energy plus sumption Energy
Peak Pur- Pur- plus Gener-
Demand Gas chases chases Trans- Distri- Sales ation plus
(MW) Steam Turbines Diesel Hydxo Total (GWh) (Gwh) mission bution (GWh) Purchases
Exploitasi I 3.7 - - 16.5 - 16.5 o.8 17.3 o.6 3.4 13.3 76.8%
Exploitasi II 24.2 - 81.8 41.0 0.3 123.1 1.8 124.9 1.6 29.0 94.3 75.5%
Exploitasi III 9.7 - - 46.7 0.2 46.9 1.2 48.1 1.4 10.7 36.0 74.8%
Exploitasi IV 22.3 - 39.4 51.9 8.9 100.2 8.1 108.3 3.8 21.8 82.7 76.4%
Exploitasi V 4.7 - - 24.4 - 24.4 - 24.4 1.2 4.9 18.3 75.0W
Exploitasi VI 7.3 - - 18.9 14.3 33.2 1.7 34.9 1.5 10.4 23.0 65.9%
Exploitasi VII 9.1 - - 8.2 23.2 31.4 - 31.4 2.5 4.7 24.2 77*14
Exploitasi VIII 13.1 - - 47.4 - 47.4 0.1 47.5 2,1 4.6 40.8 85.9%
Exploitasi IX 2,6 - - 12.7 - 12.7 - 12.7 0.4 3.4 8.9 70.l1?
Fxploitasi X 5.3 - - 22.9 - 22.9 - 22.9 04 5. 9 16.6 72. 5
Exploitasi XI 7.2 - - 33.4 - 33.4 - 33.4 018 5.6 27.0 80.8%
Generasi I,Distribusi I 94.1 248.8 - 38.3 271.7 558.8 - 558.8 47 .9 98.5 412.4 73.8%
Generasi II,Distribusi II 51.6 - 31.8 80.2 207.3 319.3 - 319.3 38.1 48.0 233.2 73.Q%
Generasi III 251.2 520.2 19.4 373.5 913.1 630.1 1,543. 2 ) - )
Distribusi III - - - 1.0 4.2 5.2 - 5.2 160.4 ) 243.9 435 ) 73 99
Distribusi IV - - - - -__ ) 708.4 )
Total 506.1 769.0 153.0 462.9 903.6 2,288.5 643.8 2n932.3 262.7-/ 494.8 2,174.8 74.2%
Percent of EnergyGeneration plusPurchases - 26.29 5.2% 15.8% 30.8%9 78.099 22.0O9 100.0% 8.9%9 16.9%9 74.29 _
(D
1/ Own consumption =85 GWh (2.9%) t
INDONESIA
Perusahaan Umum Listrik Negara (PLN)
Fourth Power Project
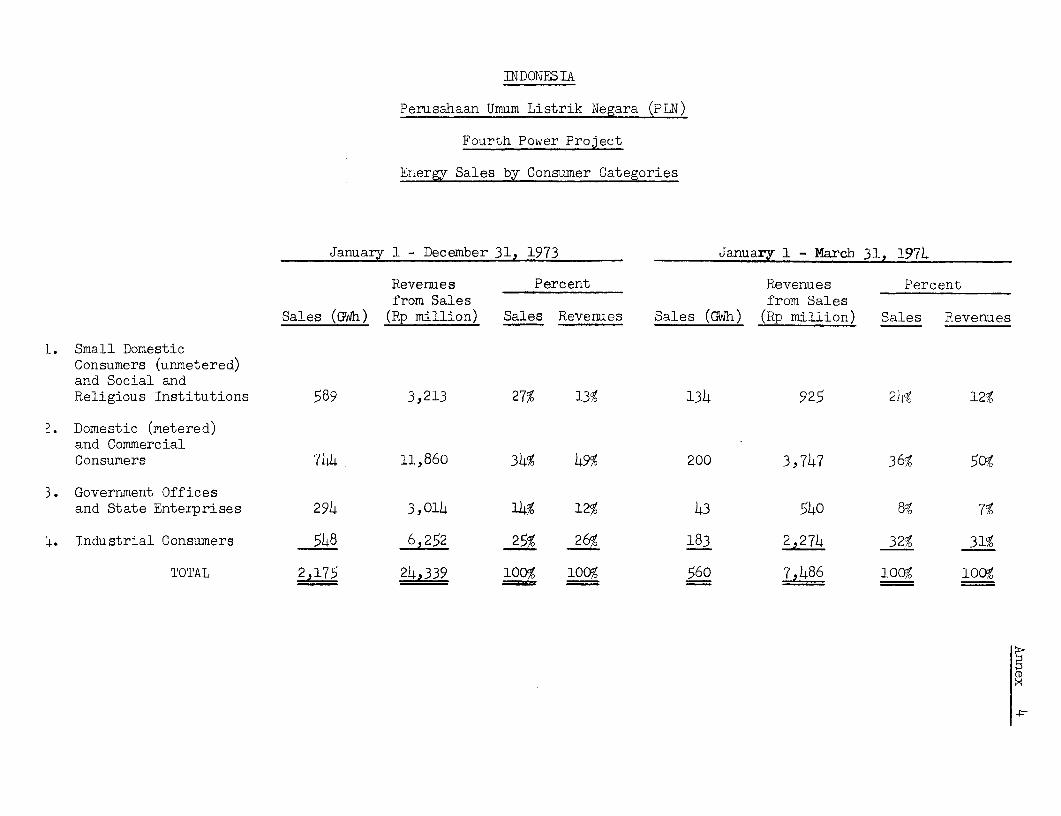
Energy Sales by Consumer Categories
January 1 - December 31, 1973 January 1 - March 31, 1974
Revenues Percent Revenues Percentfrom Sales from Sales
Sales (GWh) (Rp million) Sales Revenues Sales (GWh) (Rp million) Sales Revenues
l. Small DomesticConsumers (unmetered)and Social andReligious Institutions 589 3 ,213 27% 13% 134 925 2 4% 12%
Domestic (metered)and CommercialConsumers 744 11,860 34% 49% 200 3,747 36% 509
3. Government Officesand State Enterprises 294 3,014 14% 12% 43 540 8O 7%
4. Industrial Consumers 548 6,252 25% 26% 183 2,274 329 31%
TOTAL 2,175 24,339 lO0 lO0 560 7,486 100% lox,
(D

Annex 5
INDONESIA
Perusahaan Urnum Listrik Negara (PLN)Fourth Power Project
Actual and Forecast Generation (incl. Purchases) and Sales 1967-1978/79
Generation (incl.Purchases) SalesGWh Increase GWh Increase
Actual
1967 1,607 1,158 -
1968 1,766 5.7% 1,204 4.0%
1969 1,872 6.0% 1,454 20.8,
1970 2.084 11.3% 1,589 9.3-
1971 2,354 13,0% 1,786 12.4%
1972 2,498 6.1% 1,893 6.o%
1973 2,932 17.4% 2,175 14.9%
1974 (1. Quarter) .759 8.0% 560 707%
Forecast
1974/75 3,528 7.1% 2,611 7.1%
1975/76 4,016 13.8% 2,972 13.8%
1976/77 4,594 14.4% 3,423 15.2%
1977/78 5,307 15.5% 3,954 15.5%
1978/79 6,265 18.1% 4,699 18.8%

Annex 6
INDONESIAPerusahaan Umum Listrik Negara (PLN)
Fourth Power ProjectProject Cost Estimate
Billions of Rupiahs Millions of US DollarsLocal Foreign Total Local Foreign Total
1. Muara Karang No.3 Unit(1) Site Development 1.46 - 1.46 3.52 - 3.52(2) General Construction
Steam generator Construction 0.22 0.67 0.89 0.52 1.61 2.13Turbo generator Construction 0.04 0.37 0.41 0.10 0.89 0.99Mechanical Construction 0.30 1.56 1.86 0.73 3.76 4.49Electrical Construction 0.30 0.75 1.05 0.71 1.82 2.53Structural Construction 0.88 0.27 1.15 2.13 0.64 2.77
Sub-total 1.74 3.62 5.36 4.19 8.72 12.91
(3) Supply of EquipmentSteam Generator 0.02 2.08 2.10 0.05 5.01 5.06Turbo Generator - 3.96 3.96 - 9.54 9.54Electrical Equipment 0.01 0.84 0.85 0.02 2.02 2.04Transformer - 0.32 0.32 - 0.77 0.77Instrumentation 0.02 0.16 0.18 0.04 0.40 0.44Structural Equipment - 0.40 0.40 - 0.97 00.97
Sub-total 0.05 7.76 7.81 0.11 18.71 18.82
(4) EngineeringEngineering for Unit 3 0.02 0.40 0.42 0.05 0.97 1.02Engineering for Unit 4 0.11 1.08 1.19 0.26 2.60 2.86
Sub-total 0.13 1.48 1.61 0.31 3.57 3.88
Base Cost Estimate 3.38 12.86 16.24 8.13 31.00 39.13Physical Contingency 1/ 0.32 0.83 1.15 0.77 2.00 2.77Price Contingency 2/ 1.44 2.24 3.68 3.48 5.40 8.88
Total 5.14 15.93 21.07 12.38 38.40 50.78
2. Feasibility Study 0.12 0.29 0.41 0.30 0.70 1.00
3. Advisory Service and Training
Management Advisors 0.05 0.41 0.46 0.12 1.00 1.12Training Centers 2.63 0.77 3.40 6.33 1.85 8.18Fellowships - 0.17 0.17 - 0.40 0.40
Total 2.68 1.35 4.03 6.45 3.25 9.70
TOTAL PROJECT COST 7.94 17.57 25.51 19.13 42.35 61.48
Interest during Constructionon Bank Loan - 3.32 3.32 - 8.00 8.00
GRAND TOTAL 7.94 20.89 28.83 19.13 50.35 69.48AMOUNT OF LOAN 3/ 41.00
1/ 5% for foreign component of items (3), (4) and 10% for all other items are assumed.2/ Price contingency is based on the following rates of inflation:
1975 1976 1977-78
equipment 12% 10% 8%civil works/erection 16% 14% 12%
3/ The Loan will finance the full foreign exchange cost of the Project except foreducational equipment for training centers of US$ 1.35 million which will befinanced by PLN.

ANNEX 7Page 1
INDONES IA
PERUSAHAAN UMUM LISTRIK NEGARA (PLN)
FOURTH POWER PROJECT
Economic Justification
Economic viability of the Muara Karang project has been examinedin four different ways:
(1) least cost solution
(2) internal financial return
(3) internal economic return
(4) effect on economy
1. General Assumption
(a) Investment Cost
Muara Karang Unit 3
total project cost $50.78 millionless price contingency $(8.88)less engineering Unit 4 $(3.00) "
base cost $38.90 million
Muara Karang Unit 1 and 2
total project cost $106.0 millionless price contingency $(6.1) "
base cost $99.9 million
Gas Turbines
A recent international competitive bidding on a 20 MW unitfor the Pulo Gadung industrial project in Jakarta revealed avarying unit cost of $160-200/kW installed at a substation,
ANN4EX 7Page 2
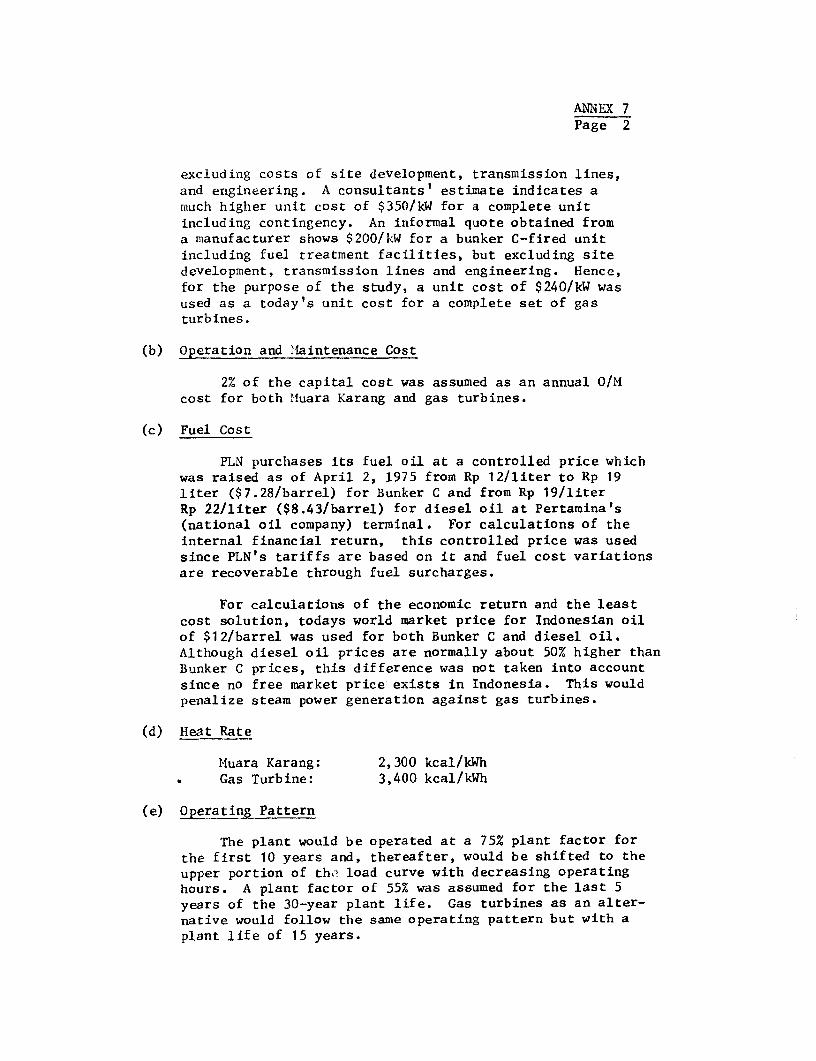
excluding costs of site development, transmission lines,and engineering. A consultants' estimate indicates amuch higher unit cost of $350/kW for a complete unitincluding contingency. An informal quote obtained froma manufacturer shows $200/kW for a bunker C-fired unitincluding fuel treatment facilities, but excluding sitedevelopment, transmission lines and engineering. Hence,for the purpose of the study, a unit cost of $240/kW wasused as a today's unit cost for a complete set of gasturbines.
(b) Operation and Ilaintenance Cost
2% of the capital cost was assumed as an annual O/Mcost for both Muara Karang and gas turbines.
(c) Fuel Cost
PLN purchases its fuel oil at a controlled price whichwas raised as of April 2, 1975 from Rp 12/liter to Rp 19liter ($7.28/barrel) for Bunker C and from Rp 19/literRp 22/liter ($8.43/barrel) for diesel oil at Pertamina's(national oil company) terminal. For calculations of theinternal financial return, this controlled price was usedsince PLN's tariffs are based on it and fuel cost variationsare recoverable through fuel surcharges.
For calculations of the economic return and the leastcost solution, todays world market price for Indonesian oilof $12/barrel was used for both Bunker C and diesel oil.Although diesel oil prices are normally about 50% higher thanBunker C prices, this difference was not taken into accountsince no free market price exists in Indonesia. This wouldpenalize steam power generation against gas turbines.
(d) Heat Rate
Muara Karang: 2,300 kcal/kWh* Gas Turbine: 3,400 kcal/kWh
(e) Operating Pattern
The plant would be operated at a 75% plant factor forthe first 10 years and, thereafter, would be shifted to theupper portion of the load curve with decreasing operatinghours. A plant factor of 55% was assumed for the last 5years of the 30-year plant life. Gas turbines as an alter-native would follow the same operating pattern but with aplant life of 15 years.

ANNEX 7Page 3
(f) Incremental Revenues
PLN's average revenue per kWh sold is at presentRp 20.0 after adjustment for the increased price offuel. In order to financially break-even by 1978 asrequired in connection with Credit 399-IND, PLN will have toraise its tariffs to Rp 21.8/kWh, excluding any additionalincrease which might become necessary due to inflationarytrends. Incremental revenues from the Project based onthese tariff levels were used as the minimum benefits ofthe Project in calculations of the internal financialreturn. It was assumed that in the first year ofoperation only a half of the energy generated by theProject would constitute incremental sales and theremaining half would only replace existing gas turbinesand thus save fuel costs. From the second year, allenergies available from the Project would represent in-crenental sales. System losses of 20% were also assumedthroughout the period.
(g) Cost of Transmission and Distribution
Although the cost of transmission lines from the MuaraKarang plant to the grid is included in the project cost,additional investment to market the output of the Projectis required for the Iistribution system. During RepelitaII PLN plans to invest Rp 147.6 billion on transmissionand distribution in the West Java area for rehabilitatingexisting systems and for expanding new systems. Sincethe existing systems are old and in chaotic condition,about one half of the investment would be required forrehabilitation and only the remaining half (Rp 74 billion)would contribute to expanding the system capacity to meetan incremental generating capacity of 610 MW during thesame period. In the following calculations Rp 74 billionwas pro-rated as follows:
Unit 3 74 x 100/610 = Rp 12.1 billion ($29.2 million)
Unit 1-3 74 x 300/610 = Rp 36.3 billion ($87.5 million)
2. Least Cost Calculation
Although the proposed Project is the only realistic solution toprovide badly needed base-load capacity, a comparison was nevertheless madeof the Project with gas turbines as a possible alternative. The MuaraKarang project was proven to be more economic than gas turbines for dis-count rates up to 23%.
ANNEX 7Page 4
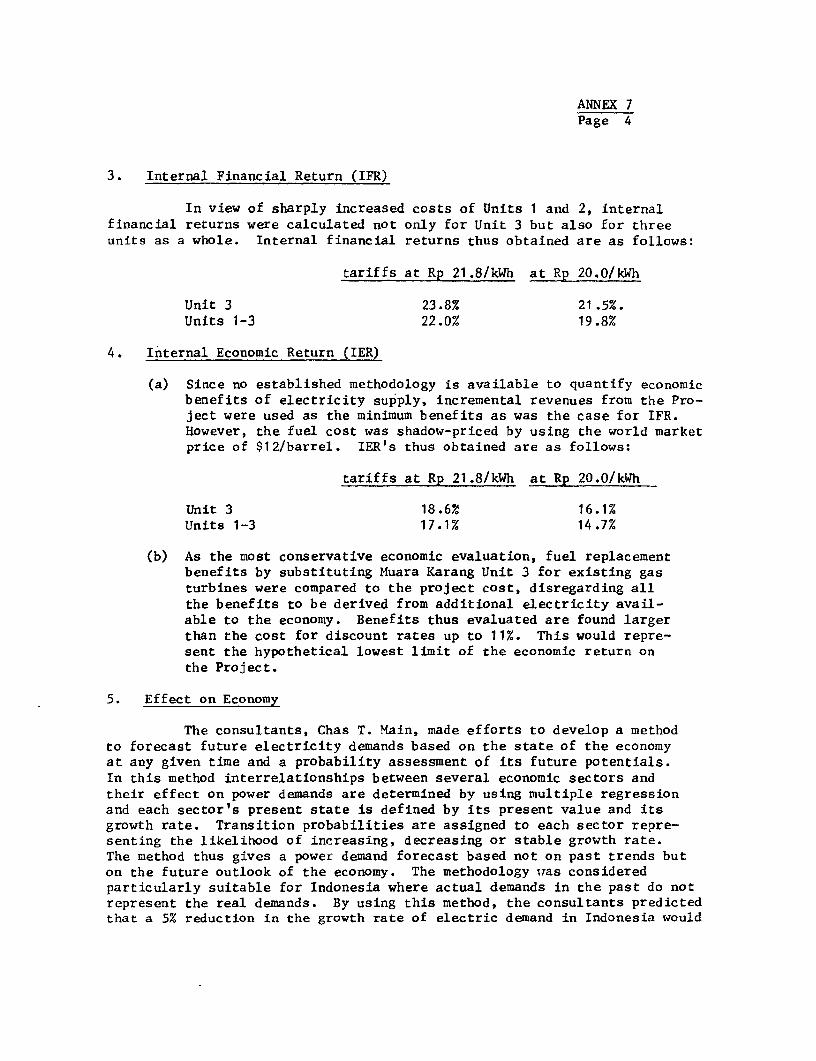
3. Internal Financial Return (IFR)
In view of sharply increased costs of Units 1 and 2, internalfinancial returns were calculated not only for Unit 3 but also for threeunits as a whole. Internal financial returns thus obtained are as follows:
tariffs at Rp 21.8/kWh at Rp 20.0/kWh
Unit 3 23.8% 21.5%.Units 1-3 22.0% 19.8%
4. Internal Economic Return (IER)
(a) Since no established methodology is available to quantify economicbenefits of electricity supply, incremental revenues from the Pro-ject were used as the minimum benefits as was the case for IFR.However, the fuel cost was shadow-priced by using the world marketprice of $12/barrel. IER's thus obtained are as follows:
tariffs at Rp 21.8/kWh at Rp 20.0/kWh
Unit 3 18.6% 16.1%Units 1-3 17.1% 14.7%
(b) As the most conservative economic evaluation, fuel replacementbenefits by substituting Muara Karang Unit 3 for existing gasturbines were compared to the project cost, disregarding allthe benefits to be derived from additional electricity avail-able to the economy. Benefits thus evaluated are found largerthan the cost for discount rates up to 11%. This would repre-sent the hypothetical lowest limit of the economic return onthe Project.
5. Effect on Economy
The consultants, Chas T. Main, made efforts to develop a methodto forecast future electricity demands based on the state of the economyat any given time and a probability assessment of its future potentials.In this method interrelationships between several economic sectors andtheir effect on power demands are determined by using multiple regressionand each sector's present state is defined by its present value and itsgrowth rate. Transition probabilities are assigned to each sector repre-senting the likelihood of increasing, decreasing or stable growth rate.The method thus gives a power demand forecast based not on past trends buton the future outlook of the economy. The methodology was consideredparticularly suitable for Indonesia where actual demands in the past do notrepresent the real demands. By using this method, the consultants predictedthat a 5% reduction in the growth rate of electric demand in Indonesia would

ANNEX 7
Page 5
result in a decline of approximately 1.5% in the growth rate of economy.Since the power demand in Central and West Java is expected to reach 1,000
MW in 1980, the Muara Karang No. 3 unit would represent about 10% of thetotal system demand and, according to this method, would affect the growthof economy by about 3%. Assuming that the combined area of Central-WestJava represents one-third of the country's economy (1972 actual), the Project
would have an effect of about 1.0% or about US$400-500 million, on thetotal expected GDP of US$40-45 billion in 1980. Although this amount doesnot necessarily represent the real benefit, it gives a good indication ofthe importance of electric power to the growth of the economy.

ANNEX 8Page 1
INDONESIA
PERUSAHAAN UMUM LISTRIK NEGARA (PLN)
FOURTH POWER PROJECT
Construction Cost of Muara Karang Project (Unit 1 &2)
Analysis of Cost Overruns
1. Introduction
1.01 The Muara Karang project (Unit 1 & 2) was appraised in November1972. The cost estimate for the project, originally prepared by consultants(C.T. Main), was discussed with PLN and the consultants and accepted asadequate. The total cost of the project was estimated at US$52 million,US$44 million representing the foreign exchange portion and US$8 millionthe local cost, including necessary transmission facilities.
1.02 An IDA credit financing the foreign cost of the project wasapproved in May 1973, and in lovember 1973 Black & Veatch International(BVI) were appointed by PLN as the consultants for project engineering andsupervision. In April 1974, BVI reestimated the project cost based on theirpreliminary design. This increased both foreign and local cost to US$54.8million and US$16.3 million equivalent, respectively, resulting in thetotal cost of US$71.1 million.
1.03 Surprisingly high bidding prices received for the Semarangthermal power project (2 x 50 'IW), Central Java, in mid-1974 forced BVIto re-examine the cost estimate for the Mtuara Karang project. TheirOctober, 1974 revision further increased the estimate to US$68.3 millionand US$37.2 million for the foreign and local component, respectively,and the total to US$105.5 million.
1.04 Bids were received on November 15, 1974 for the supply of majorequipment. Although the response to the bid invitation was favorable withsixteen suppliers well spread throughout the world participating, pricesoffered revealed additional cost increases. The sum of the lowest evaluatedbid for each schedule is now US$37.8 million, which compares with US$22.8million in the appraisal for these items; US$27.2 million in BVI's estimatein April 1973 and US$34.4 million in their October 1974 estimate.
ANNEX 8Page 2
1.05 The final cost estimate will have to wait until remaining bidshave been received on control and instrumentation, structural equipment,site development, general construction and transmission lines. In themeantime, Bank staff, working with the consultants, have spent considerabletime in attempting to anticipate the final cost.
1.06 This Annex discusses the revised cost estimate and tries toanalyze to the extent possible causes for the overruns.
2. Conclusions
2.01 The present cost estimate stands at US$106 million, consisting ofthe foreign component at US$74 million and the local component of US$32million equivalent. This is an increase of 68% in foreign and 300% in localcost compared to the original appraisal estimate.
2.02 Out of a USS30 million foreign cost increase, one-third is traceableto physical changes in project scope. The remaining two-thirds is due tothe world-wide inflation which took place during the period of economicturbulance in 1973-74.
2.03 The increase in local costs by 300% can be attributed roughly tophysical changes in the scope of the project (130%) and to price escalation(170%). Local inflation has been caused largely by soaring prices oflocally procured materials. Local labor costs, although significantlyincreased, have a secondary effect.
2.04 Although the total cost of the project has gone up substantially,it includes considerable investment on common facilities necessary forthe ultimate 5 unit development of 700 NW. After making adjustment forthese costs and adding the estimated cost of Unit No. 3 (100 MW), theinstalled cost of the initial three units of 100 1'1 each would be $397/kWexcluding transmission facilities and interest during construction onUnit No. 3. This is considered a reasonable representation of the earlyl9,5 narket price for 100 MW oil-fired units.
3. Revised Cost Estimate
3.01 Tenders were received on November 15, 1974 for the supply ofmajor equipment in four schedules; namely, steam generators, turbine/generators, electrical equipment and transformers. Local bids for pilingand site development were opened in December 1974. Remaining items stillto be tendered are: (i) control and instrumentation; (ii) transmissionline materials; (iii) structural materials; (iv) general construction(mechanical, electrical and structural construction and submarine oil line);and (v) local contracts for erection of transmission facilities.
3.02 Attached Table 1 and 2 show the comparison of the previous andthe latest estimates of the foreign and local component of the project cost.
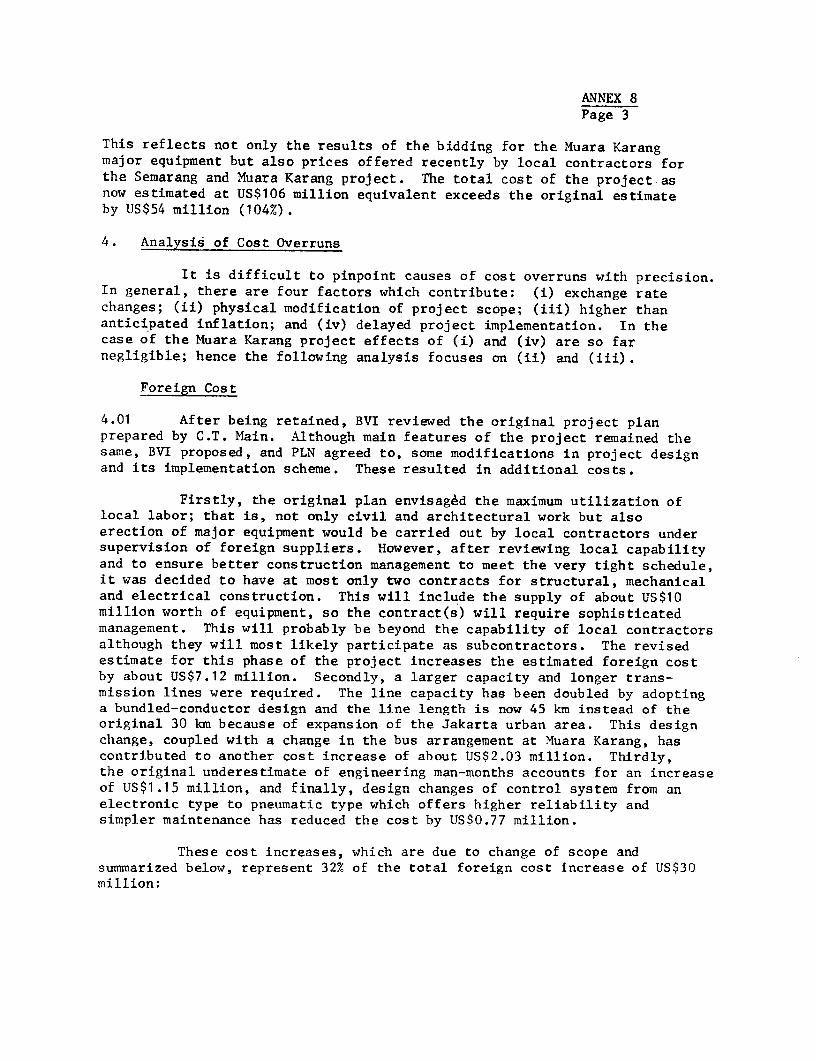
ANNEX 8Page 3
This reflects not only the results of the bidding for the Muara Karangmajor equipment but also prices offered recently by local contractors forthe Semarang and Muara Karang project. The total cost of the project asnow estimated at US$106 million equivalent exceeds the original estimateby US$54 million (104%).
4. Analysis of Cost Overruns
It is difficult to pinpoint causes of cost overruns with precision.In general, there are four factors which contribute: (i) exchange ratechanges; (ii) physical modification of project scope; (iii) higher thananticipated inflation; and (iv) delayed project implementation. In thecase of the Muara Karang project effects of (i) and (iv) are so farnegligible; hence the following analysis focuses on (ii) and (iii).
Foreign Cost
4.01 After being retained, BVI reviewed the original project planprepared by C.T. Main. Although main features of the project remained thesame, BVI proposed, and PLN agreed to, some modifications in project designand its implementation scheme. These resulted in additional costs.
Firstly, the original plan envisaged the maximum utilization oflocal labor; that is, not only civil and architectural work but alsoerection of major equipment would be carried out by local contractors undersupervision of foreign suppliers. However, after reviewing local capabilityand to ensure better construction management to meet the very tight schedule,it was decided to have at most only two contracts for structural, mechanicaland electrical construction. This will include the supply of about US$10million worth of equipment, so the contract(s) will require sophisticatedmanagement. This will probably be beyond the capability of local contractorsalthough they will most likely participate as subcontractors. The revisedestimate for this phase of the project increases the estimated foreign costby about US$7.12 million. Secondly, a larger capacity and longer trans-mission lines were required. The line capacity has been doubled by adoptinga bundled-conductor design and the line length is now 45 km instead of theoriginal 30 km because of expansion of the Jakarta urban area. This designchange, coupled with a change in the bus arrangement at Muara Karang, hascontributed to another cost increase of about US$2.03 million. Thirdly,the original underestimate of engineering man-months accounts for an increaseof US$1.15 million, and finally, design changes of control system from anelectronic type to pneumatic type which offers higher reliability andsimpler maintenance has reduced the cost by US$0.77 million.
These cost increases, which are due to change of scope andsummarized below, represent 32% of the total foreign cost increase of US$30million:

ANNEX 8Page 4
US$ million
General Construction 7.12Transmission Facilities 2.03Engineering 1.15Control and Instrumentation (0.77)
Total 9.53
4.02 The remaining cost increase of US$20.5 million can be attributedto inflation. The original estimate was based on late 1972 prices andincluded price escalation of only 5% per annum which was considered adequateat the time. The major economic crisis and world-wide inflation took placein 1973, and, exacerbated by the oil crisis, continued in 1974. Accordingto the consultants, price escalation of basic materials in USA during theone-year period from late 1973 to late 1974 is as follows:
Item % escalation
Pipe - Material 50 - 55Valve - Mfaterial 40 - 100Structural Steel 50 - 60Heat Exchanger - Material 65 - 100Condensers - Material 60Pump - Material 80Control Equipment 25 - 40Electrical Equipment 30
Thus US$20.5 million increase (47% of the original estimate) is consideredto be within the range of general inflation.
Local Costs
4.03 The local cost overrun is far more serious, amounting to US$24million equivalent or a 300% increase. About one-third of this can beattributed to the scope change of a single work items - marine work (coolingwater intake and submarine fuel pipeline). C.T. Main's original plan wasbased on oqeanographic charts then available but further investigationswere recommended before finalizing the design. When this was done in early1974, the ocean bay in front of the site was found to be much shallowerthan indicated on the charts. Consequently BVI had to extend the intakecanal from 400 m to 900 m and the fuel pipeline from 2.5 km to 4.3 km.Another survey revealed that the original land-transport scheme for equip-ment, which assumed reinforcing only a few bridges, was not feasible.Transport by barges direct]? from the harbor to the project site is required.This means that the intake canal will have to be widened to handle thebarges. All these changes in the marine work including additional dockfacilities at the site have increased the local cost by US$8.3 million over

ANNEX 8Page 5
the original estimate. Other design changes account for a local cost in-crease of US$2.0 million, including US$1.2 million for transmission facilities.
4.04 The balance of the local cost overrun of US$13.7 million or 170,'of the original estimate is mainly a result of local inflation. Acuteprice increases occurred in early 1974 for goods and materials normallypurchased locally. Cement has quadrupled from $45/ton to $170/ton ascompared with the world market prices of $40-70/ton, and reinforcing barnow costs $600/ton. These are certainly black market prices, but localcontractors have little choice other than going to the black 'narket becauseof severe shortage of these materials. Although the government set a ceilingon the cement price at $100/ton in 1974, this was not reflected in the latestbidding prices. Labor costs also increased by about 47% during thefirst six months of 1974, but it is still inexpensive at $2.50 per day fora foreman, $1.80 for a skilled worker and $1.00 for an unskilled worker.The unit cost of concrete in place for pile caps is now USS270/m as comparedto US$190/m in US. Since the major local cost items are concrete relatedsuch as pile and pile caps (US$2.9 million), marine works (US$7.4 million),structural construction (US$6.1 million), it would not be unreasonable toassume overall inflation of 170% during the last two years.
5. Unit Cost
5.01 The total cost of the project for the first two units of 100 MWis now estimated at US$106.00 million or $530 per kW installed. However,the scope of the project includes certain items which are common to thefinal 5 unit 700 MW development. To get a better idea of the unit costof a 100 MW unit, adjustments as follow are required.
(1) Cost of Unit No. 3
total cost $50.78 millionless provisions for Unit 4 ($5.95 million)
Total $44.83 million
(2) Common Facilities Included in Units 1 & 2
kite fill S 0.77 millionaccess road, docks $ 1.70 millionintake canal $ 8.54 millionsubmarine fuel line $ 4.70 million
Total $15.21 million
Cost proportioned to the future 2 x 200 MW is:
$15.21 x 4/7 = $ 8.69 million

ANNEX 8Page 6
(3) Less Transmission Facilities
substation at Cawang & Angke $ 4.10 milliontransmission lines $ 5.35 million
Total $ 9.45 million
(4) Adjusted Cost for 3 x 100 MW
cost for Unit 1 & 2 $106.0 millionadd Unit 3 $ 44.8 milliondeduct common facilities ($ 8.7 million)deduct transmission facilities ($ 9.5 million)
Total $132.6 million
The unit cost for 100 I4W is, therefore, $442/k6W. This includes escalationand engineering but not interest during construction. If price escalationis excluded, the unit cost becomes $397/kW.
5.02 A recent international competitive bidding confirms a unit costof over US$400/kW for this unit size. Bids were opened in March, 1974 fortwo units of 150 MW each for the Meharcleh thermal power plant in Syria.The total cost of this project is now estimated at US$124 million; US$104million for the foreign component and US$20 million for the local cost.The unit cost is US$413/kW. A slightly lower unit cost could be attributableto a larger unit size and a half-year difference in the bidding timing.
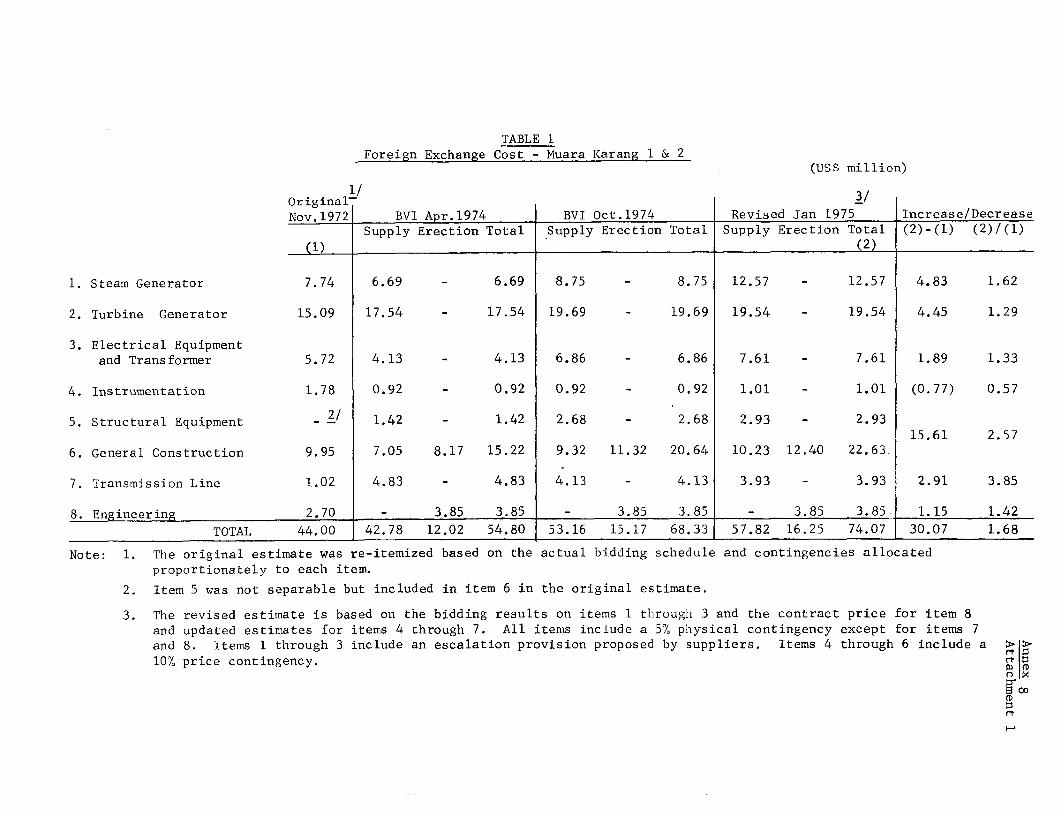
TABLE 1Foreign Exchange Cost - Muara Karang 1 & 2
(US$ million)
Original! 3/Nov. 1972 BVI Apr.1974 BVI Oct.1974 Revised Jan 1975 Increase/Decrease
Supply Erection Total Supply Erection Total Supply Erection Total (2)-(1) (2)/(1)(1) __~~~~~~~~~~~~~~~~~~~~(2)
1. Steam Generator 7.74 6.69 - 6.69 8.75 - 8.75 12.57 - 12.57 4.83 1.62
2. Turbine Generator 15.09 17.54 - 17.54 19.69 - 19.69 19.54 - 19.54 4.45 1.29
3. Electrical Equipmentand Transformer 5.72 4.13 - 4.13 6.86 - 6.86 7.61 - 7.61 1.89 1.33
4. Instrumentation 1.78 0.92 - 0.92 0.92 - 0.92 1.01 - 1.01 (0.77) 0.57
5. Structural Equipment 2/ 1.42 - 1.42 2.68 - 2.68 2.93 - 2.9315.61 2.57
6. General Construction 9.95 7.05 8.17 15.22 9.32 11.32 20.64 10.23 12.40 22.63
7. Transmission Line 1.02 4.83 - 4.83 4.13 - 4.13 3.93 - 3.93 2.91 3.85
8. Engineering 2.70 - 3.85 3.85 - 3.85 3.85 - 3.85 3.85 1.15 1.42
TOTAL 44.00 42.78 12.02 54.80 53.16 15.17 68.33 57.82 16.25 74.07 30.07 1.68
Note: 1. The original estimate was re-itemized based on the actual bidding schedule and contingencies allocatedproportionately to each item.
2. Item 5 was not separable but included in item 6 in the original estimate.
3. The revised estimate is based on the bidding results on items 1 through 3 and the contract price for item 8
and updated estimates for items 4 through 7. All items include a 5% physical contingency except for items 7
and 8. ltems 1 through 3 include an escalation provision proposed by suppliers. Items 4 through 6 include a >
10% price contingency. N 0
0 (D
,D
I-.

Annex 8
Attachment 2
TABLE 2Local Cost - Muara Karang 1 & 2
(US$ million)
1/ ~~~~~~~~2/Original7 BVI BVI Revised-Nov.1972 Apr.1974 Oct.1974 Jan.1975 Increase/Decrease
(1) (2) (2)-(1) (2)/(1)
1. Land & Site Fill 0.83 1.41 0.77 0.77 (0.06) 0.93
2. Civil Works 2.46 4.52 21.49 15.06 12.60 6.13
3. General Construction 3.66 8.93 12.95 14.18 10.52 3.88
4. Transmission & Substation 0.47 0.91 1.49 1.42 0.95 2.02
5. Engineering 0.58 0.49 0.49 0.49 (0.09) 0.85
TOTAL 8.00 16.26 37.19 31.92 23.92 3.99
Note: 1. The original estimate was re-itemized based on the actual bidding schedule
and contingencies distributed proportionately to each item.
2. The revised estimate is based on the contract price of item 1 and 5, the
bidding result on some schedules of item 2 and updated estimates for the
rest. The cost of item 2 and 3 include a 13% contingency.
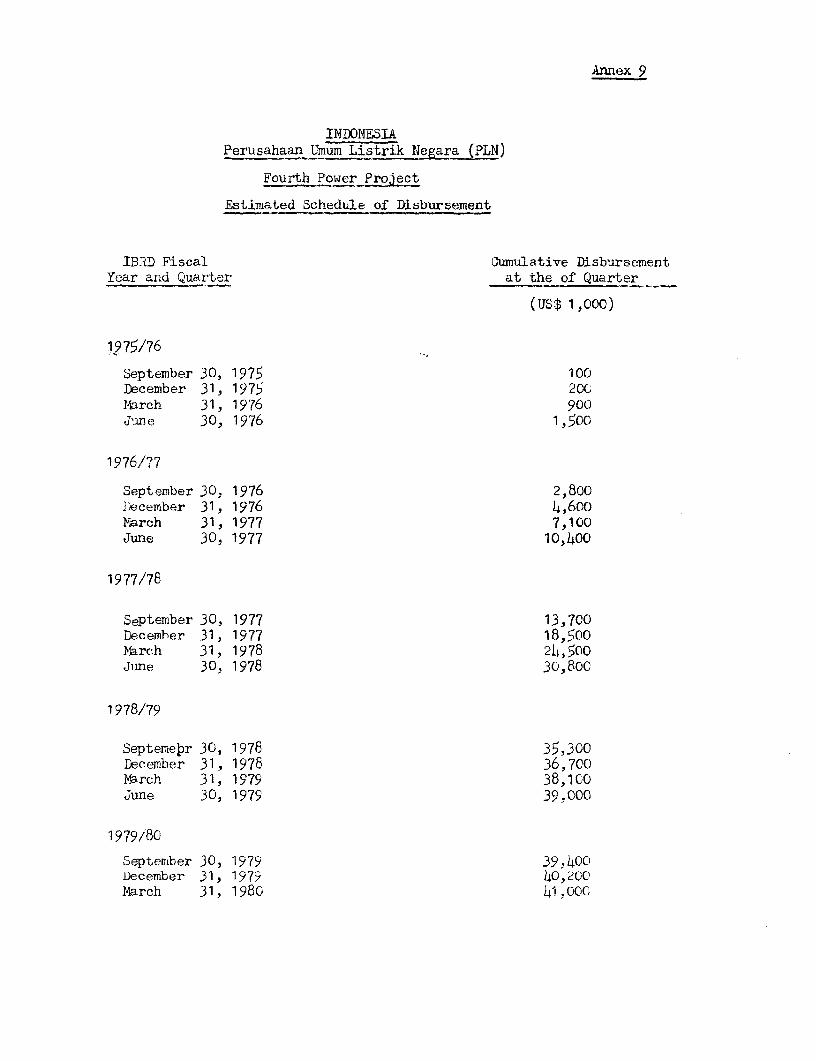
Annex 9
INDONESIAPerusahaan bTmum Listrik Negara (?LN)
Fourth Power Project
Estimated Schedule of Disbursement
IBRD Fiscal Cumulative Disburse.mentYear and Quarter at the of Quarter
(us$ 1,000)
1975/76
September 30, 1975 100December 31, 1975 206Iarch 31, 1976 900J n e 30, 1976 1,500
1976/77
Septemiber 30, 1976 2,800lk)cember 31, 1976 4,600March 31, 1977 7,100June 30, 1977 10,400
1977/78
September 30, 1977 13,700December 31, 1977 18,500March 31, 1978 214,500June 30, 1978 30,80C
1978/79
SeptemePr 30, 1978 35,300Decermber 31, 1978 36,7C0Ma,rch 31, 1979 38,1G0june 30, 1979 39,000
1979/80
September 30, 1979 39,400December 31, 1979 40,200March 31, 1980 41,00C,

ANNEX 10Page 1
INDONESIA
PERUTSAHAAN UMUM LISTRIK NEGARA (PLN)
FOURTH POWER PROJECT
Tariffs
I. Introduction
1. On June 12, 1973 a new electricity tariff became effective. Inaddition to an increase of 40% in revenues it introduced a cost orientedtariff structure based on the voltage level of service.
II. PLN's Tariff before June 12, 1973
2. Following table shows PLN's tariff as applicable before June 12,1973:
Service DemandClass of Capacity Charge Energy ChargeTariff Type of Consumer (VA) (Rp/kVA) (Rp)
Si Small Domestic Con- 60 87sumers with Load 75 108Limiters (unmetered) 100 144
125 180150 216175 252200 288
S2 Churches, M4osques, 250-2500 and 170 First 200 hours:Schools, etc. above 250 1.70
Additional kwh:5.00
Rl Small Domestic 250-2500 420 First 250 hours:Consumers (metered) 5.00
Additional kwh:15.00
R2 Large Domestic Above 2500 440 First 200 hours:Consumers (metered) 5.50
Additional kwh:16.50

ANNEX 10Page 2
Service DemandClass of Capacity Charge Energy Charge
Tariff Type of Consumer (VA) (Rp/kVA) (Rp)
Kl Small Commercial 250-2500 880 First 150 hours:Consumers 6.50
Additional kwh:20.00
K2 Large Commercial above 2500 1,120 First 150 hours:
Consumers 9.00Additional kwh:
20.00K3 Temporary less than - Minimum 20
Connections 500 hours: 20.00
Ul Street Lighting - - 2.50/kwh
U2 Government 250-2500 and 480 First 150 hours:
Agencies above 2500 4.00/kwhAdditional kwh:
12.00
U3 State Enterprises 250-2500 and 520 First 150 hours:above 2500 4.25/kwh
Additional kwh:13.00
P Industrial above 10000 270 Off-peak hours:Consumers 5.50/kwh
Peak hours:20.00/kwh
Above schedule indicates the basic charges. In addition PLN is permittedto charge fuel transportation cost depending on the location of the powergenerating source. Furthermore, extra charges can be levied for:
(a) additional fuel cost, if thermal generation exceeds10% of total generation; and
(b) additional current cost of more than 10%.
III. Considerations for Tariff Revision
3. Prior to the revision it had been generally agreed that the tariff
structure did not meet PLN4's requirements: It did not generate sufficientfunds to cover cash expenses and it was not cost related. For instance, in-dustrial consumers paid an energy charge higher than domestic consumers.
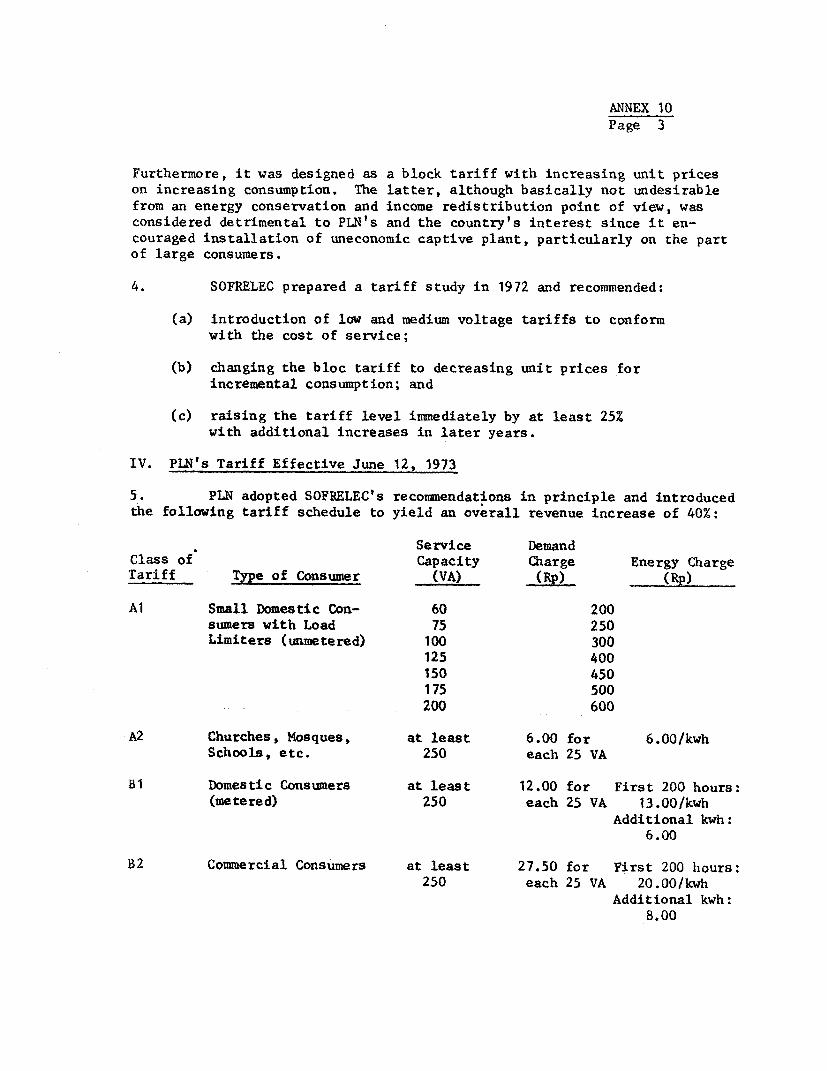
ANNEX 10Page 3
Furthermore, it was designed as a block tariff with increasing unit priceson increasing consumption. The latter, although basically not undesirablefrom an energy conservation and income redistribution point of view, wasconsidered detrimental to PLN's and the country's interest since it en-couraged installation of uneconomic captive plant, particularly on the partof large consumers.
4. SOFRELEC prepared a tariff study in 1972 and recommended:
(a) introduction of low and medium voltage tariffs to conformwith the cost of service;
(b) changing the bloc tariff to decreasing unit prices forincremental consumption; and
(c) raising the tariff level immediately by at least 25%with additional increases in later years.
IV. PLN's Tariff Effective June 12, 1973
5. PLN adopted SOFRELEC's recommendations in principle and introducedthe following tariff schedule to yield an overall revenue increase of 40%:
Service DemandClass of Capacity Charge Energy ChargeTariff Type of Consumer (VA) (Rp) (Rp)
Al Small Domestic Con- 60 200sumers with Load 75 250Limiters (unmetered) 100 300
125 400150 450175 500200 600
A2 Churches, Mosques, at least 6.00 for 6.00/kwhSchools, etc. 250 each 25 VA
B1 Domestic Consumers at least 12.00 for First 200 hours:(metered) 250 each 25 VA 13.00/kwh
Additional kwh:6.00
B2 Commercial Consumers at least 27.50 for First 200 hours:250 each 25 VA 20.00/kwh
Additional kwh:8.00
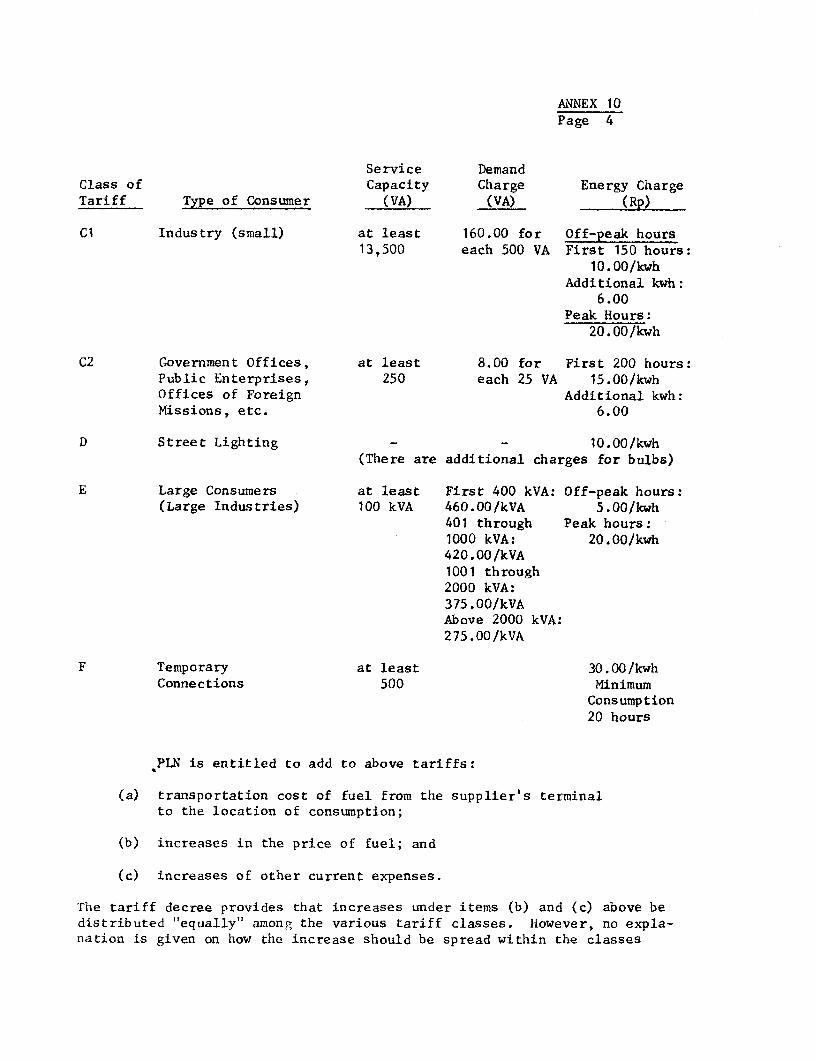
ANNEX 10Page 4
Service DemandClass of Capacity Charge Energy ChargeTariff Type of Consumer (VA) (VA) (Rp)
C1 Industry (small) at least 160.00 for Off-peak hours13,500 each 500 VA First 150 hours:
10.00/kwhAdditional kwh:
6.00Peak Hours:
20.00/kwh
C2 Government Offices, at least 8.00 for First 200 hours:Public Enterprises, 250 each 25 VA 15.00/kwhOffices of Foreign Additional kwh:Missions, etc. 6.00
D Street Lighting - - 10.00/kwh(There are additional charges for bulbs)
E Large Consumers at least First 400 kVA: Off-peak hours:(Large Industries) 100 kVA 460.00/kVA 5.00/kwh
401 through Peak hours:1000 kVA: 20.00/kwh420.00/kVA1001 through2000 kVA:375.00/kVAAbove 2000 kVA:275.00/kVA
F Temporary at least 30.00/kwhConnections 500 Minimum
Consumption20 hours
PLN is entitled to add to above tariffs:
(a) transportation cost of fuel from the supplier's terminalto the location of consumption;
(b) increases in the price of fuel; and
(c) increases of other current expenses.
The tariff decree provides that increases under items (b) and (c) above bedistributed "equally" among the various tariff classes. However, no expla-nation is given on how the increase should be spread within the classes

ANNEX 10Page 5
(A1/A2, B1/B2, C1/C2). For political reasons (not to create too heavy aburden for the low income groups) PLN has chosen in the past to allocatean equal amount to each unit sold rather than apply percentages commensurateto the various tariff classes. This has the disadvantage of partiallyeliminating the differences between the tariff classes watering down theprinciple of charges based on cost of service.
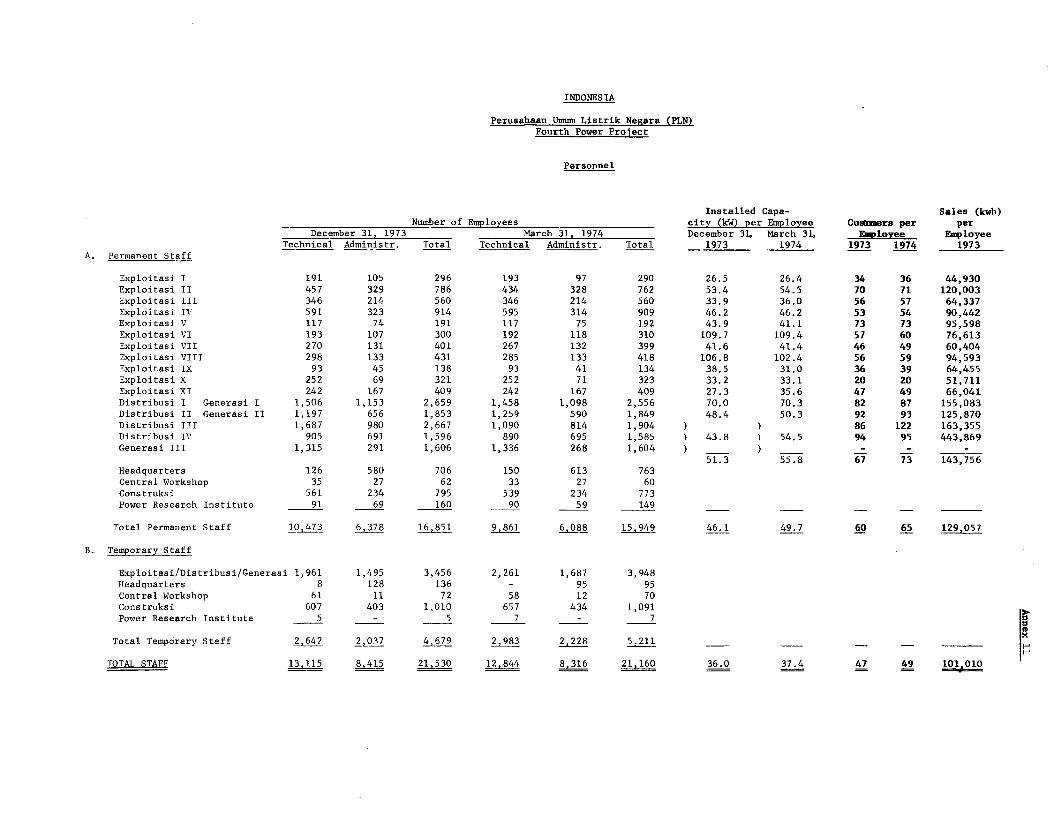
INDONESIA
Perusahaan Umum Listrik Negara (PLN)Fourth Power Proiect
Personnel
Installed Capa- Sales (kwh)Number of Employees city (kW) per Employee Cusmuera per per
December 31, 1973 March 31, 1974 December 31, March 31, Employee EmployeeTechnical Administr. Total Technical Administr. Total 1973 1974 1973 1974 1973
A. Permanent Staff
Exploitasi I 191 105 296 193 97 290 26.5 26.4 34 36 44,930Exploitasi II 457 329 786 434 328 762 53.4 54.5 70 71 120,003Exploitasi III 346 214 560 346 214 560 33.9 36.0 56 57 64,337Exploitasi IV 591 323 914 595 314 909 46.2 46.2 53 54 90,442Exploitasi V 117 74 191 117 75 192 43.9 41.1 73 73 95,598Exploitasi VI 193 107 300 192 118 310 109.7 109.4 57 60 76,613Exploitasi VII 270 131 401 267 132 399 41.6 41.4 46 49 60,404Exploitasi VIII 298 133 431 285 133 418 106.8 102.4 56 59 94,593Exploitasi IX 93 45 138 93 41 134 38.5 31.0 36 39 64,455Exploitasi X 252 69 321 252 71 323 33.2 33.1 20 20 51,711Exploitasi XI 242 167 409 242 167 409 27.3 35.6 47 49 66,041Distribusi I Generasi I 1,506 1,153 2,659 1,458 1,098 2,556 70.0 70.3 82 87 155,083Distribusi II Generasi II 1,197 656 1,853 1,259 590 1,849 48.4 50.3 92 93 125,870Distribusi III 1,687 980 2,667 1,090 814 1,904 ) ) 86 122 163,355Distribusi IV 905 691 1,596 890 695 1,585 ) 43.8 ) 54.5 94 95 443,869Generasi III 1,315 291 1,606 1,336 268 1,604 ) _) _- - -
51.3 55.8 67 73 143,756;Headquarters 126 580 706 150 613 763Central Workshop 35 27 62 33 27 60Construksi 561 234 795 539 234 773Power Research Institute 91 69 160 90 59 149
Total Permanent Staff _0 473 6,378 16,851 9,861 6,088 15,949 46.1 49.7 60 65 129,057
B. Temporary Staff
Exploitasi/Distribusi/Generasi 1,961 1,495 3,456 2,261 1,687 3,948Headquarters 8 128 136 - 95 95Central Workshop 61 11 72 58 12 70Construksi 607 403 1,010 657 434 1,091Power Research Institute 5 - 5 7 - 7
Total Temporary Staff 2,642 2,037 4,679 2,983 2,228 5,211
TOTAL STAFF 13,115 8415 21,530 12,844 8,316 21,160 36.0 37.4 47 49 101 010
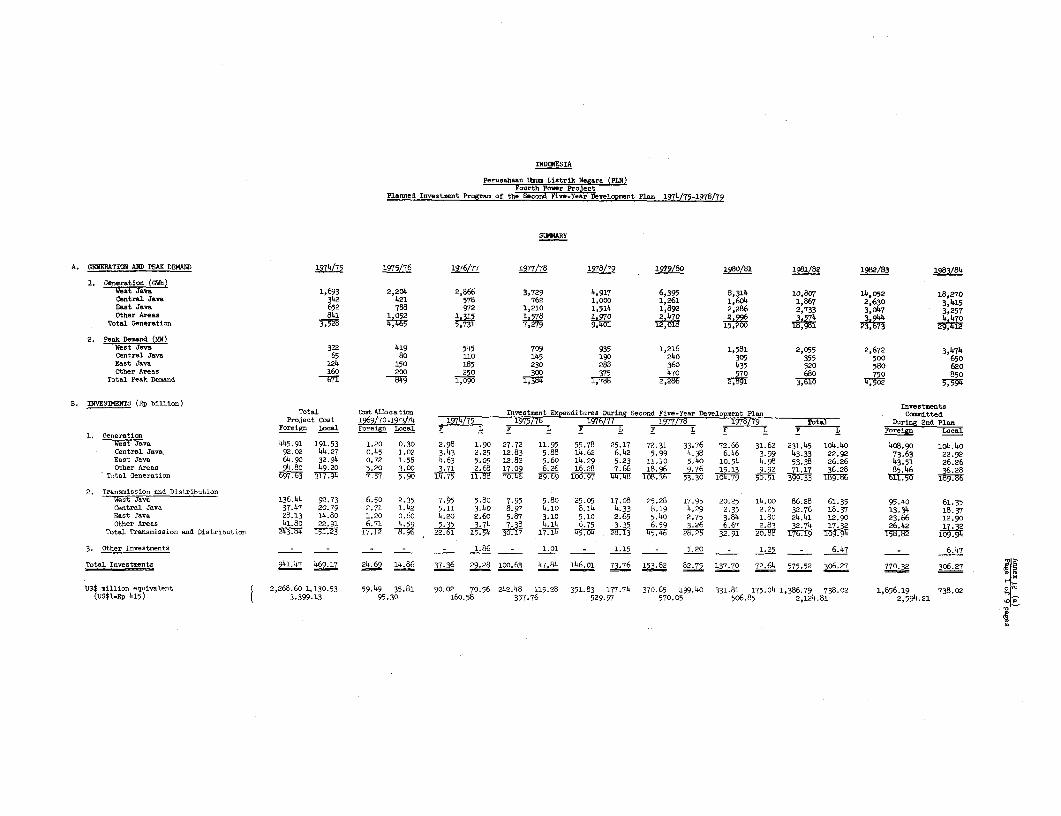
INDaESIA
Perusahasn Umus Listrik Negara (PLN)Fourth Power Project
Planned Investment Program of the Sn w-Year Deelopmnt Plan 1974/75-1978/79
SW"AY
A. GENERATION AND PEAK DEMAND 1974/75 1975/76 1976/77 1977/78 1978/79 1979/80 1980/81 1981/82 2988/83 1983/84
1. Generation (GWh)West Java 1,693 2,204 2,866 3,729 4,917 6,395 8,314 10,807 14,052 18,270Central Java 342 421 578 762 1,000 1,261 1,604 i,867 2,630 3,415East Java 652 788 972 1,210 1,514 1,892 2,286 2,733 3,047 3,257Other Areas 841 1 052 1,315 1 578 1,97° 2 470 2 996 3574 3 944 4 470
Total Generation 145,7311465 t75 9 9,401 15,200 3 23 673
2. Peak Demand (MW)West Java 322 419 545 709 935 1,216 1,581 2,055 2,672 3,474Central Java 65 80 110 145 190 240 305 355 500 650East Java 124 150 185 230 288 360 435 520 580 620Other Areas 160 200 250 300 375 470 570 68o 750 850
Total Peak Demand 67 1 1,090 T1,784 2,286 291- 3,610 5,594
B. INVESTMENTS (Rp billion) InvestmentsTotal bst Allocation Investmnt Expenditures During Second Five-Year Development Plan Committed
Project Cost 1969/70.1973/74 1974/75 1975/76 1976/77 1977/78 1978/79 70ti Daring 2nd PlanForeign Local Foreign Local F L F L F L F L F L F L Foreign Local
1. GenerationW.est Jva 445.91 191.53 1.20 0.30 2.98 1.90 27.72 11.95 55.78 25.17 72.31 33.76 72.66 31.62 231.45 104.4o 408.90 io4.4oCentral Java 92.02 44.27 o.45 1.02 3.43 2.25 12.83 5.88 14.62 6.42 5.99 4.38 6.46 3.99 43.33 22.92 73.63 22.92East Java 64.90 32.94 0.72 1.58 4.63 5.05 12.82 5.60 14.29 5.23 11.10 5.40 lo.54 4.98 53.38 26.26 43.51 26.26Other Areas 94.80 49.20 5.20 3.00 3.71 2.68 17.09 6.26 16.28 7.66 18.96 9.76 15.13 9.92 71.17 36.28 85.46 36.28
Total Generation 697.3 317. 94 7.57 5.90 1475 1 1. 8 8 29.6 5 104.79 50.51 399.33 189.86 6 1.50 189.86
2. Transminsion and DistributionWest Java 136.44 92,73 6.50 2.35 7.95 5.80 7y95 5.80 25.05 17.08 25.28 17.95 20.25 14.oo 86.28 61.35 95.40 61.35Central Java 37.47 20.79 2.71 1.42 5.11 3.40 8.97 4.10 8.14 4.33 8.19 4.29 2.35 2.25 32.76 18.37 13.34 18.37East Java 28.13 i4.8o 1.20 o.6o 4.20 2.6o 5.87 3.10 5.10 2.65 5.40 2.75 3.84 i.8o 24.41 12.90 23.66 12.90Other Areas 41.8o 22.91 6.71 4.59 5.35 3.74 7.38 4.i4 6.75 3.35 6.59 3.26 6.67 2.83 32.74 17.32 26.42 17.32
Total Transnission and Distribution 243.84 159317.1 2 8.96 22.61 15.54 30.17 17.14 26.13 45.4 6 25.25 32.91 20.88 176.19 4 158.78 109.94
3. Other Invstments - - _ - - i.86 - 1.01 - 1.15 - 1.20 - 1.25 - 6.47 _ 6.47
Total Investments 941.47 469.17 24.69 14.86 37.36 .2 100.63 47. 4 146. 73.76 82 82.75 137.70 72.64 575 52 306.27 770.32 306.27
US$ million equtvalent ( 2,268.60 1,130.53 59.49 35.81 90.02 70.56 242.48 115.28 351.83 177.74 370.65 199.40 331.81 175.04 1,386.79 738.02 1,856.19 738.02(US$1=Rp 415) 3.399.13 95.30 i6o.58 357.76 529.57 570.05 506.85 2,124.81 2,594.21
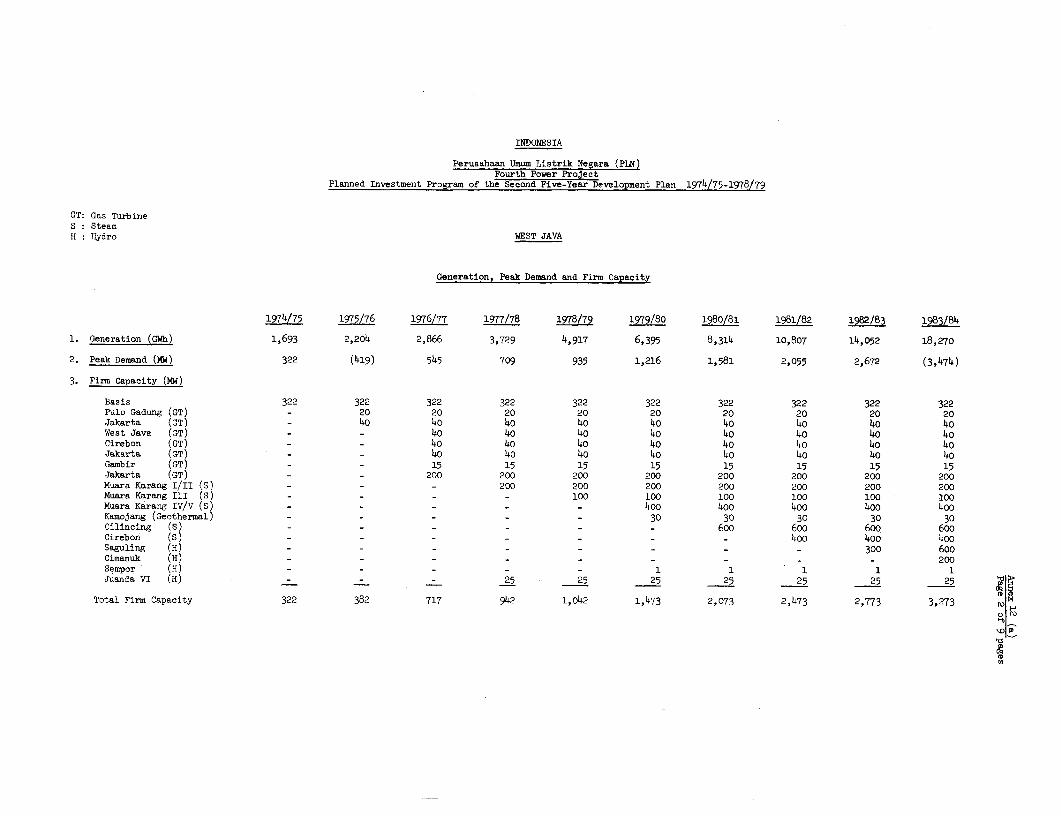
INDONESIA
Perusahaan Umum Listrik Negara (PLN)Fourth Power Project
Planned Investment Program of the Second Five-Year Development Plan 1974/75-1978/79
GT: Gas TurbineS : SteamH : Hydro WEST JAVA
Generation, Peak Demand and Firm Capacity
1974/75 l95/76 1976/77 1977/78 1978/79 1979/80 1980/81 1981/82 i9B2/83 1983/84
1. Generation (GWh) 1,693 2,204 2,866 3,729 4,917 6,395 8,314 10,807 14,052 18,270
2. Peak Demand (Mw) 322 (419) 545 709 935 1,216 1,581 2,055 2,672 (3,474)
3. Firm Capacity (MW)
Basis 322 322 322 322 322 322 322 322 322 322Pulo Gadung (GT) - 20 20 20 20 20 20 20 20 20Jakarta (GT) - 40 40 40 40 40 40 40 40 40West Java (GT) - - 40 40 40 40 40 40 40 40Cirebon (GT) - - 40 40 40 40 40 40 40 40Jakarta (GT) - - 40 40 40 40 40 40 40 40Gambir (GT) - - 15 15 15 15 15 15 15 15Jakarta (GT) - - 200 200 200 200 200 200 200 200Muara Karang I/II (S) - - - 200 200 200 200 200 200 200Muara Karang III (S) - - - - 100 100 100 100 100 100Muara Karang IV/v (S) - - - 400 400 400 400 400Kamojang (Geothermal) - - - _ - 30 30 30 30 30Cilincing (S) - - - - - - 600 600 600 600Cirebon (S) - - - - - - - 400 400 400Saguling (H) - - - - - - - - 300 600Cimanuk (H) - - - - - - - 200Sempor (H) - - - - - 1 1 1 1 1Juanda VI (H) - - - 25 25 25 25 25 25 25
Total Firm Capacity 322 382 717 942 1,042 1,473 2,073 2,473 2,773 3,273 ox
a
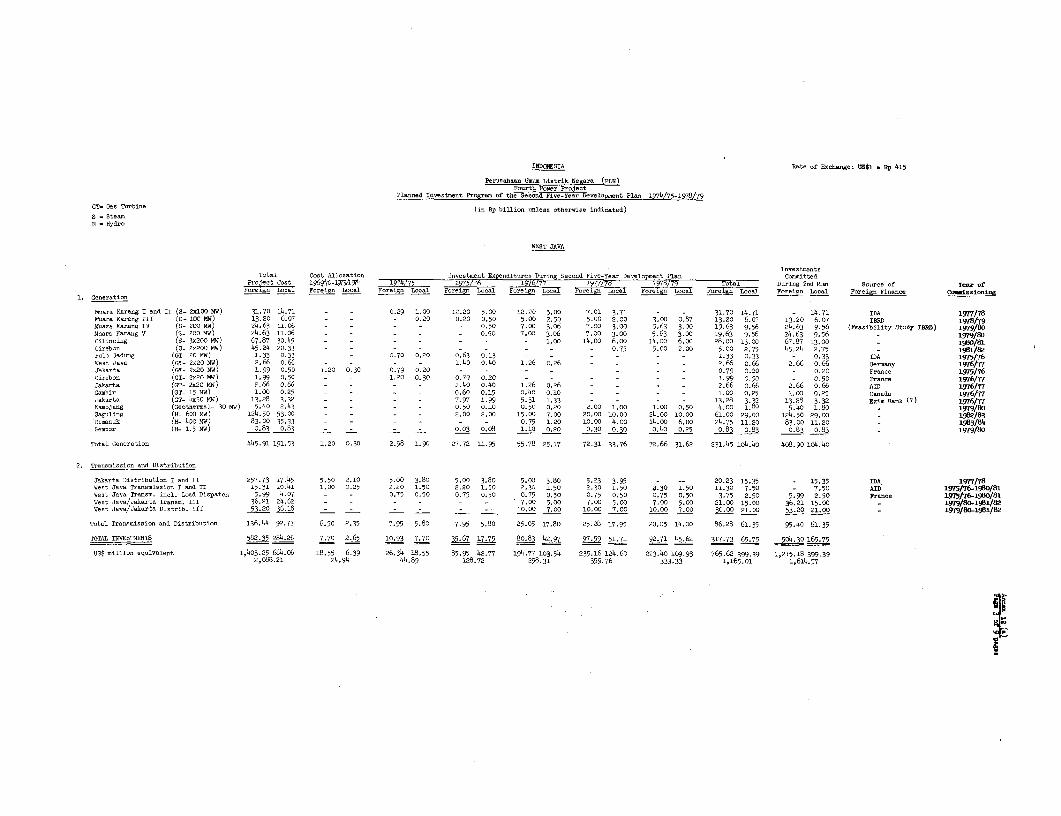
INDONESIA Rate of Exchaege: 2s$il _ Rp 415
Per-nelnen OUoc Listrik Negcra (PTN)F-othi Pone Pr-et
Planned In-estment Program of the Second Fine-Year DeTelopoeot Plne 1974/75-1978/79
GT= G.. Turbine (in Hp billion unleas othereine indioated)
S = SteamH . Hydro
WEST JAVA
Total Coet Allocation Onoentoent Iccveaoitoree During Second Five-Year D-eelop-ent Plan to=ittedProJect Coot o9 69 'o-i9 7 349t4 1974/75 1975/76 1903/77 1977/7 1978/79 Total Doriog 2ed Pie. Scarce of fear of
Foreigc local Foreign LooI Foreign local Foreign local Foreign LonD Foreign local F ig l oreign Locl Foreign local Foreign Finance Caiaaioaiag1. Generation
Monra Kareng I and II (S- 2xlO0 MW) 31.70 14.71 - 0.29 1.00 12.20 5.00 12.20 5,00 7.01 3,71 - - 31.70 14.71 - 14.71 IDA 1977/78Mearn Karcog III (S- 10C mw) 13.20 6.o - 0.20 0.20 0.50 5.00 2.50 5.00 2.00 3.00 0.87 13.20 6.07 13.20 6.07 IBRD 1978/79Marn Ks-rang IV (S- 200 MW) 24.63 l.0 - - - - - 0.50 7.00 3,6 7.00 3.00 5.63 3.00 19.63 9,56 24,63 9.56 (Feasibility Stody TaNED) 1979/80Macro K-rang V (S- 200 MW) 24.63 11.06 - - - - - 0.50 7.00 3.06 7.00 3,00 5.63 3.00 19.63 o.56 24.63 9.56 _ 19798/C lin-ing (S- 3x200 MW) 67.87 30.49 -- - 1.00 14.oo 6,oo 14.oo 6.oo 28.00 13.00 67.87 13.00 - 1980/81Cireion (S- 2x200 MW) 45.24 20.33 - 0.75 5.00 2.00 5.00 2.75 45.24 2.75 _ i981/82PoloOnGdung (GT- 20 MW) 1.33 0.33 - - 0.70 0.20 o.63 0.13 - _ - - - _ 1.33 0.33 - 0.33 IDA 1975/76Wont Java (GT- 2x20 MW) 2.66 o.66 - - - - 1.40 o.4o 1.26 0.26 - - - - 2.66 o.66 2.66 o.66 Germey iw6/77J.k-rta (GT- 2x20 MW) 1.99 0.50 1.20 0.30 0.79 0.20 - _ _ - - _ _ _ 0.79 0.20 - 0.20 Fr--ne 1975/76Cirebon (GT- 2x20 MW) 1.99 0.50 - - 1.20 0.30 0.79 0.20 - _ _ _ _ - 1.99 0.50 - 0.50 yranoe 1976/77Jearkta (GT- 220 MW) 2.66 o.66 - - _ - .o0 0o.4o 1.26 0.26 - - - - 2.66 o.66 2.66 o.66 AID 1976/77Gobnir (GT- 15 MW) 1.00 0.25 - - _ - o.6o 0.15 o.4 0.10 - - - - 1.00 0.25 1.00 0.25 Canada 1976/77Jakarta (GT- 4x50 MW) 13.28 3.32 - _ _ - 7.97 1.99 5.31 1.33 - _ - - 13.28 3.'2 13.28 3.32 Exim Bank (?) 1976/77Ktojang (Geothermal- 30 MW) 5.40 2.43 - _ _ - 0.50 0.10 0.50 0.20 2.00 1.00 1.00 0.50 4.00 1 8o 5.40 1.80 _ 1979/80Ssguling (H- 600 Mw) 124.50 53.00 - _ _ - 2.00 2.00 15.00 7.00 20.0C 10.00 24.oo 10.0 6i.oo 29.00 124.50 29.00 1982/83
Cimmnuk (h- 400 MW) 83.00 35233 _- - 0.75 1.20 10.0o 4.oo i4.oo 6.oo 24.75 11.20 83.00 11.20 _ 1963/84Sempor (h- 1.5 MW) 0.83 0.83 - O - - 0.03 o,.8 1.10 0,20 0.30 0.30 o.4o 0.25 0.83 0.83 o.83 0.83 _ 1979/80
Totnl OC-crotion 445.91 191.53 1.20 0.30 2.98 1.90 27.72 11.95 55.78 25.17 72.31 33.76 72.66 31.62 231.45 104.40 408.90 104.40
2, Transm6sOn nad Disttibution
Jakarta Dictribution I nad 2I 257.73 17.45 5.50 2.10 5.00 3.80 5.00 3.80 5.00 3.80 5.23 3.95 - -- 20.23 15.35 - 15.35 IDA 1977/78Went Jeco Trancoinioca I -nd II 15.31 10.41 1.00 0.25 2.20 1.50 2.20 1.50 2.30 1.50 2.30 1.50 2.30 1.50 11.30 7.50 - 7.50 AID 1975/76-19bO/81West Joan Tran,-. incl. Land Diopatrh 5.99 4.07 - - 0.75 0.50 0.75 0.50 0.75 0.50 0.75 0.50 0.75 0.50 3.75 2.50 5.99 2.50 France 1975/76-1980/81Went J-vc/Jakartn Trsnnm. IIT 36.21 24.62 - _ _ _ _ - 7.00 5.00 7.00 5.00 7.00 5.00 21.00 15.00 36.21 15.00 _ 1979/80_1981/82Went J_vc/Jck_rtc Dietrib. III 53.20 36.10 - _ _ _ _ - 10.00 3.00 10.00 7.00 10.00 7.00 30.00 21.00 53.20 21.00 _ 1979/80-1981/82
Totnl Tr-nmmission -nd Distribution 136.44 92.73 6.50 2.35 7.95 5.80 7.95 5.80 25.05 17.80 25.28 17.95 20,05 14.00 86.28 61.35 95.40 61.35
TOTAL ITN7STIENTS 582.55 284.26 7.70 2.65 10.93 7.70 35.67 17.75 80083 42.97 97.59 51.71 92.71 45.62 317.73 65.75 504.30165.75
0S$ million equivalent 1,403.25 684.06 18.55 6.39 26.34 18.55 85.95 42.77 194.77 103.54 235.16 124.60 223.40 109.93 765.62 399.39 1,215.18 399.392,000.21 24.94 44.89 128.72 298.31 359.76 333.33 1,165.01 1,614.57

INDONESIA
Perusahaan Umum Listrik Negara (PLN)Fourth Power Project
Planned Investment Program of the Second Five-Year Development Plan 1974/75-1978/79
GT: Gas TurbineS SteamH Hydro
CENTRAL JAVA
Generation, Peak Demand and Firm Capacity
1974/75 1975/76 1976/77 1977/78 1978/7 1979/8o 1980/81 1981/82 1982/83 1983/84
1. Generation (GWh) 342 421 578 762 1,000 1,261 1,604 1,867 2,630 3,415
2. Peak Demand (MW) 65 80 110 145 190 240 305 355 500 650
3. Firm Capacity (MW)
Basis 91 91 91 91 91 91 91 91 91 91Semarang I and II (s) - - - - 100 100 100 100 100 100Semarang III and IV (S) - - - - - - - - 400 400Cilacap I and II (S) - - - - - - 55 110 110 110Semarang (GT) - - 20 20 20 20 20 20 20 20Cilacap (GT) - - 20 20 20 20 20 20 20 20Dieng (Geothermal) - - - - - 5 5 5 5 5Garung (H) - - - - 20 20 20 20 20 20Diesel - - 6 6 6 6 6 6 6 6Semarang (GT) _ _ 20 20 20 20 20 20 20 20
Total Firm Capacity 91 91 157 157 277 282 337 392 792 792
Vo
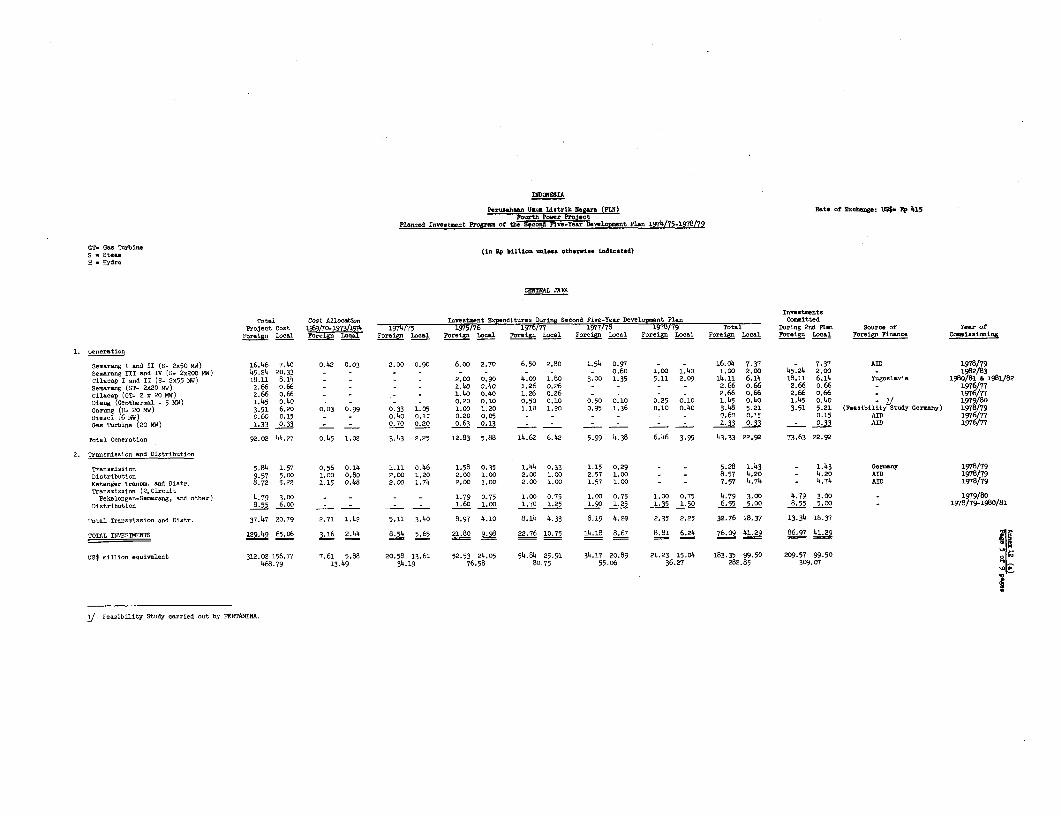
Pr-a.han Umom Listrik Negara (PLN) Rate of -hange: U3$. Rp 415pourth Po er Presett
Planned Inveotnent Frogram of the LS&c3rTpFl.Year eoelo2mnt Plan 1974/75-1978/79
sT- 0. Trbim (i. Rp billita snl*s oth.eI.. irdic.ted)S S t.-sH . Hydrc
CETIFAL JAVA
InyestcentsTotal Co-t Alloc-tion Investment Eopenditure L'uring Second Five-Year Deveoplment Plan Co.nitted
ProJect Cost 19;97O-1973 9l4 1974T75 1975/76 1976/77 1977178 197D/79 Total DOring 2nd FnP Source of Year of
Foreign Local i Local Foreign Local Foreign L.oal Foreign Local Foreign Local. Foreign Local Foreign Local Foreign Woeal Foreign Finance Comtnsioning
1. oeneration
Seo-rang I and II (s- 2x50 MW) 16.46 7.40 0.42 0.03 2.00 0.90 6.00 2.70 6.50 2.80 1.54 0.97 _ _ 16.04 7.37 - 7.37 AID 1978/79
Senarang III snd IV (S- 2x200 MW) 45.24 20.33 - - - - - - - - - o0.60 1.00 1.40 1.00 2.00 45.24 2.00 - 1982/83
CilacFp I and II (S- 2x55 ow) 18.11 8.14 2,00 0.90 4.00 1.80 3.00 1.35 5.11 2.09 14.11 6.14 1811 6.14 Yogoslavia 1980/81 & 1981/82
Se-arang (GT- 2x20 MW) 2.66 o.66 _ _ _ 1.40 0.40 1.26 0.26 - _ _ - 2.66 o.66 2.66 o.66 - 1976/77
Cila..p (GT- 2 0 20 MW) 2.66 o.66 _ - - - 1.40 o.40 1.26 0.26 - - - - 2.66 o.66 2.66 0.66 _ 1976/77
Dieng (Ocother-l - 5 MW) 1.45 0.40o 0,20 0.10 0.50 0.10 0.50 0.10 0.25 0.10 1.45 0.40 1.45 0.40 - /1979/80Garung (H- 20 MW) 3.51 6.20 0.03 0.99 0.33 1.05 1.00 1.20 1.10 1.20 0.95 1.36 0.10 0.40 3.48 5.21 3.51 5.21 (Feacibility Study Gerany) 1978/79DieseI (6 Mi) 0.6c 0.15 - - 0.40 o0.1 0.20 0.05 - - - - - - 0.6G 0.!' 0.15 AID 1976/77
Ga. Turbine (20 MW) 1.33 0.33 - _ 0.70 0.20 0.63 0.13 _ - _ _ _ _ 1.33 0.33 - 0.33 AID 1976/77
Total Generstion 92.02 44.27 0.45 1.02 3.43 2.25 12.83 5.88 14.62 6.42 5.99 4.38 6.46 3.99 43.33 22.92 73.63 22.92
2. Tran..i..ion nd Distribution
Trano,nioion 5.84 1.57 0.56 0.14 1.11 o.46 1.58 0.35 1.44 0.33 1.15 0.29 - - 5.28 1.43 - 1.43 Gacoany 1978/79
Distribution 9.57 5.O 1.00 0.80 2.00 1.20 2.00 1.00 2.00 1.00 2.57 1.00 - - 8.57 4.20 _ 4.20 AID 1978/79
Ketenger T-anna. Ond Di0r. 8.72 5.22 1.15 o.48 2.00 1.74 2.00 1.00 2.00 1.00 1.57 1.00 - - 7.57 4.74 - 4.74 AID 1978/79
Trsnsmiasion (2.Cl-roitPekboongo-.Se-arnog, nod other) 4.79 3.00 - - _ _ 1.79 0.75 1.00 0.75 1.00 0.75 1.00 0.75 4.79 3.00 4.79 3.00 _ 1979/80
Distribution 8.55 6 o _ _ - 1.60 1.00 1.70 1.25 1.90 1.25 1.35 1.50 6.55 5.00 8.55 5.00 _ 1978/79-1980/81
Total Trononission and Dittr. 37.47 20.79 2.71 1.42 5.11 3.40 8.97 4.10 9.14 4.33 8.19 4.29 2.35 2.25 32.76 18.37 13.34 18.37
TOTAL INVES7MNTS 129.49 65.06 3.16 2.44 8.54 5.65 21.80 9.98 22.76 10.75 14.18 8.67 8.81 6.24 76.09 4129 86.97 41.29
us$ nillion equivalent 312.02 156.77 7.61 5.88 20.58 13.61 52.53 24.05 54.84 25.91 34.17 20.89 21.23 15.04 183.35 99.50 209.57 99.50
468.79 13.49 34.19 76.58 80.75 55.06 36.27 282.85 309.07
F Feasibility Study c-rried out by PRRTAMIIA.

INDONESIA
Perusahaan Umum Listrik Negara (PLN)Fourth Power Project
Planned Investment Program of the Second Five-Year Development Plan 1974/75-1978/79
GT: Gas TurbineS Steam EAST JAVAH Hydro
Generation, Peak Demand and Firm Capacity
1974/75 1975/76 1976/77 1977/78 1978/79 1979/80 1980/81 981/82 1982/83 1983/84
1. Generation (GWh) 652 788 972 1,210 1,514 1,892 2,286 2,733 3,047 3,257
2. Peak Demand (MW) 124 150 185 230 288 360 435 520 580 620
3. Firm Capacity (MW)
Basis 188 188 188 188 188 188 188 188 188 188Karang Kates III (H) - - 35 35 35 35 35 35 35 35SurabaJa I and II (S) - - - 50 100 100 100 100 100 100Wlingi I and II (H) - - - - - 27 54 54 54 54Gresik (S) - - - - - 100 200 200 200 200Diesel 5 5 5 Gresik (GT) - - 60 60 60 60 60 60 60 60
Total Firm Capacity 188 193 288 338 388 515 642 642 642 642

Rate O? Eschaew US*$1. Rp 415
INDCSIA
P usahamn Lmxn Listrik Negar (PLII)
Planned Invcstnnt I Nc - Pt Mn 1974/751978/7
(tn Rp billp ite. =to* t i.ee iadteatd)
GT: GsJ TurbineS StoneH NYdro
EAST JAVA
rIvesteents- otal Cost Allo.atio- InY .toeent Expenditoren D.ning Second Fiy -Yer Devloneet a Co_itted
Project Cost 1969/70.1973/74 1974/75 1975/7' 1976/ 1977/78 1973/79 Total During 2nd Ple Source or Yeer ofloraign total Foreign Local Forign Local Foreign Local Foreign Local Fnrrign Local Forign Locs.t Foreign Locl. Foreign Local Foreign Finnce Cominionieg
1. Generatlion
Karsng Katen III (1N- 35 4w) 4.53 4.03 - 1.36 1.00 1.19 1.62 0.85 1.91 0.63 - - - - 4.53 2.67 _ 2.67 japan 1976/77Surab.ja I and II (S- 2x50 MW) 16.46 7.40 0.62 0.17 2.40 0.80 3.50 0.90 3.50 1.20 3.60 2.20 2.84 2.13 15.84 7.23 _ 7.23 Japan 1977/78 nd 1978/79Wlingi I and II (H- 2027 IfW) 12.04 8.oo - - 1.03 2.00 2.50 1.60 2.00 1.20 2.30 1.30 2.41 o.80 10.24 6.90 12.04 6.90 Japan (I) 1979/80 end 1980/81Grasik (S- 2x100 MW) 27.49 12.35 _ _ - 1.00 3.00 1.60 5.00 1.80 5.20 1.90 5.29 2.05 18.49 8.35 27.49 8.35 (Feaoibility Study J.pan)lg79/80 and 1980/81Di..el (4.5 M1w) 0.40 0.16 0.10 0.05 0.20 o.06 0.10 0.05 - - - - - _ 0.30 0.11 - 0.11 Netherland. 1975/76GreSik (GT- 3.20 MW) 3.98 1 _0 _ __ -- 2.10 0.60 1.88 0.40 --- _ - 39 1- .O 3. 1.00 _ 1976/77
Tot.1 Generation 64.90 32.94 0.72 1.58 4.63 5.05 12.82 5.60 14.29 5.23 11.10 5.40 10.54 4.98 53.38 26.26 43.51 26.26
2. Tr-n.einsion nod Distributioo
Transeidsion I 4.47 2.80 1.20 0.60 2.40 1.60 o.87 o.60 - - - - - 3.27 2.20 - 2.20 Japan 1975/76T-nsnoleion II (incl. Distr.) 8.30 4.20 - - 1.80 1.00 2.00 l.00 2.00 1.00 2.00 100 0.50 0.20 8.30 4,20 8.30 4.20 Japan 1978/79Trnomist.ion IV cnd V 12.04 6.10 - - - - 2.50 1.25 2.50 1.25 2.50 1.25 2.54 1.35 10.04 5.10 12.04 5.10 - 1980/81Distribation IV 3.32 1.70 __ -_ - 0.50 0.25 0.60 0.40 0.90 0.50 0.80 0.25 2.80 1.40 3.32 1.40 - 1980/81
7otal Trns=issooin and Dietribution 28.13 14.80 1.20 0.60 4.20 2.60 5.87 3.10 5.10 2.65 5.40 2.75 3,84 1.80 24.41 12.90 23.66 12.90
TOTAL IN4Sv31ENTS 93.03 47.74 1.92 2.18 8.83 7.65 18.69 8.70 19.39 7.88 16.50 8.15 14j 6.78 7 7.9 2 67.17 M916
92$ elioon- equalent C 224.17 115.04 4.63 5.25 21.28 18.43 45.04 20.96 46.72 18.99 39.76 19.64 34 .65 16.34 187.45 94.36 161.86 94.36339.21 9.88 39.71 66.oo 65.71 59.40 50.99 281.81 256.22

INDoNEsIA
Perusahaan Umum Listrik Negara (PLN)Fourth Power Project
Planned Investment Program of the Second Five-Year Development Plan 1974/75-1978/79GT: Gas TurbineS SteamH Hydro
OTHER AREAS
Generation, Peak Demand and Firm Capacity
1974/75 1975/76 1976/77 1977/78 1978/79 1979/80 1980/81 1981/82 1982/83 1983/84
1. Generation (GWh) 841 1,052 1,315 1,578 1,970 2,470 2,996 3,574 3,944 4,470
2. Peak Demand (MW) 160 200 250 300 375 470 570 680 750 850
3. Firm Capacity (MW)
Basis 300 300 300 300 300 300 300 300 300 300West Sumatra (Diesel) - - 6 6 6 6 6 6 6 6Tonsea Lama (H) - - - - - 5 5 5 5 5North Sulawesi (Diesel) - 9 9 9 9 9 9 9 9 9Medan (GT) - - - 30 30 30 30 30 30 30Palembang (GT) - - 15 15 15 15 15 15 15 15Ujung Pandang (GT) - 15 15 15 15 15 15 15 15 15Medan I and II (S) - - - - - 55 110 110 110 110Bukit Asam (S) - - - - - - 100 100 100 100Ujung Pandang I and II (S) - - - _ - 50 50 50 50 50Medan (GT) - - 40 40 40 40 4° 40 40 4°Medan (GT) - - 15 15 15 15 15 15 15 15Palembang (GT) - - 15 15 15 15 15 15 15 15Ujung Pandang (GT) - - 15 15 15 15 15 15 15 15East Kalimantan (GT) - - 60 60 60 60 60 60 60 60Rungkut (GT) - - 25 25 25 25 25 25 25 25Batang Agam (H) - - 7 7 11 11 11 11 11 11Manizljau (H) - - - - - - 45 45 45 45Tes (H) - - - - 4 4 4 4 4 4Riam Kanan III (H) - - - - 10 10 10 10 10 10 Sawangan (H) - - - - - 10 10 10 10 m xSentani (H) - - - - - - 20 20 20 20 oAyung (H) - - - - - - 10 10 10 10 0 RMiero Hydro - - - - 9 9 9 9 9 9Scattered Diesel - 10 10 30 30 70 90 100 120 135
Total Firm Capacity 300 334 532 582 609 759 1,019 1,029 1,049 1,064 m
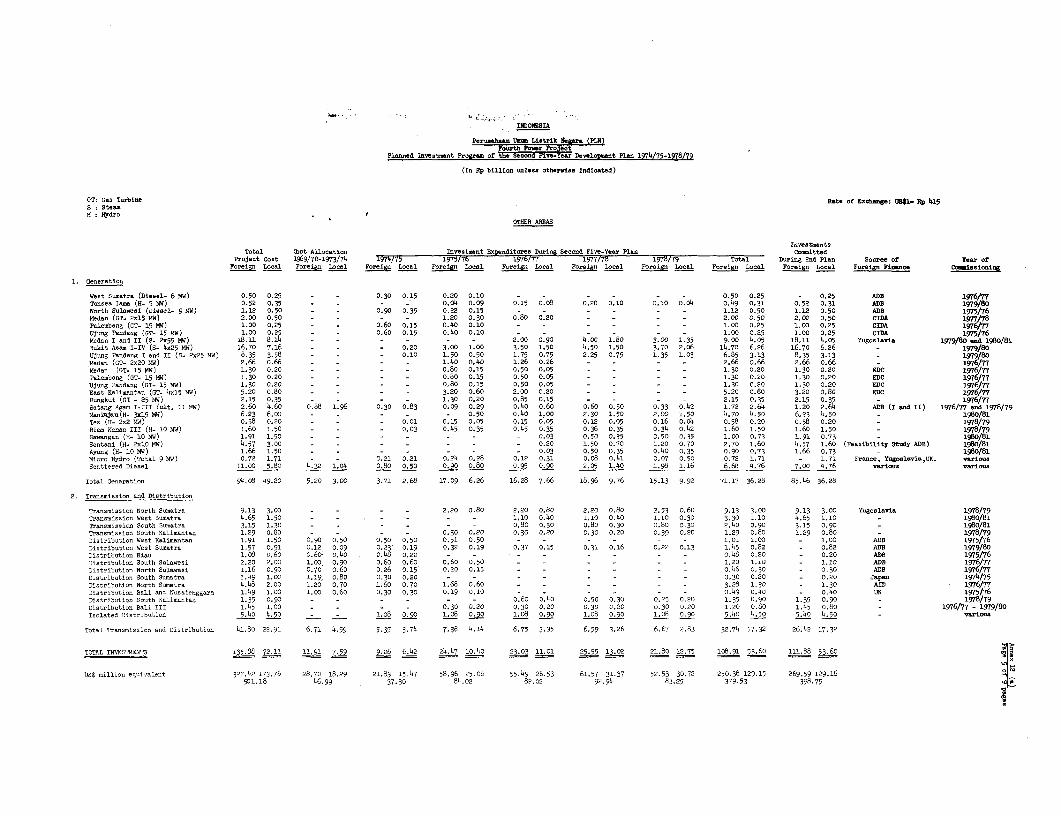
EINDNSoIA
feroasahaaUesaL1etrik1te5 PLfN)
PlanedInsetnatProramof h1S dP:rN-: eWe Devalopfmnt Plan 19724/75-1978/79
(in Hp billion o-les. otherwise Iodictid)
0:Gs%Tmbo Rate of REohangs tS*1- Hp 2s15
H1 Hydro SOTHER AREAS
Total Qbet Alienation Inestment Eopenditon Soiag Seoond Fiv-Year Plan ComittedProj-ot Coat 1969/70-1973/74 197's/75 1975/76 1997/77D 1977/70 1978/79 Total Dcring 208 Plan Soorn of Year of
Foreign Loonl. Forign Local Foreign Inoal Foreign fLoral Foreign Locol Forein lar Foreig loonal Foreiga Loa], Foreign bnoal Forign Finann O.0oaieoa.A
G. Geeration
West Sumatra (Diesol- 6 Mw) 0.50 0.25 - - 0.30 0.15 0.20 0.10 - - - - - - 0.50 0.25 - 0.25 ASH l976/77Ton..n Lan CH- 5 mw) 0.52 0.35 - - - - 0.04 0.09 0.15 o.08 0.20 0.10 0.10 o.04 0,49 0.31 0.52 0.31 ADB 1979/80North SoloIesi (Dito..l- 9 M7) 1.12 0.50 - - 0.90 0.35 0.22 0.15 - - - - - -1.12 0.50 1.12 0.50 ADH 1975/76MeaGon (GT- 2.15 MW) 2.00 0.50 - - - - 1.00 0.30 o.8o 0.20 - -- -2.00 0.50 2.00 0.50 CIAS19/7
Polevibang (is- 15 Mw) 1.00 0.25 - - 0.60 0.15 0.40 0.10 - - - - - - 1.00 0.25 1.00 0.25 015k~~~~~~~~~~~~~~~~~~~~~~~~~~~~~~~~~~~~~~~~100 ,2 o40 o.i - - -DO 0.5 .00 0.5 IDUJIOg Poodoog COT- 15 Mw) 1.00 0.25 -0 .6o 0.15 o4 0. 100- - -- - 1.00 0.25 1.00 0.25 aIDA 1975/76Modan I and II (0- 2055 Mw) jill 8.i4 - - - - - - 2.00 0.90 4.00 i.80 3.00 1.35 9.0o 4.05 i8.ii 4.05 Sogonla-ia, 1979/80 ond 19B0/8iBokit Aeon I-TV (0-
4o25 Mw) 16.70 7.16 - - - 0.20 3.00 1.00 3.50 1.50 4.50 1.50 3.70 2.06 14.70) 6.26 16.70 6.26 -1979/80
Ojong P-id-g I and II (S- 2c25 mw) 8.35 3.58 - - - 0.10 1.50 0.50 1.75 0.75 2.25 0.75 1.35 1.03 6.85 3.13 8.35 3.13 -1979/80oedam (Gs- 2o20 MW) 2.66 o.66 - - - - 1.4o 0.40 1.26 0.26 - - - - o.6 o6 .6 o6 96f
Medac (02- 15 MW) 1.30 0.20 - - - - oS 0.15 0.50 0.05 - -- -1.30 0.20 1.30 0.20 17DC 1976/n7Pale,nbaog (OsT- 15 mw) 1.30 0.20 - - - - oS 0.15 0.50 0.05 - -- -1.30 0.20 1.30 0.20 EDO 1976/f7OJJng Poodang CoT- 15 Mw) 1.30 0.00 - - i8i 0.15 0.50 0.05 - -- -1.30 0.20 1.30 0.20 EDC 1976/77E.at Kaihota,n (Gs- 4sc15 Mw) 5.20 o.8o -3 .20 o.6o 0.00 0.20 - -- -5.20 o.8o 3.20 oSo0 EDO on76/77R-ngkot (GT - 25 Mw) 2.15 0.35 - - - - 1.30 0.20 0.85 0.15 - -- 2.15 0.35 2.15 0.35 - 196/77Btatng Ag.e I-sII Colt. 112017) 2.6o 4.6o 0.80 i.96 0.30 0.83 0,09 0.29 o.4o MO6 o.D 0.50 0.33 o.42 1.72 2.64 1.20 2.64 ARE (ad is) 1976/7l an 1978/79MaoinJan)H- 3615 MW) 6.23 6.oo - - - - 0.50 OM4 1.00 2.30 1.50 2.00 w.50 4.70 4.5o 6.23 4.5o - 198/81Tea CH- 2o2 Mw) 0.58 0.20 - - - 0.01 0.15 0.05 0.15 0,05 0.12 0.05 0.16 O.A o.58 0.20 o.58 0.20- 1978/79Siam Koo.. ni II s(- 10 MW) 1,60 1.50 - - - 0.03 o.45 0.35 0.45 0.35 0.36 0,35 0.34 0.42 1.60 1.50 1.60 1.50 -1-978/79Snoagam CH- 10 Mw) 1.91 1.50 - - - - -- 0.03 0.50 0.35 0.50 0.35 1.00 0.73 1.91 0.73 -1980/81
ontani (H- 2nl0 MW) 4.57 5.00 - - - - - -- 0.20 1.50 0.70 1.20 0.70 2.70 i.6o 4.57 i.60 (CoSahibiity Stody ASS) 198o/8iAy-og (H- 10 Mw) i.66 1.50 o - 0.03 0.50 0.35 o.4o 0.35 0.90 0.73 1.66 0.73 -1980/81Micro Hyd-o CTotal 9 MW) 0.72 1.71 - - 0.21 0.21 o.24 i.2i 0.12 0.31 o.o8 o.41 0.07 0.50 0.70 1.71 - 1.71 f-anc, Yngcsla-ha,Ul. earoscScatterd SoDi . 11.00 5.8o 4.32 1.04 o.8o 0.50 0.90 o.8o 0.95 0.90 2.0 i.4o 1.98 i.16 6.68 4.76 7.00 4.y6 varios -arosc
Total Gae.oratto 94.08 49.20 5.20 3.00 3.71 2.68 17.09 6.26 16.28 7.66 18.56 9.76 15.13 9.90 71.17 36.28 85.46 36.28
2. Tc-ontcct- and Distirthtion
ToocotnNot. ar .1 .0 - - -2.20 0.80 2.20 tt80 2.20 o.9o 2.53 o.6o 9.13 3.00 9.13 3.00 Togoalas,la 1978/79Tranonioci Woo Sonr 4.65 1.50 - .10 OM4 1.10 o.4o 1.10 0.30 3.30 1.10 4.65 1.10o 1980/81froc-osooo Soo'th Suatra 3.15 1.30 - .8o 0.30 o.6o 0.50 o.8o 0.50 0.40 0.90 3.15 0.90 -1980/81
Transi-ico Soo,th tKllanstan 1.05 o.8o - - - 0.50 0.20 0.30 0,20 0.32 0.22 0.39 0.00 1.29 cOo0 1.29 o.8o 1978/79Diotrlhuti-n Wont Kalinotan 1.91 1.50 0.90 0.50 0.50 0.50 0.51 0.50 1.01 1.00 - 1.00 ADS 1975/76Diotrihottoc Moot Sumtra 1.57 0.91 0.12 0.09 0,23 0.19 0.30 0.19 0.37 0.15 0.31 o.i6 0.22 0.13 i.45 0.82 - 0.82 ASS 1979/80Sintribotion Sino i.o8 MD6 0.6o. o.4o 0 .48 0.22-it-o.4 0.20o 0.20 ADS 1975/76D.otihot Io Sooth Solawoi 2.20 2.00 1.00 0.90 26 o.6o o.6o 0O .50 1.20 t.iO 1.10 ADB 1976/77S),tstrbhti- North Solasceo i.o6 0.90 0.70 o.6o 0,26 0.15 0.20 0.15 o.46 0.30o 0.30 AD5 i976/77Dbntrlibsto- Sooth Soont- i.49 1.00 1.19 o.82 0.30 0.20-- -0.30 0.20 - 0.20 Japan 19714/75Dictribotioo North S-ntr- 4.48 2.00 1.20 0.70 i±60 2.70 1.68 o.6o 3.28 1.30 1.30 AID 1976/77Dio:trtbotioc Sail and Noonto-ggara 1.49 1.20 1.00 0.6o 0.30 0.30 0.19 2.10 o .49 0.40 - o.40 UK 1975/76Diotrib,tioo Sooth taliontno 1.35 0.90 - - - - - - o.6o 2.40 0.50 0.30 0.25 0.20 1.35 0.90 1.35 0.90 -1978/79Dicto ihottoc Soi III 1.45 1.00 - . - - 0.30 0.20 0.30 0.20 0.30 0.20 0.30 0.20 1.20 o.60 1.45 0.0D 1976/77 - l979/80Ioolatcd DOtatihotloc 5.40 4.50 - .o8 0.90 i.00 0.90 1.o6 0.90 o.o6 0.90 s.,o8 0. 90 5.40 4L.50 5.40 4.50 - vrlos
sotal -ronolond Diotriboti-n 41.80 20.91, 6.71 4.59 5.35 3.74 7.38 4.14 6.75 3.35 6.59 3.26 6.67 2.83 32.74 17.32 26.42 17.32
TOTAL INVESTMENTS 135.0 72.10 02.91 7.59 9.26 6.42 2.710.40 23.03 11.01 25.55 13.0 oi8 110 2.75 106.91 53.60 111.88 5360
Us$ millioc aoiv loot 327.42 173.76 28.72 25.29 21.83 15.47 58.9 25.o6 55.49 26.53 61.07 31.37 02.53 30.72 250.38 129.15 269.59 129.16p901.18 46.99 37.30 B4.02 82.02 92.94 83.25 379.53 398.75
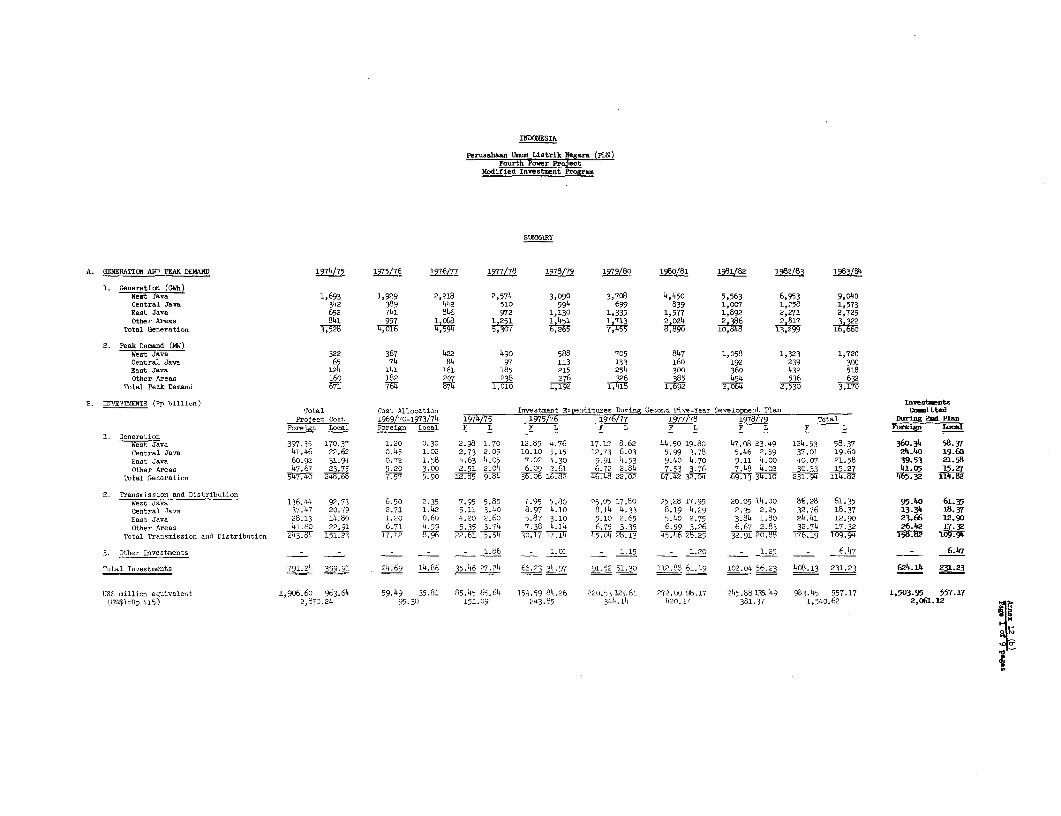
INDONESIA
Perusahaan Umum Listrik Negara (PNi)Fourth Pwer Project
Modified Investment Program
A. GENERATION AND PEAK DEMAND 1-974/75 1975/76 1976/77 1977/78 1978/79 1979/80 1980/81 1981/82 1982/83 1983/84
1. Generation (GWh)West Java 1,693 1,929 2,218 2,574 3,090 3,708 4,450 5,563 6,953 9,o4oCentra1 Java 342 389 442 510 594 699 839 1,007 1,258 1,573East Java 652 741 846 972 1,130 1,335 1,577 1,892 2,271 2,725Other Areas 84i 957 1,088 1,251 i 451 713 2 024 2 386 2817 3 322
Total Generation 3,528 '4,016 4,594 5,307 177, 55O , 9t 108 13,299 1I3o8
2. Peak Demand (MW)West Java 322 367 422 490 588 705 847 1,058 1,323 1,720Central Java 65 74 84 97 113 133 160 192 239 300East Java 124 141 161 185 215 254 300 360 432 518Other Areas 16o 182 207 238 276 326 385 454 536 632
Total Peak Demand 671 7 87 1,010 1,19 1,418 1,692 2,064 2,530 3,170
BS. IT105S0sENTS (Rp billion) TeastmeotaTotal Cost Allocation Investment Expenditores During Second Five-Year Development Plan Coitted
Project Cost 1969/70-1973/74 1974/75 1975/76 _1976/77 197/78 1978/79 Total During 2rd PlanForeign Local Foreign Local F L F L F L F L F L F L Foreign Lcal
Weste Java 397.35 170.37 1.20 0.30 2.98 1.70 12.85 4.76 17.12 8.62 44.50 19.80 47.08 23.49 124.53 58.37 360.34 58.37Central Java 41.46 22.62 0.45 1.02 2.73 2.05 10.10 5.15 12.73 6.o3 5.99 3.78 5.46 2.59 37.01 19.60 24.40 19.60East Java 60.92 31.94 0.72 1.58 4.63 4.05 7.02 4.30 9.91 4.53 9.4o 4.70 9.11 4.oo 40.07 21.58 39.53 21.58Other Areas 47.67 23.75 5.20 3.00 2.51 2.04 6.09 2.61 6.72 2.84 7.53 3.76 7.48 4.o2 30.33 15.27 41.05 15.27
Total Generation 517.20 2 4 8.67 7T97 5.90 12.85 1 16 . 48 22,02 67.42 32.04 69.13 37410 231.92 114.82 4 65327
2. Transoission and DistributionWent Java 136.44 92.73 6.50 2.35 7.95 5.80 7.95 5.8o 25.05 17.80 25.28 17.95 20.05 14.00 86,28 61.35 95.40 61.35Central Java 37.47 20.79 2.71 1.42 5.11 3.40 8.97 4.10 8.i4 4.33 8.19 4.29 2.35 2.25 32.76 18.37 13.34 18.37East Java 28.13 14.80 1.20 o.6o 4.20 2.60 5.87 3.10 5.10 2.65 5.40 2.75 3.84 1.80 24.41 12.90 23.66 12.90
Other Areas 41.80 22.91 6.71 4.59 5.35 3.'74 7.38 4.14 6.75 3.35 6.59 3.26 6.67 2.83 32.74 17.32 26.42 17.32Total Transmission and Distristtion 243.84 151.23 17.12 27 i 22.61 1 5.54 30.17 17.14 28.13 5 28.25 32.91 820 88 176.19 109.94 15989 109.94
3. Other Investnents - - - - - 1.86 - 1.01 - 1.15 _ 1.20 - 1.25 - 6.47 - 6.47
Total TIvestnents 791.24 399.3 24.69 14.86 35.46 27.24 66.23 34.97 91.52 51.30 112.88 61.49 102.04 56.23 408.13 231.23 624.14 231.23
us$ illion equivalent 1,906.60 963.64 59.49 35.81 85.45 65.64 159.59 84.26 220.53123.61 272.00 148.17 245.88 135. 49 983.45 557.17 1,503.95 557.17(NS$1-Rp 415) 2,870.24 95.3D 151.09 243.85 344.14 420.17 381.37 1,542.62 2,061.12

INDONESIA
Perasahaan Umam Listrik Negara (PLN)Fourth Pover Project
GT,: Gas Turbine Modifed Investment Program
S SteamH HydrO
WEST JAVA
Generation, Peak Demand and Firm Capacity
1974/75 1975/76 1976/77 1977/78 1978/79 1979/80 1980/81 1981/82 1982/83 1983/84
1. Generation (GWh) 1,693 1,929 2,218 2,574 3,090 3,708 4,450 5,563 6,953 9,040
2. Peak Demand (MW) 322 367 422 490 588 705 847 1,058 1,323 1,720
3. Firm Capacity (MW)
Basis 322 322 322 322 322 322 322 322 322 322Pulo Gadung (GT) - 20 20 20 20 20 20 20 20 20Jakarta (GT) - 40 40 40 40 40 40 40 40 40West Java (GT) - - 40 40 40 40 40 40 40 40Cirebon (GT) - - 40 40 40 40 40 40 40 40Jakarta (GT) - - 40 40 40 40 40 40 40 40
Gambir (GT) - - 15 15 15 15 15 15 15 15Jalarta (GT) - - - - 50 50 100 150 150 150Muara Karang I/II (5) --- 100 200 200 200 200 200 200Muara Karang III (S) - - - 100 100 100 100 1200Muara Karang IV (S) - - - - - 2 200 200 200 200 1 S
Muara Karang V (s) - - - - - - - - 200 200 ANKamoJang (Geothermal) _ _ _ _ 30 30 30 30 30 0 Cilincing (S) - - - - - - - 200 200 400Saguling (H-600 MW) - - - - - 300Sempor (H-1. 5 MW) - - _ _ - 1 1 1 1 1
Juanda VI (25 MW) -:- 25 25 25 25 25 25
Total Firm Capacity 322 382 517 617 792 923 1,173 1,423 1,623 2,123
1/ This project will be carried out by the Jatiluhur Authority.
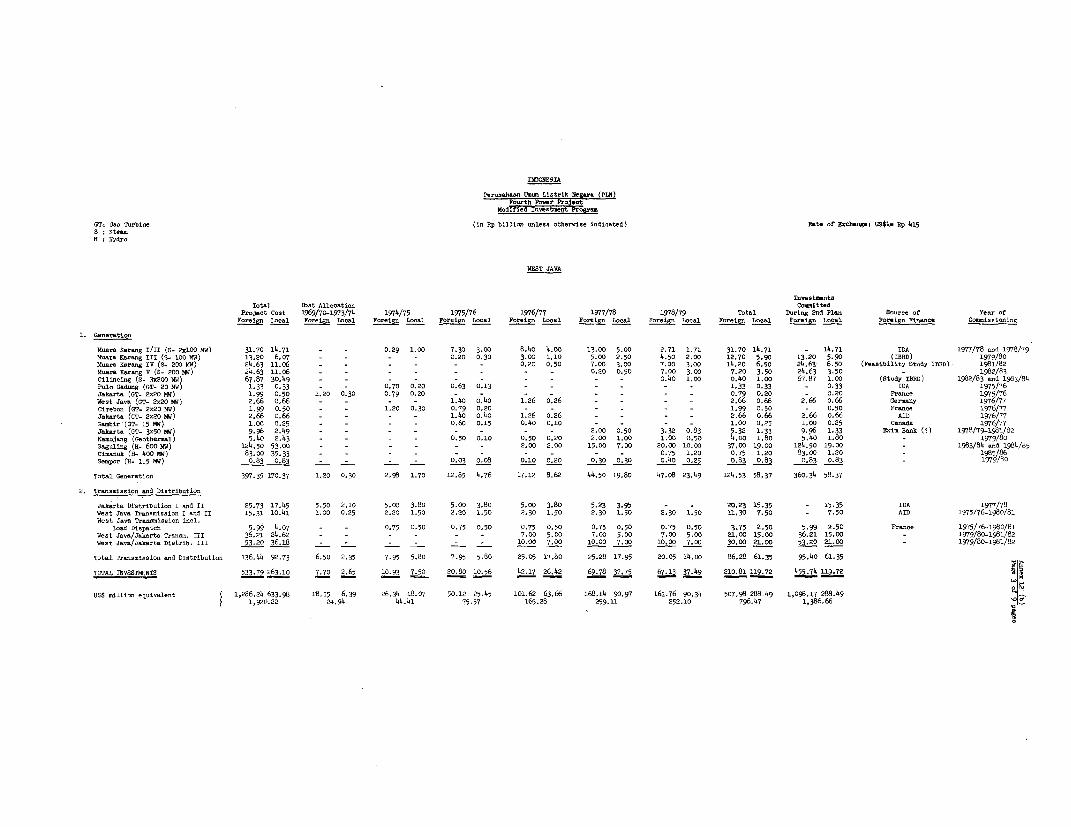
INDONESIA
Ferooahasn UDUI Liatrik Negar- (PLN)
Modlered Inveatntelt ProgreaGT: G.a Turbine (in Rp billion unleas other-iae indicated) ate of Exch-nge: US$iI Rp 415S Stea=H: Hydro
WEST JAVA
Total 00at Allocation ConmaittedProJect Coat 1969/70-1973/74 1974/75 1975/76 1976/77 1977/78 1978/79 Total .oring 2nd Plan Source of Year ofForeign Lonal Foreign loa Foeign Local FLocigc Lo.al Forign Local F ig Loc Foreign Local Foreign Loal Forign Lal Foreign Finance Coeaniooioning
1. Generation
Moara Kirang I/II (S- 2OO MW) 31.70 14.71 0.29 1.00 7.30 3.00 8.40 4.00 13.00 5.00 2.71 1.71 31.70 14.71 - 14.71 IDA 1977/78 =nd 1978/79Hoara Kitrag III (S- 100 14W) 13.20 6.o7 0.20 0.30 3.00 1.10 5.00 2.50 4.50 2.00 12.70 5.90 13.20 5.90 (IBRD) 1979/80MHara Karaog IV (S_ 200 tlW) 24.63 11.06 0.20 0.50 7.00 3.00 7.00 3.00 14.20 6.50 24.63 6.50 (Fe.atbility Stsdy 1BRD) 198)/82Muar Kararg V (S- 200 MW) 24.63 11.06 - - - - - - - - 0.20 0.50 7.00 3.00 7.20 3.50 24.63 3.50 1982/83Ciliicnng (S- 3x200 MW) 67.87 30.49 - - - - - - - - - - 0.40 1.00 0.40 1.00 67.87 1.00 (Stody IBRD) 1982/83 aDd 1983/84Pulo Gadung (GT- 20 MW) 1.33 0.33 0.70 0.20 0.63 0.13 1.33 0.33 - 0.33 IDA 1975/76Jakarta (GT- 2x20 MW) 1.99 0.50 1.20 0.30 0.79 0.20 - - -- - -0.79 0.20 - 0.20 France 1975/76Weat Java (GT- 2x20 MW) 2.66 0.66 - - - - 1.40 0.40 1.26 0.26 2.66 0.66 2.66 o.66 Geroaoy 1976/77Cirebon (GT- 2x20 MW) 1.99 0.50 1.20 0.30 0.79 0.20 - _ 1.99 0.50 - 0.50 Fr-ace 1976/77Jakarta (GT- 2n20 MW) 2.66 o.66 - - 1.40 0.40 1.26 0.26 2.66 o.66 2.66 o.66 AID 1976/77Ga-bir (GT- 15 MW) 1.00 0.25 0.60 0.15 0.40 0.10 _ _ _ _ 1.00 0.25 1.00 0.25 Canada 1976/77Jakarta (GT- 3x50 MW) 9.96 2,49 - - - - - - - - 2.00 0.50 3.32 0.83 5.32 1.33 9.96 1.33 Exia Bank (1) 1978/79-1981/82KanoJa"g (Geotheseal) 5.40 2.43 0.50 0.10 0.50 0.20 2.00 1.00 1.00 0.50 4.oo 1.80 5.40 1.80 _ 1979/80S.guling (H- 600 MW) 124.50 53.00 - - 2.00 2.00 15.00 7.00 20.00 10.00 37.00 19.00 124.50 19.00 _ 1983/84 and 1984/85Ciaanok (H- 400 MW) 83.00 35.33 _ 0.75 1.20 0.75 1.20 83.00 1.20 1 1985/86Se=por (H_ 1.5 MW) 0.83 0.83 0.03 o.06 0.10 0.20 0.30 0.30 0.40 0.25 0.83 0.83 0.83 0.83 _ 1979/80Total Generation 397.35 170.37 1.20 0.30 2,98 1.70 12.85 4.76 17.12 8.62 44.50 19.80 47.08 23.49 124.53 58.37 360.34 58.37
2. Transnieaion and Distribotion
Jakarta DstrDbution I and II 25.73 17.45 5.50 2.10 5.00 3.80 5.00 3.8o 5.00 3.80 5.23 3.95 - . 20.23 15.35 - 15.35 IDA 1977/78Weat Jav Tranemisalon I and II 15.31 10.41 1.00 0.25 2.20 1.50 2.20 1.50 2.30 1.50 2.30 1.50 2.30 1.50 11.30 7.50 - 7.50 AID 1975/76-1980/81Weat Java iransmboaton iol.load Diopatoh 5.99 4.07 - - 0.75 0.50 0.75 0o50 0.75 0.50 0.75 0.50 0.75 0.50 3.75 2.50 5.99 2.50 France 1975/76-1980/81Weet Java/Jckarta Transn. III 36.21 24.62 - - - - - . 7.00 5.00 7.00 5.00 7.00 5.00 21,00 15.00 36.21 15.00 _ 1979/80-1981/82West Java/Jaxsrta Dietrib. III 53.20 36.18 _ 10.00 7.00 10.00 7.00 10.00 7.00 30.00 21.00 53.20 21.00 _ 1979/80-1981/82
Total Tr-nsnineion and Distriboticn 136.44 92.73 6.50 2.35 7.95 5.80 7.95 5.80 25.05 17.80 25.28 17.95 20.05 14.00 86.28 61.35 95.40 61.35 ;TOTAL INVESTMENTS 533.79 263.10 7.70 2.65 10.93 7.50 2080 lo0.56 42.17 26.42 69.78 37.75 67.13 37.49 210.81 119.72 455.74 119.72
US0$ llion eolvaleot ( 1,286.24 633.98 18.55 6.39 26.34 18.07 50.12 25.45 101.62 63.66 168.14 90.97 161.76 90.34 507.98 288.49 1,098.17 288.491,920.22 24,94 44.41 75.57 165.28 259.11 252.10 796.47 1,386.66

INDONESIA
Perusahaan Umum Listrik Negara (PLN)Fourth Power Project
Modified Investment Program
CENTRAL JAVAGT: Gas TurbineS SteamH Hydro Generation, Peak Demand and Firm Capacity
1974/75 1975/76 1976/77 1977/78 1978/79 1979/80 1980/81 1981/82 1982/83 1983/84
1. Generation (GWh) 342 389 442 510 594 699 839 1,007 1,258 1,573
2. Peak Demand (MW) 65 74 94 97 113 133 160 192 239 300
3. Firm Capacity (MW)
Basis 91 91 91 91 91 91 91 91 91 91
Semarang I and II (S) - - 100 100 100 100 100 100
Cilacap I and II (S) - - - - - - 55 110 110 110Diesel - - 6 6 6 6 6 6 6 6Semarang (GT) - - 20 20 20 20 20 20 20 20
Garung (H) - - - - 20 20 20 20 20 20
Dieng (Geothermal) _ _ _ - 5 5 5 5 5 (X
Total Firm Capacity 91 91 117 117 237 242 297 352 352 352 r M

INDONESIA
Peraunhaan, Um Litrik Neg am (PIN)FovFthpo.r. ect
Modif i4 Inveat_nt Progr
(in RV billion -l... ethe-i.. indicated)CT: aOs Turbine
Rate of scsha.ge: U14. Rp 415
H: Hydro
CENTRAL JAVA
Total Cost Allocation Invetcent Expe.ditocen During Second FiP-Year Development Plan Co.-ittedProJect Coot 1969/70-1973/74 1974/75 1975/76 1976/77 1977/78 1978/79 Total luring 2od Plan Source of Year ofForeign local Foreign Local Forign Loca Foeign local Foreign Local Foreigo Local Foreign Loul Foreign local Foreigo Local Foreign Finance Ceniseioing1. Generation
Se.orn-g I and II (S- 2c50 MW) 16.46 7.40 o.42 0.03 2.00 0.90 6.oo 2.70 6.50 2.80 1.54 0.97 - - 16.o4 7.37 - 7.37 AID 1978/79Cilacap I dnd II (S- 2D55 Yw) i8.1i 8.14 - - - - 2.00 0.90 4.00 1.80 3.00 1.35 5.11 2.09 14.11 6.i4 18.ii 6.14 Yogoslavia 1980/81 and 1981/82Diesel (6 MW) 0.60 0.15 - - 0.40 0.10 0.20 0.05 - - - _ _ _ o.60 0.15 - 0.15 AID 1976/77Semareng (GT- 20 MW) 1.33 0.33 - - 0.70 0.20 o.63 0.13 - - _ 1.33 0.33 1.33 0.33 - 1976/77Garung (H- 20 MW) 3.51 6.20 0.03 0.99 0.33 1.05 1.00 1.20 1.10 1.20 0.95 1.36 0.10 CM4 3.48 5.21 3.51 5.21 (Fea-ibility Stody Gerany) 1978/79Dieng (G-other-al - 5 KW) 1.45 0.40 - - - _ 0.20 0.10 0.50 0.10 0.50 0.10 0.25 0.10 1.45 0.40 1.45 0.40 - j/ 1979/80Total Generation 41.46 22.62 0.45 1.02 2.73 2.05 10.10 5.15 12.73 6.o3 5.99 3.78 5.46 2.59 37.01 19.60 24.ui i9.6o
2. Traensdsion nod Distribition
Trsnsmision 5.84 1.57 0.56 0.14 1.11 o.46 1.58 0.35 1.44 0.33 1.15 0.29 - - 5.28 1.43 - 1.43 Occeanny 1978/79Distribution 9.57 5.00 1.00 0.80 2.00 1.20 2.00 1.00 2.00 1.00 2.57 1.00 - - 8,57 4.2o - 4.20 AID 1978/79Ketenger T.renm. and Distrib. 8.72 5.22 1.15 o.48 2.00 1.74 2.00 1.00 2.00 1.00 1.57 1.00 - - 7.57 4.74 - 4.74 AID 1978/79Troonsiosion (2. Circuit Pekilo-gno-Ser g, end ot) 4.79 3.00 - - - 1.79 0 75 1.00 0 75 1.00 0.75 1.00 0.75 4.79 3.00 4.79 3.00 1979/80Diotribtioto 8.55 6.00 - - 1.60 1.0 1.:70 1:.25 1.90 1.25 1.35 1.30 6.55 5.0 8.55 5.00 -1978/79-1980/81
Total Tr-oooiooioi =nd Ciotribotioc 37.47 20.79 2.71 1.42 5.11 3.40 0.97 4.10 8.i4 4.33 8.19 4.29 2.35 2.25 32.76 18.37 13.34 18.37TOTAL INVESTMEITS89 703 ,3 4.41 3.16 2.44 7.84 5.45 19.07 9.25 0087 i4.i8 8.07 7.81 4.84 69.77 37.97 37.74 37.97
us$ million equivlent 190.19 104.60 7.61 5.88 18.89 13.13 45.95 22.29 50.29 24.96 34.17 19.45 18.82 11.66 168.12 91.49 90.94 91.49294.79 13.49 32.02 68.24 75.25 53.62 30.48 259.61 182.43
i/ Fe"oibility Study curried out by PSRTAMI4A.

INDONESIA
Perusahaan Umum Listrik Negara (PLN)Fourth Power Project
Modified Investment Program
GT: Gas TurbineS SteamH Hydro
EA8T JAVA
Generation, Peak Demand and Firm Capacity
1974175 1975/76 1976/77 1977/78 1978/79 1979/80 1980/81 1981/82 1982/83 1983184
1. Generation (GWh) 652 741 846 972 1,130 1,335 1,577 1,892 2,271 2,725
2. Peak Demand (MW) 124 141 161 185 215 254 300 360 432 518
3. Firmn Capacity
Basis 188 188 188 188 188 188 188 188 188 188Karang Kates III (H) - - 35 35 35 35 35 35 35 35Surabaja I and II (S) - - - 50 50 100 100 100 100 100Wlingi I and II (H) - - - - 27 54 54 54 54Gresik (S) - - - - - - 100 100 200 200 t0Diesel - 5 5 5 5 5 5 5 5 5Gresik (GT) - - _- - 20 40 x
Total Firm Capacity 188 193 228 278 278 355 482 482 602 622 X
v 0

INDONESIA
Perthaa UL- Llstrlk N. .r (PLN)Paioalsfteo S neas. j e nts 9 Pr ag C I
(in Rp billion unless othrerisa iadtcated)OT: Gas Turbine Rate of Exchange: US$1--Rp 415S SteH: Hydro
EAST JAVA
Total Cost Allocation Co_ittedProJect Cost 1969/70-1973/74 1974/75 1975/76 1976/77 1977/78 1978/79 TotGl During 2nd Plan So.-c of Vear ofForeign Local Foreign Locl Foreign Loc-s Foreign Local Foreign Local Foreign Local ForeIg Local Foreign local Foreign Lonal Poreign Fin-nce omisLoniag
1. Generation
KXrang Kates III (Ho 35 MW) 4.53 4.03 - 1.36 1.00 1.19 i.62 0.85 1.91 0.63 _ _ _ _ 4.53 2.67 - 2.67 Japn 1976/77orbaja I sd II (S.- 2n50 aW) 16.46 7.40 o.62 0.17 2.40 oHo 2.H0 1.H0 3.00 1.10 3 10 2 20 2 70 2.00 14.00 6.90 - 6.90 Japan 1977/78 and 1979/80Wlingi I and ST (SH. 2n27 MW) 12.04 8.00 1.03 2.00 2.50 1.60 2.00 1.20 2.30 1.32 2.41 o.8o 10.24 6.90 12.04 6.90 JApen (1) 1979/80 and 1980/81Gr-lntS )- 2o100 MW) 27.49 12.35 1.00 3.00 1.60 4.oo 1.20 4.0o 1.20 11.00 5.00 27.49 5.00 (Feasibility Stody Japan) 1980/Hi and 1982/isDiesel (4.5 MW) o.4o o.i6 0.10 0.05 0.20 0.06 0.10 0.05 3 0.30 0.11 0 11 Nethleralndo 1975/76G-aik (GT- 2n20 MW0) -- - -- _ - -- - -__ _- - - - - - . 1982/83 and 1983/84Total Generstion 60.92 31.94 0.72 1.58 4.63 4.05 7.02 4.30 9.91 4.53 9.40 4.70 9.11 4.00 40.07 21.58 39.53 21.56
2. Trsne.innion -an Dtstributicn
TrensLisoion I 4.47 2.80 1.20 o.6o 2.40 1.60 0.87 o.60 - - - - - - 3.27 2.20 - 2.20 Japan 1975/76Tran.inion II (incl. Detir.) 8.30 4.20 - - 1.80 1.00 2.00 1.00 2.00 1.00 2.00 1.00 0.50 0.20 8.30 4.20 8.30 4.20 Japan 1978/79Traosasieion IV and V 12.04 6.1o - - - - 2.50 1.25 2.50 1.25 2.50 1.25 2.54 1.35 1o.04 5.10 12.04 5.10 _ 1980/81Distribution TV 3.32 1.70 _ _ - - 0.50 0.25 o.6o 0.40 0.90 0.50 0.80 0.25 2.80 1.4i 3.32 1.40 _ 1980/81
Total Trannmiosioa and Distribotion 28.13 i4.8o 1.20 0.6o 4.20 2.60 5.87 3.10 5.10 2.65 5.4o 2.75 3.84 1.80 24.41 *2.90 23.66 12.90
TOTAL INVESTISFIS 89,05 46.74 1.92 2.18 8.83 6.65 12.89 7.40 15.01 7.18 14.80 7.45 12.95 5.80 64.48 34.48 631 34.48
02$ eillicn eqoivlent C 214.58 112.63 4.63 5.25 21.08 16.02 _31.06 17.83 36.17 17.30 35.66 17.95 31.00 13.98 155.37' 83.08 152.27 83.08327.21 9.88 37.30 48.89 53.47 53.61 45.18 538.45 235.35
oI
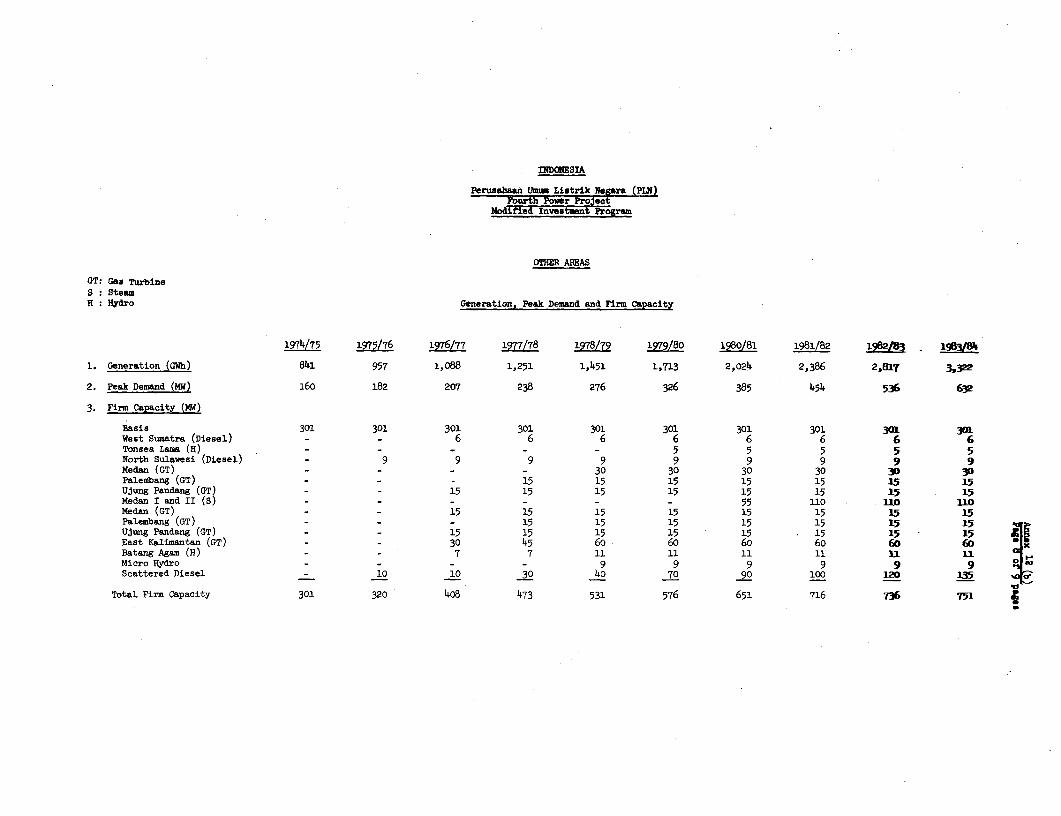
INDWNESIA
Perusahaan UnUm Listrik Negara (PLN)_rourth Fower Project
ModiTire -In-e OF= nft Pogr m
OTHER AIWAS
GT: Gas TurbineS : SteamH Hydro Generation, Peak Demand and Firm Capacity
1974/75 1975/76 1976/77 1977/78 1978/79 1979/80 1980/81 1981/82 1982f8 1903/8k
1. Generation (GWh) 841 957 1,088 1,251 1,451 1,713 2,024 2,386 2,817 3,322
2. Peak Demand (MW) 160 182 207 238 276 326 385 454 536 632
3. Firm Capacity (MW)
Basis 301 301 301 301 301 301 301 301 301 301West Sumatra (Diesel) - - 6 6 6 6 6 6 6 6Tonsea Lama (H) - - - - - 5 5 5 5 5North Sulawesi (Diesel) - 9 9 9 9 9 9 9 9 9Medan (GT) _- - 30 30 30 30 30 30Palembang (GT) - - - 15 15 15 15 15 15 15Ujung Pandang (GT) - 3 15 15 15 15 15 15 15 15Medan I and II (S) - - - - - - 55 110 1no 110Medan (GT) - - 15 15 15 15 15 15 15 15Palembang (GT) - - - 15 15 15 15 15 15 15 Ujung Pandang (GT) - - 15 15 15 15 15 15 15 15 SEast Kalimantan (GT) - - 30 45 60 60 60 60 60 60Batang Agam (H) - - 7 7 11 11 11 11 11 c1Micro Hydro - - - - 9 9 9 9 9 9 0Scattered Diesel - 10 10 30 4o 70 90 _O_ _m U5_
Total Firm Capacity 301 320 408 473 531 576 651 716 736 751

nllDCNEIA.
Pe'hssahan Usuz Listrik NtWe.a (PlN)
GT: GCa TurbineS Steez (in Pp billior onSets otherwise indicated)H Hydra
OTHER AREAS
Total Cost Allocation Inveetment Expenditures During Second-Fine-Year Derelopmept Plan CoanittedPeo3ent Coat 1969/70-1973/74 1974/75 1975/76 19T6/77 1977/78 1978/79 Total During 2nd Plan Snorce of Year ofForeign LooalI Foreign Lo-a Foreign 1oa Foeign Lo..l Foreign Lon.I Foreign Local Foreign Local Foreign Local Foreign Lo.ai Foreign Finan COssiadiag
1. Generation
Weot SDmetr- (Dienel) 0.50 0.25 _ 0.30 0.15 0.20 0.10 - - - - - - 0.50 0.25 - 0.25 ADB 1976/7TTonaen Lamo (H) 0.52 0.35 - _ - -_ ,4 0.09 0.15 i.08 0.20 0.10 0.10 0.04 0.49 0.31 0.52 0.31 ADB 1979/80North Solnaeoi (Dines) 1.12 0.50 - - 0.90 0.35 0.22 0.15 - - - - - - 1.12 0.50 1.12 0.50 ADB 1975/76MHdan (GT) 2.00 0.50 -- - - - 1.20 0.30 o.80 0.20 - - 2.00 0.50 2.00 0.50 CMiA 1978/79Paleobang (GT) 1.00 0.25 0 _ _ o.60 0.15 0.40 0.10 - - 1.00 0.25 1.00 0.25 CIDA 1977/78Ujng PFandang (GT) 1.00 0.25 - - - - 0.60 0.15 o.4i 0.10 - - _ _ 1.00 0.25 1.00 0.25 elm 1976/77MHdan 0 and II (S) 18.11 8.14 -- - - - 2.00 0.90 4.oo i.8o 6.00 2.70 18.11 2.70 Yawlns-" 1960/81 ed 1981/82MHdan (GT) 1.30 0.20 - - - - .80 0.15 0.50 0.05 - - - - 1.30 0.20 1.30 0.20 EDC 1976/7PFle.bsog (GT) 1.30 0.20 - - - - - - 0.80 0.15 0.50 0.05 - - 1.30 0.20 1.30 0.20 EDC 197/78Ujong PFndang (GT) 1.30 0.20 - - - - 0.80 0.15 0.50 0.05 - - 1.30 0.20 1.30 0.20 EDC 19T6/T7ESnt Kalinntan (GT) 5.20 o.8o - - - - i.6o 0.30 1.30 0.20 1.30 0.20 1.00 0.10 5.20 0.80 5.20 0.80 EDC 1976/n7 ad 1978/79BOtang ABam I-III (H) 2.6o 4.6o 0.88 1.96 0.30 o.83 0.09 0.29 O.4o o.60 o.6o 0.50 0.33 0.42 1.72 2.64 1.20 2.64 ADB (I ana fl) 1976/7_1978/79Micro Hydro 0.72 1.71 - - 0.21 0.21 0.24 0.28 0.12 0.31 O.o8 0.41 0.07 0.50 0.72 1.71 - 1.71 FrUKre.Yngenlavia. InK ardoeScattered DiCse 10,00 5.80 4.32 1.o4 o.o8 0.50 0.90 0.80 0.95 0.90 2.05 1.40 1.98 1.16 6.68 4.76 7.00 4.76 vaniee vriaouTotal Goneration 47.67 23.75 5.20 3.00 2.51 2.o4 6.09 2.61 6.72 2.84 7.53 3.76 7.40 4.02 30.33 15.27 41.05 15.27
2, T-snmision snd Diotribution
Trsnoooiioion North SDmatra 9.13 3.00 - - - 2.20 o.80 2.200 0.80 2.00 iSo 0.53 o.60 9.13 3.00 9.13 3.00 Nganlanva 1978/79T--uanoiion Went Sumatra 4.65 1.50 - - - - - 1.10 o.4o 1.10 o.4o 1.10 0.30 3.30 1.10 4.65 1.10 - 1980/81Tr-n_iostio_ South S-matre 3.15 1.30 _ _ _ 0.80 0.30 o.80 0.30 0.80 0.30 2.40 0.90 3.15 0.90 _ 1980/81T-anonienion Sooth Kalinantan 1.29 0.80 - - - 0.30 0.20 0.30 0.20 0.30 0.20 0.39 0.20 1.29 o,80 1.29 0.80 _ 1978/79Distribution Went Knlin-ntnn 1.91 1.50 0.90 0.50 0.50 0.50 0.51 0.50 - - - - _ - 1.01 1.00 - 1.00 ADB 1975/76Dietribhtion Weat Suoetr- 1.57 0.91 0.12 0.09 0.23 0.19 0.32 0.19 0.37 0.15 0.31 o.i6 0.22 0.13 1.45 0.82 - 0.82 ADB 1979/80Distrlbhtion Riao 1.08 o.6o o.6o o.4o o.48 0.20 - - - - - o.48 0.20 - 0.20 ADB 195/76Distribution South Sulaneoi 2.20 2.00 1.00 0.90 o.60 .6o 0.60 0.50 - 1.20 1.10 - 1.10 ADD 1976/77Distrihbtion North Solanoni 1.16 0.90 0.70 o.6o 0.26 0.15 0.20 0.15 0- - o.46 o.3o 0.30 ADB 1976/77Distribhtion Sooth Sometra i.49 1.00 1.19 o.80 0.30 0.20 - - - - - - - - 0.30 0.20 - 0.20 Japan 1974/75Distribotion Horth S-uatr- 4.48 2.00 1.20 0.70 i.6o 0.70 1.68 o.6o -6 3.28 1.30 - 1.30 AID 1976/77Diatribotion aBli and Noonte-ggarn 1.49 1.00 1.00 o.6o 0.30 0.30 0.19 0.10 - - 0.49 o.4o - 0.4o UK 1975/76]iotrihtotion Sooth Knlionotan 1.35 0.90 - _ - o.6o 0.40 0.50 0.30 0.25 0.20 1.35 0.90 1.35 0.90 - 1978/79Diotributiom onlY III 1.45 1.00 - - - 0.30 0.20 0.30 0.20 0.30 0.20 0.30 0.20 1.20 o.80 .45 0.8o - 1976/77_1979/80Onolotod Distribhtion 5.40 4.50 - - 1.08 0.90 1.08 0.90 1. C 0.90 1.O8 0.90 1.08 0.90 5.4o 4.5o 5.4o 4.50 _ arius
Total Tran-ninoino and Distribhtion 41.80 22.91 6.71 4.59 5.35 3.74 7.38 4.i4 6.75 3.35 6.59 3.26 6.67 2.83 32.74 17.32 26.42 17.32
T0TAL INVESTMENTS 89.47 46.66 11.91 7.59 7.86 5.78 13.47 6.75 13.47 6.19 14.12 7.02 14.15 6.85 63.07 32.59 67.47 32.59
us$ tillion oquiolont ( 215.59 112.43 28.70 18.29 18.94 13.93 32.46 16.26 32.45 14.92 34.02 16.92 34.10 i6.50 151.90 78.53 162.58 78.53328,02 46.99 32.87 48.72 47.37 50.94 50.6o 230.50 241.11
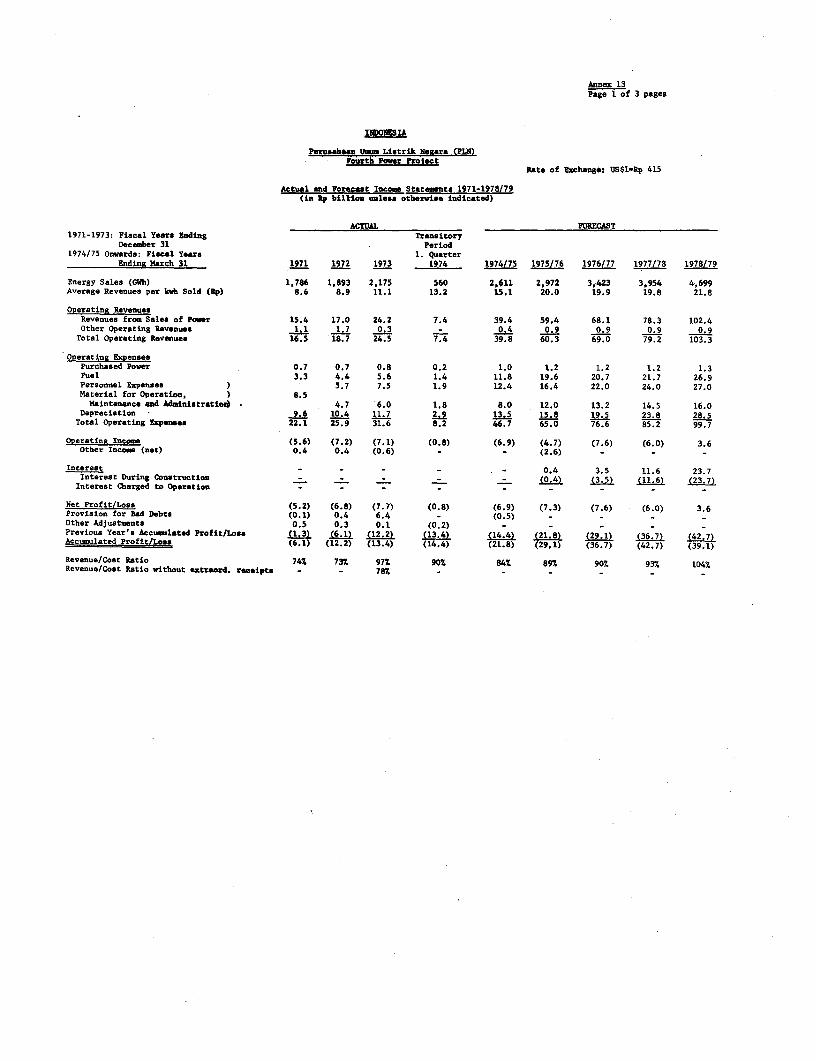
Annex 13Page 1 of 3 pages
INDONES L
Perusasan Um Listrik Namara (PLN)Fourth Power Pro1ect
Rate of Exchange: US$1-Rp 415
Actual and Forecast Income Stateents 1971-1978/79(in Rp billion unless otbhrvise indicated)
ACTUAL FORECAST1971-1973: Fiscal Years Ending Transitory
December 31 Period1974/75 Onvards: Fiscal Years 1. Quarter
Ending March 31 1971 1972 1973 1974 1974/75 1975/76 1976/77 1977/78 1978/79
Energy Sales (GlWb) 1,786 1,893 2,175 560 2,611 2,972 3,423 3,954 4,699Average Revenues per kIh Sold (Rp) 8.6 8.9 11.1 13.2 15.1 20.0 19.9 19.8 21.8
OperatinR RevenuesRevenues from Sales of Poavr 15.4 17.0 24.2 7.4 39.4 59.4 68.1 78.3 102.4Other Operating Revenues 1.1 1.7 0.3 - 0.4 0.9 0.9 0.9 0.9
Total Operating Revenues 16.5 18.7 24.5 7.4 39.8 60.3 69.0 79.2 103.3
Operatine ExpensesPurchased Power 0.7 0.7 0.8 0.2 1.0 1.2 1.2 1.2 1.3Fuel 3.3 4.4 5.6 1.4 11.8 19.6 20.7 21.7 26.9Personnel Expenses ) 5.7 7.5 1.9 12.4 16.4 22.0 24.0 27.0Material for Operation, ) 8.5
Maintenance and Administratiod . 4.7 6.0 1.8 8.0 12.0 13.2 14.5 16.0Depreciation - 9.6 10.4 11.7 2.9 13.5 15.8 19.5 23.8 28.5
Total operating Expens 22.1 25.9 31.6 8.2 46.7 65.0 76.6 85.2 99.7
Operatina Income (5.6) (7.2) (7.1) (0.8) (6.9) (4.7) (7.6) (6.0) 3.6Other Incom (net) 0.4 0.4 (0.6) _ - (2.6) - - -
Interest - - - - - 0.4 3.5 11.6 23.7Interest During Construction _ _ _ - - (0.4) (3.5) (11.6) (23.7)
Interest Charged to Operation -
Net Profit/Loss (5.2) (6.8) (7.7) (0.8) (6.9) (7.3) (7.6) (6.0) 3.6Provision for Bad Debts (0.1) 0.4 6.4 - (0.5)Other Adjustments 0.5 0.3 0.1 (0.2) - _ _ _Previous Year's Accumulated Profit/Loss (1.3) (6.1) (12.2) (13.4) (14.4) (21.8) (29.1) (36.7) (42.7)Accumulated Profit/Loss (6.1) (12.2) (13.4) (14.4) (21.8) (29.1) (36.7) (42.7) (39.1)
Revenue/Cost Ratio 741 73Z 97Z 90% 84Z 89% 90% 93% 104%Revenue/Cost Ratio without extraord. receipts - - 78% - - - - -

ANNEX 13Page 2
Notes and Assumptions on Income Statements
With the exception of fuel, all financial projections have beenmade on the basis of constant 1975 prices. Fuel costs include the latestincrease effective April 2, 1975 (see paragraph 4 of this Annex). No futureescalation has been assumed since only judgement has to be passed at presenton PLN's ability to meet the operating targets required in the financialrecovery plan and the electricity tariff contains a cost adjustment clause(particularly for fuel) which has been applied efficiently in the past.
1. EngSa
As shown in Annex 5, generation and sales development was erraticduring the past several years (possibly some of the data were not accuratelyrecorded). Consequently, predictions on the future trend of sales aredifficult to make. Although demand potential is high, it will continue tobe suppressed during the next several years due to PLN's inability to meetit. Based on projected demand PLN is likely to be able to satisfy, thefollowing production forecasts have been assumed:
West Java: 14% increase in 1975/76 to 20% in 1978/79Other Areas: 14% increase in 1975/76 to 16% in 1978/79
These assumptions result in overall sales increases of 13.8% in 1975/76 to18.82 in 1978/79, after a low increase of 7.1% in 1974/75 which is due tolack of supply capacity.
2. Average Revenues per Kwh Sold
At the time of the introduction of the financial recovery plan,preliminary agreement on basic tariff increases of 20% in 1975/76 and 15%in 1978/79 was reached with the Government. These adjustments would helpassure PLN's financial recovery by 1978/79 on the basis of late 1972 prices.Inflationary trends necessitated a basic tariff adjustment of about 40% inmid-1973 (Annex 10). Fuel cost increases which occurred since were offsetthrough application of the cost adjustment clause included in PLN's tariff.On the occasion of the recent fuel cost increase (para. 4) PLN chose again touse the cost adjustment clause rather than applying for an increase in thebasic tariff for compensating not only for the higher fuel cost but also forincreases in other costs. The expected average revenues for 1975/76 are about32% above the 1974/75 level covering more than the preliminarily agreed 20%increase plus allowing for the required fuel cost adjustment. On the basisof today's prices, a tariff increase of only about 10% is required in 1978/79.
3. Purchased Power
The bulIk of projected power purchases is from the Juanda hydrostation (Jatiluhur Authority), presently at Rp 1.47/kwh. This expenseincreases in step with PLN's tariff adjustment.
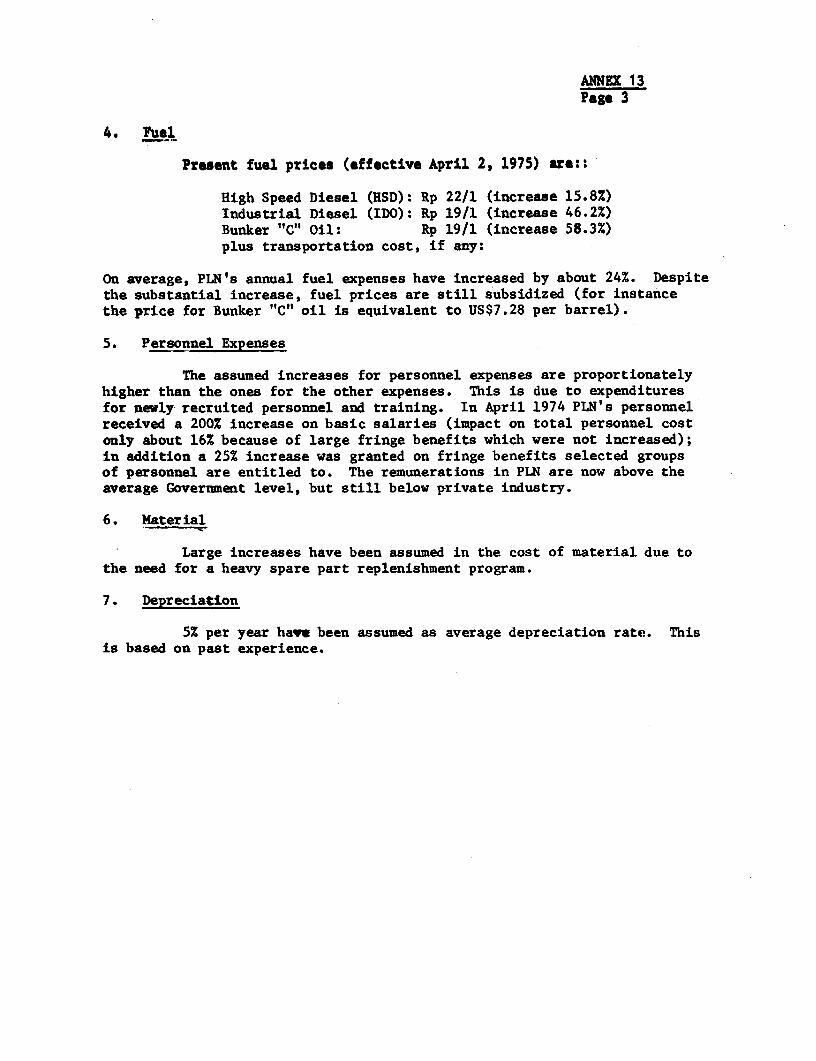
ANNEX 13Page 3
4. Fuel
Present fuel prices (effective April 2, 1975) are::
High Speed Diesel (HSD): Rp 22/1 (increase 15.8%)Industrial Diesel (IDO): Rp 19/1 (increase 46.2%)Bunker "C" Oil: Rp 19/1 (increase 58.3%)plus transportation cost, if any:
On average, PLN's annual fuel expenses have increased by about 24%. Despitethe substantial increase, fuel prices are still subsidized (for instancethe price for Bunker "C" oil is equivalent to US$7.28 per barrel).
5. Personnel Expenses
The assumed increases for personnel expenses are proportionatelyhigher than the ones for the other expenses. This is due to expendituresfor newly recruited personnel and training. In April 1974 PLN's personnelreceived a 200% increase on basic salaries (impact on total personnel costonly about 16% because of large fringe benefits which were not increased);in addition a 25% increase was granted on fringe benefits selected groupsof personnel are entitled to. The remunerations in PLN are now above theaverage Government level, but still below private industry.
6. Material
Large increases have been assumed in the cost of material due tothe need for a heavy spare part replenishment program.
7. Depreciation
5% per year have been assumed as average depreciation rate. Thisis based on past experience.
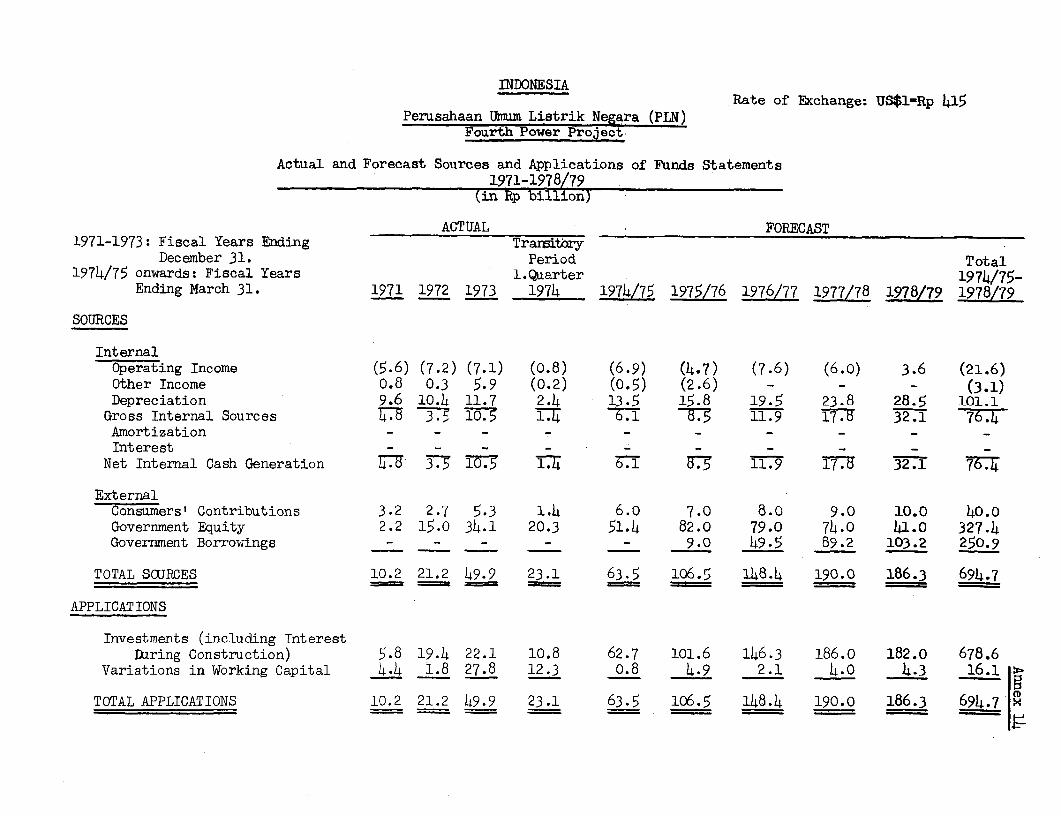
INDONESIAINDONESIA Rate of Exchange: US$1=Rp 415
Perusahaan Umum Listrik Negara (PLN)Fourth Power Project
Actual and Forecast Sources and Applications of Funds Statements1971-1978/79
(in Rp billion)
ACTUAL FORECAST1971-1973: Fiscal Years Ending Traitbry
December 31. Period Total1974/75 onwards: Fiscal Years 1.Quarter 1974/75-
Ending March 31. 1971 1972 1973 1974 1974/75 1975/76 1976/77 1977/78 1978/79 1978/79
SOURCES
InternalOperating Income (5.6) (7.2) (7.1) (0.8) (6.9) (4,7) (7.6) (6.0) 3.6 (21.6)Other Income 0.6 0.3 5.9 (0.2) (0.5) (2.6) - - - (3.1)Depreciation 9.6 10.4 11.7 2.4 13.5 15.8 19.5 23.8 28.5 101.1Gross Internal Sources 7 3 . 10.5 1 6 .1 11.9 17.o 32.1 76.4Amortization - - - - - - - - _ _Interest - - - - - - - - - _
Net Internal Cash Generation 7 37 10.5 11.9 17.o 32.1 76-4
ExternalConsumers' Contributions 3.2 2.7 5.3 1.4 6.o 7.0 8.0 9.0 10.0 40.0Government Equity 2.2 15.0 34.1 20.3 51.4 82.0 79.0 74.0 41.0 327.4Government Borrowings - _ - - - 9.0 49.5 B9.2 103.2 250.9
TOTAL SaJRCES 10.2 21.2 49.9 23.1 63.5 1o6.5 148.4 190.0 186.3 694.7
APPLICATIONS
Investments (including InterestDuring Construction) 5.8 19.4 22.1 10.8 62.7 101.6 146.3 186.0 182.0 678.6
Variations in Working Capital 4.4 1.8 27.8 12.3 0.8 4.9 2.1 4.0 4.3 16.1 B
TOTAL APPLICATIONS 10.2 21.2 49.9 23.1 63.5 106.5 148.4 190.0 186.3 694.7 x
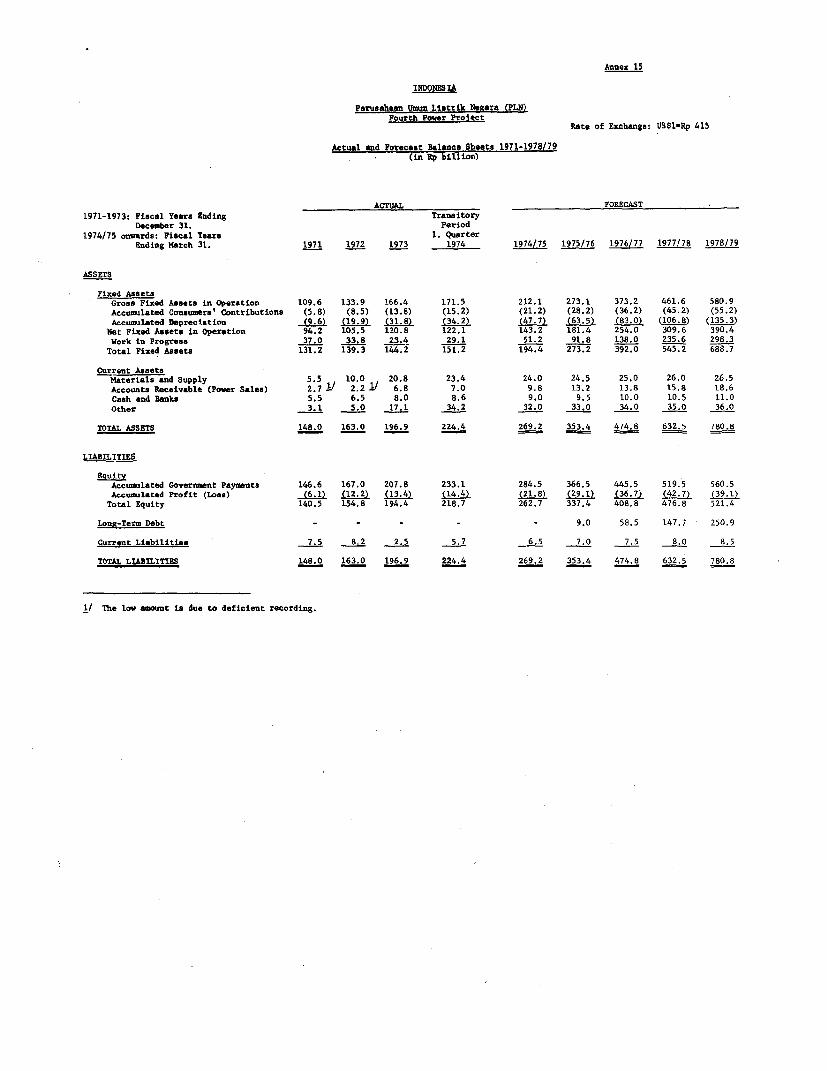
Annex 15
INDONES IA
Perusahean Umum Listrik Vesara (PLN)Fourth Power Pro1ect
Rate of Exchange: US$1FRp 415
Actual and Fovecast Balance Sheets 1971-1978/79(in Rp billion)
ACTUAL FORECAST1971-1973: Fiscal Years Ending Transitory
December 31. Period1974/75 onwards: Fiscal Years 1. Quarter
Ending March 31. 1971 1972 1973 1914 1974/75 1975/76 1976/77 1977/78 1978/79
ASSETS
Fixed AssetsGross Fixed Assets in Operation 109.6 133.9 166.4 171.5 212.1 273.1 373.2 461.6 580.9Accumilated Consumers' Contributions (5.8) (8.5) (13.8) (15.2) (21.2) (28.2) (36.2) (45.2) (55.2)Accumulated Depreciation (9.6) (19.9) (31.8) (34.2) (47.7) (63.5) (83.0) (1062.8) (135.3)
Net Fixed Assets in Operation 94.2 105.5 120.8 122.1 143.2 181.4 254.0 309.6 390.4Work in Progress 37.0 33.8 23.4 29.1 51.2 91.8 138.0 235.6 298.3
Total Fixed Assets 131.2 139.3 144.2 151.2 194.4 273.2 392.0 545.2 688.7
Current AssetsMaterials and Supply 5.5 10.0 20.8 23.4 24.0 24.5 25.0 26.0 26.5Accounts Receivable (Power Sales) 2.7 1 2.2 i/ 6.8 7.0 9.8 13.2 13.8 15.8 18.6Cash and Banks 5.5 6.5 8.0 8.6 9.0 9.5 10.0 10.5 11.0Other 3.1 5.0 17.1 34.2 32.0 33.0 34.0 35.0 36.0
TOTAL ASSETS 148.0 163.0 196.9 224,4 269.2 353.4 474.8 632.5 780.8
LIABILITIES
EquityAccumulated Government Payments 146.6 167.0 207.8 233.1 284.5 366.5 445.5 519.5 560.5Accusulated Profit (Loss) (6.1) (12.2) (13.4) (14.4) (21.8) (29.1) (36.7) (42.7) (39.1)
Total Equity 140.5 154.8 194.4 218.7 262.7 337.4 408.8 476.8 521.4
Long-Term Debt - - - - - 9.0 58.5 147.7 250.9
Current Liabilities 7.5 8.2 2.5 5.7 6.5 7.0 7.5 8.0 8.5
TOTAL LIABILITIES 148.0 163.0 196.9 224.4 269.2 353.4 474.8 632.5 780.8
I/ The low amount is due to deficient recording.

InDONESIA
Perusshesn Usue Liitrik Nera (PLN)Fourth Power Project
Status of Activities on M gst Improvemnt
Ths following provides infor-tion on the present status of activities being undertaken by PLN nd its sensgse_nt sonsoltanta, SOFREILC, to improve PLN's aotivitie-. Th listing follow largely the schedule as attahd to
Side Lettr No. 5 (Jope 22, 1973) of the 399-IND Credit docsents and ite ded.. new treising aeticities fieessd Erg loads of the present Lose (Activity 11).
(a) Schedule as included in Side Letter No.5(b) Actual sad presently planned status of activity.
a PM Responsibility of Are.. ofPLN and Responsibility imple-
tConultt ntPeonnibility of Consoltant of PiL ment ionM a Submzission of Preparatory work Start of implemen-
Banic data r7cocenendatione fur impleeota- tmton with assist-s.,availble to by Conssltet tion udertakent a-cs of Con-
1si I Ip Govern ent
A C T I V I T Y Consultent to PLN by Consultat t8jnt t iovolvemant R E N A R K S
I. PLANSING
1/2 Tosstneot Progrmaend Cash Fluw
(a) Juc. 1973 R-is- Oct. 1973 -April 1974 Yes Yen Yes Approvl Jan.1974 Thin itea 5 dealing mainly with the financial aspects of inset-
(b) July 1973 Review Oct. 1973 April 1974 yso yea yes Approval Jan.1974 m-ct nd cash fluc ProJections, was ipnotani in vie of the(in principle) Second Fin-YTer Developmnent Plan 1974/75-1978/79 of which
Pill inveetmets fore part.
62 Overall Long-_RngePlanning
(a) July 1973 Septeober 1973 November 1973 Study Jan. 1974 yes yes yes Support The delay is due to a re-arr-ngesent of priorittes. It hns bee
(b) mid 1975 late 1975 mid 1976 end -1976 yes ye. yes Sopport decided to conceot-ate first on the fL-rinced Jaws Syt-sDevelop-ect Study - the fi.e of Preces, Crd and Ridr.o=...need work in November 1974 for 21 ths - and se theeaperience gained for other areas. This rr mt sold elsoforestall overlapping of activities. Parallel to this aetivity,PLl in studying technical apects of tbe Jaw yts t.n coop-eration with the Bandopg Institute of beshbmlogy end the TechaitonUniversity of Delft (Netherlands). The deyrc though notdesirable, is Justified under the clrcastenees
3 Centra1 Dtai BSnk(a) _ November 1973 Narch 1974 June 1974 yev - _ The existing data flow in PLN is presently being staUled nod
(b) _ end 1975 early 1976 old 1976 ye. - _ _ some work undertaken on a management information ysts. . e
central data beak will be established when the results of thesestudies ar avilable.
PERSONNEL AND TRAINING
4/5/6/ Pervocnel, Salaries and Wages,7/8/10 Pensions, Recruitment DiOcisoal,
Aooeesann,t TranSfero,Re-tructuriog Progron
(a) Cuaplete Cooplete-July 1973 Oct.-Lec. 1973 Dec.1973-Feb.1976 yea yes yea October 1973 SOYRELEC's proposal was discussed with Goerent authorities,
(b) Cuoplete Conplete-July 1973 Oct-Dec. 1973 ecd 1974 yeo Ye. yes ic part provided however only partial agresnt ws reaced. Thi. is particularlytrue for the salary structure of which cly a odied veresoncould be implemented (Cor instance decreSng aalary increasesin the higher brackets of a given pay seal tinted of the oleincentive providing incressing strueture; lar ta industrialsalaries which can only partially be offset by fringe benefits).
9 Job Analyots, Organogran,tc. -Couplet(a) Cosplete Jupe 1973 August 1973 October 1973 yev yev ye.
(b) Coeplete Juno 1973 August 1973 October 1973 yeo yea yes Ii
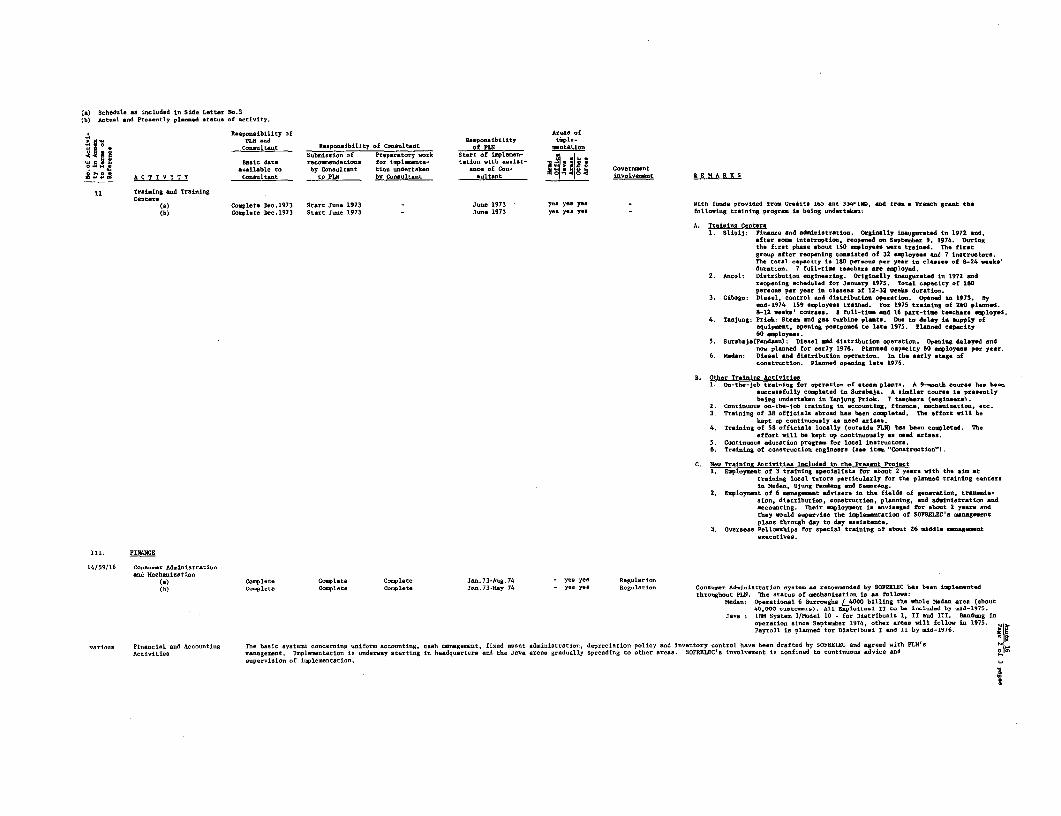
(a) S9hodule so inoloded in Side Letter No.5(b) AtrnI cod Pr-o etly plend tetrn of ctivity.
Reepo-sibility of Ar.oe ofVII . ~ ~ ~ ~ ~ ~ ~ PnN end-oponeihiitry tepte-Ii Con ultrat Reapneeibillty of Coesoltaet of PiN _ent t;on
Suhbission of PTeparetory work Start of ifpte_ee- aBI hei dete reronsedttoo. f-o inplesota- taio t1ith .e.er-
o .eP _ arailahie to by Con.ot Ito tioe undertokee euc. of Coo- _ 3D° I A C T I V I T Y Coneltant to PLN bh Conoulttat ult nt o n _ involve_nt RS MARKS
11 Trteitig cad Traitiog
"eI Cooplete D.c1973 Start J=ne 1973 - Jlon 1973 y75 Y.. yee - Oitt diode provided tree Credits 163 are 3433ll5 ad troe at Fench greet the(b) Cotplete dec.1973 Start Jo0 0 1973 - Jun 1973 Yee yes Y. e - foliowiog trfintig pregear is being -rdetekeo:
A. Togietee C-cterm1. Stiptij: Pinereandiadelieitratlee. Orginally taugorated to 1972 cod,
afte on _e terr_ptio, reped o Septeo 1974. During
the first phase_shoot i50 ealoycee we trained. The firstgroup after repein 19e e ated f 32 etiyoys nod 7 i pstroore.;The tote1 opaity is 190 perso per Year tL. te.ee of .E$-24 -skh'd4ration. 7 Col t-ric teahers are N)etolyed.
2. Amorn: Dis trihot io engineering . Oriinll ie.ogo..arad in 1972 cedocop e .ni ehdled for Ja nry 1975. Tti pioty of 10persona per year in ..ee.. of 12-32 woeke doretic..
3.) Ciog bee conoly e distrihotion operatiu. Opene in 1973. By(b)4 159 aeploycee trained, For 1975 reaming of 2*0 PInt d.8-12 seeha' roorcee. 8 doll-tine and 16 part-tIme tseahers seplonyed.
4. Taedeng: Priok ; Stea end go tobhi plant. Doe e deleay to sopply ofoqoipisnt, openig postpond to late 1975. flamend capacity60 ceptoysas.
5. Sor Mha(Pdo): Diesel e a doeistribution OP 1 rton. Opeig delayed endno plannd for early 1976. F'lamaed capacIty 60 nptoy.e. Par year.
h. Mede: Diteal and dintaThotino operation. In the early tfage of=cntrntioe. Planned4 Peoiag late 1976.
B. Other Tr Ce h tivts1. On-tho-joh training for p.,tranion f -ca plants. A 9-noeh orehoe keen
nactesafoIly oprlotad in Sorahja. A siiler coorse Is pr..e.tlybengodentahee In Tnjung Priok. 7 te...hhre (ogiee..a..
. oe-the-jb trainin in ai-oocting, t Seance, otoheeie-iten, etc.3. Training of 38 officials abroad h.o been copltad. Th.effora .ll he
kept up coetinooney as needanes4. Trainigo of 59 officiate locally (ooteide PIN) bee bonn nooplted. The
effort wilt he kept oP ... ntln...sly as need ariese.5. Cooti-on education progra for teetistot1 s6. Training of o-tr-tien engin...re (eon ire "C-ntrotiOn").-
C. ow renin ltiritie Tealdad1 in the Present PrelottI. teyoyentof3 tratinin epeclaltet for shoot 2 y.-r. with the ai.eat
training Ioa roosparticularly for the plancd training centrer
2. fEploy-et of 6 canafageest adoloore tn thc fieIde of gsonrtien, tranacle-nien, disteihutien, coentrettio,PI plning, and add..Ioltratin and
scotn.Their sqloyoann is nvicaged for chat 2 ysare endthey would enpervise the islnpeeicettion od SOFRELt C's nuegageustPlan throgh day to day asiaratnce.
3. 0veroen. Paitoonhipe for special training of ehent 26 ciddle onngenst
III. FINAiNCE
14/59/If Co.eoerAdetnerraticoend M..henintioo
Ce) ~~~~~Coupleto Coe9tete Coopetee Jao.73-Ago.74 - ..70 . R.5 te titoto(4) toowloto ~~~~~CooPirte Coopltol J- 0.73-May 74 -Y.. Y.a Rgeulrto- Coneon- A&d.initrotien synta as rohon-dedthy SOpROLtC baa b.en iglenetad
throaghoot PiLl. The etatoc of haieatien te a. fotl1wa:Mede- Opora.tione 4 Borrowhk L4O0O hilling the whole Meda area (eboot
40,000 --- oer). Alt fap.iotisi 1I Se be iosiudedby oed-1975.lava : 1IBM Syctan 3/Model 10 - for Diotrihusis 1, TI and I 1. Bandoeg In
operation cicon Sept-b-e 1974, oth-r .ara eitl follow in 1975.Poyru11 to plannd for Dletribusi I and 11 by oid-1976.
-cioce Pi,on..a an d A.ooootico Tho beets cyoton... o orico uniforn acow-tiec, .. eh nanaent. f lord e...t adnLiuit-tic.. depreciation Policy cud Inven.tory control have boon drafted by SOFRtEC and agreed With PLNn teAutivitio naaenn . Inpe-totiou, in undresy etartiog it hsadqoartrr o ad the Je aoreoc gradually opro:ding to oth-r -. s0. SOytIfEC'o i-vl-onito Icoafind to oootin...oe adice and O
coporriioto of ieptoetettoe..

(a) Schedule as iacloded in Side Latter No. 5.(b) Actual .nd Pre:eatly planned status Of actility.
Rssponsibility of Areas ofnn>: PLN and Reapsosibility iapl.s-ea 90 0 Con..ltost Responsibility of Consuitant of PlN -entatioa
< 8 du~~~~~~~~~~~ ~~~~~~~~bmis.io. af Preparatory asrl Start of iepletn oa ' Basic data recommendations Cfor iaplementa- tatiaa with assist- au ala
iaailable to by Cansoltant tien uadertaken ases of Con- E I"D Governmeat5 N' sE A C T I V I T Y Coasultant ta PLN by Censoltast suItant m: _ _ _ e involvement R E M A R E S
29 Internal Audit(a) May 1973 Des. 1973 Jan.-Marh 1974 April 1974 yes yes yes Inforastion SOFRELEC is presently drafting recoemendations on(b) May 1973 July 1974 end 1975 end 1975 yes yes yes Infsrmation inpieneatation of audit nativities In outlying ar sa. n
Asdit is genera is hampered by lank of qsahified personnl.
31 Insarasee(a) De. 1973 Jan. 1974 Jac. 1975 - Yes yea YES Appraval SOPRELEC has drafted an interim report listing all inseran-e(b) Dee. 1973 aid 1975 end 1975 - yes yen yes Appr.el reqairaennt. After ree.. ipt ef PlN's LScundes final
recaaned.tiss cill be aade. The delay is sadesirable.
33 Tariffs(a) Complete AnnuaI Revien in doe tine in doe tine ye. yes yes Approeai Resent experieace shees that the improreaents in the tariff(h) Complete Annual Revien in doe tine in due tine yes yes yes Approval adjustment process rank a-ang the greatest achievements Of
24/25/32 BudSgt PLN apd SOFRELEC. The rate -Pking process works effiieatly.(a) _ Contiaoeo Continuous Continuoos yes yes yes.- PLN's internal operation and cenatranti.n budget proce.dres
(b) ~~~~~~~~See rearks -der "Coastrot ti-" On itea IV. Yes yes Yea as drafted hp SOFREAC have been tple.tetd; only day is day-neistanc.e is being rendered by the -oneltanta. Difficoltinastill persist in relation ti the DIP (Goserssent) budget, onchich, however, a aswjr breakthrough could be reached recently
(se"Ceastr-ctien0
).
12/27/63 Office Management Procedures(a) May 1973 Jan.-Jane 1974 Marnh-Sept.1974 April/Oct. 1974 ye ys yen - Lack of tine and invslssent in matte-n aoe imdiately(b) Jan.1973 late 1975 early 1976 early 1976 yee yes yea -p iportant on the part t of PLN and the c.s.ltantn eaplain
the udeairahle slippage.
CONSTRUCTION
34-36 All Activities With ane exeeptioa (quarterly budget rnlease), only eomparatively aniaportant probl-e= in eoanecticn with performanae ieprvenet have been attacked. Initial eark hba been dane on the establishment of67 basic tieciael standards, disco:sions acre held on regolations for obtaining power connections, etc.; howeer no real progress has yet beea made on nttlers -uch bs p-a3eat iaple-satation, nantra-t
ad=tnistrctioa and pr-aureneat. C....qa ently, the originally envisaged ausistanee progran was net maintained and a sew series of nativities has to be andertaken.Presently the following is eavisaged:
1. Procorement: SOFRELEC sill delegate a pro.urenoat aspect she sill first train PLN personnel in proso et procedur-s and later provide advi-e in day to day problems. This assignmnt,seheduled to start in early 1975, ill take about one year to -emplete.
2. oanran-nt Budget: I_ the past los-en-neat budget proeed--'s, partie-larly the -eehanien e,ployed n releo.siog thz budgeted local funds, erse one of the maJor obstaelns to efficient projectimpleneatation. Reneatly the Gocer.-nent agreed to release in cdynace so a quarterly basis the budgeted local fands through oemmercial banks and administered by PLN headqsarters;befoe evry iagle budget ites had to be applied fo r through '1 d trsry ffic aeni-osly delaying iapl-enati. ThIs ppear: to be a Step in the eight direstian.
3. Planning and loaateuttoa -irhings Training la-se for senir offisars on "hydra", "thcral" and "plant -o -iaining" (for instance acepta-c tests) will be held. Training is aehdoledto start in early 1975.
The largest obstacle to s-rioos improvenent in the field of ooantructlon is the lack of qunlified engineers. Nevertheless, improvenent in the speed and qanlity of pr-ejet impleneatation is cruoialfor PLN's recsvery and all means available will have ts con-estrate on thia goal.
OPERATION
37/43/49/56 Improvement of Operation38-44/63 and Maintenannce Procedures
38-4/8 - Mi.t -(a)-e Conylete Oe-.1973-Feb.1974 -Jan.-M-rh 1974 - yea 55- Imple-e-s-tatia started free impantai... area sha as ste-)b) Complete Dec.1973.Feb.1974 Jn. -Marah 1974 - yea Yea por plant, distribotis offic.s in Jakarta, Rndueg, etc.
Iportant Impr-.ets can he observd in maintenanceoscheduling of generating plant.
50/55/69 Lad Dinpatch and RegionalDitsribotios Ceaters
(s) Complete Dec.1973-June 1974 - Apr.1974-Jan.1975 y yesye Support BRsically the delay is doe to the sloe progress in the(b) Complete end 197
4-nid 1975 - aid 1975 and later - yes yea Support rehabilitation of tha Jakart dietrlbutisa etrk. At the
sos.eat the following nativities are anderwy:1. hatsc design of the loaud dispath .neter On West Jan
(SOFTELEC). Fre-nh bilateral aid will finance construntion.2. Ereetien of load dispatch ceter fee East Ja-n. This is far
the 150 kV' trassisnioa system incdisig telemtering,superviory -otr-I and teles-ai-atia equipment.
3. Varioun studie on sped draop, frequncy regulation,system sfety and operatio .en.....is.I
47/51 Plant and System Protection(a) Complete Dea. 1973 - April 19(4 - yes yes -ehloy in part doe to heavy ia-oltetens of ooliaots in(b) Complete end 1974-esd 1975 - end 1975-end 1976 - yea yen training efforts and in part ti need for coardinaticn with
Jan Sycten Study.
52 Opetem Standardinctios (a) Jane 1973 March 1974 - Jane 1974 yes ye. yes Support Delay due to oocupation nith ore orgent matters; act crucial(b) Jane 1973 end 1974 - early 1975 yea yes yes Suvpart for PLN's operationa. 50
53/57 Syste= Lass Reduntions(a) - Continucus Contia.o.s Continuous -. ye yea Support Costiuously being attached through maintenance pragranaI, matesV(b) _ Contisuous Continou Ctinous yes yen Support reader training, etc. Subtatial ir-.mtrement can nnly he
n-bieved thraugh ineestsset in trnmsinad dietrlbstianf_aiIitie. I
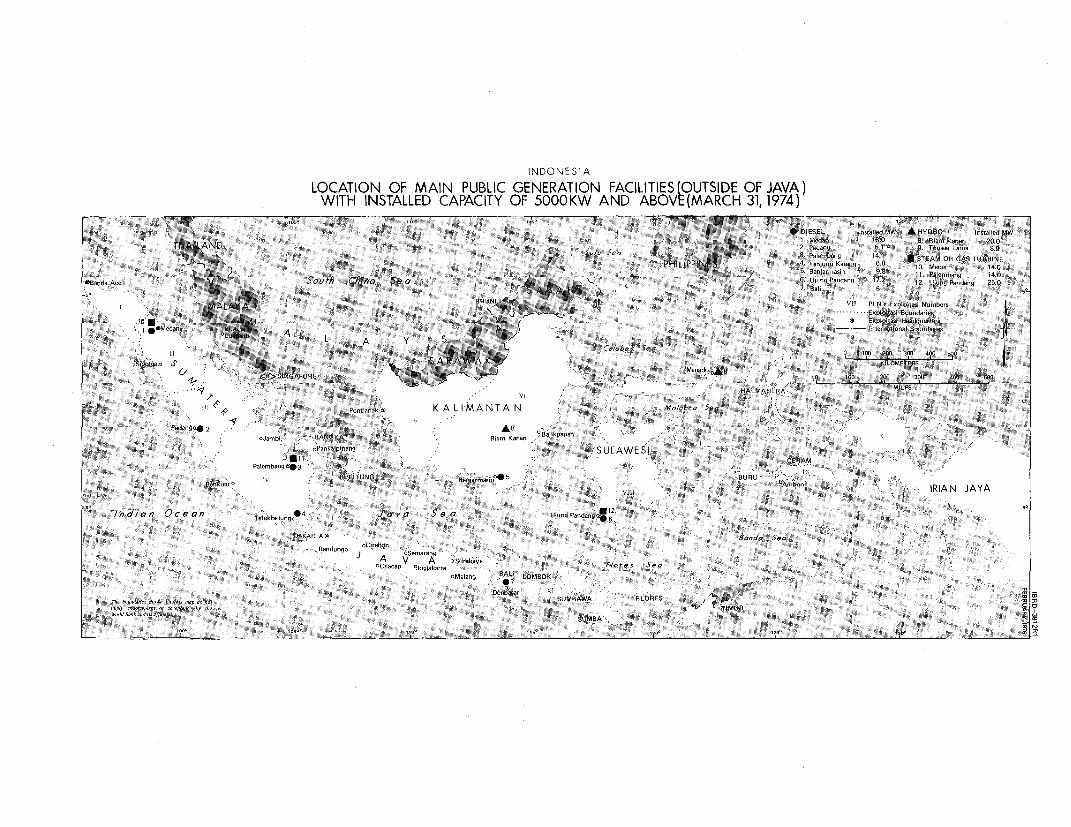
IN DO NESIA
LOCATION OF MAIN PUBLIC GENERATION FACILITIES (OUTSIDE OF JAVA)WITH INSTALLED CAPACITY OF 5000KW AND ABOVE (MARCH 31, 1974)
0 DIESEL InrttOllOd MW A HYDRO installed MW
t Medan 16.0 8. Riar. Kna.. 20.0
TMtLN Solo' Seao., 3. P lomborrg 14.1 STEAM ORi GAS TURBINEPHILIP ~~~~~~~~~~~ ~4. TanIung Koan9 88 10. Mad-o 14.0
S. Brhjarmasin 9.8 11. Palmbeang 14.0
~~B9s4o Aceh "~~~~~~f"' '.. South China Sea ..s-.. ..~~~~~~~~~~~~~ 8. Ujong Pondong 17.2 12. 6UjjungPandngSSg P2osUung sand 250M
a R UNW 1VII PLN'a E.pIoitasi NombernMALAY,.A .... \Exoploitosi Btoundaries
.10 0 a~~~~~~~~~~~~~~~~~ '. E.pIlctasi Heodgoort.to
IOU 4$ . - -K ALAInternational B-odaries
LAA
OA RA V Ak / KILOMETERS
& "~~~~~SINGAPORE ._______________
"17' . . ,~~~~~~~~~~~~~~~~~~~ F~~~~~ALMAHE5A, IE
0" .~~~~~~~~~~'p Poo~~~~~~~~~tionak K A L I'MA N TA N Mfco SO a
EoO9*2 -AB
-J-bi1 ,.8AOK Ri-rr Konorn
OPankaOipinang .SULAWAESI
CERAM
Bnnkuiu S~~~~~~~EL1TUNG .- 9 5 BURU"
Roo1 oOAonn ~~~ ~ ~I~s,,boo IRIAN ~~~JAYA
Indlian Ocean T 04bt g~,1J v S ea Ujn anag 2"B'
Badn oCirebon -
A v A ooooy /rs SooCil ... p
0Jogj.k.r. l,fos S
OMalong 2BA Li LOMBOK
A~~~~ b~~~~~~ d , - . 4 -~~~~~~~bn o s rS U M B A W A - F L O R E S '
rOSoodoe00r010 byoo .(o TIMOR
0',,0o00d101010 SUMBA
100" 15" IS"115 100 105"100" 0

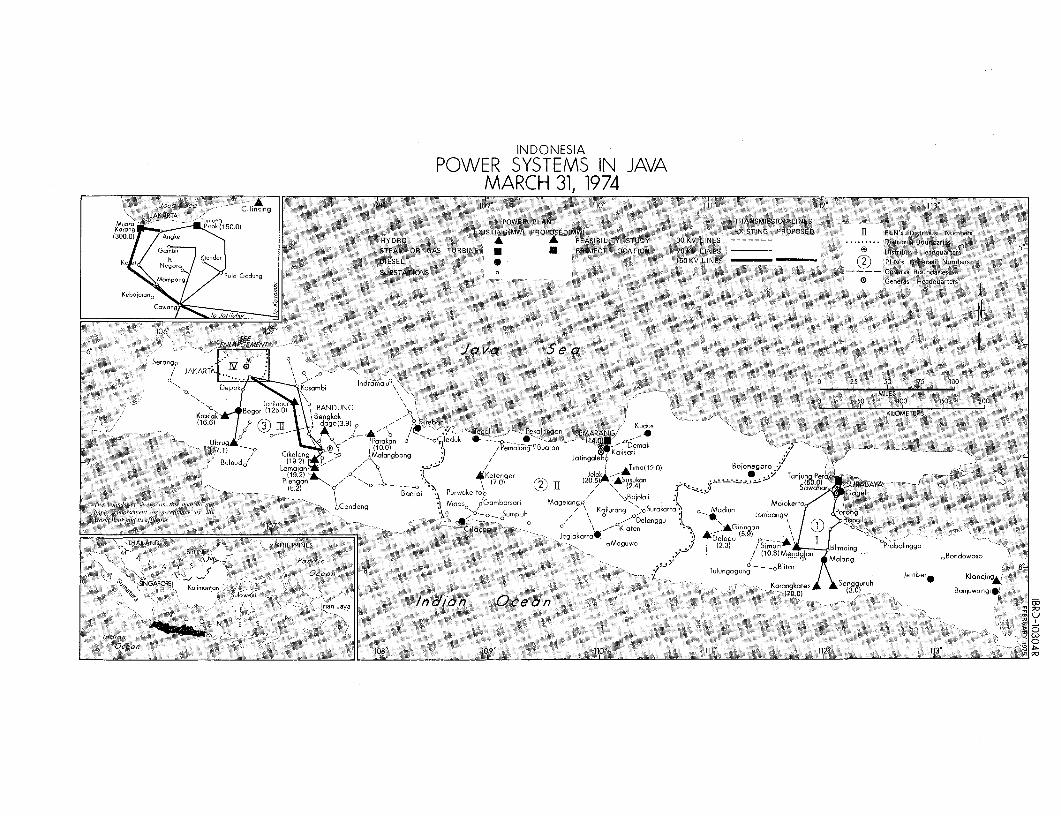
INDONESIA
POWER SYSTEMS IN JAVAMARCH 31, 1974
Jo,o Seo 103 (09' 110 11 2 Ii3 0dinmgJAKARTA- POWER PLANT TRANSMISSION LINES
(300r0 -a EXISTING(MW( PRPOS^EOkMW) EXISTING PROPOSED If PLN's DOstrib.si Numbers30 b / n e k HYDRO A FEASIBILITY STUDY 30KV LINES - Digtsi)eosi Bno-daries 5°
STEAM OR GAS TURBINE * U PROJECT LOCATION 70KV LINES % Dlstribusi HeadNearser-sK JI. KIende, DIESEL 1 0OKV LINES -('2) PLN's Generasi Numbers
Negp o ro - -Pulo I3ese i oSU STATIONS °-n east BoundariesMoropoog P.10 Godoss SUBSTATIONS 0 0 Geneses) -leadguarters~~~~~~~~~~~~~~~~~eneasiReaquawr
107
Keboioon0 5/
Osf
6N M - Java Sea
d' LAKAR 1.* \ 0 0 25 50 75 100' * > DepokgD Kosaob, in . MILES
Ubrog 0 ~~~~~~~~~~~~~~~~~~~~~~~~~~~~~~~~~o -~~~~~~~~~~~~~~~ 2 ~ ~ ~ ~ ~ ~ ~ ~ ~ 1 o R 0
g_ ,, tor (125 0 -EeLIho(k3 9) ,' ° JoIen 7 ? \ T >- °tkolongen SEMAPAN i/ KILOMSTER5 290
K,Q_l Bengkok ,7 - Pebonangbong /Penr or__I d 10.2) ol 7 0 Timo(12.0) Bojonegoro., E ' 9
I.omoianr r ~~~~~~eIenduke,r1jV,o -6eSkanog. -
Ubu - - Jgaal )Xeep >_A\/ II0 - --- -1 ---- -
47. 1)Plngn . z -. Os'70)VI ~ / K\,s )24) r** __7SOkI Gae
t SNGA 4 JK ~~~~~~~~~C I 11 ni d- aag aeoingguu j oningaNo
nnply (to ~t0Ottit'rIt OotCeIttoJret Or, tIm (5.2)o. Sompuk \ \ 2.4) om a g
C)ceanLAPI PHILIPP.NES -. -6 109°o il0° I° (2.3) P-3° Simo gb l
RUlJEI / Mo(ong 0 Eoedowoso~~~~~~~m~ o.m.r.r Mg..nq 61ket(A p l " " - P p o t/ .---- 0 .
'"-lINOAPLAf -W n osgolPoen ~ oohRnggsog,
Ocean lOB 5090 no0 U)0
(120 1)3 Oeannlonoing&