perspective on potential benefits and harms of fish
TRANSCRIPT

Perspective on potential benefits and harms of fish consumption
Emily Oken, MD, MPH
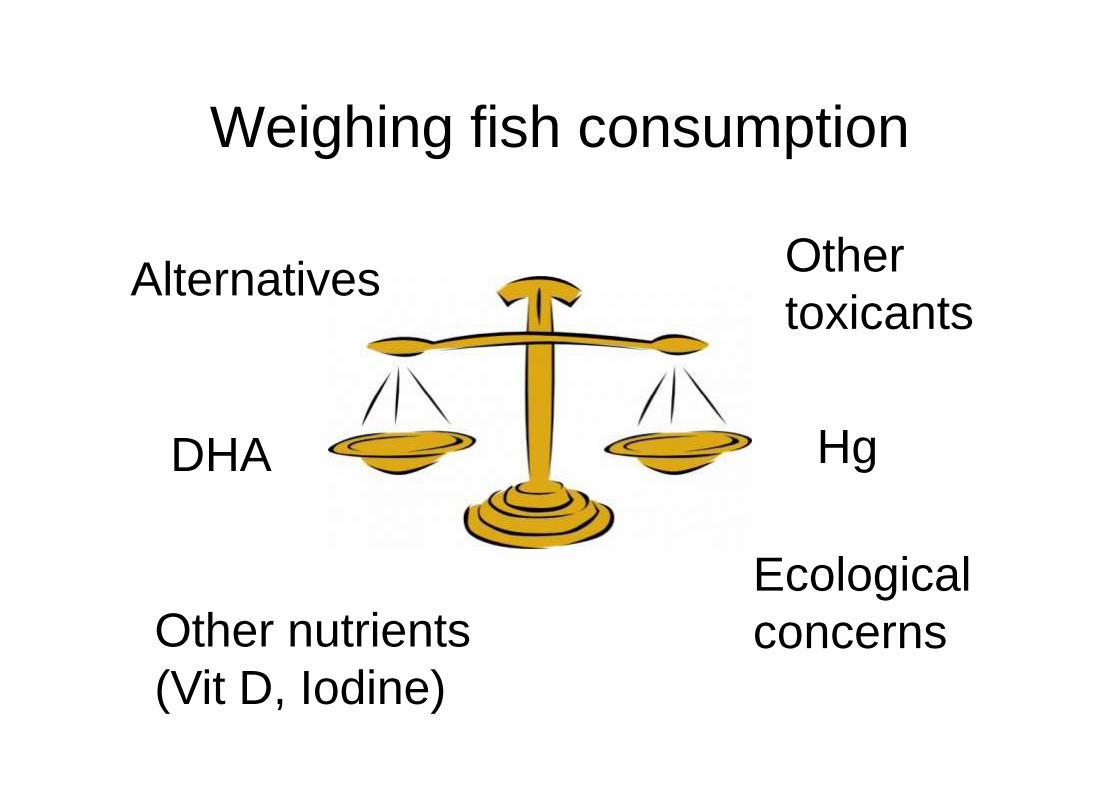
Weighing fish consumption
Alternatives Other toxicants
HgDHA
EcologicalconcernsOther nutrients
(Vit D, Iodine)

Toxicant exposure - complexities
• Multiple contaminants may co-occur, with different or interactive health effects– PCBs and other persistent organic
compounds, heavy metals, “contaminants of compounds, heavy metals, “contaminants of emerging concern” such as pharmaceuticals, personal care products, and perfluorinatedorganic compounds
• Most studies (and advisories) focus on single contaminants
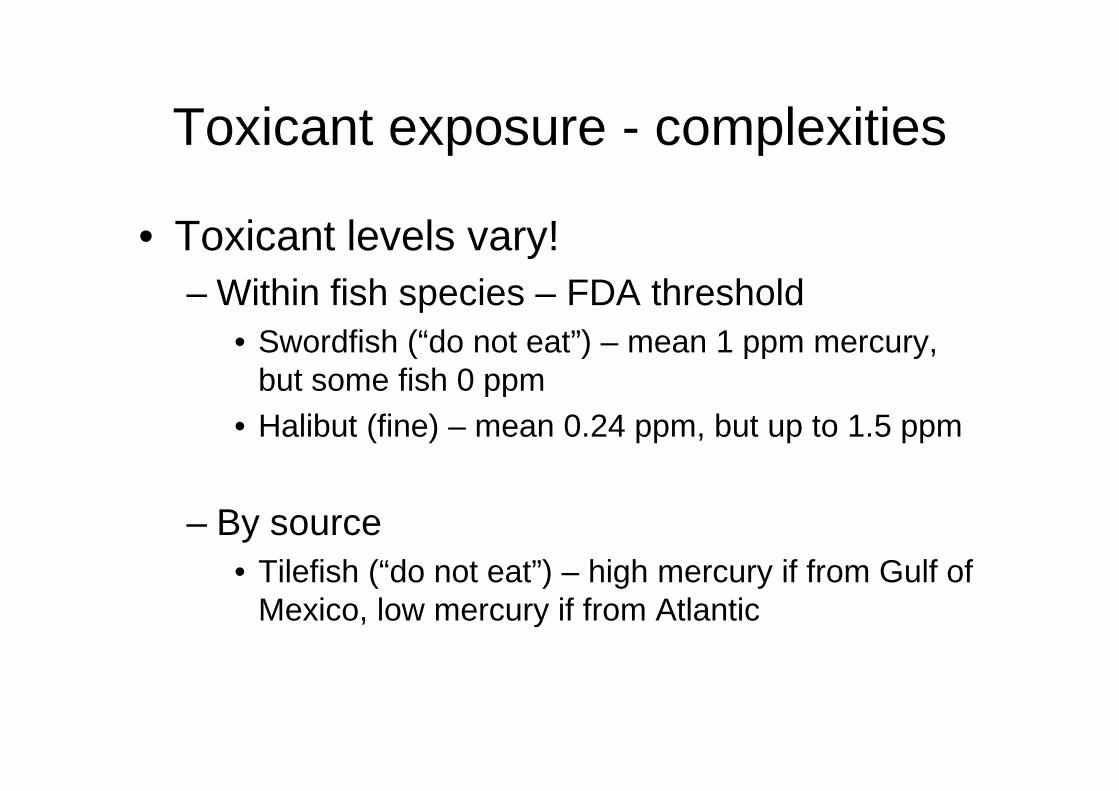
Toxicant exposure - complexities
• Toxicant levels vary!– Within fish species – FDA threshold
• Swordfish (“do not eat”) – mean 1 ppm mercury, but some fish 0 ppmbut some fish 0 ppm
• Halibut (fine) – mean 0.24 ppm, but up to 1.5 ppm
– By source• Tilefish (“do not eat”) – high mercury if from Gulf of
Mexico, low mercury if from Atlantic

Toxicant exposure - complexities
• Variable susceptibility to toxicities– Variation among individuals, also by stage of
lifecourse– Fetus especially susceptible– Fetus especially susceptible– US EPA/FDA advice specific to pregnancy, no
advice for non-pregnant adults– Very limited information about effects on
children
• Confounding by nutritional benefits

Fish is the primary dietary source of omega-3 long-chain polyunsaturated fatty acids
• Omega-3 LCPUFA:– Essential nutrients –
we can’t synthesize them, have to eat them
– Necessary for fetal – Necessary for fetal optimal fetal brain, eye development (DHA)
– Most women eat too little: recommended 1400 mg DHA/week, US mean ~500 mg/wk

Maternal mercury and child cognition with low exposure
Child test score
Age and sex MV
Peabody Picture Vocabulary TestHair Hg >1ppmHg < 90th %ile
-5.3 (-10.1, -0.5)Referent
-4.0 (-8.0, 0.0)ReferentHg < 90th %ile Referent Referent
Wide Range Assessment of Visual Motor AbilitiesHair Hg >1ppmHg < 90th %ile
-3.4 (-7.0, 0.2)Referent
-3.5 (-7.2, 0.2)Referent
*MV adjustment = Child: fetal growth, gestation length, breastfeeding duration, birth order, language; Maternal: PPVT score, age, BMI, race/ethnicity, education, marital status, smoking; Paternal: education.
Oken, et al. AJE 2008

Maternal fish intake and child cognition – Project Viva
Child Test Score
Age and sex MV
Peabody Picture Vocabulary TestFish > 2x/wkFish <= 2x/wk
-1.5 (-7.3, 4.4)-2.2 (-6.5, 2.2)
1.2 (-3.5, 6.0)-2.1 (-5.7, 1.4)
Oken, et al. AJE 2008
Fish <= 2x/wkFish never
-2.2 (-6.5, 2.2)Referent
-2.1 (-5.7, 1.4)Referent
Wide Range Assessment of Visual Motor AbilitiesFish > 2x/wkFish <= 2x/wkFish never
3.7 (-0.7, 8.1)0.7 (-2.5, 4.0)
Referent
5.3 (0.6, 9.6)1.1 (-2.2, 4.4)
Referent*MV adjustment = Child: fetal growth, gestation length, breastfeeding duration, birth order, language; Maternal: PPVT score, age, BMI, race/ethnicity, education, marital status, smoking; Paternal: education.

Danish National Birth Cohort
1.3
1.4
1.5
Odds
Rat
io (95
% C
I) for
hig
her
tota
l dev
elopm
ent
0.9
1
1.1
1.2
Lowest Second Third Fourth Highest
Quintile of maternal prenatal fish intake
Odds
Rat
io (95
% C
I) for
hig
her
tota
l dev
elopm
ent
Oken, et al. Am J Clin Nutr 2009

Hibbeln JR, et al. Lancet 2007;369:578-85.

DHA Supplementation in Pregnancy, Birth Outcomes & Bayley Scores
(Makrides et al, JAMA 2011)
Birth outcomes RR (95% CI)Birth <34wks 0.5 (0.3, 0.94)Birth wt <2500 g 0.7 (0.4, 0.96)NICU admission 0.6 (0.3, 0.97)NICU admission 0.6 (0.3, 0.97)
Cognition at 18 months Beta (95% CI)Cognition 0.01 (-1.4, 1.4)Language -1.4 (-3.1, 0.2)Motor 0.08 (-1.2, 1.3)Adaptive behavior -1.5 (-3.2, 0.1)

Scores on the K-ABC at 7 years of age for children whose mothers had taken cod liver oil (n = 82) or corn oil (n = 61) during pregnancy and lactation.
Helland et al, Pediatrics 2008.
©2008 by American Academy of Pediatrics

Nutrient benefits - complexities• Multiple co-occurring nutrients: protein,
iodine, vitamin D, selenium, etc.– Some studies suggest lean fish in pregnancy
at least as beneficial for birth outcomes
• Nutrient levels vary across species. – What does a 6 ounce meal give you?
• Shrimp: ~250 mg DHA• Pollock: ~700 mg DHA• Salmon: ~2500 mg DHA
• Confounding by contaminant risk

Considering both mercury and fishVisual recognition memory results in 6 month old infants
Hair mercury
<= 1.2 ppm
Hair mercury
> 1.2 ppm
>2 weekly fish servings
72(n=7)
55(n=2)
<= 2 weekly fish servings
60(n=114)
53(n=12)
Unadjusted analysis, n=135
Oken E, et al. Env Health Perspect 2005;113:1376-80.

Maternal 2nd tri
fish intake
(per svg/wk)
Maternal hair mercury at delivery
(per ppm)
Adjustment for nutrients and contaminants
(per svg/wk)
Change in 6 month VRM score
Fish 2.8 (0.2, 5.4) ---
Mercury --- -4.0 (-10.0, 2.0)
Fish & mercury 4.0 (1.3, 6.7) -7.5 (-13.7, -1.2)
Results in 6 month old infants (n=135). Adjusted for maternal age, race/ethnicity, education, marital status; infant sex, gestational age, fetal growth, breastfeeding, age at testing
Oken E, et al. Env Health Perspect 2005;113:1376-80.

Perspectives:
Competing Interests■ Toxicant exposure & harms■ Nutritional health benefits■ Ecosystem concerns■ Economic influences■ Economic influences

FAO “World review of Fisheries and Aquaculture” 2010

Humans and fish health
• Dramatic decline in fish populations, especially large pelagic (non-bottom dwelling) migratory fish such as tuna,
Source: Myers and Worm, 2005
migratory fish such as tuna, swordfish
• Estimated biomass just 10% of pre-industrial levels
• Demand for protein expected to grow another 50% by 2050

Aquaculture
May provide a solution to dwindling wild fish stocks:� Fastest growing food production industry� In 2008, 46% of fish food supply from aquaculture (vs.
<10% in 1980)
BUT, important ecological risks:BUT, important ecological risks:� Up to 1/3 wild catch for feed� Alteration of usual trophic levels� Increase infection, spread to wild populations� Use of hormones, antibiotics, pesticides� Concentrated animal waste� Escaped fish, impact wild populations� Loss of wetlands for farm development

Ecologic guidance

What is Optimal Fish Consumption Advice?
■ Communicate harms only – assume switch to lower Hg fish to achieve benefit

What is Optimal Fish Consumption Advice?
■ Communicate harms only – assume switch to lower Hg fish to achieve benefit
■ Communicate benefit only – assume benefit outweighs harms benefit outweighs harms

What is Optimal Fish Consumption Advice?
■ Communicate harms only – assume switch to lower Hg fish to achieve benefit
■ Communicate benefit only – assume benefit outweighs harms benefit outweighs harms
■ Communicate harms & benefits
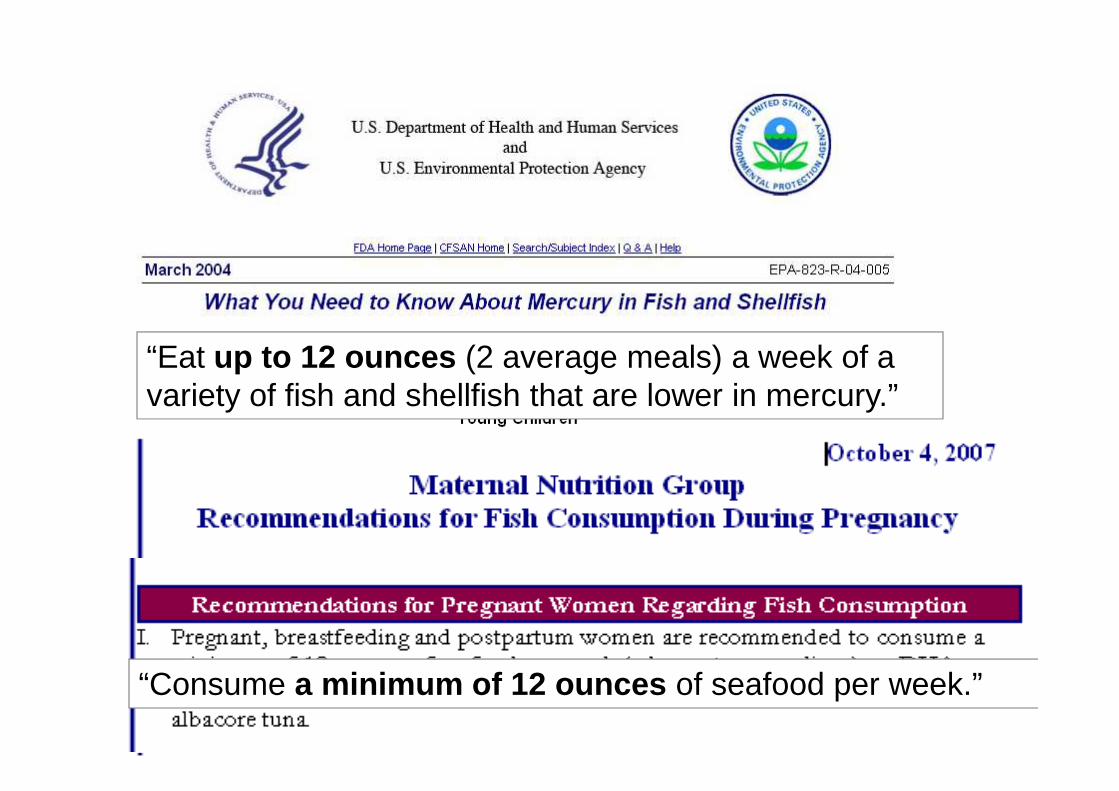
“Eat up to 12 ounces (2 average meals) a week of a variety of fish and shellfish that are lower in mercury.” variety of fish and shellfish that are lower in mercury.”
“Consume a minimum of 12 ounces of seafood per week.”


5
6
7
8
9
10
Mea
n s
ervi
ng
s p
er m
on
thDecline in fish consumptionAfter federal mercury advisory 1/01
4 fish combinedcanned tunadark meat fish
0
1
2
3
4
5
Apr-99 Jul-99 Oct-99 Jan-00 Apr-00 Jul-00 Oct-00 Jan-01 Apr-01 Jul-01 Oct-01 Jan-02
Month surveyed
Mea
n s
ervi
ng
s p
er m
on
th
Pre-advisory Post-advisory
Oken E, Kleinman K, Berland WE, Simon S, Rich-Edwards JW, Gillman MW. Obstetrics and Gynecology 2003;102(2):346-351.
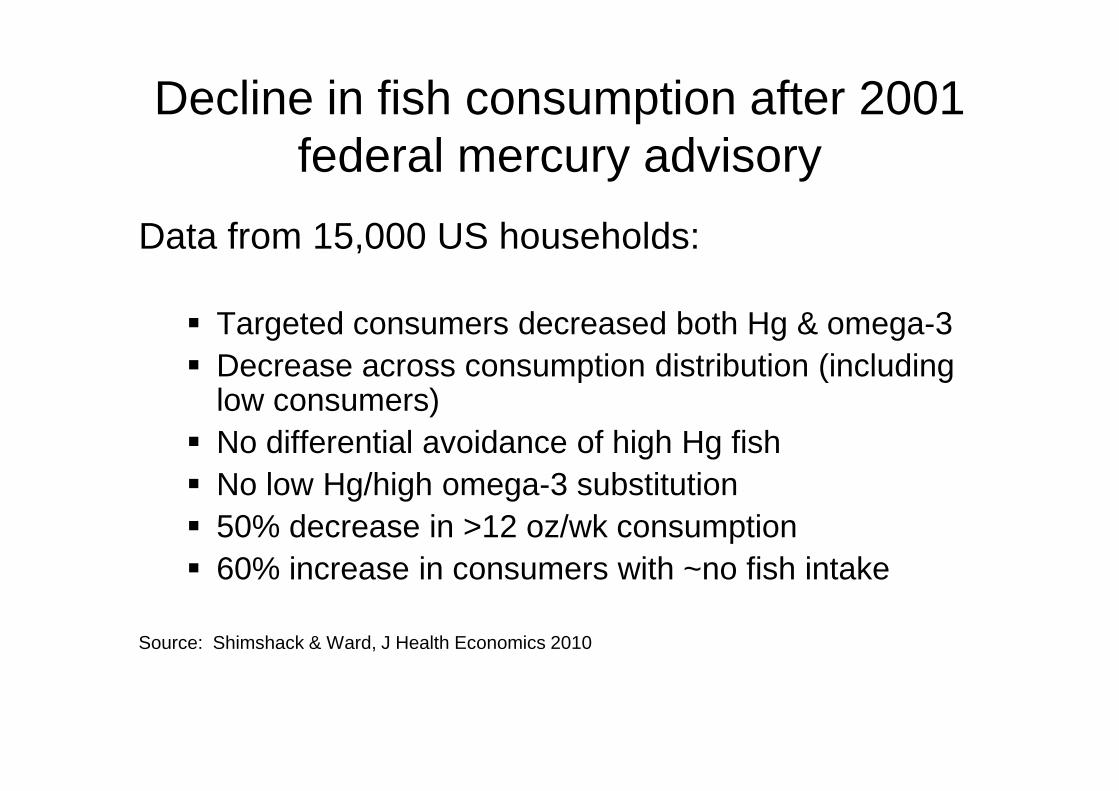
Data from 15,000 US households:
� Targeted consumers decreased both Hg & omega-3� Decrease across consumption distribution (including
low consumers)
Decline in fish consumption after 2001 federal mercury advisory
low consumers)� No differential avoidance of high Hg fish� No low Hg/high omega-3 substitution� 50% decrease in >12 oz/wk consumption� 60% increase in consumers with ~no fish intake
Source: Shimshack & Ward, J Health Economics 2010

What is Optimal Fish Consumption Advice?
■ Communicate harms only – assume switch to lower Hg fish to achieve benefit
■ Communicate benefit only – assume benefit outweighs harms benefit outweighs harms
■ Communicate harms & benefits■ Communicate risk trade offs
(contaminant vs. no fish)

What is Optimal Fish Consumption Advice?
■ Communicate harms only – assume switch to lower Hg fish to achieve benefit
■ Communicate benefit only – assume benefit outweighs harms benefit outweighs harms
■ Communicate harms & benefits■ Communicate risk trade offs
(contaminant vs. no fish)■ Species specific harm-benefit measures
(e.g., net effect)

Balancing health harms and benefits
Source: Ginsberg & Toal, EHP, 2009

http://www.washingtonpost.com/national/health-science/2012/04/03/gIQABd16sS_graphic.html

The Press
Health harmsHealth benefits
Grenier et al, Public Health Nutr 2010

The press
High Mercury Levels Are Found in Tuna SushiJanuary 23, 2008

The press
High Mercury Levels Are Found in Tuna SushiJanuary 23, 2008
Correction: January 26, 2008A chart with the continuation of a front-page article on Wednesday about high mercury levels found in tuna sushi in New York stores and restaurants referred imprecisely to what the Environmental Protection Agency deems to be an acceptable level of mercury consumption over a period of several months by an
adult of average weight. (To find the acceptable weekly level of consumption over the long term, the reference dose is multiplied by seven.)

No wonder women are confused
– “That’s the main thing I find confusing – so, like, salmon, that’s a pretty big fish, so maybe we shouldn’t eat it, but then maybe we should eat it because, like it’s higher in mercury but it’s also higher in good fat, so don’t eat it, but no, do eat it.”in good fat, so don’t eat it, but no, do eat it.”
– “You hear that fish is so good for you, yet on the other hand it’s filled with mercury and we need to look out for that…but yet we’re supposed to eat it at least twice a week.”
Bloomingdale A, Guthrie LB, Price S, Wright RO, Platek D, Haines J, Oken E. A qualitative study of fish consumption during pregnancy. American Journal of Clinical Nutrition 2010 Nov;92(5):1234-40.

Even MD’s are confused
Dear Dr. Oken,
I am sorry to bother you, but my wife (a nephrologist) and I (a thoracic surgeon) read your chapter and thought you would be the best person to possibly answer our you would be the best person to possibly answer our question.
My wife is breastfeeding our 2 month old and last night had grouper in a restaurant not realizing that this is a high mercury fish. Is this worrisome and should she stop breastfeeding?

Source Target population
Contaminant exposure
Fatty acid/ nutrient intake
Ecological impact
Economic influences
2004 FDA/EPA
Monterey Bay
EDF
Dietary Guidelines
Fish for your health
Blue Ocean Institute
Kidsafe
Fishwise
Washingon State DOH
Seafood Consumption Guides & Calculators
Connecticut State DPH
NRDC
Turtle Island
Food and Water Watch
Mercury Policy Project
National Geographic
Star Chefs
Greenpeace International
NOAA
Shedd Aquarium
Oken E, Choi AL, Karagas MR, Mariën K, Rheinberger CM, Schoeny R, Sunderland E, Korrick S.Environ Health Perspect. 2012 Jun;120(6):790-8.

Lessons Learned■ Cannot be approached with reductionist messages. E.g., not like
lowering cholesterol – ‘eat less red meat’And
■ With multiple competing risks, & consumer risk groups, a more comprehensive approach seems justified
But■ Experience suggests that more information is not necessarily health
promoting. Complex information processing costs time & cognitive effort; consumers may avoid these ‘costs’effort; consumers may avoid these ‘costs’
And■ Consumers have understandable limitations when making risk-risk
trade-offs: (1) nuanced response is difficult, and (2) often respond more to negative information (avoid food risk is priority).
■ Optimal approach may vary widely across consumers (need flexibility, multiple options, more comprehensive perspective)
(Taste, availability, & price are important determinants of seafood purchases)

Can women act on a nuanced message?

Intervention Brochure


Wallet card

2220
30
40
Ch
ange
in i
nta
ke o
f fi
sh (
g/d
ay)
Fish Intake
Ref
12
22
-10
0
10
20
Control Advice Advice + Gift Card
Ch
ange
in i
nta
ke o
f fi
sh (
g/d
ay)
Oken et al. Nutrition Journal 2013, 12:33

DHA Intake
161150
200
250Ch
ange
in in
take
of D
HA
(m
g/da
y)
Oken et al. Nutrition Journal 2013, 12:33
Ref
70
0
50
100
150
Control Advice Advice + Gift Card
Chan
ge in
inta
ke o
f DH
A (
mg/
day)

Mercury Intake
0.005
0
0.01
0.02
0.03
0.04
Ch
an
ge
in i
nta
ke o
f m
erc
ury
(mcg
/kg
/da
y)
Oken E, Guthrie LB, Bloomingdale A, Platek DN, Price S, Haines J, Gillman MW, Olsen SF, Bellinger DC, Wright RO.. Nutrition Journal 2013, 12:33
Ref-0.010
-0.04
-0.03
-0.02
-0.01
0
Control Advice Advice + Gift
Card
Ch
an
ge
in i
nta
ke o
f m
erc
ury
(mcg
/kg
/da
y)

How much fish do people eat?Depends on how you ask
1 question 4 questions 36 questions
Fish (sv/wk) 0.28 0.9 1.4
DHA (mg/d) 22 69 97
Hg (mcg/d) 0.42 1.25 1.60
200 mg/d DHA 0% 27% 36%
Oken et al. Public Health Nutr. 2013 Jul 24:1-11