persons engaged in work 80,000 persons not engaged in …. employment structure of the population of...
TRANSCRIPT
116
<Summary of the Results> I. Employment structure of the population of 15 years
old and over and households
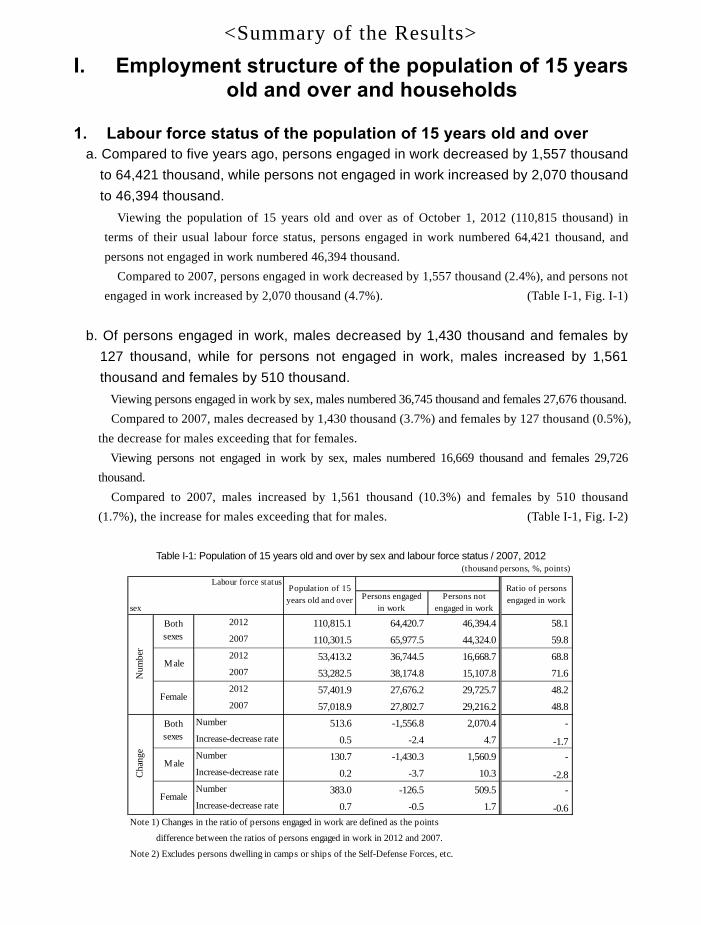
1. Labour force status of the population of 15 years old and over a. Compared to five years ago, persons engaged in work decreased by 1,557 thousand
to 64,421 thousand, while persons not engaged in work increased by 2,070 thousand to 46,394 thousand.
Viewing the population of 15 years old and over as of October 1, 2012 (110,815 thousand) in terms of their usual labour force status, persons engaged in work numbered 64,421 thousand, and persons not engaged in work numbered 46,394 thousand.
Compared to 2007, persons engaged in work decreased by 1,557 thousand (2.4%), and persons not engaged in work increased by 2,070 thousand (4.7%). (Table I-1, Fig. I-1)
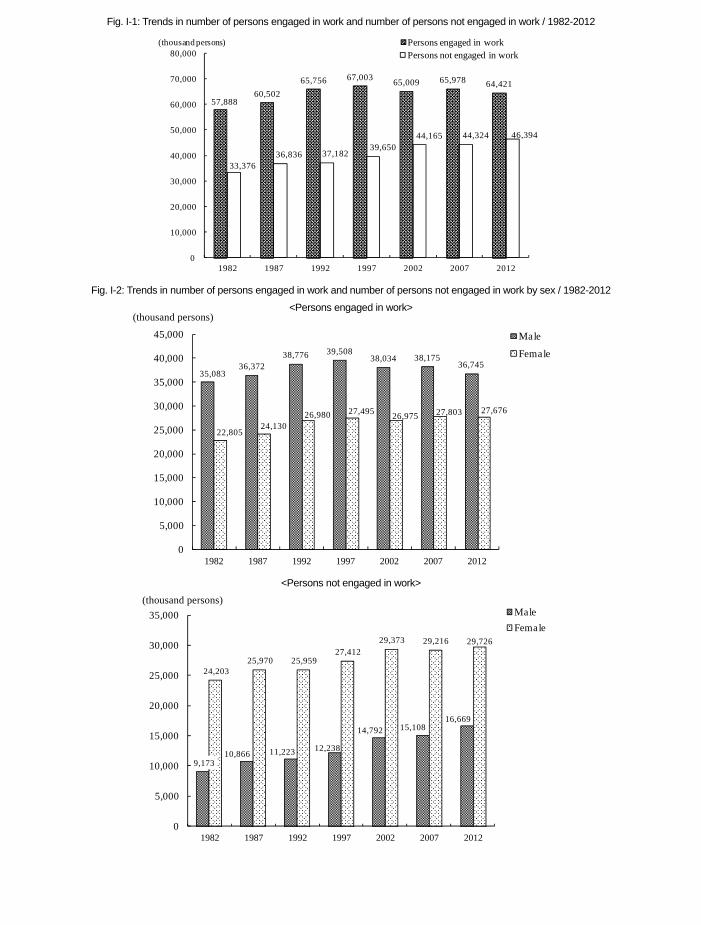
b. Of persons engaged in work, males decreased by 1,430 thousand and females by 127 thousand, while for persons not engaged in work, males increased by 1,561 thousand and females by 510 thousand.
Viewing persons engaged in work by sex, males numbered 36,745 thousand and females 27,676 thousand. Compared to 2007, males decreased by 1,430 thousand (3.7%) and females by 127 thousand (0.5%),
the decrease for males exceeding that for females. Viewing persons not engaged in work by sex, males numbered 16,669 thousand and females 29,726
thousand. Compared to 2007, males increased by 1,561 thousand (10.3%) and females by 510 thousand
(1.7%), the increase for males exceeding that for males. (Table I-1, Fig. I-2)
Table I-1: Population of 15 years old and over by sex and labour force status / 2007, 2012
(thousand persons, %, points)Labour force status
sexPersons engaged
in workPersons not
engaged in work2012 110,815.1 64,420.7 46,394.4 58.12007 110,301.5 65,977.5 44,324.0 59.82012 53,413.2 36,744.5 16,668.7 68.82007 53,282.5 38,174.8 15,107.8 71.62012 57,401.9 27,676.2 29,725.7 48.22007 57,018.9 27,802.7 29,216.2 48.8
Number 513.6 -1,556.8 2,070.4 - Increase-decrease rate 0.5 -2.4 4.7 -1.7Number 130.7 -1,430.3 1,560.9 - Increase-decrease rate 0.2 -3.7 10.3 -2.8Number 383.0 -126.5 509.5 - Increase-decrease rate 0.7 -0.5 1.7 -0.6
Note 1) Changes in the ratio of persons engaged in work are defined as the points
difference between the ratios of persons engaged in work in 2012 and 2007.
Note 2) Excludes persons dwelling in camps or ships of the Self-Defense Forces, etc.
Population of 15years old and over
Ratio of personsengaged in work
Num
ber
Bothsexes
Male
Female
Cha
nge
Bothsexes
Male
Female
Fig. I-1: Trends in number of persons engaged in work and number of persons not engaged in work / 1982-2012
Fig. I-2: Trends in number of persons engaged in work and number of persons not engaged in work by sex / 1982-2012
<Persons engaged in work>
<Persons not engaged in work>
57,888 60,502
65,756 67,003 65,009 65,978 64,421
33,376 36,836 37,182
39,650 44,165 44,324 46,394
0
10,000
20,000
30,000
40,000
50,000
60,000
70,000
80,000
1982 1987 1992 1997 2002 2007 2012
Persons engaged in workPersons not engaged in work
(thousand persons)
35,083 36,372
38,776 39,508 38,034 38,175
36,745
22,80524,130
26,980 27,495 26,975 27,803 27,676
0
5,000
10,000
15,000
20,000
25,000
30,000
35,000
40,000
45,000
1982 1987 1992 1997 2002 2007 2012
Male
Female
9,173 10,866 11,223 12,238
14,792 15,108 16,669
24,20325,970 25,959
27,41229,373 29,216 29,726
0
5,000
10,000
15,000
20,000
25,000
30,000
35,000
1982 1987 1992 1997 2002 2007 2012
MaleFemale
(thousand persons)
(thousand persons)
117
<Summary of the Results> I. Employment structure of the population of 15 years
old and over and households
1. Labour force status of the population of 15 years old and over a. Compared to five years ago, persons engaged in work decreased by 1,557 thousand
to 64,421 thousand, while persons not engaged in work increased by 2,070 thousand to 46,394 thousand.
Viewing the population of 15 years old and over as of October 1, 2012 (110,815 thousand) in terms of their usual labour force status, persons engaged in work numbered 64,421 thousand, and persons not engaged in work numbered 46,394 thousand.
Compared to 2007, persons engaged in work decreased by 1,557 thousand (2.4%), and persons not engaged in work increased by 2,070 thousand (4.7%). (Table I-1, Fig. I-1)
b. Of persons engaged in work, males decreased by 1,430 thousand and females by 127 thousand, while for persons not engaged in work, males increased by 1,561 thousand and females by 510 thousand.
Viewing persons engaged in work by sex, males numbered 36,745 thousand and females 27,676 thousand. Compared to 2007, males decreased by 1,430 thousand (3.7%) and females by 127 thousand (0.5%),
the decrease for males exceeding that for females. Viewing persons not engaged in work by sex, males numbered 16,669 thousand and females 29,726
thousand. Compared to 2007, males increased by 1,561 thousand (10.3%) and females by 510 thousand
(1.7%), the increase for males exceeding that for males. (Table I-1, Fig. I-2)
Table I-1: Population of 15 years old and over by sex and labour force status / 2007, 2012
(thousand persons, %, points)Labour force status
sexPersons engaged
in workPersons not
engaged in work2012 110,815.1 64,420.7 46,394.4 58.12007 110,301.5 65,977.5 44,324.0 59.82012 53,413.2 36,744.5 16,668.7 68.82007 53,282.5 38,174.8 15,107.8 71.62012 57,401.9 27,676.2 29,725.7 48.22007 57,018.9 27,802.7 29,216.2 48.8
Number 513.6 -1,556.8 2,070.4 - Increase-decrease rate 0.5 -2.4 4.7 -1.7Number 130.7 -1,430.3 1,560.9 - Increase-decrease rate 0.2 -3.7 10.3 -2.8Number 383.0 -126.5 509.5 - Increase-decrease rate 0.7 -0.5 1.7 -0.6
Note 1) Changes in the ratio of persons engaged in work are defined as the points
difference between the ratios of persons engaged in work in 2012 and 2007.
Note 2) Excludes persons dwelling in camps or ships of the Self-Defense Forces, etc.
Population of 15years old and over
Ratio of personsengaged in work
Num
ber
Bothsexes
Male
Female
Cha
nge
Bothsexes
Male
Female
Fig. I-1: Trends in number of persons engaged in work and number of persons not engaged in work / 1982-2012
Fig. I-2: Trends in number of persons engaged in work and number of persons not engaged in work by sex / 1982-2012
<Persons engaged in work>
<Persons not engaged in work>
57,888 60,502
65,756 67,003 65,009 65,978 64,421
33,376 36,836 37,182
39,650 44,165 44,324 46,394
0
10,000
20,000
30,000
40,000
50,000
60,000
70,000
80,000
1982 1987 1992 1997 2002 2007 2012
Persons engaged in workPersons not engaged in work
(thousand persons)
35,083 36,372
38,776 39,508 38,034 38,175
36,745
22,80524,130
26,980 27,495 26,975 27,803 27,676
0
5,000
10,000
15,000
20,000
25,000
30,000
35,000
40,000
45,000
1982 1987 1992 1997 2002 2007 2012
Male
Female
9,173 10,866 11,223 12,238
14,792 15,108 16,669
24,20325,970 25,959
27,41229,373 29,216 29,726
0
5,000
10,000
15,000
20,000
25,000
30,000
35,000
1982 1987 1992 1997 2002 2007 2012
MaleFemale
(thousand persons)
(thousand persons)
118
2. Persons engaged in work
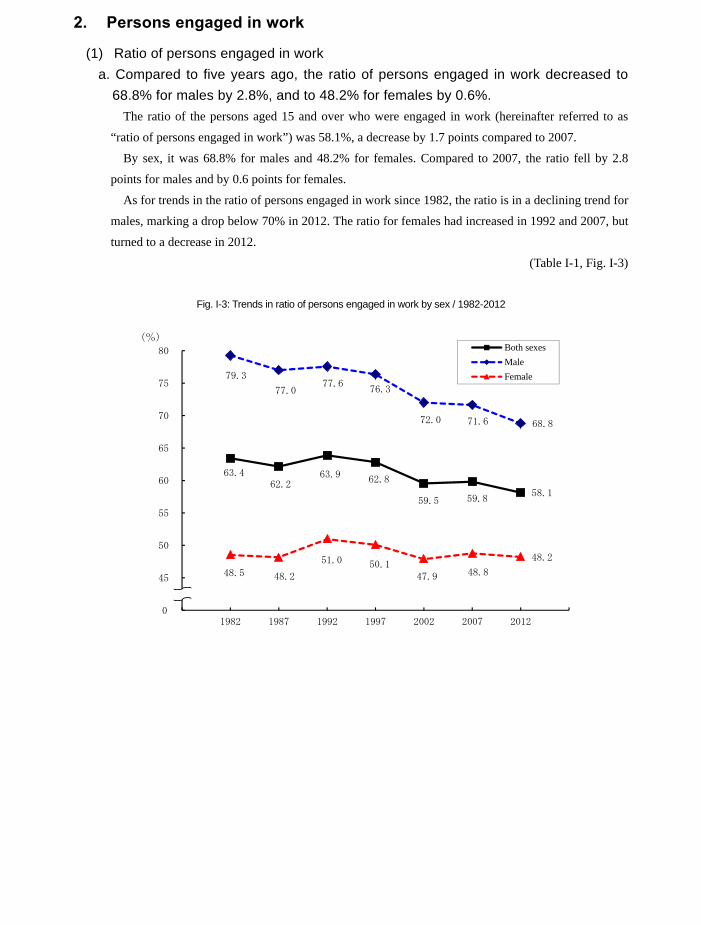
(1) Ratio of persons engaged in work a. Compared to five years ago, the ratio of persons engaged in work decreased to
68.8% for males by 2.8%, and to 48.2% for females by 0.6%. The ratio of the persons aged 15 and over who were engaged in work (hereinafter referred to as
“ratio of persons engaged in work”) was 58.1%, a decrease by 1.7 points compared to 2007.
By sex, it was 68.8% for males and 48.2% for females. Compared to 2007, the ratio fell by 2.8
points for males and by 0.6 points for females.
As for trends in the ratio of persons engaged in work since 1982, the ratio is in a declining trend for
males, marking a drop below 70% in 2012. The ratio for females had increased in 1992 and 2007, but
turned to a decrease in 2012.
(Table I-1, Fig. I-3)
Fig. I-3: Trends in ratio of persons engaged in work by sex / 1982-2012
63.4 62.2
63.9 62.8
59.5 59.8 58.1
79.3
77.0 77.6
76.3
72.0 71.6 68.8
48.5 48.2
51.0 50.1 47.9 48.8
48.2
40
45
50
55
60
65
70
75
80
1982 1987 1992 1997 2002 2007 2012
(%)Both sexesMaleFemale
00
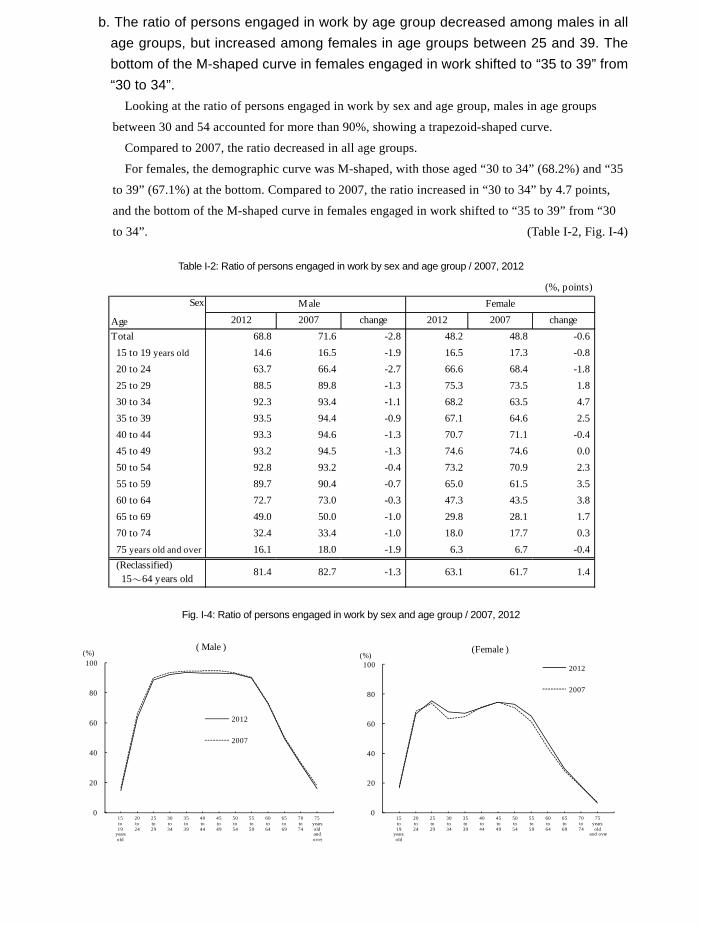
b. The ratio of persons engaged in work by age group decreased among males in all age groups, but increased among females in age groups between 25 and 39. The bottom of the M-shaped curve in females engaged in work shifted to “35 to 39” from “30 to 34”.
Looking at the ratio of persons engaged in work by sex and age group, males in age groups
between 30 and 54 accounted for more than 90%, showing a trapezoid-shaped curve.
Compared to 2007, the ratio decreased in all age groups.
For females, the demographic curve was M-shaped, with those aged “30 to 34” (68.2%) and “35
to 39” (67.1%) at the bottom. Compared to 2007, the ratio increased in “30 to 34” by 4.7 points,
and the bottom of the M-shaped curve in females engaged in work shifted to “35 to 39” from “30
to 34”. (Table I-2, Fig. I-4)
Table I-2: Ratio of persons engaged in work by sex and age group / 2007, 2012
Fig. I-4: Ratio of persons engaged in work by sex and age group / 2007, 2012
(%, points)Sex Male Female
Age 2012 2007 change 2012 2007 changeTotal 68.8 71.6 -2.8 48.2 48.8 -0.6 15 to 19 years old 14.6 16.5 -1.9 16.5 17.3 -0.8 20 to 24 63.7 66.4 -2.7 66.6 68.4 -1.8 25 to 29 88.5 89.8 -1.3 75.3 73.5 1.8 30 to 34 92.3 93.4 -1.1 68.2 63.5 4.7 35 to 39 93.5 94.4 -0.9 67.1 64.6 2.5 40 to 44 93.3 94.6 -1.3 70.7 71.1 -0.4 45 to 49 93.2 94.5 -1.3 74.6 74.6 0.0 50 to 54 92.8 93.2 -0.4 73.2 70.9 2.3 55 to 59 89.7 90.4 -0.7 65.0 61.5 3.5 60 to 64 72.7 73.0 -0.3 47.3 43.5 3.8 65 to 69 49.0 50.0 -1.0 29.8 28.1 1.7 70 to 74 32.4 33.4 -1.0 18.0 17.7 0.3 75 years old and over 16.1 18.0 -1.9 6.3 6.7 -0.4 (Reclassified) 15~64 years old
81.4 82.7 -1.3 63.1 61.7 1.4
0
20
40
60
80
100
15to19
yearsold
20to24
25to29
30to34
35to39
40to44
45to49
50to54
55to59
60to64
65to69
70to74
75yearsoldand over
(%)( Male )
2012
2007
0
20
40
60
80
100
15to19
yearsold
20to24
25to29
30to34
35to39
40to44
45to49
50to54
55to59
60to64
65to69
70to74
75yearsold
and over
(%)(Female )
2012
2007
119
2. Persons engaged in work
(1) Ratio of persons engaged in work a. Compared to five years ago, the ratio of persons engaged in work decreased to
68.8% for males by 2.8%, and to 48.2% for females by 0.6%. The ratio of the persons aged 15 and over who were engaged in work (hereinafter referred to as
“ratio of persons engaged in work”) was 58.1%, a decrease by 1.7 points compared to 2007.
By sex, it was 68.8% for males and 48.2% for females. Compared to 2007, the ratio fell by 2.8
points for males and by 0.6 points for females.
As for trends in the ratio of persons engaged in work since 1982, the ratio is in a declining trend for
males, marking a drop below 70% in 2012. The ratio for females had increased in 1992 and 2007, but
turned to a decrease in 2012.
(Table I-1, Fig. I-3)
Fig. I-3: Trends in ratio of persons engaged in work by sex / 1982-2012
63.4 62.2
63.9 62.8
59.5 59.8 58.1
79.3
77.0 77.6
76.3
72.0 71.6 68.8
48.5 48.2
51.0 50.1 47.9 48.8
48.2
40
45
50
55
60
65
70
75
80
1982 1987 1992 1997 2002 2007 2012
(%)Both sexesMaleFemale
00
b. The ratio of persons engaged in work by age group decreased among males in all age groups, but increased among females in age groups between 25 and 39. The bottom of the M-shaped curve in females engaged in work shifted to “35 to 39” from “30 to 34”.
Looking at the ratio of persons engaged in work by sex and age group, males in age groups
between 30 and 54 accounted for more than 90%, showing a trapezoid-shaped curve.
Compared to 2007, the ratio decreased in all age groups.
For females, the demographic curve was M-shaped, with those aged “30 to 34” (68.2%) and “35
to 39” (67.1%) at the bottom. Compared to 2007, the ratio increased in “30 to 34” by 4.7 points,
and the bottom of the M-shaped curve in females engaged in work shifted to “35 to 39” from “30
to 34”. (Table I-2, Fig. I-4)
Table I-2: Ratio of persons engaged in work by sex and age group / 2007, 2012
Fig. I-4: Ratio of persons engaged in work by sex and age group / 2007, 2012
(%, points)Sex Male Female
Age 2012 2007 change 2012 2007 changeTotal 68.8 71.6 -2.8 48.2 48.8 -0.6 15 to 19 years old 14.6 16.5 -1.9 16.5 17.3 -0.8 20 to 24 63.7 66.4 -2.7 66.6 68.4 -1.8 25 to 29 88.5 89.8 -1.3 75.3 73.5 1.8 30 to 34 92.3 93.4 -1.1 68.2 63.5 4.7 35 to 39 93.5 94.4 -0.9 67.1 64.6 2.5 40 to 44 93.3 94.6 -1.3 70.7 71.1 -0.4 45 to 49 93.2 94.5 -1.3 74.6 74.6 0.0 50 to 54 92.8 93.2 -0.4 73.2 70.9 2.3 55 to 59 89.7 90.4 -0.7 65.0 61.5 3.5 60 to 64 72.7 73.0 -0.3 47.3 43.5 3.8 65 to 69 49.0 50.0 -1.0 29.8 28.1 1.7 70 to 74 32.4 33.4 -1.0 18.0 17.7 0.3 75 years old and over 16.1 18.0 -1.9 6.3 6.7 -0.4 (Reclassified) 15~64 years old
81.4 82.7 -1.3 63.1 61.7 1.4
0
20
40
60
80
100
15to19
yearsold
20to24
25to29
30to34
35to39
40to44
45to49
50to54
55to59
60to64
65to69
70to74
75yearsoldand over
(%)( Male )
2012
2007
0
20
40
60
80
100
15to19
yearsold
20to24
25to29
30to34
35to39
40to44
45to49
50to54
55to59
60to64
65to69
70to74
75yearsold
and over
(%)(Female )
2012
2007
120
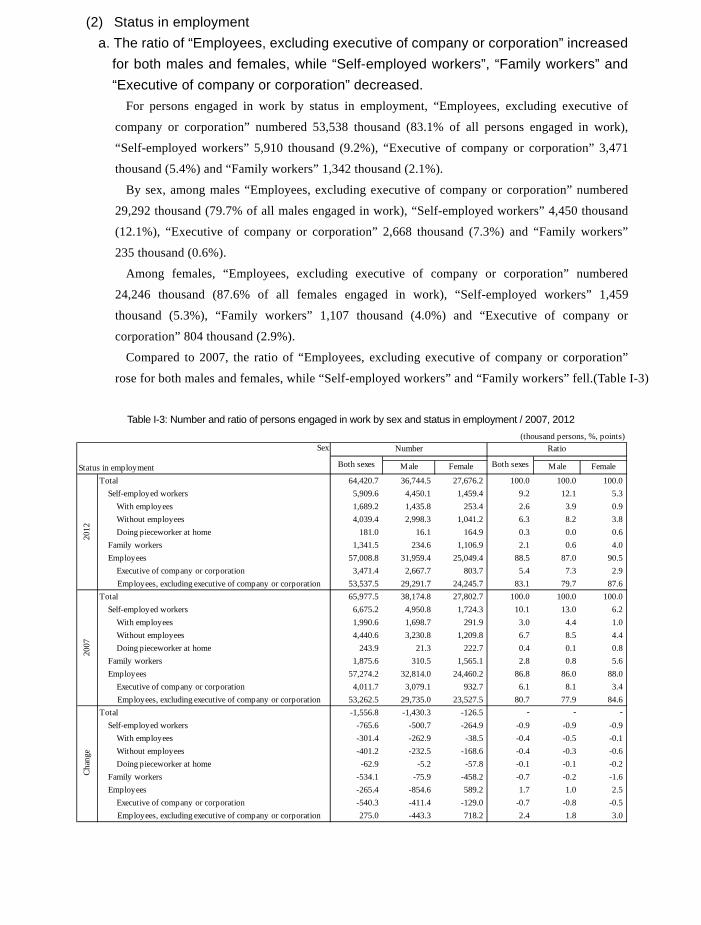
(2) Status in employment a. The ratio of “Employees, excluding executive of company or corporation” increased
for both males and females, while “Self-employed workers”, “Family workers” and “Executive of company or corporation” decreased.
For persons engaged in work by status in employment, “Employees, excluding executive of
company or corporation” numbered 53,538 thousand (83.1% of all persons engaged in work),
“Self-employed workers” 5,910 thousand (9.2%), “Executive of company or corporation” 3,471
thousand (5.4%) and “Family workers” 1,342 thousand (2.1%).
By sex, among males “Employees, excluding executive of company or corporation” numbered
29,292 thousand (79.7% of all males engaged in work), “Self-employed workers” 4,450 thousand
(12.1%), “Executive of company or corporation” 2,668 thousand (7.3%) and “Family workers”
235 thousand (0.6%).
Among females, “Employees, excluding executive of company or corporation” numbered
24,246 thousand (87.6% of all females engaged in work), “Self-employed workers” 1,459
thousand (5.3%), “Family workers” 1,107 thousand (4.0%) and “Executive of company or
corporation” 804 thousand (2.9%).
Compared to 2007, the ratio of “Employees, excluding executive of company or corporation”
rose for both males and females, while “Self-employed workers” and “Family workers” fell.(Table I-3)
Table I-3: Number and ratio of persons engaged in work by sex and status in employment / 2007, 2012
(thousand persons, %, points)Sex
Status in employment Male Female Male Female
Total 64,420.7 36,744.5 27,676.2 100.0 100.0 100.0 Self-employed workers 5,909.6 4,450.1 1,459.4 9.2 12.1 5.3
With employees 1,689.2 1,435.8 253.4 2.6 3.9 0.9 Without employees 4,039.4 2,998.3 1,041.2 6.3 8.2 3.8
Doing pieceworker at home 181.0 16.1 164.9 0.3 0.0 0.6 Family workers 1,341.5 234.6 1,106.9 2.1 0.6 4.0
Employees 57,008.8 31,959.4 25,049.4 88.5 87.0 90.5 Executive of company or corporation 3,471.4 2,667.7 803.7 5.4 7.3 2.9
Employees, excluding executive of company or corporation 53,537.5 29,291.7 24,245.7 83.1 79.7 87.6Total 65,977.5 38,174.8 27,802.7 100.0 100.0 100.0
Self-employed workers 6,675.2 4,950.8 1,724.3 10.1 13.0 6.2 With employees 1,990.6 1,698.7 291.9 3.0 4.4 1.0 Without employees 4,440.6 3,230.8 1,209.8 6.7 8.5 4.4 Doing pieceworker at home 243.9 21.3 222.7 0.4 0.1 0.8 Family workers 1,875.6 310.5 1,565.1 2.8 0.8 5.6 Employees 57,274.2 32,814.0 24,460.2 86.8 86.0 88.0 Executive of company or corporation 4,011.7 3,079.1 932.7 6.1 8.1 3.4 Employees, excluding executive of company or corporation 53,262.5 29,735.0 23,527.5 80.7 77.9 84.6Total -1,556.8 -1,430.3 -126.5 - - -
Self-employed workers -765.6 -500.7 -264.9 -0.9 -0.9 -0.9 With employees -301.4 -262.9 -38.5 -0.4 -0.5 -0.1 Without employees -401.2 -232.5 -168.6 -0.4 -0.3 -0.6 Doing pieceworker at home -62.9 -5.2 -57.8 -0.1 -0.1 -0.2 Family workers -534.1 -75.9 -458.2 -0.7 -0.2 -1.6 Employees -265.4 -854.6 589.2 1.7 1.0 2.5 Executive of company or corporation -540.3 -411.4 -129.0 -0.7 -0.8 -0.5 Employees, excluding executive of company or corporation 275.0 -443.3 718.2 2.4 1.8 3.0
2007
Both sexes Both sexes
Cha
nge
Number Ratio
2012
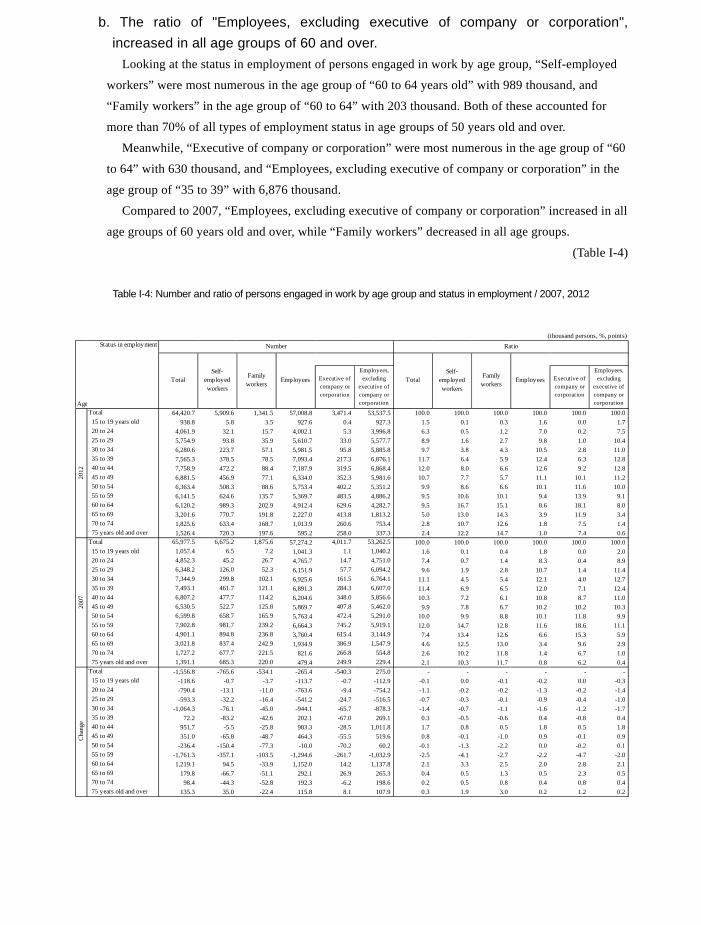
b. The ratio of "Employees, excluding executive of company or corporation", increased in all age groups of 60 and over.
Looking at the status in employment of persons engaged in work by age group, “Self-employed
workers” were most numerous in the age group of “60 to 64 years old” with 989 thousand, and
“Family workers” in the age group of “60 to 64” with 203 thousand. Both of these accounted for
more than 70% of all types of employment status in age groups of 50 years old and over.
Meanwhile, “Executive of company or corporation” were most numerous in the age group of “60
to 64” with 630 thousand, and “Employees, excluding executive of company or corporation” in the
age group of “35 to 39” with 6,876 thousand.
Compared to 2007, “Employees, excluding executive of company or corporation” increased in all
age groups of 60 years old and over, while “Family workers” decreased in all age groups.
(Table I-4)
Table I-4: Number and ratio of persons engaged in work by age group and status in employment / 2007, 2012
(thousand persons, %, points)Status in employment
Age
Executive ofcompany orcorporation
Employees,excluding
executive ofcompany orcorporation
Executive ofcompany orcorporation
Employees,excluding
executive ofcompany orcorporation
Total 64,420.7 5,909.6 1,341.5 57,008.8 3,471.4 53,537.5 100.0 100.0 100.0 100.0 100.0 100.0 15 to 19 years old 938.8 5.8 3.5 927.6 0.4 927.3 1.5 0.1 0.3 1.6 0.0 1.7 20 to 24 4,061.9 32.1 15.7 4,002.1 5.3 3,996.8 6.3 0.5 1.2 7.0 0.2 7.5 25 to 29 5,754.9 93.8 35.9 5,610.7 33.0 5,577.7 8.9 1.6 2.7 9.8 1.0 10.4 30 to 34 6,280.6 223.7 57.1 5,981.5 95.8 5,885.8 9.7 3.8 4.3 10.5 2.8 11.0 35 to 39 7,565.3 378.5 78.5 7,093.4 217.3 6,876.1 11.7 6.4 5.9 12.4 6.3 12.8 40 to 44 7,758.9 472.2 88.4 7,187.9 319.5 6,868.4 12.0 8.0 6.6 12.6 9.2 12.8 45 to 49 6,881.5 456.9 77.1 6,334.0 352.3 5,981.6 10.7 7.7 5.7 11.1 10.1 11.2 50 to 54 6,363.4 508.3 88.6 5,753.4 402.2 5,351.2 9.9 8.6 6.6 10.1 11.6 10.0 55 to 59 6,141.5 624.6 135.7 5,369.7 483.5 4,886.2 9.5 10.6 10.1 9.4 13.9 9.1 60 to 64 6,120.2 989.3 202.9 4,912.4 629.6 4,282.7 9.5 16.7 15.1 8.6 18.1 8.0 65 to 69 3,201.6 770.7 191.8 2,227.0 413.8 1,813.2 5.0 13.0 14.3 3.9 11.9 3.4 70 to 74 1,825.6 633.4 168.7 1,013.9 260.6 753.4 2.8 10.7 12.6 1.8 7.5 1.4 75 years old and over 1,526.4 720.3 197.6 595.2 258.0 337.3 2.4 12.2 14.7 1.0 7.4 0.6Total 65,977.5 6,675.2 1,875.6 57,274.2 4,011.7 53,262.5 100.0 100.0 100.0 100.0 100.0 100.0 15 to 19 years old 1,057.4 6.5 7.2 1,041.3 1.1 1,040.2 1.6 0.1 0.4 1.8 0.0 2.0 20 to 24 4,852.3 45.2 26.7 4,765.7 14.7 4,751.0 7.4 0.7 1.4 8.3 0.4 8.9 25 to 29 6,348.2 126.0 52.3 6,151.9 57.7 6,094.2 9.6 1.9 2.8 10.7 1.4 11.4 30 to 34 7,344.9 299.8 102.1 6,925.6 161.5 6,764.1 11.1 4.5 5.4 12.1 4.0 12.7 35 to 39 7,493.1 461.7 121.1 6,891.3 284.3 6,607.0 11.4 6.9 6.5 12.0 7.1 12.4 40 to 44 6,807.2 477.7 114.2 6,204.6 348.0 5,856.6 10.3 7.2 6.1 10.8 8.7 11.0 45 to 49 6,530.5 522.7 125.8 5,869.7 407.8 5,462.0 9.9 7.8 6.7 10.2 10.2 10.3 50 to 54 6,599.8 658.7 165.9 5,763.4 472.4 5,291.0 10.0 9.9 8.8 10.1 11.8 9.9 55 to 59 7,902.8 981.7 239.2 6,664.3 745.2 5,919.1 12.0 14.7 12.8 11.6 18.6 11.1 60 to 64 4,901.1 894.8 236.8 3,760.4 615.4 3,144.9 7.4 13.4 12.6 6.6 15.3 5.9 65 to 69 3,021.8 837.4 242.9 1,934.9 386.9 1,547.9 4.6 12.5 13.0 3.4 9.6 2.9 70 to 74 1,727.2 677.7 221.5 821.6 266.8 554.8 2.6 10.2 11.8 1.4 6.7 1.0 75 years old and over 1,391.1 685.3 220.0 479.4 249.9 229.4 2.1 10.3 11.7 0.8 6.2 0.4Total -1,556.8 -765.6 -534.1 -265.4 -540.3 275.0 - - - - - - 15 to 19 years old -118.6 -0.7 -3.7 -113.7 -0.7 -112.9 -0.1 0.0 -0.1 -0.2 0.0 -0.3 20 to 24 -790.4 -13.1 -11.0 -763.6 -9.4 -754.2 -1.1 -0.2 -0.2 -1.3 -0.2 -1.4 25 to 29 -593.3 -32.2 -16.4 -541.2 -24.7 -516.5 -0.7 -0.3 -0.1 -0.9 -0.4 -1.0 30 to 34 -1,064.3 -76.1 -45.0 -944.1 -65.7 -878.3 -1.4 -0.7 -1.1 -1.6 -1.2 -1.7 35 to 39 72.2 -83.2 -42.6 202.1 -67.0 269.1 0.3 -0.5 -0.6 0.4 -0.8 0.4 40 to 44 951.7 -5.5 -25.8 983.3 -28.5 1,011.8 1.7 0.8 0.5 1.8 0.5 1.8 45 to 49 351.0 -65.8 -48.7 464.3 -55.5 519.6 0.8 -0.1 -1.0 0.9 -0.1 0.9 50 to 54 -236.4 -150.4 -77.3 -10.0 -70.2 60.2 -0.1 -1.3 -2.2 0.0 -0.2 0.1 55 to 59 -1,761.3 -357.1 -103.5 -1,294.6 -261.7 -1,032.9 -2.5 -4.1 -2.7 -2.2 -4.7 -2.0 60 to 64 1,219.1 94.5 -33.9 1,152.0 14.2 1,137.8 2.1 3.3 2.5 2.0 2.8 2.1 65 to 69 179.8 -66.7 -51.1 292.1 26.9 265.3 0.4 0.5 1.3 0.5 2.3 0.5 70 to 74 98.4 -44.3 -52.8 192.3 -6.2 198.6 0.2 0.5 0.8 0.4 0.8 0.4 75 years old and over 135.3 35.0 -22.4 115.8 8.1 107.9 0.3 1.9 3.0 0.2 1.2 0.2
Self-employedworkers
Cha
nge
Number Ratio
TotalSelf-
employedworkers
Familyworkers
Employees Total
2012
2007
Familyworkers
Employees
121
(2) Status in employment a. The ratio of “Employees, excluding executive of company or corporation” increased
for both males and females, while “Self-employed workers”, “Family workers” and “Executive of company or corporation” decreased.
For persons engaged in work by status in employment, “Employees, excluding executive of
company or corporation” numbered 53,538 thousand (83.1% of all persons engaged in work),
“Self-employed workers” 5,910 thousand (9.2%), “Executive of company or corporation” 3,471
thousand (5.4%) and “Family workers” 1,342 thousand (2.1%).
By sex, among males “Employees, excluding executive of company or corporation” numbered
29,292 thousand (79.7% of all males engaged in work), “Self-employed workers” 4,450 thousand
(12.1%), “Executive of company or corporation” 2,668 thousand (7.3%) and “Family workers”
235 thousand (0.6%).
Among females, “Employees, excluding executive of company or corporation” numbered
24,246 thousand (87.6% of all females engaged in work), “Self-employed workers” 1,459
thousand (5.3%), “Family workers” 1,107 thousand (4.0%) and “Executive of company or
corporation” 804 thousand (2.9%).
Compared to 2007, the ratio of “Employees, excluding executive of company or corporation”
rose for both males and females, while “Self-employed workers” and “Family workers” fell.(Table I-3)
Table I-3: Number and ratio of persons engaged in work by sex and status in employment / 2007, 2012
(thousand persons, %, points)Sex
Status in employment Male Female Male Female
Total 64,420.7 36,744.5 27,676.2 100.0 100.0 100.0 Self-employed workers 5,909.6 4,450.1 1,459.4 9.2 12.1 5.3
With employees 1,689.2 1,435.8 253.4 2.6 3.9 0.9 Without employees 4,039.4 2,998.3 1,041.2 6.3 8.2 3.8
Doing pieceworker at home 181.0 16.1 164.9 0.3 0.0 0.6 Family workers 1,341.5 234.6 1,106.9 2.1 0.6 4.0
Employees 57,008.8 31,959.4 25,049.4 88.5 87.0 90.5 Executive of company or corporation 3,471.4 2,667.7 803.7 5.4 7.3 2.9
Employees, excluding executive of company or corporation 53,537.5 29,291.7 24,245.7 83.1 79.7 87.6Total 65,977.5 38,174.8 27,802.7 100.0 100.0 100.0
Self-employed workers 6,675.2 4,950.8 1,724.3 10.1 13.0 6.2 With employees 1,990.6 1,698.7 291.9 3.0 4.4 1.0 Without employees 4,440.6 3,230.8 1,209.8 6.7 8.5 4.4 Doing pieceworker at home 243.9 21.3 222.7 0.4 0.1 0.8 Family workers 1,875.6 310.5 1,565.1 2.8 0.8 5.6 Employees 57,274.2 32,814.0 24,460.2 86.8 86.0 88.0 Executive of company or corporation 4,011.7 3,079.1 932.7 6.1 8.1 3.4 Employees, excluding executive of company or corporation 53,262.5 29,735.0 23,527.5 80.7 77.9 84.6Total -1,556.8 -1,430.3 -126.5 - - -
Self-employed workers -765.6 -500.7 -264.9 -0.9 -0.9 -0.9 With employees -301.4 -262.9 -38.5 -0.4 -0.5 -0.1 Without employees -401.2 -232.5 -168.6 -0.4 -0.3 -0.6 Doing pieceworker at home -62.9 -5.2 -57.8 -0.1 -0.1 -0.2 Family workers -534.1 -75.9 -458.2 -0.7 -0.2 -1.6 Employees -265.4 -854.6 589.2 1.7 1.0 2.5 Executive of company or corporation -540.3 -411.4 -129.0 -0.7 -0.8 -0.5 Employees, excluding executive of company or corporation 275.0 -443.3 718.2 2.4 1.8 3.0
2007
Both sexes Both sexes
Cha
nge
Number Ratio
2012
b. The ratio of "Employees, excluding executive of company or corporation", increased in all age groups of 60 and over.
Looking at the status in employment of persons engaged in work by age group, “Self-employed
workers” were most numerous in the age group of “60 to 64 years old” with 989 thousand, and
“Family workers” in the age group of “60 to 64” with 203 thousand. Both of these accounted for
more than 70% of all types of employment status in age groups of 50 years old and over.
Meanwhile, “Executive of company or corporation” were most numerous in the age group of “60
to 64” with 630 thousand, and “Employees, excluding executive of company or corporation” in the
age group of “35 to 39” with 6,876 thousand.
Compared to 2007, “Employees, excluding executive of company or corporation” increased in all
age groups of 60 years old and over, while “Family workers” decreased in all age groups.
(Table I-4)
Table I-4: Number and ratio of persons engaged in work by age group and status in employment / 2007, 2012
(thousand persons, %, points)Status in employment
Age
Executive ofcompany orcorporation
Employees,excluding
executive ofcompany orcorporation
Executive ofcompany orcorporation
Employees,excluding
executive ofcompany orcorporation
Total 64,420.7 5,909.6 1,341.5 57,008.8 3,471.4 53,537.5 100.0 100.0 100.0 100.0 100.0 100.0 15 to 19 years old 938.8 5.8 3.5 927.6 0.4 927.3 1.5 0.1 0.3 1.6 0.0 1.7 20 to 24 4,061.9 32.1 15.7 4,002.1 5.3 3,996.8 6.3 0.5 1.2 7.0 0.2 7.5 25 to 29 5,754.9 93.8 35.9 5,610.7 33.0 5,577.7 8.9 1.6 2.7 9.8 1.0 10.4 30 to 34 6,280.6 223.7 57.1 5,981.5 95.8 5,885.8 9.7 3.8 4.3 10.5 2.8 11.0 35 to 39 7,565.3 378.5 78.5 7,093.4 217.3 6,876.1 11.7 6.4 5.9 12.4 6.3 12.8 40 to 44 7,758.9 472.2 88.4 7,187.9 319.5 6,868.4 12.0 8.0 6.6 12.6 9.2 12.8 45 to 49 6,881.5 456.9 77.1 6,334.0 352.3 5,981.6 10.7 7.7 5.7 11.1 10.1 11.2 50 to 54 6,363.4 508.3 88.6 5,753.4 402.2 5,351.2 9.9 8.6 6.6 10.1 11.6 10.0 55 to 59 6,141.5 624.6 135.7 5,369.7 483.5 4,886.2 9.5 10.6 10.1 9.4 13.9 9.1 60 to 64 6,120.2 989.3 202.9 4,912.4 629.6 4,282.7 9.5 16.7 15.1 8.6 18.1 8.0 65 to 69 3,201.6 770.7 191.8 2,227.0 413.8 1,813.2 5.0 13.0 14.3 3.9 11.9 3.4 70 to 74 1,825.6 633.4 168.7 1,013.9 260.6 753.4 2.8 10.7 12.6 1.8 7.5 1.4 75 years old and over 1,526.4 720.3 197.6 595.2 258.0 337.3 2.4 12.2 14.7 1.0 7.4 0.6Total 65,977.5 6,675.2 1,875.6 57,274.2 4,011.7 53,262.5 100.0 100.0 100.0 100.0 100.0 100.0 15 to 19 years old 1,057.4 6.5 7.2 1,041.3 1.1 1,040.2 1.6 0.1 0.4 1.8 0.0 2.0 20 to 24 4,852.3 45.2 26.7 4,765.7 14.7 4,751.0 7.4 0.7 1.4 8.3 0.4 8.9 25 to 29 6,348.2 126.0 52.3 6,151.9 57.7 6,094.2 9.6 1.9 2.8 10.7 1.4 11.4 30 to 34 7,344.9 299.8 102.1 6,925.6 161.5 6,764.1 11.1 4.5 5.4 12.1 4.0 12.7 35 to 39 7,493.1 461.7 121.1 6,891.3 284.3 6,607.0 11.4 6.9 6.5 12.0 7.1 12.4 40 to 44 6,807.2 477.7 114.2 6,204.6 348.0 5,856.6 10.3 7.2 6.1 10.8 8.7 11.0 45 to 49 6,530.5 522.7 125.8 5,869.7 407.8 5,462.0 9.9 7.8 6.7 10.2 10.2 10.3 50 to 54 6,599.8 658.7 165.9 5,763.4 472.4 5,291.0 10.0 9.9 8.8 10.1 11.8 9.9 55 to 59 7,902.8 981.7 239.2 6,664.3 745.2 5,919.1 12.0 14.7 12.8 11.6 18.6 11.1 60 to 64 4,901.1 894.8 236.8 3,760.4 615.4 3,144.9 7.4 13.4 12.6 6.6 15.3 5.9 65 to 69 3,021.8 837.4 242.9 1,934.9 386.9 1,547.9 4.6 12.5 13.0 3.4 9.6 2.9 70 to 74 1,727.2 677.7 221.5 821.6 266.8 554.8 2.6 10.2 11.8 1.4 6.7 1.0 75 years old and over 1,391.1 685.3 220.0 479.4 249.9 229.4 2.1 10.3 11.7 0.8 6.2 0.4Total -1,556.8 -765.6 -534.1 -265.4 -540.3 275.0 - - - - - - 15 to 19 years old -118.6 -0.7 -3.7 -113.7 -0.7 -112.9 -0.1 0.0 -0.1 -0.2 0.0 -0.3 20 to 24 -790.4 -13.1 -11.0 -763.6 -9.4 -754.2 -1.1 -0.2 -0.2 -1.3 -0.2 -1.4 25 to 29 -593.3 -32.2 -16.4 -541.2 -24.7 -516.5 -0.7 -0.3 -0.1 -0.9 -0.4 -1.0 30 to 34 -1,064.3 -76.1 -45.0 -944.1 -65.7 -878.3 -1.4 -0.7 -1.1 -1.6 -1.2 -1.7 35 to 39 72.2 -83.2 -42.6 202.1 -67.0 269.1 0.3 -0.5 -0.6 0.4 -0.8 0.4 40 to 44 951.7 -5.5 -25.8 983.3 -28.5 1,011.8 1.7 0.8 0.5 1.8 0.5 1.8 45 to 49 351.0 -65.8 -48.7 464.3 -55.5 519.6 0.8 -0.1 -1.0 0.9 -0.1 0.9 50 to 54 -236.4 -150.4 -77.3 -10.0 -70.2 60.2 -0.1 -1.3 -2.2 0.0 -0.2 0.1 55 to 59 -1,761.3 -357.1 -103.5 -1,294.6 -261.7 -1,032.9 -2.5 -4.1 -2.7 -2.2 -4.7 -2.0 60 to 64 1,219.1 94.5 -33.9 1,152.0 14.2 1,137.8 2.1 3.3 2.5 2.0 2.8 2.1 65 to 69 179.8 -66.7 -51.1 292.1 26.9 265.3 0.4 0.5 1.3 0.5 2.3 0.5 70 to 74 98.4 -44.3 -52.8 192.3 -6.2 198.6 0.2 0.5 0.8 0.4 0.8 0.4 75 years old and over 135.3 35.0 -22.4 115.8 8.1 107.9 0.3 1.9 3.0 0.2 1.2 0.2
Self-employedworkers
Cha
nge
Number Ratio
TotalSelf-
employedworkers
Familyworkers
Employees Total
2012
2007
Familyworkers
Employees
122
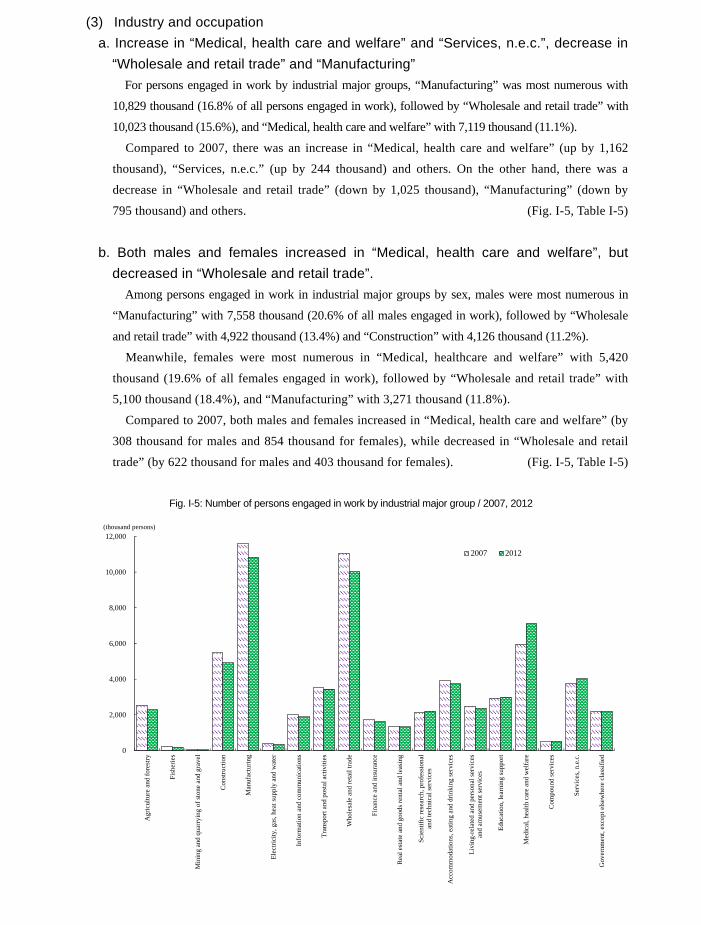
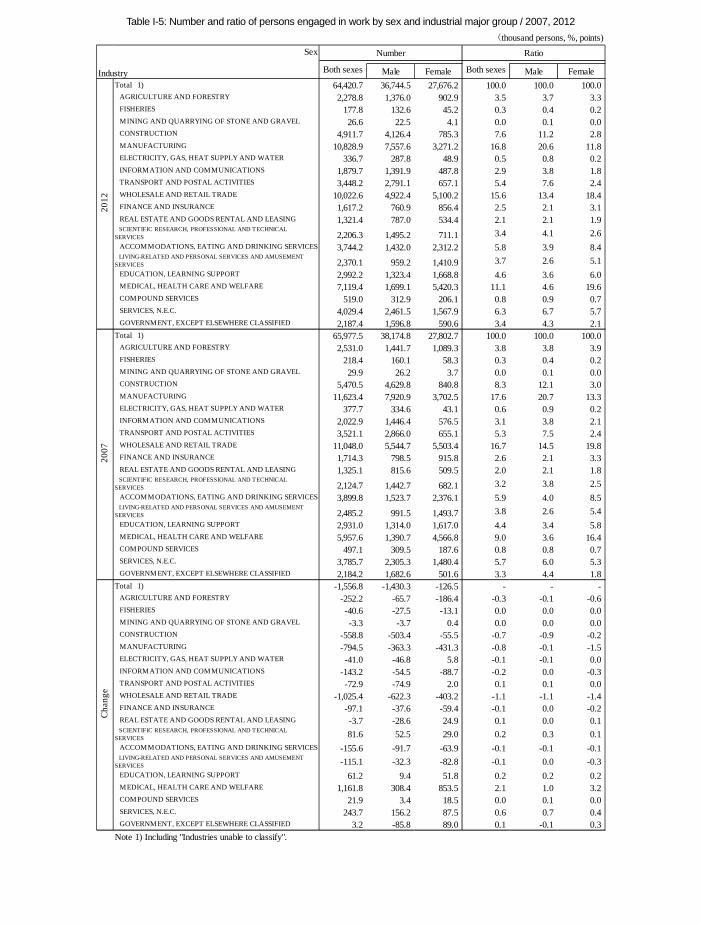
(3) Industry and occupation a. Increase in “Medical, health care and welfare” and “Services, n.e.c.”, decrease in
“Wholesale and retail trade” and “Manufacturing” For persons engaged in work by industrial major groups, “Manufacturing” was most numerous with
10,829 thousand (16.8% of all persons engaged in work), followed by “Wholesale and retail trade” with
10,023 thousand (15.6%), and “Medical, health care and welfare” with 7,119 thousand (11.1%).
Compared to 2007, there was an increase in “Medical, health care and welfare” (up by 1,162
thousand), “Services, n.e.c.” (up by 244 thousand) and others. On the other hand, there was a
decrease in “Wholesale and retail trade” (down by 1,025 thousand), “Manufacturing” (down by
795 thousand) and others. (Fig. I-5, Table I-5)
b. Both males and females increased in “Medical, health care and welfare”, but decreased in “Wholesale and retail trade”.
Among persons engaged in work in industrial major groups by sex, males were most numerous in
“Manufacturing” with 7,558 thousand (20.6% of all males engaged in work), followed by “Wholesale
and retail trade” with 4,922 thousand (13.4%) and “Construction” with 4,126 thousand (11.2%).
Meanwhile, females were most numerous in “Medical, healthcare and welfare” with 5,420
thousand (19.6% of all females engaged in work), followed by “Wholesale and retail trade” with
5,100 thousand (18.4%), and “Manufacturing” with 3,271 thousand (11.8%).
Compared to 2007, both males and females increased in “Medical, health care and welfare” (by
308 thousand for males and 854 thousand for females), while decreased in “Wholesale and retail
trade” (by 622 thousand for males and 403 thousand for females). (Fig. I-5, Table I-5)
Fig. I-5: Number of persons engaged in work by industrial major group / 2007, 2012
0
2,000
4,000
6,000
8,000
10,000
12,000
Agr
icul
ture
and
fore
stry
Fish
erie
s
Min
ing
and
quar
ryin
g of
ston
e an
d gr
avel
Con
stru
ctio
n
Man
ufac
turin
g
Elec
trici
ty, g
as, h
eat s
uppl
y an
d w
ater
Info
rmat
ion
and
com
mun
icat
ions
Tran
spor
t and
pos
tal a
ctiv
ities
Who
lesa
le a
nd re
tail
trade
Fina
nce
and
insu
ranc
e
Rea
l est
ate
and
good
s ren
tal a
nd le
asin
g
Scie
ntifi
c re
sear
ch, p
rofe
ssio
nal
and
tech
nica
l ser
vice
s
Acc
omm
odat
ions
, eat
ing
and
drin
king
serv
ices
Livi
ng-r
elat
ed a
nd p
erso
nal s
ervi
ces
and
amus
emen
t ser
vice
s
Educ
atio
n, le
arni
ng su
ppor
t
Med
ical
, hea
lth c
are
and
wel
fare
Com
poun
d se
rvic
es
Serv
ices
, n.e
.c.
Gov
ernm
ent,
exce
pt e
lsew
here
cla
ssifi
ed
(thousand persons)
2007 2012
Table I-5: Number and ratio of persons engaged in work by sex and industrial major group / 2007, 2012
(thousand persons, %, points)Sex
Industry Male Female Male FemaleTotal 1) 64,420.7 36,744.5 27,676.2 100.0 100.0 100.0 AGRICULTURE AND FORESTRY 2,278.8 1,376.0 902.9 3.5 3.7 3.3 FISHERIES 177.8 132.6 45.2 0.3 0.4 0.2 MINING AND QUARRYING OF STONE AND GRAVEL 26.6 22.5 4.1 0.0 0.1 0.0 CONSTRUCTION 4,911.7 4,126.4 785.3 7.6 11.2 2.8 MANUFACTURING 10,828.9 7,557.6 3,271.2 16.8 20.6 11.8 ELECTRICITY, GAS, HEAT SUPPLY AND WATER 336.7 287.8 48.9 0.5 0.8 0.2 INFORMATION AND COMMUNICATIONS 1,879.7 1,391.9 487.8 2.9 3.8 1.8 TRANSPORT AND POSTAL ACTIVITIES 3,448.2 2,791.1 657.1 5.4 7.6 2.4 WHOLESALE AND RETAIL TRADE 10,022.6 4,922.4 5,100.2 15.6 13.4 18.4 FINANCE AND INSURANCE 1,617.2 760.9 856.4 2.5 2.1 3.1 REAL ESTATE AND GOODS RENTAL AND LEASING 1,321.4 787.0 534.4 2.1 2.1 1.9 SCIENTIFIC RESEARCH, PROFESSIONAL AND TECHNICAL SERVICES 2,206.3 1,495.2 711.1 3.4 4.1 2.6 ACCOMMODATIONS, EATING AND DRINKING SERVICES 3,744.2 1,432.0 2,312.2 5.8 3.9 8.4 LIVING-RELATED AND PERSONAL SERVICES AND AMUSEMENT SERVICES 2,370.1 959.2 1,410.9 3.7 2.6 5.1 EDUCATION, LEARNING SUPPORT 2,992.2 1,323.4 1,668.8 4.6 3.6 6.0 MEDICAL, HEALTH CARE AND WELFARE 7,119.4 1,699.1 5,420.3 11.1 4.6 19.6 COMPOUND SERVICES 519.0 312.9 206.1 0.8 0.9 0.7 SERVICES, N.E.C. 4,029.4 2,461.5 1,567.9 6.3 6.7 5.7 GOVERNMENT, EXCEPT ELSEWHERE CLASSIFIED 2,187.4 1,596.8 590.6 3.4 4.3 2.1Total 1) 65,977.5 38,174.8 27,802.7 100.0 100.0 100.0 AGRICULTURE AND FORESTRY 2,531.0 1,441.7 1,089.3 3.8 3.8 3.9 FISHERIES 218.4 160.1 58.3 0.3 0.4 0.2 MINING AND QUARRYING OF STONE AND GRAVEL 29.9 26.2 3.7 0.0 0.1 0.0 CONSTRUCTION 5,470.5 4,629.8 840.8 8.3 12.1 3.0 MANUFACTURING 11,623.4 7,920.9 3,702.5 17.6 20.7 13.3 ELECTRICITY, GAS, HEAT SUPPLY AND WATER 377.7 334.6 43.1 0.6 0.9 0.2 INFORMATION AND COMMUNICATIONS 2,022.9 1,446.4 576.5 3.1 3.8 2.1 TRANSPORT AND POSTAL ACTIVITIES 3,521.1 2,866.0 655.1 5.3 7.5 2.4 WHOLESALE AND RETAIL TRADE 11,048.0 5,544.7 5,503.4 16.7 14.5 19.8 FINANCE AND INSURANCE 1,714.3 798.5 915.8 2.6 2.1 3.3 REAL ESTATE AND GOODS RENTAL AND LEASING 1,325.1 815.6 509.5 2.0 2.1 1.8 SCIENTIFIC RESEARCH, PROFESSIONAL AND TECHNICAL SERVICES 2,124.7 1,442.7 682.1 3.2 3.8 2.5 ACCOMMODATIONS, EATING AND DRINKING SERVICES 3,899.8 1,523.7 2,376.1 5.9 4.0 8.5 LIVING-RELATED AND PERSONAL SERVICES AND AMUSEMENT SERVICES 2,485.2 991.5 1,493.7 3.8 2.6 5.4 EDUCATION, LEARNING SUPPORT 2,931.0 1,314.0 1,617.0 4.4 3.4 5.8 MEDICAL, HEALTH CARE AND WELFARE 5,957.6 1,390.7 4,566.8 9.0 3.6 16.4 COMPOUND SERVICES 497.1 309.5 187.6 0.8 0.8 0.7 SERVICES, N.E.C. 3,785.7 2,305.3 1,480.4 5.7 6.0 5.3 GOVERNMENT, EXCEPT ELSEWHERE CLASSIFIED 2,184.2 1,682.6 501.6 3.3 4.4 1.8Total 1) -1,556.8 -1,430.3 -126.5 - - - AGRICULTURE AND FORESTRY -252.2 -65.7 -186.4 -0.3 -0.1 -0.6 FISHERIES -40.6 -27.5 -13.1 0.0 0.0 0.0 MINING AND QUARRYING OF STONE AND GRAVEL -3.3 -3.7 0.4 0.0 0.0 0.0 CONSTRUCTION -558.8 -503.4 -55.5 -0.7 -0.9 -0.2 MANUFACTURING -794.5 -363.3 -431.3 -0.8 -0.1 -1.5 ELECTRICITY, GAS, HEAT SUPPLY AND WATER -41.0 -46.8 5.8 -0.1 -0.1 0.0 INFORMATION AND COMMUNICATIONS -143.2 -54.5 -88.7 -0.2 0.0 -0.3 TRANSPORT AND POSTAL ACTIVITIES -72.9 -74.9 2.0 0.1 0.1 0.0 WHOLESALE AND RETAIL TRADE -1,025.4 -622.3 -403.2 -1.1 -1.1 -1.4 FINANCE AND INSURANCE -97.1 -37.6 -59.4 -0.1 0.0 -0.2 REAL ESTATE AND GOODS RENTAL AND LEASING -3.7 -28.6 24.9 0.1 0.0 0.1 SCIENTIFIC RESEARCH, PROFESSIONAL AND TECHNICAL SERVICES 81.6 52.5 29.0 0.2 0.3 0.1 ACCOMMODATIONS, EATING AND DRINKING SERVICES -155.6 -91.7 -63.9 -0.1 -0.1 -0.1 LIVING-RELATED AND PERSONAL SERVICES AND AMUSEMENT SERVICES -115.1 -32.3 -82.8 -0.1 0.0 -0.3 EDUCATION, LEARNING SUPPORT 61.2 9.4 51.8 0.2 0.2 0.2 MEDICAL, HEALTH CARE AND WELFARE 1,161.8 308.4 853.5 2.1 1.0 3.2 COMPOUND SERVICES 21.9 3.4 18.5 0.0 0.1 0.0 SERVICES, N.E.C. 243.7 156.2 87.5 0.6 0.7 0.4 GOVERNMENT, EXCEPT ELSEWHERE CLASSIFIED 3.2 -85.8 89.0 0.1 -0.1 0.3Note 1) Including "Industries unable to classify".
2007
Cha
nge
Number Ratio
Both sexes Both sexes
2012
123
(3) Industry and occupation a. Increase in “Medical, health care and welfare” and “Services, n.e.c.”, decrease in
“Wholesale and retail trade” and “Manufacturing” For persons engaged in work by industrial major groups, “Manufacturing” was most numerous with
10,829 thousand (16.8% of all persons engaged in work), followed by “Wholesale and retail trade” with
10,023 thousand (15.6%), and “Medical, health care and welfare” with 7,119 thousand (11.1%).
Compared to 2007, there was an increase in “Medical, health care and welfare” (up by 1,162
thousand), “Services, n.e.c.” (up by 244 thousand) and others. On the other hand, there was a
decrease in “Wholesale and retail trade” (down by 1,025 thousand), “Manufacturing” (down by
795 thousand) and others. (Fig. I-5, Table I-5)
b. Both males and females increased in “Medical, health care and welfare”, but decreased in “Wholesale and retail trade”.
Among persons engaged in work in industrial major groups by sex, males were most numerous in
“Manufacturing” with 7,558 thousand (20.6% of all males engaged in work), followed by “Wholesale
and retail trade” with 4,922 thousand (13.4%) and “Construction” with 4,126 thousand (11.2%).
Meanwhile, females were most numerous in “Medical, healthcare and welfare” with 5,420
thousand (19.6% of all females engaged in work), followed by “Wholesale and retail trade” with
5,100 thousand (18.4%), and “Manufacturing” with 3,271 thousand (11.8%).
Compared to 2007, both males and females increased in “Medical, health care and welfare” (by
308 thousand for males and 854 thousand for females), while decreased in “Wholesale and retail
trade” (by 622 thousand for males and 403 thousand for females). (Fig. I-5, Table I-5)
Fig. I-5: Number of persons engaged in work by industrial major group / 2007, 2012
0
2,000
4,000
6,000
8,000
10,000
12,000
Agr
icul
ture
and
fore
stry
Fish
erie
s
Min
ing
and
quar
ryin
g of
ston
e an
d gr
avel
Con
stru
ctio
n
Man
ufac
turin
g
Elec
trici
ty, g
as, h
eat s
uppl
y an
d w
ater
Info
rmat
ion
and
com
mun
icat
ions
Tran
spor
t and
pos
tal a
ctiv
ities
Who
lesa
le a
nd re
tail
trade
Fina
nce
and
insu
ranc
e
Rea
l est
ate
and
good
s ren
tal a
nd le
asin
g
Scie
ntifi
c re
sear
ch, p
rofe
ssio
nal
and
tech
nica
l ser
vice
s
Acc
omm
odat
ions
, eat
ing
and
drin
king
serv
ices
Livi
ng-r
elat
ed a
nd p
erso
nal s
ervi
ces
and
amus
emen
t ser
vice
s
Educ
atio
n, le
arni
ng su
ppor
t
Med
ical
, hea
lth c
are
and
wel
fare
Com
poun
d se
rvic
es
Serv
ices
, n.e
.c.
Gov
ernm
ent,
exce
pt e
lsew
here
cla
ssifi
ed
(thousand persons)
2007 2012
Table I-5: Number and ratio of persons engaged in work by sex and industrial major group / 2007, 2012
(thousand persons, %, points)Sex
Industry Male Female Male FemaleTotal 1) 64,420.7 36,744.5 27,676.2 100.0 100.0 100.0 AGRICULTURE AND FORESTRY 2,278.8 1,376.0 902.9 3.5 3.7 3.3 FISHERIES 177.8 132.6 45.2 0.3 0.4 0.2 MINING AND QUARRYING OF STONE AND GRAVEL 26.6 22.5 4.1 0.0 0.1 0.0 CONSTRUCTION 4,911.7 4,126.4 785.3 7.6 11.2 2.8 MANUFACTURING 10,828.9 7,557.6 3,271.2 16.8 20.6 11.8 ELECTRICITY, GAS, HEAT SUPPLY AND WATER 336.7 287.8 48.9 0.5 0.8 0.2 INFORMATION AND COMMUNICATIONS 1,879.7 1,391.9 487.8 2.9 3.8 1.8 TRANSPORT AND POSTAL ACTIVITIES 3,448.2 2,791.1 657.1 5.4 7.6 2.4 WHOLESALE AND RETAIL TRADE 10,022.6 4,922.4 5,100.2 15.6 13.4 18.4 FINANCE AND INSURANCE 1,617.2 760.9 856.4 2.5 2.1 3.1 REAL ESTATE AND GOODS RENTAL AND LEASING 1,321.4 787.0 534.4 2.1 2.1 1.9 SCIENTIFIC RESEARCH, PROFESSIONAL AND TECHNICALSERVICES 2,206.3 1,495.2 711.1 3.4 4.1 2.6 ACCOMMODATIONS, EATING AND DRINKING SERVICES 3,744.2 1,432.0 2,312.2 5.8 3.9 8.4 LIVING-RELATED AND PERSONAL SERVICES AND AMUSEMENTSERVICES 2,370.1 959.2 1,410.9 3.7 2.6 5.1 EDUCATION, LEARNING SUPPORT 2,992.2 1,323.4 1,668.8 4.6 3.6 6.0 MEDICAL, HEALTH CARE AND WELFARE 7,119.4 1,699.1 5,420.3 11.1 4.6 19.6 COMPOUND SERVICES 519.0 312.9 206.1 0.8 0.9 0.7 SERVICES, N.E.C. 4,029.4 2,461.5 1,567.9 6.3 6.7 5.7 GOVERNMENT, EXCEPT ELSEWHERE CLASSIFIED 2,187.4 1,596.8 590.6 3.4 4.3 2.1Total 1) 65,977.5 38,174.8 27,802.7 100.0 100.0 100.0 AGRICULTURE AND FORESTRY 2,531.0 1,441.7 1,089.3 3.8 3.8 3.9 FISHERIES 218.4 160.1 58.3 0.3 0.4 0.2 MINING AND QUARRYING OF STONE AND GRAVEL 29.9 26.2 3.7 0.0 0.1 0.0 CONSTRUCTION 5,470.5 4,629.8 840.8 8.3 12.1 3.0 MANUFACTURING 11,623.4 7,920.9 3,702.5 17.6 20.7 13.3 ELECTRICITY, GAS, HEAT SUPPLY AND WATER 377.7 334.6 43.1 0.6 0.9 0.2 INFORMATION AND COMMUNICATIONS 2,022.9 1,446.4 576.5 3.1 3.8 2.1 TRANSPORT AND POSTAL ACTIVITIES 3,521.1 2,866.0 655.1 5.3 7.5 2.4 WHOLESALE AND RETAIL TRADE 11,048.0 5,544.7 5,503.4 16.7 14.5 19.8 FINANCE AND INSURANCE 1,714.3 798.5 915.8 2.6 2.1 3.3 REAL ESTATE AND GOODS RENTAL AND LEASING 1,325.1 815.6 509.5 2.0 2.1 1.8 SCIENTIFIC RESEARCH, PROFESSIONAL AND TECHNICALSERVICES 2,124.7 1,442.7 682.1 3.2 3.8 2.5 ACCOMMODATIONS, EATING AND DRINKING SERVICES 3,899.8 1,523.7 2,376.1 5.9 4.0 8.5 LIVING-RELATED AND PERSONAL SERVICES AND AMUSEMENTSERVICES 2,485.2 991.5 1,493.7 3.8 2.6 5.4 EDUCATION, LEARNING SUPPORT 2,931.0 1,314.0 1,617.0 4.4 3.4 5.8 MEDICAL, HEALTH CARE AND WELFARE 5,957.6 1,390.7 4,566.8 9.0 3.6 16.4 COMPOUND SERVICES 497.1 309.5 187.6 0.8 0.8 0.7 SERVICES, N.E.C. 3,785.7 2,305.3 1,480.4 5.7 6.0 5.3 GOVERNMENT, EXCEPT ELSEWHERE CLASSIFIED 2,184.2 1,682.6 501.6 3.3 4.4 1.8Total 1) -1,556.8 -1,430.3 -126.5 - - - AGRICULTURE AND FORESTRY -252.2 -65.7 -186.4 -0.3 -0.1 -0.6 FISHERIES -40.6 -27.5 -13.1 0.0 0.0 0.0 MINING AND QUARRYING OF STONE AND GRAVEL -3.3 -3.7 0.4 0.0 0.0 0.0 CONSTRUCTION -558.8 -503.4 -55.5 -0.7 -0.9 -0.2 MANUFACTURING -794.5 -363.3 -431.3 -0.8 -0.1 -1.5 ELECTRICITY, GAS, HEAT SUPPLY AND WATER -41.0 -46.8 5.8 -0.1 -0.1 0.0 INFORMATION AND COMMUNICATIONS -143.2 -54.5 -88.7 -0.2 0.0 -0.3 TRANSPORT AND POSTAL ACTIVITIES -72.9 -74.9 2.0 0.1 0.1 0.0 WHOLESALE AND RETAIL TRADE -1,025.4 -622.3 -403.2 -1.1 -1.1 -1.4 FINANCE AND INSURANCE -97.1 -37.6 -59.4 -0.1 0.0 -0.2 REAL ESTATE AND GOODS RENTAL AND LEASING -3.7 -28.6 24.9 0.1 0.0 0.1 SCIENTIFIC RESEARCH, PROFESSIONAL AND TECHNICALSERVICES 81.6 52.5 29.0 0.2 0.3 0.1 ACCOMMODATIONS, EATING AND DRINKING SERVICES -155.6 -91.7 -63.9 -0.1 -0.1 -0.1 LIVING-RELATED AND PERSONAL SERVICES AND AMUSEMENTSERVICES -115.1 -32.3 -82.8 -0.1 0.0 -0.3 EDUCATION, LEARNING SUPPORT 61.2 9.4 51.8 0.2 0.2 0.2 MEDICAL, HEALTH CARE AND WELFARE 1,161.8 308.4 853.5 2.1 1.0 3.2 COMPOUND SERVICES 21.9 3.4 18.5 0.0 0.1 0.0 SERVICES, N.E.C. 243.7 156.2 87.5 0.6 0.7 0.4 GOVERNMENT, EXCEPT ELSEWHERE CLASSIFIED 3.2 -85.8 89.0 0.1 -0.1 0.3Note 1) Including "Industries unable to classify".
2007
Cha
nge
Number Ratio
Both sexes Both sexes
2012
124
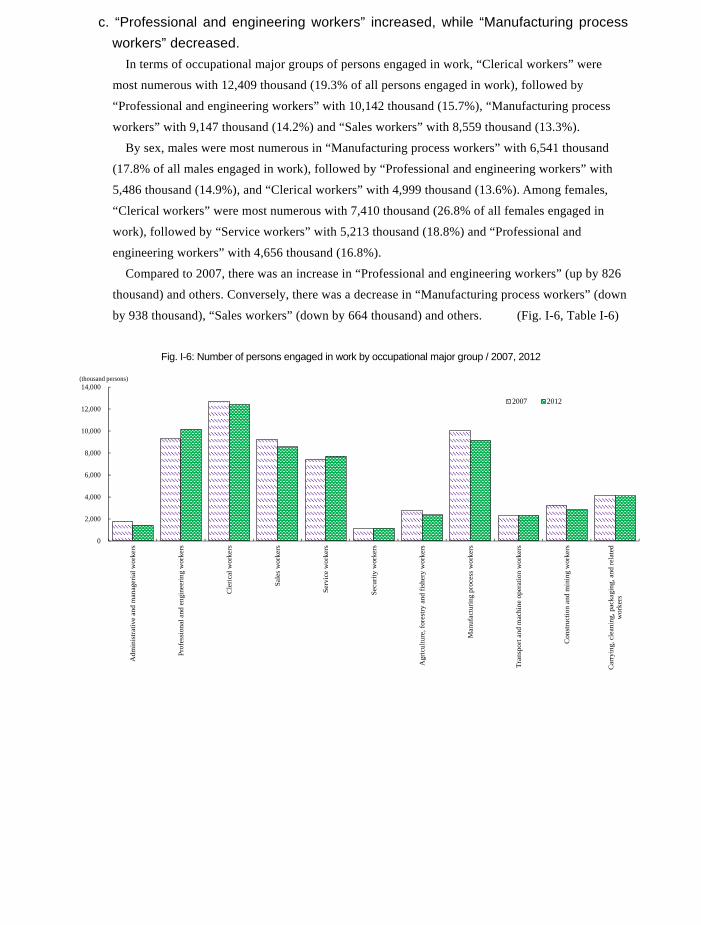
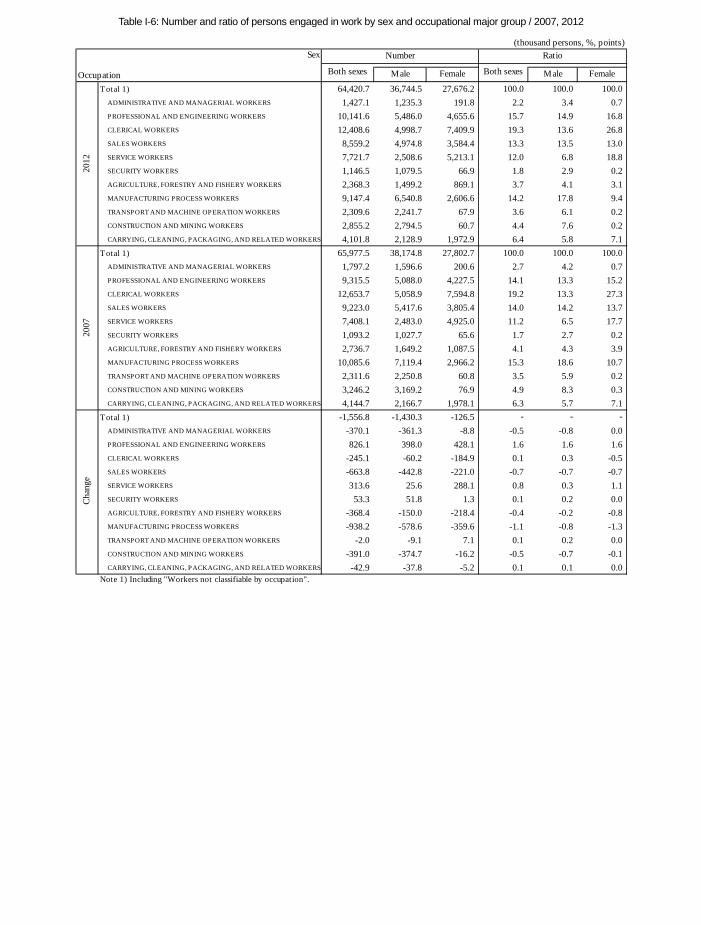
c. “Professional and engineering workers” increased, while “Manufacturing process workers” decreased.
In terms of occupational major groups of persons engaged in work, “Clerical workers” were
most numerous with 12,409 thousand (19.3% of all persons engaged in work), followed by
“Professional and engineering workers” with 10,142 thousand (15.7%), “Manufacturing process
workers” with 9,147 thousand (14.2%) and “Sales workers” with 8,559 thousand (13.3%).
By sex, males were most numerous in “Manufacturing process workers” with 6,541 thousand
(17.8% of all males engaged in work), followed by “Professional and engineering workers” with
5,486 thousand (14.9%), and “Clerical workers” with 4,999 thousand (13.6%). Among females,
“Clerical workers” were most numerous with 7,410 thousand (26.8% of all females engaged in
work), followed by “Service workers” with 5,213 thousand (18.8%) and “Professional and
engineering workers” with 4,656 thousand (16.8%).
Compared to 2007, there was an increase in “Professional and engineering workers” (up by 826
thousand) and others. Conversely, there was a decrease in “Manufacturing process workers” (down
by 938 thousand), “Sales workers” (down by 664 thousand) and others. (Fig. I-6, Table I-6)
Fig. I-6: Number of persons engaged in work by occupational major group / 2007, 2012
0
2,000
4,000
6,000
8,000
10,000
12,000
14,000
Adm
inis
trativ
e an
d m
anag
eria
l wor
kers
Prof
essi
onal
and
eng
inee
ring
wor
kers
Cle
rical
wor
kers
Sale
s w
orke
rs
Serv
ice
wor
kers
Secu
rity
wor
kers
Agr
icul
ture
, for
estry
and
fish
ery
wor
kers
Man
ufac
turin
g pr
oces
s w
orke
rs
Tran
spor
t and
mac
hine
ope
ratio
n w
orke
rs
Con
stru
ctio
n an
d m
inin
g w
orke
rs
Car
ryin
g, c
lean
ing,
pac
kagi
ng, a
nd re
late
dw
orke
rs
(thousand persons)
2007 2012
Table I-6: Number and ratio of persons engaged in work by sex and occupational major group / 2007, 2012
(thousand persons, %, points)Sex
Occupation Male Female Male Female
Total 1) 64,420.7 36,744.5 27,676.2 100.0 100.0 100.0 ADMINISTRATIVE AND MANAGERIAL WORKERS 1,427.1 1,235.3 191.8 2.2 3.4 0.7 PROFESSIONAL AND ENGINEERING WORKERS 10,141.6 5,486.0 4,655.6 15.7 14.9 16.8 CLERICAL WORKERS 12,408.6 4,998.7 7,409.9 19.3 13.6 26.8 SALES WORKERS 8,559.2 4,974.8 3,584.4 13.3 13.5 13.0 SERVICE WORKERS 7,721.7 2,508.6 5,213.1 12.0 6.8 18.8 SECURITY WORKERS 1,146.5 1,079.5 66.9 1.8 2.9 0.2 AGRICULTURE, FORESTRY AND FISHERY WORKERS 2,368.3 1,499.2 869.1 3.7 4.1 3.1 MANUFACTURING PROCESS WORKERS 9,147.4 6,540.8 2,606.6 14.2 17.8 9.4 TRANSPORT AND MACHINE OPERATION WORKERS 2,309.6 2,241.7 67.9 3.6 6.1 0.2 CONSTRUCTION AND MINING WORKERS 2,855.2 2,794.5 60.7 4.4 7.6 0.2 CARRYING, CLEANING, PACKAGING, AND RELATED WORKERS 4,101.8 2,128.9 1,972.9 6.4 5.8 7.1Total 1) 65,977.5 38,174.8 27,802.7 100.0 100.0 100.0 ADMINISTRATIVE AND MANAGERIAL WORKERS 1,797.2 1,596.6 200.6 2.7 4.2 0.7 PROFESSIONAL AND ENGINEERING WORKERS 9,315.5 5,088.0 4,227.5 14.1 13.3 15.2 CLERICAL WORKERS 12,653.7 5,058.9 7,594.8 19.2 13.3 27.3 SALES WORKERS 9,223.0 5,417.6 3,805.4 14.0 14.2 13.7 SERVICE WORKERS 7,408.1 2,483.0 4,925.0 11.2 6.5 17.7 SECURITY WORKERS 1,093.2 1,027.7 65.6 1.7 2.7 0.2 AGRICULTURE, FORESTRY AND FISHERY WORKERS 2,736.7 1,649.2 1,087.5 4.1 4.3 3.9 MANUFACTURING PROCESS WORKERS 10,085.6 7,119.4 2,966.2 15.3 18.6 10.7 TRANSPORT AND MACHINE OPERATION WORKERS 2,311.6 2,250.8 60.8 3.5 5.9 0.2 CONSTRUCTION AND MINING WORKERS 3,246.2 3,169.2 76.9 4.9 8.3 0.3 CARRYING, CLEANING, PACKAGING, AND RELATED WORKERS 4,144.7 2,166.7 1,978.1 6.3 5.7 7.1Total 1) -1,556.8 -1,430.3 -126.5 - - -
ADMINISTRATIVE AND MANAGERIAL WORKERS -370.1 -361.3 -8.8 -0.5 -0.8 0.0 PROFESSIONAL AND ENGINEERING WORKERS 826.1 398.0 428.1 1.6 1.6 1.6 CLERICAL WORKERS -245.1 -60.2 -184.9 0.1 0.3 -0.5 SALES WORKERS -663.8 -442.8 -221.0 -0.7 -0.7 -0.7 SERVICE WORKERS 313.6 25.6 288.1 0.8 0.3 1.1 SECURITY WORKERS 53.3 51.8 1.3 0.1 0.2 0.0 AGRICULTURE, FORESTRY AND FISHERY WORKERS -368.4 -150.0 -218.4 -0.4 -0.2 -0.8 MANUFACTURING PROCESS WORKERS -938.2 -578.6 -359.6 -1.1 -0.8 -1.3 TRANSPORT AND MACHINE OPERATION WORKERS -2.0 -9.1 7.1 0.1 0.2 0.0 CONSTRUCTION AND MINING WORKERS -391.0 -374.7 -16.2 -0.5 -0.7 -0.1 CARRYING, CLEANING, PACKAGING, AND RELATED WORKERS -42.9 -37.8 -5.2 0.1 0.1 0.0Note 1) Including "Workers not classifiable by occupation".
Both sexes
Cha
nge
Number Ratio
2012
2007
Both sexes
125
c. “Professional and engineering workers” increased, while “Manufacturing process workers” decreased.
In terms of occupational major groups of persons engaged in work, “Clerical workers” were
most numerous with 12,409 thousand (19.3% of all persons engaged in work), followed by
“Professional and engineering workers” with 10,142 thousand (15.7%), “Manufacturing process
workers” with 9,147 thousand (14.2%) and “Sales workers” with 8,559 thousand (13.3%).
By sex, males were most numerous in “Manufacturing process workers” with 6,541 thousand
(17.8% of all males engaged in work), followed by “Professional and engineering workers” with
5,486 thousand (14.9%), and “Clerical workers” with 4,999 thousand (13.6%). Among females,
“Clerical workers” were most numerous with 7,410 thousand (26.8% of all females engaged in
work), followed by “Service workers” with 5,213 thousand (18.8%) and “Professional and
engineering workers” with 4,656 thousand (16.8%).
Compared to 2007, there was an increase in “Professional and engineering workers” (up by 826
thousand) and others. Conversely, there was a decrease in “Manufacturing process workers” (down
by 938 thousand), “Sales workers” (down by 664 thousand) and others. (Fig. I-6, Table I-6)
Fig. I-6: Number of persons engaged in work by occupational major group / 2007, 2012
0
2,000
4,000
6,000
8,000
10,000
12,000
14,000
Adm
inis
trativ
e an
d m
anag
eria
l wor
kers
Prof
essi
onal
and
eng
inee
ring
wor
kers
Cle
rical
wor
kers
Sale
s w
orke
rs
Serv
ice
wor
kers
Secu
rity
wor
kers
Agr
icul
ture
, for
estry
and
fish
ery
wor
kers
Man
ufac
turin
g pr
oces
s w
orke
rs
Tran
spor
t and
mac
hine
ope
ratio
n w
orke
rs
Con
stru
ctio
n an
d m
inin
g w
orke
rs
Car
ryin
g, c
lean
ing,
pac
kagi
ng, a
nd re
late
dw
orke
rs
(thousand persons)
2007 2012
Table I-6: Number and ratio of persons engaged in work by sex and occupational major group / 2007, 2012
(thousand persons, %, points)Sex
Occupation Male Female Male Female
Total 1) 64,420.7 36,744.5 27,676.2 100.0 100.0 100.0 ADMINISTRATIVE AND MANAGERIAL WORKERS 1,427.1 1,235.3 191.8 2.2 3.4 0.7 PROFESSIONAL AND ENGINEERING WORKERS 10,141.6 5,486.0 4,655.6 15.7 14.9 16.8 CLERICAL WORKERS 12,408.6 4,998.7 7,409.9 19.3 13.6 26.8 SALES WORKERS 8,559.2 4,974.8 3,584.4 13.3 13.5 13.0 SERVICE WORKERS 7,721.7 2,508.6 5,213.1 12.0 6.8 18.8 SECURITY WORKERS 1,146.5 1,079.5 66.9 1.8 2.9 0.2 AGRICULTURE, FORESTRY AND FISHERY WORKERS 2,368.3 1,499.2 869.1 3.7 4.1 3.1 MANUFACTURING PROCESS WORKERS 9,147.4 6,540.8 2,606.6 14.2 17.8 9.4 TRANSPORT AND MACHINE OPERATION WORKERS 2,309.6 2,241.7 67.9 3.6 6.1 0.2 CONSTRUCTION AND MINING WORKERS 2,855.2 2,794.5 60.7 4.4 7.6 0.2 CARRYING, CLEANING, PACKAGING, AND RELATED WORKERS 4,101.8 2,128.9 1,972.9 6.4 5.8 7.1Total 1) 65,977.5 38,174.8 27,802.7 100.0 100.0 100.0 ADMINISTRATIVE AND MANAGERIAL WORKERS 1,797.2 1,596.6 200.6 2.7 4.2 0.7 PROFESSIONAL AND ENGINEERING WORKERS 9,315.5 5,088.0 4,227.5 14.1 13.3 15.2 CLERICAL WORKERS 12,653.7 5,058.9 7,594.8 19.2 13.3 27.3 SALES WORKERS 9,223.0 5,417.6 3,805.4 14.0 14.2 13.7 SERVICE WORKERS 7,408.1 2,483.0 4,925.0 11.2 6.5 17.7 SECURITY WORKERS 1,093.2 1,027.7 65.6 1.7 2.7 0.2 AGRICULTURE, FORESTRY AND FISHERY WORKERS 2,736.7 1,649.2 1,087.5 4.1 4.3 3.9 MANUFACTURING PROCESS WORKERS 10,085.6 7,119.4 2,966.2 15.3 18.6 10.7 TRANSPORT AND MACHINE OPERATION WORKERS 2,311.6 2,250.8 60.8 3.5 5.9 0.2 CONSTRUCTION AND MINING WORKERS 3,246.2 3,169.2 76.9 4.9 8.3 0.3 CARRYING, CLEANING, PACKAGING, AND RELATED WORKERS 4,144.7 2,166.7 1,978.1 6.3 5.7 7.1Total 1) -1,556.8 -1,430.3 -126.5 - - -
ADMINISTRATIVE AND MANAGERIAL WORKERS -370.1 -361.3 -8.8 -0.5 -0.8 0.0 PROFESSIONAL AND ENGINEERING WORKERS 826.1 398.0 428.1 1.6 1.6 1.6 CLERICAL WORKERS -245.1 -60.2 -184.9 0.1 0.3 -0.5 SALES WORKERS -663.8 -442.8 -221.0 -0.7 -0.7 -0.7 SERVICE WORKERS 313.6 25.6 288.1 0.8 0.3 1.1 SECURITY WORKERS 53.3 51.8 1.3 0.1 0.2 0.0 AGRICULTURE, FORESTRY AND FISHERY WORKERS -368.4 -150.0 -218.4 -0.4 -0.2 -0.8 MANUFACTURING PROCESS WORKERS -938.2 -578.6 -359.6 -1.1 -0.8 -1.3 TRANSPORT AND MACHINE OPERATION WORKERS -2.0 -9.1 7.1 0.1 0.2 0.0 CONSTRUCTION AND MINING WORKERS -391.0 -374.7 -16.2 -0.5 -0.7 -0.1 CARRYING, CLEANING, PACKAGING, AND RELATED WORKERS -42.9 -37.8 -5.2 0.1 0.1 0.0Note 1) Including "Workers not classifiable by occupation".
Both sexesC
hang
e
Number Ratio
2012
2007
Both sexes
126
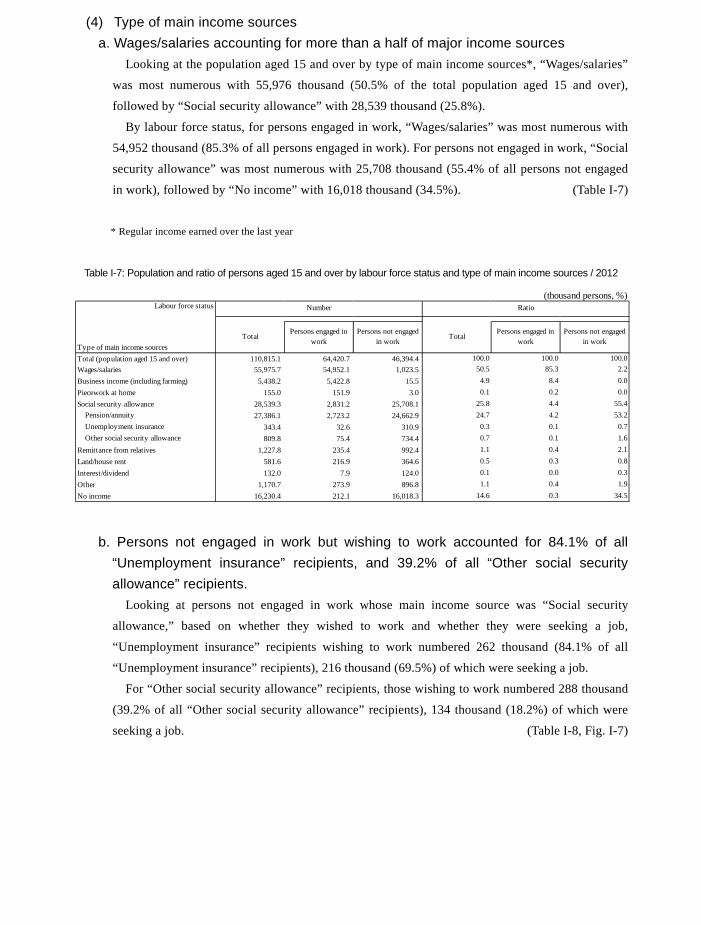
(4) Type of main income sources a. Wages/salaries accounting for more than a half of major income sources
Looking at the population aged 15 and over by type of main income sources*, “Wages/salaries”
was most numerous with 55,976 thousand (50.5% of the total population aged 15 and over),
followed by “Social security allowance” with 28,539 thousand (25.8%).
By labour force status, for persons engaged in work, “Wages/salaries” was most numerous with
54,952 thousand (85.3% of all persons engaged in work). For persons not engaged in work, “Social
security allowance” was most numerous with 25,708 thousand (55.4% of all persons not engaged
in work), followed by “No income” with 16,018 thousand (34.5%). (Table I-7)
* Regular income earned over the last year
Table I-7: Population and ratio of persons aged 15 and over by labour force status and type of main income sources / 2012
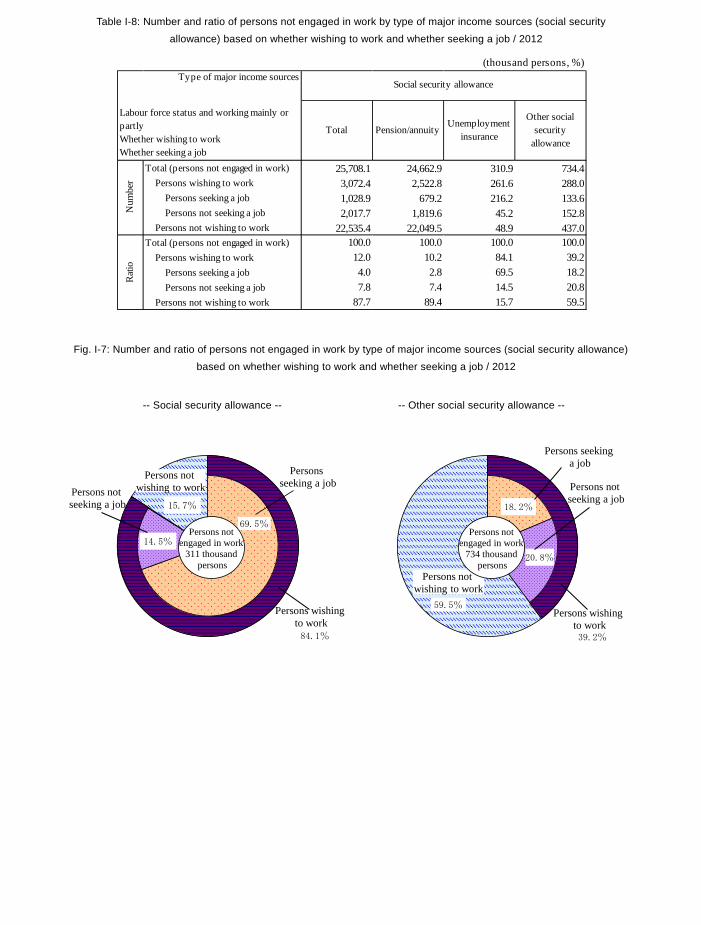
b. Persons not engaged in work but wishing to work accounted for 84.1% of all “Unemployment insurance” recipients, and 39.2% of all “Other social security allowance” recipients.
Looking at persons not engaged in work whose main income source was “Social security
allowance,” based on whether they wished to work and whether they were seeking a job,
“Unemployment insurance” recipients wishing to work numbered 262 thousand (84.1% of all
“Unemployment insurance” recipients), 216 thousand (69.5%) of which were seeking a job.
For “Other social security allowance” recipients, those wishing to work numbered 288 thousand
(39.2% of all “Other social security allowance” recipients), 134 thousand (18.2%) of which were
seeking a job. (Table I-8, Fig. I-7)
(thousand persons, %)Labour force status
Type of main income sourcesTotal
Persons engaged inwork
Persons not engagedin work
TotalPersons engaged in
workPersons not engaged
in work
Total (population aged 15 and over) 110,815.1 64,420.7 46,394.4 100.0 100.0 100.0Wages/salaries 55,975.7 54,952.1 1,023.5 50.5 85.3 2.2Business income (including farming) 5,438.2 5,422.8 15.5 4.9 8.4 0.0Piecework at home 155.0 151.9 3.0 0.1 0.2 0.0Social security allowance 28,539.3 2,831.2 25,708.1 25.8 4.4 55.4 Pension/annuity 27,386.1 2,723.2 24,662.9 24.7 4.2 53.2 Unemployment insurance 343.4 32.6 310.9 0.3 0.1 0.7 Other social security allowance 809.8 75.4 734.4 0.7 0.1 1.6Remittance from relatives 1,227.8 235.4 992.4 1.1 0.4 2.1Land/house rent 581.6 216.9 364.6 0.5 0.3 0.8Interest/dividend 132.0 7.9 124.0 0.1 0.0 0.3Other 1,170.7 273.9 896.8 1.1 0.4 1.9No income 16,230.4 212.1 16,018.3 14.6 0.3 34.5
Number Ratio
Table I-8: Number and ratio of persons not engaged in work by type of major income sources (social security
allowance) based on whether wishing to work and whether seeking a job / 2012
Fig. I-7: Number and ratio of persons not engaged in work by type of major income sources (social security allowance)
based on whether wishing to work and whether seeking a job / 2012
-- Social security allowance -- -- Other social security allowance --
(thousand persons, %)
Total Pension/annuityUnemployment
insurance
Other socialsecurity
allowance
Total (persons not engaged in work) 25,708.1 24,662.9 310.9 734.4 Persons wishing to work 3,072.4 2,522.8 261.6 288.0 Persons seeking a job 1,028.9 679.2 216.2 133.6 Persons not seeking a job 2,017.7 1,819.6 45.2 152.8 Persons not wishing to work 22,535.4 22,049.5 48.9 437.0Total (persons not engaged in work) 100.0 100.0 100.0 100.0 Persons wishing to work 12.0 10.2 84.1 39.2 Persons seeking a job 4.0 2.8 69.5 18.2 Persons not seeking a job 7.8 7.4 14.5 20.8 Persons not wishing to work 87.7 89.4 15.7 59.5
Rat
io
Type of major income sourcesSocial security allowance
Labour force status and working mainly orpartlyWhether wishing to workWhether seeking a job
Num
ber
Persons seeking a job
69.5%
Persons not seeking a job
Persons not wishing to work
15.7%
84.1%
14.5%
Persons wishingto work
Persons not engaged in work
311 thousand persons
Persons seekinga job
20.8%
Persons not seeking a job
Persons not wishing to work
59.5%
39.2%
18.2%
Persons wishing to work
Persons not engaged in work
734 thousand persons
127
(4) Type of main income sources a. Wages/salaries accounting for more than a half of major income sources
Looking at the population aged 15 and over by type of main income sources*, “Wages/salaries”
was most numerous with 55,976 thousand (50.5% of the total population aged 15 and over),
followed by “Social security allowance” with 28,539 thousand (25.8%).
By labour force status, for persons engaged in work, “Wages/salaries” was most numerous with
54,952 thousand (85.3% of all persons engaged in work). For persons not engaged in work, “Social
security allowance” was most numerous with 25,708 thousand (55.4% of all persons not engaged
in work), followed by “No income” with 16,018 thousand (34.5%). (Table I-7)
* Regular income earned over the last year
Table I-7: Population and ratio of persons aged 15 and over by labour force status and type of main income sources / 2012
b. Persons not engaged in work but wishing to work accounted for 84.1% of all “Unemployment insurance” recipients, and 39.2% of all “Other social security allowance” recipients.
Looking at persons not engaged in work whose main income source was “Social security
allowance,” based on whether they wished to work and whether they were seeking a job,
“Unemployment insurance” recipients wishing to work numbered 262 thousand (84.1% of all
“Unemployment insurance” recipients), 216 thousand (69.5%) of which were seeking a job.
For “Other social security allowance” recipients, those wishing to work numbered 288 thousand
(39.2% of all “Other social security allowance” recipients), 134 thousand (18.2%) of which were
seeking a job. (Table I-8, Fig. I-7)
(thousand persons, %)Labour force status
Type of main income sourcesTotal
Persons engaged inwork
Persons not engagedin work
TotalPersons engaged in
workPersons not engaged
in work
Total (population aged 15 and over) 110,815.1 64,420.7 46,394.4 100.0 100.0 100.0Wages/salaries 55,975.7 54,952.1 1,023.5 50.5 85.3 2.2Business income (including farming) 5,438.2 5,422.8 15.5 4.9 8.4 0.0Piecework at home 155.0 151.9 3.0 0.1 0.2 0.0Social security allowance 28,539.3 2,831.2 25,708.1 25.8 4.4 55.4 Pension/annuity 27,386.1 2,723.2 24,662.9 24.7 4.2 53.2 Unemployment insurance 343.4 32.6 310.9 0.3 0.1 0.7 Other social security allowance 809.8 75.4 734.4 0.7 0.1 1.6Remittance from relatives 1,227.8 235.4 992.4 1.1 0.4 2.1Land/house rent 581.6 216.9 364.6 0.5 0.3 0.8Interest/dividend 132.0 7.9 124.0 0.1 0.0 0.3Other 1,170.7 273.9 896.8 1.1 0.4 1.9No income 16,230.4 212.1 16,018.3 14.6 0.3 34.5
Number Ratio
Table I-8: Number and ratio of persons not engaged in work by type of major income sources (social security
allowance) based on whether wishing to work and whether seeking a job / 2012
Fig. I-7: Number and ratio of persons not engaged in work by type of major income sources (social security allowance)
based on whether wishing to work and whether seeking a job / 2012
-- Social security allowance -- -- Other social security allowance --
(thousand persons, %)
Total Pension/annuityUnemployment
insurance
Other socialsecurity
allowance
Total (persons not engaged in work) 25,708.1 24,662.9 310.9 734.4 Persons wishing to work 3,072.4 2,522.8 261.6 288.0 Persons seeking a job 1,028.9 679.2 216.2 133.6 Persons not seeking a job 2,017.7 1,819.6 45.2 152.8 Persons not wishing to work 22,535.4 22,049.5 48.9 437.0Total (persons not engaged in work) 100.0 100.0 100.0 100.0 Persons wishing to work 12.0 10.2 84.1 39.2 Persons seeking a job 4.0 2.8 69.5 18.2 Persons not seeking a job 7.8 7.4 14.5 20.8 Persons not wishing to work 87.7 89.4 15.7 59.5
Rat
io
Type of major income sourcesSocial security allowance
Labour force status and working mainly orpartlyWhether wishing to workWhether seeking a job
Num
ber
Persons seeking a job
69.5%
Persons not seeking a job
Persons not wishing to work
15.7%
84.1%
14.5%
Persons wishingto work
Persons not engaged in work
311 thousand persons
Persons seekinga job
20.8%
Persons not seeking a job
Persons not wishing to work
59.5%
39.2%
18.2%
Persons wishing to work
Persons not engaged in work
734 thousand persons
128
3. Employees (1) Type of employment
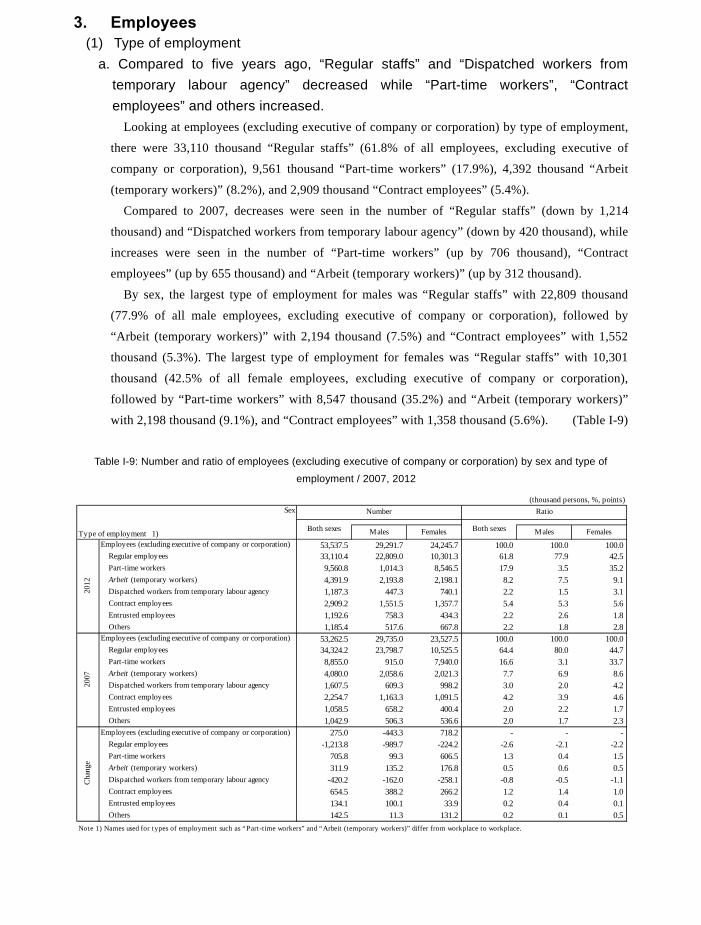
a. Compared to five years ago, “Regular staffs” and “Dispatched workers from temporary labour agency” decreased while “Part-time workers”, “Contract employees” and others increased.
Looking at employees (excluding executive of company or corporation) by type of employment,
there were 33,110 thousand “Regular staffs” (61.8% of all employees, excluding executive of
company or corporation), 9,561 thousand “Part-time workers” (17.9%), 4,392 thousand “Arbeit
(temporary workers)” (8.2%), and 2,909 thousand “Contract employees” (5.4%).
Compared to 2007, decreases were seen in the number of “Regular staffs” (down by 1,214
thousand) and “Dispatched workers from temporary labour agency” (down by 420 thousand), while
increases were seen in the number of “Part-time workers” (up by 706 thousand), “Contract
employees” (up by 655 thousand) and “Arbeit (temporary workers)” (up by 312 thousand).
By sex, the largest type of employment for males was “Regular staffs” with 22,809 thousand
(77.9% of all male employees, excluding executive of company or corporation), followed by
“Arbeit (temporary workers)” with 2,194 thousand (7.5%) and “Contract employees” with 1,552
thousand (5.3%). The largest type of employment for females was “Regular staffs” with 10,301
thousand (42.5% of all female employees, excluding executive of company or corporation),
followed by “Part-time workers” with 8,547 thousand (35.2%) and “Arbeit (temporary workers)”
with 2,198 thousand (9.1%), and “Contract employees” with 1,358 thousand (5.6%). (Table I-9)
Table I-9: Number and ratio of employees (excluding executive of company or corporation) by sex and type of
employment / 2007, 2012
Sex
Type of employment 1) Males Females Males FemalesEmployees (excluding executive of company or corporation) 53,537.5 29,291.7 24,245.7 100.0 100.0 100.0 Regular employees 33,110.4 22,809.0 10,301.3 61.8 77.9 42.5 Part-time workers 9,560.8 1,014.3 8,546.5 17.9 3.5 35.2 Arbeit (temporary workers) 4,391.9 2,193.8 2,198.1 8.2 7.5 9.1 Dispatched workers from temporary labour agency 1,187.3 447.3 740.1 2.2 1.5 3.1 Contract employees 2,909.2 1,551.5 1,357.7 5.4 5.3 5.6 Entrusted employees 1,192.6 758.3 434.3 2.2 2.6 1.8 Others 1,185.4 517.6 667.8 2.2 1.8 2.8Employees (excluding executive of company or corporation) 53,262.5 29,735.0 23,527.5 100.0 100.0 100.0 Regular employees 34,324.2 23,798.7 10,525.5 64.4 80.0 44.7 Part-time workers 8,855.0 915.0 7,940.0 16.6 3.1 33.7 Arbeit (temporary workers) 4,080.0 2,058.6 2,021.3 7.7 6.9 8.6 Dispatched workers from temporary labour agency 1,607.5 609.3 998.2 3.0 2.0 4.2 Contract employees 2,254.7 1,163.3 1,091.5 4.2 3.9 4.6 Entrusted employees 1,058.5 658.2 400.4 2.0 2.2 1.7 Others 1,042.9 506.3 536.6 2.0 1.7 2.3Employees (excluding executive of company or corporation) 275.0 -443.3 718.2 - - - Regular employees -1,213.8 -989.7 -224.2 -2.6 -2.1 -2.2 Part-time workers 705.8 99.3 606.5 1.3 0.4 1.5 Arbeit (temporary workers) 311.9 135.2 176.8 0.5 0.6 0.5 Dispatched workers from temporary labour agency -420.2 -162.0 -258.1 -0.8 -0.5 -1.1 Contract employees 654.5 388.2 266.2 1.2 1.4 1.0 Entrusted employees 134.1 100.1 33.9 0.2 0.4 0.1 Others 142.5 11.3 131.2 0.2 0.1 0.5
Note 1) Names used for types of employment such as “Part-time workers” and “Arbeit (temporary workers)” differ from workplace to workplace.
2007
(thousand persons, %, points)
Cha
nge
Number Ratio
Both sexes Both sexes
2012
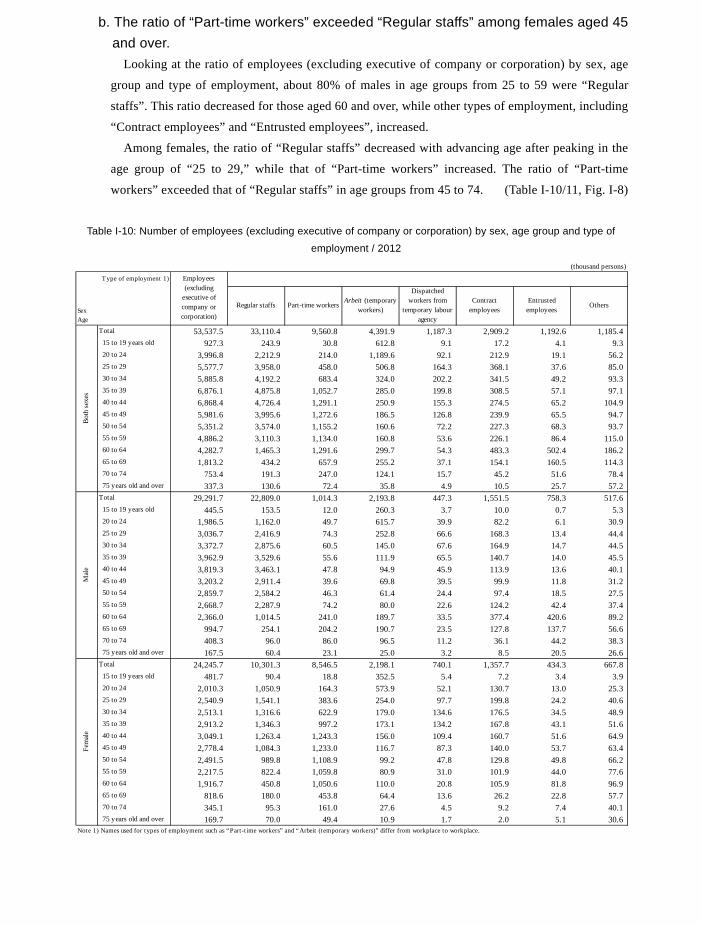
b. The ratio of “Part-time workers” exceeded “Regular staffs” among females aged 45 and over.
Looking at the ratio of employees (excluding executive of company or corporation) by sex, age
group and type of employment, about 80% of males in age groups from 25 to 59 were “Regular
staffs”. This ratio decreased for those aged 60 and over, while other types of employment, including
“Contract employees” and “Entrusted employees”, increased.
Among females, the ratio of “Regular staffs” decreased with advancing age after peaking in the
age group of “25 to 29,” while that of “Part-time workers” increased. The ratio of “Part-time
workers” exceeded that of “Regular staffs” in age groups from 45 to 74. (Table I-10/11, Fig. I-8)
Table I-10: Number of employees (excluding executive of company or corporation) by sex, age group and type of
employment / 2012
Type of employment 1)
Regular staffs Part-time workersArbeit (temporary
workers)
Dispatchedworkers from
temporary labouragency
Contractemployees
Entrustedemployees
Others
Total 53,537.5 33,110.4 9,560.8 4,391.9 1,187.3 2,909.2 1,192.6 1,185.4 15 to 19 years old 927.3 243.9 30.8 612.8 9.1 17.2 4.1 9.3 20 to 24 3,996.8 2,212.9 214.0 1,189.6 92.1 212.9 19.1 56.2 25 to 29 5,577.7 3,958.0 458.0 506.8 164.3 368.1 37.6 85.0 30 to 34 5,885.8 4,192.2 683.4 324.0 202.2 341.5 49.2 93.3 35 to 39 6,876.1 4,875.8 1,052.7 285.0 199.8 308.5 57.1 97.1 40 to 44 6,868.4 4,726.4 1,291.1 250.9 155.3 274.5 65.2 104.9 45 to 49 5,981.6 3,995.6 1,272.6 186.5 126.8 239.9 65.5 94.7 50 to 54 5,351.2 3,574.0 1,155.2 160.6 72.2 227.3 68.3 93.7 55 to 59 4,886.2 3,110.3 1,134.0 160.8 53.6 226.1 86.4 115.0 60 to 64 4,282.7 1,465.3 1,291.6 299.7 54.3 483.3 502.4 186.2 65 to 69 1,813.2 434.2 657.9 255.2 37.1 154.1 160.5 114.3 70 to 74 753.4 191.3 247.0 124.1 15.7 45.2 51.6 78.4 75 years old and over 337.3 130.6 72.4 35.8 4.9 10.5 25.7 57.2Total 29,291.7 22,809.0 1,014.3 2,193.8 447.3 1,551.5 758.3 517.6 15 to 19 years old 445.5 153.5 12.0 260.3 3.7 10.0 0.7 5.3 20 to 24 1,986.5 1,162.0 49.7 615.7 39.9 82.2 6.1 30.9 25 to 29 3,036.7 2,416.9 74.3 252.8 66.6 168.3 13.4 44.4 30 to 34 3,372.7 2,875.6 60.5 145.0 67.6 164.9 14.7 44.5 35 to 39 3,962.9 3,529.6 55.6 111.9 65.5 140.7 14.0 45.5 40 to 44 3,819.3 3,463.1 47.8 94.9 45.9 113.9 13.6 40.1 45 to 49 3,203.2 2,911.4 39.6 69.8 39.5 99.9 11.8 31.2 50 to 54 2,859.7 2,584.2 46.3 61.4 24.4 97.4 18.5 27.5 55 to 59 2,668.7 2,287.9 74.2 80.0 22.6 124.2 42.4 37.4 60 to 64 2,366.0 1,014.5 241.0 189.7 33.5 377.4 420.6 89.2 65 to 69 994.7 254.1 204.2 190.7 23.5 127.8 137.7 56.6 70 to 74 408.3 96.0 86.0 96.5 11.2 36.1 44.2 38.3 75 years old and over 167.5 60.4 23.1 25.0 3.2 8.5 20.5 26.6Total 24,245.7 10,301.3 8,546.5 2,198.1 740.1 1,357.7 434.3 667.8 15 to 19 years old 481.7 90.4 18.8 352.5 5.4 7.2 3.4 3.9 20 to 24 2,010.3 1,050.9 164.3 573.9 52.1 130.7 13.0 25.3 25 to 29 2,540.9 1,541.1 383.6 254.0 97.7 199.8 24.2 40.6 30 to 34 2,513.1 1,316.6 622.9 179.0 134.6 176.5 34.5 48.9 35 to 39 2,913.2 1,346.3 997.2 173.1 134.2 167.8 43.1 51.6 40 to 44 3,049.1 1,263.4 1,243.3 156.0 109.4 160.7 51.6 64.9 45 to 49 2,778.4 1,084.3 1,233.0 116.7 87.3 140.0 53.7 63.4 50 to 54 2,491.5 989.8 1,108.9 99.2 47.8 129.8 49.8 66.2 55 to 59 2,217.5 822.4 1,059.8 80.9 31.0 101.9 44.0 77.6 60 to 64 1,916.7 450.8 1,050.6 110.0 20.8 105.9 81.8 96.9 65 to 69 818.6 180.0 453.8 64.4 13.6 26.2 22.8 57.7 70 to 74 345.1 95.3 161.0 27.6 4.5 9.2 7.4 40.1 75 years old and over 169.7 70.0 49.4 10.9 1.7 2.0 5.1 30.6
Note 1) Names used for types of employment such as “Part-t ime workers” and “Arbeit (temporary workers)” differ from workplace to workplace.
Mal
eFe
mal
e
(thousand persons)
Employees(excluding
executive ofcompany orcorporation)
SexAge
Bot
h se
xes
129
3. Employees (1) Type of employment
a. Compared to five years ago, “Regular staffs” and “Dispatched workers from temporary labour agency” decreased while “Part-time workers”, “Contract employees” and others increased.
Looking at employees (excluding executive of company or corporation) by type of employment,
there were 33,110 thousand “Regular staffs” (61.8% of all employees, excluding executive of
company or corporation), 9,561 thousand “Part-time workers” (17.9%), 4,392 thousand “Arbeit
(temporary workers)” (8.2%), and 2,909 thousand “Contract employees” (5.4%).
Compared to 2007, decreases were seen in the number of “Regular staffs” (down by 1,214
thousand) and “Dispatched workers from temporary labour agency” (down by 420 thousand), while
increases were seen in the number of “Part-time workers” (up by 706 thousand), “Contract
employees” (up by 655 thousand) and “Arbeit (temporary workers)” (up by 312 thousand).
By sex, the largest type of employment for males was “Regular staffs” with 22,809 thousand
(77.9% of all male employees, excluding executive of company or corporation), followed by
“Arbeit (temporary workers)” with 2,194 thousand (7.5%) and “Contract employees” with 1,552
thousand (5.3%). The largest type of employment for females was “Regular staffs” with 10,301
thousand (42.5% of all female employees, excluding executive of company or corporation),
followed by “Part-time workers” with 8,547 thousand (35.2%) and “Arbeit (temporary workers)”
with 2,198 thousand (9.1%), and “Contract employees” with 1,358 thousand (5.6%). (Table I-9)
Table I-9: Number and ratio of employees (excluding executive of company or corporation) by sex and type of
employment / 2007, 2012
Sex
Type of employment 1) Males Females Males FemalesEmployees (excluding executive of company or corporation) 53,537.5 29,291.7 24,245.7 100.0 100.0 100.0 Regular employees 33,110.4 22,809.0 10,301.3 61.8 77.9 42.5 Part-time workers 9,560.8 1,014.3 8,546.5 17.9 3.5 35.2 Arbeit (temporary workers) 4,391.9 2,193.8 2,198.1 8.2 7.5 9.1 Dispatched workers from temporary labour agency 1,187.3 447.3 740.1 2.2 1.5 3.1 Contract employees 2,909.2 1,551.5 1,357.7 5.4 5.3 5.6 Entrusted employees 1,192.6 758.3 434.3 2.2 2.6 1.8 Others 1,185.4 517.6 667.8 2.2 1.8 2.8Employees (excluding executive of company or corporation) 53,262.5 29,735.0 23,527.5 100.0 100.0 100.0 Regular employees 34,324.2 23,798.7 10,525.5 64.4 80.0 44.7 Part-time workers 8,855.0 915.0 7,940.0 16.6 3.1 33.7 Arbeit (temporary workers) 4,080.0 2,058.6 2,021.3 7.7 6.9 8.6 Dispatched workers from temporary labour agency 1,607.5 609.3 998.2 3.0 2.0 4.2 Contract employees 2,254.7 1,163.3 1,091.5 4.2 3.9 4.6 Entrusted employees 1,058.5 658.2 400.4 2.0 2.2 1.7 Others 1,042.9 506.3 536.6 2.0 1.7 2.3Employees (excluding executive of company or corporation) 275.0 -443.3 718.2 - - - Regular employees -1,213.8 -989.7 -224.2 -2.6 -2.1 -2.2 Part-time workers 705.8 99.3 606.5 1.3 0.4 1.5 Arbeit (temporary workers) 311.9 135.2 176.8 0.5 0.6 0.5 Dispatched workers from temporary labour agency -420.2 -162.0 -258.1 -0.8 -0.5 -1.1 Contract employees 654.5 388.2 266.2 1.2 1.4 1.0 Entrusted employees 134.1 100.1 33.9 0.2 0.4 0.1 Others 142.5 11.3 131.2 0.2 0.1 0.5
Note 1) Names used for types of employment such as “Part-time workers” and “Arbeit (temporary workers)” differ from workplace to workplace.
2007
(thousand persons, %, points)
Cha
nge
Number Ratio
Both sexes Both sexes
2012
b. The ratio of “Part-time workers” exceeded “Regular staffs” among females aged 45 and over.
Looking at the ratio of employees (excluding executive of company or corporation) by sex, age
group and type of employment, about 80% of males in age groups from 25 to 59 were “Regular
staffs”. This ratio decreased for those aged 60 and over, while other types of employment, including
“Contract employees” and “Entrusted employees”, increased.
Among females, the ratio of “Regular staffs” decreased with advancing age after peaking in the
age group of “25 to 29,” while that of “Part-time workers” increased. The ratio of “Part-time
workers” exceeded that of “Regular staffs” in age groups from 45 to 74. (Table I-10/11, Fig. I-8)
Table I-10: Number of employees (excluding executive of company or corporation) by sex, age group and type of
employment / 2012
Type of employment 1)
Regular staffs Part-time workersArbeit (temporary
workers)
Dispatchedworkers from
temporary labouragency
Contractemployees
Entrustedemployees
Others
Total 53,537.5 33,110.4 9,560.8 4,391.9 1,187.3 2,909.2 1,192.6 1,185.4 15 to 19 years old 927.3 243.9 30.8 612.8 9.1 17.2 4.1 9.3 20 to 24 3,996.8 2,212.9 214.0 1,189.6 92.1 212.9 19.1 56.2 25 to 29 5,577.7 3,958.0 458.0 506.8 164.3 368.1 37.6 85.0 30 to 34 5,885.8 4,192.2 683.4 324.0 202.2 341.5 49.2 93.3 35 to 39 6,876.1 4,875.8 1,052.7 285.0 199.8 308.5 57.1 97.1 40 to 44 6,868.4 4,726.4 1,291.1 250.9 155.3 274.5 65.2 104.9 45 to 49 5,981.6 3,995.6 1,272.6 186.5 126.8 239.9 65.5 94.7 50 to 54 5,351.2 3,574.0 1,155.2 160.6 72.2 227.3 68.3 93.7 55 to 59 4,886.2 3,110.3 1,134.0 160.8 53.6 226.1 86.4 115.0 60 to 64 4,282.7 1,465.3 1,291.6 299.7 54.3 483.3 502.4 186.2 65 to 69 1,813.2 434.2 657.9 255.2 37.1 154.1 160.5 114.3 70 to 74 753.4 191.3 247.0 124.1 15.7 45.2 51.6 78.4 75 years old and over 337.3 130.6 72.4 35.8 4.9 10.5 25.7 57.2Total 29,291.7 22,809.0 1,014.3 2,193.8 447.3 1,551.5 758.3 517.6 15 to 19 years old 445.5 153.5 12.0 260.3 3.7 10.0 0.7 5.3 20 to 24 1,986.5 1,162.0 49.7 615.7 39.9 82.2 6.1 30.9 25 to 29 3,036.7 2,416.9 74.3 252.8 66.6 168.3 13.4 44.4 30 to 34 3,372.7 2,875.6 60.5 145.0 67.6 164.9 14.7 44.5 35 to 39 3,962.9 3,529.6 55.6 111.9 65.5 140.7 14.0 45.5 40 to 44 3,819.3 3,463.1 47.8 94.9 45.9 113.9 13.6 40.1 45 to 49 3,203.2 2,911.4 39.6 69.8 39.5 99.9 11.8 31.2 50 to 54 2,859.7 2,584.2 46.3 61.4 24.4 97.4 18.5 27.5 55 to 59 2,668.7 2,287.9 74.2 80.0 22.6 124.2 42.4 37.4 60 to 64 2,366.0 1,014.5 241.0 189.7 33.5 377.4 420.6 89.2 65 to 69 994.7 254.1 204.2 190.7 23.5 127.8 137.7 56.6 70 to 74 408.3 96.0 86.0 96.5 11.2 36.1 44.2 38.3 75 years old and over 167.5 60.4 23.1 25.0 3.2 8.5 20.5 26.6Total 24,245.7 10,301.3 8,546.5 2,198.1 740.1 1,357.7 434.3 667.8 15 to 19 years old 481.7 90.4 18.8 352.5 5.4 7.2 3.4 3.9 20 to 24 2,010.3 1,050.9 164.3 573.9 52.1 130.7 13.0 25.3 25 to 29 2,540.9 1,541.1 383.6 254.0 97.7 199.8 24.2 40.6 30 to 34 2,513.1 1,316.6 622.9 179.0 134.6 176.5 34.5 48.9 35 to 39 2,913.2 1,346.3 997.2 173.1 134.2 167.8 43.1 51.6 40 to 44 3,049.1 1,263.4 1,243.3 156.0 109.4 160.7 51.6 64.9 45 to 49 2,778.4 1,084.3 1,233.0 116.7 87.3 140.0 53.7 63.4 50 to 54 2,491.5 989.8 1,108.9 99.2 47.8 129.8 49.8 66.2 55 to 59 2,217.5 822.4 1,059.8 80.9 31.0 101.9 44.0 77.6 60 to 64 1,916.7 450.8 1,050.6 110.0 20.8 105.9 81.8 96.9 65 to 69 818.6 180.0 453.8 64.4 13.6 26.2 22.8 57.7 70 to 74 345.1 95.3 161.0 27.6 4.5 9.2 7.4 40.1 75 years old and over 169.7 70.0 49.4 10.9 1.7 2.0 5.1 30.6
Note 1) Names used for types of employment such as “Part-t ime workers” and “Arbeit (temporary workers)” differ from workplace to workplace.
Mal
eFe
mal
e
(thousand persons)
Employees(excluding
executive ofcompany orcorporation)
SexAge
Bot
h se
xes
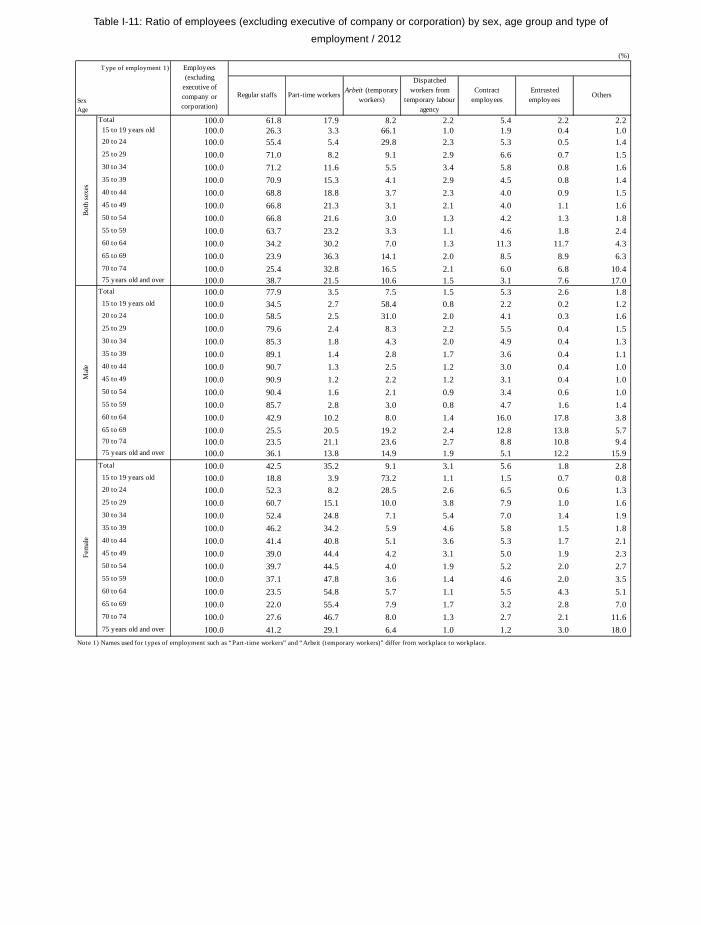
130
Table I-11: Ratio of employees (excluding executive of company or corporation) by sex, age group and type of
employment / 2012
(%)
Type of employment 1)
Regular staffs Part-time workersArbeit (temporary
workers)
Dispatchedworkers from
temporary labouragency
Contractemployees
Entrustedemployees
Others
Total 100.0 61.8 17.9 8.2 2.2 5.4 2.2 2.2 15 to 19 years old 100.0 26.3 3.3 66.1 1.0 1.9 0.4 1.0 20 to 24 100.0 55.4 5.4 29.8 2.3 5.3 0.5 1.4 25 to 29 100.0 71.0 8.2 9.1 2.9 6.6 0.7 1.5 30 to 34 100.0 71.2 11.6 5.5 3.4 5.8 0.8 1.6 35 to 39 100.0 70.9 15.3 4.1 2.9 4.5 0.8 1.4 40 to 44 100.0 68.8 18.8 3.7 2.3 4.0 0.9 1.5 45 to 49 100.0 66.8 21.3 3.1 2.1 4.0 1.1 1.6 50 to 54 100.0 66.8 21.6 3.0 1.3 4.2 1.3 1.8 55 to 59 100.0 63.7 23.2 3.3 1.1 4.6 1.8 2.4 60 to 64 100.0 34.2 30.2 7.0 1.3 11.3 11.7 4.3 65 to 69 100.0 23.9 36.3 14.1 2.0 8.5 8.9 6.3 70 to 74 100.0 25.4 32.8 16.5 2.1 6.0 6.8 10.4 75 years old and over 100.0 38.7 21.5 10.6 1.5 3.1 7.6 17.0Total 100.0 77.9 3.5 7.5 1.5 5.3 2.6 1.8 15 to 19 years old 100.0 34.5 2.7 58.4 0.8 2.2 0.2 1.2 20 to 24 100.0 58.5 2.5 31.0 2.0 4.1 0.3 1.6 25 to 29 100.0 79.6 2.4 8.3 2.2 5.5 0.4 1.5 30 to 34 100.0 85.3 1.8 4.3 2.0 4.9 0.4 1.3 35 to 39 100.0 89.1 1.4 2.8 1.7 3.6 0.4 1.1 40 to 44 100.0 90.7 1.3 2.5 1.2 3.0 0.4 1.0 45 to 49 100.0 90.9 1.2 2.2 1.2 3.1 0.4 1.0 50 to 54 100.0 90.4 1.6 2.1 0.9 3.4 0.6 1.0 55 to 59 100.0 85.7 2.8 3.0 0.8 4.7 1.6 1.4 60 to 64 100.0 42.9 10.2 8.0 1.4 16.0 17.8 3.8 65 to 69 100.0 25.5 20.5 19.2 2.4 12.8 13.8 5.7 70 to 74 100.0 23.5 21.1 23.6 2.7 8.8 10.8 9.4 75 years old and over 100.0 36.1 13.8 14.9 1.9 5.1 12.2 15.9Total 100.0 42.5 35.2 9.1 3.1 5.6 1.8 2.8 15 to 19 years old 100.0 18.8 3.9 73.2 1.1 1.5 0.7 0.8 20 to 24 100.0 52.3 8.2 28.5 2.6 6.5 0.6 1.3 25 to 29 100.0 60.7 15.1 10.0 3.8 7.9 1.0 1.6 30 to 34 100.0 52.4 24.8 7.1 5.4 7.0 1.4 1.9 35 to 39 100.0 46.2 34.2 5.9 4.6 5.8 1.5 1.8 40 to 44 100.0 41.4 40.8 5.1 3.6 5.3 1.7 2.1 45 to 49 100.0 39.0 44.4 4.2 3.1 5.0 1.9 2.3 50 to 54 100.0 39.7 44.5 4.0 1.9 5.2 2.0 2.7 55 to 59 100.0 37.1 47.8 3.6 1.4 4.6 2.0 3.5 60 to 64 100.0 23.5 54.8 5.7 1.1 5.5 4.3 5.1 65 to 69 100.0 22.0 55.4 7.9 1.7 3.2 2.8 7.0 70 to 74 100.0 27.6 46.7 8.0 1.3 2.7 2.1 11.6 75 years old and over 100.0 41.2 29.1 6.4 1.0 1.2 3.0 18.0
Note 1) Names used for types of employment such as “Part-time workers” and “Arbeit (temporary workers)” differ from workplace to workplace.
Fem
ale
Employees(excluding
executive ofcompany orcorporation)
SexAge
Bot
h se
xes
Mal
e
Fig. I-8: Ratio of employees (excluding executive of company or corporation) by sex, age group and type of
employment / 2012
Note) Names used for types of employment such as “Part-time workers” and “Arbeit (temporary workers)” differ from workplace
to workplace.
36.1
23.5
25.5
42.9
85.7
90.4
90.9
90.7
89.1
85.3
79.6
58.5
34.5
13.8
21.1
20.5
10.2
14.9
23.6
19.2
8.0
3.0
4.3
8.3
31.0
58.4
5.1
8.8
12.8
16.0
4.7
3.4
3.1
3.0
3.6
4.9
5.5
4.1
12.2
10.8
13.8
17.8
15.9
9.4
5.7
3.8
0 20 40 60 80 100
75 years old and over
70 to 74
65 to 69
60 to 64
55 to 59
50 to 54
45 to 49
40 to 44
35 to 39
30 to 34
25 to 29
20 to 24
15 to 19 years old
(Male)
(%)
41.2
27.6
22.0
23.5
37.1
39.7
39.0
41.4
46.2
52.4
60.7
52.3
18.8
29.1
46.7
55.4
54.8
47.8
44.5
44.4
40.8
34.2
24.8
15.1
8.2
3.9
6.4
8.0
7.9
5.7
3.6
4.0
4.2
5.1
5.9
7.1
10.0
28.5
73.2
3.1
3.6
4.6
5.4
3.8
3.2
5.5
4.6
5.2
5.0
5.3
5.8
7.0
7.9
6.5
3.0
4.3
18.0
11.6
7.0
5.1
3.5
0 20 40 60 80 100
75 years old and over
70 to 74
65 to 69
60 to 64
55 to 59
50 to 54
45 to 49
40 to 44
35 to 39
30 to 34
25 to 29
20 to 24
15 to 19 years old
(Female)
(%)
Regular employees Part-time workers Arbeit (temporary workers) Workers dispatched by temporary labour agencies Contract employees Entrusted employees Others
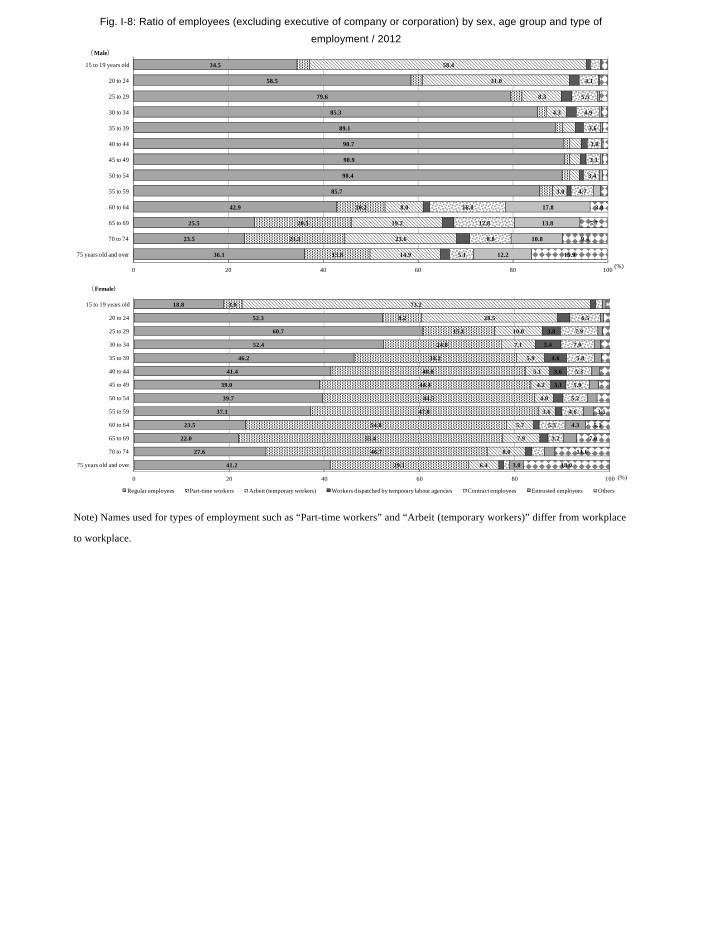
131
Table I-11: Ratio of employees (excluding executive of company or corporation) by sex, age group and type of
employment / 2012
(%)
Type of employment 1)
Regular staffs Part-time workersArbeit (temporary
workers)
Dispatchedworkers from
temporary labouragency
Contractemployees
Entrustedemployees
Others
Total 100.0 61.8 17.9 8.2 2.2 5.4 2.2 2.2 15 to 19 years old 100.0 26.3 3.3 66.1 1.0 1.9 0.4 1.0 20 to 24 100.0 55.4 5.4 29.8 2.3 5.3 0.5 1.4 25 to 29 100.0 71.0 8.2 9.1 2.9 6.6 0.7 1.5 30 to 34 100.0 71.2 11.6 5.5 3.4 5.8 0.8 1.6 35 to 39 100.0 70.9 15.3 4.1 2.9 4.5 0.8 1.4 40 to 44 100.0 68.8 18.8 3.7 2.3 4.0 0.9 1.5 45 to 49 100.0 66.8 21.3 3.1 2.1 4.0 1.1 1.6 50 to 54 100.0 66.8 21.6 3.0 1.3 4.2 1.3 1.8 55 to 59 100.0 63.7 23.2 3.3 1.1 4.6 1.8 2.4 60 to 64 100.0 34.2 30.2 7.0 1.3 11.3 11.7 4.3 65 to 69 100.0 23.9 36.3 14.1 2.0 8.5 8.9 6.3 70 to 74 100.0 25.4 32.8 16.5 2.1 6.0 6.8 10.4 75 years old and over 100.0 38.7 21.5 10.6 1.5 3.1 7.6 17.0Total 100.0 77.9 3.5 7.5 1.5 5.3 2.6 1.8 15 to 19 years old 100.0 34.5 2.7 58.4 0.8 2.2 0.2 1.2 20 to 24 100.0 58.5 2.5 31.0 2.0 4.1 0.3 1.6 25 to 29 100.0 79.6 2.4 8.3 2.2 5.5 0.4 1.5 30 to 34 100.0 85.3 1.8 4.3 2.0 4.9 0.4 1.3 35 to 39 100.0 89.1 1.4 2.8 1.7 3.6 0.4 1.1 40 to 44 100.0 90.7 1.3 2.5 1.2 3.0 0.4 1.0 45 to 49 100.0 90.9 1.2 2.2 1.2 3.1 0.4 1.0 50 to 54 100.0 90.4 1.6 2.1 0.9 3.4 0.6 1.0 55 to 59 100.0 85.7 2.8 3.0 0.8 4.7 1.6 1.4 60 to 64 100.0 42.9 10.2 8.0 1.4 16.0 17.8 3.8 65 to 69 100.0 25.5 20.5 19.2 2.4 12.8 13.8 5.7 70 to 74 100.0 23.5 21.1 23.6 2.7 8.8 10.8 9.4 75 years old and over 100.0 36.1 13.8 14.9 1.9 5.1 12.2 15.9Total 100.0 42.5 35.2 9.1 3.1 5.6 1.8 2.8 15 to 19 years old 100.0 18.8 3.9 73.2 1.1 1.5 0.7 0.8 20 to 24 100.0 52.3 8.2 28.5 2.6 6.5 0.6 1.3 25 to 29 100.0 60.7 15.1 10.0 3.8 7.9 1.0 1.6 30 to 34 100.0 52.4 24.8 7.1 5.4 7.0 1.4 1.9 35 to 39 100.0 46.2 34.2 5.9 4.6 5.8 1.5 1.8 40 to 44 100.0 41.4 40.8 5.1 3.6 5.3 1.7 2.1 45 to 49 100.0 39.0 44.4 4.2 3.1 5.0 1.9 2.3 50 to 54 100.0 39.7 44.5 4.0 1.9 5.2 2.0 2.7 55 to 59 100.0 37.1 47.8 3.6 1.4 4.6 2.0 3.5 60 to 64 100.0 23.5 54.8 5.7 1.1 5.5 4.3 5.1 65 to 69 100.0 22.0 55.4 7.9 1.7 3.2 2.8 7.0 70 to 74 100.0 27.6 46.7 8.0 1.3 2.7 2.1 11.6 75 years old and over 100.0 41.2 29.1 6.4 1.0 1.2 3.0 18.0
Note 1) Names used for types of employment such as “Part-time workers” and “Arbeit (temporary workers)” differ from workplace to workplace.
Fem
ale
Employees(excluding
executive ofcompany orcorporation)
SexAge
Bot
h se
xes
Mal
e
Fig. I-8: Ratio of employees (excluding executive of company or corporation) by sex, age group and type of
employment / 2012
Note) Names used for types of employment such as “Part-time workers” and “Arbeit (temporary workers)” differ from workplace
to workplace.
36.1
23.5
25.5
42.9
85.7
90.4
90.9
90.7
89.1
85.3
79.6
58.5
34.5
13.8
21.1
20.5
10.2
14.9
23.6
19.2
8.0
3.0
4.3
8.3
31.0
58.4
5.1
8.8
12.8
16.0
4.7
3.4
3.1
3.0
3.6
4.9
5.5
4.1
12.2
10.8
13.8
17.8
15.9
9.4
5.7
3.8
0 20 40 60 80 100
75 years old and over
70 to 74
65 to 69
60 to 64
55 to 59
50 to 54
45 to 49
40 to 44
35 to 39
30 to 34
25 to 29
20 to 24
15 to 19 years old
(Male)
(%)
41.2
27.6
22.0
23.5
37.1
39.7
39.0
41.4
46.2
52.4
60.7
52.3
18.8
29.1
46.7
55.4
54.8
47.8
44.5
44.4
40.8
34.2
24.8
15.1
8.2
3.9
6.4
8.0
7.9
5.7
3.6
4.0
4.2
5.1
5.9
7.1
10.0
28.5
73.2
3.1
3.6
4.6
5.4
3.8
3.2
5.5
4.6
5.2
5.0
5.3
5.8
7.0
7.9
6.5
3.0
4.3
18.0
11.6
7.0
5.1
3.5
0 20 40 60 80 100
75 years old and over
70 to 74
65 to 69
60 to 64
55 to 59
50 to 54
45 to 49
40 to 44
35 to 39
30 to 34
25 to 29
20 to 24
15 to 19 years old
(Female)
(%)
Regular employees Part-time workers Arbeit (temporary workers) Workers dispatched by temporary labour agencies Contract employees Entrusted employees Others
132
c. The ratio of “Part-time workers” was high in “Accommodations, eating and drinking services” and “Wholesale and retail trade”.
For the ratio of employees, excluding executive of company or corporation by industrial major
group and type of employment, industries in which there was a high ratio of “Regular staffs”
included “Electricity, gas, heat supply and water” (87.9%), “Mining and quarrying of stone and
gravel” (85.0%), “Government not elsewhere classified” (84.2%), and “Information and
communications” (81.7%). On the other hand, the industry with the lowest ratio of “Regular staffs”
was “Accommodations, eating and drinking services” (26.7%).
Industries in which the ratio of “Part-time workers” was high included “Accommodations, eating
and drinking services” (35.1%), “Wholesale and retail trade” (28.1%) and “Living-related and
personal services and amusement services” (26.9%).
Industries in which the ratio of “Arbeit (temporary workers)” was high included
“Accommodations, eating and drinking services” (31.2%), “Living-related and personal services and
amusement services” (17.8%), and “Wholesale and retail trade” (14.1%).
Compared to 2007, the ratio of “Regular staffs” decreased in all industries, except
“Manufacturing”, “Information and communications”, and “Finance and insurance”. In particular, it
decreased by 13.1 points in “Fisheries”.
By sex, for males the ratio of “Regular staffs” was high in “Government not elsewhere classified”
(92.6%) and “Electricity, gas, heat supply and water” (92.4%), while for females the ratio was high
in “Mining and quarrying of stone and gravel” (89.5%), and “Finance and insurance” (65.2%).
In terms of “Part-time workers”, for males the ratio was high in “Agriculture and forestry” (7.7%)
and “Medical, health care and welfare” (7.1%), while for females, it was high in “Accommodations,
eating and drinking services” (50.3%), and “Wholesale and retail trade” (47.7%).
In terms of “Arbeit (temporary workers)”, for males the ratio was high in “Accommodations,
eating and drinking services” (36.2%), and “Living-related and personal services and amusement
services” (21.0%), and for females in “Accommodations, eating and drinking services” (28.5%), and
“Living-related and personal services and amusement services” (15.8%). (Table I-12/13)
Table I-12: Number of employees (excluding executive of company or corporation) by sex, industrial major group and
main type of employment / 2012
(thousand persons)Sex
Main type of employment 1)
Industry
Regular staffsPart-timeworkers
Arbeit(temporaryworkers)
Regular staffsPart-timeworkers
Arbeit(temporaryworkers)
Regular staffsPart-timeworkers
Arbeit(temporaryworkers)
Total 2) 53,537.5 33,110.4 9,560.8 4,391.9 29,291.7 22,809.0 1,014.3 2,193.8 24,245.7 10,301.3 8,546.5 2,198.1Agriculture and forestry 669.8 318.4 136.5 67.1 311.5 181.7 23.9 39.5 358.3 136.7 112.5 27.6Fisheries 77.1 43.2 6.2 5.4 51.0 34.3 1.0 3.0 26.1 8.9 5.2 2.3Mining and quarrying of stone and gravel 22.6 19.2 0.4 1.2 18.9 15.8 0.1 1.2 3.8 3.4 0.3 - Construction 3,327.6 2,625.0 163.1 180.9 2,745.3 2,260.9 35.7 163.4 582.3 364.1 127.4 17.6Manufacturing 9,728.9 7,167.0 1,271.8 237.3 6,794.5 5,790.9 185.8 142.5 2,934.4 1,376.1 1,085.9 94.8Electricity, gas, heat supply and water 334.3 294.0 7.2 3.8 285.5 263.8 1.2 2.5 48.8 30.2 6.0 1.3Information and communications 1,691.6 1,382.3 51.0 42.4 1,234.9 1,097.2 4.2 21.4 456.7 285.1 46.8 21.0Transport and postal activities 3,197.5 2,172.0 360.9 212.9 2,568.2 1,962.3 82.5 173.2 629.2 209.6 278.4 39.6Wholesale and retail trade 8,345.2 4,171.4 2,344.2 1,180.2 3,819.6 2,838.7 187.8 518.6 4,525.6 1,332.7 2,156.5 661.6Finance and insurance 1,528.7 1,178.7 145.6 13.4 692.1 633.2 5.5 3.4 836.7 545.5 140.1 10.1Real estate and goods rental and leasing 821.2 499.1 128.5 70.4 488.4 335.0 33.5 45.0 332.8 164.1 95.0 25.4Scientific research, professional andtechnical services
1,498.2 1,119.2 119.9 60.4 951.5 804.9 12.6 24.0 546.7 314.3 107.3 36.4
Accommodations, eating and drinkingservices
3,078.6 823.2 1,079.4 960.3 1,075.0 524.6 71.9 389.1 2,003.6 298.6 1,007.5 571.2
Living-related and personal servicesand amusement services
1,738.2 747.2 467.6 309.3 667.2 393.7 42.2 139.8 1,070.9 353.5 425.3 169.5
Education, learning support 2,700.4 1,710.6 265.6 226.4 1,233.8 920.9 26.5 99.9 1,466.6 789.7 239.1 126.5Medical, health care and welfare 6,701.7 4,082.1 1,732.0 180.1 1,415.3 1,113.7 101.1 52.2 5,286.4 2,968.4 1,630.9 127.8Compound services 509.1 350.5 67.5 17.5 305.2 253.6 9.0 7.7 203.8 96.9 58.5 9.8Services, n.e.c. 3,385.2 1,674.2 753.4 294.9 2,011.1 1,288.1 138.5 198.7 1,374.1 386.1 614.9 96.2Government, except elsewhere classified 2,187.4 1,842.2 68.4 39.4 1,596.8 1,478.6 7.0 6.8 590.6 363.6 61.4 32.6
1) Names used for types of employment such as "Part-time workers" and "Arbeit (temporary workers)" differ from workplace to workplace.2) Industries unable to classify are included.
Both sexes Male Female
Employees,excluding
executive ofcompany orcorporation
Employees,excluding
executive ofcompany orcorporation
Employees,excluding
executive ofcompany orcorporation
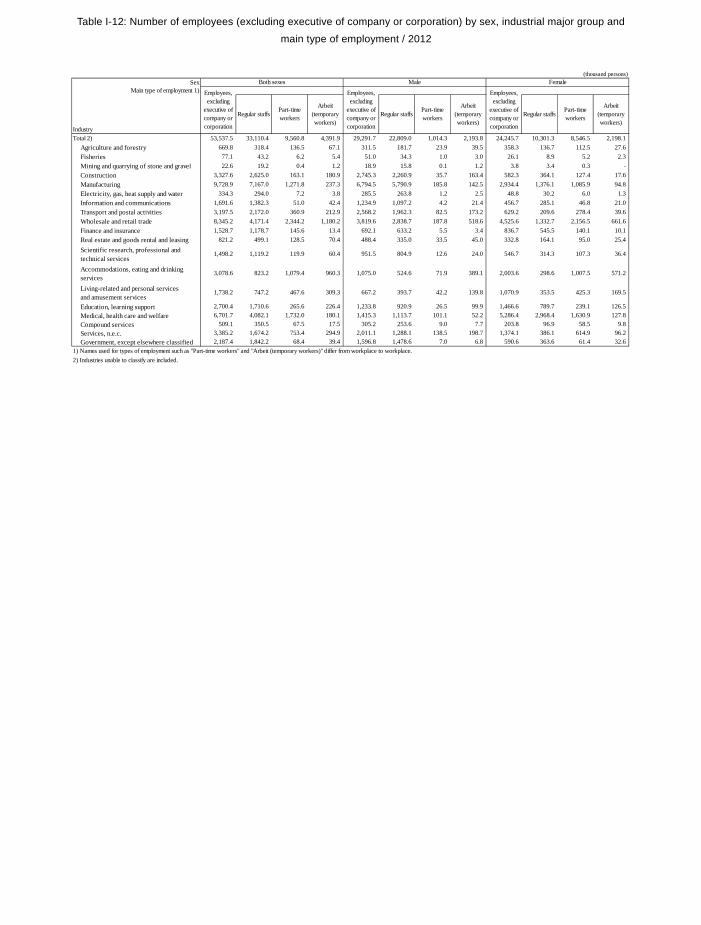
133
c. The ratio of “Part-time workers” was high in “Accommodations, eating and drinking services” and “Wholesale and retail trade”.
For the ratio of employees, excluding executive of company or corporation by industrial major
group and type of employment, industries in which there was a high ratio of “Regular staffs”
included “Electricity, gas, heat supply and water” (87.9%), “Mining and quarrying of stone and
gravel” (85.0%), “Government not elsewhere classified” (84.2%), and “Information and
communications” (81.7%). On the other hand, the industry with the lowest ratio of “Regular staffs”
was “Accommodations, eating and drinking services” (26.7%).
Industries in which the ratio of “Part-time workers” was high included “Accommodations, eating
and drinking services” (35.1%), “Wholesale and retail trade” (28.1%) and “Living-related and
personal services and amusement services” (26.9%).
Industries in which the ratio of “Arbeit (temporary workers)” was high included
“Accommodations, eating and drinking services” (31.2%), “Living-related and personal services and
amusement services” (17.8%), and “Wholesale and retail trade” (14.1%).
Compared to 2007, the ratio of “Regular staffs” decreased in all industries, except
“Manufacturing”, “Information and communications”, and “Finance and insurance”. In particular, it
decreased by 13.1 points in “Fisheries”.
By sex, for males the ratio of “Regular staffs” was high in “Government not elsewhere classified”
(92.6%) and “Electricity, gas, heat supply and water” (92.4%), while for females the ratio was high
in “Mining and quarrying of stone and gravel” (89.5%), and “Finance and insurance” (65.2%).
In terms of “Part-time workers”, for males the ratio was high in “Agriculture and forestry” (7.7%)
and “Medical, health care and welfare” (7.1%), while for females, it was high in “Accommodations,
eating and drinking services” (50.3%), and “Wholesale and retail trade” (47.7%).
In terms of “Arbeit (temporary workers)”, for males the ratio was high in “Accommodations,
eating and drinking services” (36.2%), and “Living-related and personal services and amusement
services” (21.0%), and for females in “Accommodations, eating and drinking services” (28.5%), and
“Living-related and personal services and amusement services” (15.8%). (Table I-12/13)
Table I-12: Number of employees (excluding executive of company or corporation) by sex, industrial major group and
main type of employment / 2012
(thousand persons)Sex
Main type of employment 1)
Industry
Regular staffsPart-timeworkers
Arbeit(temporaryworkers)
Regular staffsPart-timeworkers
Arbeit(temporaryworkers)
Regular staffsPart-timeworkers
Arbeit(temporaryworkers)
Total 2) 53,537.5 33,110.4 9,560.8 4,391.9 29,291.7 22,809.0 1,014.3 2,193.8 24,245.7 10,301.3 8,546.5 2,198.1Agriculture and forestry 669.8 318.4 136.5 67.1 311.5 181.7 23.9 39.5 358.3 136.7 112.5 27.6Fisheries 77.1 43.2 6.2 5.4 51.0 34.3 1.0 3.0 26.1 8.9 5.2 2.3Mining and quarrying of stone and gravel 22.6 19.2 0.4 1.2 18.9 15.8 0.1 1.2 3.8 3.4 0.3 - Construction 3,327.6 2,625.0 163.1 180.9 2,745.3 2,260.9 35.7 163.4 582.3 364.1 127.4 17.6Manufacturing 9,728.9 7,167.0 1,271.8 237.3 6,794.5 5,790.9 185.8 142.5 2,934.4 1,376.1 1,085.9 94.8Electricity, gas, heat supply and water 334.3 294.0 7.2 3.8 285.5 263.8 1.2 2.5 48.8 30.2 6.0 1.3Information and communications 1,691.6 1,382.3 51.0 42.4 1,234.9 1,097.2 4.2 21.4 456.7 285.1 46.8 21.0Transport and postal activities 3,197.5 2,172.0 360.9 212.9 2,568.2 1,962.3 82.5 173.2 629.2 209.6 278.4 39.6Wholesale and retail trade 8,345.2 4,171.4 2,344.2 1,180.2 3,819.6 2,838.7 187.8 518.6 4,525.6 1,332.7 2,156.5 661.6Finance and insurance 1,528.7 1,178.7 145.6 13.4 692.1 633.2 5.5 3.4 836.7 545.5 140.1 10.1Real estate and goods rental and leasing 821.2 499.1 128.5 70.4 488.4 335.0 33.5 45.0 332.8 164.1 95.0 25.4Scientific research, professional andtechnical services
1,498.2 1,119.2 119.9 60.4 951.5 804.9 12.6 24.0 546.7 314.3 107.3 36.4
Accommodations, eating and drinkingservices
3,078.6 823.2 1,079.4 960.3 1,075.0 524.6 71.9 389.1 2,003.6 298.6 1,007.5 571.2
Living-related and personal servicesand amusement services
1,738.2 747.2 467.6 309.3 667.2 393.7 42.2 139.8 1,070.9 353.5 425.3 169.5
Education, learning support 2,700.4 1,710.6 265.6 226.4 1,233.8 920.9 26.5 99.9 1,466.6 789.7 239.1 126.5Medical, health care and welfare 6,701.7 4,082.1 1,732.0 180.1 1,415.3 1,113.7 101.1 52.2 5,286.4 2,968.4 1,630.9 127.8Compound services 509.1 350.5 67.5 17.5 305.2 253.6 9.0 7.7 203.8 96.9 58.5 9.8Services, n.e.c. 3,385.2 1,674.2 753.4 294.9 2,011.1 1,288.1 138.5 198.7 1,374.1 386.1 614.9 96.2Government, except elsewhere classified 2,187.4 1,842.2 68.4 39.4 1,596.8 1,478.6 7.0 6.8 590.6 363.6 61.4 32.6
1) Names used for types of employment such as "Part-time workers" and "Arbeit (temporary workers)" differ from workplace to workplace.2) Industries unable to classify are included.
Both sexes Male Female
Employees,excluding
executive ofcompany orcorporation
Employees,excluding
executive ofcompany orcorporation
Employees,excluding
executive ofcompany orcorporation
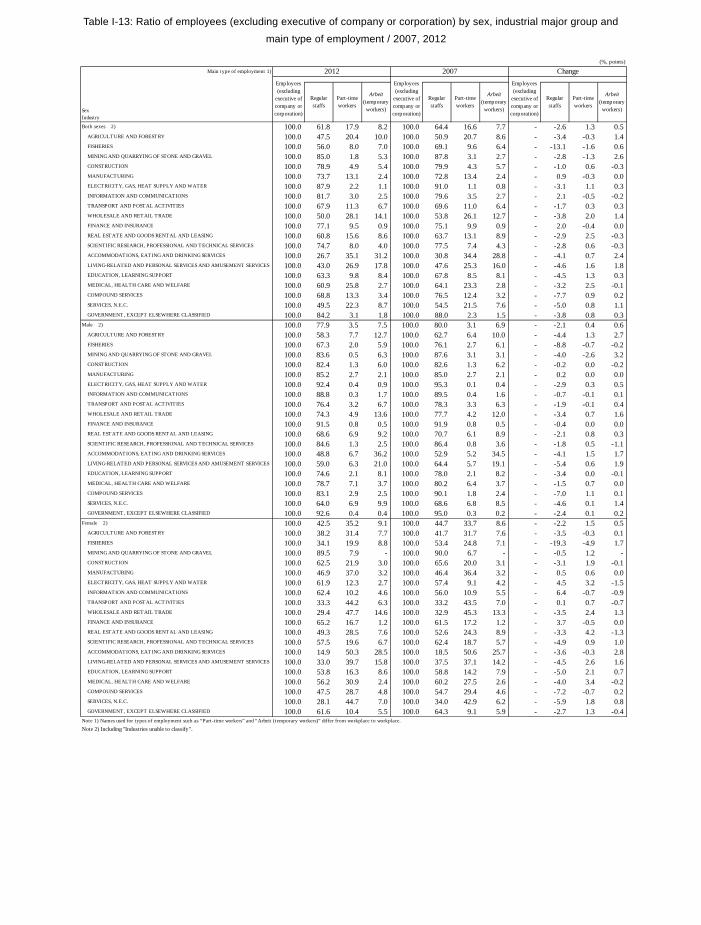
134
Table I-13: Ratio of employees (excluding executive of company or corporation) by sex, industrial major group and
main type of employment / 2007, 2012
(%, points)
Main type of employment 1)
Regularstaffs
Part-timeworkers
Arbeit(temporaryworkers)
Regularstaffs
Part-timeworkers
Arbeit(temporaryworkers)
Regularstaffs
Part-timeworkers
Arbeit(temporaryworkers)
Both sexes 2) 100.0 61.8 17.9 8.2 100.0 64.4 16.6 7.7 - -2.6 1.3 0.5 AGRICULTURE AND FORESTRY 100.0 47.5 20.4 10.0 100.0 50.9 20.7 8.6 - -3.4 -0.3 1.4 FISHERIES 100.0 56.0 8.0 7.0 100.0 69.1 9.6 6.4 - -13.1 -1.6 0.6 MINING AND QUARRYING OF STONE AND GRAVEL 100.0 85.0 1.8 5.3 100.0 87.8 3.1 2.7 - -2.8 -1.3 2.6 CONSTRUCTION 100.0 78.9 4.9 5.4 100.0 79.9 4.3 5.7 - -1.0 0.6 -0.3 MANUFACTURING 100.0 73.7 13.1 2.4 100.0 72.8 13.4 2.4 - 0.9 -0.3 0.0 ELECTRICITY, GAS, HEAT SUPPLY AND WATER 100.0 87.9 2.2 1.1 100.0 91.0 1.1 0.8 - -3.1 1.1 0.3 INFORMATION AND COMMUNICATIONS 100.0 81.7 3.0 2.5 100.0 79.6 3.5 2.7 - 2.1 -0.5 -0.2 TRANSPORT AND POSTAL ACTIVITIES 100.0 67.9 11.3 6.7 100.0 69.6 11.0 6.4 - -1.7 0.3 0.3 WHOLESALE AND RETAIL TRADE 100.0 50.0 28.1 14.1 100.0 53.8 26.1 12.7 - -3.8 2.0 1.4 FINANCE AND INSURANCE 100.0 77.1 9.5 0.9 100.0 75.1 9.9 0.9 - 2.0 -0.4 0.0 REAL ESTATE AND GOODS RENTAL AND LEASING 100.0 60.8 15.6 8.6 100.0 63.7 13.1 8.9 - -2.9 2.5 -0.3 SCIENTIFIC RESEARCH, PROFESSIONAL AND TECHNICAL SERVICES 100.0 74.7 8.0 4.0 100.0 77.5 7.4 4.3 - -2.8 0.6 -0.3 ACCOMMODATIONS, EATING AND DRINKING SERVICES 100.0 26.7 35.1 31.2 100.0 30.8 34.4 28.8 - -4.1 0.7 2.4 LIVING-RELATED AND PERSONAL SERVICES AND AMUSEMENT SERVICES 100.0 43.0 26.9 17.8 100.0 47.6 25.3 16.0 - -4.6 1.6 1.8 EDUCATION, LEARNING SUPPORT 100.0 63.3 9.8 8.4 100.0 67.8 8.5 8.1 - -4.5 1.3 0.3 MEDICAL, HEALTH CARE AND WELFARE 100.0 60.9 25.8 2.7 100.0 64.1 23.3 2.8 - -3.2 2.5 -0.1 COMPOUND SERVICES 100.0 68.8 13.3 3.4 100.0 76.5 12.4 3.2 - -7.7 0.9 0.2 SERVICES, N.E.C. 100.0 49.5 22.3 8.7 100.0 54.5 21.5 7.6 - -5.0 0.8 1.1 GOVERNMENT, EXCEPT ELSEWHERE CLASSIFIED 100.0 84.2 3.1 1.8 100.0 88.0 2.3 1.5 - -3.8 0.8 0.3Male 2) 100.0 77.9 3.5 7.5 100.0 80.0 3.1 6.9 - -2.1 0.4 0.6 AGRICULTURE AND FORESTRY 100.0 58.3 7.7 12.7 100.0 62.7 6.4 10.0 - -4.4 1.3 2.7 FISHERIES 100.0 67.3 2.0 5.9 100.0 76.1 2.7 6.1 - -8.8 -0.7 -0.2 MINING AND QUARRYING OF STONE AND GRAVEL 100.0 83.6 0.5 6.3 100.0 87.6 3.1 3.1 - -4.0 -2.6 3.2 CONSTRUCTION 100.0 82.4 1.3 6.0 100.0 82.6 1.3 6.2 - -0.2 0.0 -0.2 MANUFACTURING 100.0 85.2 2.7 2.1 100.0 85.0 2.7 2.1 - 0.2 0.0 0.0 ELECTRICITY, GAS, HEAT SUPPLY AND WATER 100.0 92.4 0.4 0.9 100.0 95.3 0.1 0.4 - -2.9 0.3 0.5 INFORMATION AND COMMUNICATIONS 100.0 88.8 0.3 1.7 100.0 89.5 0.4 1.6 - -0.7 -0.1 0.1 TRANSPORT AND POSTAL ACTIVITIES 100.0 76.4 3.2 6.7 100.0 78.3 3.3 6.3 - -1.9 -0.1 0.4 WHOLESALE AND RETAIL TRADE 100.0 74.3 4.9 13.6 100.0 77.7 4.2 12.0 - -3.4 0.7 1.6 FINANCE AND INSURANCE 100.0 91.5 0.8 0.5 100.0 91.9 0.8 0.5 - -0.4 0.0 0.0 REAL ESTATE AND GOODS RENTAL AND LEASING 100.0 68.6 6.9 9.2 100.0 70.7 6.1 8.9 - -2.1 0.8 0.3 SCIENTIFIC RESEARCH, PROFESSIONAL AND TECHNICAL SERVICES 100.0 84.6 1.3 2.5 100.0 86.4 0.8 3.6 - -1.8 0.5 -1.1 ACCOMMODATIONS, EATING AND DRINKING SERVICES 100.0 48.8 6.7 36.2 100.0 52.9 5.2 34.5 - -4.1 1.5 1.7 LIVING-RELATED AND PERSONAL SERVICES AND AMUSEMENT SERVICES 100.0 59.0 6.3 21.0 100.0 64.4 5.7 19.1 - -5.4 0.6 1.9 EDUCATION, LEARNING SUPPORT 100.0 74.6 2.1 8.1 100.0 78.0 2.1 8.2 - -3.4 0.0 -0.1 MEDICAL, HEALTH CARE AND WELFARE 100.0 78.7 7.1 3.7 100.0 80.2 6.4 3.7 - -1.5 0.7 0.0 COMPOUND SERVICES 100.0 83.1 2.9 2.5 100.0 90.1 1.8 2.4 - -7.0 1.1 0.1 SERVICES, N.E.C. 100.0 64.0 6.9 9.9 100.0 68.6 6.8 8.5 - -4.6 0.1 1.4 GOVERNMENT, EXCEPT ELSEWHERE CLASSIFIED 100.0 92.6 0.4 0.4 100.0 95.0 0.3 0.2 - -2.4 0.1 0.2Female 2) 100.0 42.5 35.2 9.1 100.0 44.7 33.7 8.6 - -2.2 1.5 0.5 AGRICULTURE AND FORESTRY 100.0 38.2 31.4 7.7 100.0 41.7 31.7 7.6 - -3.5 -0.3 0.1 FISHERIES 100.0 34.1 19.9 8.8 100.0 53.4 24.8 7.1 - -19.3 -4.9 1.7 MINING AND QUARRYING OF STONE AND GRAVEL 100.0 89.5 7.9 - 100.0 90.0 6.7 - - -0.5 1.2 - CONSTRUCTION 100.0 62.5 21.9 3.0 100.0 65.6 20.0 3.1 - -3.1 1.9 -0.1 MANUFACTURING 100.0 46.9 37.0 3.2 100.0 46.4 36.4 3.2 - 0.5 0.6 0.0 ELECTRICITY, GAS, HEAT SUPPLY AND WATER 100.0 61.9 12.3 2.7 100.0 57.4 9.1 4.2 - 4.5 3.2 -1.5 INFORMATION AND COMMUNICATIONS 100.0 62.4 10.2 4.6 100.0 56.0 10.9 5.5 - 6.4 -0.7 -0.9 TRANSPORT AND POSTAL ACTIVITIES 100.0 33.3 44.2 6.3 100.0 33.2 43.5 7.0 - 0.1 0.7 -0.7 WHOLESALE AND RETAIL TRADE 100.0 29.4 47.7 14.6 100.0 32.9 45.3 13.3 - -3.5 2.4 1.3 FINANCE AND INSURANCE 100.0 65.2 16.7 1.2 100.0 61.5 17.2 1.2 - 3.7 -0.5 0.0 REAL ESTATE AND GOODS RENTAL AND LEASING 100.0 49.3 28.5 7.6 100.0 52.6 24.3 8.9 - -3.3 4.2 -1.3 SCIENTIFIC RESEARCH, PROFESSIONAL AND TECHNICAL SERVICES 100.0 57.5 19.6 6.7 100.0 62.4 18.7 5.7 - -4.9 0.9 1.0 ACCOMMODATIONS, EATING AND DRINKING SERVICES 100.0 14.9 50.3 28.5 100.0 18.5 50.6 25.7 - -3.6 -0.3 2.8 LIVING-RELATED AND PERSONAL SERVICES AND AMUSEMENT SERVICES 100.0 33.0 39.7 15.8 100.0 37.5 37.1 14.2 - -4.5 2.6 1.6 EDUCATION, LEARNING SUPPORT 100.0 53.8 16.3 8.6 100.0 58.8 14.2 7.9 - -5.0 2.1 0.7 MEDICAL, HEALTH CARE AND WELFARE 100.0 56.2 30.9 2.4 100.0 60.2 27.5 2.6 - -4.0 3.4 -0.2 COMPOUND SERVICES 100.0 47.5 28.7 4.8 100.0 54.7 29.4 4.6 - -7.2 -0.7 0.2 SERVICES, N.E.C. 100.0 28.1 44.7 7.0 100.0 34.0 42.9 6.2 - -5.9 1.8 0.8 GOVERNMENT, EXCEPT ELSEWHERE CLASSIFIED 100.0 61.6 10.4 5.5 100.0 64.3 9.1 5.9 - -2.7 1.3 -0.4Note 1) Names used for types of employment such as “Part-time workers” and “Arbeit (temporary workers)” differ from workplace to workplace.Note 2) Including "Industries unable to classify".
2012 2007 ChangeEmployees(excluding
executive ofcompany orcorporation)
Employees(excluding
executive ofcompany orcorporation)
Employees(excluding
executive ofcompany orcorporation)Sex
Industry
d. The ratio of “Part-time workers” was high among “Carrying, cleaning, packaging, and related workers”.
Viewing employees (excluding executive of company or corporation) by occupational major
group and type of employment, occupations in which the ratio of “Regular staffs” was high
included “Administrative and managerial workers” (93.2%), “Construction and mining workers”
(80.9%) and “Professional and engineering workers” (77.6%). Among “Carrying, cleaning,
packaging, and related workers”, conversely, the ratio of “Regular staffs” was lowest at 30.8%.
Occupations in which the ratio of “Part-time workers” was high included “Carrying, cleaning,
packaging, and related workers” (40.3%), “Service workers” (33.8%) and “Sales workers” (19.3%).
Occupations in which the ratio of “Arbeit (temporary workers)” was high included “Service workers”
(18.2%), “Carrying, cleaning, packaging, and related workers” (14.0%) and “Sales workers” (13.6%).
Compared to 2007, the ratio of “Regular staffs” decreased in all occupations, except
“Construction and mining workers” in which it increased by 0.8 points. In particular, it decreased
by 6.4 points in “Agriculture, forestry and fishery workers”.
By sex, for males the ratio of “Regular staffs” was high among “Administrative and managerial
workers” (93.1%), “Professional and engineering workers” (87.3%), and “Clerical workers”
(84.6%). For females, the ratio was high among “Administrative and managerial workers” (94.7%),
“Security workers” (70.2%), and “Professional and engineering workers” (67.4%).
In terms of “Part-time workers”, for males the ratio was high among “Carrying, cleaning, packaging,
and related workers” (13.3%), “Service workers” (7.5%), and “Agriculture, forestry and fishery workers”
(7.1%). For females the ratio was high among “Carrying, cleaning, packaging, and related workers”
(69.0%), “Manufacturing process workers” (50.0%), and “Service workers” (44.9%).
In terms of “Arbeit (temporary workers)”, for males the ratio was high among “Service workers”
(25.7%), “Carrying, cleaning, packaging, and related workers” (17.6%), and “Agriculture, forestry
and fishery workers” (11.5%). For females, the ratio was high among “Sales workers” (18.9%),
“Service workers” (15.1%), and “Carrying, cleaning, packaging, and related workers” (10.1%).
(Table I-14/15)
Table I-14: Number of employees (excluding executive of company or corporation) by sex, occupational major group
and main type of employment / 2012
(thousand persons)
Sex Both sexes Male FemaleMain type of employment 1)
Occupation
Regular staffs Part-timeworkers
Arbeit(temporaryworkers)
Regular staffs Part-timeworkers
Arbeit(temporaryworkers)
Regular staffs Part-timeworkers
Arbeit(temporaryworkers)
Total 2) 53,537.5 33,110.4 9,560.8 4,391.9 29,291.7 22,809.0 1,014.3 2,193.8 24,245.7 10,301.3 8,546.5 2,198.1229.9 214.3 0.4 0.2 218.6 203.6 0.3 0.2 11.3 10.7 0.1 0.0
8,733.4 6,778.8 758.8 261.4 4,474.7 3,908.0 45.9 114.5 4,258.6 2,870.9 712.8 146.911,625.5 7,735.9 1,736.7 406.9 4,814.8 4,074.7 83.0 119.2 6,810.7 3,661.2 1,653.7 287.7
Sales workers 7,166.8 4,271.3 1,380.1 974.9 4,016.7 3,291.7 87.4 381.0 3,150.1 979.6 1,292.7 593.9Service workers 6,531.3 2,449.3 2,209.7 1,190.8 1,937.6 1,079.4 145.0 498.2 4,593.7 1,369.9 2,064.6 692.6
1,135.2 856.7 52.8 91.3 1,069.1 810.3 43.3 86.2 66.1 46.4 9.5 5.1682.8 337.1 111.2 66.4 362.5 210.8 25.6 41.6 320.3 126.3 85.7 24.8
7,832.3 5,293.5 1,317.0 330.8 5,557.1 4,577.5 180.3 194.7 2,275.2 716.0 1,136.8 136.12,156.0 1,622.9 102.8 143.3 2,092.6 1,593.0 82.7 137.8 63.4 29.9 20.2 5.51,898.1 1,536.2 28.1 125.6 1,854.5 1,508.5 22.8 122.0 43.6 27.7 5.4 3.73,719.9 1,144.1 1,498.2 519.1 1,919.7 953.2 256.0 337.9 1,800.1 190.9 1,242.2 181.2
1) Names used for types of employment such as "Part-time workers" and "Arbeit (temporary workers)" differ from workplace to workplace. 2) Workers not classifiable by occupation are included.
Agriculture, forestry and fishery workersManufacturing process workersTransport and machine operation workersConstruction and mining workersCarrying, cleaning, packaging, and related workers
Administrative and managerial workersProfessional and engineering workersClerical workers
Security workers
Employees,excluding
executive ofcompany orcorporation
Employees,excluding
executive ofcompany orcorporation
Employees,excluding
executive ofcompany orcorporation
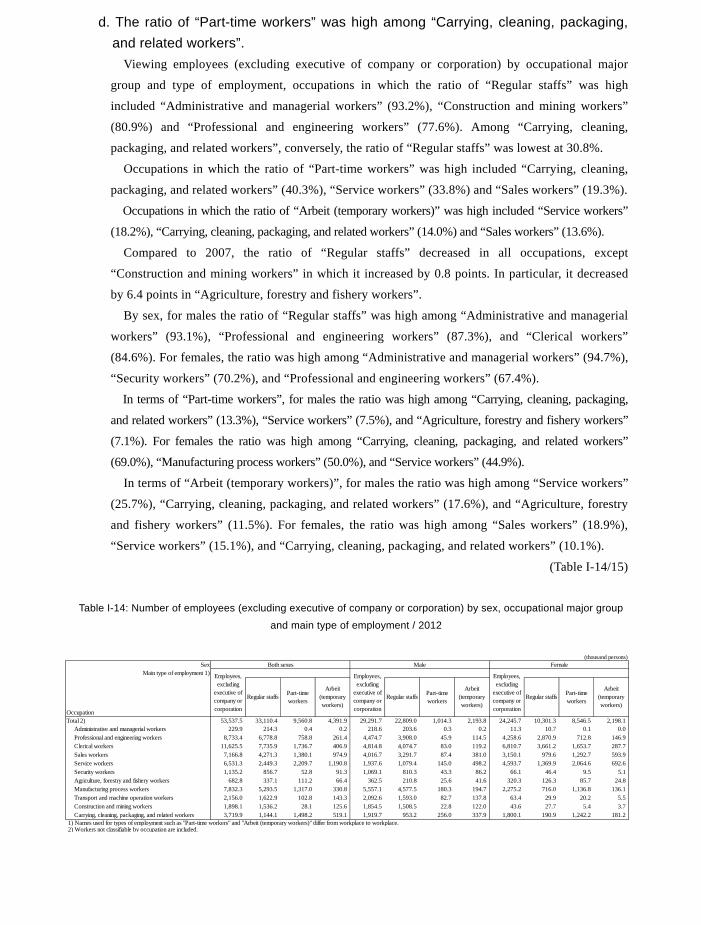
135
Table I-13: Ratio of employees (excluding executive of company or corporation) by sex, industrial major group and
main type of employment / 2007, 2012
(%, points)
Main type of employment 1)
Regularstaffs
Part-timeworkers
Arbeit(temporaryworkers)
Regularstaffs
Part-timeworkers
Arbeit(temporaryworkers)
Regularstaffs
Part-timeworkers
Arbeit(temporaryworkers)
Both sexes 2) 100.0 61.8 17.9 8.2 100.0 64.4 16.6 7.7 - -2.6 1.3 0.5 AGRICULTURE AND FORESTRY 100.0 47.5 20.4 10.0 100.0 50.9 20.7 8.6 - -3.4 -0.3 1.4 FISHERIES 100.0 56.0 8.0 7.0 100.0 69.1 9.6 6.4 - -13.1 -1.6 0.6 MINING AND QUARRYING OF STONE AND GRAVEL 100.0 85.0 1.8 5.3 100.0 87.8 3.1 2.7 - -2.8 -1.3 2.6 CONSTRUCTION 100.0 78.9 4.9 5.4 100.0 79.9 4.3 5.7 - -1.0 0.6 -0.3 MANUFACTURING 100.0 73.7 13.1 2.4 100.0 72.8 13.4 2.4 - 0.9 -0.3 0.0 ELECTRICITY, GAS, HEAT SUPPLY AND WATER 100.0 87.9 2.2 1.1 100.0 91.0 1.1 0.8 - -3.1 1.1 0.3 INFORMATION AND COMMUNICATIONS 100.0 81.7 3.0 2.5 100.0 79.6 3.5 2.7 - 2.1 -0.5 -0.2 TRANSPORT AND POSTAL ACTIVITIES 100.0 67.9 11.3 6.7 100.0 69.6 11.0 6.4 - -1.7 0.3 0.3 WHOLESALE AND RETAIL TRADE 100.0 50.0 28.1 14.1 100.0 53.8 26.1 12.7 - -3.8 2.0 1.4 FINANCE AND INSURANCE 100.0 77.1 9.5 0.9 100.0 75.1 9.9 0.9 - 2.0 -0.4 0.0 REAL ESTATE AND GOODS RENTAL AND LEASING 100.0 60.8 15.6 8.6 100.0 63.7 13.1 8.9 - -2.9 2.5 -0.3 SCIENTIFIC RESEARCH, PROFESSIONAL AND TECHNICAL SERVICES 100.0 74.7 8.0 4.0 100.0 77.5 7.4 4.3 - -2.8 0.6 -0.3 ACCOMMODATIONS, EATING AND DRINKING SERVICES 100.0 26.7 35.1 31.2 100.0 30.8 34.4 28.8 - -4.1 0.7 2.4 LIVING-RELATED AND PERSONAL SERVICES AND AMUSEMENT SERVICES 100.0 43.0 26.9 17.8 100.0 47.6 25.3 16.0 - -4.6 1.6 1.8 EDUCATION, LEARNING SUPPORT 100.0 63.3 9.8 8.4 100.0 67.8 8.5 8.1 - -4.5 1.3 0.3 MEDICAL, HEALTH CARE AND WELFARE 100.0 60.9 25.8 2.7 100.0 64.1 23.3 2.8 - -3.2 2.5 -0.1 COMPOUND SERVICES 100.0 68.8 13.3 3.4 100.0 76.5 12.4 3.2 - -7.7 0.9 0.2 SERVICES, N.E.C. 100.0 49.5 22.3 8.7 100.0 54.5 21.5 7.6 - -5.0 0.8 1.1 GOVERNMENT, EXCEPT ELSEWHERE CLASSIFIED 100.0 84.2 3.1 1.8 100.0 88.0 2.3 1.5 - -3.8 0.8 0.3Male 2) 100.0 77.9 3.5 7.5 100.0 80.0 3.1 6.9 - -2.1 0.4 0.6 AGRICULTURE AND FORESTRY 100.0 58.3 7.7 12.7 100.0 62.7 6.4 10.0 - -4.4 1.3 2.7 FISHERIES 100.0 67.3 2.0 5.9 100.0 76.1 2.7 6.1 - -8.8 -0.7 -0.2 MINING AND QUARRYING OF STONE AND GRAVEL 100.0 83.6 0.5 6.3 100.0 87.6 3.1 3.1 - -4.0 -2.6 3.2 CONSTRUCTION 100.0 82.4 1.3 6.0 100.0 82.6 1.3 6.2 - -0.2 0.0 -0.2 MANUFACTURING 100.0 85.2 2.7 2.1 100.0 85.0 2.7 2.1 - 0.2 0.0 0.0 ELECTRICITY, GAS, HEAT SUPPLY AND WATER 100.0 92.4 0.4 0.9 100.0 95.3 0.1 0.4 - -2.9 0.3 0.5 INFORMATION AND COMMUNICATIONS 100.0 88.8 0.3 1.7 100.0 89.5 0.4 1.6 - -0.7 -0.1 0.1 TRANSPORT AND POSTAL ACTIVITIES 100.0 76.4 3.2 6.7 100.0 78.3 3.3 6.3 - -1.9 -0.1 0.4 WHOLESALE AND RETAIL TRADE 100.0 74.3 4.9 13.6 100.0 77.7 4.2 12.0 - -3.4 0.7 1.6 FINANCE AND INSURANCE 100.0 91.5 0.8 0.5 100.0 91.9 0.8 0.5 - -0.4 0.0 0.0 REAL ESTATE AND GOODS RENTAL AND LEASING 100.0 68.6 6.9 9.2 100.0 70.7 6.1 8.9 - -2.1 0.8 0.3 SCIENTIFIC RESEARCH, PROFESSIONAL AND TECHNICAL SERVICES 100.0 84.6 1.3 2.5 100.0 86.4 0.8 3.6 - -1.8 0.5 -1.1 ACCOMMODATIONS, EATING AND DRINKING SERVICES 100.0 48.8 6.7 36.2 100.0 52.9 5.2 34.5 - -4.1 1.5 1.7 LIVING-RELATED AND PERSONAL SERVICES AND AMUSEMENT SERVICES 100.0 59.0 6.3 21.0 100.0 64.4 5.7 19.1 - -5.4 0.6 1.9 EDUCATION, LEARNING SUPPORT 100.0 74.6 2.1 8.1 100.0 78.0 2.1 8.2 - -3.4 0.0 -0.1 MEDICAL, HEALTH CARE AND WELFARE 100.0 78.7 7.1 3.7 100.0 80.2 6.4 3.7 - -1.5 0.7 0.0 COMPOUND SERVICES 100.0 83.1 2.9 2.5 100.0 90.1 1.8 2.4 - -7.0 1.1 0.1 SERVICES, N.E.C. 100.0 64.0 6.9 9.9 100.0 68.6 6.8 8.5 - -4.6 0.1 1.4 GOVERNMENT, EXCEPT ELSEWHERE CLASSIFIED 100.0 92.6 0.4 0.4 100.0 95.0 0.3 0.2 - -2.4 0.1 0.2Female 2) 100.0 42.5 35.2 9.1 100.0 44.7 33.7 8.6 - -2.2 1.5 0.5 AGRICULTURE AND FORESTRY 100.0 38.2 31.4 7.7 100.0 41.7 31.7 7.6 - -3.5 -0.3 0.1 FISHERIES 100.0 34.1 19.9 8.8 100.0 53.4 24.8 7.1 - -19.3 -4.9 1.7 MINING AND QUARRYING OF STONE AND GRAVEL 100.0 89.5 7.9 - 100.0 90.0 6.7 - - -0.5 1.2 - CONSTRUCTION 100.0 62.5 21.9 3.0 100.0 65.6 20.0 3.1 - -3.1 1.9 -0.1 MANUFACTURING 100.0 46.9 37.0 3.2 100.0 46.4 36.4 3.2 - 0.5 0.6 0.0 ELECTRICITY, GAS, HEAT SUPPLY AND WATER 100.0 61.9 12.3 2.7 100.0 57.4 9.1 4.2 - 4.5 3.2 -1.5 INFORMATION AND COMMUNICATIONS 100.0 62.4 10.2 4.6 100.0 56.0 10.9 5.5 - 6.4 -0.7 -0.9 TRANSPORT AND POSTAL ACTIVITIES 100.0 33.3 44.2 6.3 100.0 33.2 43.5 7.0 - 0.1 0.7 -0.7 WHOLESALE AND RETAIL TRADE 100.0 29.4 47.7 14.6 100.0 32.9 45.3 13.3 - -3.5 2.4 1.3 FINANCE AND INSURANCE 100.0 65.2 16.7 1.2 100.0 61.5 17.2 1.2 - 3.7 -0.5 0.0 REAL ESTATE AND GOODS RENTAL AND LEASING 100.0 49.3 28.5 7.6 100.0 52.6 24.3 8.9 - -3.3 4.2 -1.3 SCIENTIFIC RESEARCH, PROFESSIONAL AND TECHNICAL SERVICES 100.0 57.5 19.6 6.7 100.0 62.4 18.7 5.7 - -4.9 0.9 1.0 ACCOMMODATIONS, EATING AND DRINKING SERVICES 100.0 14.9 50.3 28.5 100.0 18.5 50.6 25.7 - -3.6 -0.3 2.8 LIVING-RELATED AND PERSONAL SERVICES AND AMUSEMENT SERVICES 100.0 33.0 39.7 15.8 100.0 37.5 37.1 14.2 - -4.5 2.6 1.6 EDUCATION, LEARNING SUPPORT 100.0 53.8 16.3 8.6 100.0 58.8 14.2 7.9 - -5.0 2.1 0.7 MEDICAL, HEALTH CARE AND WELFARE 100.0 56.2 30.9 2.4 100.0 60.2 27.5 2.6 - -4.0 3.4 -0.2 COMPOUND SERVICES 100.0 47.5 28.7 4.8 100.0 54.7 29.4 4.6 - -7.2 -0.7 0.2 SERVICES, N.E.C. 100.0 28.1 44.7 7.0 100.0 34.0 42.9 6.2 - -5.9 1.8 0.8 GOVERNMENT, EXCEPT ELSEWHERE CLASSIFIED 100.0 61.6 10.4 5.5 100.0 64.3 9.1 5.9 - -2.7 1.3 -0.4Note 1) Names used for types of employment such as “Part-time workers” and “Arbeit (temporary workers)” differ from workplace to workplace.Note 2) Including "Industries unable to classify".
2012 2007 ChangeEmployees(excluding
executive ofcompany orcorporation)
Employees(excluding
executive ofcompany orcorporation)
Employees(excluding
executive ofcompany orcorporation)Sex
Industry
d. The ratio of “Part-time workers” was high among “Carrying, cleaning, packaging, and related workers”.
Viewing employees (excluding executive of company or corporation) by occupational major
group and type of employment, occupations in which the ratio of “Regular staffs” was high
included “Administrative and managerial workers” (93.2%), “Construction and mining workers”
(80.9%) and “Professional and engineering workers” (77.6%). Among “Carrying, cleaning,
packaging, and related workers”, conversely, the ratio of “Regular staffs” was lowest at 30.8%.
Occupations in which the ratio of “Part-time workers” was high included “Carrying, cleaning,
packaging, and related workers” (40.3%), “Service workers” (33.8%) and “Sales workers” (19.3%).
Occupations in which the ratio of “Arbeit (temporary workers)” was high included “Service workers”
(18.2%), “Carrying, cleaning, packaging, and related workers” (14.0%) and “Sales workers” (13.6%).
Compared to 2007, the ratio of “Regular staffs” decreased in all occupations, except
“Construction and mining workers” in which it increased by 0.8 points. In particular, it decreased
by 6.4 points in “Agriculture, forestry and fishery workers”.
By sex, for males the ratio of “Regular staffs” was high among “Administrative and managerial
workers” (93.1%), “Professional and engineering workers” (87.3%), and “Clerical workers”
(84.6%). For females, the ratio was high among “Administrative and managerial workers” (94.7%),
“Security workers” (70.2%), and “Professional and engineering workers” (67.4%).
In terms of “Part-time workers”, for males the ratio was high among “Carrying, cleaning, packaging,
and related workers” (13.3%), “Service workers” (7.5%), and “Agriculture, forestry and fishery workers”
(7.1%). For females the ratio was high among “Carrying, cleaning, packaging, and related workers”
(69.0%), “Manufacturing process workers” (50.0%), and “Service workers” (44.9%).
In terms of “Arbeit (temporary workers)”, for males the ratio was high among “Service workers”
(25.7%), “Carrying, cleaning, packaging, and related workers” (17.6%), and “Agriculture, forestry
and fishery workers” (11.5%). For females, the ratio was high among “Sales workers” (18.9%),
“Service workers” (15.1%), and “Carrying, cleaning, packaging, and related workers” (10.1%).
(Table I-14/15)
Table I-14: Number of employees (excluding executive of company or corporation) by sex, occupational major group
and main type of employment / 2012
(thousand persons)
Sex Both sexes Male FemaleMain type of employment 1)
Occupation
Regular staffs Part-timeworkers
Arbeit(temporaryworkers)
Regular staffs Part-timeworkers
Arbeit(temporaryworkers)
Regular staffs Part-timeworkers
Arbeit(temporaryworkers)
Total 2) 53,537.5 33,110.4 9,560.8 4,391.9 29,291.7 22,809.0 1,014.3 2,193.8 24,245.7 10,301.3 8,546.5 2,198.1229.9 214.3 0.4 0.2 218.6 203.6 0.3 0.2 11.3 10.7 0.1 0.0
8,733.4 6,778.8 758.8 261.4 4,474.7 3,908.0 45.9 114.5 4,258.6 2,870.9 712.8 146.911,625.5 7,735.9 1,736.7 406.9 4,814.8 4,074.7 83.0 119.2 6,810.7 3,661.2 1,653.7 287.7
Sales workers 7,166.8 4,271.3 1,380.1 974.9 4,016.7 3,291.7 87.4 381.0 3,150.1 979.6 1,292.7 593.9Service workers 6,531.3 2,449.3 2,209.7 1,190.8 1,937.6 1,079.4 145.0 498.2 4,593.7 1,369.9 2,064.6 692.6
1,135.2 856.7 52.8 91.3 1,069.1 810.3 43.3 86.2 66.1 46.4 9.5 5.1682.8 337.1 111.2 66.4 362.5 210.8 25.6 41.6 320.3 126.3 85.7 24.8
7,832.3 5,293.5 1,317.0 330.8 5,557.1 4,577.5 180.3 194.7 2,275.2 716.0 1,136.8 136.12,156.0 1,622.9 102.8 143.3 2,092.6 1,593.0 82.7 137.8 63.4 29.9 20.2 5.51,898.1 1,536.2 28.1 125.6 1,854.5 1,508.5 22.8 122.0 43.6 27.7 5.4 3.73,719.9 1,144.1 1,498.2 519.1 1,919.7 953.2 256.0 337.9 1,800.1 190.9 1,242.2 181.2
1) Names used for types of employment such as "Part-time workers" and "Arbeit (temporary workers)" differ from workplace to workplace. 2) Workers not classifiable by occupation are included.
Agriculture, forestry and fishery workersManufacturing process workersTransport and machine operation workersConstruction and mining workersCarrying, cleaning, packaging, and related workers
Administrative and managerial workersProfessional and engineering workersClerical workers
Security workers
Employees,excluding
executive ofcompany orcorporation
Employees,excluding
executive ofcompany orcorporation
Employees,excluding
executive ofcompany orcorporation
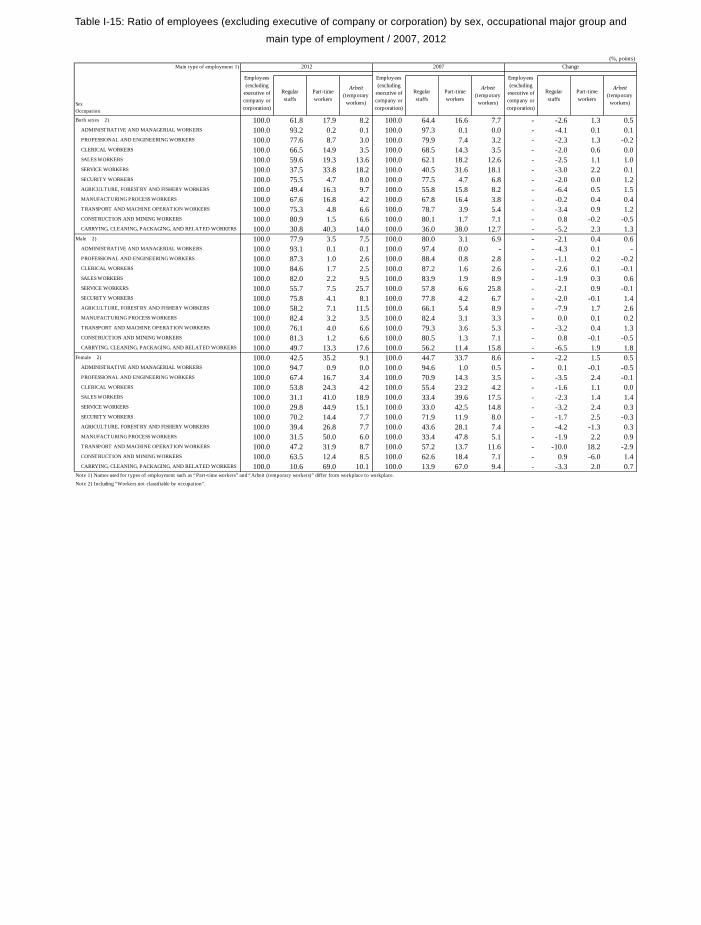
136
Table I-15: Ratio of employees (excluding executive of company or corporation) by sex, occupational major group and
main type of employment / 2007, 2012
(%, points)Main type of employment 1)
Regularstaffs
Part-timeworkers
Arbeit(temporaryworkers)
Regularstaffs
Part-timeworkers
Arbeit(temporaryworkers)
Regularstaffs
Part-timeworkers
Arbeit(temporaryworkers)
Both sexes 2) 100.0 61.8 17.9 8.2 100.0 64.4 16.6 7.7 - -2.6 1.3 0.5 ADMINISTRATIVE AND MANAGERIAL WORKERS 100.0 93.2 0.2 0.1 100.0 97.3 0.1 0.0 - -4.1 0.1 0.1 PROFESSIONAL AND ENGINEERING WORKERS 100.0 77.6 8.7 3.0 100.0 79.9 7.4 3.2 - -2.3 1.3 -0.2 CLERICAL WORKERS 100.0 66.5 14.9 3.5 100.0 68.5 14.3 3.5 - -2.0 0.6 0.0 SALES WORKERS 100.0 59.6 19.3 13.6 100.0 62.1 18.2 12.6 - -2.5 1.1 1.0 SERVICE WORKERS 100.0 37.5 33.8 18.2 100.0 40.5 31.6 18.1 - -3.0 2.2 0.1 SECURITY WORKERS 100.0 75.5 4.7 8.0 100.0 77.5 4.7 6.8 - -2.0 0.0 1.2 AGRICULTURE, FORESTRY AND FISHERY WORKERS 100.0 49.4 16.3 9.7 100.0 55.8 15.8 8.2 - -6.4 0.5 1.5 MANUFACTURING PROCESS WORKERS 100.0 67.6 16.8 4.2 100.0 67.8 16.4 3.8 - -0.2 0.4 0.4 TRANSPORT AND MACHINE OPERATION WORKERS 100.0 75.3 4.8 6.6 100.0 78.7 3.9 5.4 - -3.4 0.9 1.2 CONSTRUCTION AND MINING WORKERS 100.0 80.9 1.5 6.6 100.0 80.1 1.7 7.1 - 0.8 -0.2 -0.5 CARRYING, CLEANING, PACKAGING, AND RELATED WORKERS 100.0 30.8 40.3 14.0 100.0 36.0 38.0 12.7 - -5.2 2.3 1.3Male 2) 100.0 77.9 3.5 7.5 100.0 80.0 3.1 6.9 - -2.1 0.4 0.6 ADMINISTRATIVE AND MANAGERIAL WORKERS 100.0 93.1 0.1 0.1 100.0 97.4 0.0 - - -4.3 0.1 - PROFESSIONAL AND ENGINEERING WORKERS 100.0 87.3 1.0 2.6 100.0 88.4 0.8 2.8 - -1.1 0.2 -0.2 CLERICAL WORKERS 100.0 84.6 1.7 2.5 100.0 87.2 1.6 2.6 - -2.6 0.1 -0.1 SALES WORKERS 100.0 82.0 2.2 9.5 100.0 83.9 1.9 8.9 - -1.9 0.3 0.6 SERVICE WORKERS 100.0 55.7 7.5 25.7 100.0 57.8 6.6 25.8 - -2.1 0.9 -0.1 SECURITY WORKERS 100.0 75.8 4.1 8.1 100.0 77.8 4.2 6.7 - -2.0 -0.1 1.4 AGRICULTURE, FORESTRY AND FISHERY WORKERS 100.0 58.2 7.1 11.5 100.0 66.1 5.4 8.9 - -7.9 1.7 2.6 MANUFACTURING PROCESS WORKERS 100.0 82.4 3.2 3.5 100.0 82.4 3.1 3.3 - 0.0 0.1 0.2 TRANSPORT AND MACHINE OPERATION WORKERS 100.0 76.1 4.0 6.6 100.0 79.3 3.6 5.3 - -3.2 0.4 1.3 CONSTRUCTION AND MINING WORKERS 100.0 81.3 1.2 6.6 100.0 80.5 1.3 7.1 - 0.8 -0.1 -0.5 CARRYING, CLEANING, PACKAGING, AND RELATED WORKERS 100.0 49.7 13.3 17.6 100.0 56.2 11.4 15.8 - -6.5 1.9 1.8Female 2) 100.0 42.5 35.2 9.1 100.0 44.7 33.7 8.6 - -2.2 1.5 0.5 ADMINISTRATIVE AND MANAGERIAL WORKERS 100.0 94.7 0.9 0.0 100.0 94.6 1.0 0.5 - 0.1 -0.1 -0.5 PROFESSIONAL AND ENGINEERING WORKERS 100.0 67.4 16.7 3.4 100.0 70.9 14.3 3.5 - -3.5 2.4 -0.1 CLERICAL WORKERS 100.0 53.8 24.3 4.2 100.0 55.4 23.2 4.2 - -1.6 1.1 0.0 SALES WORKERS 100.0 31.1 41.0 18.9 100.0 33.4 39.6 17.5 - -2.3 1.4 1.4 SERVICE WORKERS 100.0 29.8 44.9 15.1 100.0 33.0 42.5 14.8 - -3.2 2.4 0.3 SECURITY WORKERS 100.0 70.2 14.4 7.7 100.0 71.9 11.9 8.0 - -1.7 2.5 -0.3 AGRICULTURE, FORESTRY AND FISHERY WORKERS 100.0 39.4 26.8 7.7 100.0 43.6 28.1 7.4 - -4.2 -1.3 0.3 MANUFACTURING PROCESS WORKERS 100.0 31.5 50.0 6.0 100.0 33.4 47.8 5.1 - -1.9 2.2 0.9 TRANSPORT AND MACHINE OPERATION WORKERS 100.0 47.2 31.9 8.7 100.0 57.2 13.7 11.6 - -10.0 18.2 -2.9 CONSTRUCTION AND MINING WORKERS 100.0 63.5 12.4 8.5 100.0 62.6 18.4 7.1 - 0.9 -6.0 1.4 CARRYING, CLEANING, PACKAGING, AND RELATED WORKERS 100.0 10.6 69.0 10.1 100.0 13.9 67.0 9.4 - -3.3 2.0 0.7Note 1) Names used for types of employment such as “Part-t ime workers” and “Arbeit (temporary workers)” differ from workplace to workplace.Note 2) Including "Workers not classifiable by occupation".
SexOccupation
2012 2007 Change
Employees(excluding
executive ofcompany orcorporation)
Employees(excluding
executive ofcompany orcorporation)
Employees(excluding
executive ofcompany orcorporation)
Without a definite contract term
(including lifetime employment)
92.2%
With a definite contract term
4.1%
Not sure 3.7%[Regular staffs]
Regular staffs
(2) Employment contract term a. “Employees, excluding executive of company or corporation” employed “Without a
definite term (including lifetime employment)” account for 68.5%, while those employed “With a definite contract term” account for 22.6%.
Looking at “Employees, excluding executive of company or corporation” by whether with or
without a definite contract term, those employed “Without a definite term (including lifetime
employment)” numbered 36,699 thousand (68.5% of all “Employees, excluding executive of
company or corporation”), while those employed “With a definite contract term” numbered 12,119
thousand (22.6%). For those employed “With a definite contract term” by length of contract term,
“Over 6 months up to 1 year” was most numerous with 4,768 thousand (39.3% of all those
employed with a definite contract term), followed by “1 month or over up to 6 months” with 3,311
thousand (27.3%) and “Over 1 year up to 3 years” with 1,849 thousand (15.3%).
Looking at “Irregular staffs” by whether with or without a definite contract term, those employed
“Without a definite term (including lifetime employment)” numbered 6,159 thousand (30.2% of all
“Irregular staffs”), while those employed “With a definite contract term” numbered 10,765
thousand (52.7%). (Fig. I-9, Table I-16)
Fig. I-9: Ratio of employees (excluding executive of company or corporation) by whether with or without a definite
contract term, length of a contract term, and type of employment / 2012
Without a definite contract term
(including lifetime employment)
30.2%
Less than 1 month (0.9%)
1 month or over up to 6 months
(29.9%)
Over 6 months up to 1 year
(41.1%)
Over 1 year up to 3 years (14.3%)
Over 3 years up to 5 years (3.0%)
Other (10.8%)Not sure 15.8%
With a definite contract term
52.7%
[Irregular staffs]
Irregular staffs
Less than 1 month (0.9%)
1 month or over up to 6 months
(27.3%)
Over 6 months up to 1 year (39.3%)
Over 1 year up to 3 years (15.3%)
Over 3 years up to 5 years (4.5%)
Other (12.7%)
Without a definite contract term (including
lifetime employment)
68.5%
With a definite contract term
22.6%
Not sure 8.3%
[Employees, excluding executive of company or corporation]
Employees, excluding
executive of company or corporation
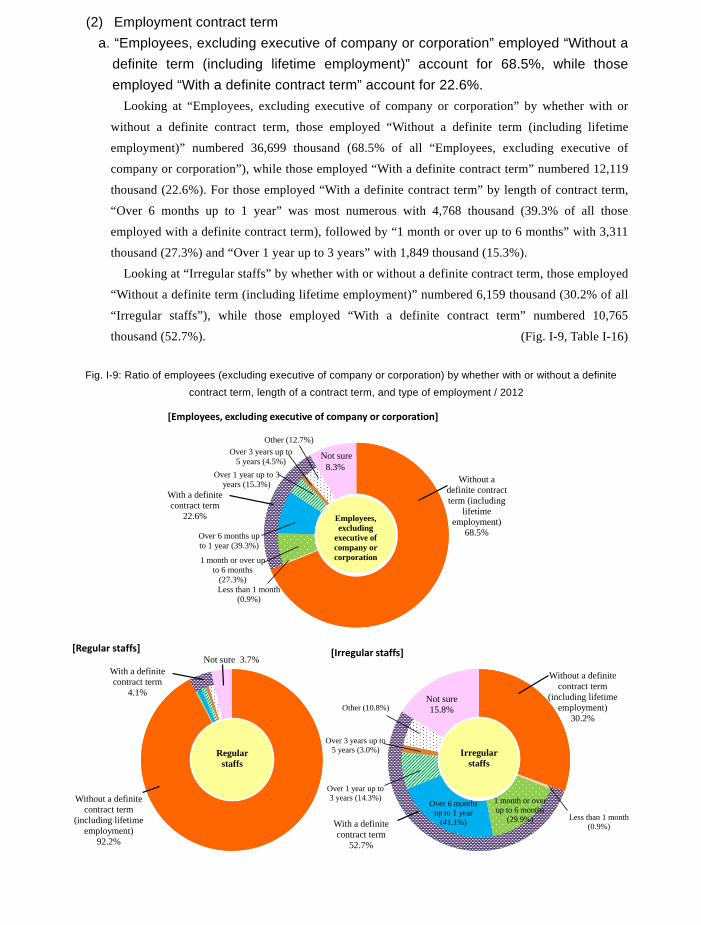
137
Table I-15: Ratio of employees (excluding executive of company or corporation) by sex, occupational major group and
main type of employment / 2007, 2012
(%, points)Main type of employment 1)
Regularstaffs
Part-timeworkers
Arbeit(temporaryworkers)
Regularstaffs
Part-timeworkers
Arbeit(temporaryworkers)
Regularstaffs
Part-timeworkers
Arbeit(temporaryworkers)
Both sexes 2) 100.0 61.8 17.9 8.2 100.0 64.4 16.6 7.7 - -2.6 1.3 0.5 ADMINISTRATIVE AND MANAGERIAL WORKERS 100.0 93.2 0.2 0.1 100.0 97.3 0.1 0.0 - -4.1 0.1 0.1 PROFESSIONAL AND ENGINEERING WORKERS 100.0 77.6 8.7 3.0 100.0 79.9 7.4 3.2 - -2.3 1.3 -0.2 CLERICAL WORKERS 100.0 66.5 14.9 3.5 100.0 68.5 14.3 3.5 - -2.0 0.6 0.0 SALES WORKERS 100.0 59.6 19.3 13.6 100.0 62.1 18.2 12.6 - -2.5 1.1 1.0 SERVICE WORKERS 100.0 37.5 33.8 18.2 100.0 40.5 31.6 18.1 - -3.0 2.2 0.1 SECURITY WORKERS 100.0 75.5 4.7 8.0 100.0 77.5 4.7 6.8 - -2.0 0.0 1.2 AGRICULTURE, FORESTRY AND FISHERY WORKERS 100.0 49.4 16.3 9.7 100.0 55.8 15.8 8.2 - -6.4 0.5 1.5 MANUFACTURING PROCESS WORKERS 100.0 67.6 16.8 4.2 100.0 67.8 16.4 3.8 - -0.2 0.4 0.4 TRANSPORT AND MACHINE OPERATION WORKERS 100.0 75.3 4.8 6.6 100.0 78.7 3.9 5.4 - -3.4 0.9 1.2 CONSTRUCTION AND MINING WORKERS 100.0 80.9 1.5 6.6 100.0 80.1 1.7 7.1 - 0.8 -0.2 -0.5 CARRYING, CLEANING, PACKAGING, AND RELATED WORKERS 100.0 30.8 40.3 14.0 100.0 36.0 38.0 12.7 - -5.2 2.3 1.3Male 2) 100.0 77.9 3.5 7.5 100.0 80.0 3.1 6.9 - -2.1 0.4 0.6 ADMINISTRATIVE AND MANAGERIAL WORKERS 100.0 93.1 0.1 0.1 100.0 97.4 0.0 - - -4.3 0.1 - PROFESSIONAL AND ENGINEERING WORKERS 100.0 87.3 1.0 2.6 100.0 88.4 0.8 2.8 - -1.1 0.2 -0.2 CLERICAL WORKERS 100.0 84.6 1.7 2.5 100.0 87.2 1.6 2.6 - -2.6 0.1 -0.1 SALES WORKERS 100.0 82.0 2.2 9.5 100.0 83.9 1.9 8.9 - -1.9 0.3 0.6 SERVICE WORKERS 100.0 55.7 7.5 25.7 100.0 57.8 6.6 25.8 - -2.1 0.9 -0.1 SECURITY WORKERS 100.0 75.8 4.1 8.1 100.0 77.8 4.2 6.7 - -2.0 -0.1 1.4 AGRICULTURE, FORESTRY AND FISHERY WORKERS 100.0 58.2 7.1 11.5 100.0 66.1 5.4 8.9 - -7.9 1.7 2.6 MANUFACTURING PROCESS WORKERS 100.0 82.4 3.2 3.5 100.0 82.4 3.1 3.3 - 0.0 0.1 0.2 TRANSPORT AND MACHINE OPERATION WORKERS 100.0 76.1 4.0 6.6 100.0 79.3 3.6 5.3 - -3.2 0.4 1.3 CONSTRUCTION AND MINING WORKERS 100.0 81.3 1.2 6.6 100.0 80.5 1.3 7.1 - 0.8 -0.1 -0.5 CARRYING, CLEANING, PACKAGING, AND RELATED WORKERS 100.0 49.7 13.3 17.6 100.0 56.2 11.4 15.8 - -6.5 1.9 1.8Female 2) 100.0 42.5 35.2 9.1 100.0 44.7 33.7 8.6 - -2.2 1.5 0.5 ADMINISTRATIVE AND MANAGERIAL WORKERS 100.0 94.7 0.9 0.0 100.0 94.6 1.0 0.5 - 0.1 -0.1 -0.5 PROFESSIONAL AND ENGINEERING WORKERS 100.0 67.4 16.7 3.4 100.0 70.9 14.3 3.5 - -3.5 2.4 -0.1 CLERICAL WORKERS 100.0 53.8 24.3 4.2 100.0 55.4 23.2 4.2 - -1.6 1.1 0.0 SALES WORKERS 100.0 31.1 41.0 18.9 100.0 33.4 39.6 17.5 - -2.3 1.4 1.4 SERVICE WORKERS 100.0 29.8 44.9 15.1 100.0 33.0 42.5 14.8 - -3.2 2.4 0.3 SECURITY WORKERS 100.0 70.2 14.4 7.7 100.0 71.9 11.9 8.0 - -1.7 2.5 -0.3 AGRICULTURE, FORESTRY AND FISHERY WORKERS 100.0 39.4 26.8 7.7 100.0 43.6 28.1 7.4 - -4.2 -1.3 0.3 MANUFACTURING PROCESS WORKERS 100.0 31.5 50.0 6.0 100.0 33.4 47.8 5.1 - -1.9 2.2 0.9 TRANSPORT AND MACHINE OPERATION WORKERS 100.0 47.2 31.9 8.7 100.0 57.2 13.7 11.6 - -10.0 18.2 -2.9 CONSTRUCTION AND MINING WORKERS 100.0 63.5 12.4 8.5 100.0 62.6 18.4 7.1 - 0.9 -6.0 1.4 CARRYING, CLEANING, PACKAGING, AND RELATED WORKERS 100.0 10.6 69.0 10.1 100.0 13.9 67.0 9.4 - -3.3 2.0 0.7Note 1) Names used for types of employment such as “Part-t ime workers” and “Arbeit (temporary workers)” differ from workplace to workplace.Note 2) Including "Workers not classifiable by occupation".
SexOccupation
2012 2007 Change
Employees(excluding
executive ofcompany orcorporation)
Employees(excluding
executive ofcompany orcorporation)
Employees(excluding
executive ofcompany orcorporation)
Without a definite contract term
(including lifetime employment)
92.2%
With a definite contract term
4.1%
Not sure 3.7%[Regular staffs]
Regular staffs
(2) Employment contract term a. “Employees, excluding executive of company or corporation” employed “Without a
definite term (including lifetime employment)” account for 68.5%, while those employed “With a definite contract term” account for 22.6%.
Looking at “Employees, excluding executive of company or corporation” by whether with or
without a definite contract term, those employed “Without a definite term (including lifetime
employment)” numbered 36,699 thousand (68.5% of all “Employees, excluding executive of
company or corporation”), while those employed “With a definite contract term” numbered 12,119
thousand (22.6%). For those employed “With a definite contract term” by length of contract term,
“Over 6 months up to 1 year” was most numerous with 4,768 thousand (39.3% of all those
employed with a definite contract term), followed by “1 month or over up to 6 months” with 3,311
thousand (27.3%) and “Over 1 year up to 3 years” with 1,849 thousand (15.3%).
Looking at “Irregular staffs” by whether with or without a definite contract term, those employed
“Without a definite term (including lifetime employment)” numbered 6,159 thousand (30.2% of all
“Irregular staffs”), while those employed “With a definite contract term” numbered 10,765
thousand (52.7%). (Fig. I-9, Table I-16)
Fig. I-9: Ratio of employees (excluding executive of company or corporation) by whether with or without a definite
contract term, length of a contract term, and type of employment / 2012
Without a definite contract term
(including lifetime employment)
30.2%
Less than 1 month (0.9%)
1 month or over up to 6 months
(29.9%)
Over 6 months up to 1 year
(41.1%)
Over 1 year up to 3 years (14.3%)
Over 3 years up to 5 years (3.0%)
Other (10.8%)Not sure 15.8%
With a definite contract term
52.7%
[Irregular staffs]
Irregular staffs
Less than 1 month (0.9%)
1 month or over up to 6 months
(27.3%)
Over 6 months up to 1 year (39.3%)
Over 1 year up to 3 years (15.3%)
Over 3 years up to 5 years (4.5%)
Other (12.7%)
Without a definite contract term (including
lifetime employment)
68.5%
With a definite contract term
22.6%
Not sure 8.3%
[Employees, excluding executive of company or corporation]
Employees, excluding
executive of company or corporation
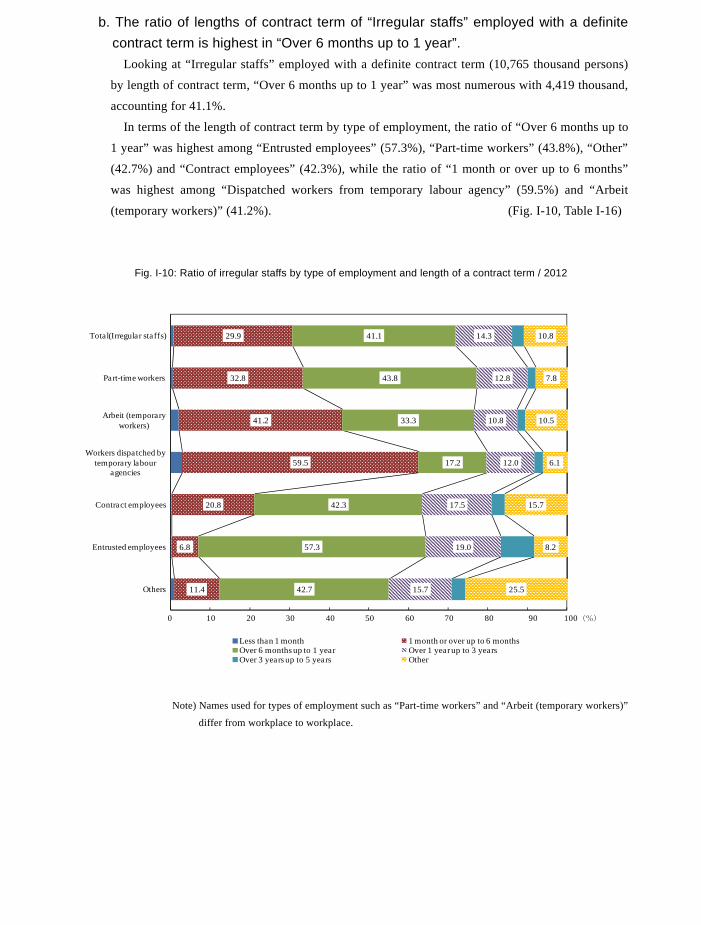
138
b. The ratio of lengths of contract term of “Irregular staffs” employed with a definite contract term is highest in “Over 6 months up to 1 year”.
Looking at “Irregular staffs” employed with a definite contract term (10,765 thousand persons)
by length of contract term, “Over 6 months up to 1 year” was most numerous with 4,419 thousand,
accounting for 41.1%.
In terms of the length of contract term by type of employment, the ratio of “Over 6 months up to
1 year” was highest among “Entrusted employees” (57.3%), “Part-time workers” (43.8%), “Other”
(42.7%) and “Contract employees” (42.3%), while the ratio of “1 month or over up to 6 months”
was highest among “Dispatched workers from temporary labour agency” (59.5%) and “Arbeit
(temporary workers)” (41.2%). (Fig. I-10, Table I-16)
Fig. I-10: Ratio of irregular staffs by type of employment and length of a contract term / 2012
Note) Names used for types of employment such as “Part-time workers” and “Arbeit (temporary workers)”
differ from workplace to workplace.
11.4
6.8
20.8
59.5
41.2
32.8
29.9
42.7
57.3
42.3
17.2
33.3
43.8
41.1
15.7
19.0
17.5
12.0
10.8
12.8
14.3
25.5
8.2
15.7
6.1
10.5
7.8
10.8
Others
Entrusted employees
Contract employees
Workers dispatched by temporary labour
agencies
Arbeit (temporary workers)
Part-time workers
Total(Irregular staffs)
Less than 1 month 1 month or over up to 6 monthsOver 6 months up to 1 year Over 1 year up to 3 yearsOver 3 years up to 5 years Other
0 10 20 30 40 50 60 70 80 90 100(%)
Table I-16: Number and ratio of employees (excluding executive of company or corporation) by sex, whether with or
without a definite contract term, length of a contract term, and type of employment / 2012
Type of employment 1)
Part-time workersArbeit (temporary
workers)
Dispatchedworkers from
temporary labouragency
Contractemployees
Entrustedemployees
Others
Both sexes 53,537.5 33,110.4 20,427.1 9,560.8 4,391.9 1,187.3 2,909.2 1,192.6 1,185.4
36,698.9 30,539.9 6,159.1 3,714.6 1,566.9 184.3 - 175.9 517.4
With a definite term 12,119.3 1,354.4 10,764.9 4,384.3 1,485.5 839.1 2,695.3 946.7 414.0 Less than 1 month 109.3 7.4 101.9 26.1 32.9 25.2 10.8 2.6 4.2 1 month or over up to 6 months 3,310.9 88.5 3,222.5 1,440.2 611.6 499.0 560.4 64.1 47.2 Over 6 months up to 1 year 4,767.7 348.6 4,419.1 1,920.8 494.0 144.5 1,141.2 542.0 176.6 Over 1 year up to 3 years 1,849.2 311.7 1,537.6 559.9 160.5 101.1 471.5 179.5 65.1 Over 3 years up to 5 years 547.1 222.3 324.8 93.6 30.8 17.7 87.1 80.5 15.1 Other 1,535.1 376.0 1,159.1 343.7 155.8 51.6 424.2 78.1 105.7 Not sure 4,447.0 1,212.5 3,234.5 1,348.0 1,276.0 156.0 193.7 63.3 197.3Male 29,291.7 22,809.0 6,482.7 1,014.3 2,193.8 447.3 1,551.5 758.3 517.6
22,602.6 21,099.2 1,503.4 316.4 774.0 94.4 - 111.8 206.9
With a definite term 4,703.1 912.0 3,791.1 551.8 726.6 281.9 1,426.3 607.4 197.0 Less than 1 month 46.9 4.0 42.9 4.8 18.4 8.7 6.0 1.7 3.3 1 month or over up to 6 months 1,052.1 57.5 994.6 182.5 285.4 157.0 308.2 45.2 16.3 Over 6 months up to 1 year 1,787.4 236.3 1,551.1 239.0 235.3 52.1 597.2 349.5 78.1 Over 1 year up to 3 years 736.2 190.5 545.7 62.3 79.2 33.5 230.0 111.8 28.9 Over 3 years up to 5 years 317.7 160.7 157.1 16.6 18.2 10.4 49.2 54.1 8.7 Other 762.7 263.0 499.7 46.7 90.1 20.3 235.8 45.1 61.7 Not sure 1,899.8 795.1 1,104.7 135.0 656.5 68.0 113.1 35.5 96.5Female 24,245.7 10,301.3 13,944.4 8,546.5 2,198.1 740.1 1,357.7 434.3 667.8
14,096.3 9,440.6 4,655.7 3,398.2 792.9 89.9 - 64.1 310.6
With a definite term 7,416.2 442.3 6,973.9 3,832.4 758.9 557.2 1,269.0 339.3 216.9 Less than 1 month 62.4 3.4 59.0 21.3 14.6 16.5 4.8 0.9 0.9 1 month or over up to 6 months 2,258.9 30.9 2,227.9 1,257.6 326.2 342.0 252.3 18.9 30.9 Over 6 months up to 1 year 2,980.3 112.3 2,868.0 1,681.9 258.6 92.4 544.1 192.5 98.5 Over 1 year up to 3 years 1,113.0 121.1 991.8 497.5 81.2 67.7 241.5 67.7 36.2 Over 3 years up to 5 years 229.3 61.6 167.7 77.0 12.6 7.3 38.0 26.4 6.4 Other 772.4 113.0 659.4 297.1 65.7 31.3 188.3 33.0 44.0 Not sure 2,547.2 417.4 2,129.8 1,213.1 619.5 88.0 80.6 27.7 100.8Both sexes 100.0 100.0 100.0 100.0 100.0 100.0 100.0 100.0 100.0
68.5 92.2 30.2 38.9 35.7 15.5 - 14.7 43.6
22.6 4.1 52.7 45.9 33.8 70.7 92.6 79.4 34.9(100.0) (100.0) (100.0) (100.0) (100.0) (100.0) (100.0) (100.0) (100.0)
Less than 1 month (0.9) (0.5) (0.9) (0.6) (2.2) (3.0) (0.4) (0.3) (1.0) 1 month or over up to 6 months (27.3) (6.5) (29.9) (32.8) (41.2) (59.5) (20.8) (6.8) (11.4) Over 6 months up to 1 year (39.3) (25.7) (41.1) (43.8) (33.3) (17.2) (42.3) (57.3) (42.7) Over 1 year up to 3 years (15.3) (23.0) (14.3) (12.8) (10.8) (12.0) (17.5) (19.0) (15.7) Over 3 years up to 5 years (4.5) (16.4) (3.0) (2.1) (2.1) (2.1) (3.2) (8.5) (3.6) Other (12.7) (27.8) (10.8) (7.8) (10.5) (6.1) (15.7) (8.2) (25.5) Not sure 8.3 3.7 15.8 14.1 29.1 13.1 6.7 5.3 16.6Male 100.0 100.0 100.0 100.0 100.0 100.0 100.0 100.0 100.0
77.2 92.5 23.2 31.2 35.3 21.1 - 14.7 40.0
16.1 4.0 58.5 54.4 33.1 63.0 91.9 80.1 38.1(100.0) (100.0) (100.0) (100.0) (100.0) (100.0) (100.0) (100.0) (100.0)
Less than 1 month (1.0) (0.4) (1.1) (0.9) (2.5) (3.1) (0.4) (0.3) (1.7) 1 month or over up to 6 months (22.4) (6.3) (26.2) (33.1) (39.3) (55.7) (21.6) (7.4) (8.3) Over 6 months up to 1 year (38.0) (25.9) (40.9) (43.3) (32.4) (18.5) (41.9) (57.5) (39.6) Over 1 year up to 3 years (15.7) (20.9) (14.4) (11.3) (10.9) (11.9) (16.1) (18.4) (14.7) Over 3 years up to 5 years (6.8) (17.6) (4.1) (3.0) (2.5) (3.7) (3.4) (8.9) (4.4) Other (16.2) (28.8) (13.2) (8.5) (12.4) (7.2) (16.5) (7.4) (31.3) Not sure 6.5 3.5 17.0 13.3 29.9 15.2 7.3 4.7 18.6Female 100.0 100.0 100.0 100.0 100.0 100.0 100.0 100.0 100.0
58.1 91.6 33.4 39.8 36.1 12.1 - 14.8 46.5
30.6 4.3 50.0 44.8 34.5 75.3 93.5 78.1 32.5(100.0) (100.0) (100.0) (100.0) (100.0) (100.0) (100.0) (100.0) (100.0)
Less than 1 month (0.8) (0.8) (0.8) (0.6) (1.9) (3.0) (0.4) (0.3) (0.4) 1 month or over up to 6 months (30.5) (7.0) (31.9) (32.8) (43.0) (61.4) (19.9) (5.6) (14.2) Over 6 months up to 1 year (40.2) (25.4) (41.1) (43.9) (34.1) (16.6) (42.9) (56.7) (45.4) Over 1 year up to 3 years (15.0) (27.4) (14.2) (13.0) (10.7) (12.2) (19.0) (20.0) (16.7) Over 3 years up to 5 years (3.1) (13.9) (2.4) (2.0) (1.7) (1.3) (3.0) (7.8) (3.0) Other (10.4) (25.5) (9.5) (7.8) (8.7) (5.6) (14.8) (9.7) (20.3) Not sure 10.5 4.1 15.3 14.2 28.2 11.9 5.9 6.4 15.1
Note 1) Names used for types of employment such as “Part-t ime workers” and “Arbeit (temporary workers)” differ from workplace to workplace.
With a definite term
Num
ber
Without a definite term (Including lifetime employment)
Without a definite term (Including lifetime employment)
Without a definite term (Including lifetime employment)
Rat
io
Without a definite term (Including lifetime employment)
With a definite term
Without a definite term (Including lifetime employment)
With a definite term
(thousand persons, %)
Without a definite term (Including lifetime employment)
Employees(excluding executive
of company orcorporation)
Regular staffs Irregular staffsEmployed with or without a Definite ContractTermA Term per Contract
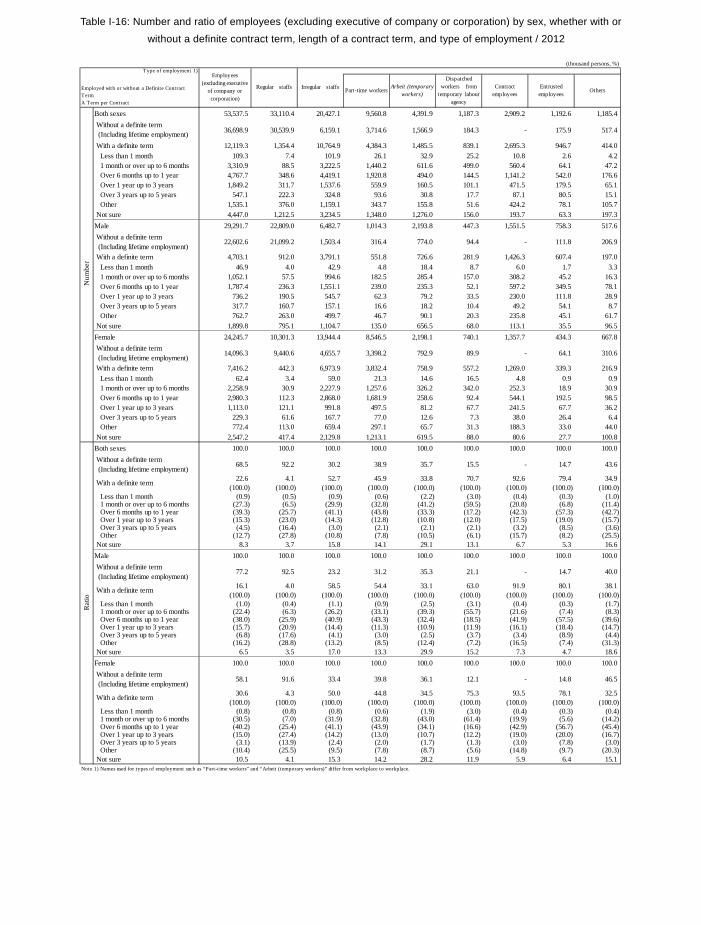
139
b. The ratio of lengths of contract term of “Irregular staffs” employed with a definite contract term is highest in “Over 6 months up to 1 year”.
Looking at “Irregular staffs” employed with a definite contract term (10,765 thousand persons)
by length of contract term, “Over 6 months up to 1 year” was most numerous with 4,419 thousand,
accounting for 41.1%.
In terms of the length of contract term by type of employment, the ratio of “Over 6 months up to
1 year” was highest among “Entrusted employees” (57.3%), “Part-time workers” (43.8%), “Other”
(42.7%) and “Contract employees” (42.3%), while the ratio of “1 month or over up to 6 months”
was highest among “Dispatched workers from temporary labour agency” (59.5%) and “Arbeit
(temporary workers)” (41.2%). (Fig. I-10, Table I-16)
Fig. I-10: Ratio of irregular staffs by type of employment and length of a contract term / 2012
Note) Names used for types of employment such as “Part-time workers” and “Arbeit (temporary workers)”
differ from workplace to workplace.
11.4
6.8
20.8
59.5
41.2
32.8
29.9
42.7
57.3
42.3
17.2
33.3
43.8
41.1
15.7
19.0
17.5
12.0
10.8
12.8
14.3
25.5
8.2
15.7
6.1
10.5
7.8
10.8
Others
Entrusted employees
Contract employees
Workers dispatched by temporary labour
agencies
Arbeit (temporary workers)
Part-time workers
Total(Irregular staffs)
Less than 1 month 1 month or over up to 6 monthsOver 6 months up to 1 year Over 1 year up to 3 yearsOver 3 years up to 5 years Other
0 10 20 30 40 50 60 70 80 90 100(%)
Table I-16: Number and ratio of employees (excluding executive of company or corporation) by sex, whether with or
without a definite contract term, length of a contract term, and type of employment / 2012
Type of employment 1)
Part-time workersArbeit (temporary
workers)
Dispatchedworkers from
temporary labouragency
Contractemployees
Entrustedemployees
Others
Both sexes 53,537.5 33,110.4 20,427.1 9,560.8 4,391.9 1,187.3 2,909.2 1,192.6 1,185.4
36,698.9 30,539.9 6,159.1 3,714.6 1,566.9 184.3 - 175.9 517.4
With a definite term 12,119.3 1,354.4 10,764.9 4,384.3 1,485.5 839.1 2,695.3 946.7 414.0 Less than 1 month 109.3 7.4 101.9 26.1 32.9 25.2 10.8 2.6 4.2 1 month or over up to 6 months 3,310.9 88.5 3,222.5 1,440.2 611.6 499.0 560.4 64.1 47.2 Over 6 months up to 1 year 4,767.7 348.6 4,419.1 1,920.8 494.0 144.5 1,141.2 542.0 176.6 Over 1 year up to 3 years 1,849.2 311.7 1,537.6 559.9 160.5 101.1 471.5 179.5 65.1 Over 3 years up to 5 years 547.1 222.3 324.8 93.6 30.8 17.7 87.1 80.5 15.1 Other 1,535.1 376.0 1,159.1 343.7 155.8 51.6 424.2 78.1 105.7 Not sure 4,447.0 1,212.5 3,234.5 1,348.0 1,276.0 156.0 193.7 63.3 197.3Male 29,291.7 22,809.0 6,482.7 1,014.3 2,193.8 447.3 1,551.5 758.3 517.6
22,602.6 21,099.2 1,503.4 316.4 774.0 94.4 - 111.8 206.9
With a definite term 4,703.1 912.0 3,791.1 551.8 726.6 281.9 1,426.3 607.4 197.0 Less than 1 month 46.9 4.0 42.9 4.8 18.4 8.7 6.0 1.7 3.3 1 month or over up to 6 months 1,052.1 57.5 994.6 182.5 285.4 157.0 308.2 45.2 16.3 Over 6 months up to 1 year 1,787.4 236.3 1,551.1 239.0 235.3 52.1 597.2 349.5 78.1 Over 1 year up to 3 years 736.2 190.5 545.7 62.3 79.2 33.5 230.0 111.8 28.9 Over 3 years up to 5 years 317.7 160.7 157.1 16.6 18.2 10.4 49.2 54.1 8.7 Other 762.7 263.0 499.7 46.7 90.1 20.3 235.8 45.1 61.7 Not sure 1,899.8 795.1 1,104.7 135.0 656.5 68.0 113.1 35.5 96.5Female 24,245.7 10,301.3 13,944.4 8,546.5 2,198.1 740.1 1,357.7 434.3 667.8
14,096.3 9,440.6 4,655.7 3,398.2 792.9 89.9 - 64.1 310.6
With a definite term 7,416.2 442.3 6,973.9 3,832.4 758.9 557.2 1,269.0 339.3 216.9 Less than 1 month 62.4 3.4 59.0 21.3 14.6 16.5 4.8 0.9 0.9 1 month or over up to 6 months 2,258.9 30.9 2,227.9 1,257.6 326.2 342.0 252.3 18.9 30.9 Over 6 months up to 1 year 2,980.3 112.3 2,868.0 1,681.9 258.6 92.4 544.1 192.5 98.5 Over 1 year up to 3 years 1,113.0 121.1 991.8 497.5 81.2 67.7 241.5 67.7 36.2 Over 3 years up to 5 years 229.3 61.6 167.7 77.0 12.6 7.3 38.0 26.4 6.4 Other 772.4 113.0 659.4 297.1 65.7 31.3 188.3 33.0 44.0 Not sure 2,547.2 417.4 2,129.8 1,213.1 619.5 88.0 80.6 27.7 100.8Both sexes 100.0 100.0 100.0 100.0 100.0 100.0 100.0 100.0 100.0
68.5 92.2 30.2 38.9 35.7 15.5 - 14.7 43.6
22.6 4.1 52.7 45.9 33.8 70.7 92.6 79.4 34.9(100.0) (100.0) (100.0) (100.0) (100.0) (100.0) (100.0) (100.0) (100.0)
Less than 1 month (0.9) (0.5) (0.9) (0.6) (2.2) (3.0) (0.4) (0.3) (1.0) 1 month or over up to 6 months (27.3) (6.5) (29.9) (32.8) (41.2) (59.5) (20.8) (6.8) (11.4) Over 6 months up to 1 year (39.3) (25.7) (41.1) (43.8) (33.3) (17.2) (42.3) (57.3) (42.7) Over 1 year up to 3 years (15.3) (23.0) (14.3) (12.8) (10.8) (12.0) (17.5) (19.0) (15.7) Over 3 years up to 5 years (4.5) (16.4) (3.0) (2.1) (2.1) (2.1) (3.2) (8.5) (3.6) Other (12.7) (27.8) (10.8) (7.8) (10.5) (6.1) (15.7) (8.2) (25.5) Not sure 8.3 3.7 15.8 14.1 29.1 13.1 6.7 5.3 16.6Male 100.0 100.0 100.0 100.0 100.0 100.0 100.0 100.0 100.0
77.2 92.5 23.2 31.2 35.3 21.1 - 14.7 40.0
16.1 4.0 58.5 54.4 33.1 63.0 91.9 80.1 38.1(100.0) (100.0) (100.0) (100.0) (100.0) (100.0) (100.0) (100.0) (100.0)
Less than 1 month (1.0) (0.4) (1.1) (0.9) (2.5) (3.1) (0.4) (0.3) (1.7) 1 month or over up to 6 months (22.4) (6.3) (26.2) (33.1) (39.3) (55.7) (21.6) (7.4) (8.3) Over 6 months up to 1 year (38.0) (25.9) (40.9) (43.3) (32.4) (18.5) (41.9) (57.5) (39.6) Over 1 year up to 3 years (15.7) (20.9) (14.4) (11.3) (10.9) (11.9) (16.1) (18.4) (14.7) Over 3 years up to 5 years (6.8) (17.6) (4.1) (3.0) (2.5) (3.7) (3.4) (8.9) (4.4) Other (16.2) (28.8) (13.2) (8.5) (12.4) (7.2) (16.5) (7.4) (31.3) Not sure 6.5 3.5 17.0 13.3 29.9 15.2 7.3 4.7 18.6Female 100.0 100.0 100.0 100.0 100.0 100.0 100.0 100.0 100.0
58.1 91.6 33.4 39.8 36.1 12.1 - 14.8 46.5
30.6 4.3 50.0 44.8 34.5 75.3 93.5 78.1 32.5(100.0) (100.0) (100.0) (100.0) (100.0) (100.0) (100.0) (100.0) (100.0)
Less than 1 month (0.8) (0.8) (0.8) (0.6) (1.9) (3.0) (0.4) (0.3) (0.4) 1 month or over up to 6 months (30.5) (7.0) (31.9) (32.8) (43.0) (61.4) (19.9) (5.6) (14.2) Over 6 months up to 1 year (40.2) (25.4) (41.1) (43.9) (34.1) (16.6) (42.9) (56.7) (45.4) Over 1 year up to 3 years (15.0) (27.4) (14.2) (13.0) (10.7) (12.2) (19.0) (20.0) (16.7) Over 3 years up to 5 years (3.1) (13.9) (2.4) (2.0) (1.7) (1.3) (3.0) (7.8) (3.0) Other (10.4) (25.5) (9.5) (7.8) (8.7) (5.6) (14.8) (9.7) (20.3) Not sure 10.5 4.1 15.3 14.2 28.2 11.9 5.9 6.4 15.1
Note 1) Names used for types of employment such as “Part-t ime workers” and “Arbeit (temporary workers)” differ from workplace to workplace.
With a definite term
Num
ber
Without a definite term (Including lifetime employment)
Without a definite term (Including lifetime employment)
Without a definite term (Including lifetime employment)
Rat
io
Without a definite term (Including lifetime employment)
With a definite term
Without a definite term (Including lifetime employment)
With a definite term
(thousand persons, %)
Without a definite term (Including lifetime employment)
Employees(excluding executive
of company orcorporation)
Regular staffs Irregular staffsEmployed with or without a Definite ContractTermA Term per Contract
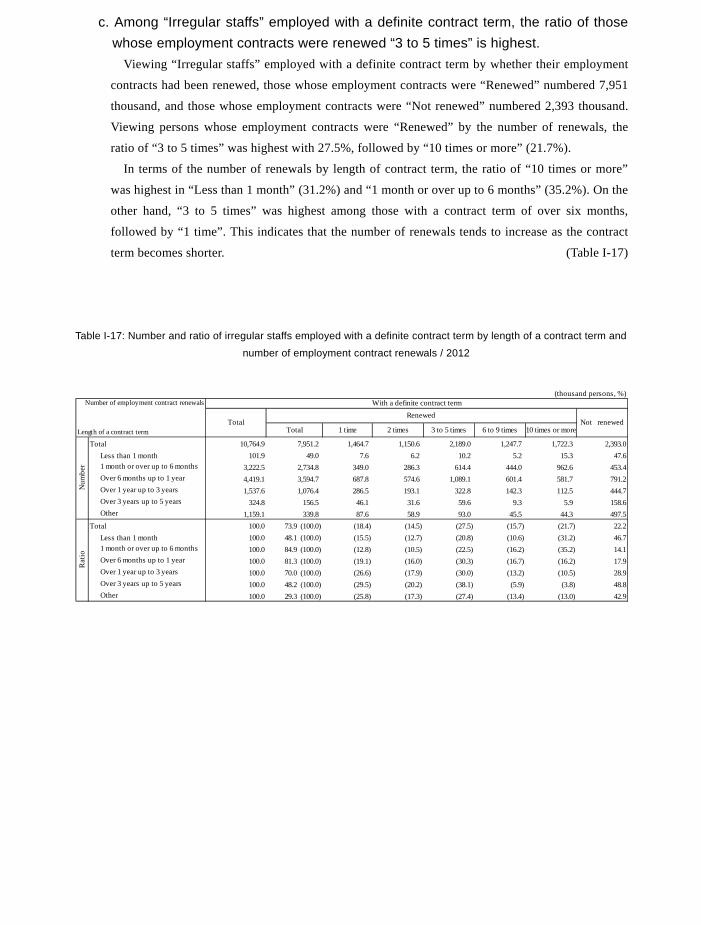
140
c. Among “Irregular staffs” employed with a definite contract term, the ratio of those whose employment contracts were renewed “3 to 5 times” is highest.
Viewing “Irregular staffs” employed with a definite contract term by whether their employment
contracts had been renewed, those whose employment contracts were “Renewed” numbered 7,951
thousand, and those whose employment contracts were “Not renewed” numbered 2,393 thousand.
Viewing persons whose employment contracts were “Renewed” by the number of renewals, the
ratio of “3 to 5 times” was highest with 27.5%, followed by “10 times or more” (21.7%).
In terms of the number of renewals by length of contract term, the ratio of “10 times or more”
was highest in “Less than 1 month” (31.2%) and “1 month or over up to 6 months” (35.2%). On the
other hand, “3 to 5 times” was highest among those with a contract term of over six months,
followed by “1 time”. This indicates that the number of renewals tends to increase as the contract
term becomes shorter. (Table I-17)
Table I-17: Number and ratio of irregular staffs employed with a definite contract term by length of a contract term and
number of employment contract renewals / 2012
(thousand persons, %)Number of employment contract renewals
Length of a contract term 1 time 2 times 3 to 5 times 6 to 9 times 10 times or more
Total 10,764.9 1,464.7 1,150.6 2,189.0 1,247.7 1,722.3 2,393.0Less than 1 month 101.9 7.6 6.2 10.2 5.2 15.3 47.61 month or over up to 6 months 3,222.5 349.0 286.3 614.4 444.0 962.6 453.4Over 6 months up to 1 year 4,419.1 687.8 574.6 1,089.1 601.4 581.7 791.2Over 1 year up to 3 years 1,537.6 286.5 193.1 322.8 142.3 112.5 444.7Over 3 years up to 5 years 324.8 46.1 31.6 59.6 9.3 5.9 158.6Other 1,159.1 87.6 58.9 93.0 45.5 44.3 497.5
Total 100.0 73.9 (100.0) (18.4) (14.5) (27.5) (15.7) (21.7) 22.2Less than 1 month 100.0 48.1 (100.0) (15.5) (12.7) (20.8) (10.6) (31.2) 46.71 month or over up to 6 months 100.0 84.9 (100.0) (12.8) (10.5) (22.5) (16.2) (35.2) 14.1Over 6 months up to 1 year 100.0 81.3 (100.0) (19.1) (16.0) (30.3) (16.7) (16.2) 17.9Over 1 year up to 3 years 100.0 70.0 (100.0) (26.6) (17.9) (30.0) (13.2) (10.5) 28.9Over 3 years up to 5 years 100.0 48.2 (100.0) (29.5) (20.2) (38.1) (5.9) (3.8) 48.8Other 100.0 29.3 (100.0) (25.8) (17.3) (27.4) (13.4) (13.0) 42.9
With a definite contract term
TotalRenewed
Not renewedTotal
Rat
ioN
umbe
r
7,951.249.0
2,734.83,594.71,076.4
156.5339.8
d. Of “Part-time workers” employed with a definite contract term, those whose employment contract was “Renewed” account for 80% and over.
Looking at “Irregular staffs” employed with a definite contract term by type of employment and
whether the contract is renewed, the ratio of those whose employment contract was “renewed” was
highest in “Part-time workers” (80.3%), followed by “Dispatched workers from temporary labour
agency” (76.1%) and “Entrusted employees” (74.5%).
In terms of the number of renewals by type of employment, “3 to 5 times” was highest in “Arbeit
(temporary workers)”, “Contract employees”, “Entrusted employees” and “Other”. In contrast, “10
times or more” was highest in “Part-time workers”, and “10 times or more” and “3 to 5 times” were
highest in “Dispatched workers from temporary labour agency”. (Table I-18)
Table I-18: Number and ratio of irregular staffs employed with a definite contract term by type of employment and
number of employment contract renewals / 2012
Number of Renewals of Employment Contract
1 time 2 times 3 to 5 times 6 to 9 times 10 times or more
Total 10,764.9 1,464.7 1,150.6 2,189.0 1,247.7 1,722.3 2,393.0 Part-time workers 4,384.3 544.7 437.6 902.6 602.4 949.4 804.5 Arbeit (temporary workers) 1,485.5 220.6 167.9 256.6 128.1 165.6 497.7 Dispatched workers from temporary labour agency 839.1 102.9 87.1 166.2 96.7 166.4 189.3
Contract employees 2,695.3 370.8 284.5 571.3 294.4 331.5 502.1 Entrusted employees 946.7 168.4 137.7 230.6 90.0 72.8 232.5 Others 414.0 57.3 35.8 61.8 36.1 36.6 166.9Total 100.0 73.9 (100.0) (18.4) (14.5) (27.5) (15.7) (21.7) 22.2 Part-time workers 100.0 80.3 (100.0) (15.5) (12.4) (25.6) (17.1) (27.0) 18.3 Arbeit (temporary workers) 100.0 64.7 (100.0) (23.0) (17.5) (26.7) (13.3) (17.2) 33.5 Dispatched workers from temporary labour agency 100.0 76.1 (100.0) (16.1) (13.6) (26.0) (15.1) (26.0) 22.6
Contract employees 100.0 70.3 (100.0) (19.6) (15.0) (30.2) (15.5) (17.5) 18.6 Entrusted employees 100.0 74.5 (100.0) (23.9) (19.5) (32.7) (12.8) (10.3) 24.6 Others 100.0 56.2 (100.0) (24.6) (15.4) (26.6) (15.5) (15.7) 40.3
Note 1) Names used for types of employment such as “Part-t ime workers” and “Arbeit (temporary workers)” differ from workplace to workplace.
Rat
ioN
umbe
r
7,951.2
3,519.8
960.6
638.8
1,894.3
705.0
232.6
With a definite term
Total Renewed
Not renewedType of employment 1) Total
(thousand persons, %)
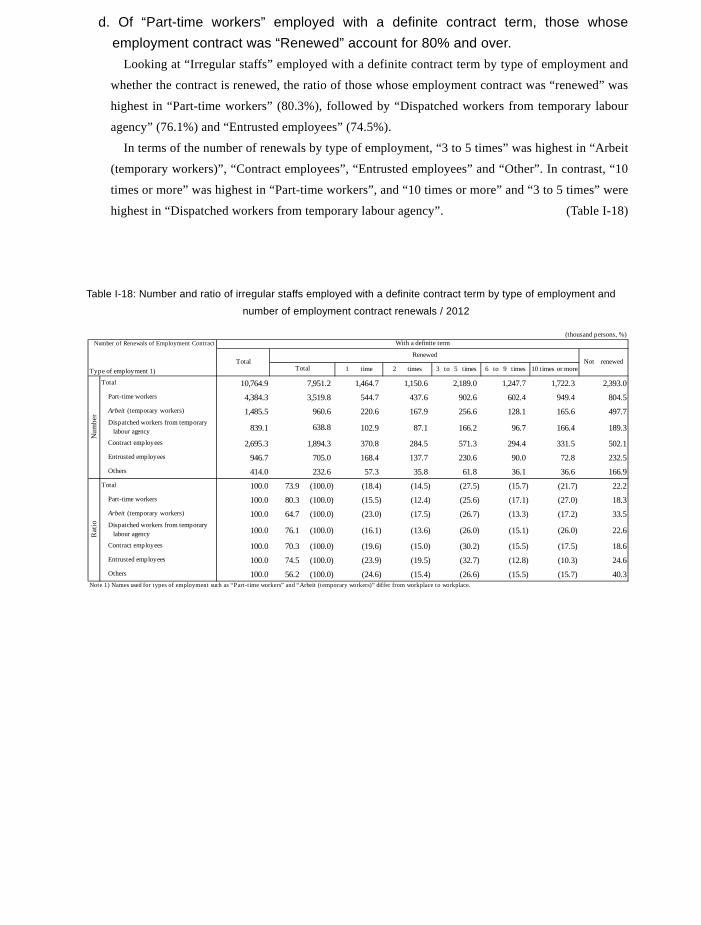
141
c. Among “Irregular staffs” employed with a definite contract term, the ratio of those whose employment contracts were renewed “3 to 5 times” is highest.
Viewing “Irregular staffs” employed with a definite contract term by whether their employment
contracts had been renewed, those whose employment contracts were “Renewed” numbered 7,951
thousand, and those whose employment contracts were “Not renewed” numbered 2,393 thousand.
Viewing persons whose employment contracts were “Renewed” by the number of renewals, the
ratio of “3 to 5 times” was highest with 27.5%, followed by “10 times or more” (21.7%).
In terms of the number of renewals by length of contract term, the ratio of “10 times or more”
was highest in “Less than 1 month” (31.2%) and “1 month or over up to 6 months” (35.2%). On the
other hand, “3 to 5 times” was highest among those with a contract term of over six months,
followed by “1 time”. This indicates that the number of renewals tends to increase as the contract
term becomes shorter. (Table I-17)
Table I-17: Number and ratio of irregular staffs employed with a definite contract term by length of a contract term and
number of employment contract renewals / 2012
(thousand persons, %)Number of employment contract renewals
Length of a contract term 1 time 2 times 3 to 5 times 6 to 9 times 10 times or more
Total 10,764.9 1,464.7 1,150.6 2,189.0 1,247.7 1,722.3 2,393.0Less than 1 month 101.9 7.6 6.2 10.2 5.2 15.3 47.61 month or over up to 6 months 3,222.5 349.0 286.3 614.4 444.0 962.6 453.4Over 6 months up to 1 year 4,419.1 687.8 574.6 1,089.1 601.4 581.7 791.2Over 1 year up to 3 years 1,537.6 286.5 193.1 322.8 142.3 112.5 444.7Over 3 years up to 5 years 324.8 46.1 31.6 59.6 9.3 5.9 158.6Other 1,159.1 87.6 58.9 93.0 45.5 44.3 497.5
Total 100.0 73.9 (100.0) (18.4) (14.5) (27.5) (15.7) (21.7) 22.2Less than 1 month 100.0 48.1 (100.0) (15.5) (12.7) (20.8) (10.6) (31.2) 46.71 month or over up to 6 months 100.0 84.9 (100.0) (12.8) (10.5) (22.5) (16.2) (35.2) 14.1Over 6 months up to 1 year 100.0 81.3 (100.0) (19.1) (16.0) (30.3) (16.7) (16.2) 17.9Over 1 year up to 3 years 100.0 70.0 (100.0) (26.6) (17.9) (30.0) (13.2) (10.5) 28.9Over 3 years up to 5 years 100.0 48.2 (100.0) (29.5) (20.2) (38.1) (5.9) (3.8) 48.8Other 100.0 29.3 (100.0) (25.8) (17.3) (27.4) (13.4) (13.0) 42.9
With a definite contract term
TotalRenewed
Not renewedTotal
Rat
ioN
umbe
r
7,951.249.0
2,734.83,594.71,076.4
156.5339.8
d. Of “Part-time workers” employed with a definite contract term, those whose employment contract was “Renewed” account for 80% and over.
Looking at “Irregular staffs” employed with a definite contract term by type of employment and
whether the contract is renewed, the ratio of those whose employment contract was “renewed” was
highest in “Part-time workers” (80.3%), followed by “Dispatched workers from temporary labour
agency” (76.1%) and “Entrusted employees” (74.5%).
In terms of the number of renewals by type of employment, “3 to 5 times” was highest in “Arbeit
(temporary workers)”, “Contract employees”, “Entrusted employees” and “Other”. In contrast, “10
times or more” was highest in “Part-time workers”, and “10 times or more” and “3 to 5 times” were
highest in “Dispatched workers from temporary labour agency”. (Table I-18)
Table I-18: Number and ratio of irregular staffs employed with a definite contract term by type of employment and
number of employment contract renewals / 2012
Number of Renewals of Employment Contract
1 time 2 times 3 to 5 times 6 to 9 times 10 times or more
Total 10,764.9 1,464.7 1,150.6 2,189.0 1,247.7 1,722.3 2,393.0 Part-time workers 4,384.3 544.7 437.6 902.6 602.4 949.4 804.5 Arbeit (temporary workers) 1,485.5 220.6 167.9 256.6 128.1 165.6 497.7 Dispatched workers from temporary labour agency 839.1 102.9 87.1 166.2 96.7 166.4 189.3
Contract employees 2,695.3 370.8 284.5 571.3 294.4 331.5 502.1 Entrusted employees 946.7 168.4 137.7 230.6 90.0 72.8 232.5 Others 414.0 57.3 35.8 61.8 36.1 36.6 166.9Total 100.0 73.9 (100.0) (18.4) (14.5) (27.5) (15.7) (21.7) 22.2 Part-time workers 100.0 80.3 (100.0) (15.5) (12.4) (25.6) (17.1) (27.0) 18.3 Arbeit (temporary workers) 100.0 64.7 (100.0) (23.0) (17.5) (26.7) (13.3) (17.2) 33.5 Dispatched workers from temporary labour agency 100.0 76.1 (100.0) (16.1) (13.6) (26.0) (15.1) (26.0) 22.6
Contract employees 100.0 70.3 (100.0) (19.6) (15.0) (30.2) (15.5) (17.5) 18.6 Entrusted employees 100.0 74.5 (100.0) (23.9) (19.5) (32.7) (12.8) (10.3) 24.6 Others 100.0 56.2 (100.0) (24.6) (15.4) (26.6) (15.5) (15.7) 40.3
Note 1) Names used for types of employment such as “Part-t ime workers” and “Arbeit (temporary workers)” differ from workplace to workplace.
Rat
ioN
umbe
r
7,951.2
3,519.8
960.6
638.8
1,894.3
705.0
232.6
With a definite term
Total Renewed
Not renewedType of employment 1) Total
(thousand persons, %)
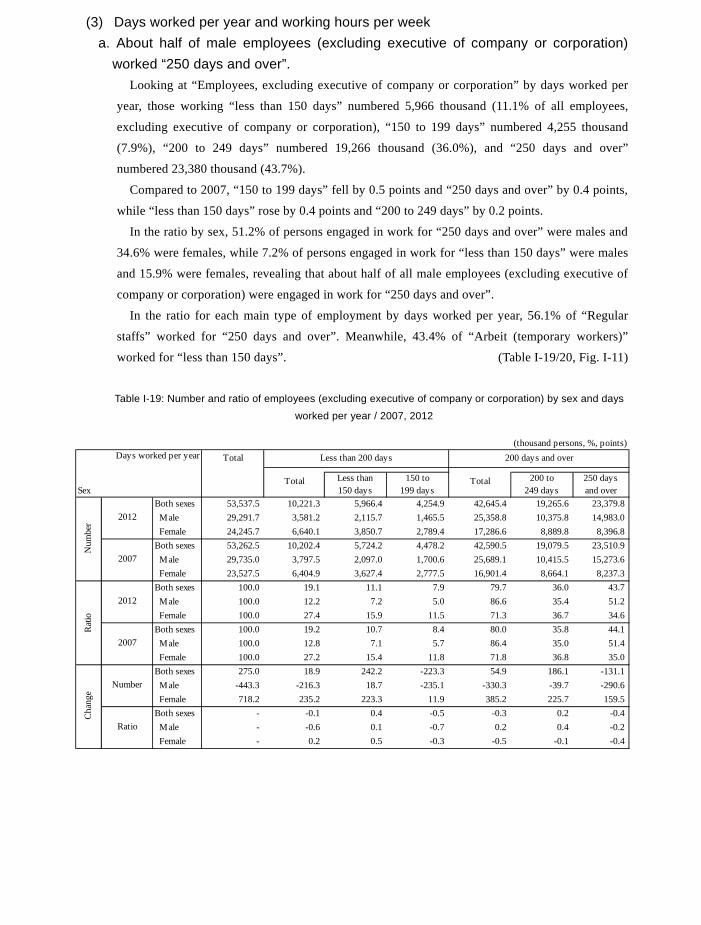
142
(3) Days worked per year and working hours per week a. About half of male employees (excluding executive of company or corporation)
worked “250 days and over”. Looking at “Employees, excluding executive of company or corporation” by days worked per
year, those working “less than 150 days” numbered 5,966 thousand (11.1% of all employees,
excluding executive of company or corporation), “150 to 199 days” numbered 4,255 thousand
(7.9%), “200 to 249 days” numbered 19,266 thousand (36.0%), and “250 days and over”
numbered 23,380 thousand (43.7%).
Compared to 2007, “150 to 199 days” fell by 0.5 points and “250 days and over” by 0.4 points,
while “less than 150 days” rose by 0.4 points and “200 to 249 days” by 0.2 points.
In the ratio by sex, 51.2% of persons engaged in work for “250 days and over” were males and
34.6% were females, while 7.2% of persons engaged in work for “less than 150 days” were males
and 15.9% were females, revealing that about half of all male employees (excluding executive of
company or corporation) were engaged in work for “250 days and over”.
In the ratio for each main type of employment by days worked per year, 56.1% of “Regular
staffs” worked for “250 days and over”. Meanwhile, 43.4% of “Arbeit (temporary workers)”
worked for “less than 150 days”. (Table I-19/20, Fig. I-11)
Table I-19: Number and ratio of employees (excluding executive of company or corporation) by sex and days
worked per year / 2007, 2012
(thousand persons, %, points)Days worked per year Total
SexLess than150 days
150 to199 days
200 to249 days
250 daysand over
Both sexes 53,537.5 10,221.3 5,966.4 4,254.9 42,645.4 19,265.6 23,379.8 Male 29,291.7 3,581.2 2,115.7 1,465.5 25,358.8 10,375.8 14,983.0
Female 24,245.7 6,640.1 3,850.7 2,789.4 17,286.6 8,889.8 8,396.8Both sexes 53,262.5 10,202.4 5,724.2 4,478.2 42,590.5 19,079.5 23,510.9 Male 29,735.0 3,797.5 2,097.0 1,700.6 25,689.1 10,415.5 15,273.6
Female 23,527.5 6,404.9 3,627.4 2,777.5 16,901.4 8,664.1 8,237.3Both sexes 100.0 19.1 11.1 7.9 79.7 36.0 43.7 Male 100.0 12.2 7.2 5.0 86.6 35.4 51.2
Female 100.0 27.4 15.9 11.5 71.3 36.7 34.6Both sexes 100.0 19.2 10.7 8.4 80.0 35.8 44.1 Male 100.0 12.8 7.1 5.7 86.4 35.0 51.4
Female 100.0 27.2 15.4 11.8 71.8 36.8 35.0Both sexes 275.0 18.9 242.2 -223.3 54.9 186.1 -131.1 Male -443.3 -216.3 18.7 -235.1 -330.3 -39.7 -290.6 Female 718.2 235.2 223.3 11.9 385.2 225.7 159.5Both sexes - -0.1 0.4 -0.5 -0.3 0.2 -0.4 Male - -0.6 0.1 -0.7 0.2 0.4 -0.2 Female - 0.2 0.5 -0.3 -0.5 -0.1 -0.4
2007
Cha
nge
Number
Ratio
Less than 200 days 200 days and over
Total Total
Num
ber
2012
2007
Rat
io
2012
Table I-20: Number and ratio of employees (excluding executive of company or corporation) by sex, type of
employment and days worked per year / 2012
Fig. I-11: Ratio of employees (excluding executive of company or corporation) by main type of employment and days
worked per year / 2012
Note) Names used for types of employment such as “Part-time workers” and “Arbeit (temporary workers)” differ
from workplace to workplace.
(thousand persons, %)Days worked per year
SexType of employment 1)
Less than150 days
150 to199 days
200 to249 days
250 daysand over
Less than150 days
150 to199 days
200 to249 days
250 daysand over
Both sexes 53,537.5 10,221.3 5,966.4 4,254.9 42,645.4 19,265.6 23,379.8 100.0 19.1 11.1 7.9 79.7 36.0 43.7 Regular staffs 33,110.4 1,811.6 955.3 856.2 31,010.6 12,423.7 18,586.8 100.0 5.5 2.9 2.6 93.7 37.5 56.1 Part-time workers 9,560.8 4,045.8 2,131.3 1,914.5 5,364.0 3,455.2 1,908.8 100.0 42.3 22.3 20.0 56.1 36.1 20.0 Arbeit (temporary workers) 4,391.9 2,706.0 1,906.6 799.3 1,563.8 882.5 681.3 100.0 61.6 43.4 18.2 35.6 20.1 15.5 Dispatched workers from temporary labour agency 1,187.3 329.9 203.0 127.0 828.0 533.7 294.3 100.0 27.8 17.1 10.7 69.7 45.0 24.8
Contract employees 2,909.2 536.7 274.9 261.8 2,332.5 1,199.8 1,132.8 100.0 18.4 9.4 9.0 80.2 41.2 38.9 Entrusted employees 1,192.6 322.2 176.1 146.1 862.3 488.0 374.2 100.0 27.0 14.8 12.3 72.3 40.9 31.4 Other 1,185.4 469.0 319.2 149.9 684.2 282.7 401.5 100.0 39.6 26.9 12.6 57.7 23.8 33.9
Male 29,291.7 3,581.2 2,115.7 1,465.5 25,358.8 10,375.8 14,983.0 100.0 12.2 7.2 5.0 86.6 35.4 51.2
Regular staffs 22,809.0 1,118.3 570.2 548.1 21,490.6 8,394.0 13,096.6 100.0 4.9 2.5 2.4 94.2 36.8 57.4
Part-time workers 1,014.3 369.2 205.8 163.3 625.8 343.9 282.0 100.0 36.4 20.3 16.1 61.7 33.9 27.8
Arbeit (temporary workers) 2,193.8 1,278.8 891.8 387.0 844.3 441.0 403.3 100.0 58.3 40.7 17.6 38.5 20.1 18.4
Dispatched workers from temporary labour agency
447.3 118.6 68.9 49.6 314.4 179.3 135.1 100.0 26.5 15.4 11.1 70.3 40.1 30.2
Contract employees 1,551.5 297.8 140.7 157.1 1,228.6 588.3 640.2 100.0 19.2 9.1 10.1 79.2 37.9 41.3
Entrusted employees 758.3 205.7 110.7 95.0 548.5 302.0 246.5 100.0 27.1 14.6 12.5 72.3 39.8 32.5
Other 517.6 192.8 127.4 65.4 306.4 127.3 179.1 100.0 37.2 24.6 12.6 59.2 24.6 34.6
Female 24,245.7 6,640.1 3,850.7 2,789.4 17,286.6 8,889.8 8,396.8 100.0 27.4 15.9 11.5 71.3 36.7 34.6
Regular staffs 10,301.3 693.3 385.1 308.1 9,519.9 4,029.7 5,490.3 100.0 6.7 3.7 3.0 92.4 39.1 53.3
Part-time workers 8,546.5 3,676.6 1,925.4 1,751.1 4,738.2 3,111.4 1,626.8 100.0 43.0 22.5 20.5 55.4 36.4 19.0
Arbeit (temporary workers) 2,198.1 1,427.2 1,014.8 412.4 719.5 441.5 278.0 100.0 64.9 46.2 18.8 32.7 20.1 12.6
Dispatched workers from temporary labour agency
740.1 211.4 133.9 77.4 513.5 354.4 159.1 100.0 28.6 18.1 10.5 69.4 47.9 21.5
Contract employees 1,357.7 238.9 134.1 104.8 1,104.0 611.4 492.6 100.0 17.6 9.9 7.7 81.3 45.0 36.3
Entrusted employees 434.3 116.5 65.3 51.2 313.7 186.0 127.7 100.0 26.8 15.0 11.8 72.2 42.8 29.4
Other 667.8 276.3 191.8 84.4 377.8 155.4 222.4 100.0 41.4 28.7 12.6 56.6 23.3 33.3Note 1) Names used for types of employment such as “Part-time workers” and “Arbeit (temporary workers)” differ from workplace to workplace.
Number Ratio
Total
Less than 200 days 200 days and over
Total
Less than 200 days 200 days and over
Total Total Total Total
0 10 20 30 40 50 60 70 80 90 100
Regular staffs
Part-time workers
Arbeit (temporary workers)
(%)
37.5 56.1
22.3 36.1 20.0
43.4 20.1 15.518.2
20.0
200~249 days 250 days or more150~199 daysLess than 150 days
2.62.9
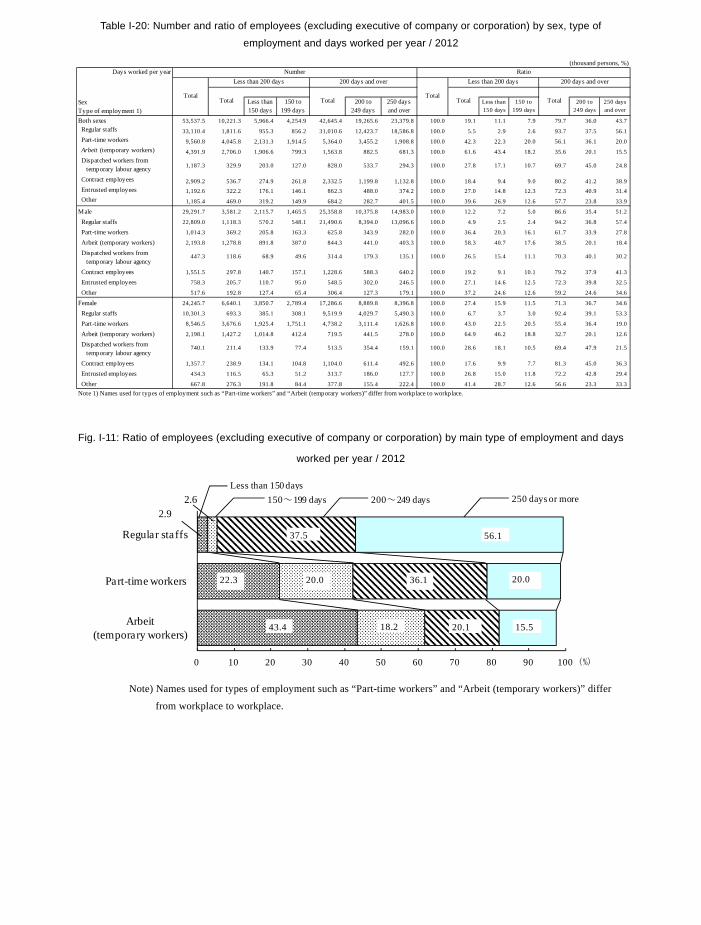
143
(3) Days worked per year and working hours per week a. About half of male employees (excluding executive of company or corporation)
worked “250 days and over”. Looking at “Employees, excluding executive of company or corporation” by days worked per
year, those working “less than 150 days” numbered 5,966 thousand (11.1% of all employees,
excluding executive of company or corporation), “150 to 199 days” numbered 4,255 thousand
(7.9%), “200 to 249 days” numbered 19,266 thousand (36.0%), and “250 days and over”
numbered 23,380 thousand (43.7%).
Compared to 2007, “150 to 199 days” fell by 0.5 points and “250 days and over” by 0.4 points,
while “less than 150 days” rose by 0.4 points and “200 to 249 days” by 0.2 points.
In the ratio by sex, 51.2% of persons engaged in work for “250 days and over” were males and
34.6% were females, while 7.2% of persons engaged in work for “less than 150 days” were males
and 15.9% were females, revealing that about half of all male employees (excluding executive of
company or corporation) were engaged in work for “250 days and over”.
In the ratio for each main type of employment by days worked per year, 56.1% of “Regular
staffs” worked for “250 days and over”. Meanwhile, 43.4% of “Arbeit (temporary workers)”
worked for “less than 150 days”. (Table I-19/20, Fig. I-11)
Table I-19: Number and ratio of employees (excluding executive of company or corporation) by sex and days
worked per year / 2007, 2012
(thousand persons, %, points)Days worked per year Total
SexLess than150 days
150 to199 days
200 to249 days
250 daysand over
Both sexes 53,537.5 10,221.3 5,966.4 4,254.9 42,645.4 19,265.6 23,379.8 Male 29,291.7 3,581.2 2,115.7 1,465.5 25,358.8 10,375.8 14,983.0
Female 24,245.7 6,640.1 3,850.7 2,789.4 17,286.6 8,889.8 8,396.8Both sexes 53,262.5 10,202.4 5,724.2 4,478.2 42,590.5 19,079.5 23,510.9 Male 29,735.0 3,797.5 2,097.0 1,700.6 25,689.1 10,415.5 15,273.6
Female 23,527.5 6,404.9 3,627.4 2,777.5 16,901.4 8,664.1 8,237.3Both sexes 100.0 19.1 11.1 7.9 79.7 36.0 43.7 Male 100.0 12.2 7.2 5.0 86.6 35.4 51.2
Female 100.0 27.4 15.9 11.5 71.3 36.7 34.6Both sexes 100.0 19.2 10.7 8.4 80.0 35.8 44.1 Male 100.0 12.8 7.1 5.7 86.4 35.0 51.4
Female 100.0 27.2 15.4 11.8 71.8 36.8 35.0Both sexes 275.0 18.9 242.2 -223.3 54.9 186.1 -131.1 Male -443.3 -216.3 18.7 -235.1 -330.3 -39.7 -290.6 Female 718.2 235.2 223.3 11.9 385.2 225.7 159.5Both sexes - -0.1 0.4 -0.5 -0.3 0.2 -0.4 Male - -0.6 0.1 -0.7 0.2 0.4 -0.2 Female - 0.2 0.5 -0.3 -0.5 -0.1 -0.4
2007
Cha
nge
Number
Ratio
Less than 200 days 200 days and over
Total Total
Num
ber
2012
2007
Rat
io
2012
Table I-20: Number and ratio of employees (excluding executive of company or corporation) by sex, type of
employment and days worked per year / 2012
Fig. I-11: Ratio of employees (excluding executive of company or corporation) by main type of employment and days
worked per year / 2012
Note) Names used for types of employment such as “Part-time workers” and “Arbeit (temporary workers)” differ
from workplace to workplace.
(thousand persons, %)Days worked per year
SexType of employment 1)
Less than150 days
150 to199 days
200 to249 days
250 daysand over
Less than150 days
150 to199 days
200 to249 days
250 daysand over
Both sexes 53,537.5 10,221.3 5,966.4 4,254.9 42,645.4 19,265.6 23,379.8 100.0 19.1 11.1 7.9 79.7 36.0 43.7 Regular staffs 33,110.4 1,811.6 955.3 856.2 31,010.6 12,423.7 18,586.8 100.0 5.5 2.9 2.6 93.7 37.5 56.1 Part-time workers 9,560.8 4,045.8 2,131.3 1,914.5 5,364.0 3,455.2 1,908.8 100.0 42.3 22.3 20.0 56.1 36.1 20.0 Arbeit (temporary workers) 4,391.9 2,706.0 1,906.6 799.3 1,563.8 882.5 681.3 100.0 61.6 43.4 18.2 35.6 20.1 15.5 Dispatched workers from temporary labour agency 1,187.3 329.9 203.0 127.0 828.0 533.7 294.3 100.0 27.8 17.1 10.7 69.7 45.0 24.8
Contract employees 2,909.2 536.7 274.9 261.8 2,332.5 1,199.8 1,132.8 100.0 18.4 9.4 9.0 80.2 41.2 38.9 Entrusted employees 1,192.6 322.2 176.1 146.1 862.3 488.0 374.2 100.0 27.0 14.8 12.3 72.3 40.9 31.4 Other 1,185.4 469.0 319.2 149.9 684.2 282.7 401.5 100.0 39.6 26.9 12.6 57.7 23.8 33.9
Male 29,291.7 3,581.2 2,115.7 1,465.5 25,358.8 10,375.8 14,983.0 100.0 12.2 7.2 5.0 86.6 35.4 51.2
Regular staffs 22,809.0 1,118.3 570.2 548.1 21,490.6 8,394.0 13,096.6 100.0 4.9 2.5 2.4 94.2 36.8 57.4
Part-time workers 1,014.3 369.2 205.8 163.3 625.8 343.9 282.0 100.0 36.4 20.3 16.1 61.7 33.9 27.8
Arbeit (temporary workers) 2,193.8 1,278.8 891.8 387.0 844.3 441.0 403.3 100.0 58.3 40.7 17.6 38.5 20.1 18.4
Dispatched workers from temporary labour agency
447.3 118.6 68.9 49.6 314.4 179.3 135.1 100.0 26.5 15.4 11.1 70.3 40.1 30.2
Contract employees 1,551.5 297.8 140.7 157.1 1,228.6 588.3 640.2 100.0 19.2 9.1 10.1 79.2 37.9 41.3
Entrusted employees 758.3 205.7 110.7 95.0 548.5 302.0 246.5 100.0 27.1 14.6 12.5 72.3 39.8 32.5
Other 517.6 192.8 127.4 65.4 306.4 127.3 179.1 100.0 37.2 24.6 12.6 59.2 24.6 34.6
Female 24,245.7 6,640.1 3,850.7 2,789.4 17,286.6 8,889.8 8,396.8 100.0 27.4 15.9 11.5 71.3 36.7 34.6
Regular staffs 10,301.3 693.3 385.1 308.1 9,519.9 4,029.7 5,490.3 100.0 6.7 3.7 3.0 92.4 39.1 53.3
Part-time workers 8,546.5 3,676.6 1,925.4 1,751.1 4,738.2 3,111.4 1,626.8 100.0 43.0 22.5 20.5 55.4 36.4 19.0
Arbeit (temporary workers) 2,198.1 1,427.2 1,014.8 412.4 719.5 441.5 278.0 100.0 64.9 46.2 18.8 32.7 20.1 12.6
Dispatched workers from temporary labour agency
740.1 211.4 133.9 77.4 513.5 354.4 159.1 100.0 28.6 18.1 10.5 69.4 47.9 21.5
Contract employees 1,357.7 238.9 134.1 104.8 1,104.0 611.4 492.6 100.0 17.6 9.9 7.7 81.3 45.0 36.3
Entrusted employees 434.3 116.5 65.3 51.2 313.7 186.0 127.7 100.0 26.8 15.0 11.8 72.2 42.8 29.4
Other 667.8 276.3 191.8 84.4 377.8 155.4 222.4 100.0 41.4 28.7 12.6 56.6 23.3 33.3Note 1) Names used for types of employment such as “Part-time workers” and “Arbeit (temporary workers)” differ from workplace to workplace.
Number Ratio
Total
Less than 200 days 200 days and over
Total
Less than 200 days 200 days and over
Total Total Total Total
0 10 20 30 40 50 60 70 80 90 100
Regular staffs
Part-time workers
Arbeit (temporary workers)
(%)
37.5 56.1
22.3 36.1 20.0
43.4 20.1 15.518.2
20.0
200~249 days 250 days or more150~199 daysLess than 150 days
2.62.9
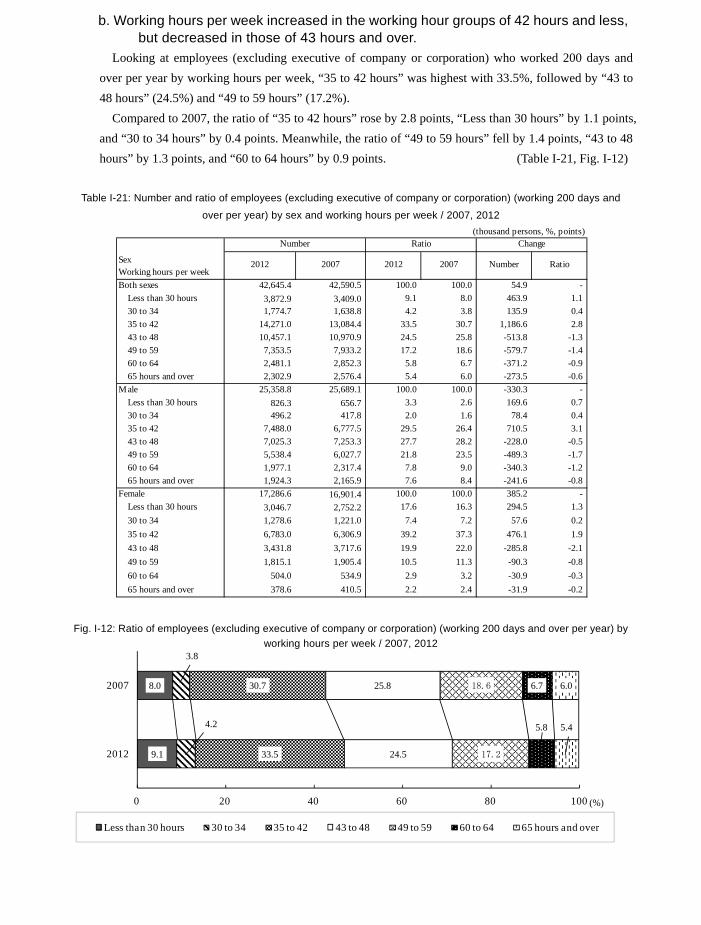
144
9.1
8.0
4.2
3.8
33.5
30.7
24.5
25.8
17.2
18.6
5.8
6.7
5.4
6.0
0 20 40 60 80 100
2012
2007
Less than 30 hours 30 to 34 35 to 42 43 to 48 49 to 59 60 to 64 65 hours and over
(%)
b. Working hours per week increased in the working hour groups of 42 hours and less, but decreased in those of 43 hours and over.
Looking at employees (excluding executive of company or corporation) who worked 200 days and over per year by working hours per week, “35 to 42 hours” was highest with 33.5%, followed by “43 to 48 hours” (24.5%) and “49 to 59 hours” (17.2%).
Compared to 2007, the ratio of “35 to 42 hours” rose by 2.8 points, “Less than 30 hours” by 1.1 points, and “30 to 34 hours” by 0.4 points. Meanwhile, the ratio of “49 to 59 hours” fell by 1.4 points, “43 to 48 hours” by 1.3 points, and “60 to 64 hours” by 0.9 points. (Table I-21, Fig. I-12)
Table I-21: Number and ratio of employees (excluding executive of company or corporation) (working 200 days and
over per year) by sex and working hours per week / 2007, 2012
Fig. I-12: Ratio of employees (excluding executive of company or corporation) (working 200 days and over per year) by working hours per week / 2007, 2012
(thousand persons, %, points)
Both sexes 42,645.4 42,590.5 100.0 100.0 54.9 - Less than 30 hours 3,872.9 3,409.0 9.1 8.0 463.9 1.1 30 to 34 1,774.7 1,638.8 4.2 3.8 135.9 0.4 35 to 42 14,271.0 13,084.4 33.5 30.7 1,186.6 2.8 43 to 48 10,457.1 10,970.9 24.5 25.8 -513.8 -1.3 49 to 59 7,353.5 7,933.2 17.2 18.6 -579.7 -1.4 60 to 64 2,481.1 2,852.3 5.8 6.7 -371.2 -0.9 65 hours and over 2,302.9 2,576.4 5.4 6.0 -273.5 -0.6Male 25,358.8 25,689.1 100.0 100.0 -330.3 - Less than 30 hours 826.3 656.7 3.3 2.6 169.6 0.7 30 to 34 496.2 417.8 2.0 1.6 78.4 0.4 35 to 42 7,488.0 6,777.5 29.5 26.4 710.5 3.1 43 to 48 7,025.3 7,253.3 27.7 28.2 -228.0 -0.5 49 to 59 5,538.4 6,027.7 21.8 23.5 -489.3 -1.7 60 to 64 1,977.1 2,317.4 7.8 9.0 -340.3 -1.2 65 hours and over 1,924.3 2,165.9 7.6 8.4 -241.6 -0.8Female 17,286.6 16,901.4 100.0 100.0 385.2 - Less than 30 hours 3,046.7 2,752.2 17.6 16.3 294.5 1.3 30 to 34 1,278.6 1,221.0 7.4 7.2 57.6 0.2 35 to 42 6,783.0 6,306.9 39.2 37.3 476.1 1.9 43 to 48 3,431.8 3,717.6 19.9 22.0 -285.8 -2.1 49 to 59 1,815.1 1,905.4 10.5 11.3 -90.3 -0.8 60 to 64 504.0 534.9 2.9 3.2 -30.9 -0.3 65 hours and over 378.6 410.5 2.2 2.4 -31.9 -0.2
Number Ratio Change
SexWorking hours per week
2012 2007 2012 2007 Number Ratio
c. The ratio of male “Regular staffs” working 60 hours and over per week decreased in all age groups (excluding “65 years old and over”). Looking at the ratio of employees (excluding executive of company or corporation) who worked 200
days and over per year by main type of employment and working hours per week, the highest among
“Regular staffs” was “35 to 42 hours” with 32.7%. On the other hand, the highest among “Part-time
workers” and “Arbeit (temporary workers)” was “Less than 30 hours” with 45.5% and 31.3%,
respectively.
In the ratio of “Regular staffs” working 60 hours and over per week by sex, for males “60 to 64 hours”
and “65 hours and over” accounted for 8.5% and 8.3%, respectively. Meanwhile, for females “60 to 64
hours” and “65 hours and over” accounted for 4.4% and 3.2%, respectively.
In the ratio of male “Regular staffs” working 60 hours and over per week by age group, “30 to 34
years old” was highest with 20.6%, followed by “25 to 29” (19.6%) and “35 to 39” (19.4%). This
indicates that about 20% of “Regular staff” aged from 25 to 39 worked 60 hours and over per week.
Compared to 2007, the ratio of male “Regular staffs” working 60 hours and over per week decreased
in all age groups (excluding “65 years old and over”). (Table I-22, Fig. I-13/14)
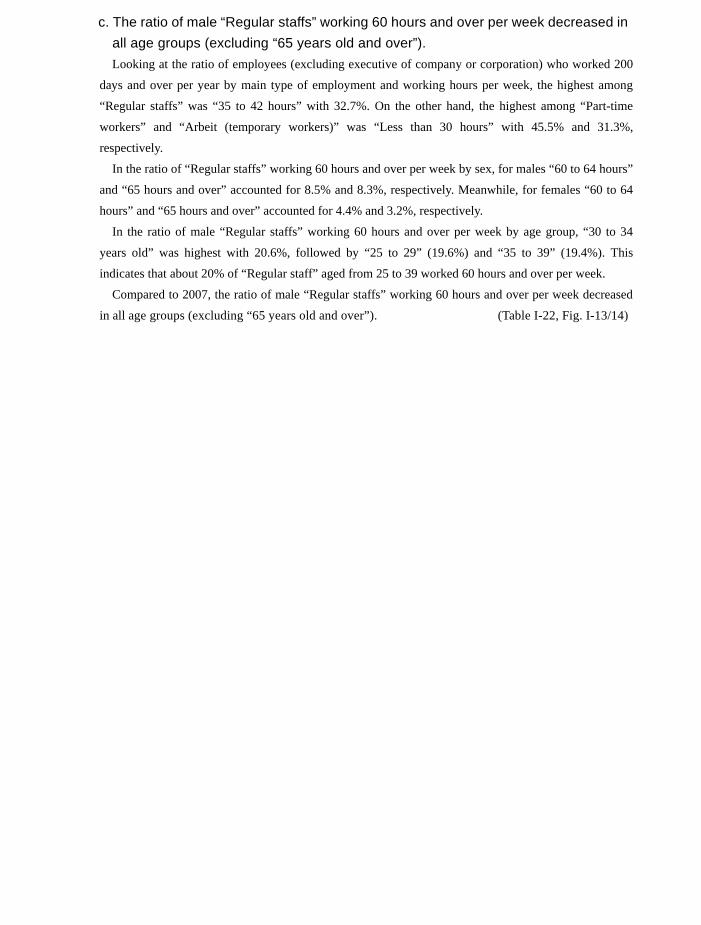
145
9.1
8.0
4.2
3.8
33.5
30.7
24.5
25.8
17.2
18.6
5.8
6.7
5.4
6.0
0 20 40 60 80 100
2012
2007
Less than 30 hours 30 to 34 35 to 42 43 to 48 49 to 59 60 to 64 65 hours and over
(%)
b. Working hours per week increased in the working hour groups of 42 hours and less, but decreased in those of 43 hours and over.
Looking at employees (excluding executive of company or corporation) who worked 200 days and over per year by working hours per week, “35 to 42 hours” was highest with 33.5%, followed by “43 to 48 hours” (24.5%) and “49 to 59 hours” (17.2%).
Compared to 2007, the ratio of “35 to 42 hours” rose by 2.8 points, “Less than 30 hours” by 1.1 points, and “30 to 34 hours” by 0.4 points. Meanwhile, the ratio of “49 to 59 hours” fell by 1.4 points, “43 to 48 hours” by 1.3 points, and “60 to 64 hours” by 0.9 points. (Table I-21, Fig. I-12)
Table I-21: Number and ratio of employees (excluding executive of company or corporation) (working 200 days and
over per year) by sex and working hours per week / 2007, 2012
Fig. I-12: Ratio of employees (excluding executive of company or corporation) (working 200 days and over per year) by working hours per week / 2007, 2012
(thousand persons, %, points)
Both sexes 42,645.4 42,590.5 100.0 100.0 54.9 - Less than 30 hours 3,872.9 3,409.0 9.1 8.0 463.9 1.1 30 to 34 1,774.7 1,638.8 4.2 3.8 135.9 0.4 35 to 42 14,271.0 13,084.4 33.5 30.7 1,186.6 2.8 43 to 48 10,457.1 10,970.9 24.5 25.8 -513.8 -1.3 49 to 59 7,353.5 7,933.2 17.2 18.6 -579.7 -1.4 60 to 64 2,481.1 2,852.3 5.8 6.7 -371.2 -0.9 65 hours and over 2,302.9 2,576.4 5.4 6.0 -273.5 -0.6Male 25,358.8 25,689.1 100.0 100.0 -330.3 - Less than 30 hours 826.3 656.7 3.3 2.6 169.6 0.7 30 to 34 496.2 417.8 2.0 1.6 78.4 0.4 35 to 42 7,488.0 6,777.5 29.5 26.4 710.5 3.1 43 to 48 7,025.3 7,253.3 27.7 28.2 -228.0 -0.5 49 to 59 5,538.4 6,027.7 21.8 23.5 -489.3 -1.7 60 to 64 1,977.1 2,317.4 7.8 9.0 -340.3 -1.2 65 hours and over 1,924.3 2,165.9 7.6 8.4 -241.6 -0.8Female 17,286.6 16,901.4 100.0 100.0 385.2 - Less than 30 hours 3,046.7 2,752.2 17.6 16.3 294.5 1.3 30 to 34 1,278.6 1,221.0 7.4 7.2 57.6 0.2 35 to 42 6,783.0 6,306.9 39.2 37.3 476.1 1.9 43 to 48 3,431.8 3,717.6 19.9 22.0 -285.8 -2.1 49 to 59 1,815.1 1,905.4 10.5 11.3 -90.3 -0.8 60 to 64 504.0 534.9 2.9 3.2 -30.9 -0.3 65 hours and over 378.6 410.5 2.2 2.4 -31.9 -0.2
Number Ratio Change
SexWorking hours per week
2012 2007 2012 2007 Number Ratio
c. The ratio of male “Regular staffs” working 60 hours and over per week decreased in all age groups (excluding “65 years old and over”). Looking at the ratio of employees (excluding executive of company or corporation) who worked 200
days and over per year by main type of employment and working hours per week, the highest among
“Regular staffs” was “35 to 42 hours” with 32.7%. On the other hand, the highest among “Part-time
workers” and “Arbeit (temporary workers)” was “Less than 30 hours” with 45.5% and 31.3%,
respectively.
In the ratio of “Regular staffs” working 60 hours and over per week by sex, for males “60 to 64 hours”
and “65 hours and over” accounted for 8.5% and 8.3%, respectively. Meanwhile, for females “60 to 64
hours” and “65 hours and over” accounted for 4.4% and 3.2%, respectively.
In the ratio of male “Regular staffs” working 60 hours and over per week by age group, “30 to 34
years old” was highest with 20.6%, followed by “25 to 29” (19.6%) and “35 to 39” (19.4%). This
indicates that about 20% of “Regular staff” aged from 25 to 39 worked 60 hours and over per week.
Compared to 2007, the ratio of male “Regular staffs” working 60 hours and over per week decreased
in all age groups (excluding “65 years old and over”). (Table I-22, Fig. I-13/14)
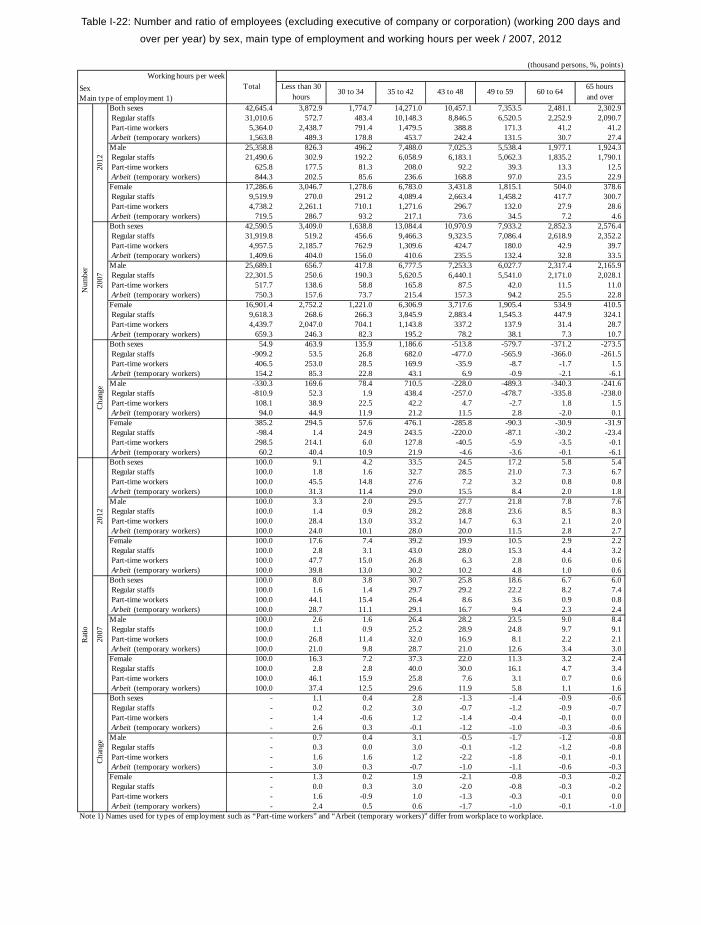
146
Table I-22: Number and ratio of employees (excluding executive of company or corporation) (working 200 days and
over per year) by sex, main type of employment and working hours per week / 2007, 2012
(thousand persons, %, points)Working hours per week
SexMain type of employment 1)
Both sexes 42,645.4 3,872.9 1,774.7 14,271.0 10,457.1 7,353.5 2,481.1 2,302.9 Regular staffs 31,010.6 572.7 483.4 10,148.3 8,846.5 6,520.5 2,252.9 2,090.7 Part-time workers 5,364.0 2,438.7 791.4 1,479.5 388.8 171.3 41.2 41.2 Arbeit (temporary workers) 1,563.8 489.3 178.8 453.7 242.4 131.5 30.7 27.4Male 25,358.8 826.3 496.2 7,488.0 7,025.3 5,538.4 1,977.1 1,924.3 Regular staffs 21,490.6 302.9 192.2 6,058.9 6,183.1 5,062.3 1,835.2 1,790.1 Part-time workers 625.8 177.5 81.3 208.0 92.2 39.3 13.3 12.5 Arbeit (temporary workers) 844.3 202.5 85.6 236.6 168.8 97.0 23.5 22.9Female 17,286.6 3,046.7 1,278.6 6,783.0 3,431.8 1,815.1 504.0 378.6 Regular staffs 9,519.9 270.0 291.2 4,089.4 2,663.4 1,458.2 417.7 300.7 Part-time workers 4,738.2 2,261.1 710.1 1,271.6 296.7 132.0 27.9 28.6 Arbeit (temporary workers) 719.5 286.7 93.2 217.1 73.6 34.5 7.2 4.6Both sexes 42,590.5 3,409.0 1,638.8 13,084.4 10,970.9 7,933.2 2,852.3 2,576.4 Regular staffs 31,919.8 519.2 456.6 9,466.3 9,323.5 7,086.4 2,618.9 2,352.2 Part-time workers 4,957.5 2,185.7 762.9 1,309.6 424.7 180.0 42.9 39.7 Arbeit (temporary workers) 1,409.6 404.0 156.0 410.6 235.5 132.4 32.8 33.5Male 25,689.1 656.7 417.8 6,777.5 7,253.3 6,027.7 2,317.4 2,165.9 Regular staffs 22,301.5 250.6 190.3 5,620.5 6,440.1 5,541.0 2,171.0 2,028.1 Part-time workers 517.7 138.6 58.8 165.8 87.5 42.0 11.5 11.0 Arbeit (temporary workers) 750.3 157.6 73.7 215.4 157.3 94.2 25.5 22.8Female 16,901.4 2,752.2 1,221.0 6,306.9 3,717.6 1,905.4 534.9 410.5 Regular staffs 9,618.3 268.6 266.3 3,845.9 2,883.4 1,545.3 447.9 324.1 Part-time workers 4,439.7 2,047.0 704.1 1,143.8 337.2 137.9 31.4 28.7 Arbeit (temporary workers) 659.3 246.3 82.3 195.2 78.2 38.1 7.3 10.7Both sexes 54.9 463.9 135.9 1,186.6 -513.8 -579.7 -371.2 -273.5 Regular staffs -909.2 53.5 26.8 682.0 -477.0 -565.9 -366.0 -261.5 Part-time workers 406.5 253.0 28.5 169.9 -35.9 -8.7 -1.7 1.5 Arbeit (temporary workers) 154.2 85.3 22.8 43.1 6.9 -0.9 -2.1 -6.1Male -330.3 169.6 78.4 710.5 -228.0 -489.3 -340.3 -241.6 Regular staffs -810.9 52.3 1.9 438.4 -257.0 -478.7 -335.8 -238.0 Part-time workers 108.1 38.9 22.5 42.2 4.7 -2.7 1.8 1.5 Arbeit (temporary workers) 94.0 44.9 11.9 21.2 11.5 2.8 -2.0 0.1Female 385.2 294.5 57.6 476.1 -285.8 -90.3 -30.9 -31.9 Regular staffs -98.4 1.4 24.9 243.5 -220.0 -87.1 -30.2 -23.4 Part-time workers 298.5 214.1 6.0 127.8 -40.5 -5.9 -3.5 -0.1 Arbeit (temporary workers) 60.2 40.4 10.9 21.9 -4.6 -3.6 -0.1 -6.1Both sexes 100.0 9.1 4.2 33.5 24.5 17.2 5.8 5.4 Regular staffs 100.0 1.8 1.6 32.7 28.5 21.0 7.3 6.7 Part-time workers 100.0 45.5 14.8 27.6 7.2 3.2 0.8 0.8 Arbeit (temporary workers) 100.0 31.3 11.4 29.0 15.5 8.4 2.0 1.8Male 100.0 3.3 2.0 29.5 27.7 21.8 7.8 7.6 Regular staffs 100.0 1.4 0.9 28.2 28.8 23.6 8.5 8.3 Part-time workers 100.0 28.4 13.0 33.2 14.7 6.3 2.1 2.0 Arbeit (temporary workers) 100.0 24.0 10.1 28.0 20.0 11.5 2.8 2.7Female 100.0 17.6 7.4 39.2 19.9 10.5 2.9 2.2 Regular staffs 100.0 2.8 3.1 43.0 28.0 15.3 4.4 3.2 Part-time workers 100.0 47.7 15.0 26.8 6.3 2.8 0.6 0.6 Arbeit (temporary workers) 100.0 39.8 13.0 30.2 10.2 4.8 1.0 0.6Both sexes 100.0 8.0 3.8 30.7 25.8 18.6 6.7 6.0 Regular staffs 100.0 1.6 1.4 29.7 29.2 22.2 8.2 7.4 Part-time workers 100.0 44.1 15.4 26.4 8.6 3.6 0.9 0.8 Arbeit (temporary workers) 100.0 28.7 11.1 29.1 16.7 9.4 2.3 2.4Male 100.0 2.6 1.6 26.4 28.2 23.5 9.0 8.4 Regular staffs 100.0 1.1 0.9 25.2 28.9 24.8 9.7 9.1 Part-time workers 100.0 26.8 11.4 32.0 16.9 8.1 2.2 2.1 Arbeit (temporary workers) 100.0 21.0 9.8 28.7 21.0 12.6 3.4 3.0Female 100.0 16.3 7.2 37.3 22.0 11.3 3.2 2.4 Regular staffs 100.0 2.8 2.8 40.0 30.0 16.1 4.7 3.4 Part-time workers 100.0 46.1 15.9 25.8 7.6 3.1 0.7 0.6 Arbeit (temporary workers) 100.0 37.4 12.5 29.6 11.9 5.8 1.1 1.6Both sexes - 1.1 0.4 2.8 -1.3 -1.4 -0.9 -0.6 Regular staffs - 0.2 0.2 3.0 -0.7 -1.2 -0.9 -0.7 Part-time workers - 1.4 -0.6 1.2 -1.4 -0.4 -0.1 0.0 Arbeit (temporary workers) - 2.6 0.3 -0.1 -1.2 -1.0 -0.3 -0.6Male - 0.7 0.4 3.1 -0.5 -1.7 -1.2 -0.8 Regular staffs - 0.3 0.0 3.0 -0.1 -1.2 -1.2 -0.8 Part-time workers - 1.6 1.6 1.2 -2.2 -1.8 -0.1 -0.1 Arbeit (temporary workers) - 3.0 0.3 -0.7 -1.0 -1.1 -0.6 -0.3Female - 1.3 0.2 1.9 -2.1 -0.8 -0.3 -0.2 Regular staffs - 0.0 0.3 3.0 -2.0 -0.8 -0.3 -0.2 Part-time workers - 1.6 -0.9 1.0 -1.3 -0.3 -0.1 0.0 Arbeit (temporary workers) - 2.4 0.5 0.6 -1.7 -1.0 -0.1 -1.0
Note 1) Names used for types of employment such as “Part-time workers” and “Arbeit (temporary workers)” differ from workplace to workplace.
Rat
io
Cha
nge
2012
2007
Num
ber
Cha
nge
2012
2007
Total Less than 30hours
30 to 34 35 to 42 43 to 48 49 to 59 60 to 6465 hoursand over
Fig. I-13: Ratio of employees (excluding executive of company or corporation) (working 200 days and over per year) by
main type of employment and working hours per week / 2007, 2012
Note) Names used for types of employment such as “Part-time workers” and “Arbeit (temporary workers)” differ from workplace to
workplace.
Fig. I-14: Ratio of male regular staffs working 60 hours and over per week
(working 200 days and over per year) by age group / 2007, 2012
12.0
18.9
22.2 22.9
22.5 21.0
18.1
14.6
11.6 11.1
9.5
11.2
16.0
19.6 20.6
19.4 18.7
16.6
13.7
10.8 10.8 10.2
0
5
10
15
20
25
15 to 19 years old
20 to 24 25 to 29 30 to 34 35 to 39 40 to 44 45 to 49 50 to 54 55 to 59 60 to 64 65 years old and
over
2007 2012
(%)
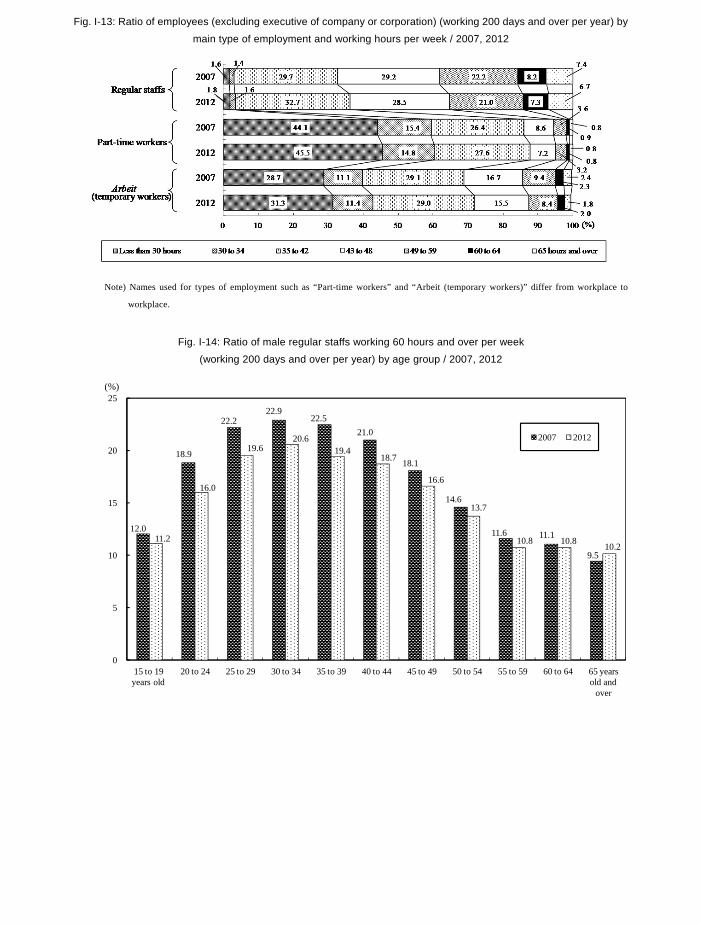
147
Table I-22: Number and ratio of employees (excluding executive of company or corporation) (working 200 days and
over per year) by sex, main type of employment and working hours per week / 2007, 2012
(thousand persons, %, points)Working hours per week
SexMain type of employment 1)
Both sexes 42,645.4 3,872.9 1,774.7 14,271.0 10,457.1 7,353.5 2,481.1 2,302.9 Regular staffs 31,010.6 572.7 483.4 10,148.3 8,846.5 6,520.5 2,252.9 2,090.7 Part-time workers 5,364.0 2,438.7 791.4 1,479.5 388.8 171.3 41.2 41.2 Arbeit (temporary workers) 1,563.8 489.3 178.8 453.7 242.4 131.5 30.7 27.4Male 25,358.8 826.3 496.2 7,488.0 7,025.3 5,538.4 1,977.1 1,924.3 Regular staffs 21,490.6 302.9 192.2 6,058.9 6,183.1 5,062.3 1,835.2 1,790.1 Part-time workers 625.8 177.5 81.3 208.0 92.2 39.3 13.3 12.5 Arbeit (temporary workers) 844.3 202.5 85.6 236.6 168.8 97.0 23.5 22.9Female 17,286.6 3,046.7 1,278.6 6,783.0 3,431.8 1,815.1 504.0 378.6 Regular staffs 9,519.9 270.0 291.2 4,089.4 2,663.4 1,458.2 417.7 300.7 Part-time workers 4,738.2 2,261.1 710.1 1,271.6 296.7 132.0 27.9 28.6 Arbeit (temporary workers) 719.5 286.7 93.2 217.1 73.6 34.5 7.2 4.6Both sexes 42,590.5 3,409.0 1,638.8 13,084.4 10,970.9 7,933.2 2,852.3 2,576.4 Regular staffs 31,919.8 519.2 456.6 9,466.3 9,323.5 7,086.4 2,618.9 2,352.2 Part-time workers 4,957.5 2,185.7 762.9 1,309.6 424.7 180.0 42.9 39.7 Arbeit (temporary workers) 1,409.6 404.0 156.0 410.6 235.5 132.4 32.8 33.5Male 25,689.1 656.7 417.8 6,777.5 7,253.3 6,027.7 2,317.4 2,165.9 Regular staffs 22,301.5 250.6 190.3 5,620.5 6,440.1 5,541.0 2,171.0 2,028.1 Part-time workers 517.7 138.6 58.8 165.8 87.5 42.0 11.5 11.0 Arbeit (temporary workers) 750.3 157.6 73.7 215.4 157.3 94.2 25.5 22.8Female 16,901.4 2,752.2 1,221.0 6,306.9 3,717.6 1,905.4 534.9 410.5 Regular staffs 9,618.3 268.6 266.3 3,845.9 2,883.4 1,545.3 447.9 324.1 Part-time workers 4,439.7 2,047.0 704.1 1,143.8 337.2 137.9 31.4 28.7 Arbeit (temporary workers) 659.3 246.3 82.3 195.2 78.2 38.1 7.3 10.7Both sexes 54.9 463.9 135.9 1,186.6 -513.8 -579.7 -371.2 -273.5 Regular staffs -909.2 53.5 26.8 682.0 -477.0 -565.9 -366.0 -261.5 Part-time workers 406.5 253.0 28.5 169.9 -35.9 -8.7 -1.7 1.5 Arbeit (temporary workers) 154.2 85.3 22.8 43.1 6.9 -0.9 -2.1 -6.1Male -330.3 169.6 78.4 710.5 -228.0 -489.3 -340.3 -241.6 Regular staffs -810.9 52.3 1.9 438.4 -257.0 -478.7 -335.8 -238.0 Part-time workers 108.1 38.9 22.5 42.2 4.7 -2.7 1.8 1.5 Arbeit (temporary workers) 94.0 44.9 11.9 21.2 11.5 2.8 -2.0 0.1Female 385.2 294.5 57.6 476.1 -285.8 -90.3 -30.9 -31.9 Regular staffs -98.4 1.4 24.9 243.5 -220.0 -87.1 -30.2 -23.4 Part-time workers 298.5 214.1 6.0 127.8 -40.5 -5.9 -3.5 -0.1 Arbeit (temporary workers) 60.2 40.4 10.9 21.9 -4.6 -3.6 -0.1 -6.1Both sexes 100.0 9.1 4.2 33.5 24.5 17.2 5.8 5.4 Regular staffs 100.0 1.8 1.6 32.7 28.5 21.0 7.3 6.7 Part-time workers 100.0 45.5 14.8 27.6 7.2 3.2 0.8 0.8 Arbeit (temporary workers) 100.0 31.3 11.4 29.0 15.5 8.4 2.0 1.8Male 100.0 3.3 2.0 29.5 27.7 21.8 7.8 7.6 Regular staffs 100.0 1.4 0.9 28.2 28.8 23.6 8.5 8.3 Part-time workers 100.0 28.4 13.0 33.2 14.7 6.3 2.1 2.0 Arbeit (temporary workers) 100.0 24.0 10.1 28.0 20.0 11.5 2.8 2.7Female 100.0 17.6 7.4 39.2 19.9 10.5 2.9 2.2 Regular staffs 100.0 2.8 3.1 43.0 28.0 15.3 4.4 3.2 Part-time workers 100.0 47.7 15.0 26.8 6.3 2.8 0.6 0.6 Arbeit (temporary workers) 100.0 39.8 13.0 30.2 10.2 4.8 1.0 0.6Both sexes 100.0 8.0 3.8 30.7 25.8 18.6 6.7 6.0 Regular staffs 100.0 1.6 1.4 29.7 29.2 22.2 8.2 7.4 Part-time workers 100.0 44.1 15.4 26.4 8.6 3.6 0.9 0.8 Arbeit (temporary workers) 100.0 28.7 11.1 29.1 16.7 9.4 2.3 2.4Male 100.0 2.6 1.6 26.4 28.2 23.5 9.0 8.4 Regular staffs 100.0 1.1 0.9 25.2 28.9 24.8 9.7 9.1 Part-time workers 100.0 26.8 11.4 32.0 16.9 8.1 2.2 2.1 Arbeit (temporary workers) 100.0 21.0 9.8 28.7 21.0 12.6 3.4 3.0Female 100.0 16.3 7.2 37.3 22.0 11.3 3.2 2.4 Regular staffs 100.0 2.8 2.8 40.0 30.0 16.1 4.7 3.4 Part-time workers 100.0 46.1 15.9 25.8 7.6 3.1 0.7 0.6 Arbeit (temporary workers) 100.0 37.4 12.5 29.6 11.9 5.8 1.1 1.6Both sexes - 1.1 0.4 2.8 -1.3 -1.4 -0.9 -0.6 Regular staffs - 0.2 0.2 3.0 -0.7 -1.2 -0.9 -0.7 Part-time workers - 1.4 -0.6 1.2 -1.4 -0.4 -0.1 0.0 Arbeit (temporary workers) - 2.6 0.3 -0.1 -1.2 -1.0 -0.3 -0.6Male - 0.7 0.4 3.1 -0.5 -1.7 -1.2 -0.8 Regular staffs - 0.3 0.0 3.0 -0.1 -1.2 -1.2 -0.8 Part-time workers - 1.6 1.6 1.2 -2.2 -1.8 -0.1 -0.1 Arbeit (temporary workers) - 3.0 0.3 -0.7 -1.0 -1.1 -0.6 -0.3Female - 1.3 0.2 1.9 -2.1 -0.8 -0.3 -0.2 Regular staffs - 0.0 0.3 3.0 -2.0 -0.8 -0.3 -0.2 Part-time workers - 1.6 -0.9 1.0 -1.3 -0.3 -0.1 0.0 Arbeit (temporary workers) - 2.4 0.5 0.6 -1.7 -1.0 -0.1 -1.0
Note 1) Names used for types of employment such as “Part-time workers” and “Arbeit (temporary workers)” differ from workplace to workplace.
Rat
io
Cha
nge
2012
2007
Num
ber
Cha
nge
2012
2007
Total Less than 30hours
30 to 34 35 to 42 43 to 48 49 to 59 60 to 6465 hoursand over
Fig. I-13: Ratio of employees (excluding executive of company or corporation) (working 200 days and over per year) by
main type of employment and working hours per week / 2007, 2012
Note) Names used for types of employment such as “Part-time workers” and “Arbeit (temporary workers)” differ from workplace to
workplace.
Fig. I-14: Ratio of male regular staffs working 60 hours and over per week
(working 200 days and over per year) by age group / 2007, 2012
12.0
18.9
22.2 22.9
22.5 21.0
18.1
14.6
11.6 11.1
9.5
11.2
16.0
19.6 20.6
19.4 18.7
16.6
13.7
10.8 10.8 10.2
0
5
10
15
20
25
15 to 19 years old
20 to 24 25 to 29 30 to 34 35 to 39 40 to 44 45 to 49 50 to 54 55 to 59 60 to 64 65 years old and
over
2007 2012
(%)
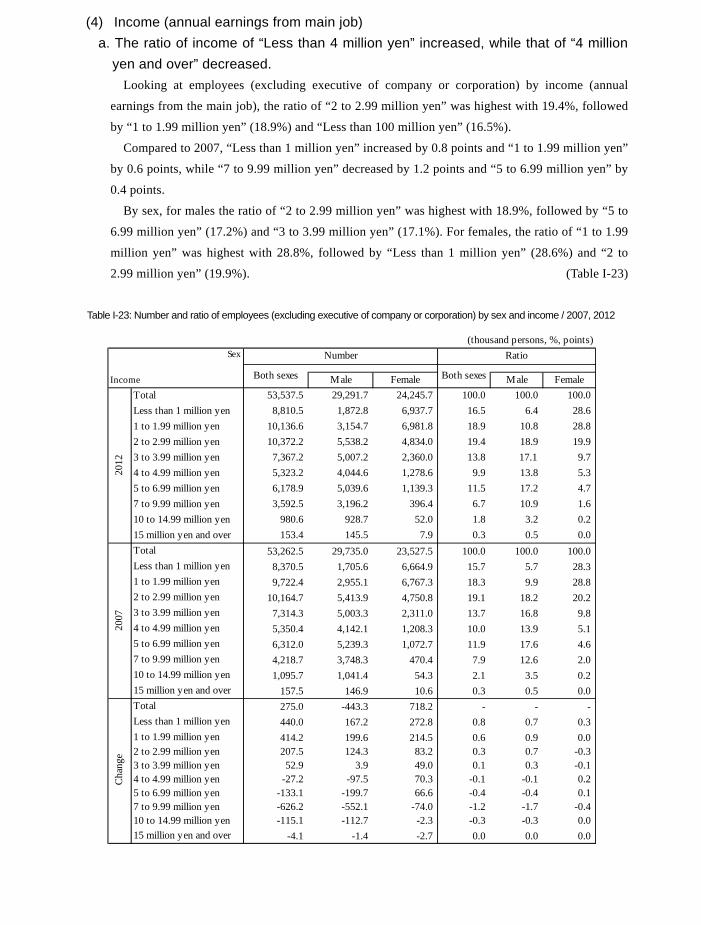
148
(4) Income (annual earnings from main job) a. The ratio of income of “Less than 4 million yen” increased, while that of “4 million
yen and over” decreased. Looking at employees (excluding executive of company or corporation) by income (annual
earnings from the main job), the ratio of “2 to 2.99 million yen” was highest with 19.4%, followed
by “1 to 1.99 million yen” (18.9%) and “Less than 100 million yen” (16.5%).
Compared to 2007, “Less than 1 million yen” increased by 0.8 points and “1 to 1.99 million yen”
by 0.6 points, while “7 to 9.99 million yen” decreased by 1.2 points and “5 to 6.99 million yen” by
0.4 points.
By sex, for males the ratio of “2 to 2.99 million yen” was highest with 18.9%, followed by “5 to
6.99 million yen” (17.2%) and “3 to 3.99 million yen” (17.1%). For females, the ratio of “1 to 1.99
million yen” was highest with 28.8%, followed by “Less than 1 million yen” (28.6%) and “2 to
2.99 million yen” (19.9%). (Table I-23)
Table I-23: Number and ratio of employees (excluding executive of company or corporation) by sex and income / 2007, 2012
(thousand persons, %, points)Sex
Male Female Male FemaleTotal 53,537.5 29,291.7 24,245.7 100.0 100.0 100.0Less than 1 million yen 8,810.5 1,872.8 6,937.7 16.5 6.4 28.61 to 1.99 million yen 10,136.6 3,154.7 6,981.8 18.9 10.8 28.82 to 2.99 million yen 10,372.2 5,538.2 4,834.0 19.4 18.9 19.93 to 3.99 million yen 7,367.2 5,007.2 2,360.0 13.8 17.1 9.74 to 4.99 million yen 5,323.2 4,044.6 1,278.6 9.9 13.8 5.35 to 6.99 million yen 6,178.9 5,039.6 1,139.3 11.5 17.2 4.77 to 9.99 million yen 3,592.5 3,196.2 396.4 6.7 10.9 1.610 to 14.99 million yen 980.6 928.7 52.0 1.8 3.2 0.215 million yen and over 153.4 145.5 7.9 0.3 0.5 0.0Total 53,262.5 29,735.0 23,527.5 100.0 100.0 100.0Less than 1 million yen 8,370.5 1,705.6 6,664.9 15.7 5.7 28.31 to 1.99 million yen 9,722.4 2,955.1 6,767.3 18.3 9.9 28.82 to 2.99 million yen 10,164.7 5,413.9 4,750.8 19.1 18.2 20.23 to 3.99 million yen 7,314.3 5,003.3 2,311.0 13.7 16.8 9.84 to 4.99 million yen 5,350.4 4,142.1 1,208.3 10.0 13.9 5.15 to 6.99 million yen 6,312.0 5,239.3 1,072.7 11.9 17.6 4.67 to 9.99 million yen 4,218.7 3,748.3 470.4 7.9 12.6 2.010 to 14.99 million yen 1,095.7 1,041.4 54.3 2.1 3.5 0.215 million yen and over 157.5 146.9 10.6 0.3 0.5 0.0Total 275.0 -443.3 718.2 - - - Less than 1 million yen 440.0 167.2 272.8 0.8 0.7 0.31 to 1.99 million yen 414.2 199.6 214.5 0.6 0.9 0.02 to 2.99 million yen 207.5 124.3 83.2 0.3 0.7 -0.33 to 3.99 million yen 52.9 3.9 49.0 0.1 0.3 -0.14 to 4.99 million yen -27.2 -97.5 70.3 -0.1 -0.1 0.25 to 6.99 million yen -133.1 -199.7 66.6 -0.4 -0.4 0.17 to 9.99 million yen -626.2 -552.1 -74.0 -1.2 -1.7 -0.410 to 14.99 million yen -115.1 -112.7 -2.3 -0.3 -0.3 0.015 million yen and over -4.1 -1.4 -2.7 0.0 0.0 0.0
Cha
nge
Number Ratio
Both sexes Both sexesIncome
2012
2007
b. About 90% of female “Part-time workers” and “Arbeit (temporary workers)” earn less than 2 million yen. In the ratio for each main type of employment by income (annual earnings from the main job),
among “Regular staffs”, for males the highest ratio was “5 to 6.99 million yen” with 21.5%. Less than
5 million yen accounted for 58.9% of the whole, and less than 7 million yen accounted for 80.4%.
Among females, “2 to 2.99 million yen” had the highest ratio with 31.7%. Less than 3 million yen
accounted for 51.8% of the whole, and less than 5 million yen accounted for 84.0%.
Among “Part-time workers”, for males the highest ratio was “1 to 1.99 million yen” with 50.9%,
less than 2 million yen accounting for 79.2% of the whole. For females, the highest ratio was “less
than 1 million yen” with 51.5%, less than 2 million yen accounting for 93.0% of the whole.
In the category of “Arbeit (temporary workers)”, for males the highest ratio was “Less than 1
million yen” with 49.8%, less than 2 million yen accounting for 82.7% of the whole. For females,
similarly, the highest was “Less than 1 million yen” with 67.3%, less than 2 million yen accounting
for 93.2% of the whole. (Table I-24, Fig. I-15)
Table I-24: Ratio of employees (excluding executive of company or corporation) by sex, main type of employment and income / 2012
(%)Sex
Total 100.0 - 100.0 - 100.0 - Less than 1 million yen 1.8 (1.8) 0.7 (0.7) 4.1 (4.1)1 to 1.99 million yen 8.1 (9.9) 4.6 (5.3) 16.0 (20.1)2 to 2.99 million yen 21.9 (31.8) 17.4 (22.7) 31.7 (51.8)3 to 3.99 million yen 19.7 (51.5) 19.4 (42.1) 20.4 (72.2)4 to 4.99 million yen 15.2 (66.7) 16.8 (58.9) 11.8 (84.0)5 to 6.99 million yen 18.2 (84.9) 21.5 (80.4) 10.7 (94.7)7 to 9.99 million yen 10.7 (95.6) 13.8 (94.2) 3.7 (98.4)10 to 12.49 million yen 2.4 (98.0) 3.2 (97.4) 0.4 (98.8)12.5 to 14.99 million yen 0.6 (98.6) 0.8 (98.2) 0.1 (98.9)15 million yen and over 0.5 (99.1) 0.6 (98.8) 0.1 (99.0)Total 100.0 - 100.0 - 100.0 - Less than 1 million yen 49.0 (49.0) 28.3 (28.3) 51.5 (51.5)1 to 1.99 million yen 42.5 (91.5) 50.9 (79.2) 41.5 (93.0)2 to 2.99 million yen 6.6 (98.1) 16.0 (95.2) 5.4 (98.4)3 to 3.99 million yen 0.7 (98.8) 2.4 (97.6) 0.5 (98.9)4 to 4.99 million yen 0.2 (99.0) 0.5 (98.1) 0.1 (99.0)5 million yen and over 0.2 (99.2) 0.6 (98.7) 0.1 (99.1)Total 100.0 - 100.0 - 100.0 - Less than 1 million yen 58.5 (58.5) 49.8 (49.8) 67.3 (67.3)1 to 1.99 million yen 29.4 (87.9) 32.9 (82.7) 25.9 (93.2)2 to 2.99 million yen 8.8 (96.7) 12.6 (95.3) 4.9 (98.1)3 to 3.99 million yen 1.2 (97.9) 1.9 (97.2) 0.5 (98.6)4 to 4.99 million yen 0.2 (98.1) 0.4 (97.6) 0.1 (98.7)5 million yen and over 0.2 (98.3) 0.3 (97.9) 0.1 (98.8)
Note 1) Names used for types of employment such as “Part-time workers” and “Arbeit (temporary workers)” differ from workplace to workplace.
Note) In parentheses: Cumulative ratios
Regularstaffs
Part-timeworkers
Arbeit(temporary workers)
Both sexesMain type of employment 1)Income
Male Female
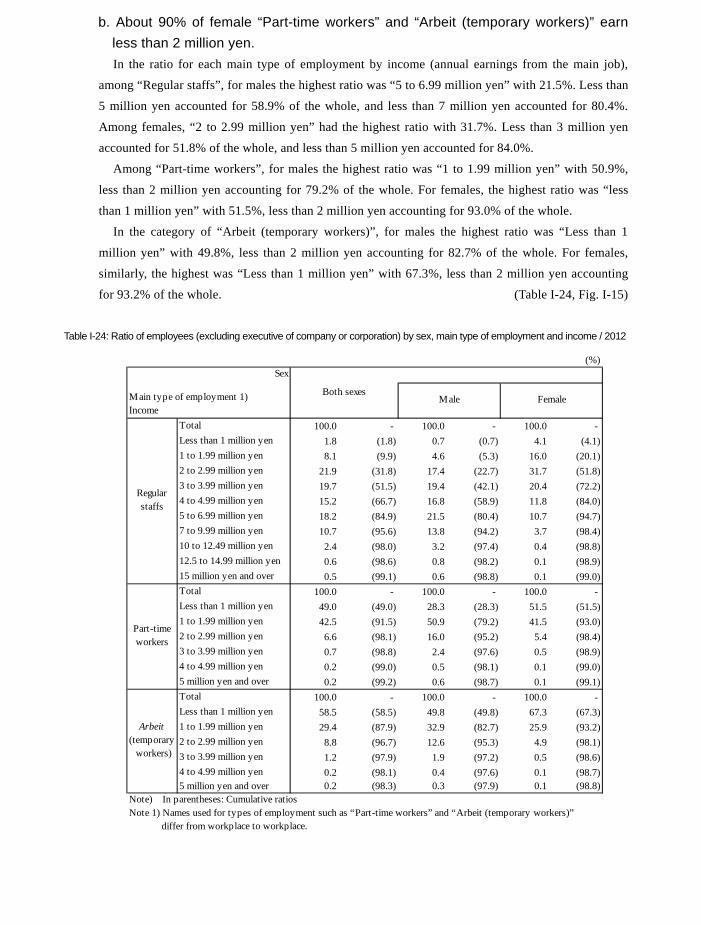
149
(4) Income (annual earnings from main job) a. The ratio of income of “Less than 4 million yen” increased, while that of “4 million
yen and over” decreased. Looking at employees (excluding executive of company or corporation) by income (annual
earnings from the main job), the ratio of “2 to 2.99 million yen” was highest with 19.4%, followed
by “1 to 1.99 million yen” (18.9%) and “Less than 100 million yen” (16.5%).
Compared to 2007, “Less than 1 million yen” increased by 0.8 points and “1 to 1.99 million yen”
by 0.6 points, while “7 to 9.99 million yen” decreased by 1.2 points and “5 to 6.99 million yen” by
0.4 points.
By sex, for males the ratio of “2 to 2.99 million yen” was highest with 18.9%, followed by “5 to
6.99 million yen” (17.2%) and “3 to 3.99 million yen” (17.1%). For females, the ratio of “1 to 1.99
million yen” was highest with 28.8%, followed by “Less than 1 million yen” (28.6%) and “2 to
2.99 million yen” (19.9%). (Table I-23)
Table I-23: Number and ratio of employees (excluding executive of company or corporation) by sex and income / 2007, 2012
(thousand persons, %, points)Sex
Male Female Male FemaleTotal 53,537.5 29,291.7 24,245.7 100.0 100.0 100.0Less than 1 million yen 8,810.5 1,872.8 6,937.7 16.5 6.4 28.61 to 1.99 million yen 10,136.6 3,154.7 6,981.8 18.9 10.8 28.82 to 2.99 million yen 10,372.2 5,538.2 4,834.0 19.4 18.9 19.93 to 3.99 million yen 7,367.2 5,007.2 2,360.0 13.8 17.1 9.74 to 4.99 million yen 5,323.2 4,044.6 1,278.6 9.9 13.8 5.35 to 6.99 million yen 6,178.9 5,039.6 1,139.3 11.5 17.2 4.77 to 9.99 million yen 3,592.5 3,196.2 396.4 6.7 10.9 1.610 to 14.99 million yen 980.6 928.7 52.0 1.8 3.2 0.215 million yen and over 153.4 145.5 7.9 0.3 0.5 0.0Total 53,262.5 29,735.0 23,527.5 100.0 100.0 100.0Less than 1 million yen 8,370.5 1,705.6 6,664.9 15.7 5.7 28.31 to 1.99 million yen 9,722.4 2,955.1 6,767.3 18.3 9.9 28.82 to 2.99 million yen 10,164.7 5,413.9 4,750.8 19.1 18.2 20.23 to 3.99 million yen 7,314.3 5,003.3 2,311.0 13.7 16.8 9.84 to 4.99 million yen 5,350.4 4,142.1 1,208.3 10.0 13.9 5.15 to 6.99 million yen 6,312.0 5,239.3 1,072.7 11.9 17.6 4.67 to 9.99 million yen 4,218.7 3,748.3 470.4 7.9 12.6 2.010 to 14.99 million yen 1,095.7 1,041.4 54.3 2.1 3.5 0.215 million yen and over 157.5 146.9 10.6 0.3 0.5 0.0Total 275.0 -443.3 718.2 - - - Less than 1 million yen 440.0 167.2 272.8 0.8 0.7 0.31 to 1.99 million yen 414.2 199.6 214.5 0.6 0.9 0.02 to 2.99 million yen 207.5 124.3 83.2 0.3 0.7 -0.33 to 3.99 million yen 52.9 3.9 49.0 0.1 0.3 -0.14 to 4.99 million yen -27.2 -97.5 70.3 -0.1 -0.1 0.25 to 6.99 million yen -133.1 -199.7 66.6 -0.4 -0.4 0.17 to 9.99 million yen -626.2 -552.1 -74.0 -1.2 -1.7 -0.410 to 14.99 million yen -115.1 -112.7 -2.3 -0.3 -0.3 0.015 million yen and over -4.1 -1.4 -2.7 0.0 0.0 0.0
Cha
nge
Number Ratio
Both sexes Both sexesIncome
2012
2007
b. About 90% of female “Part-time workers” and “Arbeit (temporary workers)” earn less than 2 million yen. In the ratio for each main type of employment by income (annual earnings from the main job),
among “Regular staffs”, for males the highest ratio was “5 to 6.99 million yen” with 21.5%. Less than
5 million yen accounted for 58.9% of the whole, and less than 7 million yen accounted for 80.4%.
Among females, “2 to 2.99 million yen” had the highest ratio with 31.7%. Less than 3 million yen
accounted for 51.8% of the whole, and less than 5 million yen accounted for 84.0%.
Among “Part-time workers”, for males the highest ratio was “1 to 1.99 million yen” with 50.9%,
less than 2 million yen accounting for 79.2% of the whole. For females, the highest ratio was “less
than 1 million yen” with 51.5%, less than 2 million yen accounting for 93.0% of the whole.
In the category of “Arbeit (temporary workers)”, for males the highest ratio was “Less than 1
million yen” with 49.8%, less than 2 million yen accounting for 82.7% of the whole. For females,
similarly, the highest was “Less than 1 million yen” with 67.3%, less than 2 million yen accounting
for 93.2% of the whole. (Table I-24, Fig. I-15)
Table I-24: Ratio of employees (excluding executive of company or corporation) by sex, main type of employment and income / 2012
(%)Sex
Total 100.0 - 100.0 - 100.0 - Less than 1 million yen 1.8 (1.8) 0.7 (0.7) 4.1 (4.1)1 to 1.99 million yen 8.1 (9.9) 4.6 (5.3) 16.0 (20.1)2 to 2.99 million yen 21.9 (31.8) 17.4 (22.7) 31.7 (51.8)3 to 3.99 million yen 19.7 (51.5) 19.4 (42.1) 20.4 (72.2)4 to 4.99 million yen 15.2 (66.7) 16.8 (58.9) 11.8 (84.0)5 to 6.99 million yen 18.2 (84.9) 21.5 (80.4) 10.7 (94.7)7 to 9.99 million yen 10.7 (95.6) 13.8 (94.2) 3.7 (98.4)10 to 12.49 million yen 2.4 (98.0) 3.2 (97.4) 0.4 (98.8)12.5 to 14.99 million yen 0.6 (98.6) 0.8 (98.2) 0.1 (98.9)15 million yen and over 0.5 (99.1) 0.6 (98.8) 0.1 (99.0)Total 100.0 - 100.0 - 100.0 - Less than 1 million yen 49.0 (49.0) 28.3 (28.3) 51.5 (51.5)1 to 1.99 million yen 42.5 (91.5) 50.9 (79.2) 41.5 (93.0)2 to 2.99 million yen 6.6 (98.1) 16.0 (95.2) 5.4 (98.4)3 to 3.99 million yen 0.7 (98.8) 2.4 (97.6) 0.5 (98.9)4 to 4.99 million yen 0.2 (99.0) 0.5 (98.1) 0.1 (99.0)5 million yen and over 0.2 (99.2) 0.6 (98.7) 0.1 (99.1)Total 100.0 - 100.0 - 100.0 - Less than 1 million yen 58.5 (58.5) 49.8 (49.8) 67.3 (67.3)1 to 1.99 million yen 29.4 (87.9) 32.9 (82.7) 25.9 (93.2)2 to 2.99 million yen 8.8 (96.7) 12.6 (95.3) 4.9 (98.1)3 to 3.99 million yen 1.2 (97.9) 1.9 (97.2) 0.5 (98.6)4 to 4.99 million yen 0.2 (98.1) 0.4 (97.6) 0.1 (98.7)5 million yen and over 0.2 (98.3) 0.3 (97.9) 0.1 (98.8)
Note 1) Names used for types of employment such as “Part-time workers” and “Arbeit (temporary workers)” differ from workplace to workplace.
Note) In parentheses: Cumulative ratios
Regularstaffs
Part-timeworkers
Arbeit(temporary workers)
Both sexesMain type of employment 1)Income
Male Female
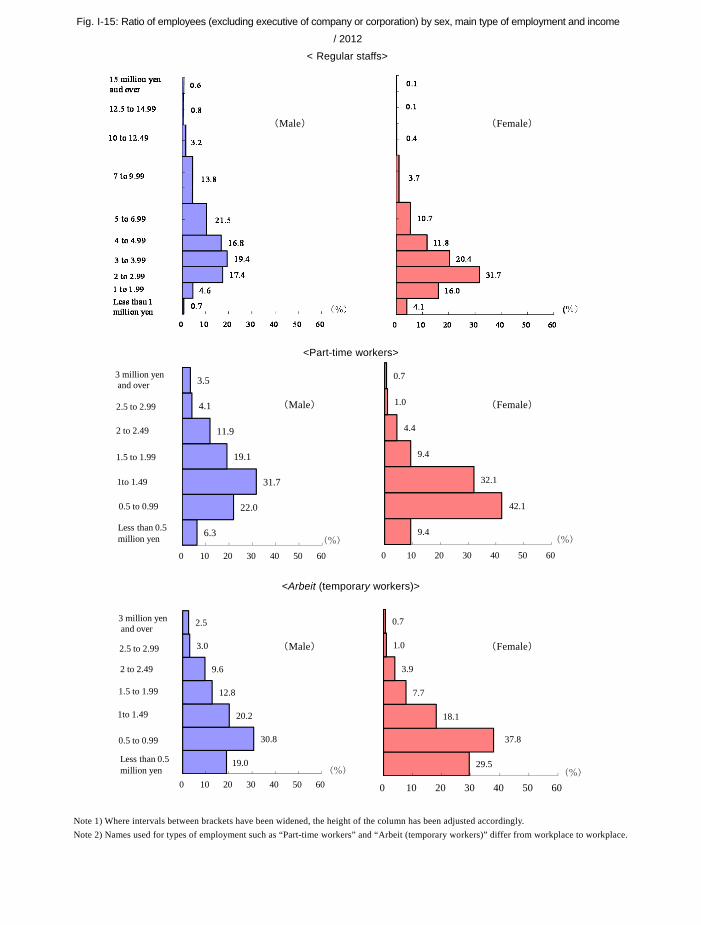
150
Fig. I-15: Ratio of employees (excluding executive of company or corporation) by sex, main type of employment and income
/ 2012
< Regular staffs>
<Part-time workers>
<Arbeit (temporary workers)>
Note 1) Where intervals between brackets have been widened, the height of the column has been adjusted accordingly. Note 2) Names used for types of employment such as “Part-time workers” and “Arbeit (temporary workers)” differ from workplace to workplace.
6.3
22.0
31.7
19.1
11.9
4.1
3.5
0 10 20 30 40 50 60
(%)
Less than 0.5million yen
0.5 to 0.99
1to 1.49
1.5 to 1.99
2 to 2.49
2.5 to 2.99
3 million yenand over
9.4
42.1
32.1
9.4
4.4
1.0
0.7
0 10 20 30 40 50 60
(%)
19.0
30.8
20.2
12.8
9.6
3.0
2.5
0 10 20 30 40 50 60(%)
Less than 0.5million yen
0.5 to 0.99
1to 1.49
1.5 to 1.99
2 to 2.49
2.5 to 2.99
3 million yenand over
29.5
37.8
18.1
7.7
3.9
1.0
0.7
0 10 20 30 40 50 60(%)
(Male) (Female)
(Male) (Female)
(Male) (Female)
(千人,%,ポイント)
平成24年 平成19年 平成14年 平成24年 平成19年 平成24年 平成19年
総数 64,420.7 65,977.5 65,009.3 -1,556.8 968.2 -2.4 1.5
男 36,744.5 38,174.8 38,034.1 -1,430.3 140.7 -3.7 0.4
女 27,676.2 27,802.7 26,975.3 -126.5 827.4 -0.5 3.1
総数 11,905.2 12,651.1 12,564.4 -745.9 86.7 -5.9 0.7
男 5,934.1 6,440.4 6,452.1 -506.3 -11.7 -7.9 -0.2
女 5,971.2 6,210.6 6,112.4 -239.4 98.2 -3.9 1.6
総数 18.5 19.2 19.3 -0.7 -0.1
男 16.1 16.9 17.0 -0.8 -0.1
女 21.6 22.3 22.7 -0.7 -0.4
有業者
実数
占
め
る
割
合
有
業
者
に
①転職就業者
実数
実数 増減率増減
4. Change of labour force status (1) Persons engaged and not engaged in work, who had left their previous job during the
past five years a. Persons engaged in work who had a previous job decrease in number.
The population aged 15 and over who had left their previous job during the past five years
numbered 21,709 thousand in 2012, a decrease by 622 thousand (2.8%) from 2007. Among them,
persons who took up a new job after leaving their previous jobs (hereinafter referred to as “persons
engaged in work who had a previous job”) numbered 11,905 thousand, a decrease by 746 thousand
(5.9%) from 2007, while persons not engaged in work after leaving their previous job (hereinafter
referred to as “persons not engaged in work who had a previous job”) numbered 9,804 thousand, an
increase by 124 thousand (1.3%) from 2007.
In trends by sex, among males the number of persons engaged in work who had a previous job
decreased in both 2007 and 2012, while persons not engaged in work who had a previous job
decreased in 2007 but increased in 2012. Among females, persons engaged in work who had a
previous job increased in 2007 but decreased in 2012, while persons not engaged in work who had
a previous job decreased in both cases. (Table I-25/26/27)
Table I-25: Trends in number and ratio of the population aged 15 and over who left their previous job during the past
five years by sex / 2002-2012
Table I-26: Trends in number and ratio of persons engaged in work who had a previous job during the past five years by
sex / 2002-2012
(thousand persons, %)
2012 2007 2002 2012 2007 2012 2007Both sexes 21,709.1 22,331.5 24,029.5 -622.4 -1,698.0 -2.8 -7.1
Male 10,091.7 10,185.2 11,085.4 -93.5 -900.2 -0.9 -8.1
Female 11,617.5 12,146.2 12,944.1 -528.7 -797.9 -4.4 -6.2
Number Change Increase-decrease rate
Persons who lefttheir previous jobs
during the pastfive years (①+②)
(thousand persons, %, points)
2012 2007 2002 2012 2007 2012 2007Both sexes 64,420.7 65,977.5 65,009.3 -1,556.8 968.2 -2.4 1.5
Male 36,744.5 38,174.8 38,034.1 -1,430.3 140.7 -3.7 0.4
Female 27,676.2 27,802.7 26,975.3 -126.5 827.4 -0.5 3.1
Both sexes 11,905.2 12,651.1 12,564.4 -745.9 86.7 -5.9 0.7
Male 5,934.1 6,440.4 6,452.1 -506.3 -11.7 -7.9 -0.2
Female 5,971.2 6,210.6 6,112.4 -239.4 98.2 -3.9 1.6
Both sexes 18.5 19.2 19.3 -0.7 -0.1
Male 16.1 16.9 17.0 -0.8 -0.1
Female 21.6 22.3 22.7 -0.7 -0.4①Pe
rson
s eng
aged
in w
ork
who
had
a p
revi
ous j
ob
Num
ber
Rat
io to
all
pers
ons
enga
ged
in w
ork
Number Change Increase-decrease rate
Pers
ons
enga
ged
in w
ork
Num
ber
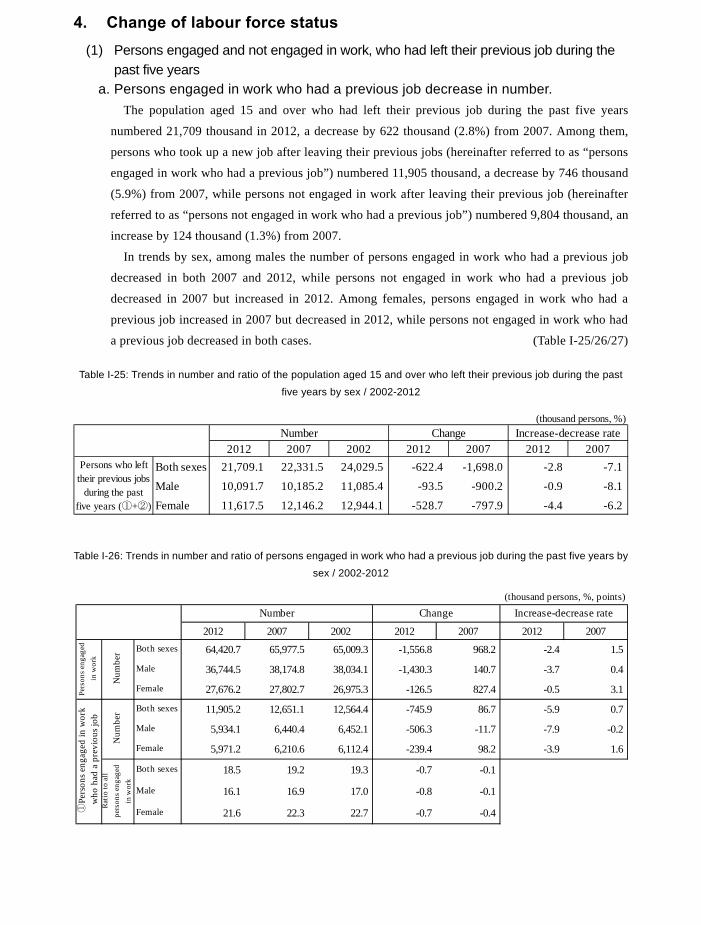
151
Fig. I-15: Ratio of employees (excluding executive of company or corporation) by sex, main type of employment and income
/ 2012
< Regular staffs>
<Part-time workers>
<Arbeit (temporary workers)>
Note 1) Where intervals between brackets have been widened, the height of the column has been adjusted accordingly. Note 2) Names used for types of employment such as “Part-time workers” and “Arbeit (temporary workers)” differ from workplace to workplace.
6.3
22.0
31.7
19.1
11.9
4.1
3.5
0 10 20 30 40 50 60
(%)
Less than 0.5million yen
0.5 to 0.99
1to 1.49
1.5 to 1.99
2 to 2.49
2.5 to 2.99
3 million yenand over
9.4
42.1
32.1
9.4
4.4
1.0
0.7
0 10 20 30 40 50 60
(%)
19.0
30.8
20.2
12.8
9.6
3.0
2.5
0 10 20 30 40 50 60(%)
Less than 0.5million yen
0.5 to 0.99
1to 1.49
1.5 to 1.99
2 to 2.49
2.5 to 2.99
3 million yenand over
29.5
37.8
18.1
7.7
3.9
1.0
0.7
0 10 20 30 40 50 60(%)
(Male) (Female)
(Male) (Female)
(Male) (Female)
(千人,%,ポイント)
平成24年 平成19年 平成14年 平成24年 平成19年 平成24年 平成19年
総数 64,420.7 65,977.5 65,009.3 -1,556.8 968.2 -2.4 1.5
男 36,744.5 38,174.8 38,034.1 -1,430.3 140.7 -3.7 0.4
女 27,676.2 27,802.7 26,975.3 -126.5 827.4 -0.5 3.1
総数 11,905.2 12,651.1 12,564.4 -745.9 86.7 -5.9 0.7
男 5,934.1 6,440.4 6,452.1 -506.3 -11.7 -7.9 -0.2
女 5,971.2 6,210.6 6,112.4 -239.4 98.2 -3.9 1.6
総数 18.5 19.2 19.3 -0.7 -0.1
男 16.1 16.9 17.0 -0.8 -0.1
女 21.6 22.3 22.7 -0.7 -0.4
有業者
実数
占
め
る
割
合
有
業
者
に
①転職就業者
実数
実数 増減率増減
4. Change of labour force status (1) Persons engaged and not engaged in work, who had left their previous job during the
past five years a. Persons engaged in work who had a previous job decrease in number.
The population aged 15 and over who had left their previous job during the past five years
numbered 21,709 thousand in 2012, a decrease by 622 thousand (2.8%) from 2007. Among them,
persons who took up a new job after leaving their previous jobs (hereinafter referred to as “persons
engaged in work who had a previous job”) numbered 11,905 thousand, a decrease by 746 thousand
(5.9%) from 2007, while persons not engaged in work after leaving their previous job (hereinafter
referred to as “persons not engaged in work who had a previous job”) numbered 9,804 thousand, an
increase by 124 thousand (1.3%) from 2007.
In trends by sex, among males the number of persons engaged in work who had a previous job
decreased in both 2007 and 2012, while persons not engaged in work who had a previous job
decreased in 2007 but increased in 2012. Among females, persons engaged in work who had a
previous job increased in 2007 but decreased in 2012, while persons not engaged in work who had
a previous job decreased in both cases. (Table I-25/26/27)
Table I-25: Trends in number and ratio of the population aged 15 and over who left their previous job during the past
five years by sex / 2002-2012
Table I-26: Trends in number and ratio of persons engaged in work who had a previous job during the past five years by
sex / 2002-2012
(thousand persons, %)
2012 2007 2002 2012 2007 2012 2007Both sexes 21,709.1 22,331.5 24,029.5 -622.4 -1,698.0 -2.8 -7.1
Male 10,091.7 10,185.2 11,085.4 -93.5 -900.2 -0.9 -8.1
Female 11,617.5 12,146.2 12,944.1 -528.7 -797.9 -4.4 -6.2
Number Change Increase-decrease rate
Persons who lefttheir previous jobs
during the pastfive years (①+②)
(thousand persons, %, points)
2012 2007 2002 2012 2007 2012 2007Both sexes 64,420.7 65,977.5 65,009.3 -1,556.8 968.2 -2.4 1.5
Male 36,744.5 38,174.8 38,034.1 -1,430.3 140.7 -3.7 0.4
Female 27,676.2 27,802.7 26,975.3 -126.5 827.4 -0.5 3.1
Both sexes 11,905.2 12,651.1 12,564.4 -745.9 86.7 -5.9 0.7
Male 5,934.1 6,440.4 6,452.1 -506.3 -11.7 -7.9 -0.2
Female 5,971.2 6,210.6 6,112.4 -239.4 98.2 -3.9 1.6
Both sexes 18.5 19.2 19.3 -0.7 -0.1
Male 16.1 16.9 17.0 -0.8 -0.1
Female 21.6 22.3 22.7 -0.7 -0.4①Pe
rson
s eng
aged
in w
ork
who
had
a p
revi
ous j
ob
Num
ber
Rat
io to
all
pers
ons
enga
ged
in w
ork
Number Change Increase-decrease rate
Pers
ons
enga
ged
in w
ork
Num
ber
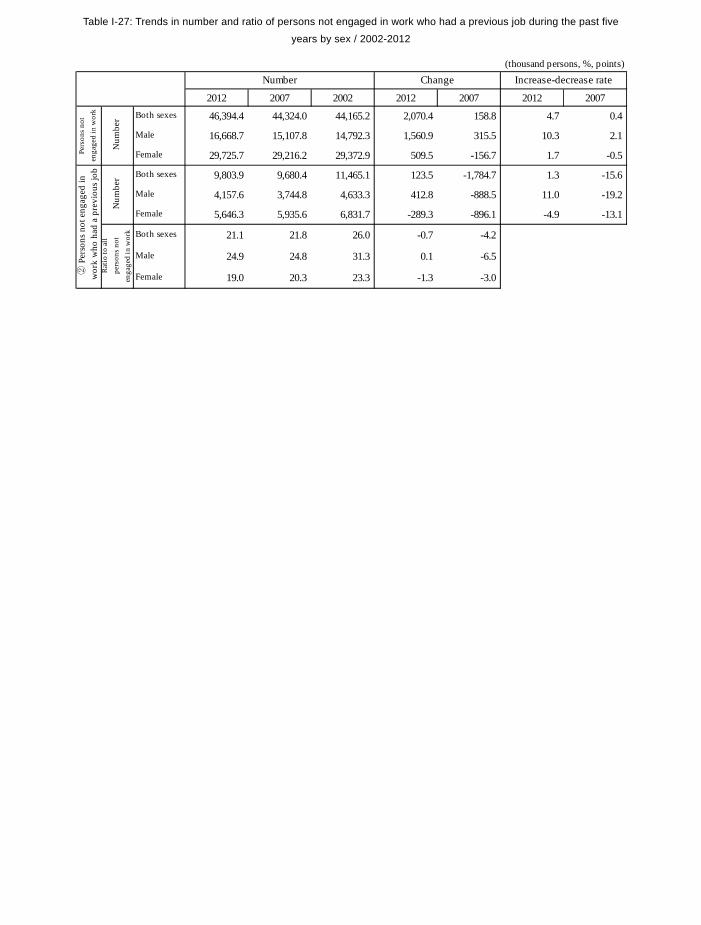
152
Table I-27: Trends in number and ratio of persons not engaged in work who had a previous job during the past five
years by sex / 2002-2012
(thousand persons, %, points)
2012 2007 2002 2012 2007 2012 2007Both sexes 46,394.4 44,324.0 44,165.2 2,070.4 158.8 4.7 0.4
Male 16,668.7 15,107.8 14,792.3 1,560.9 315.5 10.3 2.1
Female 29,725.7 29,216.2 29,372.9 509.5 -156.7 1.7 -0.5
Both sexes 9,803.9 9,680.4 11,465.1 123.5 -1,784.7 1.3 -15.6
Male 4,157.6 3,744.8 4,633.3 412.8 -888.5 11.0 -19.2
Female 5,646.3 5,935.6 6,831.7 -289.3 -896.1 -4.9 -13.1
Both sexes 21.1 21.8 26.0 -0.7 -4.2
Male 24.9 24.8 31.3 0.1 -6.5
Female 19.0 20.3 23.3 -1.3 -3.0② P
erso
ns n
ot e
ngag
ed in
wor
k w
ho h
ad a
pre
viou
s job
Num
ber
Rat
io to
all
pers
ons
not
enga
ged
in w
ork
Number Change Increase-decrease ratePe
rson
s no
ten
gage
d in
wor
k
Num
ber
(thousand persons, %,)Sex
Age Male Female Male FemaleTotal 5,934.1 5,971.2 100.0 100.015 to 19 years old 57.5 91.2 1.0 1.5
20 to 24 454.1 580.4 7.7 9.7
25 to 29 861.1 929.6 14.5 15.6
30 to 34 867.0 885.4 14.6 14.8
35 to 39 751.8 800.9 12.7 13.4
40 to 44 545.0 745.3 9.2 12.5
45 to 49 416.9 626.0 7.0 10.5
50 to 54 344.7 478.8 5.8 8.0
55 to 59 400.5 356.7 6.7 6.0
60 to 64 810.6 325.4 13.7 5.4
65 years old and over 424.9 151.3 7.2 2.5
Number Ratio
b. Persons engaged in work who had a previous job in their 20s and 30s account for about 50% among both males and females.
Looking at persons engaged in work who had a previous job during the past five years by sex
and age group, among males the most numerous age group was “30 to 34 years old” with 867
thousand (accounting for 14.6% of all males engaged in work who had a previous job), followed by
“25 to 29” with 861 thousand (14.5%) and “35 to 39” with 752 thousand (12.7%). Among females,
the most numerous age group was “25 to 29” with 930 thousand (accounting for 15.6% of all
females engaged in work who had a previous job), followed by “30 to 34” with 885 thousand
(14.8%) and “35 to 39” with 801 thousand (13.4%). Those in their 20s and 30s accounted for about
50% of persons engaged in work who had a previous job for both males and females.
Among males, a little over 20% of all persons engaged in work who had a previous job were
those aged 60 and over. (Fig. I-16, Table I-28)
Fig. I-16: Number of persons engaged in work who had a previous job during the past five years by sex and age group / 2012
Table I-28: Number and ratio of persons engaged in work who had a previous job during the past five years
by sex and age group / 2012
0 200 400 600 800 1,000
15 to 19 years old
20 to 24
25 to 29
30 to 34
35 to 39
40 to 44
45 to 49
50 to 54
55 to 59
60 to 64
65 years old and over (thousand
persons)
Male
Female
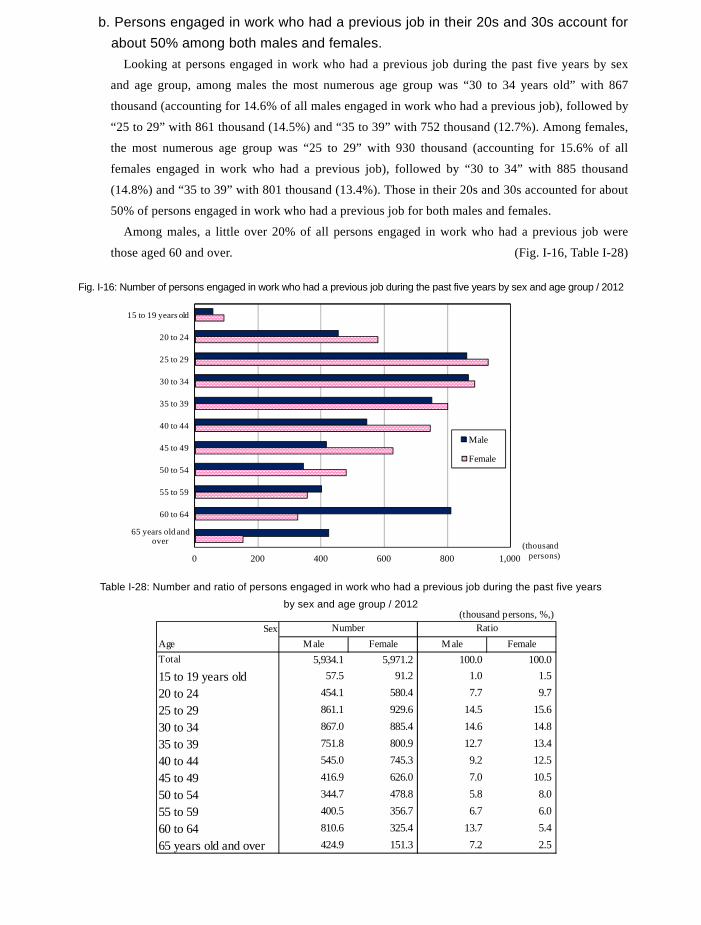
153
Table I-27: Trends in number and ratio of persons not engaged in work who had a previous job during the past five
years by sex / 2002-2012
(thousand persons, %, points)
2012 2007 2002 2012 2007 2012 2007Both sexes 46,394.4 44,324.0 44,165.2 2,070.4 158.8 4.7 0.4
Male 16,668.7 15,107.8 14,792.3 1,560.9 315.5 10.3 2.1
Female 29,725.7 29,216.2 29,372.9 509.5 -156.7 1.7 -0.5
Both sexes 9,803.9 9,680.4 11,465.1 123.5 -1,784.7 1.3 -15.6
Male 4,157.6 3,744.8 4,633.3 412.8 -888.5 11.0 -19.2
Female 5,646.3 5,935.6 6,831.7 -289.3 -896.1 -4.9 -13.1
Both sexes 21.1 21.8 26.0 -0.7 -4.2
Male 24.9 24.8 31.3 0.1 -6.5
Female 19.0 20.3 23.3 -1.3 -3.0② P
erso
ns n
ot e
ngag
ed in
wor
k w
ho h
ad a
pre
viou
s job
Num
ber
Rat
io to
all
pers
ons
not
enga
ged
in w
ork
Number Change Increase-decrease rate
Pers
ons
not
enga
ged
in w
ork
Num
ber
(thousand persons, %,)Sex
Age Male Female Male FemaleTotal 5,934.1 5,971.2 100.0 100.015 to 19 years old 57.5 91.2 1.0 1.5
20 to 24 454.1 580.4 7.7 9.7
25 to 29 861.1 929.6 14.5 15.6
30 to 34 867.0 885.4 14.6 14.8
35 to 39 751.8 800.9 12.7 13.4
40 to 44 545.0 745.3 9.2 12.5
45 to 49 416.9 626.0 7.0 10.5
50 to 54 344.7 478.8 5.8 8.0
55 to 59 400.5 356.7 6.7 6.0
60 to 64 810.6 325.4 13.7 5.4
65 years old and over 424.9 151.3 7.2 2.5
Number Ratio
b. Persons engaged in work who had a previous job in their 20s and 30s account for about 50% among both males and females.
Looking at persons engaged in work who had a previous job during the past five years by sex
and age group, among males the most numerous age group was “30 to 34 years old” with 867
thousand (accounting for 14.6% of all males engaged in work who had a previous job), followed by
“25 to 29” with 861 thousand (14.5%) and “35 to 39” with 752 thousand (12.7%). Among females,
the most numerous age group was “25 to 29” with 930 thousand (accounting for 15.6% of all
females engaged in work who had a previous job), followed by “30 to 34” with 885 thousand
(14.8%) and “35 to 39” with 801 thousand (13.4%). Those in their 20s and 30s accounted for about
50% of persons engaged in work who had a previous job for both males and females.
Among males, a little over 20% of all persons engaged in work who had a previous job were
those aged 60 and over. (Fig. I-16, Table I-28)
Fig. I-16: Number of persons engaged in work who had a previous job during the past five years by sex and age group / 2012
Table I-28: Number and ratio of persons engaged in work who had a previous job during the past five years
by sex and age group / 2012
0 200 400 600 800 1,000
15 to 19 years old
20 to 24
25 to 29
30 to 34
35 to 39
40 to 44
45 to 49
50 to 54
55 to 59
60 to 64
65 years old and over (thousand
persons)
Male
Female
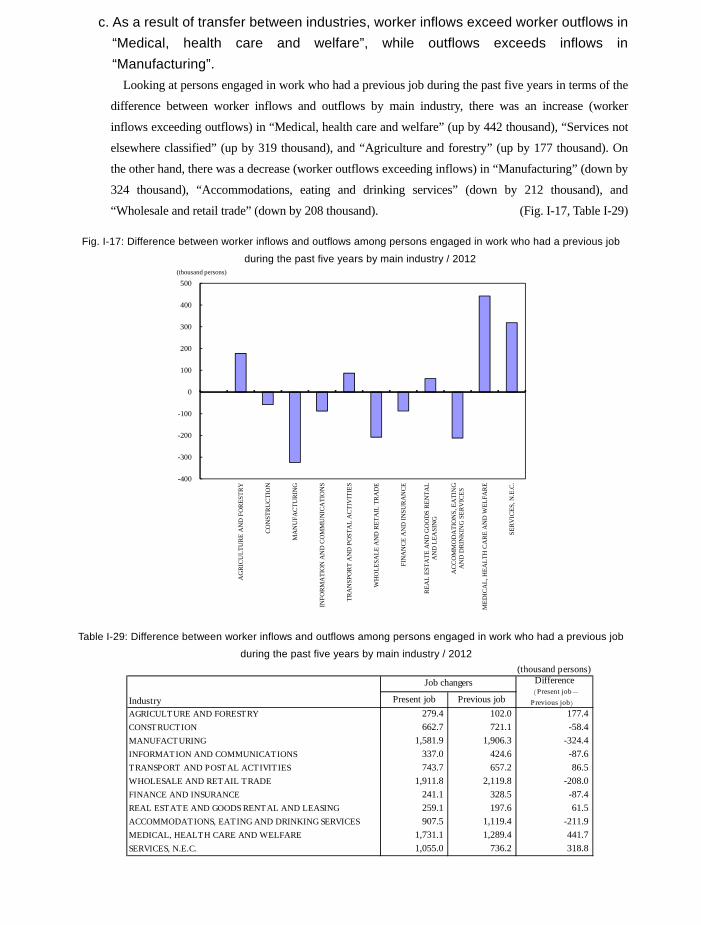
154
c. As a result of transfer between industries, worker inflows exceed worker outflows in “Medical, health care and welfare”, while outflows exceeds inflows in “Manufacturing”.
Looking at persons engaged in work who had a previous job during the past five years in terms of the
difference between worker inflows and outflows by main industry, there was an increase (worker
inflows exceeding outflows) in “Medical, health care and welfare” (up by 442 thousand), “Services not
elsewhere classified” (up by 319 thousand), and “Agriculture and forestry” (up by 177 thousand). On
the other hand, there was a decrease (worker outflows exceeding inflows) in “Manufacturing” (down by
324 thousand), “Accommodations, eating and drinking services” (down by 212 thousand), and
“Wholesale and retail trade” (down by 208 thousand). (Fig. I-17, Table I-29)
Fig. I-17: Difference between worker inflows and outflows among persons engaged in work who had a previous job
during the past five years by main industry / 2012
Table I-29: Difference between worker inflows and outflows among persons engaged in work who had a previous job
during the past five years by main industry / 2012
(thousand persons)
Industry Present job Previous jobAGRICULTURE AND FORESTRY 279.4 102.0 177.4CONSTRUCTION 662.7 721.1 -58.4MANUFACTURING 1,581.9 1,906.3 -324.4INFORMATION AND COMMUNICATIONS 337.0 424.6 -87.6TRANSPORT AND POSTAL ACTIVITIES 743.7 657.2 86.5WHOLESALE AND RETAIL TRADE 1,911.8 2,119.8 -208.0FINANCE AND INSURANCE 241.1 328.5 -87.4REAL ESTATE AND GOODS RENTAL AND LEASING 259.1 197.6 61.5ACCOMMODATIONS, EATING AND DRINKING SERVICES 907.5 1,119.4 -211.9MEDICAL, HEALTH CARE AND WELFARE 1,731.1 1,289.4 441.7SERVICES, N.E.C. 1,055.0 736.2 318.8
Job changers Difference(Present job-Previous job)
-400
-300
-200
-100
0
100
200
300
400
500
AG
RIC
ULT
UR
E A
ND
FO
RES
TRY
CON
STR
UC
TIO
N
MA
NU
FACT
UR
ING
INFO
RM
ATI
ON
AN
D C
OM
MU
NIC
ATI
ON
S
TRA
NSP
ORT
AN
D P
OST
AL
AC
TIV
ITIE
S
WH
OLE
SALE
AN
D R
ETA
IL T
RA
DE
FIN
AN
CE
AN
D IN
SUR
AN
CE
REA
L ES
TATE
AN
D G
OO
DS
REN
TAL
AN
D L
EASI
NG
AC
CO
MM
OD
ATI
ON
S, E
ATI
NG
AN
D D
RIN
KIN
G S
ERV
ICES
MED
ICA
L, H
EALT
H C
AR
E A
ND
WEL
FAR
E
SER
VIC
ES, N
.E.C
.
(thousand persons)
d. High ratio of transfers within the same industry “Medical, health care and welfare” (present job) and “Services not elsewhere classified” (present
job) were the industries in which incoming workers outnumbered outgoing ones. Looking at the
industry of the previous job in those industries (ratio to the industry of the present job), “Medical,
health care and welfare” and “Services not elsewhere classified” accounted for 48.2% and 18.8%,
respectively, which means the ratio of transfers within the same industry was highest. As for other
industries, the ratio of transfers within the same industry was also highest in all industries, except
“Agriculture and forestry” and “Real estate and goods rental and leasing”.
Conversely, “Manufacturing” (previous job) was the industry in which outgoing workers were
outnumbered by incoming ones most remarkably. Looking at the industry of the present job (ratio
to the industry of the previous job), “Manufacturing” was highest with 38.4%, followed by
“Wholesale and retail trade” (12.9%). (Table I-30)
Table I-30: Number and ratio of persons engaged in work who had a previous job during the past five years by main industry of the previous job and main industry of the present job / 2012
<Number> (thousand persons)Industry of the previous job
Industry of the present jobTotal 1) 11,905.2 102.0 721.1 1,906.3 424.6 657.2 2,119.8 328.5 197.6 1,119.4 1,289.4 736.2AGRICULTURE AND FORESTRY 279.4 30.3 31.3 59.5 4.2 15.5 35.8 4.0 2.1 13.4 14.4 13.9CONSTRUCTION 662.7 8.1 297.6 80.0 14.4 36.2 62.0 9.6 13.1 26.6 14.1 31.6MANUFACTURING 1,581.9 13.5 75.0 732.6 38.0 65.7 210.9 24.1 16.1 96.1 47.4 76.2INFORMATION AND COMMUNICATIONS 337.0 0.0 6.9 27.0 147.2 5.8 39.4 10.6 5.9 10.2 6.6 25.6TRANSPORT AND POSTAL ACTIVITIES 743.7 5.4 44.6 113.5 12.3 255.4 98.4 9.3 10.3 39.2 19.5 45.7WHOLESALE AND RETAIL TRADE 1,911.8 12.5 63.0 246.8 43.9 72.8 772.9 44.9 29.0 190.7 91.8 90.7FINANCE AND INSURANCE 241.1 0.8 4.8 17.4 9.4 5.1 38.7 80.6 5.5 16.4 11.7 14.4REAL ESTATE AND GOODS RENTAL AND LEASING 259.1 1.7 19.1 26.7 7.7 13.4 46.0 11.8 38.8 14.7 12.2 18.2ACCOMMODATIONS, EATING AND DRINKING SERVICES 907.5 4.7 19.8 84.5 11.8 26.1 167.6 14.4 10.0 370.5 47.7 36.5MEDICAL, HEALTH CARE AND WELFARE 1,731.1 6.4 27.2 136.6 19.0 37.4 205.3 32.9 14.5 124.0 834.6 63.9SERVICES, N.E.C. 1,055.0 7.2 53.2 168.8 47.6 58.6 158.6 29.9 24.3 69.2 52.3 197.9Note 1) Including "Industries unable to classify".
REAL ESTATEAND GOODSRENTAL AND
LEASING
ACCOMMODATIONS,EATING AND
DRINKING SERVICESSERVICES, N.E.C.
Total 1)
AGRICULTUREAND FORESTRY
CONSTRUCTION MANUFACTURINGINFORMATION
ANDCOMMUNICATIONS
TRANSPORT ANDPOSTAL
ACTIVITIES
WHOLESALE ANDRETAIL TRADE
FINANCE ANDINSURANCE
MEDICAL,HEALTH CAREAND WELFARE
<Ratio based on current job as 100> (%)Industry of the previous job
Industry of the present jobTotal 1) 100.0 0.9 6.1 16.0 3.6 5.5 17.8 2.8 1.7 9.4 10.8 6.2AGRICULTURE AND FORESTRY 100.0 10.8 11.2 21.3 1.5 5.5 12.8 1.4 0.8 4.8 5.2 5.0CONSTRUCTION 100.0 1.2 44.9 12.1 2.2 5.5 9.4 1.4 2.0 4.0 2.1 4.8MANUFACTURING 100.0 0.9 4.7 46.3 2.4 4.2 13.3 1.5 1.0 6.1 3.0 4.8INFORMATION AND COMMUNICATIONS 100.0 0.0 2.0 8.0 43.7 1.7 11.7 3.1 1.8 3.0 2.0 7.6TRANSPORT AND POSTAL ACTIVITIES 100.0 0.7 6.0 15.3 1.7 34.3 13.2 1.3 1.4 5.3 2.6 6.1WHOLESALE AND RETAIL TRADE 100.0 0.7 3.3 12.9 2.3 3.8 40.4 2.3 1.5 10.0 4.8 4.7FINANCE AND INSURANCE 100.0 0.3 2.0 7.2 3.9 2.1 16.1 33.4 2.3 6.8 4.9 6.0REAL ESTATE AND GOODS RENTAL AND LEASING 100.0 0.7 7.4 10.3 3.0 5.2 17.8 4.6 15.0 5.7 4.7 7.0ACCOMMODATIONS, EATING AND DRINKING SERVICES 100.0 0.5 2.2 9.3 1.3 2.9 18.5 1.6 1.1 40.8 5.3 4.0MEDICAL, HEALTH CARE AND WELFARE 100.0 0.4 1.6 7.9 1.1 2.2 11.9 1.9 0.8 7.2 48.2 3.7SERVICES, N.E.C. 100.0 0.7 5.0 16.0 4.5 5.6 15.0 2.8 2.3 6.6 5.0 18.8Note 1) Including "Industries unable to classify".
REAL ESTATEAND GOODSRENTAL AND
LEASING
ACCOMMODATIONS,EATING AND
DRINKING SERVICESSERVICES, N.E.C.
Total 1)
AGRICULTUREAND FORESTRY
CONSTRUCTION MANUFACTURINGINFORMATION
ANDCOMMUNICATIONS
TRANSPORT ANDPOSTAL
ACTIVITIES
WHOLESALE ANDRETAIL TRADE
FINANCE ANDINSURANCE
MEDICAL,HEALTH CAREAND WELFARE
<Ratio based on previous job as 100> (%)Industry of the previous job
Industry of the present jobTotal 1) 100.0 100.0 100.0 100.0 100.0 100.0 100.0 100.0 100.0 100.0 100.0 100.0AGRICULTURE AND FORESTRY 2.3 29.7 4.3 3.1 1.0 2.4 1.7 1.2 1.1 1.2 1.1 1.9CONSTRUCTION 5.6 7.9 41.3 4.2 3.4 5.5 2.9 2.9 6.6 2.4 1.1 4.3MANUFACTURING 13.3 13.2 10.4 38.4 8.9 10.0 9.9 7.3 8.1 8.6 3.7 10.4INFORMATION AND COMMUNICATIONS 2.8 0.0 1.0 1.4 34.7 0.9 1.9 3.2 3.0 0.9 0.5 3.5TRANSPORT AND POSTAL ACTIVITIES 6.2 5.3 6.2 6.0 2.9 38.9 4.6 2.8 5.2 3.5 1.5 6.2WHOLESALE AND RETAIL TRADE 16.1 12.3 8.7 12.9 10.3 11.1 36.5 13.7 14.7 17.0 7.1 12.3FINANCE AND INSURANCE 2.0 0.8 0.7 0.9 2.2 0.8 1.8 24.5 2.8 1.5 0.9 2.0REAL ESTATE AND GOODS RENTAL AND LEASING 2.2 1.7 2.6 1.4 1.8 2.0 2.2 3.6 19.6 1.3 0.9 2.5ACCOMMODATIONS, EATING AND DRINKING SERVICES 7.6 4.6 2.7 4.4 2.8 4.0 7.9 4.4 5.1 33.1 3.7 5.0MEDICAL, HEALTH CARE AND WELFARE 14.5 6.3 3.8 7.2 4.5 5.7 9.7 10.0 7.3 11.1 64.7 8.7SERVICES, N.E.C. 8.9 7.1 7.4 8.9 11.2 8.9 7.5 9.1 12.3 6.2 4.1 26.9Note 1) Including "Industries unable to classify".
REAL ESTATEAND GOODSRENTAL AND
LEASING
ACCOMMODATIONS,EATING AND
DRINKING SERVICESSERVICES, N.E.C.
Total 1)
WHOLESALE ANDRETAIL TRADE
FINANCE ANDINSURANCE
MEDICAL,HEALTH CAREAND WELFARE
AGRICULTUREAND FORESTRY
CONSTRUCTION MANUFACTURINGINFORMATION
ANDCOMMUNICATIONS
TRANSPORT ANDPOSTAL
ACTIVITIES
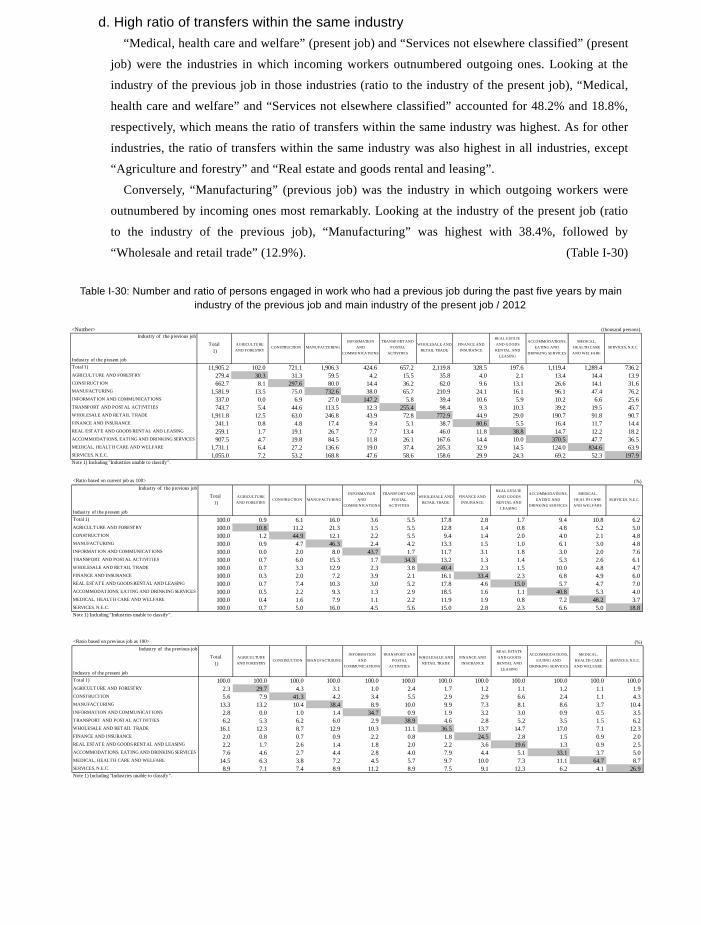
155
c. As a result of transfer between industries, worker inflows exceed worker outflows in “Medical, health care and welfare”, while outflows exceeds inflows in “Manufacturing”.
Looking at persons engaged in work who had a previous job during the past five years in terms of the
difference between worker inflows and outflows by main industry, there was an increase (worker
inflows exceeding outflows) in “Medical, health care and welfare” (up by 442 thousand), “Services not
elsewhere classified” (up by 319 thousand), and “Agriculture and forestry” (up by 177 thousand). On
the other hand, there was a decrease (worker outflows exceeding inflows) in “Manufacturing” (down by
324 thousand), “Accommodations, eating and drinking services” (down by 212 thousand), and
“Wholesale and retail trade” (down by 208 thousand). (Fig. I-17, Table I-29)
Fig. I-17: Difference between worker inflows and outflows among persons engaged in work who had a previous job
during the past five years by main industry / 2012
Table I-29: Difference between worker inflows and outflows among persons engaged in work who had a previous job
during the past five years by main industry / 2012
(thousand persons)
Industry Present job Previous jobAGRICULTURE AND FORESTRY 279.4 102.0 177.4CONSTRUCTION 662.7 721.1 -58.4MANUFACTURING 1,581.9 1,906.3 -324.4INFORMATION AND COMMUNICATIONS 337.0 424.6 -87.6TRANSPORT AND POSTAL ACTIVITIES 743.7 657.2 86.5WHOLESALE AND RETAIL TRADE 1,911.8 2,119.8 -208.0FINANCE AND INSURANCE 241.1 328.5 -87.4REAL ESTATE AND GOODS RENTAL AND LEASING 259.1 197.6 61.5ACCOMMODATIONS, EATING AND DRINKING SERVICES 907.5 1,119.4 -211.9MEDICAL, HEALTH CARE AND WELFARE 1,731.1 1,289.4 441.7SERVICES, N.E.C. 1,055.0 736.2 318.8
Job changers Difference(Present job-Previous job)
-400
-300
-200
-100
0
100
200
300
400
500
AG
RIC
ULT
UR
E A
ND
FO
RES
TRY
CON
STR
UC
TIO
N
MA
NU
FACT
UR
ING
INFO
RM
ATI
ON
AN
D C
OM
MU
NIC
ATI
ON
S
TRA
NSP
ORT
AN
D P
OST
AL
AC
TIV
ITIE
S
WH
OLE
SALE
AN
D R
ETA
IL T
RA
DE
FIN
AN
CE
AN
D IN
SUR
AN
CE
REA
L ES
TATE
AN
D G
OO
DS
REN
TAL
AN
D L
EASI
NG
AC
CO
MM
OD
ATI
ON
S, E
ATI
NG
AN
D D
RIN
KIN
G S
ERV
ICES
MED
ICA
L, H
EALT
H C
AR
E A
ND
WEL
FAR
E
SER
VIC
ES, N
.E.C
.
(thousand persons)
d. High ratio of transfers within the same industry “Medical, health care and welfare” (present job) and “Services not elsewhere classified” (present
job) were the industries in which incoming workers outnumbered outgoing ones. Looking at the
industry of the previous job in those industries (ratio to the industry of the present job), “Medical,
health care and welfare” and “Services not elsewhere classified” accounted for 48.2% and 18.8%,
respectively, which means the ratio of transfers within the same industry was highest. As for other
industries, the ratio of transfers within the same industry was also highest in all industries, except
“Agriculture and forestry” and “Real estate and goods rental and leasing”.
Conversely, “Manufacturing” (previous job) was the industry in which outgoing workers were
outnumbered by incoming ones most remarkably. Looking at the industry of the present job (ratio
to the industry of the previous job), “Manufacturing” was highest with 38.4%, followed by
“Wholesale and retail trade” (12.9%). (Table I-30)
Table I-30: Number and ratio of persons engaged in work who had a previous job during the past five years by main industry of the previous job and main industry of the present job / 2012
<Number> (thousand persons)Industry of the previous job
Industry of the present jobTotal 1) 11,905.2 102.0 721.1 1,906.3 424.6 657.2 2,119.8 328.5 197.6 1,119.4 1,289.4 736.2AGRICULTURE AND FORESTRY 279.4 30.3 31.3 59.5 4.2 15.5 35.8 4.0 2.1 13.4 14.4 13.9CONSTRUCTION 662.7 8.1 297.6 80.0 14.4 36.2 62.0 9.6 13.1 26.6 14.1 31.6MANUFACTURING 1,581.9 13.5 75.0 732.6 38.0 65.7 210.9 24.1 16.1 96.1 47.4 76.2INFORMATION AND COMMUNICATIONS 337.0 0.0 6.9 27.0 147.2 5.8 39.4 10.6 5.9 10.2 6.6 25.6TRANSPORT AND POSTAL ACTIVITIES 743.7 5.4 44.6 113.5 12.3 255.4 98.4 9.3 10.3 39.2 19.5 45.7WHOLESALE AND RETAIL TRADE 1,911.8 12.5 63.0 246.8 43.9 72.8 772.9 44.9 29.0 190.7 91.8 90.7FINANCE AND INSURANCE 241.1 0.8 4.8 17.4 9.4 5.1 38.7 80.6 5.5 16.4 11.7 14.4REAL ESTATE AND GOODS RENTAL AND LEASING 259.1 1.7 19.1 26.7 7.7 13.4 46.0 11.8 38.8 14.7 12.2 18.2ACCOMMODATIONS, EATING AND DRINKING SERVICES 907.5 4.7 19.8 84.5 11.8 26.1 167.6 14.4 10.0 370.5 47.7 36.5MEDICAL, HEALTH CARE AND WELFARE 1,731.1 6.4 27.2 136.6 19.0 37.4 205.3 32.9 14.5 124.0 834.6 63.9SERVICES, N.E.C. 1,055.0 7.2 53.2 168.8 47.6 58.6 158.6 29.9 24.3 69.2 52.3 197.9Note 1) Including "Industries unable to classify".
REAL ESTATEAND GOODSRENTAL AND
LEASING
ACCOMMODATIONS,EATING AND
DRINKING SERVICESSERVICES, N.E.C.
Total 1)
AGRICULTUREAND FORESTRY
CONSTRUCTION MANUFACTURINGINFORMATION
ANDCOMMUNICATIONS
TRANSPORT ANDPOSTAL
ACTIVITIES
WHOLESALE ANDRETAIL TRADE
FINANCE ANDINSURANCE
MEDICAL,HEALTH CAREAND WELFARE
<Ratio based on current job as 100> (%)Industry of the previous job
Industry of the present jobTotal 1) 100.0 0.9 6.1 16.0 3.6 5.5 17.8 2.8 1.7 9.4 10.8 6.2AGRICULTURE AND FORESTRY 100.0 10.8 11.2 21.3 1.5 5.5 12.8 1.4 0.8 4.8 5.2 5.0CONSTRUCTION 100.0 1.2 44.9 12.1 2.2 5.5 9.4 1.4 2.0 4.0 2.1 4.8MANUFACTURING 100.0 0.9 4.7 46.3 2.4 4.2 13.3 1.5 1.0 6.1 3.0 4.8INFORMATION AND COMMUNICATIONS 100.0 0.0 2.0 8.0 43.7 1.7 11.7 3.1 1.8 3.0 2.0 7.6TRANSPORT AND POSTAL ACTIVITIES 100.0 0.7 6.0 15.3 1.7 34.3 13.2 1.3 1.4 5.3 2.6 6.1WHOLESALE AND RETAIL TRADE 100.0 0.7 3.3 12.9 2.3 3.8 40.4 2.3 1.5 10.0 4.8 4.7FINANCE AND INSURANCE 100.0 0.3 2.0 7.2 3.9 2.1 16.1 33.4 2.3 6.8 4.9 6.0REAL ESTATE AND GOODS RENTAL AND LEASING 100.0 0.7 7.4 10.3 3.0 5.2 17.8 4.6 15.0 5.7 4.7 7.0ACCOMMODATIONS, EATING AND DRINKING SERVICES 100.0 0.5 2.2 9.3 1.3 2.9 18.5 1.6 1.1 40.8 5.3 4.0MEDICAL, HEALTH CARE AND WELFARE 100.0 0.4 1.6 7.9 1.1 2.2 11.9 1.9 0.8 7.2 48.2 3.7SERVICES, N.E.C. 100.0 0.7 5.0 16.0 4.5 5.6 15.0 2.8 2.3 6.6 5.0 18.8Note 1) Including "Industries unable to classify".
REAL ESTATEAND GOODSRENTAL AND
LEASING
ACCOMMODATIONS,EATING AND
DRINKING SERVICESSERVICES, N.E.C.
Total 1)
AGRICULTUREAND FORESTRY
CONSTRUCTION MANUFACTURINGINFORMATION
ANDCOMMUNICATIONS
TRANSPORT ANDPOSTAL
ACTIVITIES
WHOLESALE ANDRETAIL TRADE
FINANCE ANDINSURANCE
MEDICAL,HEALTH CAREAND WELFARE
<Ratio based on previous job as 100> (%)Industry of the previous job
Industry of the present jobTotal 1) 100.0 100.0 100.0 100.0 100.0 100.0 100.0 100.0 100.0 100.0 100.0 100.0AGRICULTURE AND FORESTRY 2.3 29.7 4.3 3.1 1.0 2.4 1.7 1.2 1.1 1.2 1.1 1.9CONSTRUCTION 5.6 7.9 41.3 4.2 3.4 5.5 2.9 2.9 6.6 2.4 1.1 4.3MANUFACTURING 13.3 13.2 10.4 38.4 8.9 10.0 9.9 7.3 8.1 8.6 3.7 10.4INFORMATION AND COMMUNICATIONS 2.8 0.0 1.0 1.4 34.7 0.9 1.9 3.2 3.0 0.9 0.5 3.5TRANSPORT AND POSTAL ACTIVITIES 6.2 5.3 6.2 6.0 2.9 38.9 4.6 2.8 5.2 3.5 1.5 6.2WHOLESALE AND RETAIL TRADE 16.1 12.3 8.7 12.9 10.3 11.1 36.5 13.7 14.7 17.0 7.1 12.3FINANCE AND INSURANCE 2.0 0.8 0.7 0.9 2.2 0.8 1.8 24.5 2.8 1.5 0.9 2.0REAL ESTATE AND GOODS RENTAL AND LEASING 2.2 1.7 2.6 1.4 1.8 2.0 2.2 3.6 19.6 1.3 0.9 2.5ACCOMMODATIONS, EATING AND DRINKING SERVICES 7.6 4.6 2.7 4.4 2.8 4.0 7.9 4.4 5.1 33.1 3.7 5.0MEDICAL, HEALTH CARE AND WELFARE 14.5 6.3 3.8 7.2 4.5 5.7 9.7 10.0 7.3 11.1 64.7 8.7SERVICES, N.E.C. 8.9 7.1 7.4 8.9 11.2 8.9 7.5 9.1 12.3 6.2 4.1 26.9Note 1) Including "Industries unable to classify".
REAL ESTATEAND GOODSRENTAL AND
LEASING
ACCOMMODATIONS,EATING AND
DRINKING SERVICESSERVICES, N.E.C.
Total 1)
WHOLESALE ANDRETAIL TRADE
FINANCE ANDINSURANCE
MEDICAL,HEALTH CAREAND WELFARE
AGRICULTUREAND FORESTRY
CONSTRUCTION MANUFACTURINGINFORMATION
ANDCOMMUNICATIONS
TRANSPORT ANDPOSTAL
ACTIVITIES
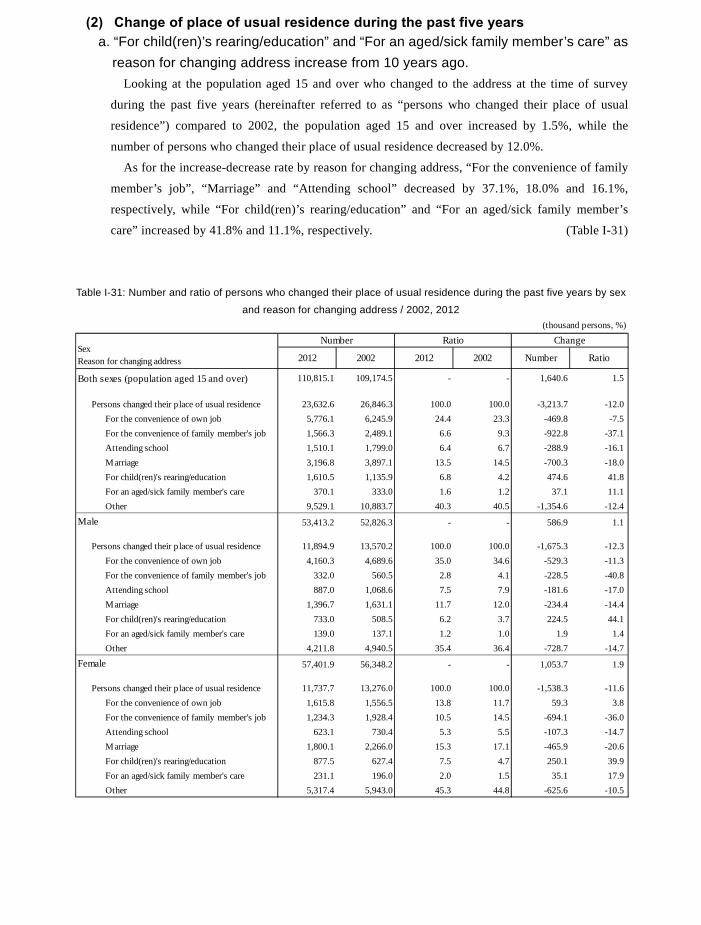
156
(2) Change of place of usual residence during the past five years a. “For child(ren)’s rearing/education” and “For an aged/sick family member’s care” as
reason for changing address increase from 10 years ago. Looking at the population aged 15 and over who changed to the address at the time of survey
during the past five years (hereinafter referred to as “persons who changed their place of usual
residence”) compared to 2002, the population aged 15 and over increased by 1.5%, while the
number of persons who changed their place of usual residence decreased by 12.0%.
As for the increase-decrease rate by reason for changing address, “For the convenience of family
member’s job”, “Marriage” and “Attending school” decreased by 37.1%, 18.0% and 16.1%,
respectively, while “For child(ren)’s rearing/education” and “For an aged/sick family member’s
care” increased by 41.8% and 11.1%, respectively. (Table I-31)
Table I-31: Number and ratio of persons who changed their place of usual residence during the past five years by sex
and reason for changing address / 2002, 2012
(thousand persons, %)
2012 2002 2012 2002 Number Ratio
Both sexes (population aged 15 and over) 110,815.1 109,174.5 - - 1,640.6 1.5
Persons changed their place of usual residence 23,632.6 26,846.3 100.0 100.0 -3,213.7 -12.0For the convenience of own job 5,776.1 6,245.9 24.4 23.3 -469.8 -7.5For the convenience of family member's job 1,566.3 2,489.1 6.6 9.3 -922.8 -37.1Attending school 1,510.1 1,799.0 6.4 6.7 -288.9 -16.1Marriage 3,196.8 3,897.1 13.5 14.5 -700.3 -18.0For child(ren)'s rearing/education 1,610.5 1,135.9 6.8 4.2 474.6 41.8For an aged/sick family member's care 370.1 333.0 1.6 1.2 37.1 11.1Other 9,529.1 10,883.7 40.3 40.5 -1,354.6 -12.4
Male 53,413.2 52,826.3 - - 586.9 1.1
Persons changed their place of usual residence 11,894.9 13,570.2 100.0 100.0 -1,675.3 -12.3For the convenience of own job 4,160.3 4,689.6 35.0 34.6 -529.3 -11.3For the convenience of family member's job 332.0 560.5 2.8 4.1 -228.5 -40.8Attending school 887.0 1,068.6 7.5 7.9 -181.6 -17.0Marriage 1,396.7 1,631.1 11.7 12.0 -234.4 -14.4For child(ren)'s rearing/education 733.0 508.5 6.2 3.7 224.5 44.1For an aged/sick family member's care 139.0 137.1 1.2 1.0 1.9 1.4Other 4,211.8 4,940.5 35.4 36.4 -728.7 -14.7
Female 57,401.9 56,348.2 - - 1,053.7 1.9
Persons changed their place of usual residence 11,737.7 13,276.0 100.0 100.0 -1,538.3 -11.6For the convenience of own job 1,615.8 1,556.5 13.8 11.7 59.3 3.8For the convenience of family member's job 1,234.3 1,928.4 10.5 14.5 -694.1 -36.0Attending school 623.1 730.4 5.3 5.5 -107.3 -14.7Marriage 1,800.1 2,266.0 15.3 17.1 -465.9 -20.6For child(ren)'s rearing/education 877.5 627.4 7.5 4.7 250.1 39.9For an aged/sick family member's care 231.1 196.0 2.0 1.5 35.1 17.9Other 5,317.4 5,943.0 45.3 44.8 -625.6 -10.5
SexReason for changing address
Number Ratio Change
b. Females have a higher ratio of persons who changed their place of usual residence according to life stages than males.
Looking at the reason for changing address by sex, for males “For the convenience of own job”
was highest with 35.0%, followed by “Attending school” (7.5%).
Meanwhile, for females “Marriage” was highest with 15.3%, followed by “For the convenience
of family member’s job” (10.5%), “For child(ren)’s rearing/education” (7.5%) and “For an
aged/sick family member’s care” (2.0%). Compared to males, females had a higher ratio of persons
who changed their place of usual residence according to life stages. (Table I-31, Fig. I-18)
Fig. I-18: Ratio of persons who changed their place of usual residence during the past five years by sex and reason for
changing address / 2012
For the convenience of
own job13.8% For the
convenience of family
member's job10.5%
Attending school5.3%Marriage
15.3%
For child(ren)'s rearing/
education7.5%
For an aged/ sick family
member's care2.0%
Other45.3%
Female
For the convenience of
own job35.0%
For the convenience of
family member's job
2.8%Attending school7.5%
Marriage11.7%
For child(ren)'s rearing/
education6.2%
For an aged/ sick family
member's care1.2%
Other35.4%
Male
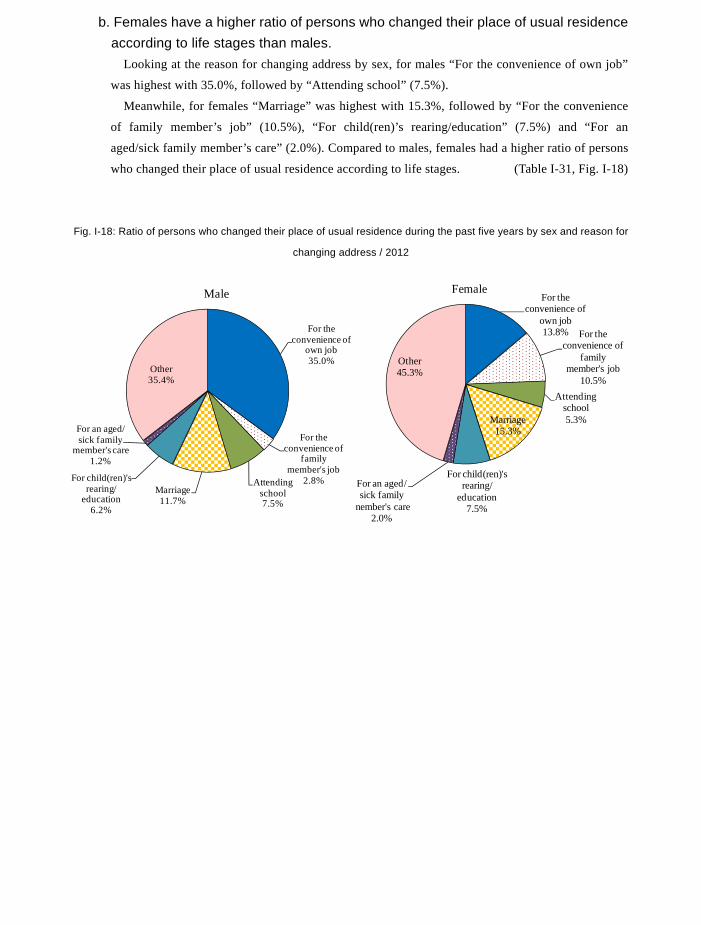
157
(2) Change of place of usual residence during the past five years a. “For child(ren)’s rearing/education” and “For an aged/sick family member’s care” as
reason for changing address increase from 10 years ago. Looking at the population aged 15 and over who changed to the address at the time of survey
during the past five years (hereinafter referred to as “persons who changed their place of usual
residence”) compared to 2002, the population aged 15 and over increased by 1.5%, while the
number of persons who changed their place of usual residence decreased by 12.0%.
As for the increase-decrease rate by reason for changing address, “For the convenience of family
member’s job”, “Marriage” and “Attending school” decreased by 37.1%, 18.0% and 16.1%,
respectively, while “For child(ren)’s rearing/education” and “For an aged/sick family member’s
care” increased by 41.8% and 11.1%, respectively. (Table I-31)
Table I-31: Number and ratio of persons who changed their place of usual residence during the past five years by sex
and reason for changing address / 2002, 2012
(thousand persons, %)
2012 2002 2012 2002 Number Ratio
Both sexes (population aged 15 and over) 110,815.1 109,174.5 - - 1,640.6 1.5
Persons changed their place of usual residence 23,632.6 26,846.3 100.0 100.0 -3,213.7 -12.0For the convenience of own job 5,776.1 6,245.9 24.4 23.3 -469.8 -7.5For the convenience of family member's job 1,566.3 2,489.1 6.6 9.3 -922.8 -37.1Attending school 1,510.1 1,799.0 6.4 6.7 -288.9 -16.1Marriage 3,196.8 3,897.1 13.5 14.5 -700.3 -18.0For child(ren)'s rearing/education 1,610.5 1,135.9 6.8 4.2 474.6 41.8For an aged/sick family member's care 370.1 333.0 1.6 1.2 37.1 11.1Other 9,529.1 10,883.7 40.3 40.5 -1,354.6 -12.4
Male 53,413.2 52,826.3 - - 586.9 1.1
Persons changed their place of usual residence 11,894.9 13,570.2 100.0 100.0 -1,675.3 -12.3For the convenience of own job 4,160.3 4,689.6 35.0 34.6 -529.3 -11.3For the convenience of family member's job 332.0 560.5 2.8 4.1 -228.5 -40.8Attending school 887.0 1,068.6 7.5 7.9 -181.6 -17.0Marriage 1,396.7 1,631.1 11.7 12.0 -234.4 -14.4For child(ren)'s rearing/education 733.0 508.5 6.2 3.7 224.5 44.1For an aged/sick family member's care 139.0 137.1 1.2 1.0 1.9 1.4Other 4,211.8 4,940.5 35.4 36.4 -728.7 -14.7
Female 57,401.9 56,348.2 - - 1,053.7 1.9
Persons changed their place of usual residence 11,737.7 13,276.0 100.0 100.0 -1,538.3 -11.6For the convenience of own job 1,615.8 1,556.5 13.8 11.7 59.3 3.8For the convenience of family member's job 1,234.3 1,928.4 10.5 14.5 -694.1 -36.0Attending school 623.1 730.4 5.3 5.5 -107.3 -14.7Marriage 1,800.1 2,266.0 15.3 17.1 -465.9 -20.6For child(ren)'s rearing/education 877.5 627.4 7.5 4.7 250.1 39.9For an aged/sick family member's care 231.1 196.0 2.0 1.5 35.1 17.9Other 5,317.4 5,943.0 45.3 44.8 -625.6 -10.5
SexReason for changing address
Number Ratio Change
b. Females have a higher ratio of persons who changed their place of usual residence according to life stages than males.
Looking at the reason for changing address by sex, for males “For the convenience of own job”
was highest with 35.0%, followed by “Attending school” (7.5%).
Meanwhile, for females “Marriage” was highest with 15.3%, followed by “For the convenience
of family member’s job” (10.5%), “For child(ren)’s rearing/education” (7.5%) and “For an
aged/sick family member’s care” (2.0%). Compared to males, females had a higher ratio of persons
who changed their place of usual residence according to life stages. (Table I-31, Fig. I-18)
Fig. I-18: Ratio of persons who changed their place of usual residence during the past five years by sex and reason for
changing address / 2012
For the convenience of
own job13.8% For the
convenience of family
member's job10.5%
Attending school5.3%Marriage
15.3%
For child(ren)'s rearing/
education7.5%
For an aged/ sick family
member's care2.0%
Other45.3%
Female
For the convenience of
own job35.0%
For the convenience of
family member's job
2.8%Attending school7.5%
Marriage11.7%
For child(ren)'s rearing/
education6.2%
For an aged/ sick family
member's care1.2%
Other35.4%
Male
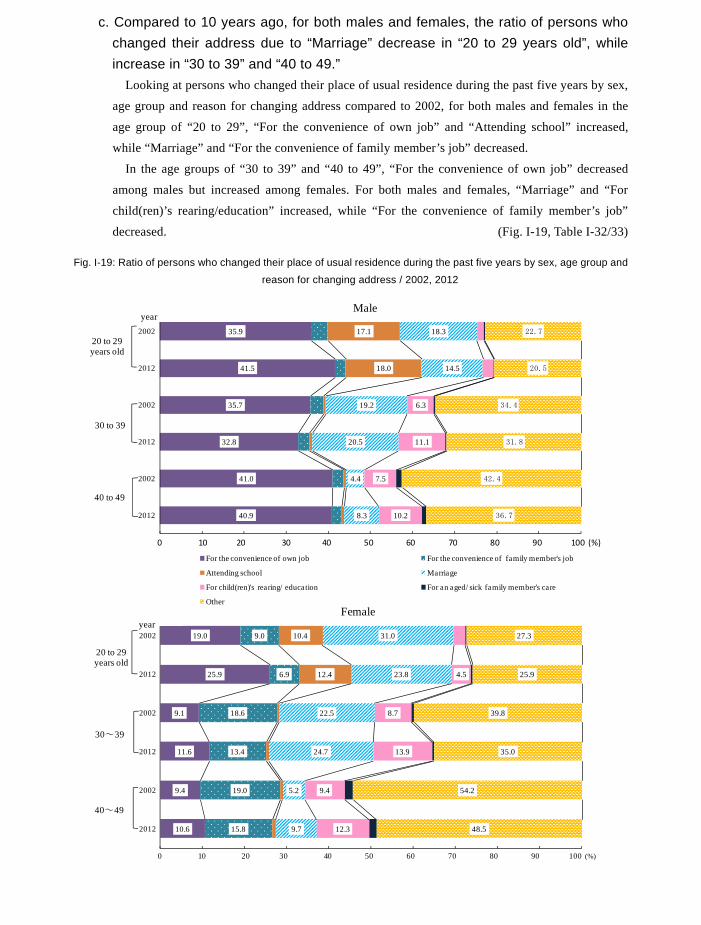
158
c. Compared to 10 years ago, for both males and females, the ratio of persons who changed their address due to “Marriage” decrease in “20 to 29 years old”, while increase in “30 to 39” and “40 to 49.”
Looking at persons who changed their place of usual residence during the past five years by sex,
age group and reason for changing address compared to 2002, for both males and females in the
age group of “20 to 29”, “For the convenience of own job” and “Attending school” increased,
while “Marriage” and “For the convenience of family member’s job” decreased.
In the age groups of “30 to 39” and “40 to 49”, “For the convenience of own job” decreased
among males but increased among females. For both males and females, “Marriage” and “For
child(ren)’s rearing/education” increased, while “For the convenience of family member’s job”
decreased. (Fig. I-19, Table I-32/33)
Fig. I-19: Ratio of persons who changed their place of usual residence during the past five years by sex, age group and
reason for changing address / 2002, 2012
40.9
41.0
32.8
35.7
41.5
35.9
18.0
17.1
8.3
4.4
20.5
19.2
14.5
18.3
10.2
7.5
11.1
6.3
36.7
42.4
31.8
34.4
20.5
22.7
2012
2002
2012
2002
2012
200220 to 29years old
Male
For the convenience of own job For the convenience of family member's job
Attending school Marriage
For child(ren)'s rearing/ education For an aged/ sick family member's care
Other
0 10 20 30 40 50 60 70 80 90 100 (%)
30 to 39
40 to 49
year
10.6
9.4
11.6
9.1
25.9
19.0
15.8
19.0
13.4
18.6
6.9
9.0
12.4
10.4
9.7
5.2
24.7
22.5
23.8
31.0
12.3
9.4
13.9
8.7
4.5
48.5
54.2
35.0
39.8
25.9
27.3
2012
2002
2012
2002
2012
2002
20 to 29years old
Female
0 10 20 30 40 50 60 70 80 90 100 (%)
30~39
40~49
year
Table I-32: Number and ratio of persons who changed their place of usual residence during the past five years by sex,
age group and reason for changing address / 2012
(thousand persons, %)
TotalFor the
convenience ofown job
For theconvenience offamily member's
job
Attendingschool
MarriageFor child(ren)'s
rearing/education
For an aged/sick family
member's careOther
Both sexes 23,632.6 5,776.1 1,566.3 1,510.1 3,196.8 1,610.5 370.1 9,529.1 15 to 19 years old 1,241.6 64.6 119.3 531.6 6.9 1.3 3.3 511.1 20 to 29 5,798.9 1,964.2 268.9 885.6 1,106.0 202.0 15.4 1,339.6 30 to 39 7,418.2 1,653.9 593.5 54.9 1,672.6 923.9 27.5 2,475.9 40 to 49 3,810.0 1,033.5 317.3 30.2 340.2 423.8 52.4 1,602.4 50 to 59 1,843.8 582.0 136.1 6.0 52.3 49.1 74.4 937.6 60 to 69 1,484.7 356.9 74.4 1.2 14.0 8.8 74.9 947.2 70 years old and over 2,035.5 121.1 56.8 0.6 4.9 1.7 122.0 1,715.3Male 11,894.9 4,160.3 332.0 887.0 1,396.7 733.0 139.0 4,211.8 15 to 19 years old 664.4 42.0 59.5 309.2 0.9 0.2 1.7 249.9 20 to 29 2,953.5 1,226.4 73.7 531.7 429.7 72.7 5.5 604.0 30 to 39 3,730.2 1,224.4 97.6 27.6 763.0 412.7 10.5 1,186.0 40 to 49 2,080.6 850.3 44.0 14.1 172.4 211.7 20.8 763.1 50 to 59 1,039.7 482.2 25.0 3.4 23.7 29.2 30.4 442.9 60 to 69 793.2 257.8 18.1 0.5 5.4 6.1 37.1 465.0 70 years old and over 633.3 77.3 14.1 0.5 1.5 0.4 33.2 500.8Female 11,737.7 1,615.8 1,234.3 623.1 1,800.1 877.5 231.1 5,317.4 15 to 19 years old 577.2 22.6 59.9 222.4 6.0 1.1 1.6 261.2 20 to 29 2,845.4 737.8 195.2 353.9 676.3 129.3 10.0 735.6 30 to 39 3,688.0 429.5 495.8 27.3 909.6 511.2 17.1 1,290.0 40 to 49 1,729.3 183.2 273.3 16.2 167.8 212.2 31.6 839.2 50 to 59 804.1 99.9 111.0 2.5 28.6 19.9 44.0 494.8 60 to 69 691.5 99.0 56.3 0.7 8.7 2.6 37.8 482.1 70 years old and over 1,402.1 43.8 42.7 0.1 3.2 1.3 88.8 1,214.5Both sexes 100.0 24.4 6.6 6.4 13.5 6.8 1.6 40.3 15 to 19 years old 100.0 5.2 9.6 42.8 0.6 0.1 0.3 41.2 20 to 29 100.0 33.9 4.6 15.3 19.1 3.5 0.3 23.1 30 to 39 100.0 22.3 8.0 0.7 22.5 12.5 0.4 33.4 40 to 49 100.0 27.1 8.3 0.8 8.9 11.1 1.4 42.1 50 to 59 100.0 31.6 7.4 0.3 2.8 2.7 4.0 50.9 60 to 69 100.0 24.0 5.0 0.1 0.9 0.6 5.0 63.8 70 years old and over 100.0 5.9 2.8 0.0 0.2 0.1 6.0 84.3Male 100.0 35.0 2.8 7.5 11.7 6.2 1.2 35.4 15 to 19 years old 100.0 6.3 9.0 46.5 0.1 0.0 0.3 37.6 20 to 29 100.0 41.5 2.5 18.0 14.5 2.5 0.2 20.5 30 to 39 100.0 32.8 2.6 0.7 20.5 11.1 0.3 31.8 40 to 49 100.0 40.9 2.1 0.7 8.3 10.2 1.0 36.7 50 to 59 100.0 46.4 2.4 0.3 2.3 2.8 2.9 42.6 60 to 69 100.0 32.5 2.3 0.1 0.7 0.8 4.7 58.6 70 years old and over 100.0 12.2 2.2 0.1 0.2 0.1 5.2 79.1Female 100.0 13.8 10.5 5.3 15.3 7.5 2.0 45.3 15 to 19 years old 100.0 3.9 10.4 38.5 1.0 0.2 0.3 45.3 20 to 29 100.0 25.9 6.9 12.4 23.8 4.5 0.4 25.9 30 to 39 100.0 11.6 13.4 0.7 24.7 13.9 0.5 35.0 40 to 49 100.0 10.6 15.8 0.9 9.7 12.3 1.8 48.5 50 to 59 100.0 12.4 13.8 0.3 3.6 2.5 5.5 61.5 60 to 69 100.0 14.3 8.1 0.1 1.3 0.4 5.5 69.7 70 years old and over 100.0 3.1 3.0 0.0 0.2 0.1 6.3 86.6
Num
ber
Rat
io
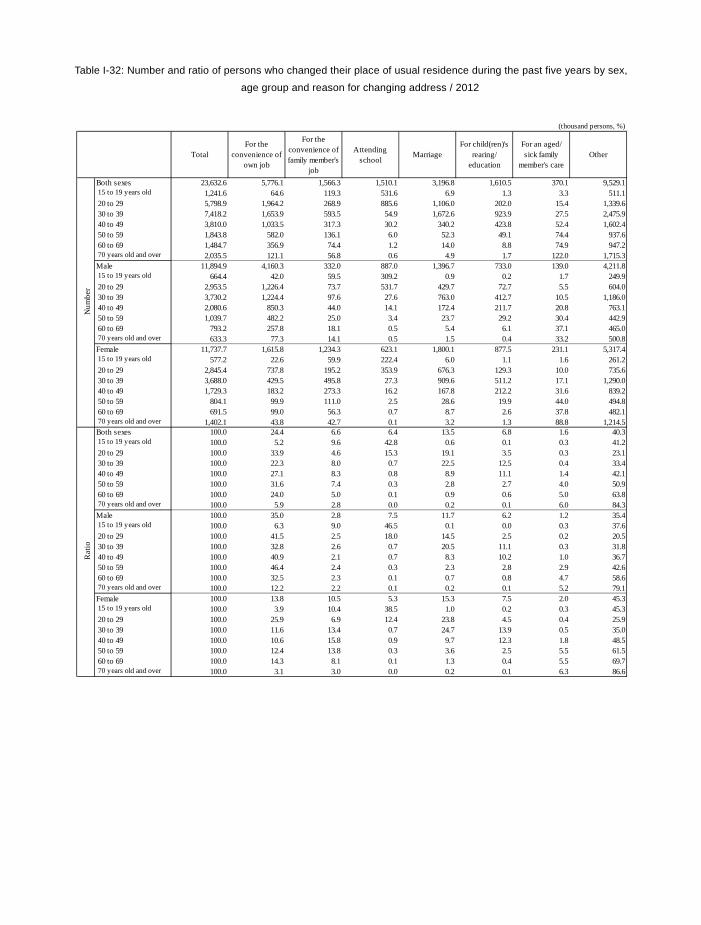
159
c. Compared to 10 years ago, for both males and females, the ratio of persons who changed their address due to “Marriage” decrease in “20 to 29 years old”, while increase in “30 to 39” and “40 to 49.”
Looking at persons who changed their place of usual residence during the past five years by sex,
age group and reason for changing address compared to 2002, for both males and females in the
age group of “20 to 29”, “For the convenience of own job” and “Attending school” increased,
while “Marriage” and “For the convenience of family member’s job” decreased.
In the age groups of “30 to 39” and “40 to 49”, “For the convenience of own job” decreased
among males but increased among females. For both males and females, “Marriage” and “For
child(ren)’s rearing/education” increased, while “For the convenience of family member’s job”
decreased. (Fig. I-19, Table I-32/33)
Fig. I-19: Ratio of persons who changed their place of usual residence during the past five years by sex, age group and
reason for changing address / 2002, 2012
40.9
41.0
32.8
35.7
41.5
35.9
18.0
17.1
8.3
4.4
20.5
19.2
14.5
18.3
10.2
7.5
11.1
6.3
36.7
42.4
31.8
34.4
20.5
22.7
2012
2002
2012
2002
2012
200220 to 29years old
Male
For the convenience of own job For the convenience of family member's job
Attending school Marriage
For child(ren)'s rearing/ education For an aged/ sick family member's care
Other
0 10 20 30 40 50 60 70 80 90 100 (%)
30 to 39
40 to 49
year
10.6
9.4
11.6
9.1
25.9
19.0
15.8
19.0
13.4
18.6
6.9
9.0
12.4
10.4
9.7
5.2
24.7
22.5
23.8
31.0
12.3
9.4
13.9
8.7
4.5
48.5
54.2
35.0
39.8
25.9
27.3
2012
2002
2012
2002
2012
2002
20 to 29years old
Female
0 10 20 30 40 50 60 70 80 90 100 (%)
30~39
40~49
year
Table I-32: Number and ratio of persons who changed their place of usual residence during the past five years by sex,
age group and reason for changing address / 2012
(thousand persons, %)
TotalFor the
convenience ofown job
For theconvenience offamily member's
job
Attendingschool
MarriageFor child(ren)'s
rearing/education
For an aged/sick family
member's careOther
Both sexes 23,632.6 5,776.1 1,566.3 1,510.1 3,196.8 1,610.5 370.1 9,529.1 15 to 19 years old 1,241.6 64.6 119.3 531.6 6.9 1.3 3.3 511.1 20 to 29 5,798.9 1,964.2 268.9 885.6 1,106.0 202.0 15.4 1,339.6 30 to 39 7,418.2 1,653.9 593.5 54.9 1,672.6 923.9 27.5 2,475.9 40 to 49 3,810.0 1,033.5 317.3 30.2 340.2 423.8 52.4 1,602.4 50 to 59 1,843.8 582.0 136.1 6.0 52.3 49.1 74.4 937.6 60 to 69 1,484.7 356.9 74.4 1.2 14.0 8.8 74.9 947.2 70 years old and over 2,035.5 121.1 56.8 0.6 4.9 1.7 122.0 1,715.3Male 11,894.9 4,160.3 332.0 887.0 1,396.7 733.0 139.0 4,211.8 15 to 19 years old 664.4 42.0 59.5 309.2 0.9 0.2 1.7 249.9 20 to 29 2,953.5 1,226.4 73.7 531.7 429.7 72.7 5.5 604.0 30 to 39 3,730.2 1,224.4 97.6 27.6 763.0 412.7 10.5 1,186.0 40 to 49 2,080.6 850.3 44.0 14.1 172.4 211.7 20.8 763.1 50 to 59 1,039.7 482.2 25.0 3.4 23.7 29.2 30.4 442.9 60 to 69 793.2 257.8 18.1 0.5 5.4 6.1 37.1 465.0 70 years old and over 633.3 77.3 14.1 0.5 1.5 0.4 33.2 500.8Female 11,737.7 1,615.8 1,234.3 623.1 1,800.1 877.5 231.1 5,317.4 15 to 19 years old 577.2 22.6 59.9 222.4 6.0 1.1 1.6 261.2 20 to 29 2,845.4 737.8 195.2 353.9 676.3 129.3 10.0 735.6 30 to 39 3,688.0 429.5 495.8 27.3 909.6 511.2 17.1 1,290.0 40 to 49 1,729.3 183.2 273.3 16.2 167.8 212.2 31.6 839.2 50 to 59 804.1 99.9 111.0 2.5 28.6 19.9 44.0 494.8 60 to 69 691.5 99.0 56.3 0.7 8.7 2.6 37.8 482.1 70 years old and over 1,402.1 43.8 42.7 0.1 3.2 1.3 88.8 1,214.5Both sexes 100.0 24.4 6.6 6.4 13.5 6.8 1.6 40.3 15 to 19 years old 100.0 5.2 9.6 42.8 0.6 0.1 0.3 41.2 20 to 29 100.0 33.9 4.6 15.3 19.1 3.5 0.3 23.1 30 to 39 100.0 22.3 8.0 0.7 22.5 12.5 0.4 33.4 40 to 49 100.0 27.1 8.3 0.8 8.9 11.1 1.4 42.1 50 to 59 100.0 31.6 7.4 0.3 2.8 2.7 4.0 50.9 60 to 69 100.0 24.0 5.0 0.1 0.9 0.6 5.0 63.8 70 years old and over 100.0 5.9 2.8 0.0 0.2 0.1 6.0 84.3Male 100.0 35.0 2.8 7.5 11.7 6.2 1.2 35.4 15 to 19 years old 100.0 6.3 9.0 46.5 0.1 0.0 0.3 37.6 20 to 29 100.0 41.5 2.5 18.0 14.5 2.5 0.2 20.5 30 to 39 100.0 32.8 2.6 0.7 20.5 11.1 0.3 31.8 40 to 49 100.0 40.9 2.1 0.7 8.3 10.2 1.0 36.7 50 to 59 100.0 46.4 2.4 0.3 2.3 2.8 2.9 42.6 60 to 69 100.0 32.5 2.3 0.1 0.7 0.8 4.7 58.6 70 years old and over 100.0 12.2 2.2 0.1 0.2 0.1 5.2 79.1Female 100.0 13.8 10.5 5.3 15.3 7.5 2.0 45.3 15 to 19 years old 100.0 3.9 10.4 38.5 1.0 0.2 0.3 45.3 20 to 29 100.0 25.9 6.9 12.4 23.8 4.5 0.4 25.9 30 to 39 100.0 11.6 13.4 0.7 24.7 13.9 0.5 35.0 40 to 49 100.0 10.6 15.8 0.9 9.7 12.3 1.8 48.5 50 to 59 100.0 12.4 13.8 0.3 3.6 2.5 5.5 61.5 60 to 69 100.0 14.3 8.1 0.1 1.3 0.4 5.5 69.7 70 years old and over 100.0 3.1 3.0 0.0 0.2 0.1 6.3 86.6
Num
ber
Rat
io
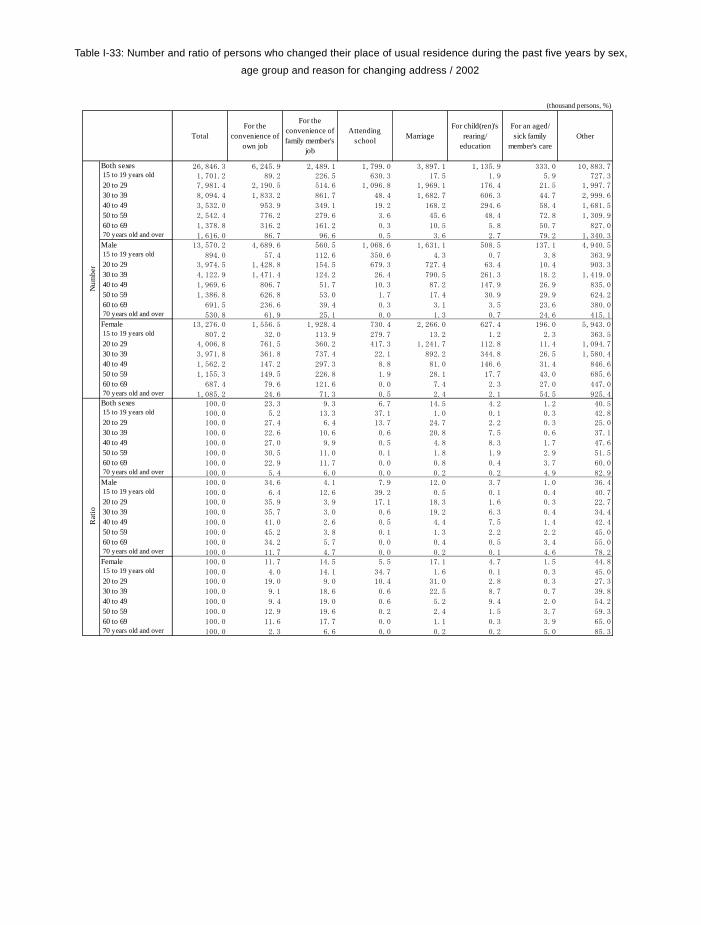
160
Table I-33: Number and ratio of persons who changed their place of usual residence during the past five years by sex,
age group and reason for changing address / 2002
(thousand persons, %)
TotalFor the
convenience ofown job
For theconvenience offamily member's
job
Attendingschool Marriage
For child(ren)'srearing/
education
For an aged/sick family
member's careOther
Both sexes 26,846.3 6,245.9 2,489.1 1,799.0 3,897.1 1,135.9 333.0 10,883.7 15 to 19 years old 1,701.2 89.2 226.5 630.3 17.5 1.9 5.9 727.3 20 to 29 7,981.4 2,190.5 514.6 1,096.8 1,969.1 176.4 21.5 1,997.7
30 to 39 8,094.4 1,833.2 861.7 48.4 1,682.7 606.3 44.7 2,999.6
40 to 49 3,532.0 953.9 349.1 19.2 168.2 294.6 58.4 1,681.5
50 to 59 2,542.4 776.2 279.6 3.6 45.6 48.4 72.8 1,309.9
60 to 69 1,378.8 316.2 161.2 0.3 10.5 5.8 50.7 827.0 70 years old and over 1,616.0 86.7 96.6 0.5 3.6 2.7 79.2 1,340.3Male 13,570.2 4,689.6 560.5 1,068.6 1,631.1 508.5 137.1 4,940.5 15 to 19 years old 894.0 57.4 112.6 350.6 4.3 0.7 3.8 363.9 20 to 29 3,974.5 1,428.8 154.5 679.3 727.4 63.4 10.4 903.3
30 to 39 4,122.9 1,471.4 124.2 26.4 790.5 261.3 18.2 1,419.0
40 to 49 1,969.6 806.7 51.7 10.3 87.2 147.9 26.9 835.0
50 to 59 1,386.8 626.8 53.0 1.7 17.4 30.9 29.9 624.2
60 to 69 691.5 236.6 39.4 0.3 3.1 3.5 23.6 380.0 70 years old and over 530.8 61.9 25.1 0.0 1.3 0.7 24.6 415.1Female 13,276.0 1,556.5 1,928.4 730.4 2,266.0 627.4 196.0 5,943.0 15 to 19 years old 807.2 32.0 113.9 279.7 13.2 1.2 2.3 363.5 20 to 29 4,006.8 761.5 360.2 417.3 1,241.7 112.8 11.4 1,094.7
30 to 39 3,971.8 361.8 737.4 22.1 892.2 344.8 26.5 1,580.4
40 to 49 1,562.2 147.2 297.3 8.8 81.0 146.6 31.4 846.6
50 to 59 1,155.3 149.5 226.8 1.9 28.1 17.7 43.0 685.6
60 to 69 687.4 79.6 121.6 0.0 7.4 2.3 27.0 447.0 70 years old and over 1,085.2 24.6 71.3 0.5 2.4 2.1 54.5 925.4Both sexes 100.0 23.3 9.3 6.7 14.5 4.2 1.2 40.5 15 to 19 years old 100.0 5.2 13.3 37.1 1.0 0.1 0.3 42.8 20 to 29 100.0 27.4 6.4 13.7 24.7 2.2 0.3 25.0
30 to 39 100.0 22.6 10.6 0.6 20.8 7.5 0.6 37.1
40 to 49 100.0 27.0 9.9 0.5 4.8 8.3 1.7 47.6
50 to 59 100.0 30.5 11.0 0.1 1.8 1.9 2.9 51.5
60 to 69 100.0 22.9 11.7 0.0 0.8 0.4 3.7 60.0 70 years old and over 100.0 5.4 6.0 0.0 0.2 0.2 4.9 82.9Male 100.0 34.6 4.1 7.9 12.0 3.7 1.0 36.4 15 to 19 years old 100.0 6.4 12.6 39.2 0.5 0.1 0.4 40.7 20 to 29 100.0 35.9 3.9 17.1 18.3 1.6 0.3 22.7
30 to 39 100.0 35.7 3.0 0.6 19.2 6.3 0.4 34.4
40 to 49 100.0 41.0 2.6 0.5 4.4 7.5 1.4 42.4
50 to 59 100.0 45.2 3.8 0.1 1.3 2.2 2.2 45.0
60 to 69 100.0 34.2 5.7 0.0 0.4 0.5 3.4 55.0 70 years old and over 100.0 11.7 4.7 0.0 0.2 0.1 4.6 78.2Female 100.0 11.7 14.5 5.5 17.1 4.7 1.5 44.8 15 to 19 years old 100.0 4.0 14.1 34.7 1.6 0.1 0.3 45.0 20 to 29 100.0 19.0 9.0 10.4 31.0 2.8 0.3 27.3
30 to 39 100.0 9.1 18.6 0.6 22.5 8.7 0.7 39.8
40 to 49 100.0 9.4 19.0 0.6 5.2 9.4 2.0 54.2
50 to 59 100.0 12.9 19.6 0.2 2.4 1.5 3.7 59.3
60 to 69 100.0 11.6 17.7 0.0 1.1 0.3 3.9 65.0 70 years old and over 100.0 2.3 6.6 0.0 0.2 0.2 5.0 85.3
Num
ber
Rat
io
5. Labour force status of households (1) Labour force status and age group of head of household
a. The ratio of households whose heads are engaged in work falls to its lowest since the start of survey.
Looking at the nation’s 53,998 thousand households in terms of the labour force status of head of
household, there were 35,070 thousand households in which the head of household was engaged in
work, and 18,841 thousand households in which the head of household was not engaged in work.
Compared to 2007, households whose heads were engaged in work decreased by 532 thousand,
while households whose heads were not engaged in work increased by 2,288 thousand.
The ratio of households whose heads were engaged in work to all households, which had been
decreasing since 1965, fell to its lowest at 64.9% in 2012 (decrease by 3.2 points from 2007). On the
other hand, households whose heads were not engaged in work accounted for 34.9% of all households
(increase by 3.2 points from 2007). (Fig. I-20, Table I-34)
Fig. I-20: Trends in ratio of households whose heads are engaged in work / 1956-2012
b. Households whose heads are not engaged in work account for 80% and over of all households whose heads are aged 60 and over.
Looking at households by labour force status and age group of head of household, households
whose heads were not engaged in work had a high ratio of householders aged 60 and over.
Households whose heads were aged 60 and over accounted for 80% and over of all households whose
heads were not engaged in work.
Compared to 2007, households whose heads were not engaged in work and aged 75 and over
increased by 1,832 thousand.
Looking at households whose heads were engaged in work by age group compared to 2007, there
was a decrease in almost all age groups, down by 2.1 points in the age group of “15 to 19 years old”
(32.4%) and by 1.8 points in “20 to 24” (66.8%). However, “60 to 64” increased by 0.8 points,
accounting for 70.3%. (Table I-34/35)
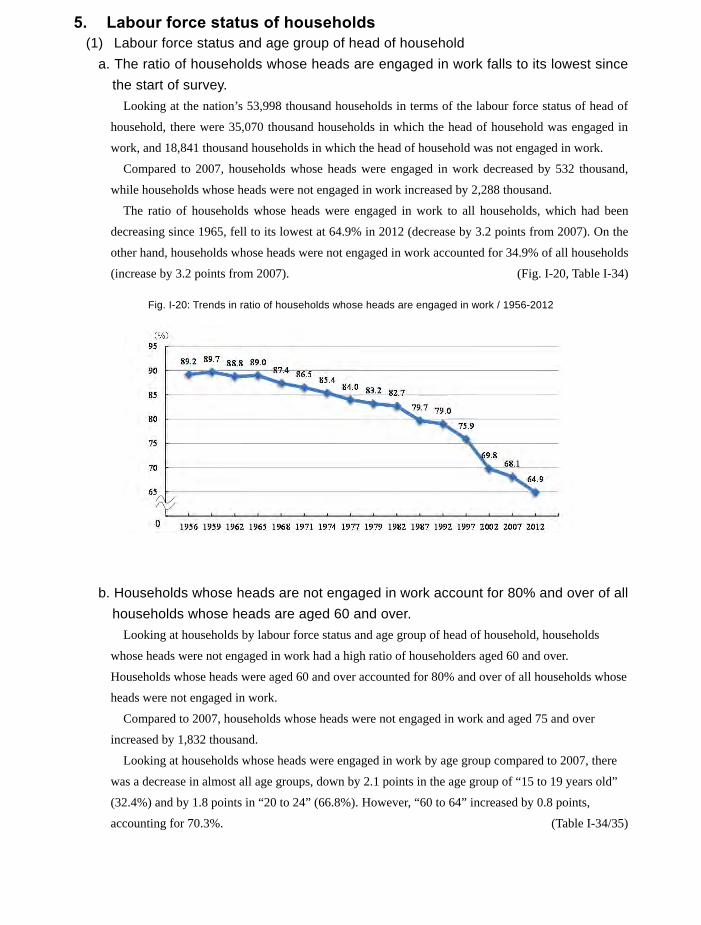
161
Table I-33: Number and ratio of persons who changed their place of usual residence during the past five years by sex,
age group and reason for changing address / 2002
(thousand persons, %)
TotalFor the
convenience ofown job
For theconvenience offamily member's
job
Attendingschool Marriage
For child(ren)'srearing/
education
For an aged/sick family
member's careOther
Both sexes 26,846.3 6,245.9 2,489.1 1,799.0 3,897.1 1,135.9 333.0 10,883.7 15 to 19 years old 1,701.2 89.2 226.5 630.3 17.5 1.9 5.9 727.3 20 to 29 7,981.4 2,190.5 514.6 1,096.8 1,969.1 176.4 21.5 1,997.7
30 to 39 8,094.4 1,833.2 861.7 48.4 1,682.7 606.3 44.7 2,999.6
40 to 49 3,532.0 953.9 349.1 19.2 168.2 294.6 58.4 1,681.5
50 to 59 2,542.4 776.2 279.6 3.6 45.6 48.4 72.8 1,309.9
60 to 69 1,378.8 316.2 161.2 0.3 10.5 5.8 50.7 827.0 70 years old and over 1,616.0 86.7 96.6 0.5 3.6 2.7 79.2 1,340.3Male 13,570.2 4,689.6 560.5 1,068.6 1,631.1 508.5 137.1 4,940.5 15 to 19 years old 894.0 57.4 112.6 350.6 4.3 0.7 3.8 363.9 20 to 29 3,974.5 1,428.8 154.5 679.3 727.4 63.4 10.4 903.3
30 to 39 4,122.9 1,471.4 124.2 26.4 790.5 261.3 18.2 1,419.0
40 to 49 1,969.6 806.7 51.7 10.3 87.2 147.9 26.9 835.0
50 to 59 1,386.8 626.8 53.0 1.7 17.4 30.9 29.9 624.2
60 to 69 691.5 236.6 39.4 0.3 3.1 3.5 23.6 380.0 70 years old and over 530.8 61.9 25.1 0.0 1.3 0.7 24.6 415.1Female 13,276.0 1,556.5 1,928.4 730.4 2,266.0 627.4 196.0 5,943.0 15 to 19 years old 807.2 32.0 113.9 279.7 13.2 1.2 2.3 363.5 20 to 29 4,006.8 761.5 360.2 417.3 1,241.7 112.8 11.4 1,094.7
30 to 39 3,971.8 361.8 737.4 22.1 892.2 344.8 26.5 1,580.4
40 to 49 1,562.2 147.2 297.3 8.8 81.0 146.6 31.4 846.6
50 to 59 1,155.3 149.5 226.8 1.9 28.1 17.7 43.0 685.6
60 to 69 687.4 79.6 121.6 0.0 7.4 2.3 27.0 447.0 70 years old and over 1,085.2 24.6 71.3 0.5 2.4 2.1 54.5 925.4Both sexes 100.0 23.3 9.3 6.7 14.5 4.2 1.2 40.5 15 to 19 years old 100.0 5.2 13.3 37.1 1.0 0.1 0.3 42.8 20 to 29 100.0 27.4 6.4 13.7 24.7 2.2 0.3 25.0
30 to 39 100.0 22.6 10.6 0.6 20.8 7.5 0.6 37.1
40 to 49 100.0 27.0 9.9 0.5 4.8 8.3 1.7 47.6
50 to 59 100.0 30.5 11.0 0.1 1.8 1.9 2.9 51.5
60 to 69 100.0 22.9 11.7 0.0 0.8 0.4 3.7 60.0 70 years old and over 100.0 5.4 6.0 0.0 0.2 0.2 4.9 82.9Male 100.0 34.6 4.1 7.9 12.0 3.7 1.0 36.4 15 to 19 years old 100.0 6.4 12.6 39.2 0.5 0.1 0.4 40.7 20 to 29 100.0 35.9 3.9 17.1 18.3 1.6 0.3 22.7
30 to 39 100.0 35.7 3.0 0.6 19.2 6.3 0.4 34.4
40 to 49 100.0 41.0 2.6 0.5 4.4 7.5 1.4 42.4
50 to 59 100.0 45.2 3.8 0.1 1.3 2.2 2.2 45.0
60 to 69 100.0 34.2 5.7 0.0 0.4 0.5 3.4 55.0 70 years old and over 100.0 11.7 4.7 0.0 0.2 0.1 4.6 78.2Female 100.0 11.7 14.5 5.5 17.1 4.7 1.5 44.8 15 to 19 years old 100.0 4.0 14.1 34.7 1.6 0.1 0.3 45.0 20 to 29 100.0 19.0 9.0 10.4 31.0 2.8 0.3 27.3
30 to 39 100.0 9.1 18.6 0.6 22.5 8.7 0.7 39.8
40 to 49 100.0 9.4 19.0 0.6 5.2 9.4 2.0 54.2
50 to 59 100.0 12.9 19.6 0.2 2.4 1.5 3.7 59.3
60 to 69 100.0 11.6 17.7 0.0 1.1 0.3 3.9 65.0 70 years old and over 100.0 2.3 6.6 0.0 0.2 0.2 5.0 85.3
Num
ber
Rat
io
5. Labour force status of households (1) Labour force status and age group of head of household
a. The ratio of households whose heads are engaged in work falls to its lowest since the start of survey.
Looking at the nation’s 53,998 thousand households in terms of the labour force status of head of
household, there were 35,070 thousand households in which the head of household was engaged in
work, and 18,841 thousand households in which the head of household was not engaged in work.
Compared to 2007, households whose heads were engaged in work decreased by 532 thousand,
while households whose heads were not engaged in work increased by 2,288 thousand.
The ratio of households whose heads were engaged in work to all households, which had been
decreasing since 1965, fell to its lowest at 64.9% in 2012 (decrease by 3.2 points from 2007). On the
other hand, households whose heads were not engaged in work accounted for 34.9% of all households
(increase by 3.2 points from 2007). (Fig. I-20, Table I-34)
Fig. I-20: Trends in ratio of households whose heads are engaged in work / 1956-2012
b. Households whose heads are not engaged in work account for 80% and over of all households whose heads are aged 60 and over.
Looking at households by labour force status and age group of head of household, households
whose heads were not engaged in work had a high ratio of householders aged 60 and over.
Households whose heads were aged 60 and over accounted for 80% and over of all households whose
heads were not engaged in work.
Compared to 2007, households whose heads were not engaged in work and aged 75 and over
increased by 1,832 thousand.
Looking at households whose heads were engaged in work by age group compared to 2007, there
was a decrease in almost all age groups, down by 2.1 points in the age group of “15 to 19 years old”
(32.4%) and by 1.8 points in “20 to 24” (66.8%). However, “60 to 64” increased by 0.8 points,
accounting for 70.3%. (Table I-34/35)
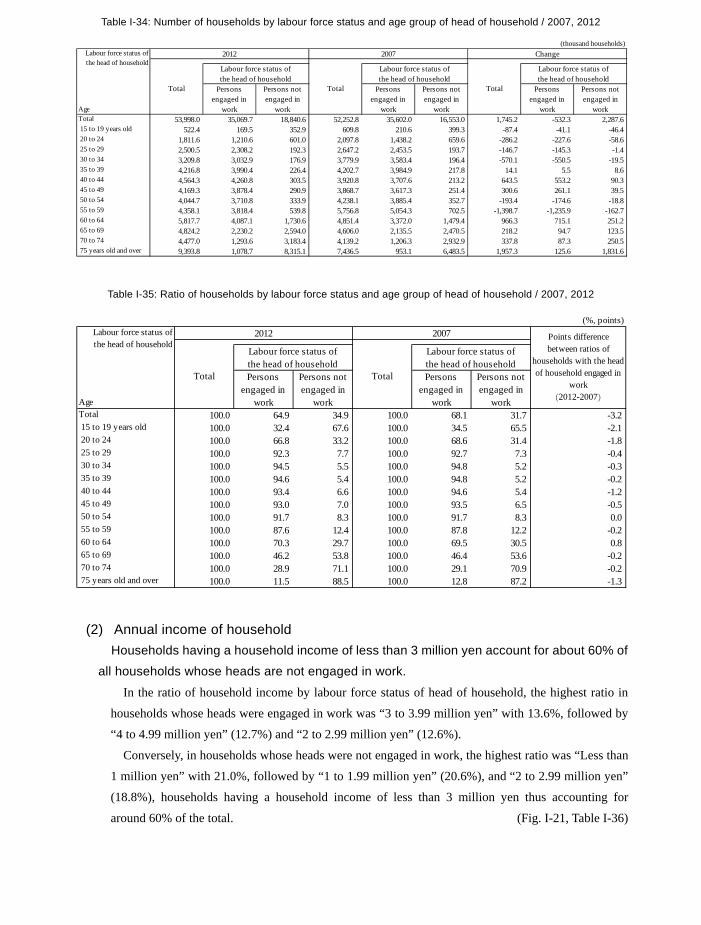
162
Table I-34: Number of households by labour force status and age group of head of household / 2007, 2012
Table I-35: Ratio of households by labour force status and age group of head of household / 2007, 2012
(2) Annual income of household Households having a household income of less than 3 million yen account for about 60% of
all households whose heads are not engaged in work. In the ratio of household income by labour force status of head of household, the highest ratio in
households whose heads were engaged in work was “3 to 3.99 million yen” with 13.6%, followed by
“4 to 4.99 million yen” (12.7%) and “2 to 2.99 million yen” (12.6%).
Conversely, in households whose heads were not engaged in work, the highest ratio was “Less than
1 million yen” with 21.0%, followed by “1 to 1.99 million yen” (20.6%), and “2 to 2.99 million yen”
(18.8%), households having a household income of less than 3 million yen thus accounting for
around 60% of the total. (Fig. I-21, Table I-36)
(thousand households)2012 2007 Change
Labour force status ofthe head of household
Labour force status ofthe head of household
Labour force status ofthe head of household
Age
Personsengaged in
work
Persons notengaged in
work
Personsengaged in
work
Persons notengaged in
work
Personsengaged in
work
Persons notengaged in
workTotal 53,998.0 35,069.7 18,840.6 52,252.8 35,602.0 16,553.0 1,745.2 -532.3 2,287.6 15 to 19 years old 522.4 169.5 352.9 609.8 210.6 399.3 -87.4 -41.1 -46.4 20 to 24 1,811.6 1,210.6 601.0 2,097.8 1,438.2 659.6 -286.2 -227.6 -58.6 25 to 29 2,500.5 2,308.2 192.3 2,647.2 2,453.5 193.7 -146.7 -145.3 -1.4 30 to 34 3,209.8 3,032.9 176.9 3,779.9 3,583.4 196.4 -570.1 -550.5 -19.5 35 to 39 4,216.8 3,990.4 226.4 4,202.7 3,984.9 217.8 14.1 5.5 8.6 40 to 44 4,564.3 4,260.8 303.5 3,920.8 3,707.6 213.2 643.5 553.2 90.3 45 to 49 4,169.3 3,878.4 290.9 3,868.7 3,617.3 251.4 300.6 261.1 39.5 50 to 54 4,044.7 3,710.8 333.9 4,238.1 3,885.4 352.7 -193.4 -174.6 -18.8 55 to 59 4,358.1 3,818.4 539.8 5,756.8 5,054.3 702.5 -1,398.7 -1,235.9 -162.7 60 to 64 5,817.7 4,087.1 1,730.6 4,851.4 3,372.0 1,479.4 966.3 715.1 251.2 65 to 69 4,824.2 2,230.2 2,594.0 4,606.0 2,135.5 2,470.5 218.2 94.7 123.5 70 to 74 4,477.0 1,293.6 3,183.4 4,139.2 1,206.3 2,932.9 337.8 87.3 250.5 75 years old and over 9,393.8 1,078.7 8,315.1 7,436.5 953.1 6,483.5 1,957.3 125.6 1,831.6
Total Total Total
Labour force status ofthe head of household
(%, points)2012 2007
Labour force status ofthe head of household
Labour force status ofthe head of household
Age
Personsengaged in
work
Persons notengaged in
work
Personsengaged in
work
Persons notengaged in
workTotal 100.0 64.9 34.9 100.0 68.1 31.7 -3.2 15 to 19 years old 100.0 32.4 67.6 100.0 34.5 65.5 -2.1 20 to 24 100.0 66.8 33.2 100.0 68.6 31.4 -1.8 25 to 29 100.0 92.3 7.7 100.0 92.7 7.3 -0.4 30 to 34 100.0 94.5 5.5 100.0 94.8 5.2 -0.3 35 to 39 100.0 94.6 5.4 100.0 94.8 5.2 -0.2 40 to 44 100.0 93.4 6.6 100.0 94.6 5.4 -1.2 45 to 49 100.0 93.0 7.0 100.0 93.5 6.5 -0.5 50 to 54 100.0 91.7 8.3 100.0 91.7 8.3 0.0 55 to 59 100.0 87.6 12.4 100.0 87.8 12.2 -0.2 60 to 64 100.0 70.3 29.7 100.0 69.5 30.5 0.8 65 to 69 100.0 46.2 53.8 100.0 46.4 53.6 -0.2 70 to 74 100.0 28.9 71.1 100.0 29.1 70.9 -0.2 75 years old and over 100.0 11.5 88.5 100.0 12.8 87.2 -1.3
Points differencebetween ratios of
households with the headof household engaged in
work(2012-2007)
Total Total
Labour force status ofthe head of household
Fig. I-21: Ratio of households by labour force status of head of household and income of household / 2012
Note) Where intervals between brackets have been widened, the height of the column has been adjusted accordingly.
Table I-36: Number and ratio of households by labour force status of head of household and income of household /2012
0
5
10
15
Lessthan
1million
yen
1 to
1.99million
yen
2to
2.99
3to
3.99
4to
4.99
5to
5.99
6to
6.99
7to
7.99
8to
8.99
9to
9.99
10to
12.49
12.5to
14.99
15to
19.99
20million
yenandover
(Households with the head of household engaged in work)(%)
0
5
10
15
20
25
Lessthan
1million
yen
1 to
1.99million
yen
2to
2.99
3to
3.99
4to
4.99
5to
5.99
6to
6.99
7to
7.99
8to
8.99
9to
9.99
10to
12.49
12.5to
14.99
15to
19.99
20million
yenandover
(Households with the head of household not engaged in work)(%)
(thousand households, %)Ratio
Labour force status ofthe head of household
Labour force status ofthe head of household
Personsengaged in
work
Persons notengaged in
work
Personsengaged in
work
Persons notengaged in
workTotal 53,998.0 35,069.7 18,840.6 100.0 100.0 100.0
5,169.5 1,208.1 3,960.3 9.6 3.4 21.06,493.3 2,606.5 3,884.2 12.0 7.4 20.67,941.1 4,402.4 3,536.8 14.7 12.6 18.87,175.1 4,760.9 2,411.6 13.3 13.6 12.85,699.7 4,451.0 1,247.7 10.6 12.7 6.64,671.8 3,871.5 799.2 8.7 11.0 4.23,620.6 3,113.8 506.1 6.7 8.9 2.72,791.3 2,433.8 356.9 5.2 6.9 1.92,245.4 1,979.5 265.8 4.2 5.6 1.41,631.6 1,443.4 187.8 3.0 4.1 1.02,487.7 2,242.7 244.6 4.6 6.4 1.31,031.5 938.1 93.3 1.9 2.7 0.5
732.8 680.0 52.7 1.4 1.9 0.3414.7 385.7 29.1 0.8 1.1 0.2 20 million yen and over
15 to 19.99
6 to 6.99 7 to 7.99 8 to 8.99 9 to 9.99 10 to 12.49 12.5 to 14.99
5 to 5.99
Total Total
Labour force status ofthe head of household
Number of households
Income of Household
Less than 1 million yen 1 to 1.99 million 2 to 2.99 3 to 3.99 4 to 4.99
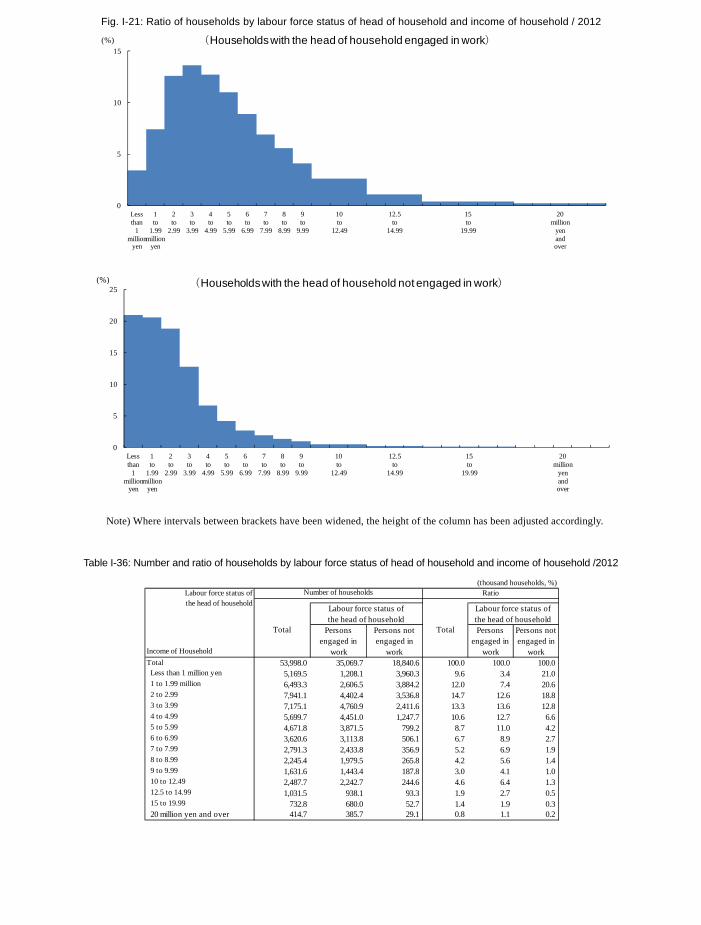
163
Table I-34: Number of households by labour force status and age group of head of household / 2007, 2012
Table I-35: Ratio of households by labour force status and age group of head of household / 2007, 2012
(2) Annual income of household Households having a household income of less than 3 million yen account for about 60% of
all households whose heads are not engaged in work. In the ratio of household income by labour force status of head of household, the highest ratio in
households whose heads were engaged in work was “3 to 3.99 million yen” with 13.6%, followed by
“4 to 4.99 million yen” (12.7%) and “2 to 2.99 million yen” (12.6%).
Conversely, in households whose heads were not engaged in work, the highest ratio was “Less than
1 million yen” with 21.0%, followed by “1 to 1.99 million yen” (20.6%), and “2 to 2.99 million yen”
(18.8%), households having a household income of less than 3 million yen thus accounting for
around 60% of the total. (Fig. I-21, Table I-36)
(thousand households)2012 2007 Change
Labour force status ofthe head of household
Labour force status ofthe head of household
Labour force status ofthe head of household
Age
Personsengaged in
work
Persons notengaged in
work
Personsengaged in
work
Persons notengaged in
work
Personsengaged in
work
Persons notengaged in
workTotal 53,998.0 35,069.7 18,840.6 52,252.8 35,602.0 16,553.0 1,745.2 -532.3 2,287.6 15 to 19 years old 522.4 169.5 352.9 609.8 210.6 399.3 -87.4 -41.1 -46.4 20 to 24 1,811.6 1,210.6 601.0 2,097.8 1,438.2 659.6 -286.2 -227.6 -58.6 25 to 29 2,500.5 2,308.2 192.3 2,647.2 2,453.5 193.7 -146.7 -145.3 -1.4 30 to 34 3,209.8 3,032.9 176.9 3,779.9 3,583.4 196.4 -570.1 -550.5 -19.5 35 to 39 4,216.8 3,990.4 226.4 4,202.7 3,984.9 217.8 14.1 5.5 8.6 40 to 44 4,564.3 4,260.8 303.5 3,920.8 3,707.6 213.2 643.5 553.2 90.3 45 to 49 4,169.3 3,878.4 290.9 3,868.7 3,617.3 251.4 300.6 261.1 39.5 50 to 54 4,044.7 3,710.8 333.9 4,238.1 3,885.4 352.7 -193.4 -174.6 -18.8 55 to 59 4,358.1 3,818.4 539.8 5,756.8 5,054.3 702.5 -1,398.7 -1,235.9 -162.7 60 to 64 5,817.7 4,087.1 1,730.6 4,851.4 3,372.0 1,479.4 966.3 715.1 251.2 65 to 69 4,824.2 2,230.2 2,594.0 4,606.0 2,135.5 2,470.5 218.2 94.7 123.5 70 to 74 4,477.0 1,293.6 3,183.4 4,139.2 1,206.3 2,932.9 337.8 87.3 250.5 75 years old and over 9,393.8 1,078.7 8,315.1 7,436.5 953.1 6,483.5 1,957.3 125.6 1,831.6
Total Total Total
Labour force status ofthe head of household
(%, points)2012 2007
Labour force status ofthe head of household
Labour force status ofthe head of household
Age
Personsengaged in
work
Persons notengaged in
work
Personsengaged in
work
Persons notengaged in
workTotal 100.0 64.9 34.9 100.0 68.1 31.7 -3.2 15 to 19 years old 100.0 32.4 67.6 100.0 34.5 65.5 -2.1 20 to 24 100.0 66.8 33.2 100.0 68.6 31.4 -1.8 25 to 29 100.0 92.3 7.7 100.0 92.7 7.3 -0.4 30 to 34 100.0 94.5 5.5 100.0 94.8 5.2 -0.3 35 to 39 100.0 94.6 5.4 100.0 94.8 5.2 -0.2 40 to 44 100.0 93.4 6.6 100.0 94.6 5.4 -1.2 45 to 49 100.0 93.0 7.0 100.0 93.5 6.5 -0.5 50 to 54 100.0 91.7 8.3 100.0 91.7 8.3 0.0 55 to 59 100.0 87.6 12.4 100.0 87.8 12.2 -0.2 60 to 64 100.0 70.3 29.7 100.0 69.5 30.5 0.8 65 to 69 100.0 46.2 53.8 100.0 46.4 53.6 -0.2 70 to 74 100.0 28.9 71.1 100.0 29.1 70.9 -0.2 75 years old and over 100.0 11.5 88.5 100.0 12.8 87.2 -1.3
Points differencebetween ratios of
households with the headof household engaged in
work(2012-2007)
Total Total
Labour force status ofthe head of household
Fig. I-21: Ratio of households by labour force status of head of household and income of household / 2012
Note) Where intervals between brackets have been widened, the height of the column has been adjusted accordingly.
Table I-36: Number and ratio of households by labour force status of head of household and income of household /2012
0
5
10
15
Lessthan
1million
yen
1 to
1.99million
yen
2to
2.99
3to
3.99
4to
4.99
5to
5.99
6to
6.99
7to
7.99
8to
8.99
9to
9.99
10to
12.49
12.5to
14.99
15to
19.99
20million
yenandover
(Households with the head of household engaged in work)(%)
0
5
10
15
20
25
Lessthan
1million
yen
1 to
1.99million
yen
2to
2.99
3to
3.99
4to
4.99
5to
5.99
6to
6.99
7to
7.99
8to
8.99
9to
9.99
10to
12.49
12.5to
14.99
15to
19.99
20million
yenandover
(Households with the head of household not engaged in work)(%)
(thousand households, %)Ratio
Labour force status ofthe head of household
Labour force status ofthe head of household
Personsengaged in
work
Persons notengaged in
work
Personsengaged in
work
Persons notengaged in
workTotal 53,998.0 35,069.7 18,840.6 100.0 100.0 100.0
5,169.5 1,208.1 3,960.3 9.6 3.4 21.06,493.3 2,606.5 3,884.2 12.0 7.4 20.67,941.1 4,402.4 3,536.8 14.7 12.6 18.87,175.1 4,760.9 2,411.6 13.3 13.6 12.85,699.7 4,451.0 1,247.7 10.6 12.7 6.64,671.8 3,871.5 799.2 8.7 11.0 4.23,620.6 3,113.8 506.1 6.7 8.9 2.72,791.3 2,433.8 356.9 5.2 6.9 1.92,245.4 1,979.5 265.8 4.2 5.6 1.41,631.6 1,443.4 187.8 3.0 4.1 1.02,487.7 2,242.7 244.6 4.6 6.4 1.31,031.5 938.1 93.3 1.9 2.7 0.5
732.8 680.0 52.7 1.4 1.9 0.3414.7 385.7 29.1 0.8 1.1 0.2 20 million yen and over
15 to 19.99
6 to 6.99 7 to 7.99 8 to 8.99 9 to 9.99 10 to 12.49 12.5 to 14.99
5 to 5.99
Total Total
Labour force status ofthe head of household
Number of households
Income of Household
Less than 1 million yen 1 to 1.99 million 2 to 2.99 3 to 3.99 4 to 4.99
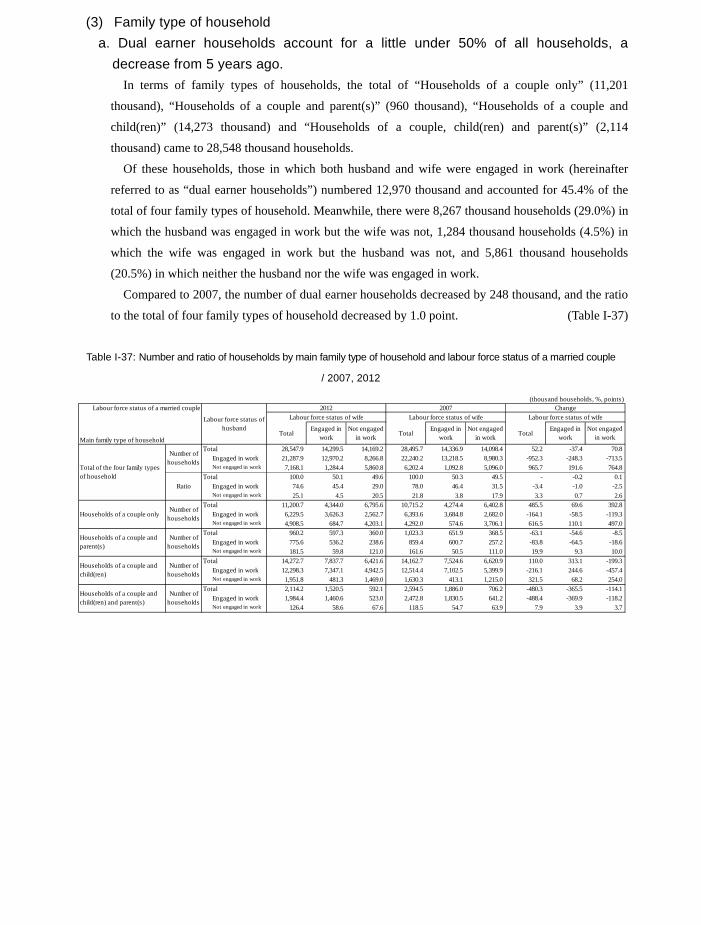
164
(3) Family type of household a. Dual earner households account for a little under 50% of all households, a
decrease from 5 years ago. In terms of family types of households, the total of “Households of a couple only” (11,201
thousand), “Households of a couple and parent(s)” (960 thousand), “Households of a couple and
child(ren)” (14,273 thousand) and “Households of a couple, child(ren) and parent(s)” (2,114
thousand) came to 28,548 thousand households.
Of these households, those in which both husband and wife were engaged in work (hereinafter
referred to as “dual earner households”) numbered 12,970 thousand and accounted for 45.4% of the
total of four family types of household. Meanwhile, there were 8,267 thousand households (29.0%) in
which the husband was engaged in work but the wife was not, 1,284 thousand households (4.5%) in
which the wife was engaged in work but the husband was not, and 5,861 thousand households
(20.5%) in which neither the husband nor the wife was engaged in work.
Compared to 2007, the number of dual earner households decreased by 248 thousand, and the ratio
to the total of four family types of household decreased by 1.0 point. (Table I-37)
Table I-37: Number and ratio of households by main family type of household and labour force status of a married couple
/ 2007, 2012
(thousand households, %, points)Labour force status of a married couple 2012 2007 Change
Labour force status of wife Labour force status of wife Labour force status of wife
Main family type of householdTotal
Engaged inwork
Not engagedin work Total
Engaged inwork
Not engagedin work Total
Engaged inwork
Not engagedin work
Total 28,547.9 14,299.5 14,169.2 28,495.7 14,336.9 14,098.4 52.2 -37.4 70.8Engaged in work 21,287.9 12,970.2 8,266.8 22,240.2 13,218.5 8,980.3 -952.3 -248.3 -713.5Not engaged in work 7,168.1 1,284.4 5,860.8 6,202.4 1,092.8 5,096.0 965.7 191.6 764.8
Total 100.0 50.1 49.6 100.0 50.3 49.5 - -0.2 0.1Engaged in work 74.6 45.4 29.0 78.0 46.4 31.5 -3.4 -1.0 -2.5Not engaged in work 25.1 4.5 20.5 21.8 3.8 17.9 3.3 0.7 2.6
Total 11,200.7 4,344.0 6,795.6 10,715.2 4,274.4 6,402.8 485.5 69.6 392.8Engaged in work 6,229.5 3,626.3 2,562.7 6,393.6 3,684.8 2,682.0 -164.1 -58.5 -119.3Not engaged in work 4,908.5 684.7 4,203.1 4,292.0 574.6 3,706.1 616.5 110.1 497.0
Total 960.2 597.3 360.0 1,023.3 651.9 368.5 -63.1 -54.6 -8.5Engaged in work 775.6 536.2 238.6 859.4 600.7 257.2 -83.8 -64.5 -18.6Not engaged in work 181.5 59.8 121.0 161.6 50.5 111.0 19.9 9.3 10.0
Total 14,272.7 7,837.7 6,421.6 14,162.7 7,524.6 6,620.9 110.0 313.1 -199.3Engaged in work 12,298.3 7,347.1 4,942.5 12,514.4 7,102.5 5,399.9 -216.1 244.6 -457.4Not engaged in work 1,951.8 481.3 1,469.0 1,630.3 413.1 1,215.0 321.5 68.2 254.0
Total 2,114.2 1,520.5 592.1 2,594.5 1,886.0 706.2 -480.3 -365.5 -114.1Engaged in work 1,984.4 1,460.6 523.0 2,472.8 1,830.5 641.2 -488.4 -369.9 -118.2Not engaged in work 126.4 58.6 67.6 118.5 54.7 63.9 7.9 3.9 3.7
Households of a couple onlyNumber of
households
Labour force status ofhusband
Total of the four family typesof household
Number ofhouseholds
Ratio
Households of a couple andparent(s)
Number ofhouseholds
Households of a couple andchild(ren)
Number ofhouseholds
Households of a couple andchild(ren) and parent(s)
Number ofhouseholds
b. Households with husbands earning “2.5 to 2.99 million yen” have the highest ratio of wives engaged in work.
In terms of the ratio of wives engaged in work to households with husbands engaged in work by
income of husband (annual income from main job), it was highest with 65.8% in households whose
husband’s income group was “2.5 to 2.99 million yen”.
The ratio of households in which both husband and wife were engaged in work and the wife’s
employment type was a “Part-time worker” exceeded 25% in all husband’s income groups from 2 to
9.99 million yen, and was highest in “2.5 to 2.99 million yen” accounting for 28.3%.
(Fig. I-22, Table I-38)
Fig. I-22: Ratio of wives engaged in work by husband’s income group / 2012
53.7 58.0
60.9 63.8 65.8 65.3 63.7
61.2 61.1 60.5 56.9 56.1
52.3 47.3
52.0
16.0 21.0
23.3 26.0
28.3 27.1 26.4 26.0 26.1 26.2 26.4 25.8 20.7
17.4
9.8
0
10
20
30
40
50
60
70
80
Less than
1 million
yen
1 to 1.49
million yen
1.5 to 1.99
2 to 2.49
2.5 to 2.99
3 to 3.99
4 to 4.99
5 to 5.99
6 to 6.99
7 to 7.99
8 to 8.99
9 to 9.99
10 to 12.49
12.5 to 14.99
15 million
yen and over
Ratio of wives engaged in workOf which wives are part-time workers
(%)
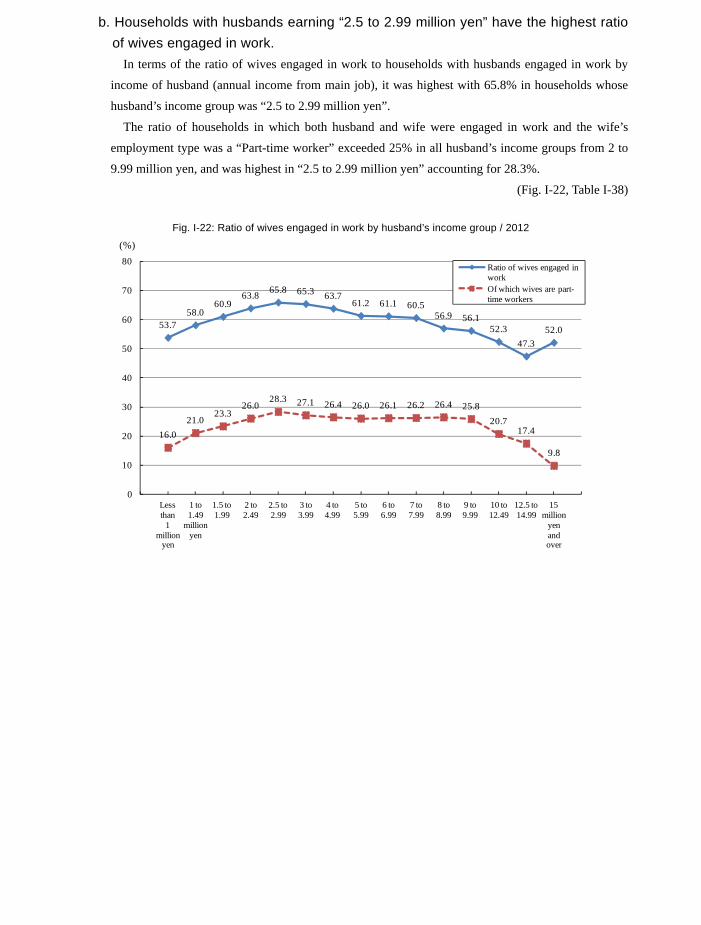
165
(3) Family type of household a. Dual earner households account for a little under 50% of all households, a
decrease from 5 years ago. In terms of family types of households, the total of “Households of a couple only” (11,201
thousand), “Households of a couple and parent(s)” (960 thousand), “Households of a couple and
child(ren)” (14,273 thousand) and “Households of a couple, child(ren) and parent(s)” (2,114
thousand) came to 28,548 thousand households.
Of these households, those in which both husband and wife were engaged in work (hereinafter
referred to as “dual earner households”) numbered 12,970 thousand and accounted for 45.4% of the
total of four family types of household. Meanwhile, there were 8,267 thousand households (29.0%) in
which the husband was engaged in work but the wife was not, 1,284 thousand households (4.5%) in
which the wife was engaged in work but the husband was not, and 5,861 thousand households
(20.5%) in which neither the husband nor the wife was engaged in work.
Compared to 2007, the number of dual earner households decreased by 248 thousand, and the ratio
to the total of four family types of household decreased by 1.0 point. (Table I-37)
Table I-37: Number and ratio of households by main family type of household and labour force status of a married couple
/ 2007, 2012
(thousand households, %, points)Labour force status of a married couple 2012 2007 Change
Labour force status of wife Labour force status of wife Labour force status of wife
Main family type of householdTotal
Engaged inwork
Not engagedin work Total
Engaged inwork
Not engagedin work Total
Engaged inwork
Not engagedin work
Total 28,547.9 14,299.5 14,169.2 28,495.7 14,336.9 14,098.4 52.2 -37.4 70.8Engaged in work 21,287.9 12,970.2 8,266.8 22,240.2 13,218.5 8,980.3 -952.3 -248.3 -713.5Not engaged in work 7,168.1 1,284.4 5,860.8 6,202.4 1,092.8 5,096.0 965.7 191.6 764.8
Total 100.0 50.1 49.6 100.0 50.3 49.5 - -0.2 0.1Engaged in work 74.6 45.4 29.0 78.0 46.4 31.5 -3.4 -1.0 -2.5Not engaged in work 25.1 4.5 20.5 21.8 3.8 17.9 3.3 0.7 2.6
Total 11,200.7 4,344.0 6,795.6 10,715.2 4,274.4 6,402.8 485.5 69.6 392.8Engaged in work 6,229.5 3,626.3 2,562.7 6,393.6 3,684.8 2,682.0 -164.1 -58.5 -119.3Not engaged in work 4,908.5 684.7 4,203.1 4,292.0 574.6 3,706.1 616.5 110.1 497.0
Total 960.2 597.3 360.0 1,023.3 651.9 368.5 -63.1 -54.6 -8.5Engaged in work 775.6 536.2 238.6 859.4 600.7 257.2 -83.8 -64.5 -18.6Not engaged in work 181.5 59.8 121.0 161.6 50.5 111.0 19.9 9.3 10.0
Total 14,272.7 7,837.7 6,421.6 14,162.7 7,524.6 6,620.9 110.0 313.1 -199.3Engaged in work 12,298.3 7,347.1 4,942.5 12,514.4 7,102.5 5,399.9 -216.1 244.6 -457.4Not engaged in work 1,951.8 481.3 1,469.0 1,630.3 413.1 1,215.0 321.5 68.2 254.0
Total 2,114.2 1,520.5 592.1 2,594.5 1,886.0 706.2 -480.3 -365.5 -114.1Engaged in work 1,984.4 1,460.6 523.0 2,472.8 1,830.5 641.2 -488.4 -369.9 -118.2Not engaged in work 126.4 58.6 67.6 118.5 54.7 63.9 7.9 3.9 3.7
Households of a couple onlyNumber of
households
Labour force status ofhusband
Total of the four family typesof household
Number ofhouseholds
Ratio
Households of a couple andparent(s)
Number ofhouseholds
Households of a couple andchild(ren)
Number ofhouseholds
Households of a couple andchild(ren) and parent(s)
Number ofhouseholds
b. Households with husbands earning “2.5 to 2.99 million yen” have the highest ratio of wives engaged in work.
In terms of the ratio of wives engaged in work to households with husbands engaged in work by
income of husband (annual income from main job), it was highest with 65.8% in households whose
husband’s income group was “2.5 to 2.99 million yen”.
The ratio of households in which both husband and wife were engaged in work and the wife’s
employment type was a “Part-time worker” exceeded 25% in all husband’s income groups from 2 to
9.99 million yen, and was highest in “2.5 to 2.99 million yen” accounting for 28.3%.
(Fig. I-22, Table I-38)
Fig. I-22: Ratio of wives engaged in work by husband’s income group / 2012
53.7 58.0
60.9 63.8 65.8 65.3 63.7
61.2 61.1 60.5 56.9 56.1
52.3 47.3
52.0
16.0 21.0
23.3 26.0
28.3 27.1 26.4 26.0 26.1 26.2 26.4 25.8 20.7
17.4
9.8
0
10
20
30
40
50
60
70
80
Less than
1 million
yen
1 to 1.49
million yen
1.5 to 1.99
2 to 2.49
2.5 to 2.99
3 to 3.99
4 to 4.99
5 to 5.99
6 to 6.99
7 to 7.99
8 to 8.99
9 to 9.99
10 to 12.49
12.5 to 14.99
15 million
yen and over
Ratio of wives engaged in workOf which wives are part-time workers
(%)
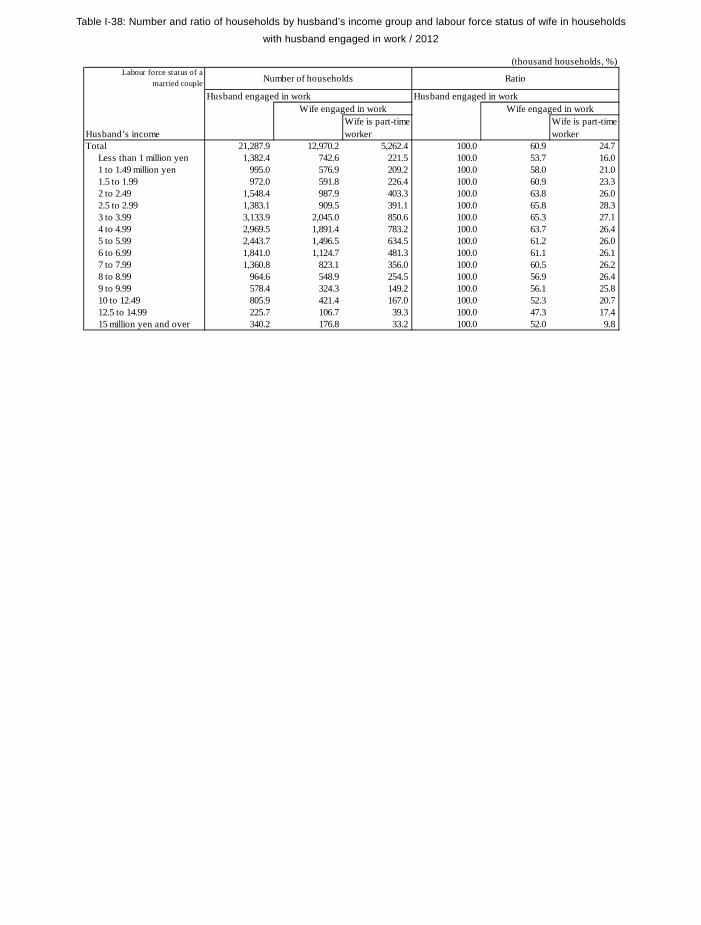
166
Table I-38: Number and ratio of households by husband’s income group and labour force status of wife in households
with husband engaged in work / 2012
(thousand households, %)Labour force status of a
married couple Number of households Ratio
Husband engaged in work Husband engaged in workWife engaged in work Wife engaged in work
Husband’s incomeWife is part-timeworker
Wife is part-timeworker
Total 21,287.9 12,970.2 5,262.4 100.0 60.9 24.7Less than 1 million yen 1,382.4 742.6 221.5 100.0 53.7 16.01 to 1.49 million yen 995.0 576.9 209.2 100.0 58.0 21.01.5 to 1.99 972.0 591.8 226.4 100.0 60.9 23.32 to 2.49 1,548.4 987.9 403.3 100.0 63.8 26.02.5 to 2.99 1,383.1 909.5 391.1 100.0 65.8 28.33 to 3.99 3,133.9 2,045.0 850.6 100.0 65.3 27.14 to 4.99 2,969.5 1,891.4 783.2 100.0 63.7 26.45 to 5.99 2,443.7 1,496.5 634.5 100.0 61.2 26.06 to 6.99 1,841.0 1,124.7 481.3 100.0 61.1 26.17 to 7.99 1,360.8 823.1 356.0 100.0 60.5 26.28 to 8.99 964.6 548.9 254.5 100.0 56.9 26.49 to 9.99 578.4 324.3 149.2 100.0 56.1 25.810 to 12.49 805.9 421.4 167.0 100.0 52.3 20.712.5 to 14.99 225.7 106.7 39.3 100.0 47.3 17.415 million yen and over 340.2 176.8 33.2 100.0 52.0 9.8
(thousand persons, %)
Total Lost own job Other
Japan 110,815.1 5,700.7 210.0 2,046.6 3,444.1 55,622.5 47,309.1 Total of three devastated prefectures 4,868.2 1,139.2 85.5 658.0 395.8 1,517.0 2,137.2 Iwate-ken 1,140.1 217.7 15.0 120.7 82.1 410.1 499.1 Miyagi-ken 2,020.7 479.4 41.1 267.0 171.3 617.1 888.3 Fukushima-ken 1,707.4 442.1 29.4 270.3 142.4 489.8 749.8 Other prefectures 105,946.9 4,561.5 124.6 1,388.6 3,048.2 54,105.5 45,172.0
Japan 100.0 100.0 100.0 100.0 100.0 100.0 100.0 Total of three devastated prefectures 4.4 20.0 40.7 32.2 11.5 2.7 4.5 Iwate-ken 1.0 3.8 7.1 5.9 2.4 0.7 1.1 Miyagi-ken 1.8 8.4 19.6 13.0 5.0 1.1 1.9 Fukushima-ken 1.5 7.8 14.0 13.2 4.1 0.9 1.6 Other prefectures 95.6 80.0 59.3 67.8 88.5 97.3 95.5
Num
ber
Rat
io
Whether job affected from the earthquake byprimary damage
TotalAffected
Not affectedHad no
occupation atthe timeTook a leave
of absence
II. Changes in employment status in terms of recent socio-economic conditions
II-1. How the Great East Japan Earthquake affected jobs 1. How the earthquake affected jobs
a. 210 thousand persons lose their jobs due to the earthquake, more than 40% of whom are residents in three devastated prefectures. The Great East Japan Earthquake directly affected the jobs of 5,701 thousand persons (including
those who were forced to quit their jobs or temporarily retire from work). There were 1,139 thousand
affected persons in three devastated prefectures (i.e. Iwate-ken, Miyagi-ken and Fukushima-ken; the
same shall apply hereafter), and 4,562 thousand in other prefectures.
Among them, persons who lost their jobs numbered 210 thousand, consisting of 86 thousand in three
devastated prefectures and 125 thousand in other prefectures. This means 40% or more of persons who
lost their jobs were residents in three devastated prefectures.
Persons who took a leave of absence numbered 2,047 thousand, consisting of 658 thousand in three
devastated prefectures and 1,389 thousand in other prefectures. This means 30% or more of persons who
temporarily retired from work were residents in three devastated prefectures. (Table II-1-1, Fig.II-1-1)
Table II-1-1: Number and ratio of persons aged 15 and over by whether job was affected from
the earthquake by primary damage / 2012
Fig.II-1-1: Number and ratio of persons aged 15 and over by labour force status, status in employment, type of
employment, and whether job was affected by the earthquake by primary damage / 2012
Took a leave of absence
35.9%2,047
thousand peopleOther
60.4%3,444 thousand people
Lost own job 3.7%210 thousandpeople
Affected 5,701
thousandpeople
Not engaged in work40.3%
Lost own job210 thousand
people
Engaged in work59.7%
Employees, excluding executive of company or corporation56.4%
Regular staffs (41.8%)
Irregular staffs (58.2%)
* Values given in parentheses indicate the percentage in all employees, excluding executive of company or corporation.
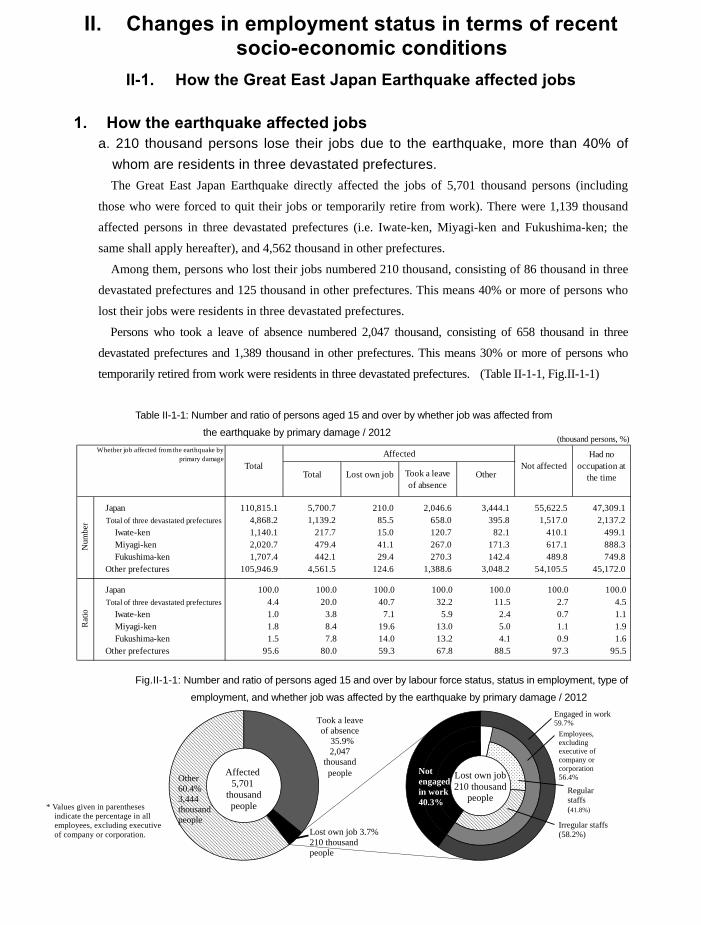
167
Table I-38: Number and ratio of households by husband’s income group and labour force status of wife in households
with husband engaged in work / 2012
(thousand households, %)Labour force status of a
married couple Number of households Ratio
Husband engaged in work Husband engaged in workWife engaged in work Wife engaged in work
Husband’s incomeWife is part-timeworker
Wife is part-timeworker
Total 21,287.9 12,970.2 5,262.4 100.0 60.9 24.7Less than 1 million yen 1,382.4 742.6 221.5 100.0 53.7 16.01 to 1.49 million yen 995.0 576.9 209.2 100.0 58.0 21.01.5 to 1.99 972.0 591.8 226.4 100.0 60.9 23.32 to 2.49 1,548.4 987.9 403.3 100.0 63.8 26.02.5 to 2.99 1,383.1 909.5 391.1 100.0 65.8 28.33 to 3.99 3,133.9 2,045.0 850.6 100.0 65.3 27.14 to 4.99 2,969.5 1,891.4 783.2 100.0 63.7 26.45 to 5.99 2,443.7 1,496.5 634.5 100.0 61.2 26.06 to 6.99 1,841.0 1,124.7 481.3 100.0 61.1 26.17 to 7.99 1,360.8 823.1 356.0 100.0 60.5 26.28 to 8.99 964.6 548.9 254.5 100.0 56.9 26.49 to 9.99 578.4 324.3 149.2 100.0 56.1 25.810 to 12.49 805.9 421.4 167.0 100.0 52.3 20.712.5 to 14.99 225.7 106.7 39.3 100.0 47.3 17.415 million yen and over 340.2 176.8 33.2 100.0 52.0 9.8
(thousand persons, %)
Total Lost own job Other
Japan 110,815.1 5,700.7 210.0 2,046.6 3,444.1 55,622.5 47,309.1 Total of three devastated prefectures 4,868.2 1,139.2 85.5 658.0 395.8 1,517.0 2,137.2 Iwate-ken 1,140.1 217.7 15.0 120.7 82.1 410.1 499.1 Miyagi-ken 2,020.7 479.4 41.1 267.0 171.3 617.1 888.3 Fukushima-ken 1,707.4 442.1 29.4 270.3 142.4 489.8 749.8 Other prefectures 105,946.9 4,561.5 124.6 1,388.6 3,048.2 54,105.5 45,172.0
Japan 100.0 100.0 100.0 100.0 100.0 100.0 100.0 Total of three devastated prefectures 4.4 20.0 40.7 32.2 11.5 2.7 4.5 Iwate-ken 1.0 3.8 7.1 5.9 2.4 0.7 1.1 Miyagi-ken 1.8 8.4 19.6 13.0 5.0 1.1 1.9 Fukushima-ken 1.5 7.8 14.0 13.2 4.1 0.9 1.6 Other prefectures 95.6 80.0 59.3 67.8 88.5 97.3 95.5
Num
ber
Rat
io
Whether job affected from the earthquake byprimary damage
TotalAffected
Not affectedHad no
occupation atthe timeTook a leave
of absence
II. Changes in employment status in terms of recent socio-economic conditions
II-1. How the Great East Japan Earthquake affected jobs 1. How the earthquake affected jobs
a. 210 thousand persons lose their jobs due to the earthquake, more than 40% of whom are residents in three devastated prefectures. The Great East Japan Earthquake directly affected the jobs of 5,701 thousand persons (including
those who were forced to quit their jobs or temporarily retire from work). There were 1,139 thousand
affected persons in three devastated prefectures (i.e. Iwate-ken, Miyagi-ken and Fukushima-ken; the
same shall apply hereafter), and 4,562 thousand in other prefectures.
Among them, persons who lost their jobs numbered 210 thousand, consisting of 86 thousand in three
devastated prefectures and 125 thousand in other prefectures. This means 40% or more of persons who
lost their jobs were residents in three devastated prefectures.
Persons who took a leave of absence numbered 2,047 thousand, consisting of 658 thousand in three
devastated prefectures and 1,389 thousand in other prefectures. This means 30% or more of persons who
temporarily retired from work were residents in three devastated prefectures. (Table II-1-1, Fig.II-1-1)
Table II-1-1: Number and ratio of persons aged 15 and over by whether job was affected from
the earthquake by primary damage / 2012
Fig.II-1-1: Number and ratio of persons aged 15 and over by labour force status, status in employment, type of
employment, and whether job was affected by the earthquake by primary damage / 2012
Took a leave of absence
35.9%2,047
thousand peopleOther
60.4%3,444 thousand people
Lost own job 3.7%210 thousandpeople
Affected 5,701
thousandpeople
Not engaged in work40.3%
Lost own job210 thousand
people
Engaged in work59.7%
Employees, excluding executive of company or corporation56.4%
Regular staffs (41.8%)
Irregular staffs (58.2%)
* Values given in parentheses indicate the percentage in all employees, excluding executive of company or corporation.
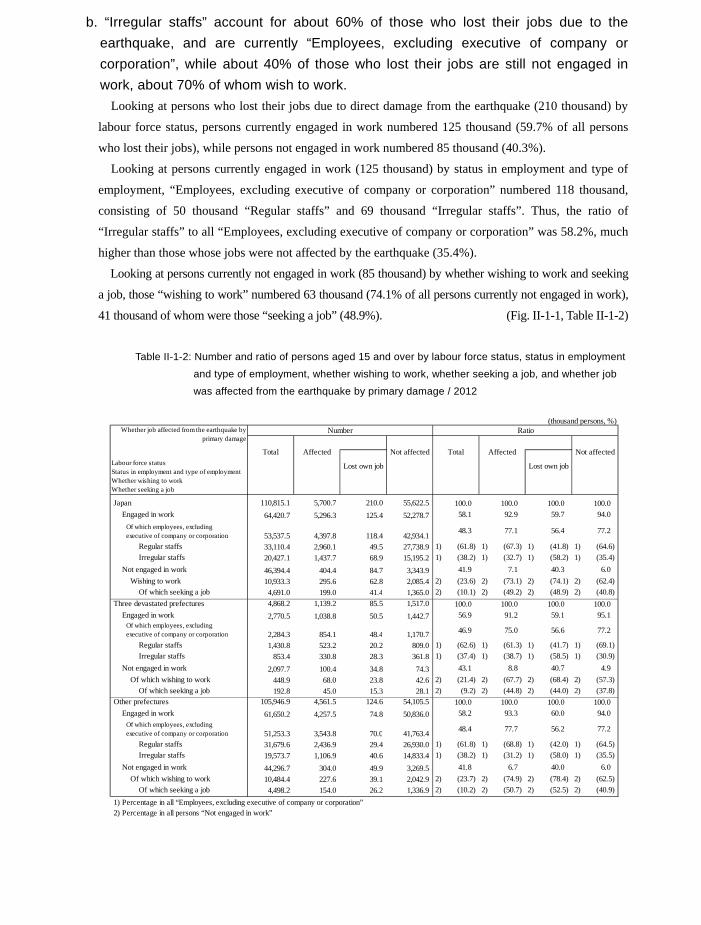
168
b. “Irregular staffs” account for about 60% of those who lost their jobs due to the earthquake, and are currently “Employees, excluding executive of company or corporation”, while about 40% of those who lost their jobs are still not engaged in work, about 70% of whom wish to work.
Looking at persons who lost their jobs due to direct damage from the earthquake (210 thousand) by
labour force status, persons currently engaged in work numbered 125 thousand (59.7% of all persons
who lost their jobs), while persons not engaged in work numbered 85 thousand (40.3%).
Looking at persons currently engaged in work (125 thousand) by status in employment and type of
employment, “Employees, excluding executive of company or corporation” numbered 118 thousand,
consisting of 50 thousand “Regular staffs” and 69 thousand “Irregular staffs”. Thus, the ratio of
“Irregular staffs” to all “Employees, excluding executive of company or corporation” was 58.2%, much
higher than those whose jobs were not affected by the earthquake (35.4%).
Looking at persons currently not engaged in work (85 thousand) by whether wishing to work and seeking
a job, those “wishing to work” numbered 63 thousand (74.1% of all persons currently not engaged in work),
41 thousand of whom were those “seeking a job” (48.9%). (Fig. II-1-1, Table II-1-2)
Table II-1-2: Number and ratio of persons aged 15 and over by labour force status, status in employment
and type of employment, whether wishing to work, whether seeking a job, and whether job
was affected from the earthquake by primary damage / 2012
Japan 100.0 100.0 100.0 100.0 Engaged in work 58.1 92.9 59.7 94.0 Of which employees, excluding executive of company or corporation
48.3 77.1 56.4 77.2
Regular staffs 1) 1) 1) 1) Irregular staffs 1) 1) 1) 1) Not engaged in work 41.9 7.1 40.3 6.0 Wishing to work 2) 2) 2) 2) Of which seeking a job 2) 2) 2) 2) Three devastated prefectures 100.0 100.0 100.0 100.0 Engaged in work 56.9 91.2 59.1 95.1 Of which employees, excluding executive of company or corporation 46.9 75.0 56.6 77.2
Regular staffs 1) 1) 1) 1) Irregular staffs 1) 1) 1) 1) Not engaged in work 43.1 8.8 40.7 4.9 Of which wishing to work 2) 2) 2) 2) Of which seeking a job 2) 2) 2) 2) Other prefectures 100.0 100.0 100.0 100.0 Engaged in work 58.2 93.3 60.0 94.0 Of which employees, excluding executive of company or corporation 48.4 77.7 56.2 77.2
Regular staffs 1) 1) 1) 1) Irregular staffs 1) 1) 1) 1) Not engaged in work 41.8 6.7 40.0 6.0 Of which wishing to work 2) 2) 2) 2) Of which seeking a job 2) 2) 2) 2) 1) Percentage in all “Employees, excluding executive of company or corporation” 2) Percentage in all persons “Not engaged in work”
(thousand persons, %)Whether job affected from the earthquake by
primary damageNumber Ratio
Total Affected Not affected Total Affected Not affectedLabour force statusStatus in employment and type of employmentWhether wishing to workWhether seeking a job
Lost own job Lost own job
64,420.7 5,296.3 125.4 52,278.7
(58.2)
53,537.5 4,397.8 118.4 42,934.1
110,815.1 5,700.7 210.0 55,622.5
(35.4)
46,394.4 404.4 84.7 3,343.9
(61.8) (67.3) (41.8) (64.6)20,427.1 1,437.7 68.9 15,195.2 (38.2) (32.7)33,110.4 2,960.1 49.5 27,738.9
(74.1) (62.4)4,691.0 199.0 41.4 1,365.0 (10.1) (49.2) (48.9) (40.8)
10,933.3 295.6 62.8 2,085.4 (23.6) (73.1)
2,284.3 854.1 48.4 1,170.71,430.8 523.2 20.2 809.0
4,868.2 1,139.2 85.5 1,517.02,770.5 1,038.8 50.5 1,442.7
(58.5) (30.9)
2,097.7 100.4 34.8 74.3
(62.6) (61.3) (41.7) (69.1)853.4 330.8 28.3 361.8 (37.4) (38.7)
(68.4) (57.3)192.8 45.0 15.3 28.1 (9.2) (44.8) (44.0) (37.8)448.9 68.0 23.8 42.6 (21.4) (67.7)
51,253.3 3,543.8 70.0 41,763.431,679.6 2,436.9 29.4 26,930.0
105,946.9 4,561.5 124.6 54,105.561,650.2 4,257.5 74.8 50,836.0
(58.0) (35.5)
44,296.7 304.0 49.9 3,269.5
(61.8) (68.8) (42.0) (64.5)19,573.7 1,106.9 40.6 14,833.4 (38.2) (31.2)
(78.4) (62.5)4,498.2 154.0 26.2 1,336.9 (10.2) (50.7) (52.5) (40.9)
10,484.4 227.6 39.1 2,042.9 (23.7) (74.9)
c. Among persons who lost their jobs due to the earthquake and had a previous job as “Regular staff”, those currently employed as “Regular staff” account for about 40%.
For persons who lost their jobs due to direct damage from the earthquake (210 thousand), when
comparing the status in employment and type of employment Note) between their previous and present
jobs, persons currently engaged in work accounted for 62.4% of those who had a previous job as
“Employees, excluding executive of company or corporation”, and 27.2% of those who had a previous
job as “Self-employed workers”.
Looking at the breakdown of those who had a previous job as “Employees, excluding executive of
company or corporation”, the ratio of persons currently engaged in work was higher among those who
had been employed as “Regular staffs” (66.8%) than among those who had been employed as “Irregular
staffs” (59.3%).
The ratio of persons currently employed as “Regular staffs” was also higher among those who had
been employed as “Regular staffs” (41.9%) than among those who had been employed as “Irregular
staffs” (13.0%). (Table II-1-3)
Note) The “status in employment and type of employment in the previous job” of those who lost their
own jobs due to direct damage from the earthquake does not always correspond exactly to the
“status in employment and type of employment just before the earthquake” (because those who
had taken up a job and then quit the job several times up to the time of survey after the earthquake
are included).
Table II-1-3: Number and ratio of those who left their jobs (those who lost their own jobs due to direct damage
from the earthquake) by status in employment and type of employment in the previous job, labour
force status, and status in employment and type of employment in the present job / 2012
(thousand persons, %)
Total
Total
Total
Total 210.0 125.4 3.4 0.5 121.2 2.8 118.4 49.5 68.9 84.7 Self-employed workers 14.7 4.0 0.9 - 3.1 - 3.1 1.1 2.0 10.7 Family workers 5.3 1.9 - 0.2 1.6 - 1.6 0.5 1.2 3.5 Employees 183.0 114.1 2.4 0.2 111.5 2.8 108.7 45.5 63.2 69.0 Executives of company or corporation 3.8 2.2 0.1 - 2.1 0.4 1.8 0.6 1.2 1.6 Employees, excluding executive of company or corporation 179.2 111.9 2.3 0.2 109.4 2.4 106.9 44.9 62.0 67.4 Regular staffs 75.0 50.1 1.9 - 48.2 2.2 46.0 31.4 14.6 24.9 Irregular staffs 104.2 61.8 0.5 0.2 61.1 0.2 60.9 13.5 47.4 42.5
Total 100.0 59.7 1.6 0.2 57.7 1.3 56.4 23.6 32.8 40.3 Self-employed workers 100.0 27.2 6.1 - 21.1 - 21.1 7.5 13.6 72.8 Family workers 100.0 35.8 - 3.8 30.2 - 30.2 9.4 22.6 66.0 Employees 100.0 62.3 1.3 0.1 60.9 1.5 59.4 24.9 34.5 37.7 Executives of company or corporation 100.0 57.9 2.6 - 55.3 10.5 47.4 15.8 31.6 42.1 Employees, excluding executive of company or corporation 100.0 62.4 1.3 0.1 61.0 1.3 59.7 25.1 34.6 37.6 Regular staffs 100.0 66.8 2.5 - 64.3 2.9 61.3 41.9 19.5 33.2 Irregular staffs 100.0 59.3 0.5 0.2 58.6 0.2 58.4 13.0 45.5 40.8
Num
ber
Rat
io
Self-employedworkers
Not engagedin work
Labour force statusStatus in employment and type of
employment in the present job
Total Engaged in workFamily
workersEmployees
Executivesof company
orcorporation
Employees, excluding executive ofcompany or corporation
Regularstaffs
Irregularstaffs
Status in employment and type ofemployment in the previous job
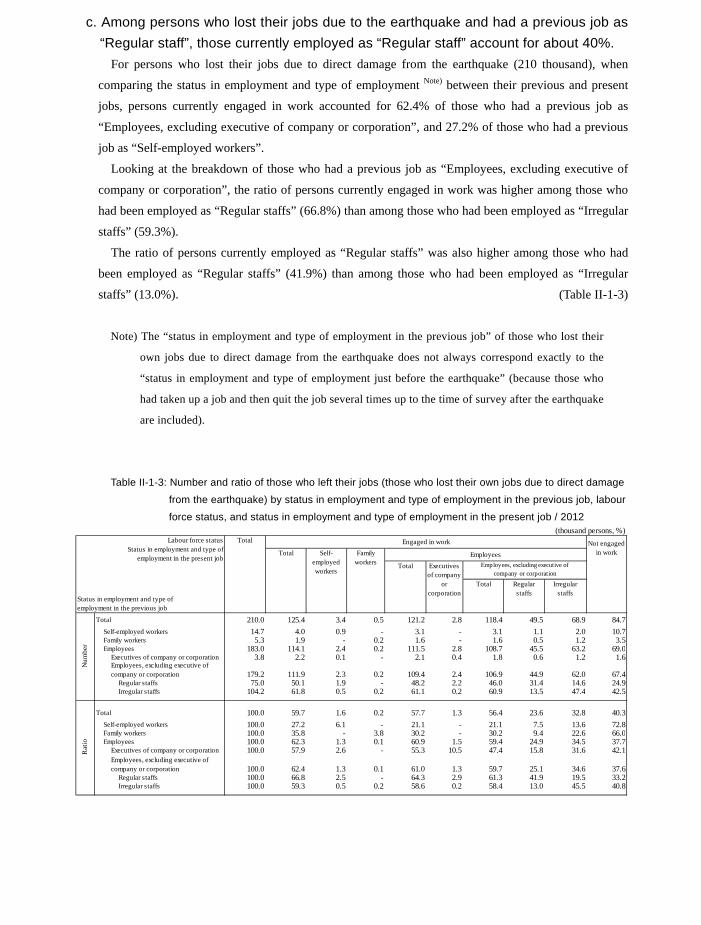
169
b. “Irregular staffs” account for about 60% of those who lost their jobs due to the earthquake, and are currently “Employees, excluding executive of company or corporation”, while about 40% of those who lost their jobs are still not engaged in work, about 70% of whom wish to work.
Looking at persons who lost their jobs due to direct damage from the earthquake (210 thousand) by
labour force status, persons currently engaged in work numbered 125 thousand (59.7% of all persons
who lost their jobs), while persons not engaged in work numbered 85 thousand (40.3%).
Looking at persons currently engaged in work (125 thousand) by status in employment and type of
employment, “Employees, excluding executive of company or corporation” numbered 118 thousand,
consisting of 50 thousand “Regular staffs” and 69 thousand “Irregular staffs”. Thus, the ratio of
“Irregular staffs” to all “Employees, excluding executive of company or corporation” was 58.2%, much
higher than those whose jobs were not affected by the earthquake (35.4%).
Looking at persons currently not engaged in work (85 thousand) by whether wishing to work and seeking
a job, those “wishing to work” numbered 63 thousand (74.1% of all persons currently not engaged in work),
41 thousand of whom were those “seeking a job” (48.9%). (Fig. II-1-1, Table II-1-2)
Table II-1-2: Number and ratio of persons aged 15 and over by labour force status, status in employment
and type of employment, whether wishing to work, whether seeking a job, and whether job
was affected from the earthquake by primary damage / 2012
Japan 100.0 100.0 100.0 100.0 Engaged in work 58.1 92.9 59.7 94.0 Of which employees, excluding executive of company or corporation
48.3 77.1 56.4 77.2
Regular staffs 1) 1) 1) 1) Irregular staffs 1) 1) 1) 1) Not engaged in work 41.9 7.1 40.3 6.0 Wishing to work 2) 2) 2) 2) Of which seeking a job 2) 2) 2) 2) Three devastated prefectures 100.0 100.0 100.0 100.0 Engaged in work 56.9 91.2 59.1 95.1 Of which employees, excluding executive of company or corporation 46.9 75.0 56.6 77.2
Regular staffs 1) 1) 1) 1) Irregular staffs 1) 1) 1) 1) Not engaged in work 43.1 8.8 40.7 4.9 Of which wishing to work 2) 2) 2) 2) Of which seeking a job 2) 2) 2) 2) Other prefectures 100.0 100.0 100.0 100.0 Engaged in work 58.2 93.3 60.0 94.0 Of which employees, excluding executive of company or corporation 48.4 77.7 56.2 77.2
Regular staffs 1) 1) 1) 1) Irregular staffs 1) 1) 1) 1) Not engaged in work 41.8 6.7 40.0 6.0 Of which wishing to work 2) 2) 2) 2) Of which seeking a job 2) 2) 2) 2) 1) Percentage in all “Employees, excluding executive of company or corporation” 2) Percentage in all persons “Not engaged in work”
(thousand persons, %)Whether job affected from the earthquake by
primary damageNumber Ratio
Total Affected Not affected Total Affected Not affectedLabour force statusStatus in employment and type of employmentWhether wishing to workWhether seeking a job
Lost own job Lost own job
64,420.7 5,296.3 125.4 52,278.7
(58.2)
53,537.5 4,397.8 118.4 42,934.1
110,815.1 5,700.7 210.0 55,622.5
(35.4)
46,394.4 404.4 84.7 3,343.9
(61.8) (67.3) (41.8) (64.6)20,427.1 1,437.7 68.9 15,195.2 (38.2) (32.7)33,110.4 2,960.1 49.5 27,738.9
(74.1) (62.4)4,691.0 199.0 41.4 1,365.0 (10.1) (49.2) (48.9) (40.8)
10,933.3 295.6 62.8 2,085.4 (23.6) (73.1)
2,284.3 854.1 48.4 1,170.71,430.8 523.2 20.2 809.0
4,868.2 1,139.2 85.5 1,517.02,770.5 1,038.8 50.5 1,442.7
(58.5) (30.9)
2,097.7 100.4 34.8 74.3
(62.6) (61.3) (41.7) (69.1)853.4 330.8 28.3 361.8 (37.4) (38.7)
(68.4) (57.3)192.8 45.0 15.3 28.1 (9.2) (44.8) (44.0) (37.8)448.9 68.0 23.8 42.6 (21.4) (67.7)
51,253.3 3,543.8 70.0 41,763.431,679.6 2,436.9 29.4 26,930.0
105,946.9 4,561.5 124.6 54,105.561,650.2 4,257.5 74.8 50,836.0
(58.0) (35.5)
44,296.7 304.0 49.9 3,269.5
(61.8) (68.8) (42.0) (64.5)19,573.7 1,106.9 40.6 14,833.4 (38.2) (31.2)
(78.4) (62.5)4,498.2 154.0 26.2 1,336.9 (10.2) (50.7) (52.5) (40.9)
10,484.4 227.6 39.1 2,042.9 (23.7) (74.9)
c. Among persons who lost their jobs due to the earthquake and had a previous job as “Regular staff”, those currently employed as “Regular staff” account for about 40%.
For persons who lost their jobs due to direct damage from the earthquake (210 thousand), when
comparing the status in employment and type of employment Note) between their previous and present
jobs, persons currently engaged in work accounted for 62.4% of those who had a previous job as
“Employees, excluding executive of company or corporation”, and 27.2% of those who had a previous
job as “Self-employed workers”.
Looking at the breakdown of those who had a previous job as “Employees, excluding executive of
company or corporation”, the ratio of persons currently engaged in work was higher among those who
had been employed as “Regular staffs” (66.8%) than among those who had been employed as “Irregular
staffs” (59.3%).
The ratio of persons currently employed as “Regular staffs” was also higher among those who had
been employed as “Regular staffs” (41.9%) than among those who had been employed as “Irregular
staffs” (13.0%). (Table II-1-3)
Note) The “status in employment and type of employment in the previous job” of those who lost their
own jobs due to direct damage from the earthquake does not always correspond exactly to the
“status in employment and type of employment just before the earthquake” (because those who
had taken up a job and then quit the job several times up to the time of survey after the earthquake
are included).
Table II-1-3: Number and ratio of those who left their jobs (those who lost their own jobs due to direct damage
from the earthquake) by status in employment and type of employment in the previous job, labour
force status, and status in employment and type of employment in the present job / 2012
(thousand persons, %)
Total
Total
Total
Total 210.0 125.4 3.4 0.5 121.2 2.8 118.4 49.5 68.9 84.7 Self-employed workers 14.7 4.0 0.9 - 3.1 - 3.1 1.1 2.0 10.7 Family workers 5.3 1.9 - 0.2 1.6 - 1.6 0.5 1.2 3.5 Employees 183.0 114.1 2.4 0.2 111.5 2.8 108.7 45.5 63.2 69.0 Executives of company or corporation 3.8 2.2 0.1 - 2.1 0.4 1.8 0.6 1.2 1.6 Employees, excluding executive of company or corporation 179.2 111.9 2.3 0.2 109.4 2.4 106.9 44.9 62.0 67.4 Regular staffs 75.0 50.1 1.9 - 48.2 2.2 46.0 31.4 14.6 24.9 Irregular staffs 104.2 61.8 0.5 0.2 61.1 0.2 60.9 13.5 47.4 42.5
Total 100.0 59.7 1.6 0.2 57.7 1.3 56.4 23.6 32.8 40.3 Self-employed workers 100.0 27.2 6.1 - 21.1 - 21.1 7.5 13.6 72.8 Family workers 100.0 35.8 - 3.8 30.2 - 30.2 9.4 22.6 66.0 Employees 100.0 62.3 1.3 0.1 60.9 1.5 59.4 24.9 34.5 37.7 Executives of company or corporation 100.0 57.9 2.6 - 55.3 10.5 47.4 15.8 31.6 42.1 Employees, excluding executive of company or corporation 100.0 62.4 1.3 0.1 61.0 1.3 59.7 25.1 34.6 37.6 Regular staffs 100.0 66.8 2.5 - 64.3 2.9 61.3 41.9 19.5 33.2 Irregular staffs 100.0 59.3 0.5 0.2 58.6 0.2 58.4 13.0 45.5 40.8
Num
ber
Rat
io
Self-employedworkers
Not engagedin work
Labour force statusStatus in employment and type of
employment in the present job
Total Engaged in workFamily
workersEmployees
Executivesof company
orcorporation
Employees, excluding executive ofcompany or corporation
Regularstaffs
Irregularstaffs
Status in employment and type ofemployment in the previous job
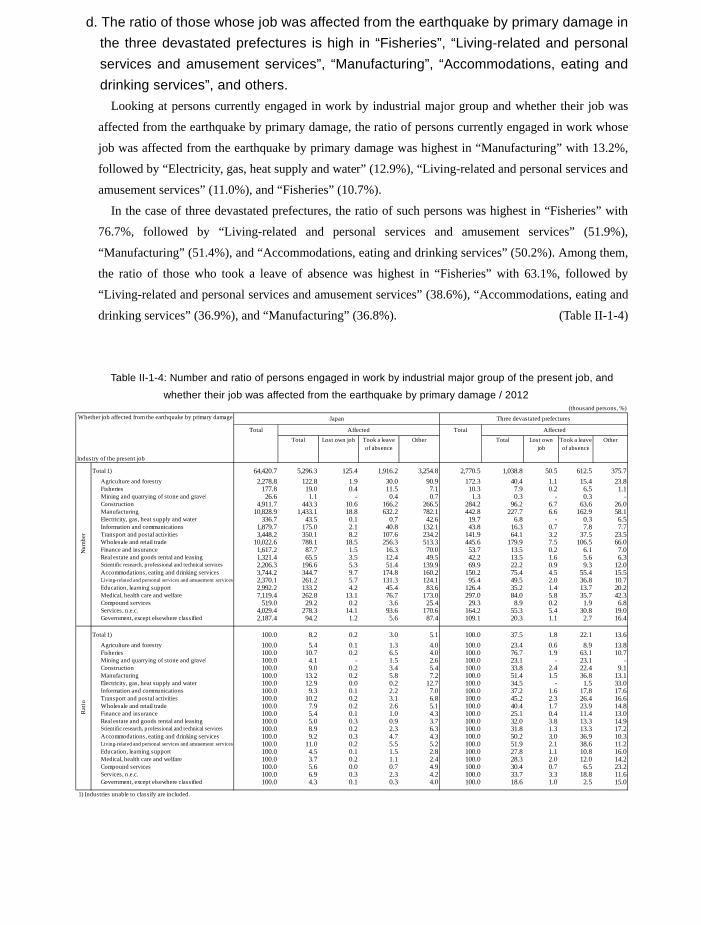
170
d. The ratio of those whose job was affected from the earthquake by primary damage in the three devastated prefectures is high in “Fisheries”, “Living-related and personal services and amusement services”, “Manufacturing”, “Accommodations, eating and drinking services”, and others.
Looking at persons currently engaged in work by industrial major group and whether their job was
affected from the earthquake by primary damage, the ratio of persons currently engaged in work whose
job was affected from the earthquake by primary damage was highest in “Manufacturing” with 13.2%,
followed by “Electricity, gas, heat supply and water” (12.9%), “Living-related and personal services and
amusement services” (11.0%), and “Fisheries” (10.7%).
In the case of three devastated prefectures, the ratio of such persons was highest in “Fisheries” with
76.7%, followed by “Living-related and personal services and amusement services” (51.9%),
“Manufacturing” (51.4%), and “Accommodations, eating and drinking services” (50.2%). Among them,
the ratio of those who took a leave of absence was highest in “Fisheries” with 63.1%, followed by
“Living-related and personal services and amusement services” (38.6%), “Accommodations, eating and
drinking services” (36.9%), and “Manufacturing” (36.8%). (Table II-1-4)
Table II-1-4: Number and ratio of persons engaged in work by industrial major group of the present job, and
whether their job was affected from the earthquake by primary damage / 2012
(thousand persons, %)
Total TotalTotal Lost own job Took a leave
of absenceOther Total Lost own
jobTook a leaveof absence
Other
Total 1) 64,420.7 5,296.3 125.4 1,916.2 3,254.8 2,770.5 1,038.8 50.5 612.5 375.7Agriculture and forestry 2,278.8 122.8 1.9 30.0 90.9 172.3 40.4 1.1 15.4 23.8Fisheries 177.8 19.0 0.4 11.5 7.1 10.3 7.9 0.2 6.5 1.1Mining and quarrying of stone and gravel 26.6 1.1 - 0.4 0.7 1.3 0.3 - 0.3 -Construction 4,911.7 443.3 10.6 166.2 266.5 284.2 96.2 6.7 63.6 26.0Manufacturing 10,828.9 1,433.1 18.8 632.2 782.1 442.8 227.7 6.6 162.9 58.1Electricity, gas, heat supply and water 336.7 43.5 0.1 0.7 42.6 19.7 6.8 - 0.3 6.5Information and communications 1,879.7 175.0 2.1 40.8 132.1 43.8 16.3 0.7 7.8 7.7Transport and postal activities 3,448.2 350.1 8.2 107.6 234.2 141.9 64.1 3.2 37.5 23.5Wholesale and retail trade 10,022.6 788.1 18.5 256.3 513.3 445.6 179.9 7.5 106.5 66.0Finance and insurance 1,617.2 87.7 1.5 16.3 70.0 53.7 13.5 0.2 6.1 7.0Real estate and goods rental and leasing 1,321.4 65.5 3.5 12.4 49.5 42.2 13.5 1.6 5.6 6.3Scientific research, professional and technical services 2,206.3 196.6 5.3 51.4 139.9 69.9 22.2 0.9 9.3 12.0Accommodations, eating and drinking services 3,744.2 344.7 9.7 174.8 160.2 150.2 75.4 4.5 55.4 15.5Living-related and personal services and amusement services 2,370.1 261.2 5.7 131.3 124.1 95.4 49.5 2.0 36.8 10.7Education, learning support 2,992.2 133.2 4.2 45.4 83.6 126.4 35.2 1.4 13.7 20.2Medical, health care and welfare 7,119.4 262.8 13.1 76.7 173.0 297.0 84.0 5.8 35.7 42.3Compound services 519.0 29.2 0.2 3.6 25.4 29.3 8.9 0.2 1.9 6.8Services, n.e.c. 4,029.4 278.3 14.1 93.6 170.6 164.2 55.3 5.4 30.8 19.0Government, except elsewhere classified 2,187.4 94.2 1.2 5.6 87.4 109.1 20.3 1.1 2.7 16.4
Total 1) 100.0 8.2 0.2 3.0 5.1 100.0 37.5 1.8 22.1 13.6Agriculture and forestry 100.0 5.4 0.1 1.3 4.0 100.0 23.4 0.6 8.9 13.8Fisheries 100.0 10.7 0.2 6.5 4.0 100.0 76.7 1.9 63.1 10.7Mining and quarrying of stone and gravel 100.0 4.1 - 1.5 2.6 100.0 23.1 - 23.1 -Construction 100.0 9.0 0.2 3.4 5.4 100.0 33.8 2.4 22.4 9.1Manufacturing 100.0 13.2 0.2 5.8 7.2 100.0 51.4 1.5 36.8 13.1Electricity, gas, heat supply and water 100.0 12.9 0.0 0.2 12.7 100.0 34.5 - 1.5 33.0Information and communications 100.0 9.3 0.1 2.2 7.0 100.0 37.2 1.6 17.8 17.6Transport and postal activities 100.0 10.2 0.2 3.1 6.8 100.0 45.2 2.3 26.4 16.6Wholesale and retail trade 100.0 7.9 0.2 2.6 5.1 100.0 40.4 1.7 23.9 14.8Finance and insurance 100.0 5.4 0.1 1.0 4.3 100.0 25.1 0.4 11.4 13.0Real estate and goods rental and leasing 100.0 5.0 0.3 0.9 3.7 100.0 32.0 3.8 13.3 14.9Scientific research, professional and technical services 100.0 8.9 0.2 2.3 6.3 100.0 31.8 1.3 13.3 17.2Accommodations, eating and drinking services 100.0 9.2 0.3 4.7 4.3 100.0 50.2 3.0 36.9 10.3Living-related and personal services and amusement services 100.0 11.0 0.2 5.5 5.2 100.0 51.9 2.1 38.6 11.2Education, learning support 100.0 4.5 0.1 1.5 2.8 100.0 27.8 1.1 10.8 16.0Medical, health care and welfare 100.0 3.7 0.2 1.1 2.4 100.0 28.3 2.0 12.0 14.2Compound services 100.0 5.6 0.0 0.7 4.9 100.0 30.4 0.7 6.5 23.2Services, n.e.c. 100.0 6.9 0.3 2.3 4.2 100.0 33.7 3.3 18.8 11.6Government, except elsewhere classified 100.0 4.3 0.1 0.3 4.0 100.0 18.6 1.0 2.5 15.0
1) Industries unable to classify are included.
Industry of the present job
Num
ber
Rat
io
Whether job affected from the earthquake by primary damage Japan Three devastated prefectures
Affected Affected
2. Evacuation and Employment a. 70% and more of evacuees currently live in the three devastated prefectures, where
90% and more of evacuees moved within the same prefecture. Persons evacuated from the earthquake at the time of survey (October 1, 2012) (a total of the
population aged 15 and over who were “Currently on evacuation” and “Moved after the earthquake” Note)) numbered 347 thousand.
Among them, those living in the three devastated prefectures numbered 243 thousand (44 thousand in
Iwate-ken, 104 thousand in Miyagi-ken, and 95 thousand in Fukushima-ken), while those living in other
prefectures numbered 104 thousand, which means 70% and over of evacuees lived in the three
devastated prefectures.
Looking at evacuees by address at the time of the earthquake (before evacuation), evacuees who
moved within the same prefecture accounted for 90% and over of all evacuees in three devastated
prefectures, and the ratio was highest in Fukushima-ken at 97.9%.
In terms of evacuees who moved within the same prefecture, for Iwate-ken and Miyagi-ken the ratio
of those who moved within the “same municipality” (76.5% in Iwate-ken and 65.5% in Miyagi-ken)
was higher than that of those who moved from “other municipality”. On the other hand, for
Fukushima-ken, the ratio of those who moved from “other municipality” (59.6%) was higher than that
of those who moved within the “same municipality”.
Looking at evacuees by labour force status, the number of persons engaged in work (185 thousand)
exceeded that of persons not engaged in work (162 thousand), while in Fukushima-ken, the number of
persons not engaged in work (48 thousand) exceeded that of persons engaged in work (47 thousand).
(Table II-1-5, Fig.II-1-2)
Note) Persons who “Evacuated from the earthquake” include “Currently on evacuation”, “Moved after the earthquake”,
and “Returned to the evacuated residence”.
Table II-1-5: Number and ratio of evacuees by present address, labour force status, and address at the time of
the earthquake (including those currently on evacuation and those who moved after the
earthquake) / 2012
(thousand persons, %)
Total TotalPresent addressLabour force status
Total In the samemunicipality
Othermunicipality
Total In the samemunicipality
Othermunicipality
Japan 346.6 252.7 153.1 99.7 92.2 100.0 72.9 44.2 28.8 26.6 Engaged in work 184.5 133.5 83.3 50.3 49.7 100.0 72.4 45.1 27.3 26.9 Not engaged in work 162.2 119.2 69.7 49.4 42.4 100.0 73.5 43.0 30.5 26.1 Three devastated prefectures 242.9 229.8 137.9 91.9 12.0 100.0 94.6 56.8 37.8 4.9 Engaged in work 127.1 118.9 74.2 44.8 7.2 100.0 93.5 58.4 35.2 5.7 Not engaged in work 116.0 111.0 63.7 47.3 4.8 100.0 95.7 54.9 40.8 4.1 Iwate-ken 43.8 40.8 33.5 7.3 2.8 100.0 93.2 76.5 16.7 6.4 Engaged in work 22.8 21.1 17.7 3.4 1.6 100.0 92.5 77.6 14.9 7.0 Not engaged in work 21.0 19.8 15.8 4.0 1.2 100.0 94.3 75.2 19.0 5.7 Miyagi-ken 103.7 95.6 67.9 27.7 7.4 100.0 92.2 65.5 26.7 7.1 Engaged in work 57.3 52.3 37.4 14.9 4.4 100.0 91.3 65.3 26.0 7.7 Not engaged in work 46.6 43.3 30.5 12.8 3.1 100.0 92.9 65.5 27.5 6.7 Fukushima-ken 95.4 93.4 36.5 56.9 1.8 100.0 97.9 38.3 59.6 1.9 Engaged in work 47.0 45.5 19.1 26.5 1.2 100.0 96.8 40.6 56.4 2.6 Not engaged in work 48.4 47.9 17.4 30.5 0.5 100.0 99.0 36.0 63.0 1.0 Other prefectures 103.8 22.8 15.2 7.7 80.2 100.0 22.0 14.6 7.4 77.3 Engaged in work 57.4 14.7 9.2 5.5 42.5 100.0 25.6 16.0 9.6 74.0 Not engaged in work 46.3 8.2 6.0 2.2 37.6 100.0 17.7 13.0 4.8 81.2
Address at the time of theearthquake
Number RatioIn the same prefecture as now Other
prefecturesIn the same prefecture as now Other
prefectures
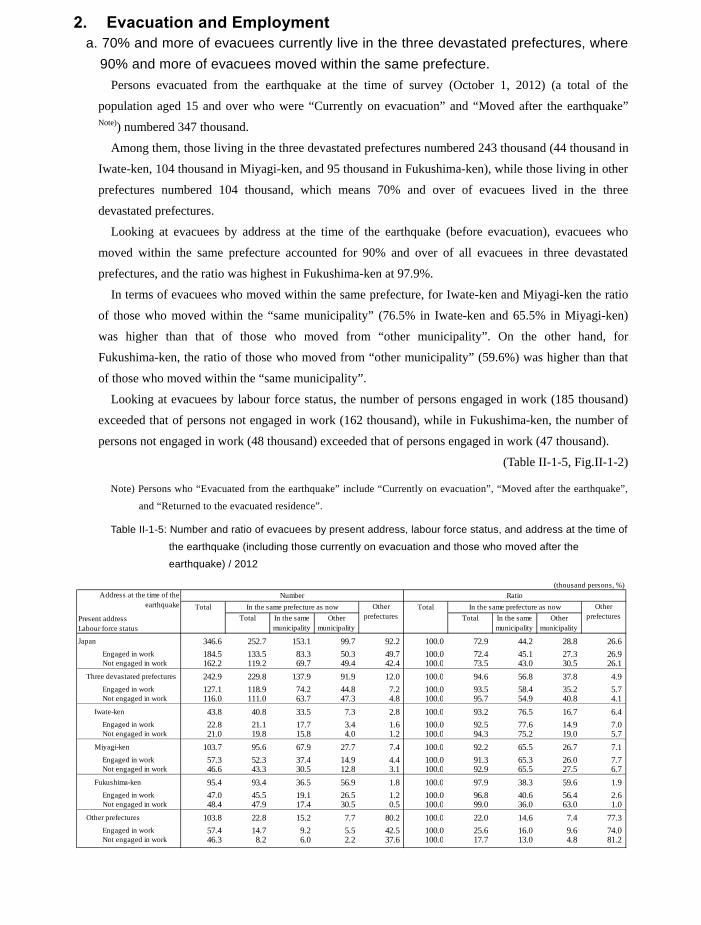
171
d. The ratio of those whose job was affected from the earthquake by primary damage in the three devastated prefectures is high in “Fisheries”, “Living-related and personal services and amusement services”, “Manufacturing”, “Accommodations, eating and drinking services”, and others.
Looking at persons currently engaged in work by industrial major group and whether their job was
affected from the earthquake by primary damage, the ratio of persons currently engaged in work whose
job was affected from the earthquake by primary damage was highest in “Manufacturing” with 13.2%,
followed by “Electricity, gas, heat supply and water” (12.9%), “Living-related and personal services and
amusement services” (11.0%), and “Fisheries” (10.7%).
In the case of three devastated prefectures, the ratio of such persons was highest in “Fisheries” with
76.7%, followed by “Living-related and personal services and amusement services” (51.9%),
“Manufacturing” (51.4%), and “Accommodations, eating and drinking services” (50.2%). Among them,
the ratio of those who took a leave of absence was highest in “Fisheries” with 63.1%, followed by
“Living-related and personal services and amusement services” (38.6%), “Accommodations, eating and
drinking services” (36.9%), and “Manufacturing” (36.8%). (Table II-1-4)
Table II-1-4: Number and ratio of persons engaged in work by industrial major group of the present job, and
whether their job was affected from the earthquake by primary damage / 2012
(thousand persons, %)
Total TotalTotal Lost own job Took a leave
of absenceOther Total Lost own
jobTook a leaveof absence
Other
Total 1) 64,420.7 5,296.3 125.4 1,916.2 3,254.8 2,770.5 1,038.8 50.5 612.5 375.7Agriculture and forestry 2,278.8 122.8 1.9 30.0 90.9 172.3 40.4 1.1 15.4 23.8Fisheries 177.8 19.0 0.4 11.5 7.1 10.3 7.9 0.2 6.5 1.1Mining and quarrying of stone and gravel 26.6 1.1 - 0.4 0.7 1.3 0.3 - 0.3 -Construction 4,911.7 443.3 10.6 166.2 266.5 284.2 96.2 6.7 63.6 26.0Manufacturing 10,828.9 1,433.1 18.8 632.2 782.1 442.8 227.7 6.6 162.9 58.1Electricity, gas, heat supply and water 336.7 43.5 0.1 0.7 42.6 19.7 6.8 - 0.3 6.5Information and communications 1,879.7 175.0 2.1 40.8 132.1 43.8 16.3 0.7 7.8 7.7Transport and postal activities 3,448.2 350.1 8.2 107.6 234.2 141.9 64.1 3.2 37.5 23.5Wholesale and retail trade 10,022.6 788.1 18.5 256.3 513.3 445.6 179.9 7.5 106.5 66.0Finance and insurance 1,617.2 87.7 1.5 16.3 70.0 53.7 13.5 0.2 6.1 7.0Real estate and goods rental and leasing 1,321.4 65.5 3.5 12.4 49.5 42.2 13.5 1.6 5.6 6.3Scientific research, professional and technical services 2,206.3 196.6 5.3 51.4 139.9 69.9 22.2 0.9 9.3 12.0Accommodations, eating and drinking services 3,744.2 344.7 9.7 174.8 160.2 150.2 75.4 4.5 55.4 15.5Living-related and personal services and amusement services 2,370.1 261.2 5.7 131.3 124.1 95.4 49.5 2.0 36.8 10.7Education, learning support 2,992.2 133.2 4.2 45.4 83.6 126.4 35.2 1.4 13.7 20.2Medical, health care and welfare 7,119.4 262.8 13.1 76.7 173.0 297.0 84.0 5.8 35.7 42.3Compound services 519.0 29.2 0.2 3.6 25.4 29.3 8.9 0.2 1.9 6.8Services, n.e.c. 4,029.4 278.3 14.1 93.6 170.6 164.2 55.3 5.4 30.8 19.0Government, except elsewhere classified 2,187.4 94.2 1.2 5.6 87.4 109.1 20.3 1.1 2.7 16.4
Total 1) 100.0 8.2 0.2 3.0 5.1 100.0 37.5 1.8 22.1 13.6Agriculture and forestry 100.0 5.4 0.1 1.3 4.0 100.0 23.4 0.6 8.9 13.8Fisheries 100.0 10.7 0.2 6.5 4.0 100.0 76.7 1.9 63.1 10.7Mining and quarrying of stone and gravel 100.0 4.1 - 1.5 2.6 100.0 23.1 - 23.1 -Construction 100.0 9.0 0.2 3.4 5.4 100.0 33.8 2.4 22.4 9.1Manufacturing 100.0 13.2 0.2 5.8 7.2 100.0 51.4 1.5 36.8 13.1Electricity, gas, heat supply and water 100.0 12.9 0.0 0.2 12.7 100.0 34.5 - 1.5 33.0Information and communications 100.0 9.3 0.1 2.2 7.0 100.0 37.2 1.6 17.8 17.6Transport and postal activities 100.0 10.2 0.2 3.1 6.8 100.0 45.2 2.3 26.4 16.6Wholesale and retail trade 100.0 7.9 0.2 2.6 5.1 100.0 40.4 1.7 23.9 14.8Finance and insurance 100.0 5.4 0.1 1.0 4.3 100.0 25.1 0.4 11.4 13.0Real estate and goods rental and leasing 100.0 5.0 0.3 0.9 3.7 100.0 32.0 3.8 13.3 14.9Scientific research, professional and technical services 100.0 8.9 0.2 2.3 6.3 100.0 31.8 1.3 13.3 17.2Accommodations, eating and drinking services 100.0 9.2 0.3 4.7 4.3 100.0 50.2 3.0 36.9 10.3Living-related and personal services and amusement services 100.0 11.0 0.2 5.5 5.2 100.0 51.9 2.1 38.6 11.2Education, learning support 100.0 4.5 0.1 1.5 2.8 100.0 27.8 1.1 10.8 16.0Medical, health care and welfare 100.0 3.7 0.2 1.1 2.4 100.0 28.3 2.0 12.0 14.2Compound services 100.0 5.6 0.0 0.7 4.9 100.0 30.4 0.7 6.5 23.2Services, n.e.c. 100.0 6.9 0.3 2.3 4.2 100.0 33.7 3.3 18.8 11.6Government, except elsewhere classified 100.0 4.3 0.1 0.3 4.0 100.0 18.6 1.0 2.5 15.0
1) Industries unable to classify are included.
Industry of the present job
Num
ber
Rat
io
Whether job affected from the earthquake by primary damage Japan Three devastated prefectures
Affected Affected
2. Evacuation and Employment a. 70% and more of evacuees currently live in the three devastated prefectures, where
90% and more of evacuees moved within the same prefecture. Persons evacuated from the earthquake at the time of survey (October 1, 2012) (a total of the
population aged 15 and over who were “Currently on evacuation” and “Moved after the earthquake” Note)) numbered 347 thousand.
Among them, those living in the three devastated prefectures numbered 243 thousand (44 thousand in
Iwate-ken, 104 thousand in Miyagi-ken, and 95 thousand in Fukushima-ken), while those living in other
prefectures numbered 104 thousand, which means 70% and over of evacuees lived in the three
devastated prefectures.
Looking at evacuees by address at the time of the earthquake (before evacuation), evacuees who
moved within the same prefecture accounted for 90% and over of all evacuees in three devastated
prefectures, and the ratio was highest in Fukushima-ken at 97.9%.
In terms of evacuees who moved within the same prefecture, for Iwate-ken and Miyagi-ken the ratio
of those who moved within the “same municipality” (76.5% in Iwate-ken and 65.5% in Miyagi-ken)
was higher than that of those who moved from “other municipality”. On the other hand, for
Fukushima-ken, the ratio of those who moved from “other municipality” (59.6%) was higher than that
of those who moved within the “same municipality”.
Looking at evacuees by labour force status, the number of persons engaged in work (185 thousand)
exceeded that of persons not engaged in work (162 thousand), while in Fukushima-ken, the number of
persons not engaged in work (48 thousand) exceeded that of persons engaged in work (47 thousand).
(Table II-1-5, Fig.II-1-2)
Note) Persons who “Evacuated from the earthquake” include “Currently on evacuation”, “Moved after the earthquake”,
and “Returned to the evacuated residence”.
Table II-1-5: Number and ratio of evacuees by present address, labour force status, and address at the time of
the earthquake (including those currently on evacuation and those who moved after the
earthquake) / 2012
(thousand persons, %)
Total TotalPresent addressLabour force status
Total In the samemunicipality
Othermunicipality
Total In the samemunicipality
Othermunicipality
Japan 346.6 252.7 153.1 99.7 92.2 100.0 72.9 44.2 28.8 26.6 Engaged in work 184.5 133.5 83.3 50.3 49.7 100.0 72.4 45.1 27.3 26.9 Not engaged in work 162.2 119.2 69.7 49.4 42.4 100.0 73.5 43.0 30.5 26.1 Three devastated prefectures 242.9 229.8 137.9 91.9 12.0 100.0 94.6 56.8 37.8 4.9 Engaged in work 127.1 118.9 74.2 44.8 7.2 100.0 93.5 58.4 35.2 5.7 Not engaged in work 116.0 111.0 63.7 47.3 4.8 100.0 95.7 54.9 40.8 4.1 Iwate-ken 43.8 40.8 33.5 7.3 2.8 100.0 93.2 76.5 16.7 6.4 Engaged in work 22.8 21.1 17.7 3.4 1.6 100.0 92.5 77.6 14.9 7.0 Not engaged in work 21.0 19.8 15.8 4.0 1.2 100.0 94.3 75.2 19.0 5.7 Miyagi-ken 103.7 95.6 67.9 27.7 7.4 100.0 92.2 65.5 26.7 7.1 Engaged in work 57.3 52.3 37.4 14.9 4.4 100.0 91.3 65.3 26.0 7.7 Not engaged in work 46.6 43.3 30.5 12.8 3.1 100.0 92.9 65.5 27.5 6.7 Fukushima-ken 95.4 93.4 36.5 56.9 1.8 100.0 97.9 38.3 59.6 1.9 Engaged in work 47.0 45.5 19.1 26.5 1.2 100.0 96.8 40.6 56.4 2.6 Not engaged in work 48.4 47.9 17.4 30.5 0.5 100.0 99.0 36.0 63.0 1.0 Other prefectures 103.8 22.8 15.2 7.7 80.2 100.0 22.0 14.6 7.4 77.3 Engaged in work 57.4 14.7 9.2 5.5 42.5 100.0 25.6 16.0 9.6 74.0 Not engaged in work 46.3 8.2 6.0 2.2 37.6 100.0 17.7 13.0 4.8 81.2
Address at the time of theearthquake
Number RatioIn the same prefecture as now Other
prefecturesIn the same prefecture as now Other
prefectures
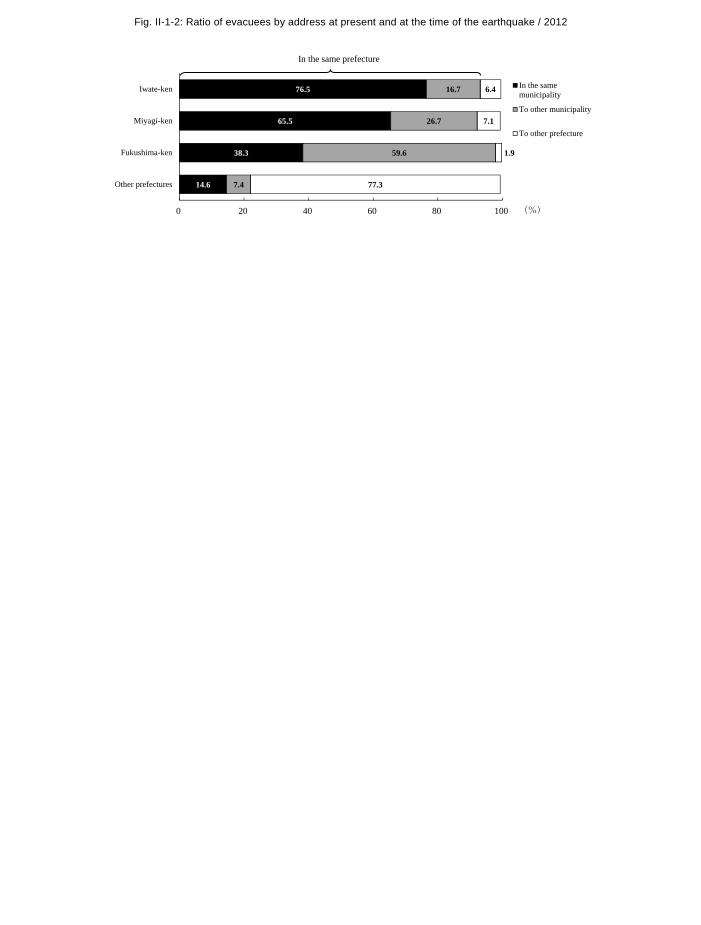
172
Fig. II-1-2: Ratio of evacuees by address at present and at the time of the earthquake / 2012
14.6
38.3
65.5
76.5
7.4
59.6
26.7
16.7
77.3
1.9
7.1
6.4
0 20 40 60 80 100
Other prefectures
Fukushima-ken
Miyagi-ken
Iwate-ken In the samemunicipality
To other municipality
To other prefecture
(%)
In the same prefecture
b. Of 347 thousand earthquake evacuees, 40 thousand persons lost their jobs due to direct damage from the earthquake, and 50% and more of them are not currently engaged in work.
Looking at persons who evacuated from the earthquake (347 thousand) by whether their job was
affected from the earthquake by primary damage, those affected numbered 143 thousand, 40 thousand
of whom lost their jobs. In terms of the present labour force status among persons who lost their jobs,
those engaged in work numbered 18 thousand (45.1% of all evacuees who lost their jobs), while those
not engaged in work numbered 22 thousand (54.9%).
Among persons who didn’t evacuate, those whose job was affected from the earthquake numbered
5,364 thousand, 156 thousand of whom lost their job. In terms of the present labour force status among
persons who lost their jobs, those engaged in work numbered 98 thousand (63.1% of all persons who
lost their jobs), while those not engaged in work numbered 57 thousand (36.9%). This means that
evacuees had a lower ratio of those currently engaged in work than those who didn’t evacuate.
(Table II-1-6, Fig.II-1-3)
Table II-1-6: Number and ratio of persons aged 15 and over by labour force status, whether wishing to work,
whether seeking a job, whether evacuated from the earthquake, and whether job affected from the
earthquake by primary damage / 2012
Japan Engaged in work
Not engaged in work Wishing to work Of which seeking a job
Three devastated prefectures Engaged in work
Not engaged in work Wishing to work Of which seeking a job
Other prefectures Engaged in work
Not engaged in work Wishing to work Of which seeking a job
Japan 100.0 100.0 100.0 100.0 100.0 100.0 100.0 100.0 100.0 100.0 Engaged in work 53.2 73.6 45.1 91.5 20.8 58.3 93.5 63.1 94.0 12.0
Not engaged in work 46.8 26.4 54.9 8.5 79.3 41.7 6.5 36.9 6.0 88.0 Wishing to work 1) 1) 1) 1) 1) 1) 1) 1) 1) 1) Of which seeking a job 1) 1) 1) 1) 1) 1) 1) 1) 1) 1) Three devastated prefectures 100.0 100.0 100.0 100.0 100.0 100.0 100.0 100.0 100.0 100.0
Engaged in work 52.3 74.7 45.0 92.4 16.0 57.4 93.1 66.1 95.2 10.5
Not engaged in work 47.8 25.4 55.4 7.9 84.0 42.7 6.9 33.7 4.9 89.5 Wishing to work 1) 1) 1) 1) 1) 1) 1) 1) 1) 1) Of which seeking a job 1) 1) 1) 1) 1) 1) 1) 1) 1) 1) Other prefectures 100.0 100.0 100.0 100.0 100.0 100.0 100.0 100.0 100.0 100.0
Engaged in work 55.3 71.0 46.1 88.9 31.2 58.3 93.5 61.7 94.0 12.1
Not engaged in work 44.6 28.7 53.9 11.1 68.6 41.7 6.5 38.3 6.0 87.9 Wishing to work 1) 1) 1) 1) 1) 1) 1) 1) 1) 1) Of which seeking a job 1) 1) 1) 1) 1) 1) 1) 1) 1) 1)
1) Percentage in all persons "Not engaged in work"
Labour force statusWhether wishing to workWhether seeking a job
Of which lostown job
Of which lostown job
(thousand persons, %)Whether evacuated from the earthquake
Whether job affected from theearthquake by primary damage
Evacuated(those currently on evacuation + those who moved after the earthquake)
Didn’t evacuate
Total Affected Not affectedHad no
occupation atthe time
Total Affected Not affectedHad no
occupation atthe time
108,515.1 5,364.2 155.5 55,377.7 46,769.3184.5 105.3 18.1 44.4 31.2346.6 143.0 40.1 48.5 150.1
63,265.5 5,013.5 98.1 52,051.3 5,618.5
162.2 37.7 22.0 4.1 119.0 45,249.6 350.7 57.4 3,326.4 41,150.88,163.4
24.6 12.4 7.7 2.0 10.3 4,599.0 179.8 31.9 1,359.2 2,968.056.4 24.0 13.3 2.8 28.9 10,677.7 260.8 46.2 2,076.8
1,833.6127.1 76.3 11.7 31.6 16.4 2,397.4 824.2 31.2 1,346.6 191.9242.9 102.2 26.0 34.2 102.7 4,180.2 885.4 47.2 1,415.1
116.0 26.0 14.4 2.7 86.3 1,782.9 61.1 15.9 68.7 1,641.8
4,478.9 108.4 53,962.6
274.114.7 7.9 5.0 0.8 6.3 158.2 31.3 8.6 26.0 98.335.3 16.2 8.9 1.6 17.2 360.6 42.6 11.7 39.1
44,935.857.4 28.9 6.5 12.8 14.8 60,868.2 4,189.3 66.9 50,704.8 5,426.7
103.8 40.7 14.1 14.4 47.5 104,334.9
46.3 11.7 7.6 1.6 32.67,889.3
9.7 4.5 2.6 1.2 4.1
43,466.7 289.6 41.5 3,257.8 39,509.021.0 7.8 4.4 1.4 11.7
Rat
io
10,317.2 218.1 34.5 2,037.6
Num
ber
(15.2) (32.9) (35.0) (48.8) (8.7) (10.2)(34.8) (63.7) (60.5)
4,440.8 148.4 23.3 1,333.1 2,869.7
(74.4) (80.5) (62.4) (19.8)(7.2)
(30.4) (62.3) (61.8) (59.3) (19.9) (20.2) (69.7) (73.6) (56.9) (16.7)(29.6) (7.3) (8.9) (51.2) (54.1) (37.8)
(68.3) (24.3) (23.6)(51.3) (55.6) (40.9)
(6.0)
(45.4) (66.7) (57.9) (87.5) (35.9) (23.7)(51.2) (56.1) (40.9) (7.3)(75.3) (83.1) (62.5) (20.0)
(21.0) (38.5) (34.2) (75.0) (12.6) (10.2)
(12.7) (30.4) (34.7)
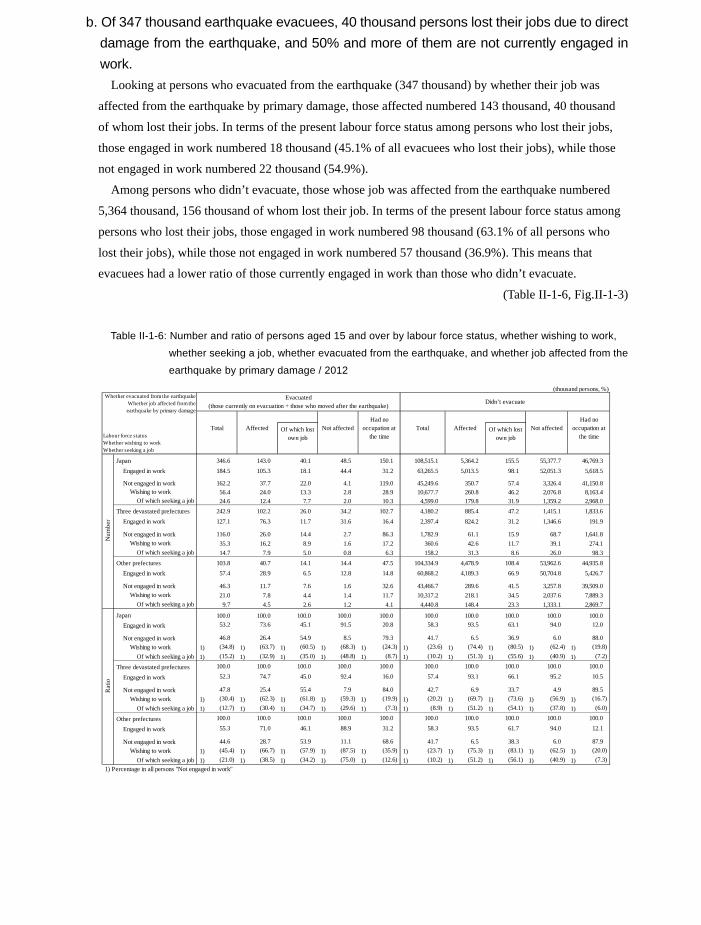
173
Fig. II-1-2: Ratio of evacuees by address at present and at the time of the earthquake / 2012
14.6
38.3
65.5
76.5
7.4
59.6
26.7
16.7
77.3
1.9
7.1
6.4
0 20 40 60 80 100
Other prefectures
Fukushima-ken
Miyagi-ken
Iwate-ken In the samemunicipality
To other municipality
To other prefecture
(%)
In the same prefecture
b. Of 347 thousand earthquake evacuees, 40 thousand persons lost their jobs due to direct damage from the earthquake, and 50% and more of them are not currently engaged in work.
Looking at persons who evacuated from the earthquake (347 thousand) by whether their job was
affected from the earthquake by primary damage, those affected numbered 143 thousand, 40 thousand
of whom lost their jobs. In terms of the present labour force status among persons who lost their jobs,
those engaged in work numbered 18 thousand (45.1% of all evacuees who lost their jobs), while those
not engaged in work numbered 22 thousand (54.9%).
Among persons who didn’t evacuate, those whose job was affected from the earthquake numbered
5,364 thousand, 156 thousand of whom lost their job. In terms of the present labour force status among
persons who lost their jobs, those engaged in work numbered 98 thousand (63.1% of all persons who
lost their jobs), while those not engaged in work numbered 57 thousand (36.9%). This means that
evacuees had a lower ratio of those currently engaged in work than those who didn’t evacuate.
(Table II-1-6, Fig.II-1-3)
Table II-1-6: Number and ratio of persons aged 15 and over by labour force status, whether wishing to work,
whether seeking a job, whether evacuated from the earthquake, and whether job affected from the
earthquake by primary damage / 2012
Japan Engaged in work
Not engaged in work Wishing to work Of which seeking a job
Three devastated prefectures Engaged in work
Not engaged in work Wishing to work Of which seeking a job
Other prefectures Engaged in work
Not engaged in work Wishing to work Of which seeking a job
Japan 100.0 100.0 100.0 100.0 100.0 100.0 100.0 100.0 100.0 100.0 Engaged in work 53.2 73.6 45.1 91.5 20.8 58.3 93.5 63.1 94.0 12.0
Not engaged in work 46.8 26.4 54.9 8.5 79.3 41.7 6.5 36.9 6.0 88.0 Wishing to work 1) 1) 1) 1) 1) 1) 1) 1) 1) 1) Of which seeking a job 1) 1) 1) 1) 1) 1) 1) 1) 1) 1) Three devastated prefectures 100.0 100.0 100.0 100.0 100.0 100.0 100.0 100.0 100.0 100.0
Engaged in work 52.3 74.7 45.0 92.4 16.0 57.4 93.1 66.1 95.2 10.5
Not engaged in work 47.8 25.4 55.4 7.9 84.0 42.7 6.9 33.7 4.9 89.5 Wishing to work 1) 1) 1) 1) 1) 1) 1) 1) 1) 1) Of which seeking a job 1) 1) 1) 1) 1) 1) 1) 1) 1) 1) Other prefectures 100.0 100.0 100.0 100.0 100.0 100.0 100.0 100.0 100.0 100.0
Engaged in work 55.3 71.0 46.1 88.9 31.2 58.3 93.5 61.7 94.0 12.1
Not engaged in work 44.6 28.7 53.9 11.1 68.6 41.7 6.5 38.3 6.0 87.9 Wishing to work 1) 1) 1) 1) 1) 1) 1) 1) 1) 1) Of which seeking a job 1) 1) 1) 1) 1) 1) 1) 1) 1) 1)
1) Percentage in all persons "Not engaged in work"
Labour force statusWhether wishing to workWhether seeking a job
Of which lostown job
Of which lostown job
(thousand persons, %)Whether evacuated from the earthquake
Whether job affected from theearthquake by primary damage
Evacuated(those currently on evacuation + those who moved after the earthquake)
Didn’t evacuate
Total Affected Not affectedHad no
occupation atthe time
Total Affected Not affectedHad no
occupation atthe time
108,515.1 5,364.2 155.5 55,377.7 46,769.3184.5 105.3 18.1 44.4 31.2346.6 143.0 40.1 48.5 150.1
63,265.5 5,013.5 98.1 52,051.3 5,618.5
162.2 37.7 22.0 4.1 119.0 45,249.6 350.7 57.4 3,326.4 41,150.88,163.4
24.6 12.4 7.7 2.0 10.3 4,599.0 179.8 31.9 1,359.2 2,968.056.4 24.0 13.3 2.8 28.9 10,677.7 260.8 46.2 2,076.8
1,833.6127.1 76.3 11.7 31.6 16.4 2,397.4 824.2 31.2 1,346.6 191.9242.9 102.2 26.0 34.2 102.7 4,180.2 885.4 47.2 1,415.1
116.0 26.0 14.4 2.7 86.3 1,782.9 61.1 15.9 68.7 1,641.8
4,478.9 108.4 53,962.6
274.114.7 7.9 5.0 0.8 6.3 158.2 31.3 8.6 26.0 98.335.3 16.2 8.9 1.6 17.2 360.6 42.6 11.7 39.1
44,935.857.4 28.9 6.5 12.8 14.8 60,868.2 4,189.3 66.9 50,704.8 5,426.7
103.8 40.7 14.1 14.4 47.5 104,334.9
46.3 11.7 7.6 1.6 32.67,889.3
9.7 4.5 2.6 1.2 4.1
43,466.7 289.6 41.5 3,257.8 39,509.021.0 7.8 4.4 1.4 11.7
Rat
io
10,317.2 218.1 34.5 2,037.6
Num
ber
(15.2) (32.9) (35.0) (48.8) (8.7) (10.2)(34.8) (63.7) (60.5)
4,440.8 148.4 23.3 1,333.1 2,869.7
(74.4) (80.5) (62.4) (19.8)(7.2)
(30.4) (62.3) (61.8) (59.3) (19.9) (20.2) (69.7) (73.6) (56.9) (16.7)(29.6) (7.3) (8.9) (51.2) (54.1) (37.8)
(68.3) (24.3) (23.6)(51.3) (55.6) (40.9)
(6.0)
(45.4) (66.7) (57.9) (87.5) (35.9) (23.7)(51.2) (56.1) (40.9) (7.3)(75.3) (83.1) (62.5) (20.0)
(21.0) (38.5) (34.2) (75.0) (12.6) (10.2)
(12.7) (30.4) (34.7)
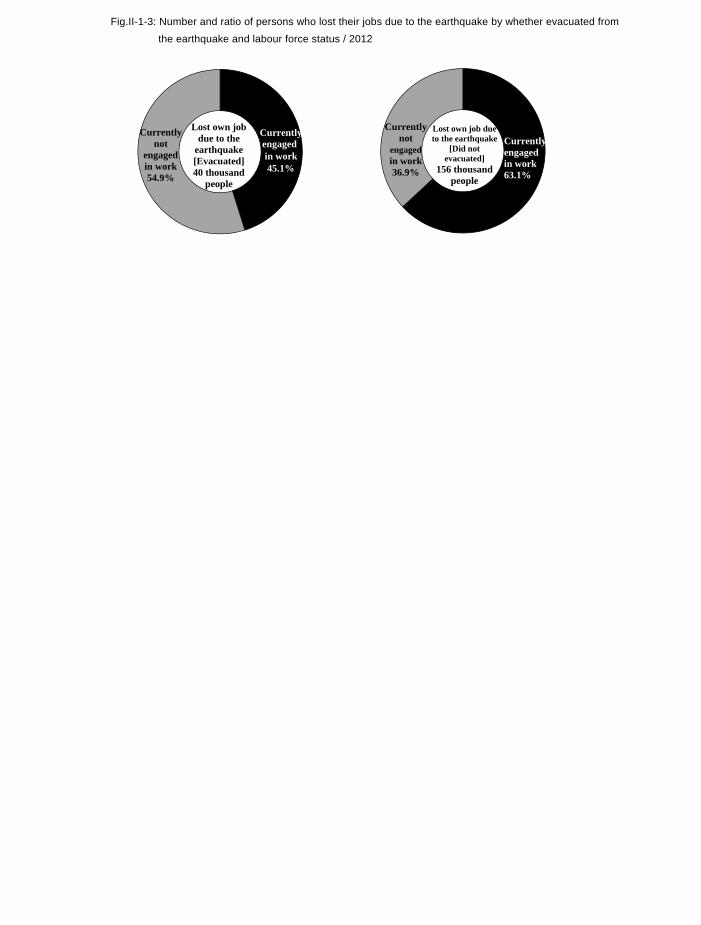
174
Fig.II-1-3: Number and ratio of persons who lost their jobs due to the earthquake by whether evacuated from
the earthquake and labour force status / 2012
Currently engagedin work45.1%
Currently not
engaged in work54.9%
Lost own job due to the
earthquake [Evacuated] 40 thousand
people
Currently engaged in work63.1%
Currently not
engagedin work36.9%
Lost own job due to the earthquake
[Did not evacuated]
156 thousand people
3. Wish for work of persons who lost their jobs due to the earthquake The largest ratio of persons who lost their jobs due to the earthquake and are not
engaged in work wish to work as “Regular staffs”. Looking at persons wishing to work who had lost their jobs due to direct damage from the earthquake
and were currently not engaged in work (63 thousand) by kind of job wished to take, “Not particular about
the type of job” was highest with 35.0%, followed by “Services job” (15.9%), “Professional/technical job”
(12.3%), and “Clerical job” (11.5%). Among them, for persons seeking a job (41 thousand), “Not
particular about the type of job” was highest with 32.9%, followed by “Services job” (15.5%), “Clerical
job” (12.8%), and “Professional/technical job” (12.6%). Compared to the kinds of job that all persons not
engaged in work wished to take, persons wishing to work, especially those seeking a job, had a high ratio
of those who wished to do “Manufacturing/ production processing work”.
In terms of the status of job wished to take, “Regular staffs” was highest with 40.3%, followed by
“Part-time workers and Arbeit (temporary workers) (40.1%). Among them, for persons seeking a job,
“Regular staffs” was highest with 49.5%, followed by “Part-time workers and Arbeit (temporary workers)
(38.4%). This means persons seeking a job had a higher ratio of those wishing to work as “Regular staffs”
compared to all persons not engaged in work. (Table II-1-7/8)
Table II-1-7: Number and ratio of persons not engaged in work (those who lost their jobs due to direct damage from
the earthquake) by whether wishing to work, whether seeking a job, and kind of job wished to take / 2012
Table II-1-8: Number and ratio of persons not engaged in work (those who lost their jobs due to direct damage from the
earthquake) by whether wishing to work, whether seeking a job, and status of job wished to take / 2012
(thousand persons, %)
Not engaged in work Total 10,933.3 554.6 146.5 163.3 433.4 1,764.8 1,466.6 140.9 1,402.4 121.8 314.8 4,250.3(Of which wishing to work) Of which seeking a job 4,691.0 303.6 78.8 98.9 228.9 833.6 650.8 62.6 656.7 39.4 117.1 1,594.7
Total 100.0 5.1 1.3 1.5 4.0 16.1 13.4 1.3 12.8 1.1 2.9 38.9 Of which seeking a job 100.0 6.5 1.7 2.1 4.9 17.8 13.9 1.3 14.0 0.8 2.5 34.0
Total 62.8 7.1 0.8 0.9 3.5 10.0 7.7 1.8 7.2 1.0 0.7 22.0 Of which seeking a job 41.4 4.8 0.5 0.7 3.2 6.4 5.2 0.7 5.3 0.5 0.5 13.6
Total 100.0 11.3 1.3 1.4 5.6 15.9 12.3 2.9 11.5 1.6 1.1 35.0 Of which seeking a job 100.0 11.6 1.2 1.7 7.7 15.5 12.6 1.7 12.8 1.2 1.2 32.9
Kind of job wished to take Total Manufacturing/production
processing work
Construction/mining work
Not particularabout the
type of jobWhether wishing to workWhether seeking a job
Number
Others(protectedservice job,
etc.)
Services job
Of which lost their jobsdue to direct damagefrom the earthquake
Transport/machineoperation
work
Professional/technical job
Managementjob
Business/sales job
Ratio
Number
Ratio
Clerical job Agriculture,forestry andfishery work
(thousand persons, %)Total Contract
employeesOther
Not engaged in work Total 10,933.3 2,874.5 5,808.5 119.2 197.4 376.7 30.1 353.1 970.7(Of which wishing to work) Of which seeking a job 4,691.0 1,792.1 2,236.1 58.5 92.2 196.8 8.1 68.4 206.5
Total 100.0 26.3 53.1 1.1 1.8 3.4 0.3 3.2 8.9 Of which seeking a job 100.0 38.2 47.7 1.2 2.0 4.2 0.2 1.5 4.4
Total 62.8 25.3 25.2 2.2 1.0 4.6 0.3 0.6 3.4 Of which seeking a job 41.4 20.5 15.9 0.6 0.8 2.5 0.1 0.3 0.6
Total 100.0 40.3 40.1 3.5 1.6 7.3 0.5 1.0 5.4 Of which seeking a job 100.0 49.5 38.4 1.4 1.9 6.0 0.2 0.7 1.4
Number
Ratio
Number
Ratio
Of which lost their jobsdue to direct damage fromthe earthquake
Type of employment wished to have Regular staffs Dispatchedworkers from
temporary labouragency
Self-employedworker
Whether wishing to workWhether seeking a job
Part-timeworkers, Arbeit
(temporaryworkers)
Wish to takeover thefamily
business
Doingpieceworkat home
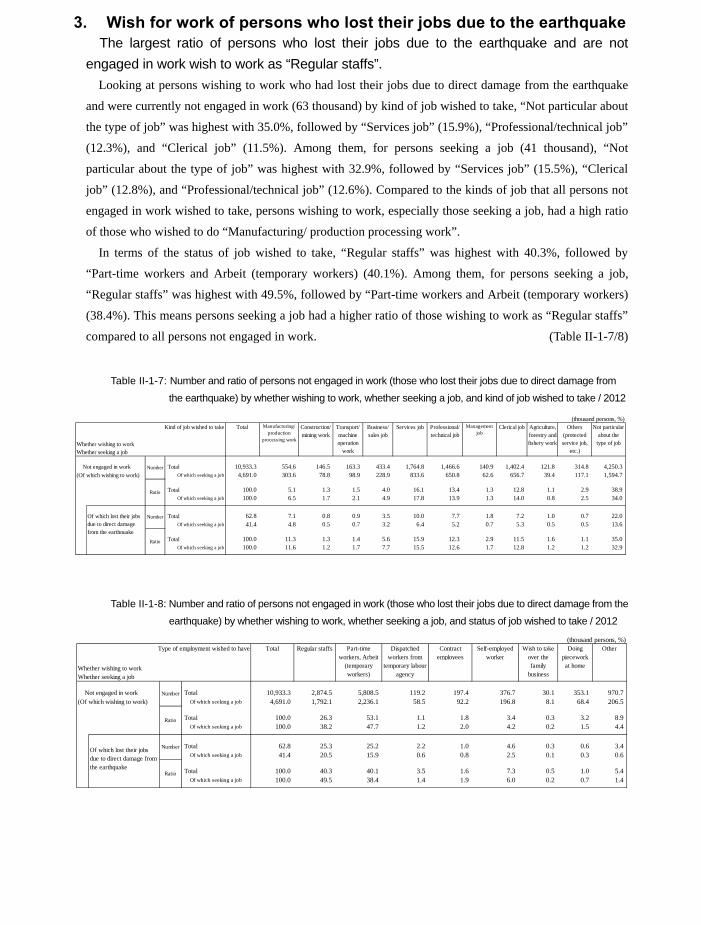
175
Fig.II-1-3: Number and ratio of persons who lost their jobs due to the earthquake by whether evacuated from
the earthquake and labour force status / 2012
Currently engagedin work45.1%
Currently not
engaged in work54.9%
Lost own job due to the
earthquake [Evacuated] 40 thousand
people
Currently engaged in work63.1%
Currently not
engagedin work36.9%
Lost own job due to the earthquake
[Did not evacuated]
156 thousand people
3. Wish for work of persons who lost their jobs due to the earthquake The largest ratio of persons who lost their jobs due to the earthquake and are not
engaged in work wish to work as “Regular staffs”. Looking at persons wishing to work who had lost their jobs due to direct damage from the earthquake
and were currently not engaged in work (63 thousand) by kind of job wished to take, “Not particular about
the type of job” was highest with 35.0%, followed by “Services job” (15.9%), “Professional/technical job”
(12.3%), and “Clerical job” (11.5%). Among them, for persons seeking a job (41 thousand), “Not
particular about the type of job” was highest with 32.9%, followed by “Services job” (15.5%), “Clerical
job” (12.8%), and “Professional/technical job” (12.6%). Compared to the kinds of job that all persons not
engaged in work wished to take, persons wishing to work, especially those seeking a job, had a high ratio
of those who wished to do “Manufacturing/ production processing work”.
In terms of the status of job wished to take, “Regular staffs” was highest with 40.3%, followed by
“Part-time workers and Arbeit (temporary workers) (40.1%). Among them, for persons seeking a job,
“Regular staffs” was highest with 49.5%, followed by “Part-time workers and Arbeit (temporary workers)
(38.4%). This means persons seeking a job had a higher ratio of those wishing to work as “Regular staffs”
compared to all persons not engaged in work. (Table II-1-7/8)
Table II-1-7: Number and ratio of persons not engaged in work (those who lost their jobs due to direct damage from
the earthquake) by whether wishing to work, whether seeking a job, and kind of job wished to take / 2012
Table II-1-8: Number and ratio of persons not engaged in work (those who lost their jobs due to direct damage from the
earthquake) by whether wishing to work, whether seeking a job, and status of job wished to take / 2012
(thousand persons, %)
Not engaged in work Total 10,933.3 554.6 146.5 163.3 433.4 1,764.8 1,466.6 140.9 1,402.4 121.8 314.8 4,250.3(Of which wishing to work) Of which seeking a job 4,691.0 303.6 78.8 98.9 228.9 833.6 650.8 62.6 656.7 39.4 117.1 1,594.7
Total 100.0 5.1 1.3 1.5 4.0 16.1 13.4 1.3 12.8 1.1 2.9 38.9 Of which seeking a job 100.0 6.5 1.7 2.1 4.9 17.8 13.9 1.3 14.0 0.8 2.5 34.0
Total 62.8 7.1 0.8 0.9 3.5 10.0 7.7 1.8 7.2 1.0 0.7 22.0 Of which seeking a job 41.4 4.8 0.5 0.7 3.2 6.4 5.2 0.7 5.3 0.5 0.5 13.6
Total 100.0 11.3 1.3 1.4 5.6 15.9 12.3 2.9 11.5 1.6 1.1 35.0 Of which seeking a job 100.0 11.6 1.2 1.7 7.7 15.5 12.6 1.7 12.8 1.2 1.2 32.9
Kind of job wished to take Total Manufacturing/production
processing work
Construction/mining work
Not particularabout the
type of jobWhether wishing to workWhether seeking a job
Number
Others(protectedservice job,
etc.)
Services job
Of which lost their jobsdue to direct damagefrom the earthquake
Transport/machineoperation
work
Professional/technical job
Managementjob
Business/sales job
Ratio
Number
Ratio
Clerical job Agriculture,forestry andfishery work
(thousand persons, %)Total Contract
employeesOther
Not engaged in work Total 10,933.3 2,874.5 5,808.5 119.2 197.4 376.7 30.1 353.1 970.7(Of which wishing to work) Of which seeking a job 4,691.0 1,792.1 2,236.1 58.5 92.2 196.8 8.1 68.4 206.5
Total 100.0 26.3 53.1 1.1 1.8 3.4 0.3 3.2 8.9 Of which seeking a job 100.0 38.2 47.7 1.2 2.0 4.2 0.2 1.5 4.4
Total 62.8 25.3 25.2 2.2 1.0 4.6 0.3 0.6 3.4 Of which seeking a job 41.4 20.5 15.9 0.6 0.8 2.5 0.1 0.3 0.6
Total 100.0 40.3 40.1 3.5 1.6 7.3 0.5 1.0 5.4 Of which seeking a job 100.0 49.5 38.4 1.4 1.9 6.0 0.2 0.7 1.4
Number
Ratio
Number
Ratio
Of which lost their jobsdue to direct damage fromthe earthquake
Type of employment wished to have Regular staffs Dispatchedworkers from
temporary labouragency
Self-employedworker
Whether wishing to workWhether seeking a job
Part-timeworkers, Arbeit
(temporaryworkers)
Wish to takeover thefamily
business
Doingpieceworkat home
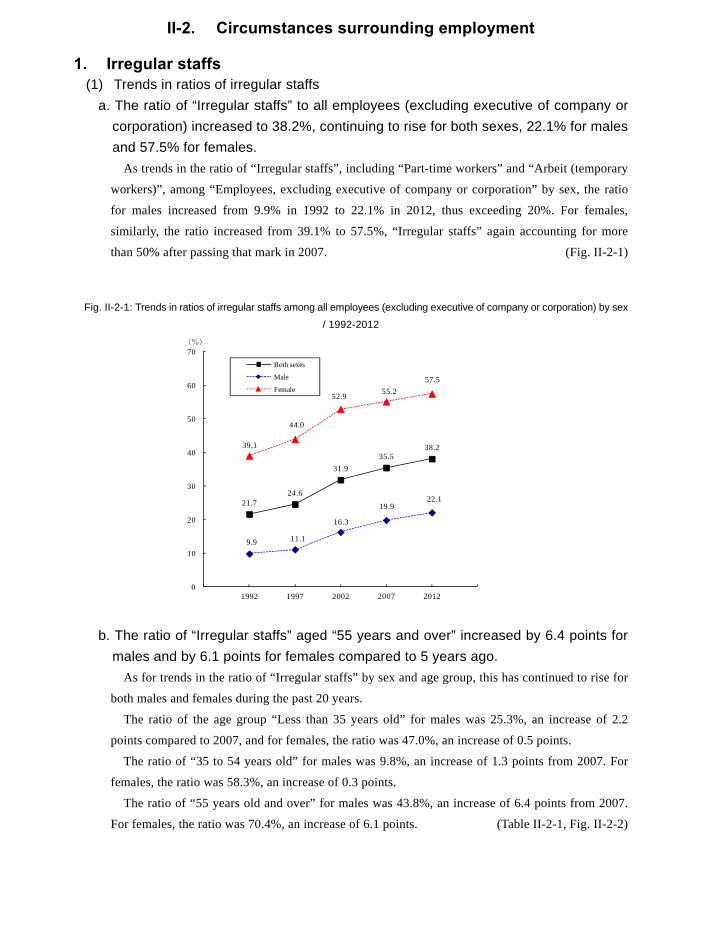
176
II-2. Circumstances surrounding employment
1. Irregular staffs (1) Trends in ratios of irregular staffs
a. The ratio of “Irregular staffs” to all employees (excluding executive of company or corporation) increased to 38.2%, continuing to rise for both sexes, 22.1% for males and 57.5% for females.
As trends in the ratio of “Irregular staffs”, including “Part-time workers” and “Arbeit (temporary
workers)”, among “Employees, excluding executive of company or corporation” by sex, the ratio
for males increased from 9.9% in 1992 to 22.1% in 2012, thus exceeding 20%. For females,
similarly, the ratio increased from 39.1% to 57.5%, “Irregular staffs” again accounting for more
than 50% after passing that mark in 2007. (Fig. II-2-1)
Fig. II-2-1: Trends in ratios of irregular staffs among all employees (excluding executive of company or corporation) by sex
/ 1992-2012
b. The ratio of “Irregular staffs” aged “55 years and over” increased by 6.4 points for
males and by 6.1 points for females compared to 5 years ago. As for trends in the ratio of “Irregular staffs” by sex and age group, this has continued to rise for
both males and females during the past 20 years.
The ratio of the age group “Less than 35 years old” for males was 25.3%, an increase of 2.2
points compared to 2007, and for females, the ratio was 47.0%, an increase of 0.5 points.
The ratio of “35 to 54 years old” for males was 9.8%, an increase of 1.3 points from 2007. For
females, the ratio was 58.3%, an increase of 0.3 points.
The ratio of “55 years old and over” for males was 43.8%, an increase of 6.4 points from 2007.
For females, the ratio was 70.4%, an increase of 6.1 points. (Table II-2-1, Fig. II-2-2)
21.7 24.6
31.9 35.5
38.2
9.9 11.1
16.3
19.9 22.1
39.1
44.0
52.9 55.2 57.5
0
10
20
30
40
50
60
70
1992 1997 2002 2007 2012
(%)
Both sexes
Male
Female
Table II-2-1: Trends in number of employees (excluding executive of company or corporation), and number and ratio
of irregular staffs by sex and age group / 1992-2012
Fig. II-2-2: Trends in ratio of irregular staffs by sex and age group / 1992-2012
16.521.1
30.433.6 35.3
10.513.0
19.523.1
25.3
24.9
32.1
44.346.5 47.0
0
20
40
60
80
1992 1997 2002 2007 2012
(%)
(Less than 35 years old)
Both sexes
Male
Female
21.9 23.2
28.130.4 31.5
3.7 3.66.5
8.5 9.8
48.551.1
57.2 58.0 58.3
0
20
40
60
80
1992 1997 2002 2007 2012
(%)
(35 to 54 years old)
Both sexes
Male
Female
35.337.5
45.448.9
55.8
26.7 26.6
34.237.4
43.8
51.055.6
62.7 64.3
70.4
0
20
40
60
80
1992 1997 2002 2007 2012
(%)
(55 years old and over)
Both sexes
Male
Female
(thousand persons,%)
Irregularstaffs
Irregularstaffs
Irregularstaffs
Irregularstaffs
Irregularstaffs
Total 48,605.0 10,532.0 51,147.0 12,590.0 50,837.5 16,206.2 53,262.5 18,898.6 53,537.5 20,427.1Less than 35 years old 19,323.0 3,192.0 20,263.0 4,268.0 19,733.9 5,993.7 18,649.5 6,268.8 16,387.6 5,780.535 to 54 years old 22,376.0 4,902.0 22,801.0 5,289.0 22,604.3 6,351.5 23,216.6 7,057.2 25,077.3 7,905.455 years old and over 6,906.0 2,438.0 8,084.0 3,030.0 8,499.2 3,860.9 11,396.1 5,572.6 12,072.8 6,741.2Total 28,971.0 2,862.0 30,157.0 3,358.0 29,244.7 4,780.3 29,735.0 5,910.7 29,291.7 6,482.7Less than 35 years old 11,218.0 1,174.0 11,692.0 1,517.0 11,100.9 2,168.5 10,280.8 2,376.7 8,841.4 2,233.535 to 54 years old 13,290.0 495.0 13,397.0 488.0 12,995.0 851.0 12,938.8 1,100.3 13,845.1 1,357.055 years old and over 4,465.0 1,193.0 5,069.0 1,350.0 5,148.9 1,761.1 6,515.2 2,433.8 6,605.2 2,892.1Total 19,634.0 7,670.0 20,990.0 9,231.0 21,592.8 11,425.7 23,527.5 12,988.0 24,245.7 13,944.4Less than 35 years old 8,106.0 2,018.0 8,571.0 2,750.0 8,633.1 3,825.4 8,368.7 3,892.2 7,546.0 3,546.935 to 54 years old 9,087.0 4,407.0 9,405.0 4,804.0 9,609.4 5,500.7 10,277.8 5,956.7 11,232.2 6,548.455 years old and over 2,441.0 1,245.0 3,015.0 1,677.0 3,350.3 2,099.7 4,880.9 3,139.2 5,467.6 3,849.1Total 100.0 21.7 100.0 24.6 100.0 31.9 100.0 35.5 100.0 38.2Less than 35 years old 100.0 16.5 100.0 21.1 100.0 30.4 100.0 33.6 100.0 35.335 to 54 years old 100.0 21.9 100.0 23.2 100.0 28.1 100.0 30.4 100.0 31.555 years old and over 100.0 35.3 100.0 37.5 100.0 45.4 100.0 48.9 100.0 55.8Total 100.0 9.9 100.0 11.1 100.0 16.3 100.0 19.9 100.0 22.1Less than 35 years old 100.0 10.5 100.0 13.0 100.0 19.5 100.0 23.1 100.0 25.335 to 54 years old 100.0 3.7 100.0 3.6 100.0 6.5 100.0 8.5 100.0 9.855 years old and over 100.0 26.7 100.0 26.6 100.0 34.2 100.0 37.4 100.0 43.8Total 100.0 39.1 100.0 44.0 100.0 52.9 100.0 55.2 100.0 57.5Less than 35 years old 100.0 24.9 100.0 32.1 100.0 44.3 100.0 46.5 100.0 47.035 to 54 years old 100.0 48.5 100.0 51.1 100.0 57.2 100.0 58.0 100.0 58.355 years old and over 100.0 51.0 100.0 55.6 100.0 62.7 100.0 64.3 100.0 70.4
Note) Results for 1992-1997 are calculated in units of thousands.
Num
ber
Bot
h se
xes
Mal
eFe
mal
e
Rat
io
Bot
h se
xes
Mal
eFe
mal
e
Employees(excluding
executive ofcompany orcorporation)
Employees(excluding
executive ofcompany orcorporation)
Employees(excluding
executive ofcompany orcorporation)
Employees(excluding
executive ofcompany orcorporation)
Employees(excluding
executive ofcompany orcorporation)
SexAge
1992 1997 2002 2007 2012
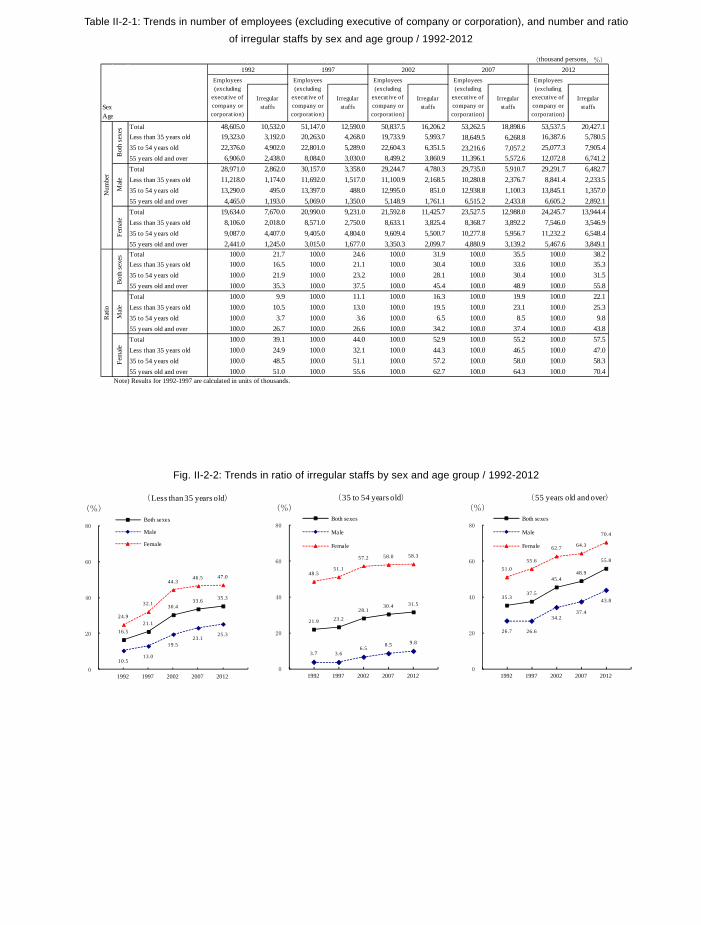
177
II-2. Circumstances surrounding employment
1. Irregular staffs (1) Trends in ratios of irregular staffs
a. The ratio of “Irregular staffs” to all employees (excluding executive of company or corporation) increased to 38.2%, continuing to rise for both sexes, 22.1% for males and 57.5% for females.
As trends in the ratio of “Irregular staffs”, including “Part-time workers” and “Arbeit (temporary
workers)”, among “Employees, excluding executive of company or corporation” by sex, the ratio
for males increased from 9.9% in 1992 to 22.1% in 2012, thus exceeding 20%. For females,
similarly, the ratio increased from 39.1% to 57.5%, “Irregular staffs” again accounting for more
than 50% after passing that mark in 2007. (Fig. II-2-1)
Fig. II-2-1: Trends in ratios of irregular staffs among all employees (excluding executive of company or corporation) by sex
/ 1992-2012
b. The ratio of “Irregular staffs” aged “55 years and over” increased by 6.4 points for
males and by 6.1 points for females compared to 5 years ago. As for trends in the ratio of “Irregular staffs” by sex and age group, this has continued to rise for
both males and females during the past 20 years.
The ratio of the age group “Less than 35 years old” for males was 25.3%, an increase of 2.2
points compared to 2007, and for females, the ratio was 47.0%, an increase of 0.5 points.
The ratio of “35 to 54 years old” for males was 9.8%, an increase of 1.3 points from 2007. For
females, the ratio was 58.3%, an increase of 0.3 points.
The ratio of “55 years old and over” for males was 43.8%, an increase of 6.4 points from 2007.
For females, the ratio was 70.4%, an increase of 6.1 points. (Table II-2-1, Fig. II-2-2)
21.7 24.6
31.9 35.5
38.2
9.9 11.1
16.3
19.9 22.1
39.1
44.0
52.9 55.2 57.5
0
10
20
30
40
50
60
70
1992 1997 2002 2007 2012
(%)
Both sexes
Male
Female
Table II-2-1: Trends in number of employees (excluding executive of company or corporation), and number and ratio
of irregular staffs by sex and age group / 1992-2012
Fig. II-2-2: Trends in ratio of irregular staffs by sex and age group / 1992-2012
16.521.1
30.433.6 35.3
10.513.0
19.523.1
25.3
24.9
32.1
44.346.5 47.0
0
20
40
60
80
1992 1997 2002 2007 2012
(%)
(Less than 35 years old)
Both sexes
Male
Female
21.9 23.2
28.130.4 31.5
3.7 3.66.5
8.5 9.8
48.551.1
57.2 58.0 58.3
0
20
40
60
80
1992 1997 2002 2007 2012
(%)
(35 to 54 years old)
Both sexes
Male
Female
35.337.5
45.448.9
55.8
26.7 26.6
34.237.4
43.8
51.055.6
62.7 64.3
70.4
0
20
40
60
80
1992 1997 2002 2007 2012
(%)
(55 years old and over)
Both sexes
Male
Female
(thousand persons,%)
Irregularstaffs
Irregularstaffs
Irregularstaffs
Irregularstaffs
Irregularstaffs
Total 48,605.0 10,532.0 51,147.0 12,590.0 50,837.5 16,206.2 53,262.5 18,898.6 53,537.5 20,427.1Less than 35 years old 19,323.0 3,192.0 20,263.0 4,268.0 19,733.9 5,993.7 18,649.5 6,268.8 16,387.6 5,780.535 to 54 years old 22,376.0 4,902.0 22,801.0 5,289.0 22,604.3 6,351.5 23,216.6 7,057.2 25,077.3 7,905.455 years old and over 6,906.0 2,438.0 8,084.0 3,030.0 8,499.2 3,860.9 11,396.1 5,572.6 12,072.8 6,741.2Total 28,971.0 2,862.0 30,157.0 3,358.0 29,244.7 4,780.3 29,735.0 5,910.7 29,291.7 6,482.7Less than 35 years old 11,218.0 1,174.0 11,692.0 1,517.0 11,100.9 2,168.5 10,280.8 2,376.7 8,841.4 2,233.535 to 54 years old 13,290.0 495.0 13,397.0 488.0 12,995.0 851.0 12,938.8 1,100.3 13,845.1 1,357.055 years old and over 4,465.0 1,193.0 5,069.0 1,350.0 5,148.9 1,761.1 6,515.2 2,433.8 6,605.2 2,892.1Total 19,634.0 7,670.0 20,990.0 9,231.0 21,592.8 11,425.7 23,527.5 12,988.0 24,245.7 13,944.4Less than 35 years old 8,106.0 2,018.0 8,571.0 2,750.0 8,633.1 3,825.4 8,368.7 3,892.2 7,546.0 3,546.935 to 54 years old 9,087.0 4,407.0 9,405.0 4,804.0 9,609.4 5,500.7 10,277.8 5,956.7 11,232.2 6,548.455 years old and over 2,441.0 1,245.0 3,015.0 1,677.0 3,350.3 2,099.7 4,880.9 3,139.2 5,467.6 3,849.1Total 100.0 21.7 100.0 24.6 100.0 31.9 100.0 35.5 100.0 38.2Less than 35 years old 100.0 16.5 100.0 21.1 100.0 30.4 100.0 33.6 100.0 35.335 to 54 years old 100.0 21.9 100.0 23.2 100.0 28.1 100.0 30.4 100.0 31.555 years old and over 100.0 35.3 100.0 37.5 100.0 45.4 100.0 48.9 100.0 55.8Total 100.0 9.9 100.0 11.1 100.0 16.3 100.0 19.9 100.0 22.1Less than 35 years old 100.0 10.5 100.0 13.0 100.0 19.5 100.0 23.1 100.0 25.335 to 54 years old 100.0 3.7 100.0 3.6 100.0 6.5 100.0 8.5 100.0 9.855 years old and over 100.0 26.7 100.0 26.6 100.0 34.2 100.0 37.4 100.0 43.8Total 100.0 39.1 100.0 44.0 100.0 52.9 100.0 55.2 100.0 57.5Less than 35 years old 100.0 24.9 100.0 32.1 100.0 44.3 100.0 46.5 100.0 47.035 to 54 years old 100.0 48.5 100.0 51.1 100.0 57.2 100.0 58.0 100.0 58.355 years old and over 100.0 51.0 100.0 55.6 100.0 62.7 100.0 64.3 100.0 70.4
Note) Results for 1992-1997 are calculated in units of thousands.
Num
ber
Bot
h se
xes
Mal
eFe
mal
e
Rat
io
Bot
h se
xes
Mal
eFe
mal
e
Employees(excluding
executive ofcompany orcorporation)
Employees(excluding
executive ofcompany orcorporation)
Employees(excluding
executive ofcompany orcorporation)
Employees(excluding
executive ofcompany orcorporation)
Employees(excluding
executive ofcompany orcorporation)
SexAge
1992 1997 2002 2007 2012
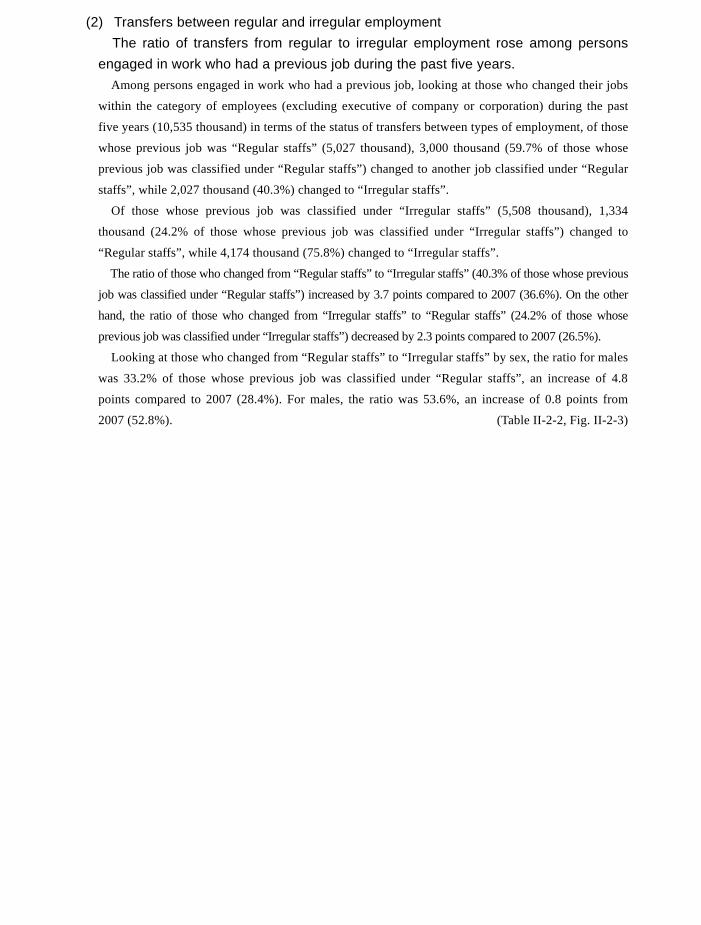
178
(2) Transfers between regular and irregular employment The ratio of transfers from regular to irregular employment rose among persons
engaged in work who had a previous job during the past five years. Among persons engaged in work who had a previous job, looking at those who changed their jobs
within the category of employees (excluding executive of company or corporation) during the past
five years (10,535 thousand) in terms of the status of transfers between types of employment, of those
whose previous job was “Regular staffs” (5,027 thousand), 3,000 thousand (59.7% of those whose
previous job was classified under “Regular staffs”) changed to another job classified under “Regular
staffs”, while 2,027 thousand (40.3%) changed to “Irregular staffs”.
Of those whose previous job was classified under “Irregular staffs” (5,508 thousand), 1,334
thousand (24.2% of those whose previous job was classified under “Irregular staffs”) changed to
“Regular staffs”, while 4,174 thousand (75.8%) changed to “Irregular staffs”.
The ratio of those who changed from “Regular staffs” to “Irregular staffs” (40.3% of those whose previous
job was classified under “Regular staffs”) increased by 3.7 points compared to 2007 (36.6%). On the other
hand, the ratio of those who changed from “Irregular staffs” to “Regular staffs” (24.2% of those whose
previous job was classified under “Irregular staffs”) decreased by 2.3 points compared to 2007 (26.5%).
Looking at those who changed from “Regular staffs” to “Irregular staffs” by sex, the ratio for males
was 33.2% of those whose previous job was classified under “Regular staffs”, an increase of 4.8
points compared to 2007 (28.4%). For males, the ratio was 53.6%, an increase of 0.8 points from
2007 (52.8%). (Table II-2-2, Fig. II-2-3)
Table II-2-2: Number of persons engaged in work who had a previous job during the past 5 years (employees,
excluding executive of company or corporation) by sex, type of employment of the present job, and type of employment
of the previous job / 2012
(thousand persons)
SexType of employmentof the present job 1)
Part-timeworkers
Arbeit(temporary
workers)
Dispatchedworkers from
temporarylabour agency
Contractemployees
Entrustedemployees
Others
Employees (excluding executive of company or corporation) 10,534.9 5,026.5 5,508.4 2,084.9 1,526.2 724.1 793.3 170.1 209.8 Regular staffs 4,333.7 2,999.5 1,334.2 303.8 428.7 200.0 281.6 51.5 68.6 Irregular staffs 6,201.3 2,027.0 4,174.2 1,781.2 1,097.5 524.1 511.7 118.6 141.2 Part-time workers 2,572.2 647.2 1,924.9 1,422.1 195.2 120.9 115.5 32.4 38.8 Arbeit (temporary workers) 1,396.3 411.0 985.3 123.8 695.7 64.3 67.4 14.5 19.6 Dispatched workers from temporary labour agency
614.1 185.4 428.7 64.5 69.4 217.1 62.5 5.6 9.6
Contract employees 1,031.2 471.6 559.6 103.6 98.0 102.7 220.8 14.3 20.1 Entrusted employees 348.3 216.0 132.4 34.4 15.0 7.9 22.2 44.1 8.8 Others 239.2 95.8 143.4 32.8 24.1 11.1 23.3 7.6 44.4Male 4,988.0 3,274.8 1,713.2 176.7 688.9 270.7 392.2 80.4 104.1 Regular staffs 2,836.9 2,186.6 650.4 50.0 254.1 110.3 168.8 23.7 43.5 Irregular staffs 2,151.1 1,088.2 1,062.9 126.8 434.8 160.4 223.4 56.7 60.7 Part-time workers 358.7 195.4 163.3 77.6 27.1 16.7 25.4 8.9 7.7 Arbeit (temporary workers) 685.7 265.1 420.6 23.6 314.4 26.1 35.2 9.7 11.5 Dispatched workers from temporary labour agency
225.2 85.8 139.4 6.9 27.3 72.6 25.3 2.5 4.8
Contract employees 546.9 311.8 235.1 11.6 50.0 37.8 115.3 7.5 12.9 Entrusted employees 219.9 170.8 49.1 3.8 4.9 3.3 9.6 23.8 3.7 Others 114.8 59.4 55.4 3.2 11.2 3.9 12.7 4.4 20.1Female 5,546.9 1,751.7 3,795.2 1,908.2 837.3 453.3 401.1 89.6 105.7 Regular staffs 1,496.7 812.9 683.8 253.8 174.6 89.7 112.8 27.8 25.1 Irregular staffs 4,050.2 938.8 3,111.4 1,654.4 662.7 363.7 288.3 61.9 80.5 Part-time workers 2,213.5 451.9 1,761.6 1,344.6 168.1 104.2 90.2 23.5 31.1 Arbeit (temporary workers) 710.6 145.9 564.7 100.1 381.3 38.2 32.2 4.8 8.1 Dispatched workers from temporary labour agency
388.9 99.5 289.3 57.5 42.2 144.5 37.2 3.2 4.7
Contract employees 484.3 159.8 324.5 92.0 48.0 64.9 105.5 6.9 7.2 Entrusted employees 128.5 45.2 83.3 30.6 10.1 4.6 12.6 20.4 5.1 Others 124.4 36.4 88.0 29.6 13.0 7.2 10.6 3.2 24.3
Note 1) Names used for types of employment such as “Part-time workers” and “Arbeit (temporary workers)” differ from workplace to workplace.
Type of employment of the previous job 1) Employees
(excludingexecutive ofcompany orcorporation)
Regularstaffs
Irregular staffs
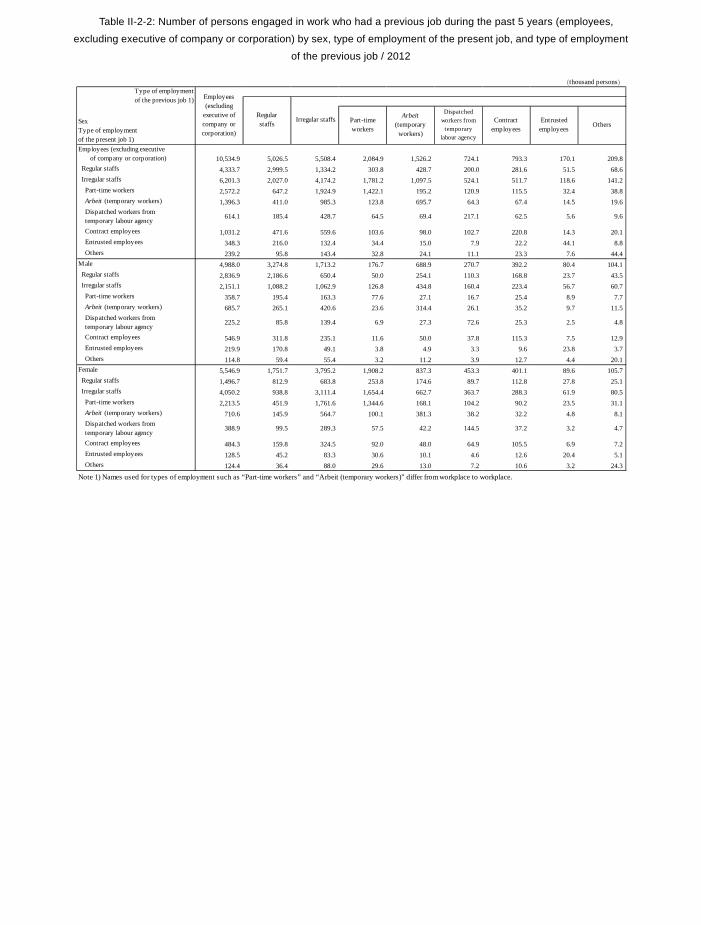
179
(2) Transfers between regular and irregular employment The ratio of transfers from regular to irregular employment rose among persons
engaged in work who had a previous job during the past five years. Among persons engaged in work who had a previous job, looking at those who changed their jobs
within the category of employees (excluding executive of company or corporation) during the past
five years (10,535 thousand) in terms of the status of transfers between types of employment, of those
whose previous job was “Regular staffs” (5,027 thousand), 3,000 thousand (59.7% of those whose
previous job was classified under “Regular staffs”) changed to another job classified under “Regular
staffs”, while 2,027 thousand (40.3%) changed to “Irregular staffs”.
Of those whose previous job was classified under “Irregular staffs” (5,508 thousand), 1,334
thousand (24.2% of those whose previous job was classified under “Irregular staffs”) changed to
“Regular staffs”, while 4,174 thousand (75.8%) changed to “Irregular staffs”.
The ratio of those who changed from “Regular staffs” to “Irregular staffs” (40.3% of those whose previous
job was classified under “Regular staffs”) increased by 3.7 points compared to 2007 (36.6%). On the other
hand, the ratio of those who changed from “Irregular staffs” to “Regular staffs” (24.2% of those whose
previous job was classified under “Irregular staffs”) decreased by 2.3 points compared to 2007 (26.5%).
Looking at those who changed from “Regular staffs” to “Irregular staffs” by sex, the ratio for males
was 33.2% of those whose previous job was classified under “Regular staffs”, an increase of 4.8
points compared to 2007 (28.4%). For males, the ratio was 53.6%, an increase of 0.8 points from
2007 (52.8%). (Table II-2-2, Fig. II-2-3)
Table II-2-2: Number of persons engaged in work who had a previous job during the past 5 years (employees,
excluding executive of company or corporation) by sex, type of employment of the present job, and type of employment
of the previous job / 2012
(thousand persons)
SexType of employmentof the present job 1)
Part-timeworkers
Arbeit(temporary
workers)
Dispatchedworkers from
temporarylabour agency
Contractemployees
Entrustedemployees
Others
Employees (excluding executive of company or corporation) 10,534.9 5,026.5 5,508.4 2,084.9 1,526.2 724.1 793.3 170.1 209.8 Regular staffs 4,333.7 2,999.5 1,334.2 303.8 428.7 200.0 281.6 51.5 68.6 Irregular staffs 6,201.3 2,027.0 4,174.2 1,781.2 1,097.5 524.1 511.7 118.6 141.2 Part-time workers 2,572.2 647.2 1,924.9 1,422.1 195.2 120.9 115.5 32.4 38.8 Arbeit (temporary workers) 1,396.3 411.0 985.3 123.8 695.7 64.3 67.4 14.5 19.6 Dispatched workers from temporary labour agency
614.1 185.4 428.7 64.5 69.4 217.1 62.5 5.6 9.6
Contract employees 1,031.2 471.6 559.6 103.6 98.0 102.7 220.8 14.3 20.1 Entrusted employees 348.3 216.0 132.4 34.4 15.0 7.9 22.2 44.1 8.8 Others 239.2 95.8 143.4 32.8 24.1 11.1 23.3 7.6 44.4Male 4,988.0 3,274.8 1,713.2 176.7 688.9 270.7 392.2 80.4 104.1 Regular staffs 2,836.9 2,186.6 650.4 50.0 254.1 110.3 168.8 23.7 43.5 Irregular staffs 2,151.1 1,088.2 1,062.9 126.8 434.8 160.4 223.4 56.7 60.7 Part-time workers 358.7 195.4 163.3 77.6 27.1 16.7 25.4 8.9 7.7 Arbeit (temporary workers) 685.7 265.1 420.6 23.6 314.4 26.1 35.2 9.7 11.5 Dispatched workers from temporary labour agency
225.2 85.8 139.4 6.9 27.3 72.6 25.3 2.5 4.8
Contract employees 546.9 311.8 235.1 11.6 50.0 37.8 115.3 7.5 12.9 Entrusted employees 219.9 170.8 49.1 3.8 4.9 3.3 9.6 23.8 3.7 Others 114.8 59.4 55.4 3.2 11.2 3.9 12.7 4.4 20.1Female 5,546.9 1,751.7 3,795.2 1,908.2 837.3 453.3 401.1 89.6 105.7 Regular staffs 1,496.7 812.9 683.8 253.8 174.6 89.7 112.8 27.8 25.1 Irregular staffs 4,050.2 938.8 3,111.4 1,654.4 662.7 363.7 288.3 61.9 80.5 Part-time workers 2,213.5 451.9 1,761.6 1,344.6 168.1 104.2 90.2 23.5 31.1 Arbeit (temporary workers) 710.6 145.9 564.7 100.1 381.3 38.2 32.2 4.8 8.1 Dispatched workers from temporary labour agency
388.9 99.5 289.3 57.5 42.2 144.5 37.2 3.2 4.7
Contract employees 484.3 159.8 324.5 92.0 48.0 64.9 105.5 6.9 7.2 Entrusted employees 128.5 45.2 83.3 30.6 10.1 4.6 12.6 20.4 5.1 Others 124.4 36.4 88.0 29.6 13.0 7.2 10.6 3.2 24.3
Note 1) Names used for types of employment such as “Part-time workers” and “Arbeit (temporary workers)” differ from workplace to workplace.
Type of employment of the previous job 1) Employees
(excludingexecutive ofcompany orcorporation)
Regularstaffs
Irregular staffs
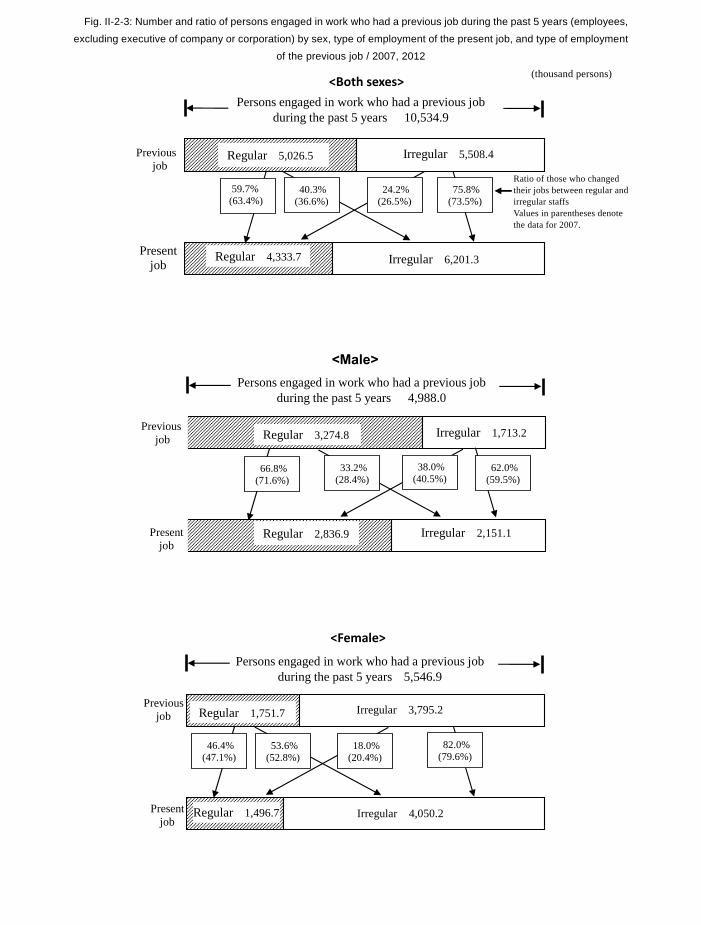
180
Present job
<Both sexes>
10,534.9Persons engaged in work who had a previous job during the past 5 years 10,534.9
59.7%(63.4%)
40.3%(36.6%)
24.2%(26.5%)
75.8%(73.5%)
Irregular 5,508.4
Irregular 6,201.3
Previousjob
Regular 5,026.5
Regular 4,333.7
<Female>
Presentjob
5,546.9
46.4%(47.1%)
53.6%(52.8%)
18.0%(20.4%)
82.0%(79.6%)
Irregular 3,795.2
Irregular 4,050.2
Persons engaged in work who had a previous job during the past 5 years 5,546.9
Previousjob Regular 1,751.7
Regular 1,496.7
<Male>
4,988.0
66.8%(71.6%)
33.2%(28.4%)
38.0%(40.5%)
62.0%(59.5%)
Irregular 1,713.2
Irregular 2,151.1
Persons engaged in work who had a previous job during the past 5 years 4,988.0
Previous job Regular 3,274.8
Regular 2,836.9
Present job
Fig. II-2-3: Number and ratio of persons engaged in work who had a previous job during the past 5 years (employees,
excluding executive of company or corporation) by sex, type of employment of the present job, and type of employment
of the previous job / 2007, 2012
(thousand persons)
Ratio of those who changed their jobs between regular and irregular staffs Values in parentheses denote the data for 2007.
2.0 2.1
2.3 2.4
2.5
2.7
1.6 1.6
1.8
1.0
1.5
2.0
2.5
3.0
2002 2007 2012
Both sexesMaleFemale
(%)
2. Young persons not engaged in work (1) Trends in number of young persons not engaged in work
a. Young persons not engaged in work* numbered 617 thousand, a decrease of 15 thousand from 5 years ago.
Young persons not engaged in work numbered 617 thousand (consisting of 286 thousand persons
wishing to work but not seeking a job, and 332 thousand persons not wishing to work), a decrease of
15 thousand compared to 2007.
By sex, males numbered 373 thousand, a decrease of 22 thousand compared to 2007, while females
numbered 245 thousand, an increase of 7 thousand from 2007. (Table II-2-3)
b. The ratio of young persons not engaged in work to the population of young persons (aged 15 to 34) is 2.3%, an increase of 0.2 points from 5 years ago.
Young persons not engaged in work accounted for 2.3% of the population aged 15 to 34, an
increase of 0.2 points compared to 2007. The ratio has continued to rise since 2002.
(Table II-2-3, Fig.II-2-4)
Table II-2-3: Number and ratio of young persons not engaged in work by sex and whether wishing to work / 2007, 2012
Fig. II-2-4: Trends in the ratio of young persons not engaged in work to the population aged 15 to 34 / 2002-2012
(thousand persons, %, points)Sex 2012 2007 Change
Whether Wishing to Work
Whether Seeking a Job Both sexes Male Female Both sexes Male Female Both sexes Male Female
Population aged 15 to 34 27,114.2 13,793.7 13,320.5 30,566.5 15,547.8 15,018.7 -3,452.3 -1,754.1 -1,698.2
①+② 617.3 372.6 244.7 632.7 394.6 238.2 -15.4 -22.0 6.5
Of those with wishing to work,those not seeking a job ① 285.7 177.3 108.4 301.7 193.8 107.9 -16.0 -16.5 0.5
Of those not wishing to work ② 331.6 195.3 136.3 331.0 200.8 130.3 0.6 -5.5 6.0
Population aged 15 to 34 100.0 100.0 100.0 100.0 100.0 100.0 - - -
2.3 2.7 1.8 2.1 2.5 1.6 0.2 0.2 0.2
Num
ber
Rat
io
Young personsnot engaged in work
Young personsnot engaged in work
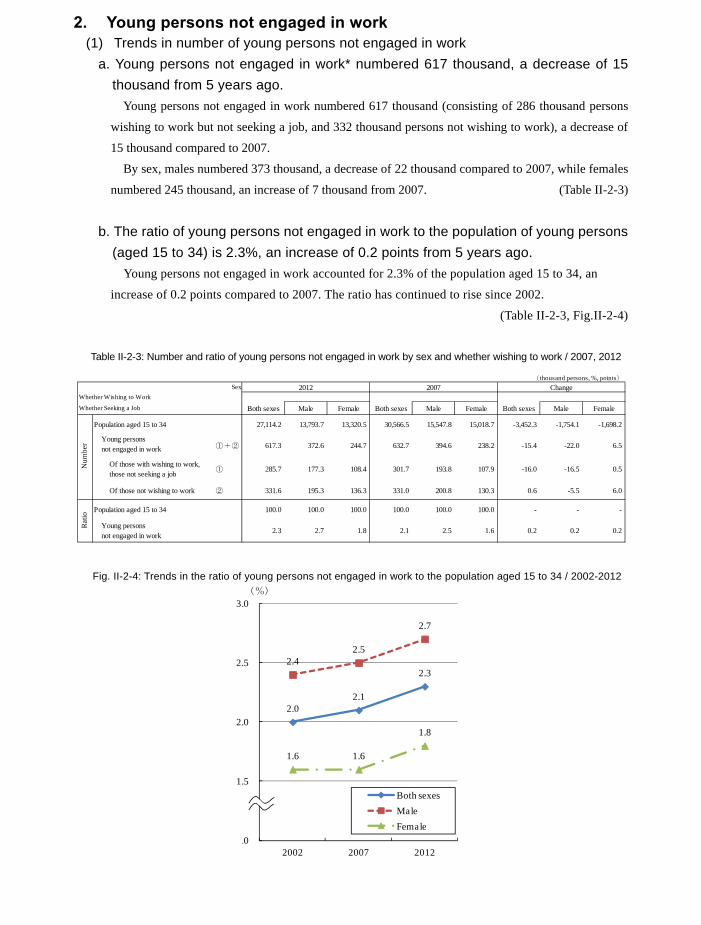
181
Present job
<Both sexes>
10,534.9Persons engaged in work who had a previous job during the past 5 years 10,534.9
59.7%(63.4%)
40.3%(36.6%)
24.2%(26.5%)
75.8%(73.5%)
Irregular 5,508.4
Irregular 6,201.3
Previousjob
Regular 5,026.5
Regular 4,333.7
<Female>
Presentjob
5,546.9
46.4%(47.1%)
53.6%(52.8%)
18.0%(20.4%)
82.0%(79.6%)
Irregular 3,795.2
Irregular 4,050.2
Persons engaged in work who had a previous job during the past 5 years 5,546.9
Previousjob Regular 1,751.7
Regular 1,496.7
<Male>
4,988.0
66.8%(71.6%)
33.2%(28.4%)
38.0%(40.5%)
62.0%(59.5%)
Irregular 1,713.2
Irregular 2,151.1
Persons engaged in work who had a previous job during the past 5 years 4,988.0
Previous job Regular 3,274.8
Regular 2,836.9
Present job
Fig. II-2-3: Number and ratio of persons engaged in work who had a previous job during the past 5 years (employees,
excluding executive of company or corporation) by sex, type of employment of the present job, and type of employment
of the previous job / 2007, 2012
(thousand persons)
Ratio of those who changed their jobs between regular and irregular staffs Values in parentheses denote the data for 2007.
2.0 2.1
2.3 2.4
2.5
2.7
1.6 1.6
1.8
1.0
1.5
2.0
2.5
3.0
2002 2007 2012
Both sexesMaleFemale
(%)
2. Young persons not engaged in work (1) Trends in number of young persons not engaged in work
a. Young persons not engaged in work* numbered 617 thousand, a decrease of 15 thousand from 5 years ago.
Young persons not engaged in work numbered 617 thousand (consisting of 286 thousand persons
wishing to work but not seeking a job, and 332 thousand persons not wishing to work), a decrease of
15 thousand compared to 2007.
By sex, males numbered 373 thousand, a decrease of 22 thousand compared to 2007, while females
numbered 245 thousand, an increase of 7 thousand from 2007. (Table II-2-3)
b. The ratio of young persons not engaged in work to the population of young persons (aged 15 to 34) is 2.3%, an increase of 0.2 points from 5 years ago.
Young persons not engaged in work accounted for 2.3% of the population aged 15 to 34, an
increase of 0.2 points compared to 2007. The ratio has continued to rise since 2002.
(Table II-2-3, Fig.II-2-4)
Table II-2-3: Number and ratio of young persons not engaged in work by sex and whether wishing to work / 2007, 2012
Fig. II-2-4: Trends in the ratio of young persons not engaged in work to the population aged 15 to 34 / 2002-2012
(thousand persons, %, points)Sex 2012 2007 Change
Whether Wishing to Work
Whether Seeking a Job Both sexes Male Female Both sexes Male Female Both sexes Male Female
Population aged 15 to 34 27,114.2 13,793.7 13,320.5 30,566.5 15,547.8 15,018.7 -3,452.3 -1,754.1 -1,698.2
①+② 617.3 372.6 244.7 632.7 394.6 238.2 -15.4 -22.0 6.5
Of those with wishing to work,those not seeking a job ① 285.7 177.3 108.4 301.7 193.8 107.9 -16.0 -16.5 0.5
Of those not wishing to work ② 331.6 195.3 136.3 331.0 200.8 130.3 0.6 -5.5 6.0
Population aged 15 to 34 100.0 100.0 100.0 100.0 100.0 100.0 - - -
2.3 2.7 1.8 2.1 2.5 1.6 0.2 0.2 0.2
Num
ber
Rat
io
Young personsnot engaged in work
Young personsnot engaged in work
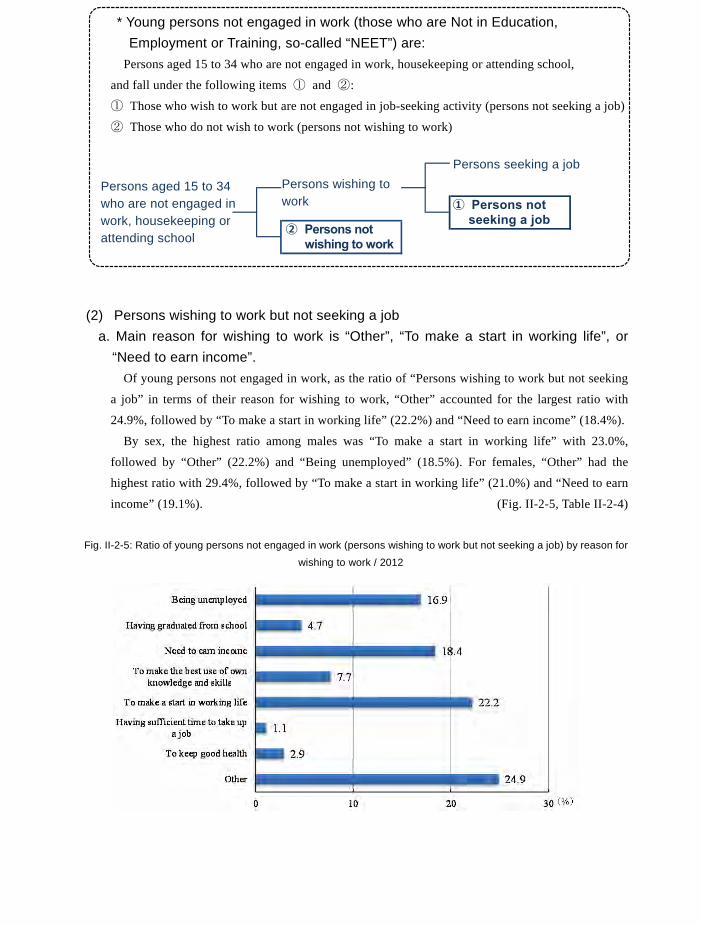
182
* Young persons not engaged in work (those who are Not in Education, Employment or Training, so-called “NEET”) are:
Persons aged 15 to 34 who are not engaged in work, housekeeping or attending school,
and fall under the following items ① and ②:
① Those who wish to work but are not engaged in job-seeking activity (persons not seeking a job)
② Those who do not wish to work (persons not wishing to work)
(2) Persons wishing to work but not seeking a job a. Main reason for wishing to work is “Other”, “To make a start in working life”, or
“Need to earn income”. Of young persons not engaged in work, as the ratio of “Persons wishing to work but not seeking
a job” in terms of their reason for wishing to work, “Other” accounted for the largest ratio with
24.9%, followed by “To make a start in working life” (22.2%) and “Need to earn income” (18.4%).
By sex, the highest ratio among males was “To make a start in working life” with 23.0%,
followed by “Other” (22.2%) and “Being unemployed” (18.5%). For females, “Other” had the
highest ratio with 29.4%, followed by “To make a start in working life” (21.0%) and “Need to earn
income” (19.1%). (Fig. II-2-5, Table II-2-4)
Fig. II-2-5: Ratio of young persons not engaged in work (persons wishing to work but not seeking a job) by reason for
wishing to work / 2012
Persons wishing to work
Persons seeking a job
① Persons not seeking a job
② Persons not wishing to work
Persons aged 15 to 34 who are not engaged in work, housekeeping or attending school
Table II-2-4: Number and ratio of young persons not engaged in work (persons wishing to work but not seeking a job)
by sex and reason for wishing to work / 2012
b. The main reason for not seeking a job is “Illness or Injury”. Of young persons not engaged in work, as the ratio of “Persons wishing to work but not seeking
a job” in terms of the reason for not seeking a job (not engaging in job-seeking activity), “Illness or
Injury” had the highest ratio with 26.5%, followed by “Other” (24.0%) and “Concentrating on
study in order to enter a college or obtain a qualification without attending a school” (12.3%).
By sex, among males “Other” had the highest ratio with 25.5%, followed by “Illness or Injury”
(23.6%) and “Concentrating on study in order to enter a college or obtain a qualification without
attending a school” (13.8%). Among females, “Illness or Injury” had the highest ratio with 31.1%,
followed by “Other” (21.6%) and “Concentrating on study in order to enter a college or obtain a
qualification without attending a school” (9.9%). (Fig. II-2-6, Table II-2-5)
Fig. II-2-6: Ratio of young persons not engaged in work (persons wishing to work but not seeking a job) by reason for
not seeking a job / 2012
(thousand persons, %)
Sex Number Ratio
Reason for Wishing to Work Both sexes Male Female Both sexes Male FemaleTotal 285.7 177.3 108.4 100.0 100.0 100.0
Being unemployed 48.4 32.8 15.7 16.9 18.5 14.5Having graduated from school 13.4 8.5 4.9 4.7 4.8 4.5Need to earn income 52.5 31.8 20.7 18.4 17.9 19.1To make the best use of own knowledge and skills 22.1 14.2 8.0 7.7 8.0 7.4To make a start in working life 63.4 40.7 22.7 22.2 23.0 20.9Having sufficient time to take up a job 3.1 1.9 1.2 1.1 1.1 1.1To keep good health 8.3 5.9 2.4 2.9 3.3 2.2Other 71.2 39.4 31.8 24.9 22.2 29.3
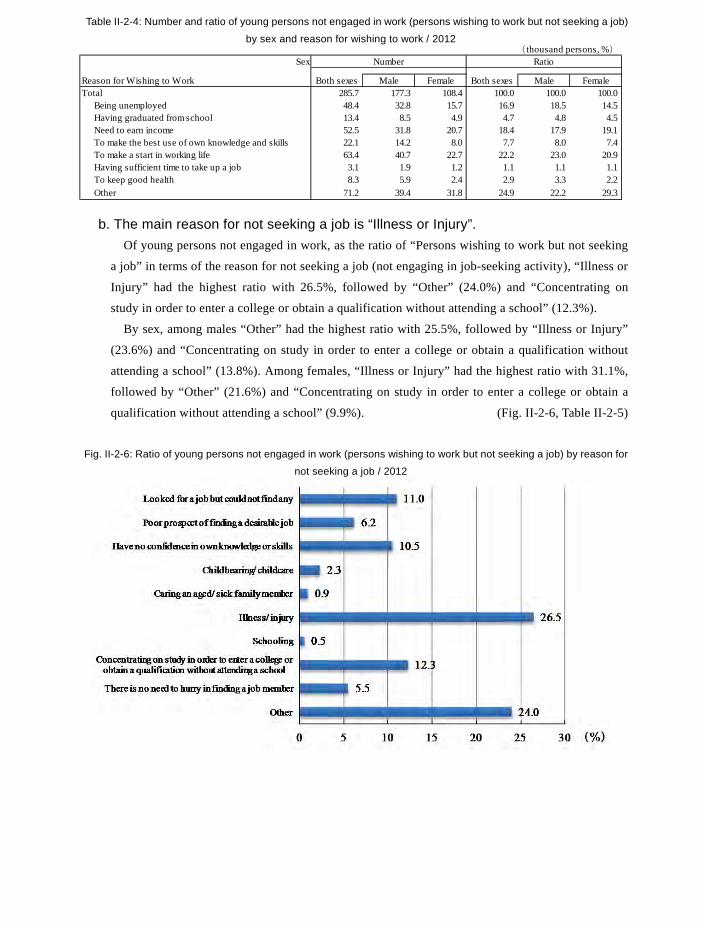
183
* Young persons not engaged in work (those who are Not in Education, Employment or Training, so-called “NEET”) are:
Persons aged 15 to 34 who are not engaged in work, housekeeping or attending school,
and fall under the following items ① and ②:
① Those who wish to work but are not engaged in job-seeking activity (persons not seeking a job)
② Those who do not wish to work (persons not wishing to work)
(2) Persons wishing to work but not seeking a job a. Main reason for wishing to work is “Other”, “To make a start in working life”, or
“Need to earn income”. Of young persons not engaged in work, as the ratio of “Persons wishing to work but not seeking
a job” in terms of their reason for wishing to work, “Other” accounted for the largest ratio with
24.9%, followed by “To make a start in working life” (22.2%) and “Need to earn income” (18.4%).
By sex, the highest ratio among males was “To make a start in working life” with 23.0%,
followed by “Other” (22.2%) and “Being unemployed” (18.5%). For females, “Other” had the
highest ratio with 29.4%, followed by “To make a start in working life” (21.0%) and “Need to earn
income” (19.1%). (Fig. II-2-5, Table II-2-4)
Fig. II-2-5: Ratio of young persons not engaged in work (persons wishing to work but not seeking a job) by reason for
wishing to work / 2012
Persons wishing to work
Persons seeking a job
① Persons not seeking a job
② Persons not wishing to work
Persons aged 15 to 34 who are not engaged in work, housekeeping or attending school
Table II-2-4: Number and ratio of young persons not engaged in work (persons wishing to work but not seeking a job)
by sex and reason for wishing to work / 2012
b. The main reason for not seeking a job is “Illness or Injury”. Of young persons not engaged in work, as the ratio of “Persons wishing to work but not seeking
a job” in terms of the reason for not seeking a job (not engaging in job-seeking activity), “Illness or
Injury” had the highest ratio with 26.5%, followed by “Other” (24.0%) and “Concentrating on
study in order to enter a college or obtain a qualification without attending a school” (12.3%).
By sex, among males “Other” had the highest ratio with 25.5%, followed by “Illness or Injury”
(23.6%) and “Concentrating on study in order to enter a college or obtain a qualification without
attending a school” (13.8%). Among females, “Illness or Injury” had the highest ratio with 31.1%,
followed by “Other” (21.6%) and “Concentrating on study in order to enter a college or obtain a
qualification without attending a school” (9.9%). (Fig. II-2-6, Table II-2-5)
Fig. II-2-6: Ratio of young persons not engaged in work (persons wishing to work but not seeking a job) by reason for
not seeking a job / 2012
(thousand persons, %)
Sex Number Ratio
Reason for Wishing to Work Both sexes Male Female Both sexes Male FemaleTotal 285.7 177.3 108.4 100.0 100.0 100.0
Being unemployed 48.4 32.8 15.7 16.9 18.5 14.5Having graduated from school 13.4 8.5 4.9 4.7 4.8 4.5Need to earn income 52.5 31.8 20.7 18.4 17.9 19.1To make the best use of own knowledge and skills 22.1 14.2 8.0 7.7 8.0 7.4To make a start in working life 63.4 40.7 22.7 22.2 23.0 20.9Having sufficient time to take up a job 3.1 1.9 1.2 1.1 1.1 1.1To keep good health 8.3 5.9 2.4 2.9 3.3 2.2Other 71.2 39.4 31.8 24.9 22.2 29.3
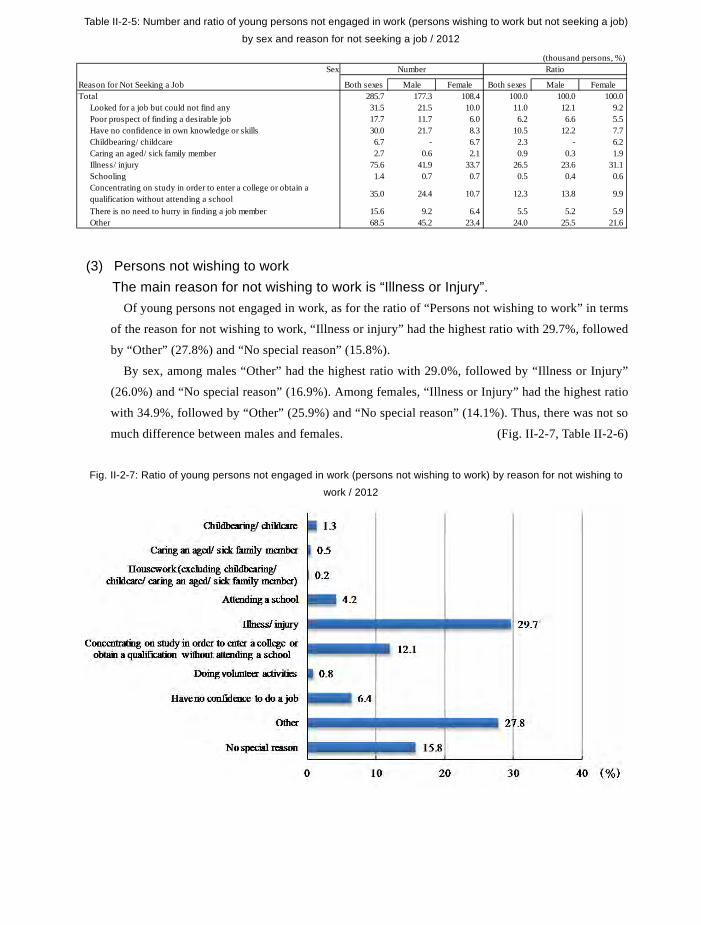
184
Table II-2-5: Number and ratio of young persons not engaged in work (persons wishing to work but not seeking a job)
by sex and reason for not seeking a job / 2012
(3) Persons not wishing to work The main reason for not wishing to work is “Illness or Injury”.
Of young persons not engaged in work, as for the ratio of “Persons not wishing to work” in terms
of the reason for not wishing to work, “Illness or injury” had the highest ratio with 29.7%, followed
by “Other” (27.8%) and “No special reason” (15.8%).
By sex, among males “Other” had the highest ratio with 29.0%, followed by “Illness or Injury”
(26.0%) and “No special reason” (16.9%). Among females, “Illness or Injury” had the highest ratio
with 34.9%, followed by “Other” (25.9%) and “No special reason” (14.1%). Thus, there was not so
much difference between males and females. (Fig. II-2-7, Table II-2-6)
Fig. II-2-7: Ratio of young persons not engaged in work (persons not wishing to work) by reason for not wishing to
work / 2012
(thousand persons, %)Sex Number Ratio
Reason for Not Seeking a Job Both sexes Male Female Both sexes Male FemaleTotal 285.7 177.3 108.4 100.0 100.0 100.0
Looked for a job but could not find any 31.5 21.5 10.0 11.0 12.1 9.2Poor prospect of finding a desirable job 17.7 11.7 6.0 6.2 6.6 5.5Have no confidence in own knowledge or skills 30.0 21.7 8.3 10.5 12.2 7.7Childbearing/ childcare 6.7 - 6.7 2.3 - 6.2Caring an aged/ sick family member 2.7 0.6 2.1 0.9 0.3 1.9Illness/ injury 75.6 41.9 33.7 26.5 23.6 31.1Schooling 1.4 0.7 0.7 0.5 0.4 0.6Concentrating on study in order to enter a college or obtain aqualification without attending a school 35.0 24.4 10.7 12.3 13.8 9.9
There is no need to hurry in finding a job member 15.6 9.2 6.4 5.5 5.2 5.9Other 68.5 45.2 23.4 24.0 25.5 21.6
Table II-2-6: Number and ratio of young persons not engaged in work (persons not wishing to work) by sex and
reason for not wishing to work / 2012
(thousand persons, %)Sex Number Ratio
Reason for Not Wishing to Work Both sexes Male Female Both sexes Male FemaleTotal 331.6 195.3 136.3 100.0 100.0 100.0
Childbearing/ childcare 4.4 0.1 4.2 1.3 0.1 3.1Caring an aged/ sick family member 1.5 0.2 1.2 0.5 0.1 0.9Housework (excluding childbearing/ childcare/ caring an aged/ sickfamily member)
0.8 - 0.8 0.2 - 0.6
Attending a school 14.0 8.6 5.4 4.2 4.4 4.0Illness/ injury 98.4 50.8 47.6 29.7 26.0 34.9Concentrating on study in order to enter a college or obtain aqualification without attending a school 40.2 27.0 13.2 12.1 13.8 9.7
Doing volunteer activities 2.5 1.2 1.3 0.8 0.6 1.0Have no confidence to do a job 21.3 16.0 5.3 6.4 8.2 3.9Other 92.1 56.7 35.3 27.8 29.0 25.9No special reason 52.4 33.1 19.2 15.8 16.9 14.1

185
Table II-2-5: Number and ratio of young persons not engaged in work (persons wishing to work but not seeking a job)
by sex and reason for not seeking a job / 2012
(3) Persons not wishing to work The main reason for not wishing to work is “Illness or Injury”.
Of young persons not engaged in work, as for the ratio of “Persons not wishing to work” in terms
of the reason for not wishing to work, “Illness or injury” had the highest ratio with 29.7%, followed
by “Other” (27.8%) and “No special reason” (15.8%).
By sex, among males “Other” had the highest ratio with 29.0%, followed by “Illness or Injury”
(26.0%) and “No special reason” (16.9%). Among females, “Illness or Injury” had the highest ratio
with 34.9%, followed by “Other” (25.9%) and “No special reason” (14.1%). Thus, there was not so
much difference between males and females. (Fig. II-2-7, Table II-2-6)
Fig. II-2-7: Ratio of young persons not engaged in work (persons not wishing to work) by reason for not wishing to
work / 2012
(thousand persons, %)Sex Number Ratio
Reason for Not Seeking a Job Both sexes Male Female Both sexes Male FemaleTotal 285.7 177.3 108.4 100.0 100.0 100.0
Looked for a job but could not find any 31.5 21.5 10.0 11.0 12.1 9.2Poor prospect of finding a desirable job 17.7 11.7 6.0 6.2 6.6 5.5Have no confidence in own knowledge or skills 30.0 21.7 8.3 10.5 12.2 7.7Childbearing/ childcare 6.7 - 6.7 2.3 - 6.2Caring an aged/ sick family member 2.7 0.6 2.1 0.9 0.3 1.9Illness/ injury 75.6 41.9 33.7 26.5 23.6 31.1Schooling 1.4 0.7 0.7 0.5 0.4 0.6Concentrating on study in order to enter a college or obtain aqualification without attending a school 35.0 24.4 10.7 12.3 13.8 9.9
There is no need to hurry in finding a job member 15.6 9.2 6.4 5.5 5.2 5.9Other 68.5 45.2 23.4 24.0 25.5 21.6
Table II-2-6: Number and ratio of young persons not engaged in work (persons not wishing to work) by sex and
reason for not wishing to work / 2012
(thousand persons, %)Sex Number Ratio
Reason for Not Wishing to Work Both sexes Male Female Both sexes Male FemaleTotal 331.6 195.3 136.3 100.0 100.0 100.0
Childbearing/ childcare 4.4 0.1 4.2 1.3 0.1 3.1Caring an aged/ sick family member 1.5 0.2 1.2 0.5 0.1 0.9Housework (excluding childbearing/ childcare/ caring an aged/ sickfamily member)
0.8 - 0.8 0.2 - 0.6
Attending a school 14.0 8.6 5.4 4.2 4.4 4.0Illness/ injury 98.4 50.8 47.6 29.7 26.0 34.9Concentrating on study in order to enter a college or obtain aqualification without attending a school 40.2 27.0 13.2 12.1 13.8 9.7
Doing volunteer activities 2.5 1.2 1.3 0.8 0.6 1.0Have no confidence to do a job 21.3 16.0 5.3 6.4 8.2 3.9Other 92.1 56.7 35.3 27.8 29.0 25.9No special reason 52.4 33.1 19.2 15.8 16.9 14.1
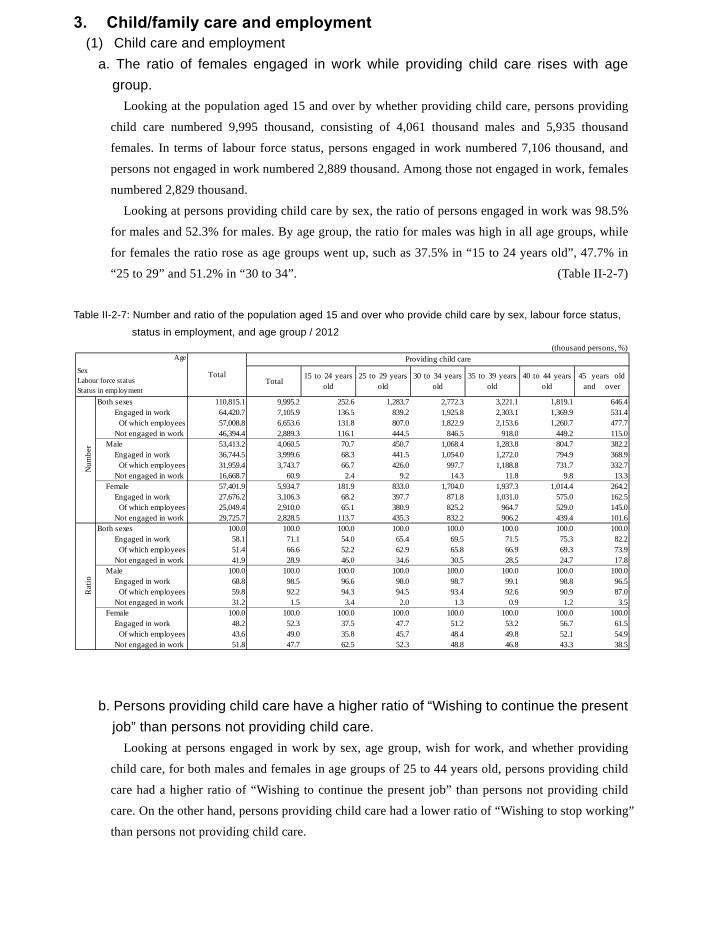
186
3. Child/family care and employment (1) Child care and employment
a. The ratio of females engaged in work while providing child care rises with age group.
Looking at the population aged 15 and over by whether providing child care, persons providing
child care numbered 9,995 thousand, consisting of 4,061 thousand males and 5,935 thousand
females. In terms of labour force status, persons engaged in work numbered 7,106 thousand, and
persons not engaged in work numbered 2,889 thousand. Among those not engaged in work, females
numbered 2,829 thousand.
Looking at persons providing child care by sex, the ratio of persons engaged in work was 98.5%
for males and 52.3% for males. By age group, the ratio for males was high in all age groups, while
for females the ratio rose as age groups went up, such as 37.5% in “15 to 24 years old”, 47.7% in
“25 to 29” and 51.2% in “30 to 34”. (Table II-2-7)
Table II-2-7: Number and ratio of the population aged 15 and over who provide child care by sex, labour force status,
status in employment, and age group / 2012
b. Persons providing child care have a higher ratio of “Wishing to continue the present
job” than persons not providing child care. Looking at persons engaged in work by sex, age group, wish for work, and whether providing
child care, for both males and females in age groups of 25 to 44 years old, persons providing child
care had a higher ratio of “Wishing to continue the present job” than persons not providing child
care. On the other hand, persons providing child care had a lower ratio of “Wishing to stop working”
than persons not providing child care.
(thousand persons, %)Age
Total15 to 24 years
old25 to 29 years
old30 to 34 years
old35 to 39 years
old40 to 44 years
old45 years old
and over
Both sexes 110,815.1 9,995.2 252.6 1,283.7 2,772.3 3,221.1 1,819.1 646.4 Engaged in work 64,420.7 7,105.9 136.5 839.2 1,925.8 2,303.1 1,369.9 531.4 Of which employees 57,008.8 6,653.6 131.8 807.0 1,822.9 2,153.6 1,260.7 477.7
Not engaged in work 46,394.4 2,889.3 116.1 444.5 846.5 918.0 449.2 115.0 Male 53,413.2 4,060.5 70.7 450.7 1,068.4 1,283.8 804.7 382.2 Engaged in work 36,744.5 3,999.6 68.3 441.5 1,054.0 1,272.0 794.9 368.9 Of which employees 31,959.4 3,743.7 66.7 426.0 997.7 1,188.8 731.7 332.7
Not engaged in work 16,668.7 60.9 2.4 9.2 14.3 11.8 9.8 13.3 Female 57,401.9 5,934.7 181.9 833.0 1,704.0 1,937.3 1,014.4 264.2 Engaged in work 27,676.2 3,106.3 68.2 397.7 871.8 1,031.0 575.0 162.5 Of which employees 25,049.4 2,910.0 65.1 380.9 825.2 964.7 529.0 145.0
Not engaged in work 29,725.7 2,828.5 113.7 435.3 832.2 906.2 439.4 101.6Both sexes 100.0 100.0 100.0 100.0 100.0 100.0 100.0 100.0 Engaged in work 58.1 71.1 54.0 65.4 69.5 71.5 75.3 82.2 Of which employees 51.4 66.6 52.2 62.9 65.8 66.9 69.3 73.9
Not engaged in work 41.9 28.9 46.0 34.6 30.5 28.5 24.7 17.8 Male 100.0 100.0 100.0 100.0 100.0 100.0 100.0 100.0 Engaged in work 68.8 98.5 96.6 98.0 98.7 99.1 98.8 96.5 Of which employees 59.8 92.2 94.3 94.5 93.4 92.6 90.9 87.0
Not engaged in work 31.2 1.5 3.4 2.0 1.3 0.9 1.2 3.5 Female 100.0 100.0 100.0 100.0 100.0 100.0 100.0 100.0 Engaged in work 48.2 52.3 37.5 47.7 51.2 53.2 56.7 61.5 Of which employees 43.6 49.0 35.8 45.7 48.4 49.8 52.1 54.9
Not engaged in work 51.8 47.7 62.5 52.3 48.8 46.8 43.3 38.5
Rat
io
Total
Providing child careSexLabour force statusStatus in employment
Num
ber
Looking at persons not engaged in work by sex, age group, whether wishing to work, and
whether seeking a job, for males in age groups of 25 to 44 years old, persons providing child care
had a higher ratio of “Wishing to work” and “Seeking a job” than persons not providing child care.
Conversely, for females, persons providing child care in the age groups of “25 to 29”, “30 to 34”
and “35 to 39” had a lower ratio of “Wishing to work” than persons not providing child care.
For females “Seeking a job” in the age groups of “25 to 44”, the ratio of persons providing child
care was lower than that of persons not providing child care. (Table II-2-8)
Table II-2-8: Number and ratio of the population aged 15 and over by sex, labour force status, wish for work, whether
wishing to work, whether seeking a job, whether providing child care, and age group / 2012
(thousand persons, %)
25 to 29 yearsold
30 to 34 yearsold
35 to 39 yearsold
40 to 44 yearsold
25 to 29 yearsold
30 to 34 yearsold
35 to 39 yearsold
40 to 44 yearsold
Male 4,060.5 450.7 1,068.4 1,283.8 804.7 48,515.7 3,070.5 2,839.6 3,418.3 3,908.3 Engaged in work 3,999.6 441.5 1,054.0 1,272.0 794.9 32,301.8 2,676.8 2,555.6 3,129.0 3,605.3 (Wish for work) Wishing to continue the present job 3,274.5 328.2 840.5 1,063.2 678.9 25,982.5 1,911.2 1,906.8 2,485.1 2,965.9 Wishing to have an additional job 241.9 34.2 68.5 73.6 41.5 1,745.6 211.3 202.5 205.8 204.7 Wishing to switch to another job 434.8 74.4 130.9 124.0 65.5 3,202.7 498.9 399.7 389.3 373.8 Wishing to stop working 37.8 3.9 11.7 8.7 6.9 1,214.5 41.5 33.5 39.0 43.7 Not engaged in work 60.9 9.2 14.3 11.8 9.8 16,213.9 393.6 284.0 289.3 303.0
(whether wishing to work, whetherseeking a job)
Wishing to work 51.3 8.2 12.7 10.4 9.0 3,968.4 276.0 212.7 211.2 218.6 Seeking a job 40.1 6.4 9.1 9.3 7.7 1,983.3 185.0 149.0 137.4 138.6 Not seeking a job 11.0 1.7 3.6 1.1 1.3 1,966.7 89.5 62.8 73.2 79.5 Not wishing to work 9.3 1.1 1.6 1.4 0.8 12,201.7 116.2 70.8 77.1 81.9Female 5,934.7 833.0 1,704.0 1,937.3 1,014.4 50,542.4 2,590.0 2,108.1 2,652.0 3,615.3 Engaged in work 3,106.3 397.7 871.8 1,031.0 575.0 24,270.6 2,183.5 1,728.3 2,049.3 2,701.9 (Wish for work) Wishing to continue the present job 2,396.7 294.7 674.2 807.3 447.0 18,724.6 1,520.9 1,239.3 1,553.4 2,047.6 Wishing to have an additional job 230.2 31.7 61.4 67.6 47.8 1,420.1 173.0 131.5 141.7 197.2 Wishing to switch to another job 410.0 63.6 116.5 133.9 68.1 2,792.4 423.3 304.1 301.4 389.0 Wishing to stop working 64.0 7.6 18.5 21.1 10.6 1,214.5 58.0 45.4 45.2 57.2 Not engaged in work 2,828.5 435.3 832.2 906.2 439.4 26,271.8 406.6 379.7 602.7 913.4
(whether wishing to work, whetherseeking a job)
Wishing to work 1,703.9 264.3 480.1 550.5 271.9 4,971.7 277.7 248.9 372.3 550.1 Seeking a job 445.1 66.2 117.3 136.7 80.3 2,136.4 169.6 135.6 199.0 265.3 Not seeking a job 1,257.6 197.9 362.2 413.4 191.6 2,814.7 107.6 113.3 172.8 282.9 Not wishing to work 1,123.9 171.0 352.0 355.3 167.5 21,228.7 128.5 129.2 228.9 361.6Male 100.0 100.0 100.0 100.0 100.0 100.0 100.0 100.0 100.0 100.0 Engaged in work 98.5 98.0 98.7 99.1 98.8 66.6 87.2 90.0 91.5 92.2 (Wish for work) Wishing to continue the present job 1) (81.9) (74.3) (79.7) (83.6) (85.4) (80.4) (71.4) (74.6) (79.4) (82.3) Wishing to have an additional job 1) (6.0) (7.7) (6.5) (5.8) (5.2) (5.4) (7.9) (7.9) (6.6) (5.7) Wishing to switch to another job 1) (10.9) (16.9) (12.4) (9.7) (8.2) (9.9) (18.6) (15.6) (12.4) (10.4) Wishing to stop working 1) (0.9) (0.9) (1.1) (0.7) (0.9) (3.8) (1.6) (1.3) (1.2) (1.2)
Not engaged in work 1.5 2.0 1.3 0.9 1.2 33.4 12.8 10.0 8.5 7.8(whether wishing to work, whetherseeking a job)
Wishing to work 2) (84.2) (89.1) (88.8) (88.1) (91.8) (24.5) (70.1) (74.9) (73.0) (72.1) Seeking a job 2) (65.8) (69.6) (63.6) (78.8) (78.6) (12.2) (47.0) (52.5) (47.5) (45.7) Not seeking a job 2) (18.1) (18.5) (25.2) (9.3) (13.3) (12.1) (22.7) (22.1) (25.3) (26.2) Not wishing to work 2) (15.3) (12.0) (11.2) (11.9) (8.2) (75.3) (29.5) (24.9) (26.7) (27.0)Female 100.0 100.0 100.0 100.0 100.0 100.0 100.0 100.0 100.0 100.0 Engaged in work 52.3 47.7 51.2 53.2 56.7 48.0 84.3 82.0 77.3 74.7 (Wish for work) Wishing to continue the present job 1) (77.2) (74.1) (77.3) (78.3) (77.7) (77.1) (69.7) (71.7) (75.8) (75.8) Wishing to have an additional job 1) (7.4) (8.0) (7.0) (6.6) (8.3) (5.9) (7.9) (7.6) (6.9) (7.3) Wishing to switch to another job 1) (13.2) (16.0) (13.4) (13.0) (11.8) (11.5) (19.4) (17.6) (14.7) (14.4) Wishing to stop working 1) (2.1) (1.9) (2.1) (2.0) (1.8) (5.0) (2.7) (2.6) (2.2) (2.1)
Not engaged in work 47.7 52.3 48.8 46.8 43.3 52.0 15.7 18.0 22.7 25.3(whether wishing to work, whetherseeking a job)
Wishing to work 2) (60.2) (60.7) (57.7) (60.7) (61.9) (18.9) (68.3) (65.6) (61.8) (60.2) Seeking a job 2) (15.7) (15.2) (14.1) (15.1) (18.3) (8.1) (41.7) (35.7) (33.0) (29.0) Not seeking a job 2) (44.5) (45.5) (43.5) (45.6) (43.6) (10.7) (26.5) (29.8) (28.7) (31.0) Not wishing to work 2) (39.7) (39.3) (42.3) (39.2) (38.1) (80.8) (31.6) (34.0) (38.0) (39.6)
1) Percentage in all persons "Engaged in work" 2) Percentage in all persons "Not engaged in work"
Num
ber
Rat
io
Whether providing child careAge Providing child care Not providing child care
SexLabour force statusWish for workWhether wishing to work, whether seeking a job
Total Total
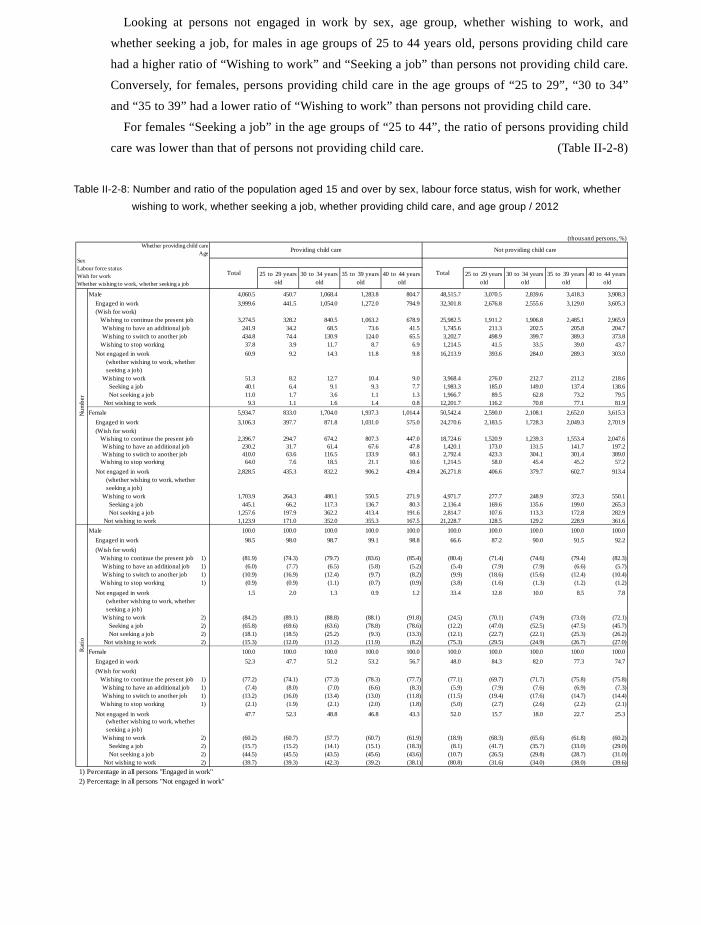
187
3. Child/family care and employment (1) Child care and employment
a. The ratio of females engaged in work while providing child care rises with age group.
Looking at the population aged 15 and over by whether providing child care, persons providing
child care numbered 9,995 thousand, consisting of 4,061 thousand males and 5,935 thousand
females. In terms of labour force status, persons engaged in work numbered 7,106 thousand, and
persons not engaged in work numbered 2,889 thousand. Among those not engaged in work, females
numbered 2,829 thousand.
Looking at persons providing child care by sex, the ratio of persons engaged in work was 98.5%
for males and 52.3% for males. By age group, the ratio for males was high in all age groups, while
for females the ratio rose as age groups went up, such as 37.5% in “15 to 24 years old”, 47.7% in
“25 to 29” and 51.2% in “30 to 34”. (Table II-2-7)
Table II-2-7: Number and ratio of the population aged 15 and over who provide child care by sex, labour force status,
status in employment, and age group / 2012
b. Persons providing child care have a higher ratio of “Wishing to continue the present
job” than persons not providing child care. Looking at persons engaged in work by sex, age group, wish for work, and whether providing
child care, for both males and females in age groups of 25 to 44 years old, persons providing child
care had a higher ratio of “Wishing to continue the present job” than persons not providing child
care. On the other hand, persons providing child care had a lower ratio of “Wishing to stop working”
than persons not providing child care.
(thousand persons, %)Age
Total15 to 24 years
old25 to 29 years
old30 to 34 years
old35 to 39 years
old40 to 44 years
old45 years old
and over
Both sexes 110,815.1 9,995.2 252.6 1,283.7 2,772.3 3,221.1 1,819.1 646.4 Engaged in work 64,420.7 7,105.9 136.5 839.2 1,925.8 2,303.1 1,369.9 531.4 Of which employees 57,008.8 6,653.6 131.8 807.0 1,822.9 2,153.6 1,260.7 477.7
Not engaged in work 46,394.4 2,889.3 116.1 444.5 846.5 918.0 449.2 115.0 Male 53,413.2 4,060.5 70.7 450.7 1,068.4 1,283.8 804.7 382.2 Engaged in work 36,744.5 3,999.6 68.3 441.5 1,054.0 1,272.0 794.9 368.9 Of which employees 31,959.4 3,743.7 66.7 426.0 997.7 1,188.8 731.7 332.7
Not engaged in work 16,668.7 60.9 2.4 9.2 14.3 11.8 9.8 13.3 Female 57,401.9 5,934.7 181.9 833.0 1,704.0 1,937.3 1,014.4 264.2 Engaged in work 27,676.2 3,106.3 68.2 397.7 871.8 1,031.0 575.0 162.5 Of which employees 25,049.4 2,910.0 65.1 380.9 825.2 964.7 529.0 145.0
Not engaged in work 29,725.7 2,828.5 113.7 435.3 832.2 906.2 439.4 101.6Both sexes 100.0 100.0 100.0 100.0 100.0 100.0 100.0 100.0 Engaged in work 58.1 71.1 54.0 65.4 69.5 71.5 75.3 82.2 Of which employees 51.4 66.6 52.2 62.9 65.8 66.9 69.3 73.9
Not engaged in work 41.9 28.9 46.0 34.6 30.5 28.5 24.7 17.8 Male 100.0 100.0 100.0 100.0 100.0 100.0 100.0 100.0 Engaged in work 68.8 98.5 96.6 98.0 98.7 99.1 98.8 96.5 Of which employees 59.8 92.2 94.3 94.5 93.4 92.6 90.9 87.0
Not engaged in work 31.2 1.5 3.4 2.0 1.3 0.9 1.2 3.5 Female 100.0 100.0 100.0 100.0 100.0 100.0 100.0 100.0 Engaged in work 48.2 52.3 37.5 47.7 51.2 53.2 56.7 61.5 Of which employees 43.6 49.0 35.8 45.7 48.4 49.8 52.1 54.9
Not engaged in work 51.8 47.7 62.5 52.3 48.8 46.8 43.3 38.5
Rat
io
Total
Providing child careSexLabour force statusStatus in employment
Num
ber
Looking at persons not engaged in work by sex, age group, whether wishing to work, and
whether seeking a job, for males in age groups of 25 to 44 years old, persons providing child care
had a higher ratio of “Wishing to work” and “Seeking a job” than persons not providing child care.
Conversely, for females, persons providing child care in the age groups of “25 to 29”, “30 to 34”
and “35 to 39” had a lower ratio of “Wishing to work” than persons not providing child care.
For females “Seeking a job” in the age groups of “25 to 44”, the ratio of persons providing child
care was lower than that of persons not providing child care. (Table II-2-8)
Table II-2-8: Number and ratio of the population aged 15 and over by sex, labour force status, wish for work, whether
wishing to work, whether seeking a job, whether providing child care, and age group / 2012
(thousand persons, %)
25 to 29 yearsold
30 to 34 yearsold
35 to 39 yearsold
40 to 44 yearsold
25 to 29 yearsold
30 to 34 yearsold
35 to 39 yearsold
40 to 44 yearsold
Male 4,060.5 450.7 1,068.4 1,283.8 804.7 48,515.7 3,070.5 2,839.6 3,418.3 3,908.3 Engaged in work 3,999.6 441.5 1,054.0 1,272.0 794.9 32,301.8 2,676.8 2,555.6 3,129.0 3,605.3 (Wish for work) Wishing to continue the present job 3,274.5 328.2 840.5 1,063.2 678.9 25,982.5 1,911.2 1,906.8 2,485.1 2,965.9 Wishing to have an additional job 241.9 34.2 68.5 73.6 41.5 1,745.6 211.3 202.5 205.8 204.7 Wishing to switch to another job 434.8 74.4 130.9 124.0 65.5 3,202.7 498.9 399.7 389.3 373.8 Wishing to stop working 37.8 3.9 11.7 8.7 6.9 1,214.5 41.5 33.5 39.0 43.7 Not engaged in work 60.9 9.2 14.3 11.8 9.8 16,213.9 393.6 284.0 289.3 303.0
(whether wishing to work, whetherseeking a job)
Wishing to work 51.3 8.2 12.7 10.4 9.0 3,968.4 276.0 212.7 211.2 218.6 Seeking a job 40.1 6.4 9.1 9.3 7.7 1,983.3 185.0 149.0 137.4 138.6 Not seeking a job 11.0 1.7 3.6 1.1 1.3 1,966.7 89.5 62.8 73.2 79.5 Not wishing to work 9.3 1.1 1.6 1.4 0.8 12,201.7 116.2 70.8 77.1 81.9Female 5,934.7 833.0 1,704.0 1,937.3 1,014.4 50,542.4 2,590.0 2,108.1 2,652.0 3,615.3 Engaged in work 3,106.3 397.7 871.8 1,031.0 575.0 24,270.6 2,183.5 1,728.3 2,049.3 2,701.9 (Wish for work) Wishing to continue the present job 2,396.7 294.7 674.2 807.3 447.0 18,724.6 1,520.9 1,239.3 1,553.4 2,047.6 Wishing to have an additional job 230.2 31.7 61.4 67.6 47.8 1,420.1 173.0 131.5 141.7 197.2 Wishing to switch to another job 410.0 63.6 116.5 133.9 68.1 2,792.4 423.3 304.1 301.4 389.0 Wishing to stop working 64.0 7.6 18.5 21.1 10.6 1,214.5 58.0 45.4 45.2 57.2 Not engaged in work 2,828.5 435.3 832.2 906.2 439.4 26,271.8 406.6 379.7 602.7 913.4
(whether wishing to work, whetherseeking a job)
Wishing to work 1,703.9 264.3 480.1 550.5 271.9 4,971.7 277.7 248.9 372.3 550.1 Seeking a job 445.1 66.2 117.3 136.7 80.3 2,136.4 169.6 135.6 199.0 265.3 Not seeking a job 1,257.6 197.9 362.2 413.4 191.6 2,814.7 107.6 113.3 172.8 282.9 Not wishing to work 1,123.9 171.0 352.0 355.3 167.5 21,228.7 128.5 129.2 228.9 361.6Male 100.0 100.0 100.0 100.0 100.0 100.0 100.0 100.0 100.0 100.0 Engaged in work 98.5 98.0 98.7 99.1 98.8 66.6 87.2 90.0 91.5 92.2 (Wish for work) Wishing to continue the present job 1) (81.9) (74.3) (79.7) (83.6) (85.4) (80.4) (71.4) (74.6) (79.4) (82.3) Wishing to have an additional job 1) (6.0) (7.7) (6.5) (5.8) (5.2) (5.4) (7.9) (7.9) (6.6) (5.7) Wishing to switch to another job 1) (10.9) (16.9) (12.4) (9.7) (8.2) (9.9) (18.6) (15.6) (12.4) (10.4) Wishing to stop working 1) (0.9) (0.9) (1.1) (0.7) (0.9) (3.8) (1.6) (1.3) (1.2) (1.2)
Not engaged in work 1.5 2.0 1.3 0.9 1.2 33.4 12.8 10.0 8.5 7.8(whether wishing to work, whetherseeking a job)
Wishing to work 2) (84.2) (89.1) (88.8) (88.1) (91.8) (24.5) (70.1) (74.9) (73.0) (72.1) Seeking a job 2) (65.8) (69.6) (63.6) (78.8) (78.6) (12.2) (47.0) (52.5) (47.5) (45.7) Not seeking a job 2) (18.1) (18.5) (25.2) (9.3) (13.3) (12.1) (22.7) (22.1) (25.3) (26.2) Not wishing to work 2) (15.3) (12.0) (11.2) (11.9) (8.2) (75.3) (29.5) (24.9) (26.7) (27.0)Female 100.0 100.0 100.0 100.0 100.0 100.0 100.0 100.0 100.0 100.0 Engaged in work 52.3 47.7 51.2 53.2 56.7 48.0 84.3 82.0 77.3 74.7 (Wish for work) Wishing to continue the present job 1) (77.2) (74.1) (77.3) (78.3) (77.7) (77.1) (69.7) (71.7) (75.8) (75.8) Wishing to have an additional job 1) (7.4) (8.0) (7.0) (6.6) (8.3) (5.9) (7.9) (7.6) (6.9) (7.3) Wishing to switch to another job 1) (13.2) (16.0) (13.4) (13.0) (11.8) (11.5) (19.4) (17.6) (14.7) (14.4) Wishing to stop working 1) (2.1) (1.9) (2.1) (2.0) (1.8) (5.0) (2.7) (2.6) (2.2) (2.1)
Not engaged in work 47.7 52.3 48.8 46.8 43.3 52.0 15.7 18.0 22.7 25.3(whether wishing to work, whetherseeking a job)
Wishing to work 2) (60.2) (60.7) (57.7) (60.7) (61.9) (18.9) (68.3) (65.6) (61.8) (60.2) Seeking a job 2) (15.7) (15.2) (14.1) (15.1) (18.3) (8.1) (41.7) (35.7) (33.0) (29.0) Not seeking a job 2) (44.5) (45.5) (43.5) (45.6) (43.6) (10.7) (26.5) (29.8) (28.7) (31.0) Not wishing to work 2) (39.7) (39.3) (42.3) (39.2) (38.1) (80.8) (31.6) (34.0) (38.0) (39.6)
1) Percentage in all persons "Engaged in work" 2) Percentage in all persons "Not engaged in work"
Num
ber
Rat
io
Whether providing child careAge Providing child care Not providing child care
SexLabour force statusWish for workWhether wishing to work, whether seeking a job
Total Total
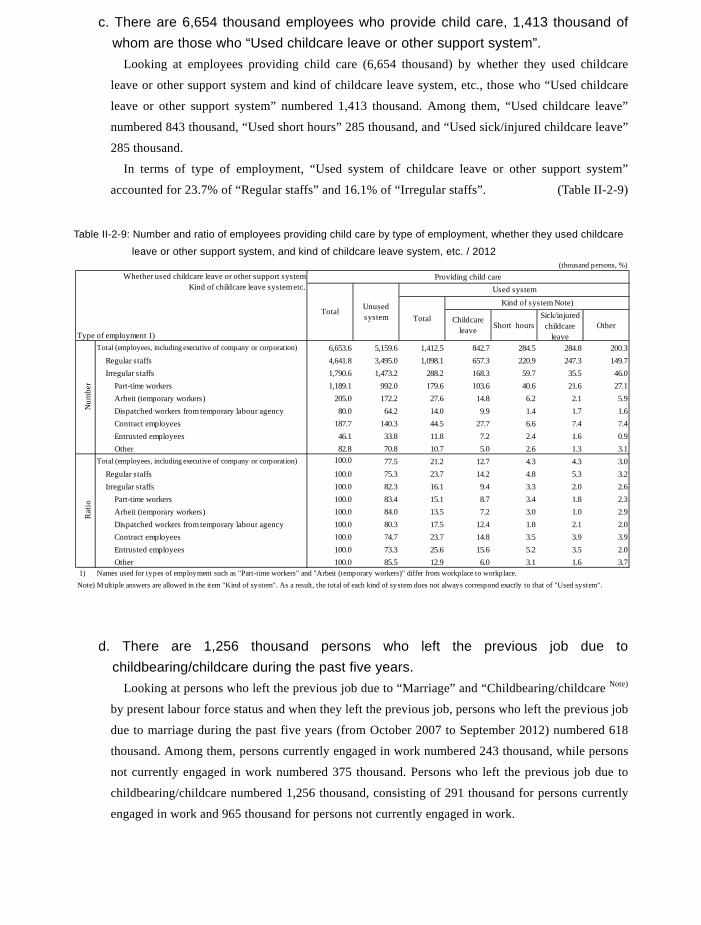
188
c. There are 6,654 thousand employees who provide child care, 1,413 thousand of whom are those who “Used childcare leave or other support system”.
Looking at employees providing child care (6,654 thousand) by whether they used childcare
leave or other support system and kind of childcare leave system, etc., those who “Used childcare
leave or other support system” numbered 1,413 thousand. Among them, “Used childcare leave”
numbered 843 thousand, “Used short hours” 285 thousand, and “Used sick/injured childcare leave”
285 thousand.
In terms of type of employment, “Used system of childcare leave or other support system”
accounted for 23.7% of “Regular staffs” and 16.1% of “Irregular staffs”. (Table II-2-9)
Table II-2-9: Number and ratio of employees providing child care by type of employment, whether they used childcare
leave or other support system, and kind of childcare leave system, etc. / 2012
d. There are 1,256 thousand persons who left the previous job due to childbearing/childcare during the past five years.
Looking at persons who left the previous job due to “Marriage” and “Childbearing/childcare Note)
by present labour force status and when they left the previous job, persons who left the previous job
due to marriage during the past five years (from October 2007 to September 2012) numbered 618
thousand. Among them, persons currently engaged in work numbered 243 thousand, while persons
not currently engaged in work numbered 375 thousand. Persons who left the previous job due to
childbearing/childcare numbered 1,256 thousand, consisting of 291 thousand for persons currently
engaged in work and 965 thousand for persons not currently engaged in work.
(thousand persons, %)
Type of employment 1)
Childcareleave Short hours
Sick/injuredchildcare
leaveOther
Total (employees, including executive of company or corporation) 6,653.6 5,159.6 1,412.5 842.7 284.5 284.8 200.3 Regular staffs 4,641.8 3,495.0 1,098.1 657.3 220.9 247.3 149.7 Irregular staffs 1,790.6 1,473.2 288.2 168.3 59.7 35.5 46.0 Part-time workers 1,189.1 992.0 179.6 103.6 40.6 21.6 27.1 Arbeit (temporary workers) 205.0 172.2 27.6 14.8 6.2 2.1 5.9 Dispatched workers from temporary labour agency 80.0 64.2 14.0 9.9 1.4 1.7 1.6 Contract employees 187.7 140.3 44.5 27.7 6.6 7.4 7.4 Entrusted employees 46.1 33.8 11.8 7.2 2.4 1.6 0.9 Other 82.8 70.8 10.7 5.0 2.6 1.3 3.1Total (employees, including executive of company or corporation) 100.0 77.5 21.2 12.7 4.3 4.3 3.0 Regular staffs 100.0 75.3 23.7 14.2 4.8 5.3 3.2 Irregular staffs 100.0 82.3 16.1 9.4 3.3 2.0 2.6 Part-time workers 100.0 83.4 15.1 8.7 3.4 1.8 2.3 Arbeit (temporary workers) 100.0 84.0 13.5 7.2 3.0 1.0 2.9 Dispatched workers from temporary labour agency 100.0 80.3 17.5 12.4 1.8 2.1 2.0 Contract employees 100.0 74.7 23.7 14.8 3.5 3.9 3.9 Entrusted employees 100.0 73.3 25.6 15.6 5.2 3.5 2.0 Other 100.0 85.5 12.9 6.0 3.1 1.6 3.7
1) Names used for types of employment such as "Part-time workers" and "Arbeit (temporary workers)" differ from workplace to workplace.Note) Multiple answers are allowed in the item "Kind of system". As a result, the total of each kind of system does not always correspond exactly to that of "Used system".
Num
ber
Rat
io
Whether used childcare leave or other support systemKind of childcare leave system etc.
Providing child care
Total Unusedsystem
Used system
Total
Kind of system Note)
Looking at trends in each five years (from October 1997 to September 2002, from October 2002
to September 2007, and October 2007 to September 2012), persons who left the previous job due to
marriage have been decreasing in number, while persons who left the previous job due to
childbearing/childcare have been increasing.
Persons who left the previous job due to marriage in the past year (from October 2011 to
September 2012) numbered 124 thousand, and persons who left the previous job due to
childbearing/childcare numbered 260 thousand. (Table II-2-10, Fig.II-2-8/9)
Note) “Childcare” as a reason for leaving the previous job given in surveys before 2007 has been changed to “Childbearing/childcare” in the survey of 2012.
Table II-2-10: Population aged 15 and over who left the previous job due to marriage or childbearing/childcare by sex,
present labour force status, and when left the previous job / 2002-2012
Fig.II-2-8: Trends in the population aged 15 and over who left the previous job by reason for leaving the previous job
/ 2002-2012
(Persons who left the previous job due to marriage)
(thousand persons)When left the previous job Oct. 2002 to
Sept. 2007Oct. 1997 toSept. 2002
Total Oct. 2011 toSept. 2012
Oct. 2010 toSept. 2011
Oct. 2009 toSept. 2010
Oct. 2008 toSept. 2009
Oct. 2007 toSept. 2008
Both sexes 617.8 123.7 105.1 118.3 119.1 126.4 813.0 1,079.2 Engaged in work 242.8 38.2 46.5 52.6 45.5 48.5 241.6 294.3 Not engaged in work 375.0 85.5 58.5 65.7 73.7 77.9 571.4 784.9Male 37.9 8.6 6.8 8.4 5.2 7.6 26.7 32.6 Engaged in work 34.9 7.3 6.7 8.1 5.0 6.5 25.6 30.5 Not engaged in work 3.0 1.4 0.1 0.3 0.2 1.0 1.1 2.0Female 579.9 115.1 98.3 109.9 113.9 118.9 786.3 1,046.6 Engaged in work 207.9 30.9 39.8 44.5 40.5 42.0 215.9 263.8 Not engaged in work 371.9 84.1 58.5 65.4 73.4 76.9 570.3 782.8Both sexes 1,255.7 259.9 244.9 241.0 229.0 232.6 1,183.5 1,181.3 Engaged in work 290.5 22.8 42.3 59.1 68.9 89.2 242.2 211.3 Not engaged in work 965.2 237.1 202.7 181.9 160.1 143.4 941.3 970.1Male 10.2 1.8 1.1 3.2 1.6 1.8 7.6 5.1 Engaged in work 7.1 1.2 0.7 2.2 0.9 1.8 5.7 3.7 Not engaged in work 3.1 0.6 0.4 1.1 0.7 0.1 1.9 1.3Female 1,245.5 258.1 243.9 237.8 227.4 230.8 1,175.9 1,176.3 Engaged in work 283.4 21.6 41.6 56.9 68.0 87.4 236.6 207.5 Not engaged in work 962.1 236.5 202.3 180.9 159.4 143.3 939.3 968.8
Oct. 2007 to Sept. 2012
SexPresent labour force status
Pers
ons w
ho le
ft th
e pr
evio
usjo
b du
e to
mar
riage
Per
sons
who
left
the
prev
ious
job
due
toch
ildbe
arin
g/ch
ildca
re375.0
571.4784.9
242.8
241.6
294.3
0
200
400
600
800
1,000
1,200
1,400
Engaged in work
Not engaged in work
(thousand persons)
1079.2
813.0
617.8
Oct. 1997 to Sept. 2002
Oct. 2002 to Sept. 2007
Oct. 2007 to Sept. 2012
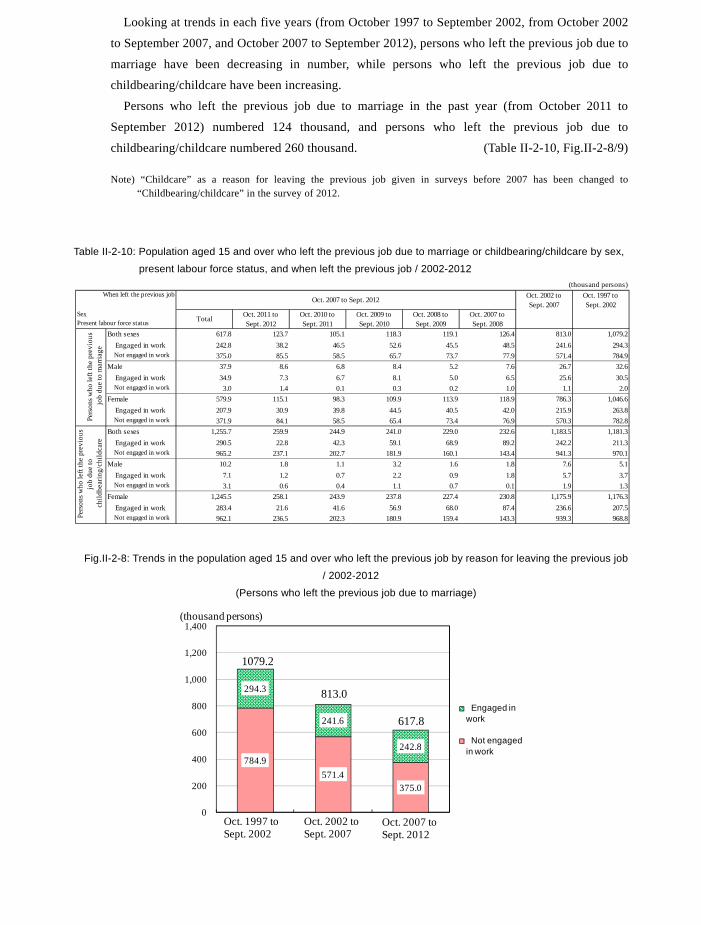
189
c. There are 6,654 thousand employees who provide child care, 1,413 thousand of whom are those who “Used childcare leave or other support system”.
Looking at employees providing child care (6,654 thousand) by whether they used childcare
leave or other support system and kind of childcare leave system, etc., those who “Used childcare
leave or other support system” numbered 1,413 thousand. Among them, “Used childcare leave”
numbered 843 thousand, “Used short hours” 285 thousand, and “Used sick/injured childcare leave”
285 thousand.
In terms of type of employment, “Used system of childcare leave or other support system”
accounted for 23.7% of “Regular staffs” and 16.1% of “Irregular staffs”. (Table II-2-9)
Table II-2-9: Number and ratio of employees providing child care by type of employment, whether they used childcare
leave or other support system, and kind of childcare leave system, etc. / 2012
d. There are 1,256 thousand persons who left the previous job due to childbearing/childcare during the past five years.
Looking at persons who left the previous job due to “Marriage” and “Childbearing/childcare Note)
by present labour force status and when they left the previous job, persons who left the previous job
due to marriage during the past five years (from October 2007 to September 2012) numbered 618
thousand. Among them, persons currently engaged in work numbered 243 thousand, while persons
not currently engaged in work numbered 375 thousand. Persons who left the previous job due to
childbearing/childcare numbered 1,256 thousand, consisting of 291 thousand for persons currently
engaged in work and 965 thousand for persons not currently engaged in work.
(thousand persons, %)
Type of employment 1)
Childcareleave Short hours
Sick/injuredchildcare
leaveOther
Total (employees, including executive of company or corporation) 6,653.6 5,159.6 1,412.5 842.7 284.5 284.8 200.3 Regular staffs 4,641.8 3,495.0 1,098.1 657.3 220.9 247.3 149.7 Irregular staffs 1,790.6 1,473.2 288.2 168.3 59.7 35.5 46.0 Part-time workers 1,189.1 992.0 179.6 103.6 40.6 21.6 27.1 Arbeit (temporary workers) 205.0 172.2 27.6 14.8 6.2 2.1 5.9 Dispatched workers from temporary labour agency 80.0 64.2 14.0 9.9 1.4 1.7 1.6 Contract employees 187.7 140.3 44.5 27.7 6.6 7.4 7.4 Entrusted employees 46.1 33.8 11.8 7.2 2.4 1.6 0.9 Other 82.8 70.8 10.7 5.0 2.6 1.3 3.1Total (employees, including executive of company or corporation) 100.0 77.5 21.2 12.7 4.3 4.3 3.0 Regular staffs 100.0 75.3 23.7 14.2 4.8 5.3 3.2 Irregular staffs 100.0 82.3 16.1 9.4 3.3 2.0 2.6 Part-time workers 100.0 83.4 15.1 8.7 3.4 1.8 2.3 Arbeit (temporary workers) 100.0 84.0 13.5 7.2 3.0 1.0 2.9 Dispatched workers from temporary labour agency 100.0 80.3 17.5 12.4 1.8 2.1 2.0 Contract employees 100.0 74.7 23.7 14.8 3.5 3.9 3.9 Entrusted employees 100.0 73.3 25.6 15.6 5.2 3.5 2.0 Other 100.0 85.5 12.9 6.0 3.1 1.6 3.7
1) Names used for types of employment such as "Part-time workers" and "Arbeit (temporary workers)" differ from workplace to workplace.Note) Multiple answers are allowed in the item "Kind of system". As a result, the total of each kind of system does not always correspond exactly to that of "Used system".
Num
ber
Rat
io
Whether used childcare leave or other support systemKind of childcare leave system etc.
Providing child care
Total Unusedsystem
Used system
Total
Kind of system Note)
Looking at trends in each five years (from October 1997 to September 2002, from October 2002
to September 2007, and October 2007 to September 2012), persons who left the previous job due to
marriage have been decreasing in number, while persons who left the previous job due to
childbearing/childcare have been increasing.
Persons who left the previous job due to marriage in the past year (from October 2011 to
September 2012) numbered 124 thousand, and persons who left the previous job due to
childbearing/childcare numbered 260 thousand. (Table II-2-10, Fig.II-2-8/9)
Note) “Childcare” as a reason for leaving the previous job given in surveys before 2007 has been changed to “Childbearing/childcare” in the survey of 2012.
Table II-2-10: Population aged 15 and over who left the previous job due to marriage or childbearing/childcare by sex,
present labour force status, and when left the previous job / 2002-2012
Fig.II-2-8: Trends in the population aged 15 and over who left the previous job by reason for leaving the previous job
/ 2002-2012
(Persons who left the previous job due to marriage)
(thousand persons)When left the previous job Oct. 2002 to
Sept. 2007Oct. 1997 toSept. 2002
Total Oct. 2011 toSept. 2012
Oct. 2010 toSept. 2011
Oct. 2009 toSept. 2010
Oct. 2008 toSept. 2009
Oct. 2007 toSept. 2008
Both sexes 617.8 123.7 105.1 118.3 119.1 126.4 813.0 1,079.2 Engaged in work 242.8 38.2 46.5 52.6 45.5 48.5 241.6 294.3 Not engaged in work 375.0 85.5 58.5 65.7 73.7 77.9 571.4 784.9Male 37.9 8.6 6.8 8.4 5.2 7.6 26.7 32.6 Engaged in work 34.9 7.3 6.7 8.1 5.0 6.5 25.6 30.5 Not engaged in work 3.0 1.4 0.1 0.3 0.2 1.0 1.1 2.0Female 579.9 115.1 98.3 109.9 113.9 118.9 786.3 1,046.6 Engaged in work 207.9 30.9 39.8 44.5 40.5 42.0 215.9 263.8 Not engaged in work 371.9 84.1 58.5 65.4 73.4 76.9 570.3 782.8Both sexes 1,255.7 259.9 244.9 241.0 229.0 232.6 1,183.5 1,181.3 Engaged in work 290.5 22.8 42.3 59.1 68.9 89.2 242.2 211.3 Not engaged in work 965.2 237.1 202.7 181.9 160.1 143.4 941.3 970.1Male 10.2 1.8 1.1 3.2 1.6 1.8 7.6 5.1 Engaged in work 7.1 1.2 0.7 2.2 0.9 1.8 5.7 3.7 Not engaged in work 3.1 0.6 0.4 1.1 0.7 0.1 1.9 1.3Female 1,245.5 258.1 243.9 237.8 227.4 230.8 1,175.9 1,176.3 Engaged in work 283.4 21.6 41.6 56.9 68.0 87.4 236.6 207.5 Not engaged in work 962.1 236.5 202.3 180.9 159.4 143.3 939.3 968.8
Oct. 2007 to Sept. 2012
SexPresent labour force status
Pers
ons w
ho le
ft th
e pr
evio
usjo
b du
e to
mar
riage
Per
sons
who
left
the
prev
ious
job
due
toch
ildbe
arin
g/ch
ildca
re
375.0571.4
784.9242.8
241.6
294.3
0
200
400
600
800
1,000
1,200
1,400
Engaged in work
Not engaged in work
(thousand persons)
1079.2
813.0
617.8
Oct. 1997 to Sept. 2002
Oct. 2002 to Sept. 2007
Oct. 2007 to Sept. 2012
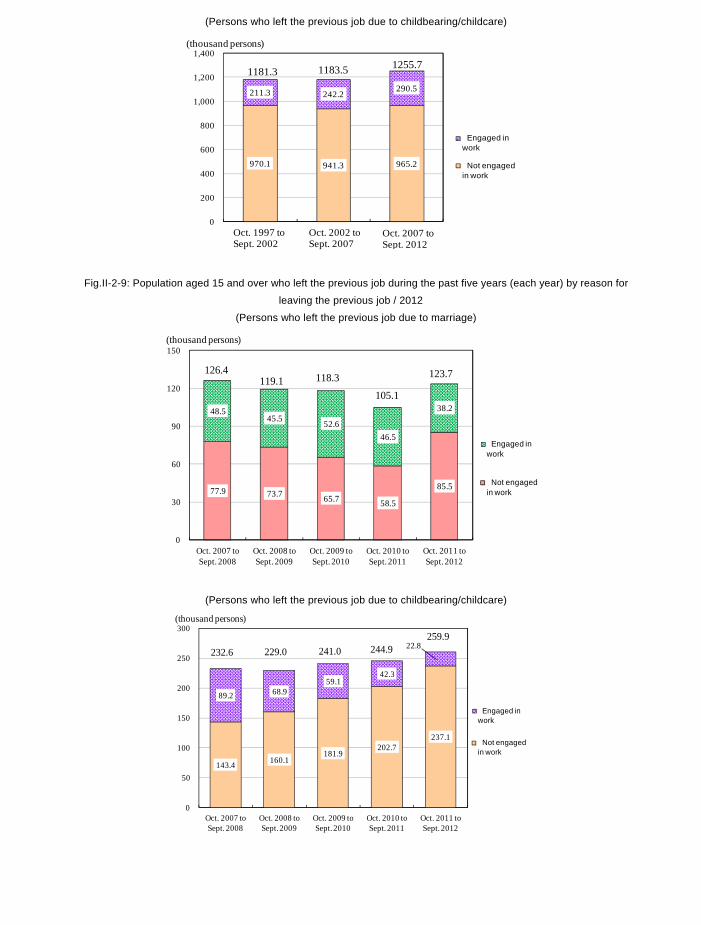
190
(Persons who left the previous job due to childbearing/childcare)
Fig.II-2-9: Population aged 15 and over who left the previous job during the past five years (each year) by reason for
leaving the previous job / 2012
(Persons who left the previous job due to marriage)
(Persons who left the previous job due to childbearing/childcare)
965.2941.3970.1
290.5242.2211.3
0
200
400
600
800
1,000
1,200
1,400
Engaged in work
Not engaged in work
(thousand persons)
1181.3 1183.5 1255.7
Oct. 1997 to Sept. 2002
Oct. 2002 to Sept. 2007
Oct. 2007 to Sept. 2012
85.5
58.565.773.777.9
38.2
46.552.645.5
48.5
0
30
60
90
120
150
Oct. 2011 to Sept. 2012
Oct. 2010 to Sept. 2011
Oct. 2009 to Sept. 2010
Oct. 2008 to Sept. 2009
Oct. 2007 to Sept. 2008
Engaged in work
Not engaged in work
(thousand persons)
126.4119.1 118.3
105.1
123.7
237.1202.7
181.9160.1143.4
22.8
42.359.1
68.989.2
0
50
100
150
200
250
300
Oct. 2011 to Sept. 2012
Oct. 2010 to Sept. 2011
Oct. 2009 to Sept. 2010
Oct. 2008 to Sept. 2009
Oct. 2007 to Sept. 2008
Engaged in work
Not engaged in work
(thousand persons)
232.6 229.0 241.0 244.9259.9
(2) Family care and employment a. About half of persons providing family care are 60 years old and over.
Looking at the population aged 15 and over by sex and whether providing family care, persons
providing family care numbered 5,574 thousand, consisting of 2,006 thousand males and 3,568
thousand females. By age group, “60 to 64 years old” was most numerous with 1,082 thousand, and
those aged 60 and over accounted for about 50% of persons providing family care.
In terms of labour force status, persons engaged in work numbered 1,309 thousand for males and
1,601 thousand for females, while persons not engaged in work numbered 697 thousand for males
and 1,967 thousand for females. (Table II-2-11)
Table II-2-11: Number and ratio of the population aged 15 and over who provide family care by sex, labour force
status, status in employment and age group / 2012
b. For both males and females, persons providing family care have a lower ratio of those engaged in work than persons not providing family care.
Looking at the ratio of persons engaged in work by sex and whether providing family care,
among those providing family care the ratio was 65.3% for males and 44.9% for females, lower
than those not providing family care (69.2% for males and 48.7% for females).
Looking at persons engaged in work by wish for work, for both males and females aged less than
65, persons providing family care had a lower ratio of “Wishing to continue the present job”
compared to persons not providing family care, while they had a higher ratio of “Wishing to have
an additional job” and “Wishing to stop working”.
(thousand persons, %)Age
TotalLess than 40
years old40 to 49 years
old50 to 54 years
old55 to 59 years
old60 to 64 years
old65 to 69 years
old70 years old
and over
Both sexes 110,815.1 5,573.8 505.5 775.8 720.7 929.6 1,081.9 607.3 953.0 Engaged in work 64,420.7 2,910.2 319.8 534.2 515.6 619.7 546.7 213.3 160.9 Of which employees 57,008.8 2,399.3 296.9 481.5 460.3 528.0 417.4 138.3 76.8 Not engaged in work 46,394.4 2,663.5 185.7 241.5 205.0 309.9 535.2 394.1 792.1Male 53,413.2 2,006.3 199.8 247.3 218.1 318.1 414.9 238.4 369.7 Engaged in work 36,744.5 1,309.2 143.3 216.6 197.2 276.0 277.5 113.4 85.1 Of which employees 31,959.4 1,026.9 129.4 191.1 171.9 225.8 203.2 66.9 38.7 Not engaged in work 16,668.7 697.1 56.4 30.7 20.9 42.1 137.4 125.0 284.6Female 57,401.9 3,567.5 305.8 528.5 502.6 611.4 667.0 368.9 583.3 Engaged in work 27,676.2 1,601.0 176.5 317.7 318.4 343.7 269.2 99.8 75.8 Of which employees 25,049.4 1,372.3 167.4 290.4 288.4 302.2 214.2 71.5 38.2 Not engaged in work 29,725.7 1,966.5 129.3 210.8 184.2 267.8 397.8 269.1 507.5Both sexes ‐ 100.0 9.1 13.9 12.9 16.7 19.4 10.9 17.1 Engaged in work ‐ 100.0 11.0 18.4 17.7 21.3 18.8 7.3 5.5 Of which employees ‐ 100.0 12.4 20.1 19.2 22.0 17.4 5.8 3.2 Not engaged in work ‐ 100.0 7.0 9.1 7.7 11.6 20.1 14.8 29.7Male ‐ 100.0 10.0 12.3 10.9 15.9 20.7 11.9 18.4 Engaged in work ‐ 100.0 10.9 16.5 15.1 21.1 21.2 8.7 6.5 Of which employees ‐ 100.0 12.6 18.6 16.7 22.0 19.8 6.5 3.8 Not engaged in work ‐ 100.0 8.1 4.4 3.0 6.0 19.7 17.9 40.8Female ‐ 100.0 8.6 14.8 14.1 17.1 18.7 10.3 16.4 Engaged in work ‐ 100.0 11.0 19.8 19.9 21.5 16.8 6.2 4.7 Of which employees ‐ 100.0 12.2 21.2 21.0 22.0 15.6 5.2 2.8 Not engaged in work ‐ 100.0 6.6 10.7 9.4 13.6 20.2 13.7 25.8
Rat
io
Total
Providing family careSexLabour force statusStatus in employment
Num
ber
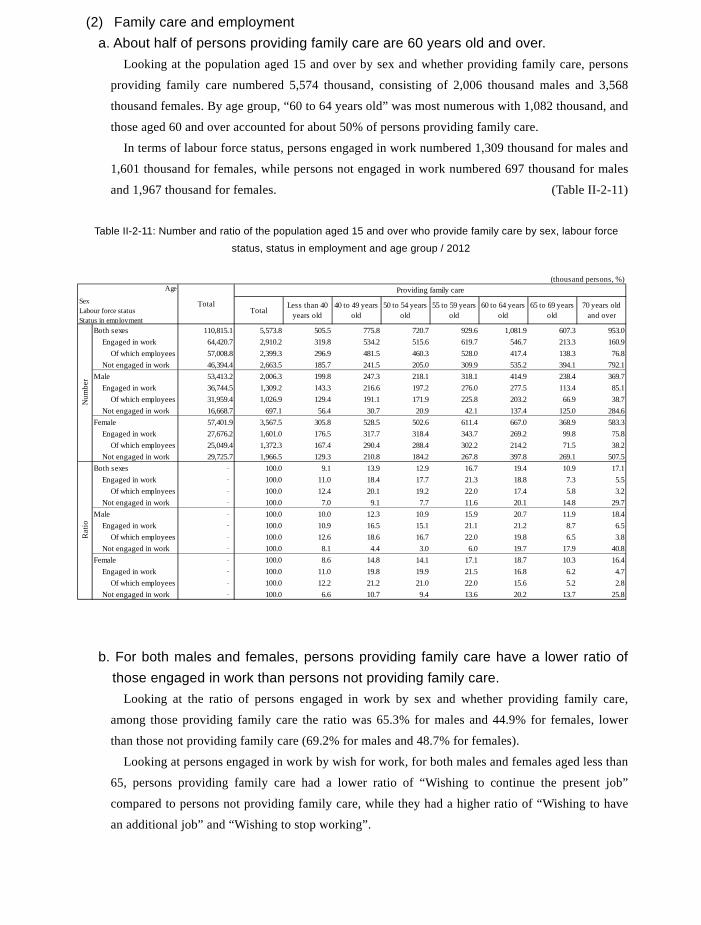
191
(Persons who left the previous job due to childbearing/childcare)
Fig.II-2-9: Population aged 15 and over who left the previous job during the past five years (each year) by reason for
leaving the previous job / 2012
(Persons who left the previous job due to marriage)
(Persons who left the previous job due to childbearing/childcare)
965.2941.3970.1
290.5242.2211.3
0
200
400
600
800
1,000
1,200
1,400
Engaged in work
Not engaged in work
(thousand persons)
1181.3 1183.5 1255.7
Oct. 1997 to Sept. 2002
Oct. 2002 to Sept. 2007
Oct. 2007 to Sept. 2012
85.5
58.565.773.777.9
38.2
46.552.645.5
48.5
0
30
60
90
120
150
Oct. 2011 to Sept. 2012
Oct. 2010 to Sept. 2011
Oct. 2009 to Sept. 2010
Oct. 2008 to Sept. 2009
Oct. 2007 to Sept. 2008
Engaged in work
Not engaged in work
(thousand persons)
126.4119.1 118.3
105.1
123.7
237.1202.7
181.9160.1143.4
22.8
42.359.1
68.989.2
0
50
100
150
200
250
300
Oct. 2011 to Sept. 2012
Oct. 2010 to Sept. 2011
Oct. 2009 to Sept. 2010
Oct. 2008 to Sept. 2009
Oct. 2007 to Sept. 2008
Engaged in work
Not engaged in work
(thousand persons)
232.6 229.0 241.0 244.9259.9
(2) Family care and employment a. About half of persons providing family care are 60 years old and over.
Looking at the population aged 15 and over by sex and whether providing family care, persons
providing family care numbered 5,574 thousand, consisting of 2,006 thousand males and 3,568
thousand females. By age group, “60 to 64 years old” was most numerous with 1,082 thousand, and
those aged 60 and over accounted for about 50% of persons providing family care.
In terms of labour force status, persons engaged in work numbered 1,309 thousand for males and
1,601 thousand for females, while persons not engaged in work numbered 697 thousand for males
and 1,967 thousand for females. (Table II-2-11)
Table II-2-11: Number and ratio of the population aged 15 and over who provide family care by sex, labour force
status, status in employment and age group / 2012
b. For both males and females, persons providing family care have a lower ratio of those engaged in work than persons not providing family care.
Looking at the ratio of persons engaged in work by sex and whether providing family care,
among those providing family care the ratio was 65.3% for males and 44.9% for females, lower
than those not providing family care (69.2% for males and 48.7% for females).
Looking at persons engaged in work by wish for work, for both males and females aged less than
65, persons providing family care had a lower ratio of “Wishing to continue the present job”
compared to persons not providing family care, while they had a higher ratio of “Wishing to have
an additional job” and “Wishing to stop working”.
(thousand persons, %)Age
TotalLess than 40
years old40 to 49 years
old50 to 54 years
old55 to 59 years
old60 to 64 years
old65 to 69 years
old70 years old
and over
Both sexes 110,815.1 5,573.8 505.5 775.8 720.7 929.6 1,081.9 607.3 953.0 Engaged in work 64,420.7 2,910.2 319.8 534.2 515.6 619.7 546.7 213.3 160.9 Of which employees 57,008.8 2,399.3 296.9 481.5 460.3 528.0 417.4 138.3 76.8 Not engaged in work 46,394.4 2,663.5 185.7 241.5 205.0 309.9 535.2 394.1 792.1Male 53,413.2 2,006.3 199.8 247.3 218.1 318.1 414.9 238.4 369.7 Engaged in work 36,744.5 1,309.2 143.3 216.6 197.2 276.0 277.5 113.4 85.1 Of which employees 31,959.4 1,026.9 129.4 191.1 171.9 225.8 203.2 66.9 38.7 Not engaged in work 16,668.7 697.1 56.4 30.7 20.9 42.1 137.4 125.0 284.6Female 57,401.9 3,567.5 305.8 528.5 502.6 611.4 667.0 368.9 583.3 Engaged in work 27,676.2 1,601.0 176.5 317.7 318.4 343.7 269.2 99.8 75.8 Of which employees 25,049.4 1,372.3 167.4 290.4 288.4 302.2 214.2 71.5 38.2 Not engaged in work 29,725.7 1,966.5 129.3 210.8 184.2 267.8 397.8 269.1 507.5Both sexes ‐ 100.0 9.1 13.9 12.9 16.7 19.4 10.9 17.1 Engaged in work ‐ 100.0 11.0 18.4 17.7 21.3 18.8 7.3 5.5 Of which employees ‐ 100.0 12.4 20.1 19.2 22.0 17.4 5.8 3.2 Not engaged in work ‐ 100.0 7.0 9.1 7.7 11.6 20.1 14.8 29.7Male ‐ 100.0 10.0 12.3 10.9 15.9 20.7 11.9 18.4 Engaged in work ‐ 100.0 10.9 16.5 15.1 21.1 21.2 8.7 6.5 Of which employees ‐ 100.0 12.6 18.6 16.7 22.0 19.8 6.5 3.8 Not engaged in work ‐ 100.0 8.1 4.4 3.0 6.0 19.7 17.9 40.8Female ‐ 100.0 8.6 14.8 14.1 17.1 18.7 10.3 16.4 Engaged in work ‐ 100.0 11.0 19.8 19.9 21.5 16.8 6.2 4.7 Of which employees ‐ 100.0 12.2 21.2 21.0 22.0 15.6 5.2 2.8 Not engaged in work ‐ 100.0 6.6 10.7 9.4 13.6 20.2 13.7 25.8
Rat
io
Total
Providing family careSexLabour force statusStatus in employment
Num
ber
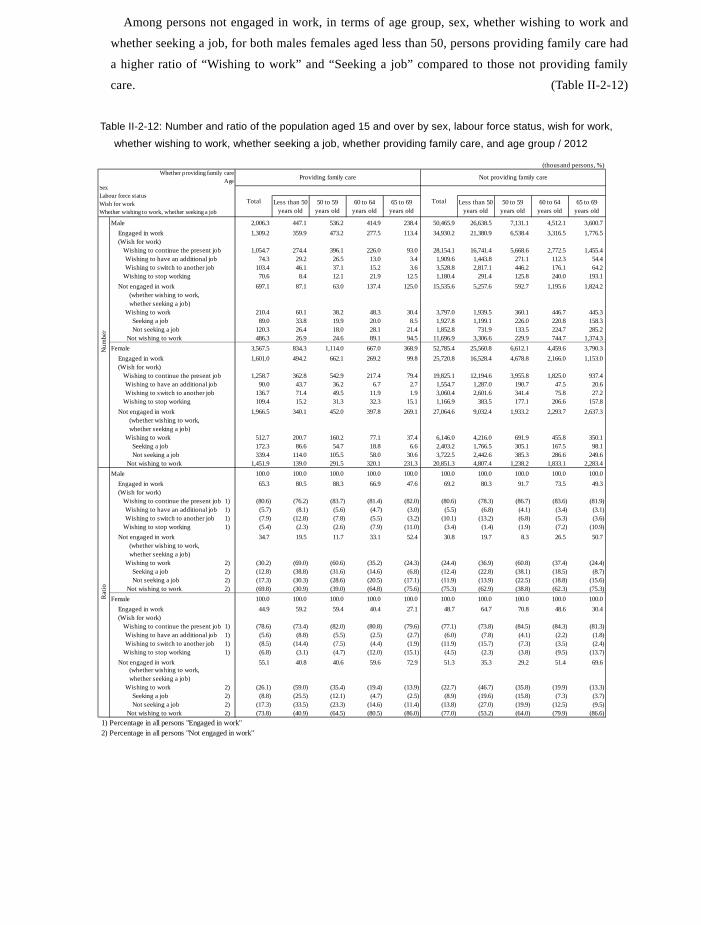
192
Among persons not engaged in work, in terms of age group, sex, whether wishing to work and
whether seeking a job, for both males females aged less than 50, persons providing family care had
a higher ratio of “Wishing to work” and “Seeking a job” compared to those not providing family
care. (Table II-2-12)
Table II-2-12: Number and ratio of the population aged 15 and over by sex, labour force status, wish for work,
whether wishing to work, whether seeking a job, whether providing family care, and age group / 2012
(thousand persons, %)
Less than 50years old
50 to 59years old
60 to 64years old
65 to 69years old
Less than 50years old
50 to 59years old
60 to 64years old
65 to 69years old
Male 2,006.3 447.1 536.2 414.9 238.4 50,465.9 26,638.5 7,131.1 4,512.1 3,600.7 Engaged in work 1,309.2 359.9 473.2 277.5 113.4 34,930.2 21,380.9 6,538.4 3,316.5 1,776.5 (Wish for work) Wishing to continue the present job 1,054.7 274.4 396.1 226.0 93.0 28,154.1 16,741.4 5,668.6 2,772.5 1,455.4 Wishing to have an additional job 74.3 29.2 26.5 13.0 3.4 1,909.6 1,443.8 271.1 112.3 54.4 Wishing to switch to another job 103.4 46.1 37.1 15.2 3.6 3,528.8 2,817.1 446.2 176.1 64.2 Wishing to stop working 70.6 8.4 12.1 21.9 12.5 1,180.4 291.4 125.8 240.0 193.1 Not engaged in work 697.1 87.1 63.0 137.4 125.0 15,535.6 5,257.6 592.7 1,195.6 1,824.2
(whether wishing to work,whether seeking a job)
Wishing to work 210.4 60.1 38.2 48.3 30.4 3,797.0 1,939.5 360.1 446.7 445.3 Seeking a job 89.0 33.8 19.9 20.0 8.5 1,927.8 1,199.1 226.0 220.8 158.3 Not seeking a job 120.3 26.4 18.0 28.1 21.4 1,852.8 731.9 133.5 224.7 285.2 Not wishing to work 486.3 26.9 24.6 89.1 94.5 11,696.9 3,306.6 229.9 744.7 1,374.3Female 3,567.5 834.3 1,114.0 667.0 368.9 52,785.4 25,560.8 6,612.1 4,459.6 3,790.3 Engaged in work 1,601.0 494.2 662.1 269.2 99.8 25,720.8 16,528.4 4,678.8 2,166.0 1,153.0 (Wish for work) Wishing to continue the present job 1,258.7 362.8 542.9 217.4 79.4 19,825.1 12,194.6 3,955.8 1,825.0 937.4 Wishing to have an additional job 90.0 43.7 36.2 6.7 2.7 1,554.7 1,287.0 190.7 47.5 20.6 Wishing to switch to another job 136.7 71.4 49.5 11.9 1.9 3,060.4 2,601.6 341.4 75.8 27.2 Wishing to stop working 109.4 15.2 31.3 32.3 15.1 1,166.9 383.5 177.1 206.6 157.8 Not engaged in work 1,966.5 340.1 452.0 397.8 269.1 27,064.6 9,032.4 1,933.2 2,293.7 2,637.3
(whether wishing to work,whether seeking a job)
Wishing to work 512.7 200.7 160.2 77.1 37.4 6,146.0 4,216.0 691.9 455.8 350.1 Seeking a job 172.3 86.6 54.7 18.8 6.6 2,403.2 1,766.5 305.1 167.5 98.1 Not seeking a job 339.4 114.0 105.5 58.0 30.6 3,722.5 2,442.6 385.3 286.6 249.6 Not wishing to work 1,451.9 139.0 291.5 320.1 231.3 20,851.3 4,807.4 1,238.2 1,833.1 2,283.4Male 100.0 100.0 100.0 100.0 100.0 100.0 100.0 100.0 100.0 100.0 Engaged in work 65.3 80.5 88.3 66.9 47.6 69.2 80.3 91.7 73.5 49.3 (Wish for work) Wishing to continue the present job 1) (80.6) (76.2) (83.7) (81.4) (82.0) (80.6) (78.3) (86.7) (83.6) (81.9) Wishing to have an additional job 1) (5.7) (8.1) (5.6) (4.7) (3.0) (5.5) (6.8) (4.1) (3.4) (3.1) Wishing to switch to another job 1) (7.9) (12.8) (7.8) (5.5) (3.2) (10.1) (13.2) (6.8) (5.3) (3.6) Wishing to stop working 1) (5.4) (2.3) (2.6) (7.9) (11.0) (3.4) (1.4) (1.9) (7.2) (10.9) Not engaged in work 34.7 19.5 11.7 33.1 52.4 30.8 19.7 8.3 26.5 50.7
(whether wishing to work,whether seeking a job)
Wishing to work 2) (30.2) (69.0) (60.6) (35.2) (24.3) (24.4) (36.9) (60.8) (37.4) (24.4) Seeking a job 2) (12.8) (38.8) (31.6) (14.6) (6.8) (12.4) (22.8) (38.1) (18.5) (8.7) Not seeking a job 2) (17.3) (30.3) (28.6) (20.5) (17.1) (11.9) (13.9) (22.5) (18.8) (15.6) Not wishing to work 2) (69.8) (30.9) (39.0) (64.8) (75.6) (75.3) (62.9) (38.8) (62.3) (75.3)Female 100.0 100.0 100.0 100.0 100.0 100.0 100.0 100.0 100.0 100.0 Engaged in work 44.9 59.2 59.4 40.4 27.1 48.7 64.7 70.8 48.6 30.4 (Wish for work) Wishing to continue the present job 1) (78.6) (73.4) (82.0) (80.8) (79.6) (77.1) (73.8) (84.5) (84.3) (81.3) Wishing to have an additional job 1) (5.6) (8.8) (5.5) (2.5) (2.7) (6.0) (7.8) (4.1) (2.2) (1.8) Wishing to switch to another job 1) (8.5) (14.4) (7.5) (4.4) (1.9) (11.9) (15.7) (7.3) (3.5) (2.4) Wishing to stop working 1) (6.8) (3.1) (4.7) (12.0) (15.1) (4.5) (2.3) (3.8) (9.5) (13.7) Not engaged in work 55.1 40.8 40.6 59.6 72.9 51.3 35.3 29.2 51.4 69.6
(whether wishing to work,whether seeking a job)
Wishing to work 2) (26.1) (59.0) (35.4) (19.4) (13.9) (22.7) (46.7) (35.8) (19.9) (13.3) Seeking a job 2) (8.8) (25.5) (12.1) (4.7) (2.5) (8.9) (19.6) (15.8) (7.3) (3.7) Not seeking a job 2) (17.3) (33.5) (23.3) (14.6) (11.4) (13.8) (27.0) (19.9) (12.5) (9.5) Not wishing to work 2) (73.8) (40.9) (64.5) (80.5) (86.0) (77.0) (53.2) (64.0) (79.9) (86.6)
1) Percentage in all persons "Engaged in work" 2) Percentage in all persons "Not engaged in work"
Num
ber
Rat
io
Whether providing family careAge Providing family care Not providing family care
SexLabour force statusWish for workWhether wishing to work, whether seeking a job
Total Total
c. There are 2,399 thousand employees providing family care, 378 thousand of whom are those who “Used family care leave or other support system”.
Looking at employees providing family care (2,399 thousand) by whether they used family care
leave or other support system and kind of system, “Used family care leave or other support system”
numbered 378 thousand. Among them, “Used family care leave” numbered 76 thousand, “Used
short hours” 56 thousand, and “Used nursing leave” 55 thousand.
In terms of type of employment, persons who “Used system of family care leave or other support
system” accounted for 16.8% of “Regular staffs” and 14.6% of “Irregular staffs”. (Table II-2-13)
Table II-2-13: Number and ratio of employees providing family care by type of employment, whether used family care
leave or other support system, and kind of family care leave system, etc. / 2012
d. There are 487 thousand persons who left the previous job due to family care during the past five years, 389 thousand of whom are female, accounting for about 80%.
Looking at persons who left the previous job “For an aged/sick family member’s care” by present
labour force status and when they left the previous job, persons who left the previous job during the
past five years numbered 487 thousand. Among them, persons currently engaged in work numbered
123 thousand, while persons not currently engaged in work numbered 364 thousand. By sex, males
numbered 98 thousand, while females numbered 389 thousand, accounting for about 80%.
Looking at trends every five years, persons who left the previous job for an aged/sick family
member’s care increased to 524 thousand “from October 1997 to September 2002” and 568
thousand “from October 2002 to September 2007”, while they decreased to 487 thousand “from
October 2007 to September 2012”.
Persons who left the previous job for an aged/sick family member’s care in the past year (from
October 2011 to September 2012) numbered 101 thousand. (Table II-2-14, Fig.II-2-10/11)
(thousand persons, %)
Family careleave Short hours Nursing leave Other
Total (employees, including executive ofcompany or corporation) 2,399.3 1,998.0 377.6 75.7 56.2 55.4 196.5
Regular staffs 1,119.1 921.1 187.7 43.8 17.4 38.1 92.0
Irregular staffs 1,065.7 898.4 155.5 23.2 33.2 15.3 86.2Total (employees, including executive ofcompany or corporation)
100.0 83.3 15.7 3.2 2.3 2.3 8.2
Regular staffs 100.0 82.3 16.8 3.9 1.6 3.4 8.2
Irregular staffs 100.0 84.3 14.6 2.2 3.1 1.4 8.1Note) Multiple answers are allowed in the item “Kind of system”. As a result, the total of each kind of system does not always correspond exactly to that of "Used system".
Num
ber
Rat
io
Whether used family care leave or other supportsystem
Kind of family care leave system etc.
Providing family care
Total Unused system
Used system
Type of employment
Total
Kind of system Note)
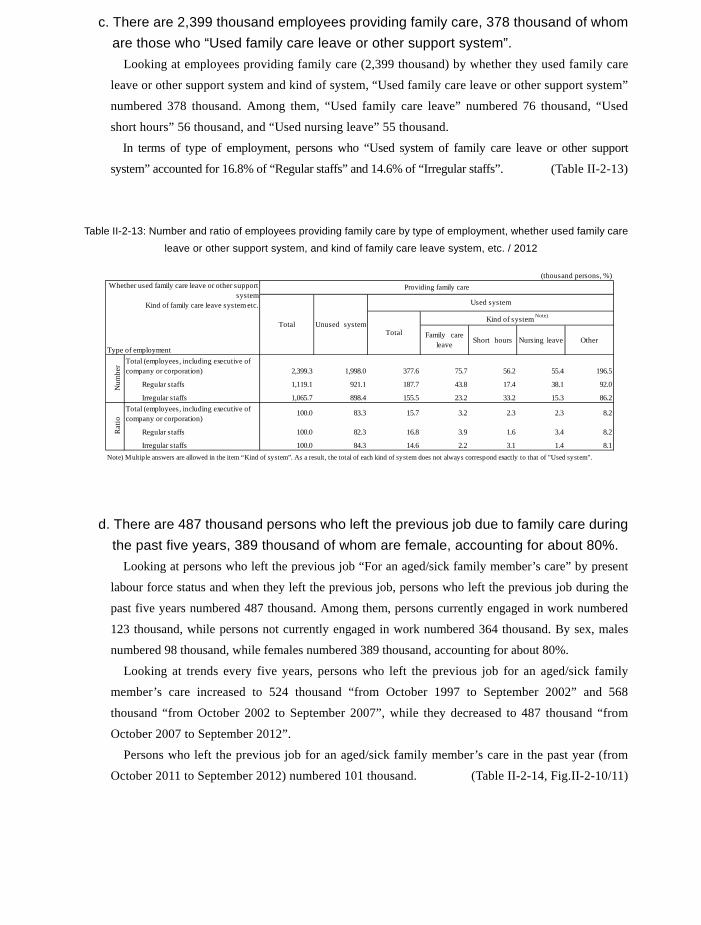
193
Among persons not engaged in work, in terms of age group, sex, whether wishing to work and
whether seeking a job, for both males females aged less than 50, persons providing family care had
a higher ratio of “Wishing to work” and “Seeking a job” compared to those not providing family
care. (Table II-2-12)
Table II-2-12: Number and ratio of the population aged 15 and over by sex, labour force status, wish for work,
whether wishing to work, whether seeking a job, whether providing family care, and age group / 2012
(thousand persons, %)
Less than 50years old
50 to 59years old
60 to 64years old
65 to 69years old
Less than 50years old
50 to 59years old
60 to 64years old
65 to 69years old
Male 2,006.3 447.1 536.2 414.9 238.4 50,465.9 26,638.5 7,131.1 4,512.1 3,600.7 Engaged in work 1,309.2 359.9 473.2 277.5 113.4 34,930.2 21,380.9 6,538.4 3,316.5 1,776.5 (Wish for work) Wishing to continue the present job 1,054.7 274.4 396.1 226.0 93.0 28,154.1 16,741.4 5,668.6 2,772.5 1,455.4 Wishing to have an additional job 74.3 29.2 26.5 13.0 3.4 1,909.6 1,443.8 271.1 112.3 54.4 Wishing to switch to another job 103.4 46.1 37.1 15.2 3.6 3,528.8 2,817.1 446.2 176.1 64.2 Wishing to stop working 70.6 8.4 12.1 21.9 12.5 1,180.4 291.4 125.8 240.0 193.1 Not engaged in work 697.1 87.1 63.0 137.4 125.0 15,535.6 5,257.6 592.7 1,195.6 1,824.2
(whether wishing to work,whether seeking a job)
Wishing to work 210.4 60.1 38.2 48.3 30.4 3,797.0 1,939.5 360.1 446.7 445.3 Seeking a job 89.0 33.8 19.9 20.0 8.5 1,927.8 1,199.1 226.0 220.8 158.3 Not seeking a job 120.3 26.4 18.0 28.1 21.4 1,852.8 731.9 133.5 224.7 285.2 Not wishing to work 486.3 26.9 24.6 89.1 94.5 11,696.9 3,306.6 229.9 744.7 1,374.3Female 3,567.5 834.3 1,114.0 667.0 368.9 52,785.4 25,560.8 6,612.1 4,459.6 3,790.3 Engaged in work 1,601.0 494.2 662.1 269.2 99.8 25,720.8 16,528.4 4,678.8 2,166.0 1,153.0 (Wish for work) Wishing to continue the present job 1,258.7 362.8 542.9 217.4 79.4 19,825.1 12,194.6 3,955.8 1,825.0 937.4 Wishing to have an additional job 90.0 43.7 36.2 6.7 2.7 1,554.7 1,287.0 190.7 47.5 20.6 Wishing to switch to another job 136.7 71.4 49.5 11.9 1.9 3,060.4 2,601.6 341.4 75.8 27.2 Wishing to stop working 109.4 15.2 31.3 32.3 15.1 1,166.9 383.5 177.1 206.6 157.8 Not engaged in work 1,966.5 340.1 452.0 397.8 269.1 27,064.6 9,032.4 1,933.2 2,293.7 2,637.3
(whether wishing to work,whether seeking a job)
Wishing to work 512.7 200.7 160.2 77.1 37.4 6,146.0 4,216.0 691.9 455.8 350.1 Seeking a job 172.3 86.6 54.7 18.8 6.6 2,403.2 1,766.5 305.1 167.5 98.1 Not seeking a job 339.4 114.0 105.5 58.0 30.6 3,722.5 2,442.6 385.3 286.6 249.6 Not wishing to work 1,451.9 139.0 291.5 320.1 231.3 20,851.3 4,807.4 1,238.2 1,833.1 2,283.4Male 100.0 100.0 100.0 100.0 100.0 100.0 100.0 100.0 100.0 100.0 Engaged in work 65.3 80.5 88.3 66.9 47.6 69.2 80.3 91.7 73.5 49.3 (Wish for work) Wishing to continue the present job 1) (80.6) (76.2) (83.7) (81.4) (82.0) (80.6) (78.3) (86.7) (83.6) (81.9) Wishing to have an additional job 1) (5.7) (8.1) (5.6) (4.7) (3.0) (5.5) (6.8) (4.1) (3.4) (3.1) Wishing to switch to another job 1) (7.9) (12.8) (7.8) (5.5) (3.2) (10.1) (13.2) (6.8) (5.3) (3.6) Wishing to stop working 1) (5.4) (2.3) (2.6) (7.9) (11.0) (3.4) (1.4) (1.9) (7.2) (10.9) Not engaged in work 34.7 19.5 11.7 33.1 52.4 30.8 19.7 8.3 26.5 50.7
(whether wishing to work,whether seeking a job)
Wishing to work 2) (30.2) (69.0) (60.6) (35.2) (24.3) (24.4) (36.9) (60.8) (37.4) (24.4) Seeking a job 2) (12.8) (38.8) (31.6) (14.6) (6.8) (12.4) (22.8) (38.1) (18.5) (8.7) Not seeking a job 2) (17.3) (30.3) (28.6) (20.5) (17.1) (11.9) (13.9) (22.5) (18.8) (15.6) Not wishing to work 2) (69.8) (30.9) (39.0) (64.8) (75.6) (75.3) (62.9) (38.8) (62.3) (75.3)Female 100.0 100.0 100.0 100.0 100.0 100.0 100.0 100.0 100.0 100.0 Engaged in work 44.9 59.2 59.4 40.4 27.1 48.7 64.7 70.8 48.6 30.4 (Wish for work) Wishing to continue the present job 1) (78.6) (73.4) (82.0) (80.8) (79.6) (77.1) (73.8) (84.5) (84.3) (81.3) Wishing to have an additional job 1) (5.6) (8.8) (5.5) (2.5) (2.7) (6.0) (7.8) (4.1) (2.2) (1.8) Wishing to switch to another job 1) (8.5) (14.4) (7.5) (4.4) (1.9) (11.9) (15.7) (7.3) (3.5) (2.4) Wishing to stop working 1) (6.8) (3.1) (4.7) (12.0) (15.1) (4.5) (2.3) (3.8) (9.5) (13.7) Not engaged in work 55.1 40.8 40.6 59.6 72.9 51.3 35.3 29.2 51.4 69.6
(whether wishing to work,whether seeking a job)
Wishing to work 2) (26.1) (59.0) (35.4) (19.4) (13.9) (22.7) (46.7) (35.8) (19.9) (13.3) Seeking a job 2) (8.8) (25.5) (12.1) (4.7) (2.5) (8.9) (19.6) (15.8) (7.3) (3.7) Not seeking a job 2) (17.3) (33.5) (23.3) (14.6) (11.4) (13.8) (27.0) (19.9) (12.5) (9.5) Not wishing to work 2) (73.8) (40.9) (64.5) (80.5) (86.0) (77.0) (53.2) (64.0) (79.9) (86.6)
1) Percentage in all persons "Engaged in work" 2) Percentage in all persons "Not engaged in work"
Num
ber
Rat
io
Whether providing family careAge Providing family care Not providing family care
SexLabour force statusWish for workWhether wishing to work, whether seeking a job
Total Total
c. There are 2,399 thousand employees providing family care, 378 thousand of whom are those who “Used family care leave or other support system”.
Looking at employees providing family care (2,399 thousand) by whether they used family care
leave or other support system and kind of system, “Used family care leave or other support system”
numbered 378 thousand. Among them, “Used family care leave” numbered 76 thousand, “Used
short hours” 56 thousand, and “Used nursing leave” 55 thousand.
In terms of type of employment, persons who “Used system of family care leave or other support
system” accounted for 16.8% of “Regular staffs” and 14.6% of “Irregular staffs”. (Table II-2-13)
Table II-2-13: Number and ratio of employees providing family care by type of employment, whether used family care
leave or other support system, and kind of family care leave system, etc. / 2012
d. There are 487 thousand persons who left the previous job due to family care during the past five years, 389 thousand of whom are female, accounting for about 80%.
Looking at persons who left the previous job “For an aged/sick family member’s care” by present
labour force status and when they left the previous job, persons who left the previous job during the
past five years numbered 487 thousand. Among them, persons currently engaged in work numbered
123 thousand, while persons not currently engaged in work numbered 364 thousand. By sex, males
numbered 98 thousand, while females numbered 389 thousand, accounting for about 80%.
Looking at trends every five years, persons who left the previous job for an aged/sick family
member’s care increased to 524 thousand “from October 1997 to September 2002” and 568
thousand “from October 2002 to September 2007”, while they decreased to 487 thousand “from
October 2007 to September 2012”.
Persons who left the previous job for an aged/sick family member’s care in the past year (from
October 2011 to September 2012) numbered 101 thousand. (Table II-2-14, Fig.II-2-10/11)
(thousand persons, %)
Family careleave Short hours Nursing leave Other
Total (employees, including executive ofcompany or corporation) 2,399.3 1,998.0 377.6 75.7 56.2 55.4 196.5
Regular staffs 1,119.1 921.1 187.7 43.8 17.4 38.1 92.0
Irregular staffs 1,065.7 898.4 155.5 23.2 33.2 15.3 86.2Total (employees, including executive ofcompany or corporation)
100.0 83.3 15.7 3.2 2.3 2.3 8.2
Regular staffs 100.0 82.3 16.8 3.9 1.6 3.4 8.2
Irregular staffs 100.0 84.3 14.6 2.2 3.1 1.4 8.1Note) Multiple answers are allowed in the item “Kind of system”. As a result, the total of each kind of system does not always correspond exactly to that of "Used system".
Num
ber
Rat
io
Whether used family care leave or other supportsystem
Kind of family care leave system etc.
Providing family care
Total Unused system
Used system
Type of employment
Total
Kind of system Note)
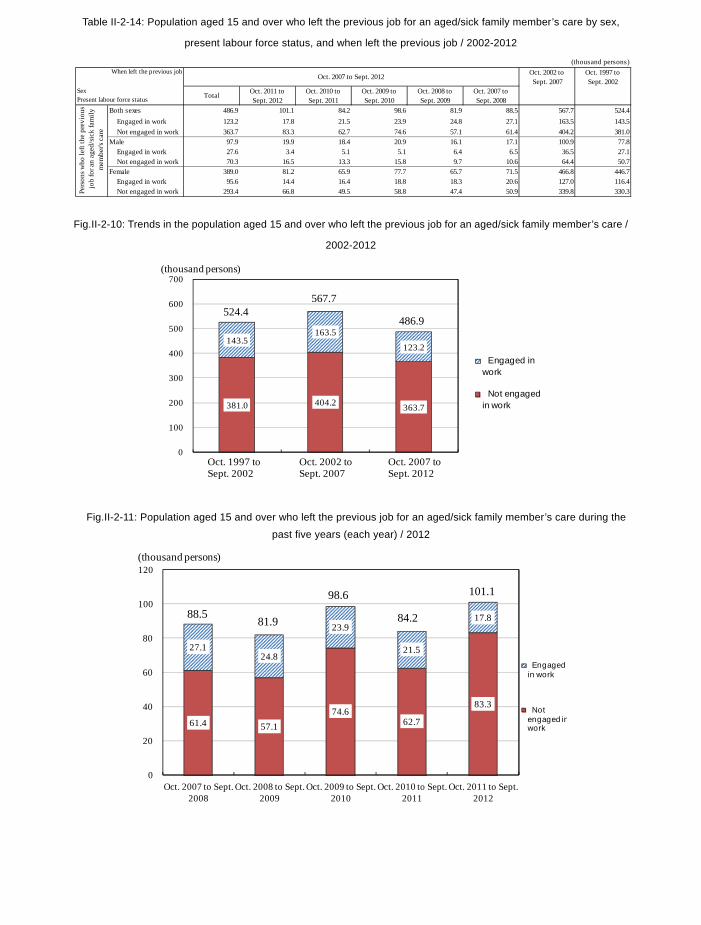
194
Table II-2-14: Population aged 15 and over who left the previous job for an aged/sick family member’s care by sex,
present labour force status, and when left the previous job / 2002-2012
Fig.II-2-10: Trends in the population aged 15 and over who left the previous job for an aged/sick family member’s care /
2002-2012
Fig.II-2-11: Population aged 15 and over who left the previous job for an aged/sick family member’s care during the
past five years (each year) / 2012
(thousand persons)When left the previous job Oct. 2002 to
Sept. 2007Oct. 1997 toSept. 2002
Total Oct. 2011 toSept. 2012
Oct. 2010 toSept. 2011
Oct. 2009 toSept. 2010
Oct. 2008 toSept. 2009
Oct. 2007 toSept. 2008
Both sexes 486.9 101.1 84.2 98.6 81.9 88.5 567.7 524.4 Engaged in work 123.2 17.8 21.5 23.9 24.8 27.1 163.5 143.5 Not engaged in work 363.7 83.3 62.7 74.6 57.1 61.4 404.2 381.0Male 97.9 19.9 18.4 20.9 16.1 17.1 100.9 77.8 Engaged in work 27.6 3.4 5.1 5.1 6.4 6.5 36.5 27.1 Not engaged in work 70.3 16.5 13.3 15.8 9.7 10.6 64.4 50.7Female 389.0 81.2 65.9 77.7 65.7 71.5 466.8 446.7 Engaged in work 95.6 14.4 16.4 18.8 18.3 20.6 127.0 116.4 Not engaged in work 293.4 66.8 49.5 58.8 47.4 50.9 339.8 330.3
Oct. 2007 to Sept. 2012
SexPresent labour force status
Pers
ons w
ho le
ft th
e pr
evio
usjo
b fo
r an
aged
/sic
k fa
mily
mem
ber's
car
e
363.7404.2381.0
123.2
163.5143.5
0
100
200
300
400
500
600
700
Engaged in work
Not engaged in work
(thousand persons)
524.4567.7
486.9
Oct. 1997 to Sept. 2002
Oct. 2002 to Sept. 2007
Oct. 2007 to Sept. 2012
83.3
62.774.6
57.161.4
17.8
21.5
23.9
24.827.1
0
20
40
60
80
100
120
Oct. 2011 to Sept. 2012
Oct. 2010 to Sept. 2011
Oct. 2009 to Sept. 2010
Oct. 2008 to Sept. 2009
Oct. 2007 to Sept. 2008
Engaged in work
Not engaged inwork
(thousand persons)
88.5 81.9
98.6
84.2
101.1
4. Employment of older persons (1) Labour force status
Persons engaged in work and persons wishing to work in the age group of “60 to 64” account for about 80% among males and about 60% among females.
Looking at persons aged 55 and over by sex, age group, labour force status, and whether wishing to
work, males engaged in work accounted for 89.7% in “55 to 59 years old”, 72.7% in “60 to 64”, and
49.0% in “65 to 69”. Males not engaged in work but wishing to work accounted for about 10% in the
age group of 60 to 74 years old.
Among females, persons engaged in work accounted for 65.0% in “55 to 59 years old”, 47.3% in
“60 to 64”, and 29.8% in “65 to 69”, while persons not engaged in work but wishing to work
accounted for about 10% in the age group of 55 to 69 years old. (Fig. II-2-12)
Fig. II-2-12: Ratio of the population aged 55 and over by sex, age group, labour force status, and whether wishing to
work / 2012
(Male)
(Female)
89.7
72.7
49.0
32.4
16.1
5.8
10.1
12.5
11.2
5.0
4.3
17.0
38.2
56.0
78.3
0 10 20 30 40 50 60 70 80 90 100
55 to 59 years old
60 to 64
65 to 69
70 to 74
75 years old and over
(%)Engaged in work Not engaged in work(Wishing to work)
Not engaged in work(Not wishing to work)
65.0
47.3
29.8
18.0
6.3
10.8
10.5
9.5
7.2
2.3
24.1
42.0
60.4
74.3
90.5
0 10 20 30 40 50 60 70 80 90 100
55 to 59 years old
60 to 64
65 to 69
70 to 74
75 years old and over
(%)Engaged in work Not engaged in work(Wishing to work)
Not engaged in work(Not wishing to work)
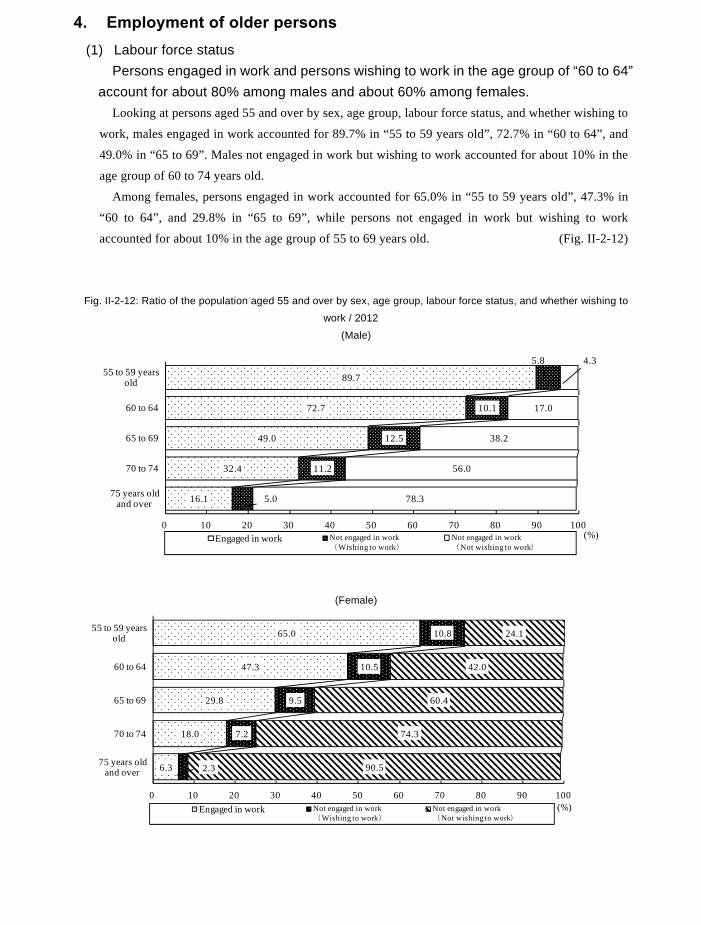
195
Table II-2-14: Population aged 15 and over who left the previous job for an aged/sick family member’s care by sex,
present labour force status, and when left the previous job / 2002-2012
Fig.II-2-10: Trends in the population aged 15 and over who left the previous job for an aged/sick family member’s care /
2002-2012
Fig.II-2-11: Population aged 15 and over who left the previous job for an aged/sick family member’s care during the
past five years (each year) / 2012
(thousand persons)When left the previous job Oct. 2002 to
Sept. 2007Oct. 1997 toSept. 2002
Total Oct. 2011 toSept. 2012
Oct. 2010 toSept. 2011
Oct. 2009 toSept. 2010
Oct. 2008 toSept. 2009
Oct. 2007 toSept. 2008
Both sexes 486.9 101.1 84.2 98.6 81.9 88.5 567.7 524.4 Engaged in work 123.2 17.8 21.5 23.9 24.8 27.1 163.5 143.5 Not engaged in work 363.7 83.3 62.7 74.6 57.1 61.4 404.2 381.0Male 97.9 19.9 18.4 20.9 16.1 17.1 100.9 77.8 Engaged in work 27.6 3.4 5.1 5.1 6.4 6.5 36.5 27.1 Not engaged in work 70.3 16.5 13.3 15.8 9.7 10.6 64.4 50.7Female 389.0 81.2 65.9 77.7 65.7 71.5 466.8 446.7 Engaged in work 95.6 14.4 16.4 18.8 18.3 20.6 127.0 116.4 Not engaged in work 293.4 66.8 49.5 58.8 47.4 50.9 339.8 330.3
Oct. 2007 to Sept. 2012
SexPresent labour force status
Pers
ons w
ho le
ft th
e pr
evio
usjo
b fo
r an
aged
/sic
k fa
mily
mem
ber's
car
e
363.7404.2381.0
123.2
163.5143.5
0
100
200
300
400
500
600
700
Engaged in work
Not engaged in work
(thousand persons)
524.4567.7
486.9
Oct. 1997 to Sept. 2002
Oct. 2002 to Sept. 2007
Oct. 2007 to Sept. 2012
83.3
62.774.6
57.161.4
17.8
21.5
23.9
24.827.1
0
20
40
60
80
100
120
Oct. 2011 to Sept. 2012
Oct. 2010 to Sept. 2011
Oct. 2009 to Sept. 2010
Oct. 2008 to Sept. 2009
Oct. 2007 to Sept. 2008
Engaged in work
Not engaged inwork
(thousand persons)
88.5 81.9
98.6
84.2
101.1
4. Employment of older persons (1) Labour force status
Persons engaged in work and persons wishing to work in the age group of “60 to 64” account for about 80% among males and about 60% among females.
Looking at persons aged 55 and over by sex, age group, labour force status, and whether wishing to
work, males engaged in work accounted for 89.7% in “55 to 59 years old”, 72.7% in “60 to 64”, and
49.0% in “65 to 69”. Males not engaged in work but wishing to work accounted for about 10% in the
age group of 60 to 74 years old.
Among females, persons engaged in work accounted for 65.0% in “55 to 59 years old”, 47.3% in
“60 to 64”, and 29.8% in “65 to 69”, while persons not engaged in work but wishing to work
accounted for about 10% in the age group of 55 to 69 years old. (Fig. II-2-12)
Fig. II-2-12: Ratio of the population aged 55 and over by sex, age group, labour force status, and whether wishing to
work / 2012
(Male)
(Female)
89.7
72.7
49.0
32.4
16.1
5.8
10.1
12.5
11.2
5.0
4.3
17.0
38.2
56.0
78.3
0 10 20 30 40 50 60 70 80 90 100
55 to 59 years old
60 to 64
65 to 69
70 to 74
75 years old and over
(%)Engaged in work Not engaged in work(Wishing to work)
Not engaged in work(Not wishing to work)
65.0
47.3
29.8
18.0
6.3
10.8
10.5
9.5
7.2
2.3
24.1
42.0
60.4
74.3
90.5
0 10 20 30 40 50 60 70 80 90 100
55 to 59 years old
60 to 64
65 to 69
70 to 74
75 years old and over
(%)Engaged in work Not engaged in work(Wishing to work)
Not engaged in work(Not wishing to work)
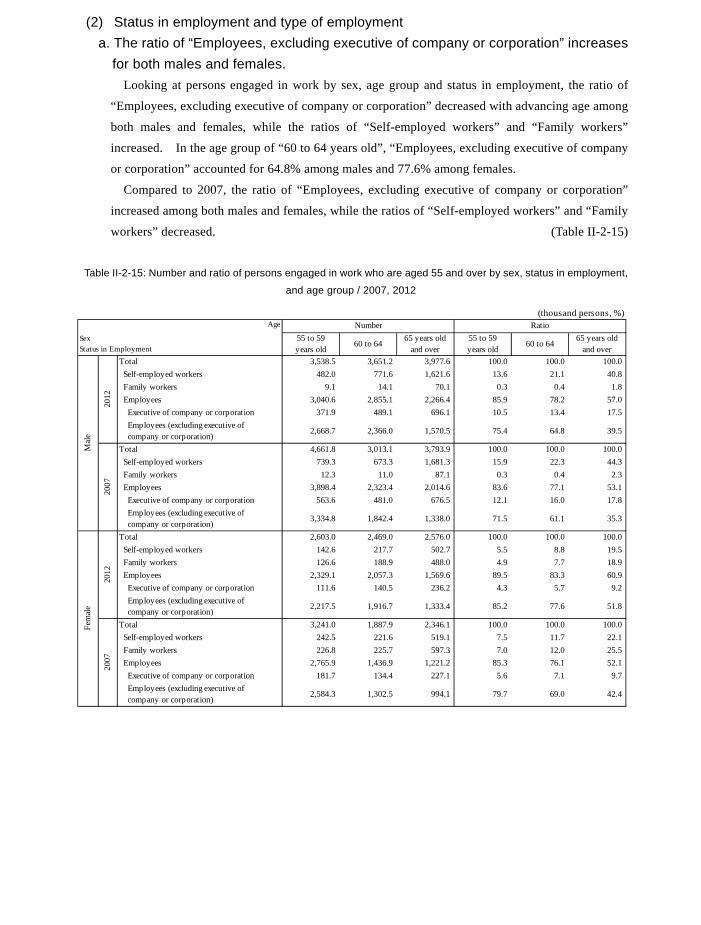
196
(2) Status in employment and type of employment a. The ratio of “Employees, excluding executive of company or corporation” increases
for both males and females. Looking at persons engaged in work by sex, age group and status in employment, the ratio of
“Employees, excluding executive of company or corporation” decreased with advancing age among
both males and females, while the ratios of “Self-employed workers” and “Family workers”
increased. In the age group of “60 to 64 years old”, “Employees, excluding executive of company
or corporation” accounted for 64.8% among males and 77.6% among females.
Compared to 2007, the ratio of “Employees, excluding executive of company or corporation”
increased among both males and females, while the ratios of “Self-employed workers” and “Family
workers” decreased. (Table II-2-15)
Table II-2-15: Number and ratio of persons engaged in work who are aged 55 and over by sex, status in employment,
and age group / 2007, 2012
(thousand persons, %)Number
55 to 59years old
60 to 6465 years old
and over55 to 59years old
60 to 6465 years old
and overTotal 3,538.5 3,651.2 3,977.6 100.0 100.0 100.0 Self-employed workers 482.0 771.6 1,621.6 13.6 21.1 40.8 Family workers 9.1 14.1 70.1 0.3 0.4 1.8 Employees 3,040.6 2,855.1 2,266.4 85.9 78.2 57.0 Executive of company or corporation 371.9 489.1 696.1 10.5 13.4 17.5 Employees (excluding executive of company or corporation)
2,668.7 2,366.0 1,570.5 75.4 64.8 39.5
Total 4,661.8 3,013.1 3,793.9 100.0 100.0 100.0 Self-employed workers 739.3 673.3 1,681.3 15.9 22.3 44.3 Family workers 12.3 11.0 87.1 0.3 0.4 2.3 Employees 3,898.4 2,323.4 2,014.6 83.6 77.1 53.1 Executive of company or corporation 563.6 481.0 676.5 12.1 16.0 17.8 Employees (excluding executive of company or corporation)
3,334.8 1,842.4 1,338.0 71.5 61.1 35.3
Total 2,603.0 2,469.0 2,576.0 100.0 100.0 100.0 Self-employed workers 142.6 217.7 502.7 5.5 8.8 19.5 Family workers 126.6 188.9 488.0 4.9 7.7 18.9 Employees 2,329.1 2,057.3 1,569.6 89.5 83.3 60.9 Executive of company or corporation 111.6 140.5 236.2 4.3 5.7 9.2 Employees (excluding executive of company or corporation)
2,217.5 1,916.7 1,333.4 85.2 77.6 51.8
Total 3,241.0 1,887.9 2,346.1 100.0 100.0 100.0 Self-employed workers 242.5 221.6 519.1 7.5 11.7 22.1 Family workers 226.8 225.7 597.3 7.0 12.0 25.5 Employees 2,765.9 1,436.9 1,221.2 85.3 76.1 52.1 Executive of company or corporation 181.7 134.4 227.1 5.6 7.1 9.7 Employees (excluding executive of company or corporation)
2,584.3 1,302.5 994.1 79.7 69.0 42.4
Fem
ale
2012
2007
Age RatioSexStatus in Employment
2012
2007
Mal
e
b. The ratio of “Regular staffs” decreases for both males and females. Looking at “Employees, excluding executive of company or corporation” by sex, age group and
type of employment, among males, “Regular staffs” accounted for 85.7% in the age group of “55 to
59”, 42.9% in “60 to 64” and 26.1% in “65 and over”. This means that the ratio of “Regular staffs”
decreases with advancing age. Among females, it was 37.1% in the age group of “55 to 59”, 23.5%
in “60 to 64” and 25.9% in “65 and over”.
Compared to 2007, for males the ratio of “Regular staffs” decreased in the age groups of “60 to
64” and “65 and over”, while the ratio of “Contract employees” increased in all age groups. Among
females, the ratio of “Regular staffs” decreased in all age groups, while the ratios of “Part-time
workers” and “Contract employees” increased. (Table II-2-16)
Table II-2-16: Number and ratio of employees (excluding executive of company or corporation) aged 55 and over by
sex, type of employment, and age group / 2007, 2012
Number
55 to 59years old
60 to 6465 years old
and over55 to 59years old
60 to 6465 years old
and over
Employees (excluding executive of companyor corporation) 2,668.7 2,366.0 1,570.5 100.0 100.0 100.0
Regular staffs 2,287.9 1,014.5 410.5 85.7 42.9 26.1 Part-time workers 74.2 241.0 313.3 2.8 10.2 19.9 Arbeit (temporary workers) 80.0 189.7 312.2 3.0 8.0 19.9 Dispatched workers from temporary labour agency 22.6 33.5 37.9 0.8 1.4 2.4
Contract employees 124.2 377.4 172.4 4.7 16.0 11.0 Entrusted employees 42.4 420.6 202.4 1.6 17.8 12.9 Other 37.4 89.2 121.5 1.4 3.8 7.7Employees (excluding executive of companyor corporation) 3,334.8 1,842.4 1,338.0 100.0 100.0 100.0
Regular staffs 2,858.4 820.0 387.8 85.7 44.5 29.0 Part-time workers 89.2 227.4 291.2 2.7 12.3 21.8 Arbeit (temporary workers) 91.3 167.3 220.8 2.7 9.1 16.5 Dispatched workers from temporary labour agency 33.5 34.0 32.7 1.0 1.8 2.4
Contract employees 130.2 200.3 117.2 3.9 10.9 8.8 Entrusted employees 71.4 319.1 174.7 2.1 17.3 13.1 Other 57.9 67.3 108.3 1.7 3.7 8.1Employees (excluding executive of companyor corporation) 2,217.5 1,916.7 1,333.4 100.0 100.0 100.0
Regular staffs 822.4 450.8 345.3 37.1 23.5 25.9 Part-time workers 1,059.8 1,050.6 664.2 47.8 54.8 49.8 Arbeit (temporary workers) 80.9 110.0 102.9 3.6 5.7 7.7 Dispatched workers from temporary labour agency 31.0 20.8 19.8 1.4 1.1 1.5
Contract employees 101.9 105.9 37.4 4.6 5.5 2.8 Entrusted employees 44.0 81.8 35.3 2.0 4.3 2.6 Other 77.6 96.9 128.4 3.5 5.1 9.6Employees (excluding executive of companyor corporation) 2,584.3 1,302.5 994.1 100.0 100.0 100.0
Regular staffs 1,034.2 367.8 333.1 40.0 28.2 33.5 Part-time workers 1,229.1 667.5 458.1 47.6 51.2 46.1 Arbeit (temporary workers) 88.7 80.3 64.0 3.4 6.2 6.4 Dispatched workers from temporary labour agency 36.1 20.2 15.1 1.4 1.6 1.5
Contract employees 85.0 54.2 19.8 3.3 4.2 2.0 Entrusted employees 50.9 54.7 27.3 2.0 4.2 2.7 Other 58.1 55.4 74.7 2.2 4.3 7.5
Fem
ale
2012
2007
2012
2007
Note 1) Names used for types of employment such as “Part-time workers” and “Arbeit (temporary workers)” differ from workplace to workplace.
(thousand persons, %)Age Ratio
SexType of Employment 1)
Mal
e
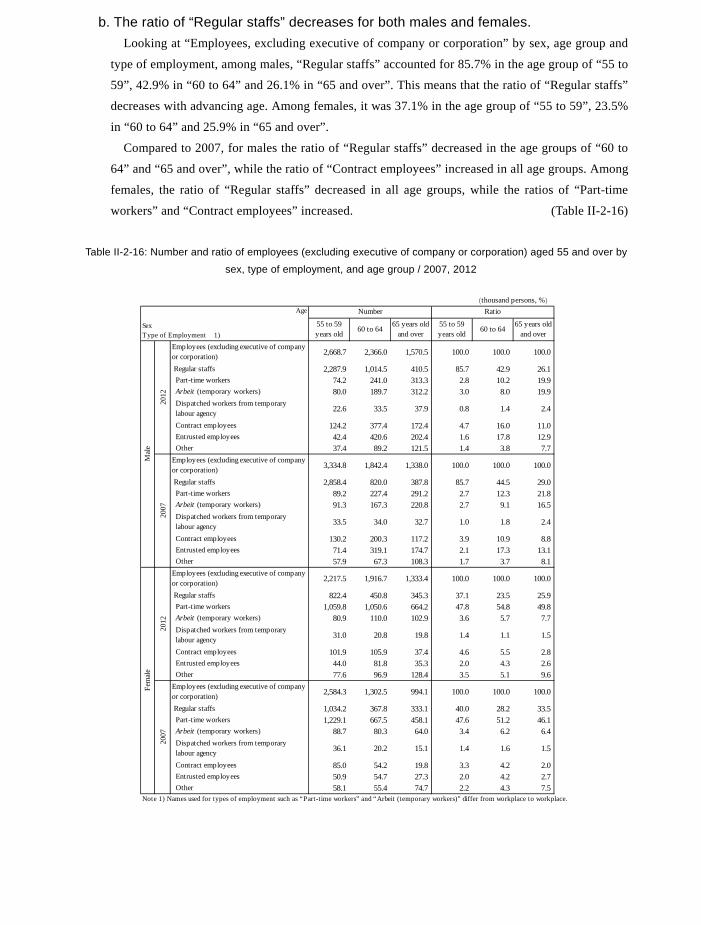
197
(2) Status in employment and type of employment a. The ratio of “Employees, excluding executive of company or corporation” increases
for both males and females. Looking at persons engaged in work by sex, age group and status in employment, the ratio of
“Employees, excluding executive of company or corporation” decreased with advancing age among
both males and females, while the ratios of “Self-employed workers” and “Family workers”
increased. In the age group of “60 to 64 years old”, “Employees, excluding executive of company
or corporation” accounted for 64.8% among males and 77.6% among females.
Compared to 2007, the ratio of “Employees, excluding executive of company or corporation”
increased among both males and females, while the ratios of “Self-employed workers” and “Family
workers” decreased. (Table II-2-15)
Table II-2-15: Number and ratio of persons engaged in work who are aged 55 and over by sex, status in employment,
and age group / 2007, 2012
(thousand persons, %)Number
55 to 59years old
60 to 6465 years old
and over55 to 59years old
60 to 6465 years old
and overTotal 3,538.5 3,651.2 3,977.6 100.0 100.0 100.0 Self-employed workers 482.0 771.6 1,621.6 13.6 21.1 40.8 Family workers 9.1 14.1 70.1 0.3 0.4 1.8 Employees 3,040.6 2,855.1 2,266.4 85.9 78.2 57.0 Executive of company or corporation 371.9 489.1 696.1 10.5 13.4 17.5 Employees (excluding executive of company or corporation)
2,668.7 2,366.0 1,570.5 75.4 64.8 39.5
Total 4,661.8 3,013.1 3,793.9 100.0 100.0 100.0 Self-employed workers 739.3 673.3 1,681.3 15.9 22.3 44.3 Family workers 12.3 11.0 87.1 0.3 0.4 2.3 Employees 3,898.4 2,323.4 2,014.6 83.6 77.1 53.1 Executive of company or corporation 563.6 481.0 676.5 12.1 16.0 17.8 Employees (excluding executive of company or corporation)
3,334.8 1,842.4 1,338.0 71.5 61.1 35.3
Total 2,603.0 2,469.0 2,576.0 100.0 100.0 100.0 Self-employed workers 142.6 217.7 502.7 5.5 8.8 19.5 Family workers 126.6 188.9 488.0 4.9 7.7 18.9 Employees 2,329.1 2,057.3 1,569.6 89.5 83.3 60.9 Executive of company or corporation 111.6 140.5 236.2 4.3 5.7 9.2 Employees (excluding executive of company or corporation)
2,217.5 1,916.7 1,333.4 85.2 77.6 51.8
Total 3,241.0 1,887.9 2,346.1 100.0 100.0 100.0 Self-employed workers 242.5 221.6 519.1 7.5 11.7 22.1 Family workers 226.8 225.7 597.3 7.0 12.0 25.5 Employees 2,765.9 1,436.9 1,221.2 85.3 76.1 52.1 Executive of company or corporation 181.7 134.4 227.1 5.6 7.1 9.7 Employees (excluding executive of company or corporation)
2,584.3 1,302.5 994.1 79.7 69.0 42.4
Fem
ale
2012
2007
Age RatioSexStatus in Employment
2012
2007
Mal
e
b. The ratio of “Regular staffs” decreases for both males and females. Looking at “Employees, excluding executive of company or corporation” by sex, age group and
type of employment, among males, “Regular staffs” accounted for 85.7% in the age group of “55 to
59”, 42.9% in “60 to 64” and 26.1% in “65 and over”. This means that the ratio of “Regular staffs”
decreases with advancing age. Among females, it was 37.1% in the age group of “55 to 59”, 23.5%
in “60 to 64” and 25.9% in “65 and over”.
Compared to 2007, for males the ratio of “Regular staffs” decreased in the age groups of “60 to
64” and “65 and over”, while the ratio of “Contract employees” increased in all age groups. Among
females, the ratio of “Regular staffs” decreased in all age groups, while the ratios of “Part-time
workers” and “Contract employees” increased. (Table II-2-16)
Table II-2-16: Number and ratio of employees (excluding executive of company or corporation) aged 55 and over by
sex, type of employment, and age group / 2007, 2012
Number
55 to 59years old
60 to 6465 years old
and over55 to 59years old
60 to 6465 years old
and over
Employees (excluding executive of companyor corporation) 2,668.7 2,366.0 1,570.5 100.0 100.0 100.0
Regular staffs 2,287.9 1,014.5 410.5 85.7 42.9 26.1 Part-time workers 74.2 241.0 313.3 2.8 10.2 19.9 Arbeit (temporary workers) 80.0 189.7 312.2 3.0 8.0 19.9 Dispatched workers from temporary labour agency 22.6 33.5 37.9 0.8 1.4 2.4
Contract employees 124.2 377.4 172.4 4.7 16.0 11.0 Entrusted employees 42.4 420.6 202.4 1.6 17.8 12.9 Other 37.4 89.2 121.5 1.4 3.8 7.7Employees (excluding executive of companyor corporation) 3,334.8 1,842.4 1,338.0 100.0 100.0 100.0
Regular staffs 2,858.4 820.0 387.8 85.7 44.5 29.0 Part-time workers 89.2 227.4 291.2 2.7 12.3 21.8 Arbeit (temporary workers) 91.3 167.3 220.8 2.7 9.1 16.5 Dispatched workers from temporary labour agency 33.5 34.0 32.7 1.0 1.8 2.4
Contract employees 130.2 200.3 117.2 3.9 10.9 8.8 Entrusted employees 71.4 319.1 174.7 2.1 17.3 13.1 Other 57.9 67.3 108.3 1.7 3.7 8.1Employees (excluding executive of companyor corporation) 2,217.5 1,916.7 1,333.4 100.0 100.0 100.0
Regular staffs 822.4 450.8 345.3 37.1 23.5 25.9 Part-time workers 1,059.8 1,050.6 664.2 47.8 54.8 49.8 Arbeit (temporary workers) 80.9 110.0 102.9 3.6 5.7 7.7 Dispatched workers from temporary labour agency 31.0 20.8 19.8 1.4 1.1 1.5
Contract employees 101.9 105.9 37.4 4.6 5.5 2.8 Entrusted employees 44.0 81.8 35.3 2.0 4.3 2.6 Other 77.6 96.9 128.4 3.5 5.1 9.6Employees (excluding executive of companyor corporation) 2,584.3 1,302.5 994.1 100.0 100.0 100.0
Regular staffs 1,034.2 367.8 333.1 40.0 28.2 33.5 Part-time workers 1,229.1 667.5 458.1 47.6 51.2 46.1 Arbeit (temporary workers) 88.7 80.3 64.0 3.4 6.2 6.4 Dispatched workers from temporary labour agency 36.1 20.2 15.1 1.4 1.6 1.5
Contract employees 85.0 54.2 19.8 3.3 4.2 2.0 Entrusted employees 50.9 54.7 27.3 2.0 4.2 2.7 Other 58.1 55.4 74.7 2.2 4.3 7.5
Fem
ale
2012
2007
2012
2007
Note 1) Names used for types of employment such as “Part-time workers” and “Arbeit (temporary workers)” differ from workplace to workplace.
(thousand persons, %)Age Ratio
SexType of Employment 1)
Mal
e
198
(3) Industry and occupation a. In the age group of “65 years old and over”, the ratio of “Agriculture and forestry” is
high among males, while “Wholesale and retail trade” is high among females. Viewing persons engaged in work by sex, age group and industrial major group, among males
aged “55 to 59”, the ratio of “Manufacturing” was highest with 19.9%, followed by “Construction”
(13.1%) and “Wholesale and retail trade” (11.9%). Also in the age group of “60 to 64”,
“Manufacturing” was highest with 16.1%, followed by “Construction” (14.5%) and “Wholesale and
retail trade” (11.8%). In “65 years old and over”, “Agriculture and forestry” was highest with
16.4%, followed by “Wholesale and retail trade” (13.5%), and “Manufacturing” (12.2%).
Among females aged “55 to 59”, the ratio of “Medical, health care and welfare” was highest with
19.9%, followed by “Wholesale and retail trade” (18.8%) and “Manufacturing” (12.9%). In the age
group of “60 to 64”, “Wholesale and retail trade” was highest with 18.5%, followed by “Medical,
health care and welfare” (15.7%) and “Manufacturing” (12.2%). In “65 years old and over”,
“Wholesale and retail trade” was highest with 17.3%, followed by “Agriculture and forestry”
(16.0%) and “Manufacturing” (10.6%). (Table II-2-17)
Table II-2-17: Number and ratio of persons engaged in work who are aged 55 and over by sex, industrial major group,
and age group / 2012
(thousand persons, %)
Number55 to 59years old
60 to 6465 years old
and over55 to 59years old
60 to 6465 years old
and overTotal 1) 3,538.5 3,651.2 3,977.6 100.0 100.0 100.0 AGRICULTURE AND FORESTRY 110.5 221.3 651.2 3.1 6.1 16.4 FISHERIES 15.3 20.0 36.6 0.4 0.5 0.9 MINING AND QUARRYING OF STONE AND GRAVEL 1.6 2.5 3.3 0.0 0.1 0.1 CONSTRUCTION 464.5 529.4 431.2 13.1 14.5 10.8 MANUFACTURING 705.7 586.5 484.8 19.9 16.1 12.2 ELECTRICITY, GAS, HEAT SUPPLY AND WATER 38.2 18.6 5.5 1.1 0.5 0.1 INFORMATION AND COMMUNICATIONS 79.8 48.2 27.5 2.3 1.3 0.7 TRANSPORT AND POSTAL ACTIVITIES 309.1 333.3 222.7 8.7 9.1 5.6 WHOLESALE AND RETAIL TRADE 420.9 431.8 537.5 11.9 11.8 13.5 FINANCE AND INSURANCE 90.2 60.8 26.7 2.5 1.7 0.7 REAL ESTATE AND GOODS RENTAL AND LEASING 66.2 115.9 203.9 1.9 3.2 5.1 SCIENTIFIC RESEARCH, PROFESSIONAL AND TECHNICAL SERVICES 151.5 177.2 176.6 4.3 4.9 4.4 ACCOMMODATIONS, EATING AND DRINKING SERVICES 101.4 128.7 131.2 2.9 3.5 3.3 LIVING-RELATED AND PERSONAL SERVICES AND AMUSEMENT SERVICES 63.0 88.4 156.1 1.8 2.4 3.9 EDUCATION, LEARNING SUPPORT 173.0 129.2 106.5 4.9 3.5 2.7 MEDICAL, HEALTH CARE AND WELFARE 140.6 151.5 159.9 4.0 4.1 4.0 COMPOUND SERVICES 35.6 21.9 6.0 1.0 0.6 0.2 SERVICES, N.E.C. 249.3 362.5 405.4 7.0 9.9 10.2 GOVERNMENT, EXCEPT ELSEWHERE CLASSIFIED 212.8 96.0 37.6 6.0 2.6 0.9Total 1) 2,603.0 2,469.0 2,575.9 100.0 100.0 100.0 AGRICULTURE AND FORESTRY 100.0 150.0 412.3 3.8 6.1 16.0 FISHERIES 6.8 7.2 13.8 0.3 0.3 0.5 MINING AND QUARRYING OF STONE AND GRAVEL 0.2 0.4 0.4 0.0 0.0 0.0 CONSTRUCTION 82.8 94.1 94.7 3.2 3.8 3.7 MANUFACTURING 335.5 302.3 272.3 12.9 12.2 10.6 ELECTRICITY, GAS, HEAT SUPPLY AND WATER 3.0 2.4 1.7 0.1 0.1 0.1 INFORMATION AND COMMUNICATIONS 15.8 8.2 6.5 0.6 0.3 0.3 TRANSPORT AND POSTAL ACTIVITIES 64.2 54.5 22.0 2.5 2.2 0.9 WHOLESALE AND RETAIL TRADE 488.8 457.7 445.0 18.8 18.5 17.3 FINANCE AND INSURANCE 58.8 39.5 25.5 2.3 1.6 1.0 REAL ESTATE AND GOODS RENTAL AND LEASING 50.4 63.5 140.5 1.9 2.6 5.5 SCIENTIFIC RESEARCH, PROFESSIONAL AND TECHNICAL SERVICES 57.3 42.8 39.9 2.2 1.7 1.5 ACCOMMODATIONS, EATING AND DRINKING SERVICES 217.6 261.5 241.9 8.4 10.6 9.4 LIVING-RELATED AND PERSONAL SERVICES AND AMUSEMENT SERVICES 115.7 158.4 191.1 4.4 6.4 7.4 EDUCATION, LEARNING SUPPORT 171.0 97.2 70.0 6.6 3.9 2.7 MEDICAL, HEALTH CARE AND WELFARE 517.7 388.1 222.6 19.9 15.7 8.6 COMPOUND SERVICES 21.3 10.8 2.8 0.8 0.4 0.1 SERVICES, N.E.C. 163.2 207.1 231.4 6.3 8.4 9.0 GOVERNMENT, EXCEPT ELSEWHERE CLASSIFIED 56.8 27.5 11.8 2.2 1.1 0.5
Note 1) Including "Industries unable to classify".
Fem
ale
Age RatioSexIndustry
Mal
e
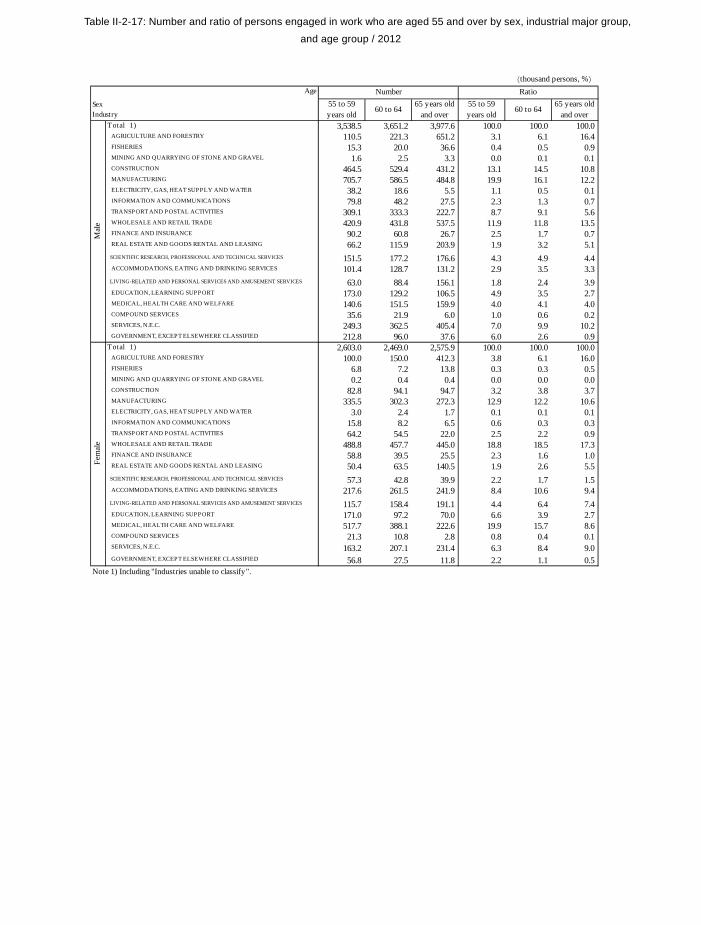
199
(3) Industry and occupation a. In the age group of “65 years old and over”, the ratio of “Agriculture and forestry” is
high among males, while “Wholesale and retail trade” is high among females. Viewing persons engaged in work by sex, age group and industrial major group, among males
aged “55 to 59”, the ratio of “Manufacturing” was highest with 19.9%, followed by “Construction”
(13.1%) and “Wholesale and retail trade” (11.9%). Also in the age group of “60 to 64”,
“Manufacturing” was highest with 16.1%, followed by “Construction” (14.5%) and “Wholesale and
retail trade” (11.8%). In “65 years old and over”, “Agriculture and forestry” was highest with
16.4%, followed by “Wholesale and retail trade” (13.5%), and “Manufacturing” (12.2%).
Among females aged “55 to 59”, the ratio of “Medical, health care and welfare” was highest with
19.9%, followed by “Wholesale and retail trade” (18.8%) and “Manufacturing” (12.9%). In the age
group of “60 to 64”, “Wholesale and retail trade” was highest with 18.5%, followed by “Medical,
health care and welfare” (15.7%) and “Manufacturing” (12.2%). In “65 years old and over”,
“Wholesale and retail trade” was highest with 17.3%, followed by “Agriculture and forestry”
(16.0%) and “Manufacturing” (10.6%). (Table II-2-17)
Table II-2-17: Number and ratio of persons engaged in work who are aged 55 and over by sex, industrial major group,
and age group / 2012
(thousand persons, %)
Number55 to 59years old
60 to 6465 years old
and over55 to 59years old
60 to 6465 years old
and overTotal 1) 3,538.5 3,651.2 3,977.6 100.0 100.0 100.0 AGRICULTURE AND FORESTRY 110.5 221.3 651.2 3.1 6.1 16.4 FISHERIES 15.3 20.0 36.6 0.4 0.5 0.9 MINING AND QUARRYING OF STONE AND GRAVEL 1.6 2.5 3.3 0.0 0.1 0.1 CONSTRUCTION 464.5 529.4 431.2 13.1 14.5 10.8 MANUFACTURING 705.7 586.5 484.8 19.9 16.1 12.2 ELECTRICITY, GAS, HEAT SUPPLY AND WATER 38.2 18.6 5.5 1.1 0.5 0.1 INFORMATION AND COMMUNICATIONS 79.8 48.2 27.5 2.3 1.3 0.7 TRANSPORT AND POSTAL ACTIVITIES 309.1 333.3 222.7 8.7 9.1 5.6 WHOLESALE AND RETAIL TRADE 420.9 431.8 537.5 11.9 11.8 13.5 FINANCE AND INSURANCE 90.2 60.8 26.7 2.5 1.7 0.7 REAL ESTATE AND GOODS RENTAL AND LEASING 66.2 115.9 203.9 1.9 3.2 5.1 SCIENTIFIC RESEARCH, PROFESSIONAL AND TECHNICAL SERVICES 151.5 177.2 176.6 4.3 4.9 4.4 ACCOMMODATIONS, EATING AND DRINKING SERVICES 101.4 128.7 131.2 2.9 3.5 3.3 LIVING-RELATED AND PERSONAL SERVICES AND AMUSEMENT SERVICES 63.0 88.4 156.1 1.8 2.4 3.9 EDUCATION, LEARNING SUPPORT 173.0 129.2 106.5 4.9 3.5 2.7 MEDICAL, HEALTH CARE AND WELFARE 140.6 151.5 159.9 4.0 4.1 4.0 COMPOUND SERVICES 35.6 21.9 6.0 1.0 0.6 0.2 SERVICES, N.E.C. 249.3 362.5 405.4 7.0 9.9 10.2 GOVERNMENT, EXCEPT ELSEWHERE CLASSIFIED 212.8 96.0 37.6 6.0 2.6 0.9Total 1) 2,603.0 2,469.0 2,575.9 100.0 100.0 100.0 AGRICULTURE AND FORESTRY 100.0 150.0 412.3 3.8 6.1 16.0 FISHERIES 6.8 7.2 13.8 0.3 0.3 0.5 MINING AND QUARRYING OF STONE AND GRAVEL 0.2 0.4 0.4 0.0 0.0 0.0 CONSTRUCTION 82.8 94.1 94.7 3.2 3.8 3.7 MANUFACTURING 335.5 302.3 272.3 12.9 12.2 10.6 ELECTRICITY, GAS, HEAT SUPPLY AND WATER 3.0 2.4 1.7 0.1 0.1 0.1 INFORMATION AND COMMUNICATIONS 15.8 8.2 6.5 0.6 0.3 0.3 TRANSPORT AND POSTAL ACTIVITIES 64.2 54.5 22.0 2.5 2.2 0.9 WHOLESALE AND RETAIL TRADE 488.8 457.7 445.0 18.8 18.5 17.3 FINANCE AND INSURANCE 58.8 39.5 25.5 2.3 1.6 1.0 REAL ESTATE AND GOODS RENTAL AND LEASING 50.4 63.5 140.5 1.9 2.6 5.5 SCIENTIFIC RESEARCH, PROFESSIONAL AND TECHNICAL SERVICES 57.3 42.8 39.9 2.2 1.7 1.5 ACCOMMODATIONS, EATING AND DRINKING SERVICES 217.6 261.5 241.9 8.4 10.6 9.4 LIVING-RELATED AND PERSONAL SERVICES AND AMUSEMENT SERVICES 115.7 158.4 191.1 4.4 6.4 7.4 EDUCATION, LEARNING SUPPORT 171.0 97.2 70.0 6.6 3.9 2.7 MEDICAL, HEALTH CARE AND WELFARE 517.7 388.1 222.6 19.9 15.7 8.6 COMPOUND SERVICES 21.3 10.8 2.8 0.8 0.4 0.1 SERVICES, N.E.C. 163.2 207.1 231.4 6.3 8.4 9.0 GOVERNMENT, EXCEPT ELSEWHERE CLASSIFIED 56.8 27.5 11.8 2.2 1.1 0.5
Note 1) Including "Industries unable to classify".
Fem
ale
Age RatioSexIndustry
Mal
e

200
b. In the age group of “65 years old and over”, the ratio of “Agriculture, forestry and fishery workers” is high among males, while “Service workers” is high among females.
Viewing persons engaged in work by sex, age group and occupational major group, among males
aged “55 to 59” the ratio of “Clerical workers” was highest with 17.3%, followed by
“Manufacturing process workers” (16.0%) and “Professional and engineering workers” (13.6%). In
the age group of “60 to 64”, “Manufacturing process workers” was highest with 14.7%, followed
by “Clerical workers” (13.1%) and “Professional and engineering workers” (10.9%). In “65 years
old and over”, “Agriculture, forestry and fishery workers” was highest with 17.2%, followed by
“Manufacturing process workers” (12.5%) and “Sales workers” (11.0%).
Among females aged “55 to 59”, the ratio of “Clerical workers” was highest with 23.6%,
followed by “Service workers” (20.4%) and “Professional and engineering workers” (14.9%). In
the age group of “60 to 64”, “Service workers” was highest with 23.5%, followed by “Clerical
workers” (19.1%) and “Carrying, cleaning, packaging, and related workers” (13.1%). In “65 years
old and over”, “Service workers” was highest with 19.8%, followed by “Agriculture, forestry and
fishery workers” (16.0%) and “Clerical workers” (14.7%). (Table II-2-18)
Table II-2-18: Number and ratio of persons engaged in work who are aged 55 and over by sex, occupational major
group, and age group / 2012
(thousand persons, %)Number
55 to 59years old
60 to 6465 years old
and over55 to 59years old
60 to 6465 years old
and overTotal 1) 3,538.5 3,651.2 3,977.6 100.0 100.0 100.0
ADMINISTRATIVE AND MANAGERIAL WORKERS 206.1 236.6 345.2 5.8 6.5 8.7
PROFESSIONAL AND ENGINEERING WORKERS 480.5 397.0 367.6 13.6 10.9 9.2
CLERICAL WORKERS 611.3 479.6 248.1 17.3 13.1 6.2
SALES WORKERS 404.6 367.9 436.9 11.4 10.1 11.0
SERVICE WORKERS 158.8 227.1 307.8 4.5 6.2 7.7
SECURITY WORKERS 128.0 113.3 103.7 3.6 3.1 2.6
AGRICULTURE, FORESTRY AND FISHERY WORKERS 122.9 242.3 684.9 3.5 6.6 17.2
MANUFACTURING PROCESS WORKERS 565.6 535.9 497.1 16.0 14.7 12.5
TRANSPORT AND MACHINE OPERATION WORKERS 272.7 323.7 236.2 7.7 8.9 5.9
CONSTRUCTION AND MINING WORKERS 311.2 346.7 272.6 8.8 9.5 6.9
CARRYING, CLEANING, PACKAGING, AND RELATED WORKERS 173.2 262.0 311.9 4.9 7.2 7.8Total 1) 2,603.0 2,469.0 2,575.9 100.0 100.0 100.0
ADMINISTRATIVE AND MANAGERIAL WORKERS 24.4 36.2 75.2 0.9 1.5 2.9
PROFESSIONAL AND ENGINEERING WORKERS 388.8 227.4 141.4 14.9 9.2 5.5
CLERICAL WORKERS 614.0 471.3 379.9 23.6 19.1 14.7
SALES WORKERS 289.5 280.1 342.7 11.1 11.3 13.3
SERVICE WORKERS 531.3 580.5 510.9 20.4 23.5 19.8
SECURITY WORKERS 5.4 4.2 2.6 0.2 0.2 0.1
AGRICULTURE, FORESTRY AND FISHERY WORKERS 95.0 143.9 412.4 3.6 5.8 16.0
MANUFACTURING PROCESS WORKERS 305.1 300.3 236.4 11.7 12.2 9.2
TRANSPORT AND MACHINE OPERATION WORKERS 6.1 5.7 2.9 0.2 0.2 0.1
CONSTRUCTION AND MINING WORKERS 8.5 8.7 7.4 0.3 0.4 0.3
CARRYING, CLEANING, PACKAGING, AND RELATED WORKERS 267.2 323.2 338.9 10.3 13.1 13.2
Note 1) Including "Workers not classifiable by occupation".
Fem
ale
Age Ratio
SexOccupation
Mal
e
(4) Wish for work The ratio of “Wishing to continue the present job” decreases in all age groups
among both males and females. Viewing persons engaged in work by sex, age group, and wish for work, “Wishing to continue the
present job” accounted for more than 80% in the age groups of “55 to 59” and “60 to 64” among both
males and females. On the other hand, the ratio of “Wishing to switch to another job” was 6.6% in
“55 to 59”, 5.3% in “60 to 64”, and 2.5% in “65 and over” among males, while the ratio for females
was 5.7% in “55 to 59”, 3.6% in “60 to 64” and 1.9% in “65 and over”.
Compared to 2007, the ratio of “Wishing to continue the present job” decreased in all age groups
among both males and females. (Table II-2-19)
Table II-2-19: Number and ratio of persons engaged in work who are aged 55 and over by sex, wish for work, and
age group / 2007, 2012
Number
55 to 59years old
60 to 6465 years old
and over55 to 59years old
60 to 6465 years old
and over
Total 3,538.5 3,651.2 3,977.6 100.0 100.0 100.0 Wishing to continue the present job 3,041.9 3,035.2 3,177.2 86.0 83.1 79.9 Wishing to have an additional job 142.5 127.9 90.9 4.0 3.5 2.3 Wishing to switch to another job 234.8 195.0 98.8 6.6 5.3 2.5 Wishing to stop working 94.2 265.0 559.5 2.7 7.3 14.1Total 4,661.8 3,013.1 3,793.9 100.0 100.0 100.0 Wishing to continue the present job 4,043.8 2,553.9 3,155.4 86.7 84.8 83.2 Wishing to have an additional job 144.0 80.9 51.4 3.1 2.7 1.4 Wishing to switch to another job 318.1 161.2 79.9 6.8 5.3 2.1 Wishing to stop working 121.9 189.2 463.9 2.6 6.3 12.2Total 2,603.0 2,469.0 2,576.0 100.0 100.0 100.0
Wishing to continue the present job 2,220.3 2,062.6 2,011.5 85.3 83.5 78.1
Wishing to have an additional job 92.6 55.0 33.5 3.6 2.2 1.3
Wishing to switch to another job 148.7 89.1 48.0 5.7 3.6 1.9
Wishing to stop working 127.1 242.1 434.5 4.9 9.8 16.9Total 3,241.0 1,887.9 2,346.1 100.0 100.0 100.0
Wishing to continue the present job 2,768.8 1,583.4 1,891.7 85.4 83.9 80.6
Wishing to have an additional job 85.8 37.6 19.9 2.6 2.0 0.8
Wishing to switch to another job 184.2 71.6 33.6 5.7 3.8 1.4
Wishing to stop working 176.7 177.4 364.6 5.5 9.4 15.5
Fem
ale
2012
2007
2012
2007
Mal
e
(thousand persons, %)Age Ratio
SexWish for Work
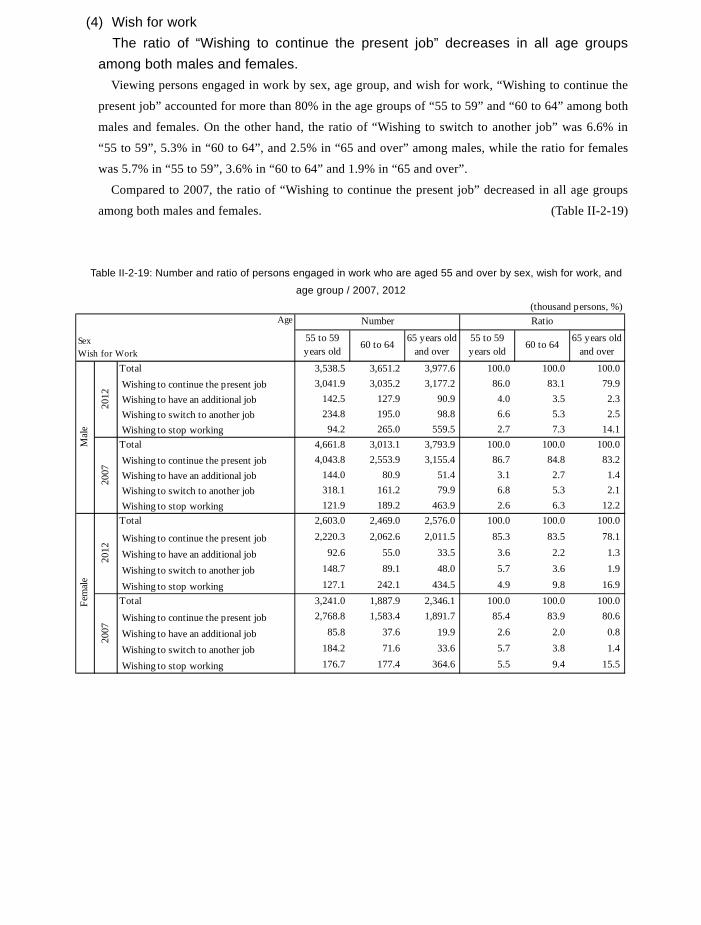
201
b. In the age group of “65 years old and over”, the ratio of “Agriculture, forestry and fishery workers” is high among males, while “Service workers” is high among females.
Viewing persons engaged in work by sex, age group and occupational major group, among males
aged “55 to 59” the ratio of “Clerical workers” was highest with 17.3%, followed by
“Manufacturing process workers” (16.0%) and “Professional and engineering workers” (13.6%). In
the age group of “60 to 64”, “Manufacturing process workers” was highest with 14.7%, followed
by “Clerical workers” (13.1%) and “Professional and engineering workers” (10.9%). In “65 years
old and over”, “Agriculture, forestry and fishery workers” was highest with 17.2%, followed by
“Manufacturing process workers” (12.5%) and “Sales workers” (11.0%).
Among females aged “55 to 59”, the ratio of “Clerical workers” was highest with 23.6%,
followed by “Service workers” (20.4%) and “Professional and engineering workers” (14.9%). In
the age group of “60 to 64”, “Service workers” was highest with 23.5%, followed by “Clerical
workers” (19.1%) and “Carrying, cleaning, packaging, and related workers” (13.1%). In “65 years
old and over”, “Service workers” was highest with 19.8%, followed by “Agriculture, forestry and
fishery workers” (16.0%) and “Clerical workers” (14.7%). (Table II-2-18)
Table II-2-18: Number and ratio of persons engaged in work who are aged 55 and over by sex, occupational major
group, and age group / 2012
(thousand persons, %)Number
55 to 59years old
60 to 6465 years old
and over55 to 59years old
60 to 6465 years old
and overTotal 1) 3,538.5 3,651.2 3,977.6 100.0 100.0 100.0
ADMINISTRATIVE AND MANAGERIAL WORKERS 206.1 236.6 345.2 5.8 6.5 8.7
PROFESSIONAL AND ENGINEERING WORKERS 480.5 397.0 367.6 13.6 10.9 9.2
CLERICAL WORKERS 611.3 479.6 248.1 17.3 13.1 6.2
SALES WORKERS 404.6 367.9 436.9 11.4 10.1 11.0
SERVICE WORKERS 158.8 227.1 307.8 4.5 6.2 7.7
SECURITY WORKERS 128.0 113.3 103.7 3.6 3.1 2.6
AGRICULTURE, FORESTRY AND FISHERY WORKERS 122.9 242.3 684.9 3.5 6.6 17.2
MANUFACTURING PROCESS WORKERS 565.6 535.9 497.1 16.0 14.7 12.5
TRANSPORT AND MACHINE OPERATION WORKERS 272.7 323.7 236.2 7.7 8.9 5.9
CONSTRUCTION AND MINING WORKERS 311.2 346.7 272.6 8.8 9.5 6.9
CARRYING, CLEANING, PACKAGING, AND RELATED WORKERS 173.2 262.0 311.9 4.9 7.2 7.8Total 1) 2,603.0 2,469.0 2,575.9 100.0 100.0 100.0
ADMINISTRATIVE AND MANAGERIAL WORKERS 24.4 36.2 75.2 0.9 1.5 2.9
PROFESSIONAL AND ENGINEERING WORKERS 388.8 227.4 141.4 14.9 9.2 5.5
CLERICAL WORKERS 614.0 471.3 379.9 23.6 19.1 14.7
SALES WORKERS 289.5 280.1 342.7 11.1 11.3 13.3
SERVICE WORKERS 531.3 580.5 510.9 20.4 23.5 19.8
SECURITY WORKERS 5.4 4.2 2.6 0.2 0.2 0.1
AGRICULTURE, FORESTRY AND FISHERY WORKERS 95.0 143.9 412.4 3.6 5.8 16.0
MANUFACTURING PROCESS WORKERS 305.1 300.3 236.4 11.7 12.2 9.2
TRANSPORT AND MACHINE OPERATION WORKERS 6.1 5.7 2.9 0.2 0.2 0.1
CONSTRUCTION AND MINING WORKERS 8.5 8.7 7.4 0.3 0.4 0.3
CARRYING, CLEANING, PACKAGING, AND RELATED WORKERS 267.2 323.2 338.9 10.3 13.1 13.2
Note 1) Including "Workers not classifiable by occupation".
Fem
ale
Age Ratio
SexOccupation
Mal
e
(4) Wish for work The ratio of “Wishing to continue the present job” decreases in all age groups
among both males and females. Viewing persons engaged in work by sex, age group, and wish for work, “Wishing to continue the
present job” accounted for more than 80% in the age groups of “55 to 59” and “60 to 64” among both
males and females. On the other hand, the ratio of “Wishing to switch to another job” was 6.6% in
“55 to 59”, 5.3% in “60 to 64”, and 2.5% in “65 and over” among males, while the ratio for females
was 5.7% in “55 to 59”, 3.6% in “60 to 64” and 1.9% in “65 and over”.
Compared to 2007, the ratio of “Wishing to continue the present job” decreased in all age groups
among both males and females. (Table II-2-19)
Table II-2-19: Number and ratio of persons engaged in work who are aged 55 and over by sex, wish for work, and
age group / 2007, 2012
Number
55 to 59years old
60 to 6465 years old
and over55 to 59years old
60 to 6465 years old
and over
Total 3,538.5 3,651.2 3,977.6 100.0 100.0 100.0 Wishing to continue the present job 3,041.9 3,035.2 3,177.2 86.0 83.1 79.9 Wishing to have an additional job 142.5 127.9 90.9 4.0 3.5 2.3 Wishing to switch to another job 234.8 195.0 98.8 6.6 5.3 2.5 Wishing to stop working 94.2 265.0 559.5 2.7 7.3 14.1Total 4,661.8 3,013.1 3,793.9 100.0 100.0 100.0 Wishing to continue the present job 4,043.8 2,553.9 3,155.4 86.7 84.8 83.2 Wishing to have an additional job 144.0 80.9 51.4 3.1 2.7 1.4 Wishing to switch to another job 318.1 161.2 79.9 6.8 5.3 2.1 Wishing to stop working 121.9 189.2 463.9 2.6 6.3 12.2Total 2,603.0 2,469.0 2,576.0 100.0 100.0 100.0
Wishing to continue the present job 2,220.3 2,062.6 2,011.5 85.3 83.5 78.1
Wishing to have an additional job 92.6 55.0 33.5 3.6 2.2 1.3
Wishing to switch to another job 148.7 89.1 48.0 5.7 3.6 1.9
Wishing to stop working 127.1 242.1 434.5 4.9 9.8 16.9Total 3,241.0 1,887.9 2,346.1 100.0 100.0 100.0
Wishing to continue the present job 2,768.8 1,583.4 1,891.7 85.4 83.9 80.6
Wishing to have an additional job 85.8 37.6 19.9 2.6 2.0 0.8
Wishing to switch to another job 184.2 71.6 33.6 5.7 3.8 1.4
Wishing to stop working 176.7 177.4 364.6 5.5 9.4 15.5
Fem
ale
2012
2007
2012
2007
Mal
e
(thousand persons, %)Age Ratio
SexWish for Work
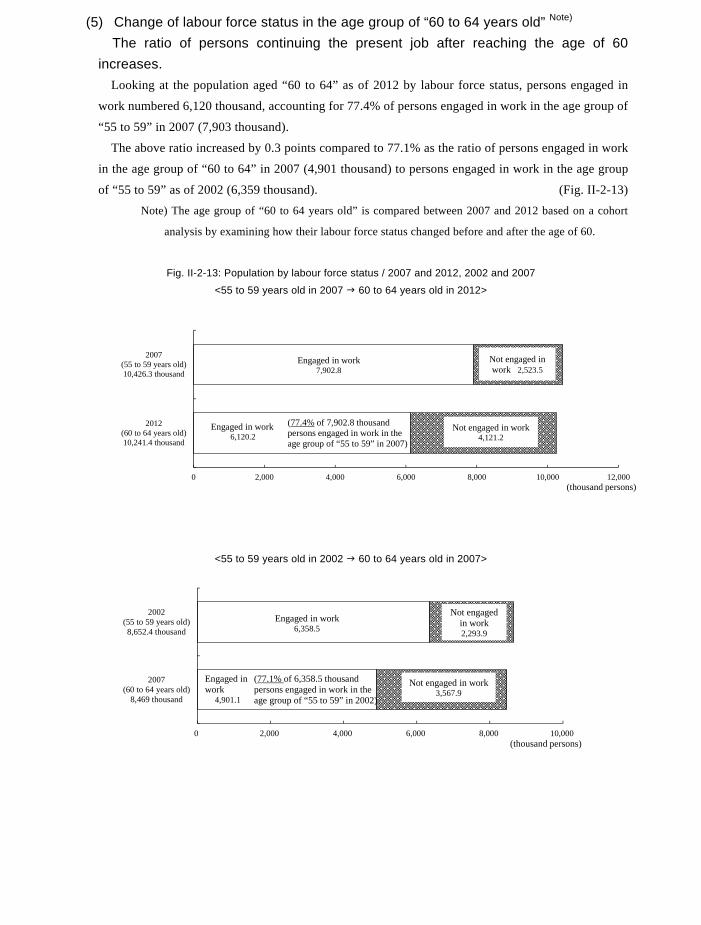
202
(5) Change of labour force status in the age group of “60 to 64 years old” Note) The ratio of persons continuing the present job after reaching the age of 60
increases. Looking at the population aged “60 to 64” as of 2012 by labour force status, persons engaged in
work numbered 6,120 thousand, accounting for 77.4% of persons engaged in work in the age group of
“55 to 59” in 2007 (7,903 thousand).
The above ratio increased by 0.3 points compared to 77.1% as the ratio of persons engaged in work
in the age group of “60 to 64” in 2007 (4,901 thousand) to persons engaged in work in the age group
of “55 to 59” as of 2002 (6,359 thousand). (Fig. II-2-13) Note) The age group of “60 to 64 years old” is compared between 2007 and 2012 based on a cohort
analysis by examining how their labour force status changed before and after the age of 60.
Fig. II-2-13: Population by labour force status / 2007 and 2012, 2002 and 2007
<55 to 59 years old in 2007 60 to 64 years old in 2012>
<55 to 59 years old in 2002 60 to 64 years old in 2007>
0 2,000 4,000 6,000 8,000 10,000
2007(60 to 64 years old)
8,469 thousand
2002(55 to 59 years old)8,652.4 thousand
(77.1% of 6,358.5 thousand persons engaged in work in the age group of “55 to 59” in 2002)
Engaged in work6,358.5
Engaged in work
4,901.1
Not engaged in work2,293.9
Not engaged in work3,567.9
(thousand persons)
0 2,000 4,000 6,000 8,000 10,000 12,000
2012(60 to 64 years old)10,241.4 thousand
2007(55 to 59 years old)10,426.3 thousand
(77.4% of 7,902.8 thousand persons engaged in work in the age group of “55 to 59” in 2007)
Engaged in work7,902.8
Not engaged in work 2,523.5
Engaged in work6,120.2
Not engaged in work4,121.2
(thousand persons)
5. Business starters (persons who started their present business by themselves)
(1) Sex and age a. Males account for 82.1% of all business starters, while females 17.9%.
Of persons engaged in work, looking at persons who started their present business by themselves
(referred to below as “business starters”) in terms of “Self-employed workers” and “Executive of
company or corporation”, there were 5,138 thousand business starters, consisting of 3,682 thousand
“Self-employed workers” and 1,456 thousand “Executives of company or corporation”.
By sex, males numbered 4,221 thousand and females numbered 918 thousand, males thus
accounting for more than 80% of the total.
Compared to 2007, the number of business starters decreased for both sexes (down by 626
thousand for males and 146 thousand for females). (Table II-2-20)
Table II-2-20: Number and ratio of business starters by sex / 2007, 2012
b. The ratio of business starters is highest in “60 to 64 years old” for both sexes. Looking at business starters by sex and age, the ratio of males in the age group of “60 to 64 years
old” was highest with 752 thousand (17.8% of all male business starters), followed by “65 to 69”
with 562 thousand (13.3%) and “55 to 59” with 496 thousand (11.8%).
For females, the ratio of “60 to 64 years old” was highest with 152 thousand (16.5% of all female
business starters), followed by “65 to 69” with 112 thousand (12.2%) and “55 to 59” with 102
thousand (11.1%). (Table II-2-21, Fig. II-2-14)
(thousand persons, %, points)
Sex
All business startersSelf-employed workers
as business starters
Executives of companyor corporation asbusiness starters
All business startersSelf-employed workers
as business starters
Executives of companyor corporation asbusiness starters
Both sexes 5,138.2 3,682.4 1,455.8 100.0 100.0 100.0 Male 4,220.7 2,941.7 1,279.0 82.1 79.9 87.9 Female 917.5 740.7 176.8 17.9 20.1 12.1
Both sexes 5,909.7 4,246.3 1,663.4 100.0 100.0 100.0 Male 4,846.7 3,377.0 1,469.7 82.0 79.5 88.4 Female 1,063.1 869.4 193.7 18.0 20.5 11.6
Both sexes -771.5 -563.9 -207.6 - - -
Male -626.0 -435.3 -190.7 0.1 0.4 -0.5 Female -145.6 -128.7 -16.9 -0.1 -0.4 0.5
Number Ratio
Cha
nge
2007
2012
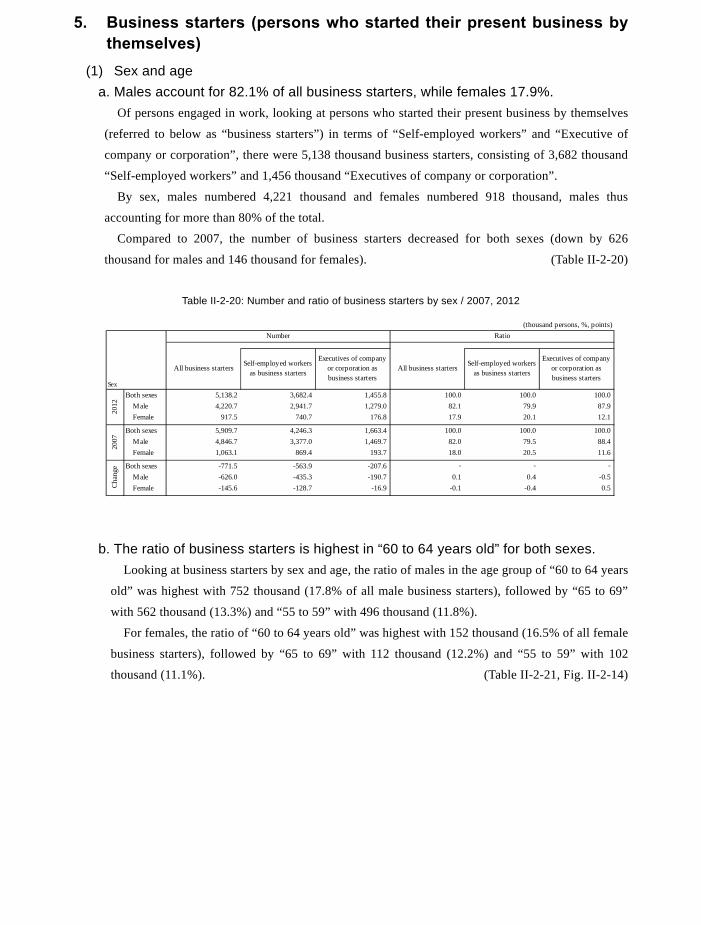
203
(5) Change of labour force status in the age group of “60 to 64 years old” Note) The ratio of persons continuing the present job after reaching the age of 60
increases. Looking at the population aged “60 to 64” as of 2012 by labour force status, persons engaged in
work numbered 6,120 thousand, accounting for 77.4% of persons engaged in work in the age group of
“55 to 59” in 2007 (7,903 thousand).
The above ratio increased by 0.3 points compared to 77.1% as the ratio of persons engaged in work
in the age group of “60 to 64” in 2007 (4,901 thousand) to persons engaged in work in the age group
of “55 to 59” as of 2002 (6,359 thousand). (Fig. II-2-13) Note) The age group of “60 to 64 years old” is compared between 2007 and 2012 based on a cohort
analysis by examining how their labour force status changed before and after the age of 60.
Fig. II-2-13: Population by labour force status / 2007 and 2012, 2002 and 2007
<55 to 59 years old in 2007 60 to 64 years old in 2012>
<55 to 59 years old in 2002 60 to 64 years old in 2007>
0 2,000 4,000 6,000 8,000 10,000
2007(60 to 64 years old)
8,469 thousand
2002(55 to 59 years old)8,652.4 thousand
(77.1% of 6,358.5 thousand persons engaged in work in the age group of “55 to 59” in 2002)
Engaged in work6,358.5
Engaged in work
4,901.1
Not engaged in work2,293.9
Not engaged in work3,567.9
(thousand persons)
0 2,000 4,000 6,000 8,000 10,000 12,000
2012(60 to 64 years old)10,241.4 thousand
2007(55 to 59 years old)10,426.3 thousand
(77.4% of 7,902.8 thousand persons engaged in work in the age group of “55 to 59” in 2007)
Engaged in work7,902.8
Not engaged in work 2,523.5
Engaged in work6,120.2
Not engaged in work4,121.2
(thousand persons)
5. Business starters (persons who started their present business by themselves)
(1) Sex and age a. Males account for 82.1% of all business starters, while females 17.9%.
Of persons engaged in work, looking at persons who started their present business by themselves
(referred to below as “business starters”) in terms of “Self-employed workers” and “Executive of
company or corporation”, there were 5,138 thousand business starters, consisting of 3,682 thousand
“Self-employed workers” and 1,456 thousand “Executives of company or corporation”.
By sex, males numbered 4,221 thousand and females numbered 918 thousand, males thus
accounting for more than 80% of the total.
Compared to 2007, the number of business starters decreased for both sexes (down by 626
thousand for males and 146 thousand for females). (Table II-2-20)
Table II-2-20: Number and ratio of business starters by sex / 2007, 2012
b. The ratio of business starters is highest in “60 to 64 years old” for both sexes. Looking at business starters by sex and age, the ratio of males in the age group of “60 to 64 years
old” was highest with 752 thousand (17.8% of all male business starters), followed by “65 to 69”
with 562 thousand (13.3%) and “55 to 59” with 496 thousand (11.8%).
For females, the ratio of “60 to 64 years old” was highest with 152 thousand (16.5% of all female
business starters), followed by “65 to 69” with 112 thousand (12.2%) and “55 to 59” with 102
thousand (11.1%). (Table II-2-21, Fig. II-2-14)
(thousand persons, %, points)
Sex
All business startersSelf-employed workers
as business starters
Executives of companyor corporation asbusiness starters
All business startersSelf-employed workers
as business starters
Executives of companyor corporation asbusiness starters
Both sexes 5,138.2 3,682.4 1,455.8 100.0 100.0 100.0 Male 4,220.7 2,941.7 1,279.0 82.1 79.9 87.9 Female 917.5 740.7 176.8 17.9 20.1 12.1
Both sexes 5,909.7 4,246.3 1,663.4 100.0 100.0 100.0 Male 4,846.7 3,377.0 1,469.7 82.0 79.5 88.4 Female 1,063.1 869.4 193.7 18.0 20.5 11.6
Both sexes -771.5 -563.9 -207.6 - - -
Male -626.0 -435.3 -190.7 0.1 0.4 -0.5 Female -145.6 -128.7 -16.9 -0.1 -0.4 0.5
Number Ratio
Cha
nge
2007
2012
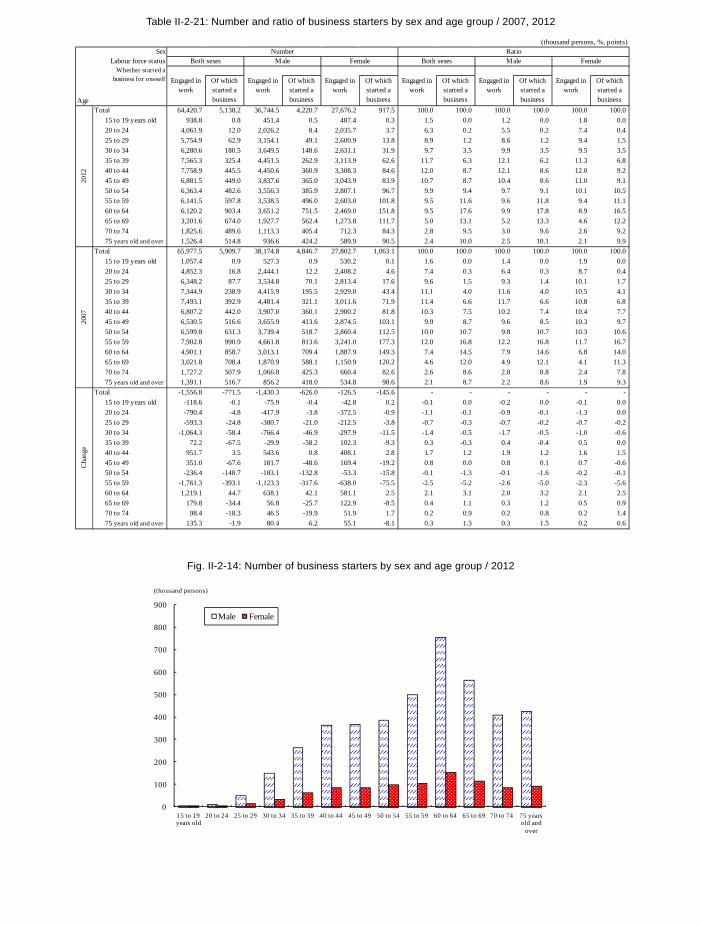
204
Table II-2-21: Number and ratio of business starters by sex and age group / 2007, 2012
Fig. II-2-14: Number of business starters by sex and age group / 2012
(thousand persons, %, points)Sex
Labour force status
Age
Of whichstarted abusiness
Of whichstarted abusiness
Of whichstarted abusiness
Of whichstarted abusiness
Of whichstarted abusiness
Of whichstarted abusiness
Total 64,420.7 5,138.2 36,744.5 4,220.7 27,676.2 917.5 100.0 100.0 100.0 100.0 100.0 100.015 to 19 years old 938.8 0.8 451.4 0.5 487.4 0.3 1.5 0.0 1.2 0.0 1.8 0.020 to 24 4,061.9 12.0 2,026.2 8.4 2,035.7 3.7 6.3 0.2 5.5 0.2 7.4 0.425 to 29 5,754.9 62.9 3,154.1 49.1 2,600.9 13.8 8.9 1.2 8.6 1.2 9.4 1.530 to 34 6,280.6 180.5 3,649.5 148.6 2,631.1 31.9 9.7 3.5 9.9 3.5 9.5 3.535 to 39 7,565.3 325.4 4,451.5 262.9 3,113.9 62.6 11.7 6.3 12.1 6.2 11.3 6.840 to 44 7,758.9 445.5 4,450.6 360.9 3,308.3 84.6 12.0 8.7 12.1 8.6 12.0 9.245 to 49 6,881.5 449.0 3,837.6 365.0 3,043.9 83.9 10.7 8.7 10.4 8.6 11.0 9.150 to 54 6,363.4 482.6 3,556.3 385.9 2,807.1 96.7 9.9 9.4 9.7 9.1 10.1 10.555 to 59 6,141.5 597.8 3,538.5 496.0 2,603.0 101.8 9.5 11.6 9.6 11.8 9.4 11.160 to 64 6,120.2 903.4 3,651.2 751.5 2,469.0 151.8 9.5 17.6 9.9 17.8 8.9 16.565 to 69 3,201.6 674.0 1,927.7 562.4 1,273.8 111.7 5.0 13.1 5.2 13.3 4.6 12.270 to 74 1,825.6 489.6 1,113.3 405.4 712.3 84.3 2.8 9.5 3.0 9.6 2.6 9.275 years old and over 1,526.4 514.8 936.6 424.2 589.9 90.5 2.4 10.0 2.5 10.1 2.1 9.9
Total 65,977.5 5,909.7 38,174.8 4,846.7 27,802.7 1,063.1 100.0 100.0 100.0 100.0 100.0 100.015 to 19 years old 1,057.4 0.9 527.3 0.9 530.2 0.1 1.6 0.0 1.4 0.0 1.9 0.020 to 24 4,852.3 16.8 2,444.1 12.2 2,408.2 4.6 7.4 0.3 6.4 0.3 8.7 0.425 to 29 6,348.2 87.7 3,534.8 70.1 2,813.4 17.6 9.6 1.5 9.3 1.4 10.1 1.730 to 34 7,344.9 238.9 4,415.9 195.5 2,929.0 43.4 11.1 4.0 11.6 4.0 10.5 4.135 to 39 7,493.1 392.9 4,481.4 321.1 3,011.6 71.9 11.4 6.6 11.7 6.6 10.8 6.840 to 44 6,807.2 442.0 3,907.0 360.1 2,900.2 81.8 10.3 7.5 10.2 7.4 10.4 7.745 to 49 6,530.5 516.6 3,655.9 413.6 2,874.5 103.1 9.9 8.7 9.6 8.5 10.3 9.750 to 54 6,599.8 631.3 3,739.4 518.7 2,860.4 112.5 10.0 10.7 9.8 10.7 10.3 10.655 to 59 7,902.8 990.9 4,661.8 813.6 3,241.0 177.3 12.0 16.8 12.2 16.8 11.7 16.760 to 64 4,901.1 858.7 3,013.1 709.4 1,887.9 149.3 7.4 14.5 7.9 14.6 6.8 14.065 to 69 3,021.8 708.4 1,870.9 588.1 1,150.9 120.2 4.6 12.0 4.9 12.1 4.1 11.370 to 74 1,727.2 507.9 1,066.8 425.3 660.4 82.6 2.6 8.6 2.8 8.8 2.4 7.875 years old and over 1,391.1 516.7 856.2 418.0 534.8 98.6 2.1 8.7 2.2 8.6 1.9 9.3
Total -1,556.8 -771.5 -1,430.3 -626.0 -126.5 -145.6 - - - - - - 15 to 19 years old -118.6 -0.1 -75.9 -0.4 -42.8 0.2 -0.1 0.0 -0.2 0.0 -0.1 0.020 to 24 -790.4 -4.8 -417.9 -3.8 -372.5 -0.9 -1.1 -0.1 -0.9 -0.1 -1.3 0.025 to 29 -593.3 -24.8 -380.7 -21.0 -212.5 -3.8 -0.7 -0.3 -0.7 -0.2 -0.7 -0.230 to 34 -1,064.3 -58.4 -766.4 -46.9 -297.9 -11.5 -1.4 -0.5 -1.7 -0.5 -1.0 -0.635 to 39 72.2 -67.5 -29.9 -58.2 102.3 -9.3 0.3 -0.3 0.4 -0.4 0.5 0.040 to 44 951.7 3.5 543.6 0.8 408.1 2.8 1.7 1.2 1.9 1.2 1.6 1.545 to 49 351.0 -67.6 181.7 -48.6 169.4 -19.2 0.8 0.0 0.8 0.1 0.7 -0.650 to 54 -236.4 -148.7 -183.1 -132.8 -53.3 -15.8 -0.1 -1.3 -0.1 -1.6 -0.2 -0.155 to 59 -1,761.3 -393.1 -1,123.3 -317.6 -638.0 -75.5 -2.5 -5.2 -2.6 -5.0 -2.3 -5.660 to 64 1,219.1 44.7 638.1 42.1 581.1 2.5 2.1 3.1 2.0 3.2 2.1 2.565 to 69 179.8 -34.4 56.8 -25.7 122.9 -8.5 0.4 1.1 0.3 1.2 0.5 0.970 to 74 98.4 -18.3 46.5 -19.9 51.9 1.7 0.2 0.9 0.2 0.8 0.2 1.475 years old and over 135.3 -1.9 80.4 6.2 55.1 -8.1 0.3 1.3 0.3 1.5 0.2 0.6
Engaged inwork
Engaged inwork
Engaged inwork
Number RatioBoth sexes Male Male FemaleBoth sexes
Whether started abusiness for oneself
2007
Cha
nge
Engaged inwork
Engaged inwork
Female
Engaged inwork
2012
0
100
200
300
400
500
600
700
800
900
15 to 19 years old
20 to 24 25 to 29 30 to 34 35 to 39 40 to 44 45 to 49 50 to 54 55 to 59 60 to 64 65 to 69 70 to 74 75 years old and
over
(thousand persons)
Male Female
c. Business starters account for 62.3% of all “Self-employed workers” and 41.9% of all “Executives of company or corporation”.
Looking at business starters by status in employment, “Self-employed workers” numbered 3,682
thousand (62.3% of all “Self-employed workers”), and “Executives of company or corporation”
numbered 1,456 thousand (41.9% of all “Executives of company or corporation).
By sex, for males, business starters accounted for 66.1% of “Self-employed workers” and 47.9%
of “Executives of company or corporation”, while for females, business starters accounted for
50.8% of “Self-employed workers” and 22.0% of “Executive of company or corporation”.
Compared to 2007, the ratio of business starters to all “Self-employed workers” decreased by 2.1
points among males, while it increased by 0.4 points among females. The ratio of business starters
to all “Executives of company or corporation” increased by 0.2 points among males and 1.2 points
among females. (Table II-2-22)
Table II-2-22: Number and ratio of business starters by sex and status in employment / 2007, 2012
(thousand persons, %, points)
Sex Number Ratio Number RatioBoth sexes 5,909.6 3,682.4 62.3 3,471.4 1,455.8 41.9
Male 4,450.1 2,941.7 66.1 2,667.7 1,279.0 47.9
Female 1,459.4 740.7 50.8 803.7 176.8 22.0
Both sexes 6,675.2 4,246.3 63.6 4,011.7 1,663.4 41.5
Male 4,950.8 3,377.0 68.2 3,079.1 1,469.7 47.7
Female 1,724.3 869.4 50.4 932.7 193.7 20.8
Both sexes -765.6 -563.9 -1.3 -540.3 -207.6 0.4
Male -500.7 -435.3 -2.1 -411.4 -190.7 0.2
Female -264.9 -128.7 0.4 -129.0 -16.9 1.2Cha
nge
Self-employedworkers
Executives ofcompany orcorporation
Of which started a business Of which started a business
2012
2007
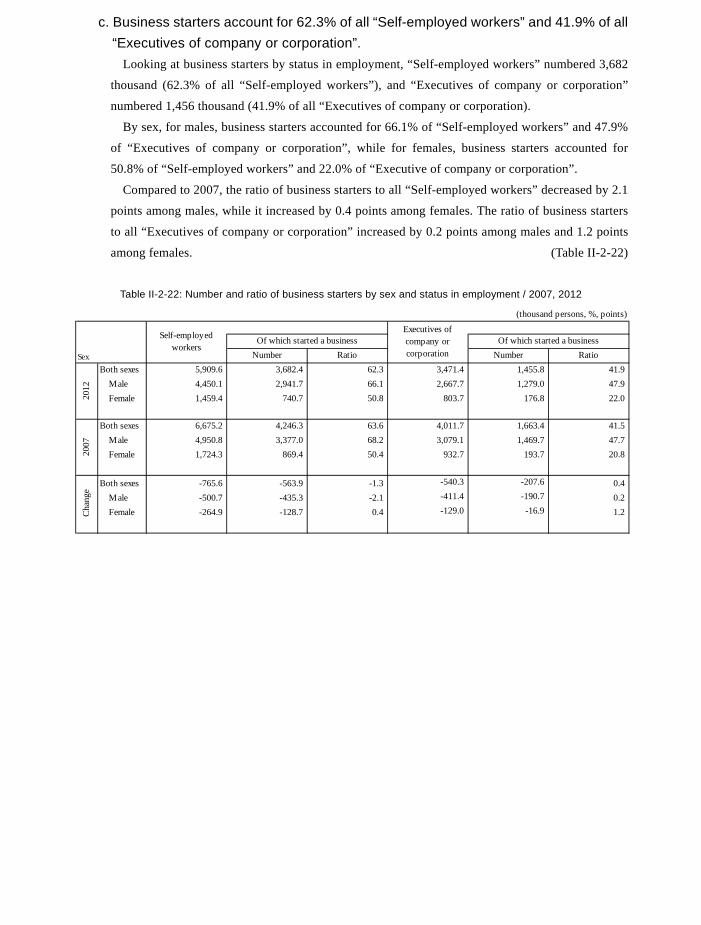
205
Table II-2-21: Number and ratio of business starters by sex and age group / 2007, 2012
Fig. II-2-14: Number of business starters by sex and age group / 2012
(thousand persons, %, points)Sex
Labour force status
Age
Of whichstarted abusiness
Of whichstarted abusiness
Of whichstarted abusiness
Of whichstarted abusiness
Of whichstarted abusiness
Of whichstarted abusiness
Total 64,420.7 5,138.2 36,744.5 4,220.7 27,676.2 917.5 100.0 100.0 100.0 100.0 100.0 100.015 to 19 years old 938.8 0.8 451.4 0.5 487.4 0.3 1.5 0.0 1.2 0.0 1.8 0.020 to 24 4,061.9 12.0 2,026.2 8.4 2,035.7 3.7 6.3 0.2 5.5 0.2 7.4 0.425 to 29 5,754.9 62.9 3,154.1 49.1 2,600.9 13.8 8.9 1.2 8.6 1.2 9.4 1.530 to 34 6,280.6 180.5 3,649.5 148.6 2,631.1 31.9 9.7 3.5 9.9 3.5 9.5 3.535 to 39 7,565.3 325.4 4,451.5 262.9 3,113.9 62.6 11.7 6.3 12.1 6.2 11.3 6.840 to 44 7,758.9 445.5 4,450.6 360.9 3,308.3 84.6 12.0 8.7 12.1 8.6 12.0 9.245 to 49 6,881.5 449.0 3,837.6 365.0 3,043.9 83.9 10.7 8.7 10.4 8.6 11.0 9.150 to 54 6,363.4 482.6 3,556.3 385.9 2,807.1 96.7 9.9 9.4 9.7 9.1 10.1 10.555 to 59 6,141.5 597.8 3,538.5 496.0 2,603.0 101.8 9.5 11.6 9.6 11.8 9.4 11.160 to 64 6,120.2 903.4 3,651.2 751.5 2,469.0 151.8 9.5 17.6 9.9 17.8 8.9 16.565 to 69 3,201.6 674.0 1,927.7 562.4 1,273.8 111.7 5.0 13.1 5.2 13.3 4.6 12.270 to 74 1,825.6 489.6 1,113.3 405.4 712.3 84.3 2.8 9.5 3.0 9.6 2.6 9.275 years old and over 1,526.4 514.8 936.6 424.2 589.9 90.5 2.4 10.0 2.5 10.1 2.1 9.9
Total 65,977.5 5,909.7 38,174.8 4,846.7 27,802.7 1,063.1 100.0 100.0 100.0 100.0 100.0 100.015 to 19 years old 1,057.4 0.9 527.3 0.9 530.2 0.1 1.6 0.0 1.4 0.0 1.9 0.020 to 24 4,852.3 16.8 2,444.1 12.2 2,408.2 4.6 7.4 0.3 6.4 0.3 8.7 0.425 to 29 6,348.2 87.7 3,534.8 70.1 2,813.4 17.6 9.6 1.5 9.3 1.4 10.1 1.730 to 34 7,344.9 238.9 4,415.9 195.5 2,929.0 43.4 11.1 4.0 11.6 4.0 10.5 4.135 to 39 7,493.1 392.9 4,481.4 321.1 3,011.6 71.9 11.4 6.6 11.7 6.6 10.8 6.840 to 44 6,807.2 442.0 3,907.0 360.1 2,900.2 81.8 10.3 7.5 10.2 7.4 10.4 7.745 to 49 6,530.5 516.6 3,655.9 413.6 2,874.5 103.1 9.9 8.7 9.6 8.5 10.3 9.750 to 54 6,599.8 631.3 3,739.4 518.7 2,860.4 112.5 10.0 10.7 9.8 10.7 10.3 10.655 to 59 7,902.8 990.9 4,661.8 813.6 3,241.0 177.3 12.0 16.8 12.2 16.8 11.7 16.760 to 64 4,901.1 858.7 3,013.1 709.4 1,887.9 149.3 7.4 14.5 7.9 14.6 6.8 14.065 to 69 3,021.8 708.4 1,870.9 588.1 1,150.9 120.2 4.6 12.0 4.9 12.1 4.1 11.370 to 74 1,727.2 507.9 1,066.8 425.3 660.4 82.6 2.6 8.6 2.8 8.8 2.4 7.875 years old and over 1,391.1 516.7 856.2 418.0 534.8 98.6 2.1 8.7 2.2 8.6 1.9 9.3
Total -1,556.8 -771.5 -1,430.3 -626.0 -126.5 -145.6 - - - - - - 15 to 19 years old -118.6 -0.1 -75.9 -0.4 -42.8 0.2 -0.1 0.0 -0.2 0.0 -0.1 0.020 to 24 -790.4 -4.8 -417.9 -3.8 -372.5 -0.9 -1.1 -0.1 -0.9 -0.1 -1.3 0.025 to 29 -593.3 -24.8 -380.7 -21.0 -212.5 -3.8 -0.7 -0.3 -0.7 -0.2 -0.7 -0.230 to 34 -1,064.3 -58.4 -766.4 -46.9 -297.9 -11.5 -1.4 -0.5 -1.7 -0.5 -1.0 -0.635 to 39 72.2 -67.5 -29.9 -58.2 102.3 -9.3 0.3 -0.3 0.4 -0.4 0.5 0.040 to 44 951.7 3.5 543.6 0.8 408.1 2.8 1.7 1.2 1.9 1.2 1.6 1.545 to 49 351.0 -67.6 181.7 -48.6 169.4 -19.2 0.8 0.0 0.8 0.1 0.7 -0.650 to 54 -236.4 -148.7 -183.1 -132.8 -53.3 -15.8 -0.1 -1.3 -0.1 -1.6 -0.2 -0.155 to 59 -1,761.3 -393.1 -1,123.3 -317.6 -638.0 -75.5 -2.5 -5.2 -2.6 -5.0 -2.3 -5.660 to 64 1,219.1 44.7 638.1 42.1 581.1 2.5 2.1 3.1 2.0 3.2 2.1 2.565 to 69 179.8 -34.4 56.8 -25.7 122.9 -8.5 0.4 1.1 0.3 1.2 0.5 0.970 to 74 98.4 -18.3 46.5 -19.9 51.9 1.7 0.2 0.9 0.2 0.8 0.2 1.475 years old and over 135.3 -1.9 80.4 6.2 55.1 -8.1 0.3 1.3 0.3 1.5 0.2 0.6
Engaged inwork
Engaged inwork
Engaged inwork
Number RatioBoth sexes Male Male FemaleBoth sexes
Whether started abusiness for oneself
2007
Cha
nge
Engaged inwork
Engaged inwork
Female
Engaged inwork
2012
0
100
200
300
400
500
600
700
800
900
15 to 19 years old
20 to 24 25 to 29 30 to 34 35 to 39 40 to 44 45 to 49 50 to 54 55 to 59 60 to 64 65 to 69 70 to 74 75 years old and
over
(thousand persons)
Male Female
c. Business starters account for 62.3% of all “Self-employed workers” and 41.9% of all “Executives of company or corporation”.
Looking at business starters by status in employment, “Self-employed workers” numbered 3,682
thousand (62.3% of all “Self-employed workers”), and “Executives of company or corporation”
numbered 1,456 thousand (41.9% of all “Executives of company or corporation).
By sex, for males, business starters accounted for 66.1% of “Self-employed workers” and 47.9%
of “Executives of company or corporation”, while for females, business starters accounted for
50.8% of “Self-employed workers” and 22.0% of “Executive of company or corporation”.
Compared to 2007, the ratio of business starters to all “Self-employed workers” decreased by 2.1
points among males, while it increased by 0.4 points among females. The ratio of business starters
to all “Executives of company or corporation” increased by 0.2 points among males and 1.2 points
among females. (Table II-2-22)
Table II-2-22: Number and ratio of business starters by sex and status in employment / 2007, 2012
(thousand persons, %, points)
Sex Number Ratio Number RatioBoth sexes 5,909.6 3,682.4 62.3 3,471.4 1,455.8 41.9
Male 4,450.1 2,941.7 66.1 2,667.7 1,279.0 47.9
Female 1,459.4 740.7 50.8 803.7 176.8 22.0
Both sexes 6,675.2 4,246.3 63.6 4,011.7 1,663.4 41.5
Male 4,950.8 3,377.0 68.2 3,079.1 1,469.7 47.7
Female 1,724.3 869.4 50.4 932.7 193.7 20.8
Both sexes -765.6 -563.9 -1.3 -540.3 -207.6 0.4
Male -500.7 -435.3 -2.1 -411.4 -190.7 0.2
Female -264.9 -128.7 0.4 -129.0 -16.9 1.2Cha
nge
Self-employedworkers
Executives ofcompany orcorporation
Of which started a business Of which started a business
2012
2007
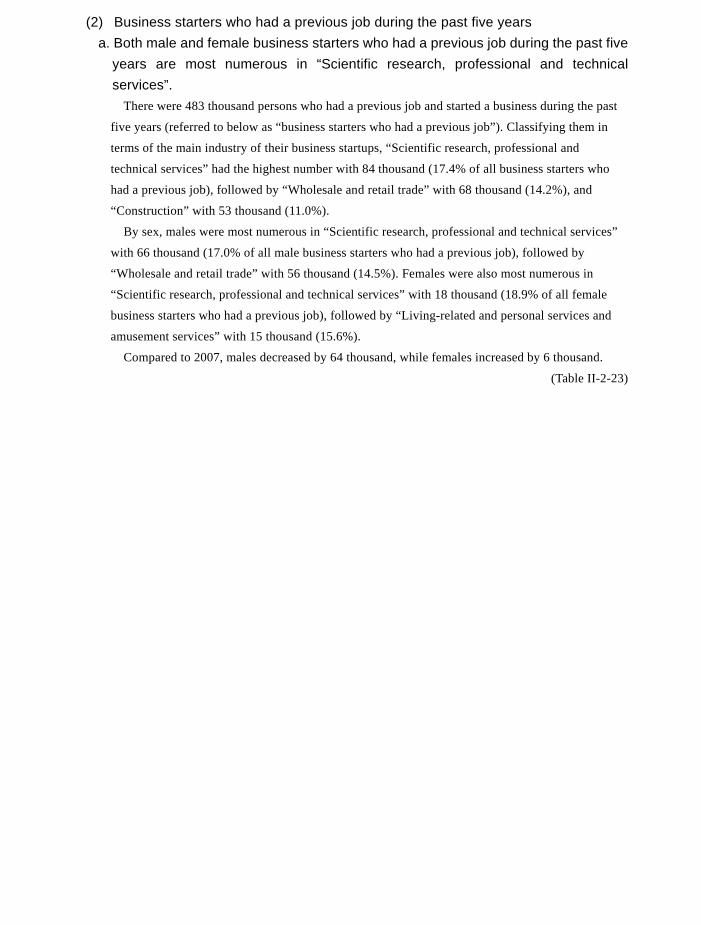
206
(2) Business starters who had a previous job during the past five years a. Both male and female business starters who had a previous job during the past five
years are most numerous in “Scientific research, professional and technical services”.
There were 483 thousand persons who had a previous job and started a business during the past
five years (referred to below as “business starters who had a previous job”). Classifying them in
terms of the main industry of their business startups, “Scientific research, professional and
technical services” had the highest number with 84 thousand (17.4% of all business starters who
had a previous job), followed by “Wholesale and retail trade” with 68 thousand (14.2%), and
“Construction” with 53 thousand (11.0%).
By sex, males were most numerous in “Scientific research, professional and technical services”
with 66 thousand (17.0% of all male business starters who had a previous job), followed by
“Wholesale and retail trade” with 56 thousand (14.5%). Females were also most numerous in
“Scientific research, professional and technical services” with 18 thousand (18.9% of all female
business starters who had a previous job), followed by “Living-related and personal services and
amusement services” with 15 thousand (15.6%).
Compared to 2007, males decreased by 64 thousand, while females increased by 6 thousand.
(Table II-2-23)
Table II-2-23: Number and ratio of business starters who had a previous job during the past five years by sex and main
industry of business startup / 2007, 2012
Note 1) Including “Industries unable to classify”.
(thousand persons, %, points)Sex Number
Industry of starting a business for oneself Male Female Male FemaleTotal 1) 483.3 386.1 97.2 100.0 100.0 100.0 AGRICULTURE AND FORESTRY 32.1 30.8 1.3 6.6 8.0 1.3 CONSTRUCTION 53.3 52.5 0.8 11.0 13.6 0.8 MANUFACTURING 13.8 11.3 2.5 2.9 2.9 2.6 INFORMATION AND COMMUNICATIONS 25.9 24.2 1.7 5.4 6.3 1.7 TRANSPORT AND POSTAL ACTIVITIES 17.8 17.2 0.6 3.7 4.5 0.6 WHOLESALE AND RETAIL TRADE 68.4 55.9 12.5 14.2 14.5 12.9 REAL ESTATE AND GOODS RENTAL AND LEASING 21.8 17.7 4.1 4.5 4.6 4.2 SCIENTIFIC RESEARCH, PROFESSIONAL AND TECHNICAL SERVICES 83.9 65.5 18.4 17.4 17.0 18.9 ACCOMMODATIONS, EATING AND DRINKING SERVICES 44.4 32.1 12.3 9.2 8.3 12.7 LIVING-RELATED AND PERSONAL SERVICES AND AMUSEMENT SERVICES 29.5 14.3 15.2 6.1 3.7 15.6 EDUCATION, LEARNING SUPPORT 17.8 6.8 11.0 3.7 1.8 11.3 MEDICAL, HEALTH CARE AND WELFARE 31.7 22.0 9.7 6.6 5.7 10.0 SERVICES, N.E.C. 26.3 23.3 3.0 5.4 6.0 3.1Total 1) 541.0 449.8 91.2 100.0 100.0 100.0 AGRICULTURE AND FORESTRY 31.8 30.1 1.7 5.9 6.7 1.9 CONSTRUCTION 69.0 67.9 1.1 12.8 15.1 1.2 MANUFACTURING 20.0 17.1 2.9 3.7 3.8 3.2 INFORMATION AND COMMUNICATIONS 35.8 32.4 3.4 6.6 7.2 3.7 TRANSPORT AND POSTAL ACTIVITIES 22.5 21.1 1.4 4.2 4.7 1.5 WHOLESALE AND RETAIL TRADE 84.1 68.5 15.6 15.5 15.2 17.1 REAL ESTATE AND GOODS RENTAL AND LEASING 24.2 22.8 1.4 4.5 5.1 1.5 SCIENTIFIC RESEARCH, PROFESSIONAL AND TECHNICAL SERVICES 79.0 65.8 13.2 14.6 14.6 14.5 ACCOMMODATIONS, EATING AND DRINKING SERVICES 44.8 28.3 16.5 8.3 6.3 18.1 LIVING-RELATED AND PERSONAL SERVICES AND AMUSEMENT SERVICES 23.2 13.7 9.5 4.3 3.0 10.4 EDUCATION, LEARNING SUPPORT 18.6 9.1 9.5 3.4 2.0 10.4 MEDICAL, HEALTH CARE AND WELFARE 31.6 23.8 7.8 5.8 5.3 8.6 SERVICES, N.E.C. 39.7 34.8 4.9 7.3 7.7 5.4Total 1) -57.7 -63.7 6.0 - - - AGRICULTURE AND FORESTRY 0.3 0.7 -0.4 0.7 1.3 -0.6 CONSTRUCTION -15.7 -15.4 -0.3 -1.8 -1.5 -0.4 MANUFACTURING -6.2 -5.8 -0.4 -0.8 -0.9 -0.6 INFORMATION AND COMMUNICATIONS -9.9 -8.2 -1.7 -1.2 -0.9 -2.0 TRANSPORT AND POSTAL ACTIVITIES -4.7 -3.9 -0.8 -0.5 -0.2 -0.9 WHOLESALE AND RETAIL TRADE -15.7 -12.6 -3.1 -1.3 -0.7 -4.2 REAL ESTATE AND GOODS RENTAL AND LEASING -2.4 -5.1 2.7 0.0 -0.5 2.7 SCIENTIFIC RESEARCH, PROFESSIONAL AND TECHNICAL SERVICES 4.9 -0.3 5.2 2.8 2.4 4.4 ACCOMMODATIONS, EATING AND DRINKING SERVICES -0.4 3.8 -4.2 0.9 2.0 -5.4 LIVING-RELATED AND PERSONAL SERVICES AND AMUSEMENT SERVICES 6.3 0.6 5.7 1.8 0.7 5.2 EDUCATION, LEARNING SUPPORT -0.8 -2.3 1.5 0.3 -0.2 0.9 MEDICAL, HEALTH CARE AND WELFARE 0.1 -1.8 1.9 0.8 0.4 1.4 SERVICES, N.E.C. -13.4 -11.5 -1.9 -1.9 -1.7 -2.3
2012
2007
Cha
nge
Ratio
Both sexes Both sexes
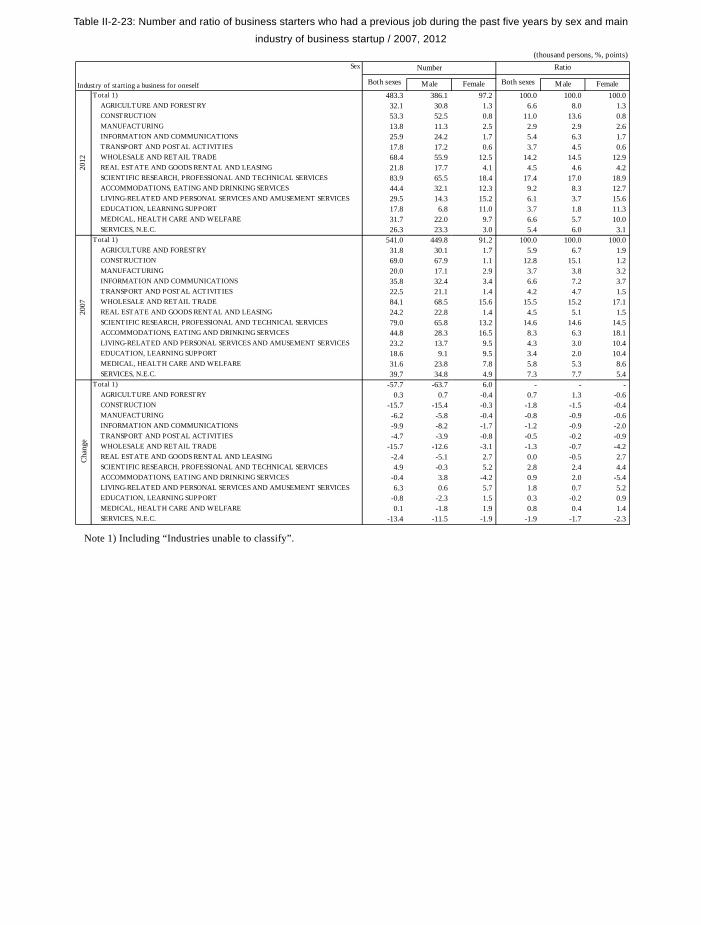
207
(2) Business starters who had a previous job during the past five years a. Both male and female business starters who had a previous job during the past five
years are most numerous in “Scientific research, professional and technical services”.
There were 483 thousand persons who had a previous job and started a business during the past
five years (referred to below as “business starters who had a previous job”). Classifying them in
terms of the main industry of their business startups, “Scientific research, professional and
technical services” had the highest number with 84 thousand (17.4% of all business starters who
had a previous job), followed by “Wholesale and retail trade” with 68 thousand (14.2%), and
“Construction” with 53 thousand (11.0%).
By sex, males were most numerous in “Scientific research, professional and technical services”
with 66 thousand (17.0% of all male business starters who had a previous job), followed by
“Wholesale and retail trade” with 56 thousand (14.5%). Females were also most numerous in
“Scientific research, professional and technical services” with 18 thousand (18.9% of all female
business starters who had a previous job), followed by “Living-related and personal services and
amusement services” with 15 thousand (15.6%).
Compared to 2007, males decreased by 64 thousand, while females increased by 6 thousand.
(Table II-2-23)
Table II-2-23: Number and ratio of business starters who had a previous job during the past five years by sex and main
industry of business startup / 2007, 2012
Note 1) Including “Industries unable to classify”.
(thousand persons, %, points)Sex Number
Industry of starting a business for oneself Male Female Male FemaleTotal 1) 483.3 386.1 97.2 100.0 100.0 100.0 AGRICULTURE AND FORESTRY 32.1 30.8 1.3 6.6 8.0 1.3 CONSTRUCTION 53.3 52.5 0.8 11.0 13.6 0.8 MANUFACTURING 13.8 11.3 2.5 2.9 2.9 2.6 INFORMATION AND COMMUNICATIONS 25.9 24.2 1.7 5.4 6.3 1.7 TRANSPORT AND POSTAL ACTIVITIES 17.8 17.2 0.6 3.7 4.5 0.6 WHOLESALE AND RETAIL TRADE 68.4 55.9 12.5 14.2 14.5 12.9 REAL ESTATE AND GOODS RENTAL AND LEASING 21.8 17.7 4.1 4.5 4.6 4.2 SCIENTIFIC RESEARCH, PROFESSIONAL AND TECHNICAL SERVICES 83.9 65.5 18.4 17.4 17.0 18.9 ACCOMMODATIONS, EATING AND DRINKING SERVICES 44.4 32.1 12.3 9.2 8.3 12.7 LIVING-RELATED AND PERSONAL SERVICES AND AMUSEMENT SERVICES 29.5 14.3 15.2 6.1 3.7 15.6 EDUCATION, LEARNING SUPPORT 17.8 6.8 11.0 3.7 1.8 11.3 MEDICAL, HEALTH CARE AND WELFARE 31.7 22.0 9.7 6.6 5.7 10.0 SERVICES, N.E.C. 26.3 23.3 3.0 5.4 6.0 3.1Total 1) 541.0 449.8 91.2 100.0 100.0 100.0 AGRICULTURE AND FORESTRY 31.8 30.1 1.7 5.9 6.7 1.9 CONSTRUCTION 69.0 67.9 1.1 12.8 15.1 1.2 MANUFACTURING 20.0 17.1 2.9 3.7 3.8 3.2 INFORMATION AND COMMUNICATIONS 35.8 32.4 3.4 6.6 7.2 3.7 TRANSPORT AND POSTAL ACTIVITIES 22.5 21.1 1.4 4.2 4.7 1.5 WHOLESALE AND RETAIL TRADE 84.1 68.5 15.6 15.5 15.2 17.1 REAL ESTATE AND GOODS RENTAL AND LEASING 24.2 22.8 1.4 4.5 5.1 1.5 SCIENTIFIC RESEARCH, PROFESSIONAL AND TECHNICAL SERVICES 79.0 65.8 13.2 14.6 14.6 14.5 ACCOMMODATIONS, EATING AND DRINKING SERVICES 44.8 28.3 16.5 8.3 6.3 18.1 LIVING-RELATED AND PERSONAL SERVICES AND AMUSEMENT SERVICES 23.2 13.7 9.5 4.3 3.0 10.4 EDUCATION, LEARNING SUPPORT 18.6 9.1 9.5 3.4 2.0 10.4 MEDICAL, HEALTH CARE AND WELFARE 31.6 23.8 7.8 5.8 5.3 8.6 SERVICES, N.E.C. 39.7 34.8 4.9 7.3 7.7 5.4Total 1) -57.7 -63.7 6.0 - - - AGRICULTURE AND FORESTRY 0.3 0.7 -0.4 0.7 1.3 -0.6 CONSTRUCTION -15.7 -15.4 -0.3 -1.8 -1.5 -0.4 MANUFACTURING -6.2 -5.8 -0.4 -0.8 -0.9 -0.6 INFORMATION AND COMMUNICATIONS -9.9 -8.2 -1.7 -1.2 -0.9 -2.0 TRANSPORT AND POSTAL ACTIVITIES -4.7 -3.9 -0.8 -0.5 -0.2 -0.9 WHOLESALE AND RETAIL TRADE -15.7 -12.6 -3.1 -1.3 -0.7 -4.2 REAL ESTATE AND GOODS RENTAL AND LEASING -2.4 -5.1 2.7 0.0 -0.5 2.7 SCIENTIFIC RESEARCH, PROFESSIONAL AND TECHNICAL SERVICES 4.9 -0.3 5.2 2.8 2.4 4.4 ACCOMMODATIONS, EATING AND DRINKING SERVICES -0.4 3.8 -4.2 0.9 2.0 -5.4 LIVING-RELATED AND PERSONAL SERVICES AND AMUSEMENT SERVICES 6.3 0.6 5.7 1.8 0.7 5.2 EDUCATION, LEARNING SUPPORT -0.8 -2.3 1.5 0.3 -0.2 0.9 MEDICAL, HEALTH CARE AND WELFARE 0.1 -1.8 1.9 0.8 0.4 1.4 SERVICES, N.E.C. -13.4 -11.5 -1.9 -1.9 -1.7 -2.3
2012
2007
Cha
nge
Ratio
Both sexes Both sexes
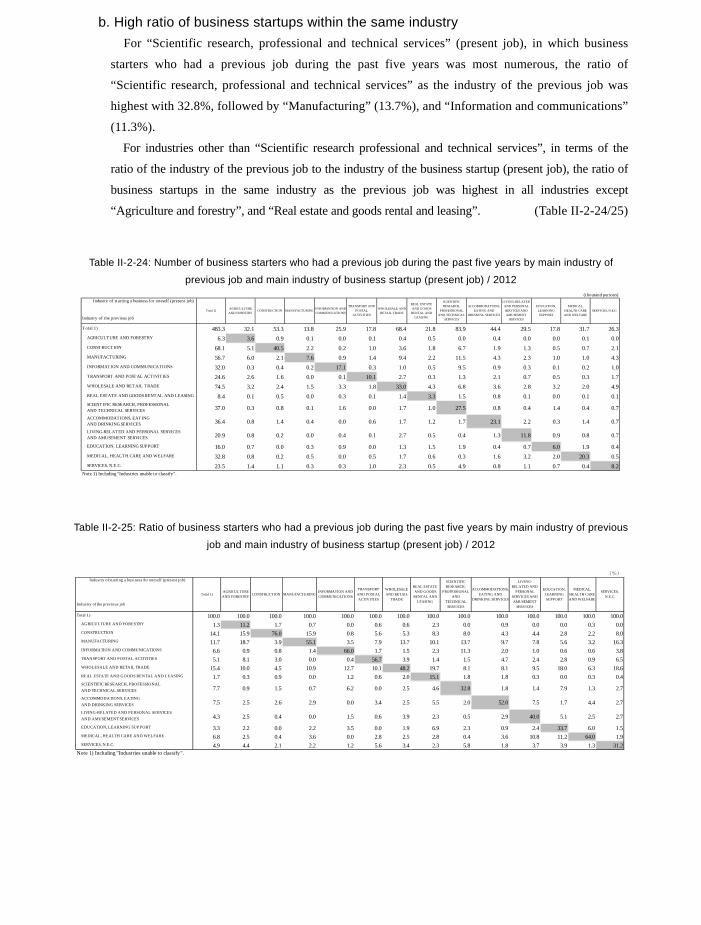
208
b. High ratio of business startups within the same industry For “Scientific research, professional and technical services” (present job), in which business
starters who had a previous job during the past five years was most numerous, the ratio of
“Scientific research, professional and technical services” as the industry of the previous job was
highest with 32.8%, followed by “Manufacturing” (13.7%), and “Information and communications”
(11.3%).
For industries other than “Scientific research professional and technical services”, in terms of the
ratio of the industry of the previous job to the industry of the business startup (present job), the ratio of
business startups in the same industry as the previous job was highest in all industries except
“Agriculture and forestry”, and “Real estate and goods rental and leasing”. (Table II-2-24/25)
Table II-2-24: Number of business starters who had a previous job during the past five years by main industry of
previous job and main industry of business startup (present job) / 2012
Table II-2-25: Ratio of business starters who had a previous job during the past five years by main industry of previous
job and main industry of business startup (present job) / 2012
(thousand persons) Industry of starting a business for oneself (present job)
Industry of the previous job
Total 1) AGRICULTUREAND FORESTRY
CONSTRUCTION MANUFACTURING INFORMATION ANDCOMMUNICATIONS
TRANSPORT ANDPOSTAL
ACTIVITIES
WHOLESALE ANDRETAIL TRADE
REAL ESTATEAND GOODS
RENTAL ANDLEASING
SCIENTIFICRESEARCH,
PROFESSIONALAND TECHNICAL
SERVICES
ACCOMMODATIONS,EATING AND
DRINKING SERVICES
LIVING-RELATEDAND PERSONALSERVICES ANDAMUSEMENT
SERVICES
EDUCATION,LEARNINGSUPPORT
MEDICAL,HEALTH CAREAND WELFARE
SERVICES, N.E.C.
Total 1) 483.3 32.1 53.3 13.8 25.9 17.8 68.4 21.8 83.9 44.4 29.5 17.8 31.7 26.3 AGRICULTURE AND FORESTRY 6.3 3.6 0.9 0.1 0.0 0.1 0.4 0.5 0.0 0.4 0.0 0.0 0.1 0.0 CONSTRUCTION 68.1 5.1 40.5 2.2 0.2 1.0 3.6 1.8 6.7 1.9 1.3 0.5 0.7 2.1 MANUFACTURING 56.7 6.0 2.1 7.6 0.9 1.4 9.4 2.2 11.5 4.3 2.3 1.0 1.0 4.3 INFORMATION AND COMMUNICATIONS 32.0 0.3 0.4 0.2 17.1 0.3 1.0 0.5 9.5 0.9 0.3 0.1 0.2 1.0 TRANSPORT AND POSTAL ACTIVITIES 24.6 2.6 1.6 0.0 0.1 10.1 2.7 0.3 1.3 2.1 0.7 0.5 0.3 1.7 WHOLESALE AND RETAIL TRADE 74.5 3.2 2.4 1.5 3.3 1.8 33.0 4.3 6.8 3.6 2.8 3.2 2.0 4.9 REAL ESTATE AND GOODS RENTAL AND LEASING 8.4 0.1 0.5 0.0 0.3 0.1 1.4 3.3 1.5 0.8 0.1 0.0 0.1 0.1 SCIENTIFIC RESEARCH, PROFESSIONAL AND TECHNICAL SERVICES 37.0 0.3 0.8 0.1 1.6 0.0 1.7 1.0 27.5 0.8 0.4 1.4 0.4 0.7
ACCOMMODATIONS, EATING AND DRINKING SERVICES 36.4 0.8 1.4 0.4 0.0 0.6 1.7 1.2 1.7 23.1 2.2 0.3 1.4 0.7
LIVING-RELATED AND PERSONAL SERVICES AND AMUSEMENT SERVICES 20.9 0.8 0.2 0.0 0.4 0.1 2.7 0.5 0.4 1.3 11.8 0.9 0.8 0.7
EDUCATION, LEARNING SUPPORT 16.0 0.7 0.0 0.3 0.9 0.0 1.3 1.5 1.9 0.4 0.7 6.0 1.9 0.4 MEDICAL, HEALTH CARE AND WELFARE 32.8 0.8 0.2 0.5 0.0 0.5 1.7 0.6 0.3 1.6 3.2 2.0 20.3 0.5 SERVICES, N.E.C. 23.5 1.4 1.1 0.3 0.3 1.0 2.3 0.5 4.9 0.8 1.1 0.7 0.4 8.2Note 1) Including "Industries unable to classify".
(%) Industry of starting a business for oneself (present job)
Industry of the previous job
Total 1)AGRICULTUREAND FORESTRY CONSTRUCTION MANUFACTURING
INFORMATION ANDCOMMUNICATIONS
TRANSPORTAND POSTALACTIVITIES
WHOLESALEAND RETAIL
TRADE
REAL ESTATEAND GOODS
RENTAL ANDLEASING
SCIENTIFICRESEARCH,
PROFESSIONALAND
TECHNICALSERVICES
ACCOMMODATIONS,EATING AND
DRINKING SERVICES
LIVING-RELATED AND
PERSONALSERVICES ANDAMUSEMENT
SERVICES
EDUCATION,LEARNINGSUPPORT
MEDICAL,HEALTH CAREAND WELFARE
SERVICES,N.E.C.
Total 1) 100.0 100.0 100.0 100.0 100.0 100.0 100.0 100.0 100.0 100.0 100.0 100.0 100.0 100.0 AGRICULTURE AND FORESTRY 1.3 11.2 1.7 0.7 0.0 0.6 0.6 2.3 0.0 0.9 0.0 0.0 0.3 0.0 CONSTRUCTION 14.1 15.9 76.0 15.9 0.8 5.6 5.3 8.3 8.0 4.3 4.4 2.8 2.2 8.0 MANUFACTURING 11.7 18.7 3.9 55.1 3.5 7.9 13.7 10.1 13.7 9.7 7.8 5.6 3.2 16.3 INFORMATION AND COMMUNICATIONS 6.6 0.9 0.8 1.4 66.0 1.7 1.5 2.3 11.3 2.0 1.0 0.6 0.6 3.8 TRANSPORT AND POSTAL ACTIVITIES 5.1 8.1 3.0 0.0 0.4 56.7 3.9 1.4 1.5 4.7 2.4 2.8 0.9 6.5 WHOLESALE AND RETAIL TRADE 15.4 10.0 4.5 10.9 12.7 10.1 48.2 19.7 8.1 8.1 9.5 18.0 6.3 18.6 REAL ESTATE AND GOODS RENTAL AND LEASING 1.7 0.3 0.9 0.0 1.2 0.6 2.0 15.1 1.8 1.8 0.3 0.0 0.3 0.4 SCIENTIFIC RESEARCH, PROFESSIONAL AND TECHNICAL SERVICES 7.7 0.9 1.5 0.7 6.2 0.0 2.5 4.6 32.8 1.8 1.4 7.9 1.3 2.7
ACCOMMODATIONS, EATING AND DRINKING SERVICES 7.5 2.5 2.6 2.9 0.0 3.4 2.5 5.5 2.0 52.0 7.5 1.7 4.4 2.7
LIVING-RELATED AND PERSONAL SERVICES AND AMUSEMENT SERVICES 4.3 2.5 0.4 0.0 1.5 0.6 3.9 2.3 0.5 2.9 40.0 5.1 2.5 2.7
EDUCATION, LEARNING SUPPORT 3.3 2.2 0.0 2.2 3.5 0.0 1.9 6.9 2.3 0.9 2.4 33.7 6.0 1.5 MEDICAL, HEALTH CARE AND WELFARE 6.8 2.5 0.4 3.6 0.0 2.8 2.5 2.8 0.4 3.6 10.8 11.2 64.0 1.9 SERVICES, N.E.C. 4.9 4.4 2.1 2.2 1.2 5.6 3.4 2.3 5.8 1.8 3.7 3.9 1.3 31.2Note 1) Including "Industries unable to classify".
c. The business startup ratio is high in “Scientific research, professional and technical services”. and “Real estate and goods rental and leasing”.
The specialization coefficient (i.e., the ratio calculated by dividing the ratio of business starters
who had a previous job during the past five years in a given industry by the ratio of all persons
engaged in work in that industry) was highest in “Scientific research, professional and technical
services” (5.1), followed by “Real estate and goods rental and leasing” (2.1), “Agriculture and
forestry” (1.9), and “Information and communications” (1.9), revealing a high rate of business
startups in these industries. Also in such industries as “Living-related and personal services and
amusement services”, “Accommodations, eating and drinking services” and “Construction”, the
specialization coefficient was more than 1.
Compared to 2007, the specialization coefficient in 2012 was more than 1 in all industries in
which it had also been more than 1 in 2007, except “Services, n.e.c.” (0.9) in which it was less than
1 in 2012. (Table II-2-26, Fig. II-2-15)
Table II-2-26: Ratio of all persons engaged in work and business starters who had a previous job during the past five
years, and specialization coefficient, by sex and main industry / 2007, 2012
(%, points)Sex
① ② ② / ①
Industry of start ing a business for oneself Male Female Male Female Male FemaleTotal 1) 100.0 100.0 100.0 100.0 100.0 100.0 - - - AGRICULTURE AND FORESTRY 3.5 3.7 3.3 6.6 8.0 1.3 1.9 2.2 0.4 CONSTRUCTION 7.6 11.2 2.8 11.0 13.6 0.8 1.4 1.2 0.3 MANUFACTURING 16.8 20.6 11.8 2.9 2.9 2.6 0.2 0.1 0.2 INFORMATION AND COMMUNICATIONS 2.9 3.8 1.8 5.4 6.3 1.7 1.9 1.7 0.9 TRANSPORT AND POSTAL ACTIVITIES 5.4 7.6 2.4 3.7 4.5 0.6 0.7 0.6 0.3 WHOLESALE AND RETAIL TRADE 15.6 13.4 18.4 14.2 14.5 12.9 0.9 1.1 0.7 REAL ESTATE AND GOODS RENTAL AND LEASING 2.1 2.1 1.9 4.5 4.6 4.2 2.1 2.2 2.2 SCIENTIFIC RESEARCH, PROFESSIONAL AND TECHNICAL SERVICES 3.4 4.1 2.6 17.4 17.0 18.9 5.1 4.1 7.3 ACCOMMODATIONS, EATING AND DRINKING SERVICES 5.8 3.9 8.4 9.2 8.3 12.7 1.6 2.1 1.5 LIVING-RELATED AND PERSONAL SERVICES AND AMUSEMENT SERVICES 3.7 2.6 5.1 6.1 3.7 15.6 1.6 1.4 3.1 EDUCATION, LEARNING SUPPORT 4.6 3.6 6.0 3.7 1.8 11.3 0.8 0.5 1.9 MEDICAL, HEALTH CARE AND WELFARE 11.1 4.6 19.6 6.6 5.7 10.0 0.6 1.2 0.5 SERVICES, N.E.C. 6.3 6.7 5.7 5.4 6.0 3.1 0.9 0.9 0.5Total 1) 100.0 100.0 100.0 100.0 100.0 100.0 - - - AGRICULTURE AND FORESTRY 3.8 3.8 3.9 5.9 6.7 1.9 1.6 1.8 0.5 CONSTRUCTION 8.3 12.1 3.0 12.8 15.1 1.2 1.5 1.2 0.4 MANUFACTURING 17.6 20.7 13.3 3.7 3.8 3.2 0.2 0.2 0.2 INFORMATION AND COMMUNICATIONS 3.1 3.8 2.1 6.6 7.2 3.7 2.1 1.9 1.8 TRANSPORT AND POSTAL ACTIVITIES 5.3 7.5 2.4 4.2 4.7 1.5 0.8 0.6 0.6 WHOLESALE AND RETAIL TRADE 16.7 14.5 19.8 15.5 15.2 17.1 0.9 1.0 0.9 REAL ESTATE AND GOODS RENTAL AND LEASING 2.0 2.1 1.8 4.5 5.1 1.5 2.3 2.4 0.8 SCIENTIFIC RESEARCH, PROFESSIONAL AND TECHNICAL SERVICES 3.2 3.8 2.5 14.6 14.6 14.5 4.6 3.8 5.8 ACCOMMODATIONS, EATING AND DRINKING SERVICES 5.9 4.0 8.5 8.3 6.3 18.1 1.4 1.6 2.1 LIVING-RELATED AND PERSONAL SERVICES AND AMUSEMENT SERVICES 3.8 2.6 5.4 4.3 3.0 10.4 1.1 1.2 1.9 EDUCATION, LEARNING SUPPORT 4.4 3.4 5.8 3.4 2.0 10.4 0.8 0.6 1.8 MEDICAL, HEALTH CARE AND WELFARE 9.0 3.6 16.4 5.8 5.3 8.6 0.6 1.5 0.5 SERVICES, N.E.C. 5.7 6.0 5.3 7.3 7.7 5.4 1.3 1.3 1.0Total 1) - - - - - - - - - AGRICULTURE AND FORESTRY -0.3 -0.1 -0.6 0.7 1.3 -0.6 0.3 0.4 -0.1 CONSTRUCTION -0.7 -0.9 -0.2 -1.8 -1.5 -0.4 -0.1 0.0 -0.1 MANUFACTURING -0.8 -0.1 -1.5 -0.8 -0.9 -0.6 0.0 -0.1 0.0 INFORMATION AND COMMUNICATIONS -0.2 0.0 -0.3 -1.2 -0.9 -2.0 -0.2 -0.2 -0.9 TRANSPORT AND POSTAL ACTIVITIES 0.1 0.1 0.0 -0.5 -0.2 -0.9 -0.1 0.0 -0.3 WHOLESALE AND RETAIL TRADE -1.1 -1.1 -1.4 -1.3 -0.7 -4.2 0.0 0.1 -0.2 REAL ESTATE AND GOODS RENTAL AND LEASING 0.1 0.0 0.1 0.0 -0.5 2.7 -0.2 -0.2 1.4 SCIENTIFIC RESEARCH, PROFESSIONAL AND TECHNICAL SERVICES 0.2 0.3 0.1 2.8 2.4 4.4 0.5 0.3 1.5 ACCOMMODATIONS, EATING AND DRINKING SERVICES -0.1 -0.1 -0.1 0.9 2.0 -5.4 0.2 0.5 -0.6 LIVING-RELATED AND PERSONAL SERVICES AND AMUSEMENT SERVICES -0.1 0.0 -0.3 1.8 0.7 5.2 0.5 0.2 1.2 EDUCATION, LEARNING SUPPORT 0.2 0.2 0.2 0.3 -0.2 0.9 0.0 -0.1 0.1 MEDICAL, HEALTH CARE AND WELFARE 2.1 1.0 3.2 0.8 0.4 1.4 0.0 -0.3 0.0 SERVICES, N.E.C. 0.6 0.7 0.4 -1.9 -1.7 -2.3 -0.4 -0.4 -0.5Note 1) Including "Industries unable to classify".
Cha
nge
Ratio of all personsengaged in work
Ratio of job-changing businessstarters over the last 5 years
Specializationcoefficient
Bothsexes
2007
2012
Bothsexes
Bothsexes
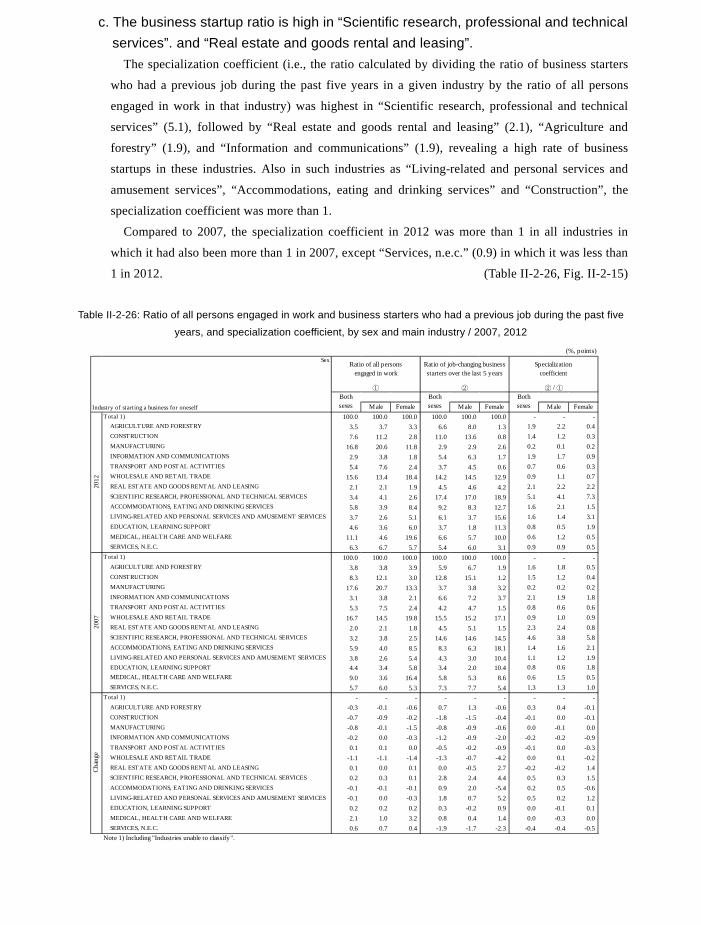
209
b. High ratio of business startups within the same industry For “Scientific research, professional and technical services” (present job), in which business
starters who had a previous job during the past five years was most numerous, the ratio of
“Scientific research, professional and technical services” as the industry of the previous job was
highest with 32.8%, followed by “Manufacturing” (13.7%), and “Information and communications”
(11.3%).
For industries other than “Scientific research professional and technical services”, in terms of the
ratio of the industry of the previous job to the industry of the business startup (present job), the ratio of
business startups in the same industry as the previous job was highest in all industries except
“Agriculture and forestry”, and “Real estate and goods rental and leasing”. (Table II-2-24/25)
Table II-2-24: Number of business starters who had a previous job during the past five years by main industry of
previous job and main industry of business startup (present job) / 2012
Table II-2-25: Ratio of business starters who had a previous job during the past five years by main industry of previous
job and main industry of business startup (present job) / 2012
(thousand persons) Industry of starting a business for oneself (present job)
Industry of the previous job
Total 1) AGRICULTUREAND FORESTRY
CONSTRUCTION MANUFACTURING INFORMATION ANDCOMMUNICATIONS
TRANSPORT ANDPOSTAL
ACTIVITIES
WHOLESALE ANDRETAIL TRADE
REAL ESTATEAND GOODS
RENTAL ANDLEASING
SCIENTIFICRESEARCH,
PROFESSIONALAND TECHNICAL
SERVICES
ACCOMMODATIONS,EATING AND
DRINKING SERVICES
LIVING-RELATEDAND PERSONALSERVICES ANDAMUSEMENT
SERVICES
EDUCATION,LEARNINGSUPPORT
MEDICAL,HEALTH CAREAND WELFARE
SERVICES, N.E.C.
Total 1) 483.3 32.1 53.3 13.8 25.9 17.8 68.4 21.8 83.9 44.4 29.5 17.8 31.7 26.3 AGRICULTURE AND FORESTRY 6.3 3.6 0.9 0.1 0.0 0.1 0.4 0.5 0.0 0.4 0.0 0.0 0.1 0.0 CONSTRUCTION 68.1 5.1 40.5 2.2 0.2 1.0 3.6 1.8 6.7 1.9 1.3 0.5 0.7 2.1 MANUFACTURING 56.7 6.0 2.1 7.6 0.9 1.4 9.4 2.2 11.5 4.3 2.3 1.0 1.0 4.3 INFORMATION AND COMMUNICATIONS 32.0 0.3 0.4 0.2 17.1 0.3 1.0 0.5 9.5 0.9 0.3 0.1 0.2 1.0 TRANSPORT AND POSTAL ACTIVITIES 24.6 2.6 1.6 0.0 0.1 10.1 2.7 0.3 1.3 2.1 0.7 0.5 0.3 1.7 WHOLESALE AND RETAIL TRADE 74.5 3.2 2.4 1.5 3.3 1.8 33.0 4.3 6.8 3.6 2.8 3.2 2.0 4.9 REAL ESTATE AND GOODS RENTAL AND LEASING 8.4 0.1 0.5 0.0 0.3 0.1 1.4 3.3 1.5 0.8 0.1 0.0 0.1 0.1 SCIENTIFIC RESEARCH, PROFESSIONAL AND TECHNICAL SERVICES 37.0 0.3 0.8 0.1 1.6 0.0 1.7 1.0 27.5 0.8 0.4 1.4 0.4 0.7
ACCOMMODATIONS, EATING AND DRINKING SERVICES 36.4 0.8 1.4 0.4 0.0 0.6 1.7 1.2 1.7 23.1 2.2 0.3 1.4 0.7
LIVING-RELATED AND PERSONAL SERVICES AND AMUSEMENT SERVICES 20.9 0.8 0.2 0.0 0.4 0.1 2.7 0.5 0.4 1.3 11.8 0.9 0.8 0.7
EDUCATION, LEARNING SUPPORT 16.0 0.7 0.0 0.3 0.9 0.0 1.3 1.5 1.9 0.4 0.7 6.0 1.9 0.4 MEDICAL, HEALTH CARE AND WELFARE 32.8 0.8 0.2 0.5 0.0 0.5 1.7 0.6 0.3 1.6 3.2 2.0 20.3 0.5 SERVICES, N.E.C. 23.5 1.4 1.1 0.3 0.3 1.0 2.3 0.5 4.9 0.8 1.1 0.7 0.4 8.2Note 1) Including "Industries unable to classify".
(%) Industry of starting a business for oneself (present job)
Industry of the previous job
Total 1)AGRICULTUREAND FORESTRY CONSTRUCTION MANUFACTURING
INFORMATION ANDCOMMUNICATIONS
TRANSPORTAND POSTALACTIVITIES
WHOLESALEAND RETAIL
TRADE
REAL ESTATEAND GOODS
RENTAL ANDLEASING
SCIENTIFICRESEARCH,
PROFESSIONALAND
TECHNICALSERVICES
ACCOMMODATIONS,EATING AND
DRINKING SERVICES
LIVING-RELATED AND
PERSONALSERVICES ANDAMUSEMENT
SERVICES
EDUCATION,LEARNINGSUPPORT
MEDICAL,HEALTH CAREAND WELFARE
SERVICES,N.E.C.
Total 1) 100.0 100.0 100.0 100.0 100.0 100.0 100.0 100.0 100.0 100.0 100.0 100.0 100.0 100.0 AGRICULTURE AND FORESTRY 1.3 11.2 1.7 0.7 0.0 0.6 0.6 2.3 0.0 0.9 0.0 0.0 0.3 0.0 CONSTRUCTION 14.1 15.9 76.0 15.9 0.8 5.6 5.3 8.3 8.0 4.3 4.4 2.8 2.2 8.0 MANUFACTURING 11.7 18.7 3.9 55.1 3.5 7.9 13.7 10.1 13.7 9.7 7.8 5.6 3.2 16.3 INFORMATION AND COMMUNICATIONS 6.6 0.9 0.8 1.4 66.0 1.7 1.5 2.3 11.3 2.0 1.0 0.6 0.6 3.8 TRANSPORT AND POSTAL ACTIVITIES 5.1 8.1 3.0 0.0 0.4 56.7 3.9 1.4 1.5 4.7 2.4 2.8 0.9 6.5 WHOLESALE AND RETAIL TRADE 15.4 10.0 4.5 10.9 12.7 10.1 48.2 19.7 8.1 8.1 9.5 18.0 6.3 18.6 REAL ESTATE AND GOODS RENTAL AND LEASING 1.7 0.3 0.9 0.0 1.2 0.6 2.0 15.1 1.8 1.8 0.3 0.0 0.3 0.4 SCIENTIFIC RESEARCH, PROFESSIONAL AND TECHNICAL SERVICES 7.7 0.9 1.5 0.7 6.2 0.0 2.5 4.6 32.8 1.8 1.4 7.9 1.3 2.7
ACCOMMODATIONS, EATING AND DRINKING SERVICES 7.5 2.5 2.6 2.9 0.0 3.4 2.5 5.5 2.0 52.0 7.5 1.7 4.4 2.7
LIVING-RELATED AND PERSONAL SERVICES AND AMUSEMENT SERVICES 4.3 2.5 0.4 0.0 1.5 0.6 3.9 2.3 0.5 2.9 40.0 5.1 2.5 2.7
EDUCATION, LEARNING SUPPORT 3.3 2.2 0.0 2.2 3.5 0.0 1.9 6.9 2.3 0.9 2.4 33.7 6.0 1.5 MEDICAL, HEALTH CARE AND WELFARE 6.8 2.5 0.4 3.6 0.0 2.8 2.5 2.8 0.4 3.6 10.8 11.2 64.0 1.9 SERVICES, N.E.C. 4.9 4.4 2.1 2.2 1.2 5.6 3.4 2.3 5.8 1.8 3.7 3.9 1.3 31.2Note 1) Including "Industries unable to classify".
c. The business startup ratio is high in “Scientific research, professional and technical services”. and “Real estate and goods rental and leasing”.
The specialization coefficient (i.e., the ratio calculated by dividing the ratio of business starters
who had a previous job during the past five years in a given industry by the ratio of all persons
engaged in work in that industry) was highest in “Scientific research, professional and technical
services” (5.1), followed by “Real estate and goods rental and leasing” (2.1), “Agriculture and
forestry” (1.9), and “Information and communications” (1.9), revealing a high rate of business
startups in these industries. Also in such industries as “Living-related and personal services and
amusement services”, “Accommodations, eating and drinking services” and “Construction”, the
specialization coefficient was more than 1.
Compared to 2007, the specialization coefficient in 2012 was more than 1 in all industries in
which it had also been more than 1 in 2007, except “Services, n.e.c.” (0.9) in which it was less than
1 in 2012. (Table II-2-26, Fig. II-2-15)
Table II-2-26: Ratio of all persons engaged in work and business starters who had a previous job during the past five
years, and specialization coefficient, by sex and main industry / 2007, 2012
(%, points)Sex
① ② ② / ①
Industry of start ing a business for oneself Male Female Male Female Male FemaleTotal 1) 100.0 100.0 100.0 100.0 100.0 100.0 - - - AGRICULTURE AND FORESTRY 3.5 3.7 3.3 6.6 8.0 1.3 1.9 2.2 0.4 CONSTRUCTION 7.6 11.2 2.8 11.0 13.6 0.8 1.4 1.2 0.3 MANUFACTURING 16.8 20.6 11.8 2.9 2.9 2.6 0.2 0.1 0.2 INFORMATION AND COMMUNICATIONS 2.9 3.8 1.8 5.4 6.3 1.7 1.9 1.7 0.9 TRANSPORT AND POSTAL ACTIVITIES 5.4 7.6 2.4 3.7 4.5 0.6 0.7 0.6 0.3 WHOLESALE AND RETAIL TRADE 15.6 13.4 18.4 14.2 14.5 12.9 0.9 1.1 0.7 REAL ESTATE AND GOODS RENTAL AND LEASING 2.1 2.1 1.9 4.5 4.6 4.2 2.1 2.2 2.2 SCIENTIFIC RESEARCH, PROFESSIONAL AND TECHNICAL SERVICES 3.4 4.1 2.6 17.4 17.0 18.9 5.1 4.1 7.3 ACCOMMODATIONS, EATING AND DRINKING SERVICES 5.8 3.9 8.4 9.2 8.3 12.7 1.6 2.1 1.5 LIVING-RELATED AND PERSONAL SERVICES AND AMUSEMENT SERVICES 3.7 2.6 5.1 6.1 3.7 15.6 1.6 1.4 3.1 EDUCATION, LEARNING SUPPORT 4.6 3.6 6.0 3.7 1.8 11.3 0.8 0.5 1.9 MEDICAL, HEALTH CARE AND WELFARE 11.1 4.6 19.6 6.6 5.7 10.0 0.6 1.2 0.5 SERVICES, N.E.C. 6.3 6.7 5.7 5.4 6.0 3.1 0.9 0.9 0.5Total 1) 100.0 100.0 100.0 100.0 100.0 100.0 - - - AGRICULTURE AND FORESTRY 3.8 3.8 3.9 5.9 6.7 1.9 1.6 1.8 0.5 CONSTRUCTION 8.3 12.1 3.0 12.8 15.1 1.2 1.5 1.2 0.4 MANUFACTURING 17.6 20.7 13.3 3.7 3.8 3.2 0.2 0.2 0.2 INFORMATION AND COMMUNICATIONS 3.1 3.8 2.1 6.6 7.2 3.7 2.1 1.9 1.8 TRANSPORT AND POSTAL ACTIVITIES 5.3 7.5 2.4 4.2 4.7 1.5 0.8 0.6 0.6 WHOLESALE AND RETAIL TRADE 16.7 14.5 19.8 15.5 15.2 17.1 0.9 1.0 0.9 REAL ESTATE AND GOODS RENTAL AND LEASING 2.0 2.1 1.8 4.5 5.1 1.5 2.3 2.4 0.8 SCIENTIFIC RESEARCH, PROFESSIONAL AND TECHNICAL SERVICES 3.2 3.8 2.5 14.6 14.6 14.5 4.6 3.8 5.8 ACCOMMODATIONS, EATING AND DRINKING SERVICES 5.9 4.0 8.5 8.3 6.3 18.1 1.4 1.6 2.1 LIVING-RELATED AND PERSONAL SERVICES AND AMUSEMENT SERVICES 3.8 2.6 5.4 4.3 3.0 10.4 1.1 1.2 1.9 EDUCATION, LEARNING SUPPORT 4.4 3.4 5.8 3.4 2.0 10.4 0.8 0.6 1.8 MEDICAL, HEALTH CARE AND WELFARE 9.0 3.6 16.4 5.8 5.3 8.6 0.6 1.5 0.5 SERVICES, N.E.C. 5.7 6.0 5.3 7.3 7.7 5.4 1.3 1.3 1.0Total 1) - - - - - - - - - AGRICULTURE AND FORESTRY -0.3 -0.1 -0.6 0.7 1.3 -0.6 0.3 0.4 -0.1 CONSTRUCTION -0.7 -0.9 -0.2 -1.8 -1.5 -0.4 -0.1 0.0 -0.1 MANUFACTURING -0.8 -0.1 -1.5 -0.8 -0.9 -0.6 0.0 -0.1 0.0 INFORMATION AND COMMUNICATIONS -0.2 0.0 -0.3 -1.2 -0.9 -2.0 -0.2 -0.2 -0.9 TRANSPORT AND POSTAL ACTIVITIES 0.1 0.1 0.0 -0.5 -0.2 -0.9 -0.1 0.0 -0.3 WHOLESALE AND RETAIL TRADE -1.1 -1.1 -1.4 -1.3 -0.7 -4.2 0.0 0.1 -0.2 REAL ESTATE AND GOODS RENTAL AND LEASING 0.1 0.0 0.1 0.0 -0.5 2.7 -0.2 -0.2 1.4 SCIENTIFIC RESEARCH, PROFESSIONAL AND TECHNICAL SERVICES 0.2 0.3 0.1 2.8 2.4 4.4 0.5 0.3 1.5 ACCOMMODATIONS, EATING AND DRINKING SERVICES -0.1 -0.1 -0.1 0.9 2.0 -5.4 0.2 0.5 -0.6 LIVING-RELATED AND PERSONAL SERVICES AND AMUSEMENT SERVICES -0.1 0.0 -0.3 1.8 0.7 5.2 0.5 0.2 1.2 EDUCATION, LEARNING SUPPORT 0.2 0.2 0.2 0.3 -0.2 0.9 0.0 -0.1 0.1 MEDICAL, HEALTH CARE AND WELFARE 2.1 1.0 3.2 0.8 0.4 1.4 0.0 -0.3 0.0 SERVICES, N.E.C. 0.6 0.7 0.4 -1.9 -1.7 -2.3 -0.4 -0.4 -0.5Note 1) Including "Industries unable to classify".
Cha
nge
Ratio of all personsengaged in work
Ratio of job-changing businessstarters over the last 5 years
Specializationcoefficient
Bothsexes
2007
2012
Bothsexes
Bothsexes
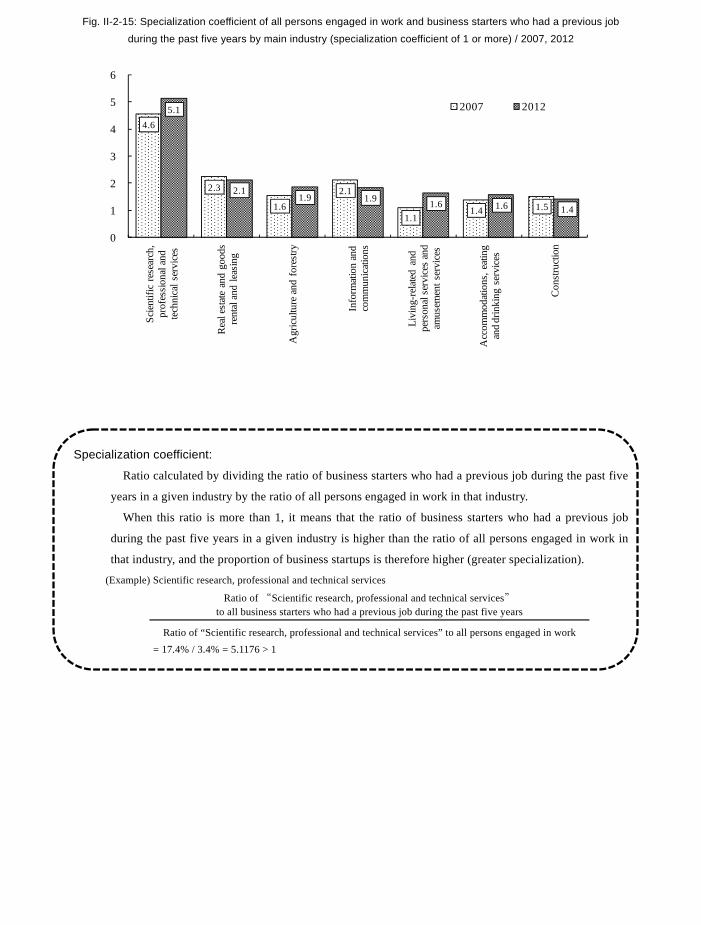
210
Fig. II-2-15: Specialization coefficient of all persons engaged in work and business starters who had a previous job
during the past five years by main industry (specialization coefficient of 1 or more) / 2007, 2012
Specialization coefficient:
Ratio calculated by dividing the ratio of business starters who had a previous job during the past five
years in a given industry by the ratio of all persons engaged in work in that industry.
When this ratio is more than 1, it means that the ratio of business starters who had a previous job
during the past five years in a given industry is higher than the ratio of all persons engaged in work in
that industry, and the proportion of business startups is therefore higher (greater specialization).
(Example) Scientific research, professional and technical services
Ratio of “Scientific research, professional and technical services” to all business starters who had a previous job during the past five years
Ratio of “Scientific research, professional and technical services” to all persons engaged in work
= 17.4% / 3.4% = 5.1176 > 1
4.6
2.3
1.6
2.1
1.11.4 1.5
5.1
2.1 1.9 1.9 1.6 1.6 1.4
0
1
2
3
4
5
6
Scie
ntifi
c re
sear
ch,
prof
essi
onal
and
te
chni
cal s
ervi
ces
Rea
l est
ate
and
good
s re
ntal
and
leas
ing
Agr
icul
ture
and
for
estry
Info
rmat
ion
and
com
mun
icat
ions
Livi
ng-r
elat
ed a
nd
pers
onal
ser
vice
s an
d am
usem
ent s
ervi
ces
Acc
omm
odat
ions
, eat
ing
and
drin
king
ser
vice
s
Con
stru
ctio
n
2007 2012
6. Type of employment of the first job and persons continuing in their first job
(1) Type of employment of the “First Job” About 40% of those who took up their first job in “Oct. 2007 to Sept. 2012” were
employed as “Irregular staffs”. Looking at persons who took up their “First Job” after October 1987 by type of employment of
the first job, the ratio of those who took up their first job as “Irregular staffs”, which has risen year
by year, was 39.8% in “Oct. 2007 to Sept. 2012”, reaching almost 40%.
Looking at persons who took up their first job in “Oct. 2007 to Sept. 2012” by sex, “Irregular
staffs” accounted for 29.1% among males and 49.3% among females. The ratio of those who took
up their first job as “Irregular staffs” was highest for both males and females since 1987.
(Fig. II-2-16, Table II-2-27)
Fig. II-2-16: Ratio of “Persons who took up their first job as irregular staffs” by sex and when took up the first job / 2012
When took up the first job
* Ratio of “Irregular staffs at the time of taking up the first job to all employees, excluding executive of company or corporation”
13.4
18.8
28.3 33.1
39.8
8.0 11.3
17.9
22.2
29.1
18.8
26.1
37.9
43.2
49.3
0
10
20
30
40
50
60
Oct. 1987 toSept. 1992
Oct. 1992 toSept. 1997
Oct. 1997 toSept. 2002
Oct. 2002 toSept. 2007
Oct. 2007 toSept. 2012
(%)
FemaleBoth sexes
Male
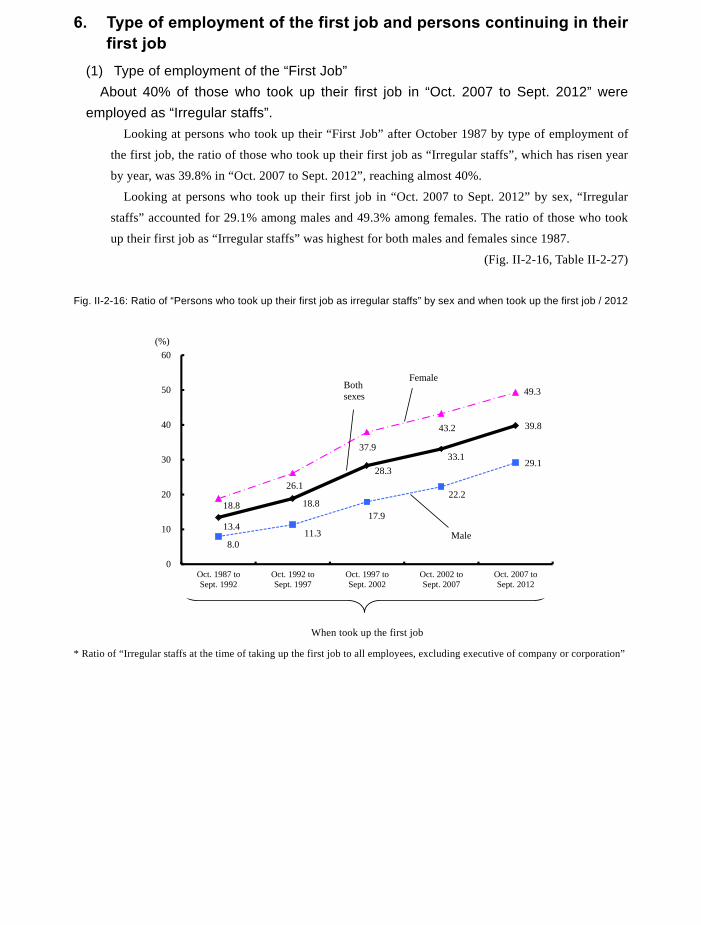
211
Fig. II-2-15: Specialization coefficient of all persons engaged in work and business starters who had a previous job
during the past five years by main industry (specialization coefficient of 1 or more) / 2007, 2012
Specialization coefficient:
Ratio calculated by dividing the ratio of business starters who had a previous job during the past five
years in a given industry by the ratio of all persons engaged in work in that industry.
When this ratio is more than 1, it means that the ratio of business starters who had a previous job
during the past five years in a given industry is higher than the ratio of all persons engaged in work in
that industry, and the proportion of business startups is therefore higher (greater specialization).
(Example) Scientific research, professional and technical services
Ratio of “Scientific research, professional and technical services” to all business starters who had a previous job during the past five years
Ratio of “Scientific research, professional and technical services” to all persons engaged in work
= 17.4% / 3.4% = 5.1176 > 1
4.6
2.3
1.6
2.1
1.11.4 1.5
5.1
2.1 1.9 1.9 1.6 1.6 1.4
0
1
2
3
4
5
6
Scie
ntifi
c re
sear
ch,
prof
essi
onal
and
te
chni
cal s
ervi
ces
Rea
l est
ate
and
good
s re
ntal
and
leas
ing
Agr
icul
ture
and
for
estry
Info
rmat
ion
and
com
mun
icat
ions
Livi
ng-r
elat
ed a
nd
pers
onal
ser
vice
s an
d am
usem
ent s
ervi
ces
Acc
omm
odat
ions
, eat
ing
and
drin
king
ser
vice
s
Con
stru
ctio
n
2007 2012
6. Type of employment of the first job and persons continuing in their first job
(1) Type of employment of the “First Job” About 40% of those who took up their first job in “Oct. 2007 to Sept. 2012” were
employed as “Irregular staffs”. Looking at persons who took up their “First Job” after October 1987 by type of employment of
the first job, the ratio of those who took up their first job as “Irregular staffs”, which has risen year
by year, was 39.8% in “Oct. 2007 to Sept. 2012”, reaching almost 40%.
Looking at persons who took up their first job in “Oct. 2007 to Sept. 2012” by sex, “Irregular
staffs” accounted for 29.1% among males and 49.3% among females. The ratio of those who took
up their first job as “Irregular staffs” was highest for both males and females since 1987.
(Fig. II-2-16, Table II-2-27)
Fig. II-2-16: Ratio of “Persons who took up their first job as irregular staffs” by sex and when took up the first job / 2012
When took up the first job
* Ratio of “Irregular staffs at the time of taking up the first job to all employees, excluding executive of company or corporation”
13.4
18.8
28.3 33.1
39.8
8.0 11.3
17.9
22.2
29.1
18.8
26.1
37.9
43.2
49.3
0
10
20
30
40
50
60
Oct. 1987 toSept. 1992
Oct. 1992 toSept. 1997
Oct. 1997 toSept. 2002
Oct. 2002 toSept. 2007
Oct. 2007 toSept. 2012
(%)
FemaleBoth sexes
Male
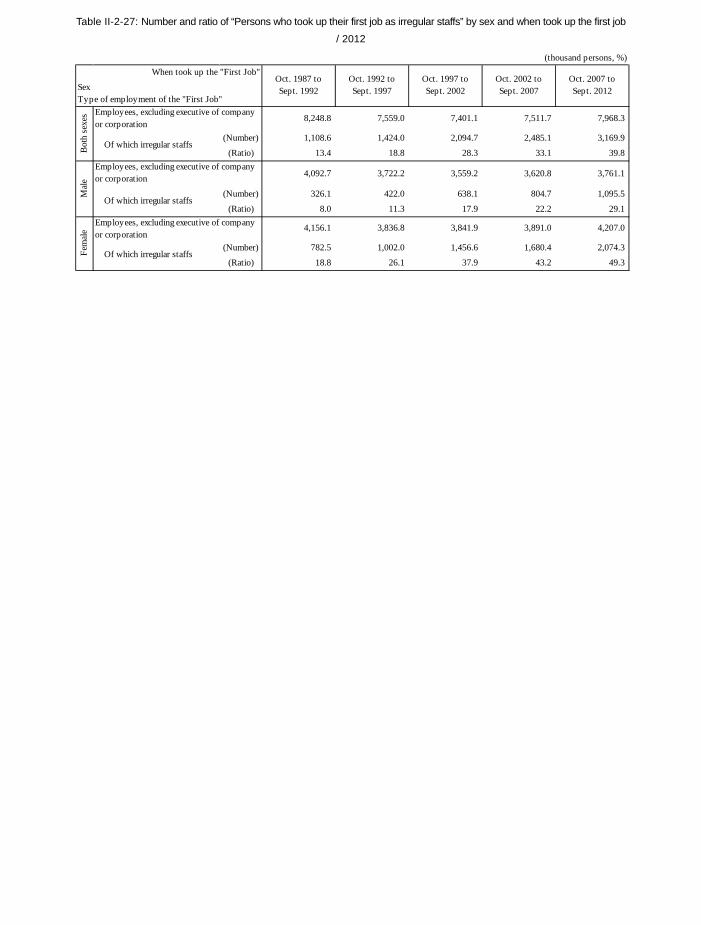
212
Table II-2-27: Number and ratio of “Persons who took up their first job as irregular staffs” by sex and when took up the first job
/ 2012
(thousand persons, %)
8,248.8 7,559.0 7,401.1 7,511.7 7,968.3
(Number) 1,108.6 1,424.0 2,094.7 2,485.1 3,169.9
(Ratio) 13.4 18.8 28.3 33.1 39.8
4,092.7 3,722.2 3,559.2 3,620.8 3,761.1
(Number) 326.1 422.0 638.1 804.7 1,095.5
(Ratio) 8.0 11.3 17.9 22.2 29.1
4,156.1 3,836.8 3,841.9 3,891.0 4,207.0
(Number) 782.5 1,002.0 1,456.6 1,680.4 2,074.3
(Ratio) 18.8 26.1 37.9 43.2 49.3
Bot
h se
xes
Of which irregular staffs
Mal
e
Of which irregular staffs
Fem
ale
Of which irregular staffs
Employees, excluding executive of companyor corporation
Employees, excluding executive of companyor corporation
Employees, excluding executive of companyor corporation
When took up the "First Job"Oct. 1987 toSept. 1992
Oct. 1992 toSept. 1997
Oct. 1997 toSept. 2002
Oct. 2002 toSept. 2007
Oct. 2007 toSept. 2012Sex
Type of employment of the "First Job"
(2) Persons continuing in the first job Of those who took up their first job in “Oct. 2007 to Sept. 2008”, “Persons continuing in
the first job” account for about 60% among “Irregular staffs”. For those who took up their first job after October 2007, looking at when took up the “First Job”
and type of employment of the first job, “Persons continuing in the first job” accounted for 70.4%
of all persons who had taken up their first job as “Regular staffs” in “Oct. 2007 to Sept. 2008”, and
for 56.3% of all persons who had taken up their first job as “Irregular staffs”. In other words, the
ratio of “Persons continuing in the first job” was 14.1 points lower among those whose first job was
irregular employment.
Looking at persons whose first job was irregular employment by sex, “Persons continuing in the
first job” accounted for 48.2% among males and 60.3% among females, revealing that the ratio was
higher among females. (Fig. II-2-17, Table II-2-28)
Fig. II-2-17: Ratio of “Persons continuing in the first job” by when took up the “First Job” and type of employment of the first job
/ 2012
* Ratio of persons continuing in the first job at the time of taking up the first job to all employees, excluding executive of
company or corporation
56.3
60.7
66.7
73.6
90.3
70.4
76.0
81.3
85.9
94.6
0 20 40 60 80 100
Oct. 2007 to Sept. 2008(within 4-5 years)
Oct. 2008 to Sept. 2009(within 3-4 years)
Oct. 2009 to Sept. 2010(within 2-3 years)
Oct. 2010 to Sept. 2011(within 1-2 years)
Oct. 2011 to Sept. 2012(within 1 year)
(%)
Whe
n to
ok u
p the
"Firs
t job
Regular staffs
Irregular staffs
In brackets: Continuous term of "First job"
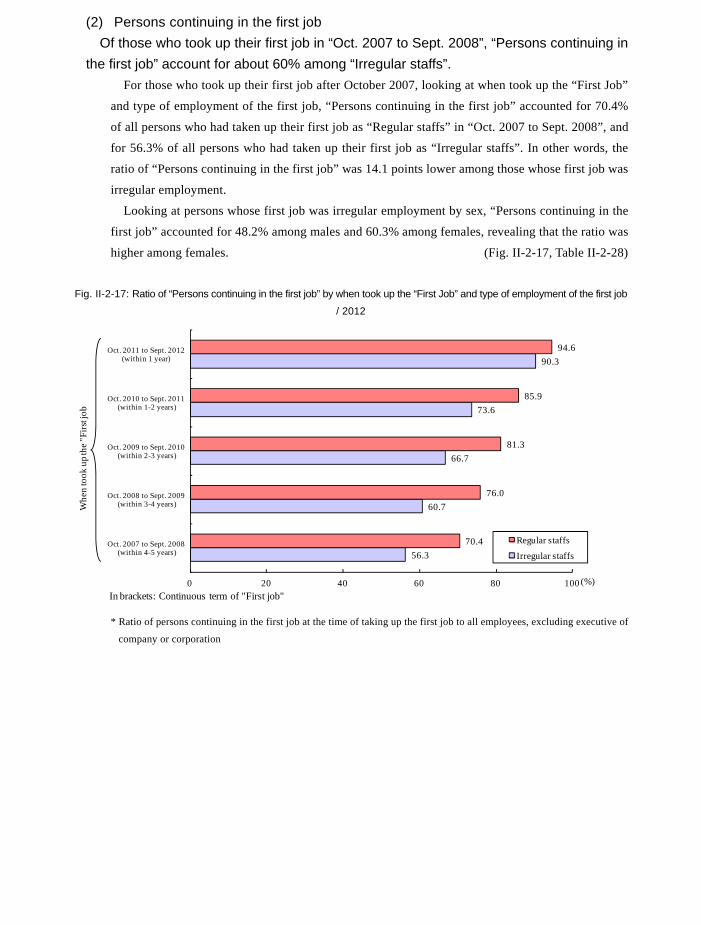
213
Table II-2-27: Number and ratio of “Persons who took up their first job as irregular staffs” by sex and when took up the first job
/ 2012
(thousand persons, %)
8,248.8 7,559.0 7,401.1 7,511.7 7,968.3
(Number) 1,108.6 1,424.0 2,094.7 2,485.1 3,169.9
(Ratio) 13.4 18.8 28.3 33.1 39.8
4,092.7 3,722.2 3,559.2 3,620.8 3,761.1
(Number) 326.1 422.0 638.1 804.7 1,095.5
(Ratio) 8.0 11.3 17.9 22.2 29.1
4,156.1 3,836.8 3,841.9 3,891.0 4,207.0
(Number) 782.5 1,002.0 1,456.6 1,680.4 2,074.3
(Ratio) 18.8 26.1 37.9 43.2 49.3
Bot
h se
xes
Of which irregular staffs
Mal
e
Of which irregular staffs
Fem
ale
Of which irregular staffs
Employees, excluding executive of companyor corporation
Employees, excluding executive of companyor corporation
Employees, excluding executive of companyor corporation
When took up the "First Job"Oct. 1987 toSept. 1992
Oct. 1992 toSept. 1997
Oct. 1997 toSept. 2002
Oct. 2002 toSept. 2007
Oct. 2007 toSept. 2012Sex
Type of employment of the "First Job"
(2) Persons continuing in the first job Of those who took up their first job in “Oct. 2007 to Sept. 2008”, “Persons continuing in
the first job” account for about 60% among “Irregular staffs”. For those who took up their first job after October 2007, looking at when took up the “First Job”
and type of employment of the first job, “Persons continuing in the first job” accounted for 70.4%
of all persons who had taken up their first job as “Regular staffs” in “Oct. 2007 to Sept. 2008”, and
for 56.3% of all persons who had taken up their first job as “Irregular staffs”. In other words, the
ratio of “Persons continuing in the first job” was 14.1 points lower among those whose first job was
irregular employment.
Looking at persons whose first job was irregular employment by sex, “Persons continuing in the
first job” accounted for 48.2% among males and 60.3% among females, revealing that the ratio was
higher among females. (Fig. II-2-17, Table II-2-28)
Fig. II-2-17: Ratio of “Persons continuing in the first job” by when took up the “First Job” and type of employment of the first job
/ 2012
* Ratio of persons continuing in the first job at the time of taking up the first job to all employees, excluding executive of
company or corporation
56.3
60.7
66.7
73.6
90.3
70.4
76.0
81.3
85.9
94.6
0 20 40 60 80 100
Oct. 2007 to Sept. 2008(within 4-5 years)
Oct. 2008 to Sept. 2009(within 3-4 years)
Oct. 2009 to Sept. 2010(within 2-3 years)
Oct. 2010 to Sept. 2011(within 1-2 years)
Oct. 2011 to Sept. 2012(within 1 year)
(%)
Whe
n to
ok u
p the
"Firs
t job
Regular staffs
Irregular staffs
In brackets: Continuous term of "First job"
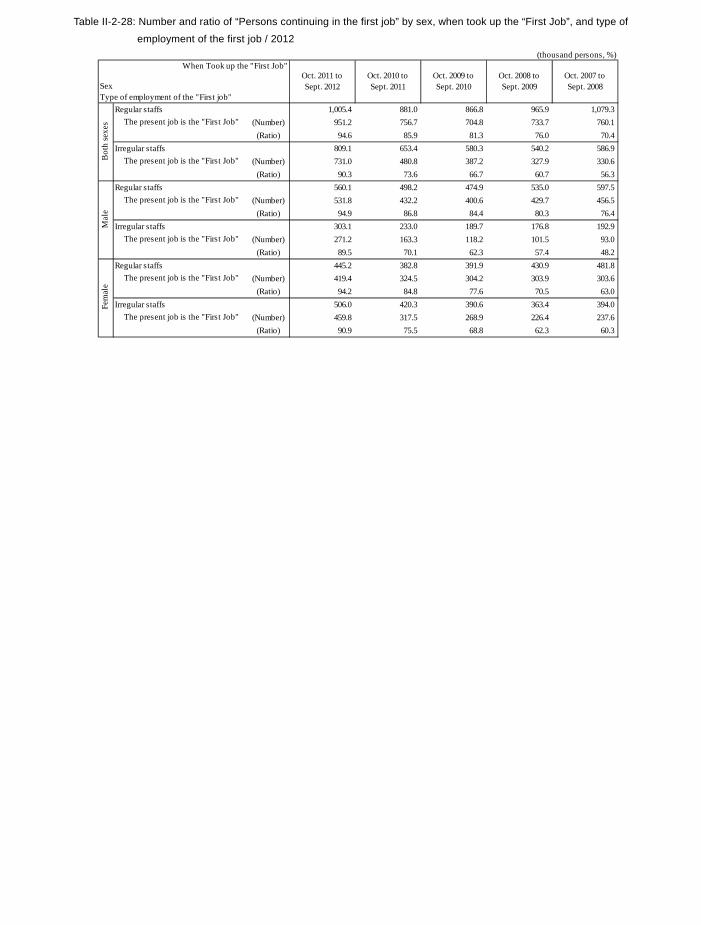
214
Table II-2-28: Number and ratio of “Persons continuing in the first job” by sex, when took up the “First Job”, and type of
employment of the first job / 2012
(thousand persons, %)
Regular staffs 1,005.4 881.0 866.8 965.9 1,079.3(Number) 951.2 756.7 704.8 733.7 760.1
(Ratio) 94.6 85.9 81.3 76.0 70.4Irregular staffs 809.1 653.4 580.3 540.2 586.9
(Number) 731.0 480.8 387.2 327.9 330.6(Ratio) 90.3 73.6 66.7 60.7 56.3
Regular staffs 560.1 498.2 474.9 535.0 597.5(Number) 531.8 432.2 400.6 429.7 456.5
(Ratio) 94.9 86.8 84.4 80.3 76.4Irregular staffs 303.1 233.0 189.7 176.8 192.9
(Number) 271.2 163.3 118.2 101.5 93.0(Ratio) 89.5 70.1 62.3 57.4 48.2
Regular staffs 445.2 382.8 391.9 430.9 481.8(Number) 419.4 324.5 304.2 303.9 303.6
(Ratio) 94.2 84.8 77.6 70.5 63.0Irregular staffs 506.0 420.3 390.6 363.4 394.0
(Number) 459.8 317.5 268.9 226.4 237.6(Ratio) 90.9 75.5 68.8 62.3 60.3
When Took up the "First Job"Oct. 2011 toSept. 2012
Oct. 2010 toSept. 2011
Oct. 2009 toSept. 2010
Oct. 2008 toSept. 2009
Oct. 2007 toSept. 2008Sex
Type of employment of the "First job"Fe
mal
e
The present job is the "First Job"
The present job is the "First Job"
Bot
h se
xes The present job is the "First Job"
The present job is the "First Job"
Mal
e
The present job is the "First Job"
The present job is the "First Job"
(3) Period from graduation to taking up the “First Job”, and type of employment a. The longer the period from graduation to taking up the “First Job”, the lower the
“Regular staffs” ratio. Looking at “Employees, excluding executive of company or corporation” by period from
graduation to taking up the “First Job” and main type of employment, “Regular staffs” accounted
for 83.5% of those whose period was “Less than 1 year”, whereas “Irregular staffs” accounted for
14.3%. For “1 year to less than 3 years”, “Regular staffs” accounted for 66.5%, whereas “Irregular
staffs” accounted for 28.5%. For “3 to less than 5 years”, “Regular staffs” accounted for 58.9%,
whereas “Irregular staffs” accounted for 33.7%. In other words, the ratio of “Regular staffs”
decreases as the period from graduation to taking up the “First Job” becomes longer.
For “10 years and over”, “Regular staffs” accounted for 36.5%, whereas “Irregular staffs” accounted
for 52.6%, which means the ratio of “Irregular staffs” was higher than that of “Regular staffs”.
By sex, for both sexes, the ratio of “Regular staffs” decreases as the period from graduation to
taking up the “First Job” becomes longer. Among females whose period was “5 to less than 10
years” and “10 years or over”, “Regular staffs” accounted for 37.4% and 21.8%, respectively,
whereas “Irregular staffs” accounted for 55.5% and 71.4%, respectively. In those periods, the ratio
of Irregular staffs” was higher than “Regular staffs”. (Table II-2-29, Fig. II-2-18)
Table II-2-29: Number and ratio of persons aged 15 and over (those who graduated from school and took up their first
job after 1983) by sex, status in employment and type of employment, and period from graduation to
taking up the “First Job” / 2012
(thousand persons, %)Period from graduation to taking up the "First Job"
Both sexes 42,079.4 30,959.4 4,305.8 1,572.3 1,768.4 2,205.6 Employees, excluding executive of company or corporation 40,527.7 30,281.0 4,090.6 1,455.2 1,577.6 1,966.1 Regular staffs 32,213.4 25,842.8 2,862.5 925.6 927.2 805.8 Irregular staffs 8,314.2 4,438.1 1,228.1 529.6 650.4 1,160.3Male 21,467.3 15,571.8 2,486.0 965.4 1,002.5 806.1 Employees, excluding executive of company or corporation 20,344.7 15,073.1 2,317.5 873.7 866.3 661.9 Regular staffs 17,429.8 13,421.7 1,778.5 626.6 640.6 500.7 Irregular staffs 2,914.9 1,651.4 539.0 247.1 225.6 161.2Female 20,612.1 15,387.7 1,819.8 606.9 765.9 1,399.5 Employees, excluding executive of company or corporation 20,183.0 15,207.9 1,773.1 581.5 711.3 1,304.2 Regular staffs 14,783.6 12,421.1 1,084.0 299.0 286.5 305.1 Irregular staffs 5,399.3 2,786.7 689.1 282.5 424.8 999.1Both sexes 100.0 100.0 100.0 100.0 100.0 100.0 Employees, excluding executive of company or corporation 96.3 97.8 95.0 92.6 89.2 89.1 Regular staffs 76.6 83.5 66.5 58.9 52.4 36.5 Irregular staffs 19.8 14.3 28.5 33.7 36.8 52.6Male 100.0 100.0 100.0 100.0 100.0 100.0 Employees, excluding executive of company or corporation 94.8 96.8 93.2 90.5 86.4 82.1 Regular staffs 81.2 86.2 71.5 64.9 63.9 62.1 Irregular staffs 13.6 10.6 21.7 25.6 22.5 20.0Female 100.0 100.0 100.0 100.0 100.0 100.0 Employees, excluding executive of company or corporation 97.9 98.8 97.4 95.8 92.9 93.2 Regular staffs 71.7 80.7 59.6 49.3 37.4 21.8 Irregular staffs 26.2 18.1 37.9 46.5 55.5 71.4
Num
ber
Rat
io
Total Less than 1year
1 year to lessthan 3 years
3 to less than5 years
5 to less than10 years
10 years orover
SexStatus in employment and type of employmentof the "First job"
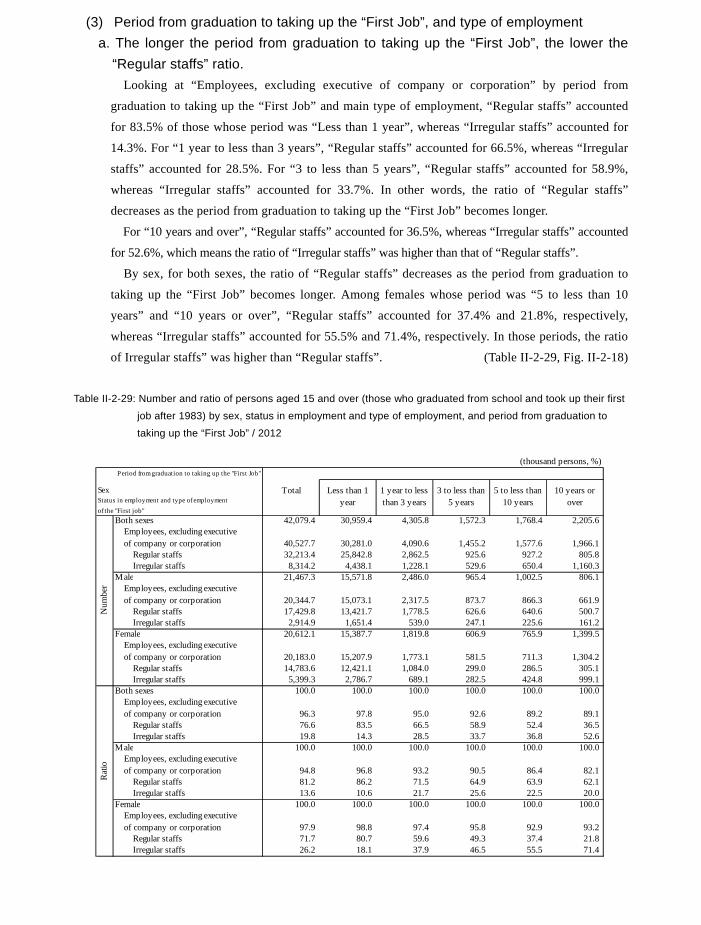
215
Table II-2-28: Number and ratio of “Persons continuing in the first job” by sex, when took up the “First Job”, and type of
employment of the first job / 2012
(thousand persons, %)
Regular staffs 1,005.4 881.0 866.8 965.9 1,079.3(Number) 951.2 756.7 704.8 733.7 760.1
(Ratio) 94.6 85.9 81.3 76.0 70.4Irregular staffs 809.1 653.4 580.3 540.2 586.9
(Number) 731.0 480.8 387.2 327.9 330.6(Ratio) 90.3 73.6 66.7 60.7 56.3
Regular staffs 560.1 498.2 474.9 535.0 597.5(Number) 531.8 432.2 400.6 429.7 456.5
(Ratio) 94.9 86.8 84.4 80.3 76.4Irregular staffs 303.1 233.0 189.7 176.8 192.9
(Number) 271.2 163.3 118.2 101.5 93.0(Ratio) 89.5 70.1 62.3 57.4 48.2
Regular staffs 445.2 382.8 391.9 430.9 481.8(Number) 419.4 324.5 304.2 303.9 303.6
(Ratio) 94.2 84.8 77.6 70.5 63.0Irregular staffs 506.0 420.3 390.6 363.4 394.0
(Number) 459.8 317.5 268.9 226.4 237.6(Ratio) 90.9 75.5 68.8 62.3 60.3
When Took up the "First Job"Oct. 2011 toSept. 2012
Oct. 2010 toSept. 2011
Oct. 2009 toSept. 2010
Oct. 2008 toSept. 2009
Oct. 2007 toSept. 2008Sex
Type of employment of the "First job"
Fem
ale
The present job is the "First Job"
The present job is the "First Job"
Bot
h se
xes The present job is the "First Job"
The present job is the "First Job"
Mal
e
The present job is the "First Job"
The present job is the "First Job"
(3) Period from graduation to taking up the “First Job”, and type of employment a. The longer the period from graduation to taking up the “First Job”, the lower the
“Regular staffs” ratio. Looking at “Employees, excluding executive of company or corporation” by period from
graduation to taking up the “First Job” and main type of employment, “Regular staffs” accounted
for 83.5% of those whose period was “Less than 1 year”, whereas “Irregular staffs” accounted for
14.3%. For “1 year to less than 3 years”, “Regular staffs” accounted for 66.5%, whereas “Irregular
staffs” accounted for 28.5%. For “3 to less than 5 years”, “Regular staffs” accounted for 58.9%,
whereas “Irregular staffs” accounted for 33.7%. In other words, the ratio of “Regular staffs”
decreases as the period from graduation to taking up the “First Job” becomes longer.
For “10 years and over”, “Regular staffs” accounted for 36.5%, whereas “Irregular staffs” accounted
for 52.6%, which means the ratio of “Irregular staffs” was higher than that of “Regular staffs”.
By sex, for both sexes, the ratio of “Regular staffs” decreases as the period from graduation to
taking up the “First Job” becomes longer. Among females whose period was “5 to less than 10
years” and “10 years or over”, “Regular staffs” accounted for 37.4% and 21.8%, respectively,
whereas “Irregular staffs” accounted for 55.5% and 71.4%, respectively. In those periods, the ratio
of Irregular staffs” was higher than “Regular staffs”. (Table II-2-29, Fig. II-2-18)
Table II-2-29: Number and ratio of persons aged 15 and over (those who graduated from school and took up their first
job after 1983) by sex, status in employment and type of employment, and period from graduation to
taking up the “First Job” / 2012
(thousand persons, %)Period from graduation to taking up the "First Job"
Both sexes 42,079.4 30,959.4 4,305.8 1,572.3 1,768.4 2,205.6 Employees, excluding executive of company or corporation 40,527.7 30,281.0 4,090.6 1,455.2 1,577.6 1,966.1 Regular staffs 32,213.4 25,842.8 2,862.5 925.6 927.2 805.8 Irregular staffs 8,314.2 4,438.1 1,228.1 529.6 650.4 1,160.3Male 21,467.3 15,571.8 2,486.0 965.4 1,002.5 806.1 Employees, excluding executive of company or corporation 20,344.7 15,073.1 2,317.5 873.7 866.3 661.9 Regular staffs 17,429.8 13,421.7 1,778.5 626.6 640.6 500.7 Irregular staffs 2,914.9 1,651.4 539.0 247.1 225.6 161.2Female 20,612.1 15,387.7 1,819.8 606.9 765.9 1,399.5 Employees, excluding executive of company or corporation 20,183.0 15,207.9 1,773.1 581.5 711.3 1,304.2 Regular staffs 14,783.6 12,421.1 1,084.0 299.0 286.5 305.1 Irregular staffs 5,399.3 2,786.7 689.1 282.5 424.8 999.1Both sexes 100.0 100.0 100.0 100.0 100.0 100.0 Employees, excluding executive of company or corporation 96.3 97.8 95.0 92.6 89.2 89.1 Regular staffs 76.6 83.5 66.5 58.9 52.4 36.5 Irregular staffs 19.8 14.3 28.5 33.7 36.8 52.6Male 100.0 100.0 100.0 100.0 100.0 100.0 Employees, excluding executive of company or corporation 94.8 96.8 93.2 90.5 86.4 82.1 Regular staffs 81.2 86.2 71.5 64.9 63.9 62.1 Irregular staffs 13.6 10.6 21.7 25.6 22.5 20.0Female 100.0 100.0 100.0 100.0 100.0 100.0 Employees, excluding executive of company or corporation 97.9 98.8 97.4 95.8 92.9 93.2 Regular staffs 71.7 80.7 59.6 49.3 37.4 21.8 Irregular staffs 26.2 18.1 37.9 46.5 55.5 71.4
Num
ber
Rat
io
Total Less than 1year
1 year to lessthan 3 years
3 to less than5 years
5 to less than10 years
10 years orover
SexStatus in employment and type of employmentof the "First job"
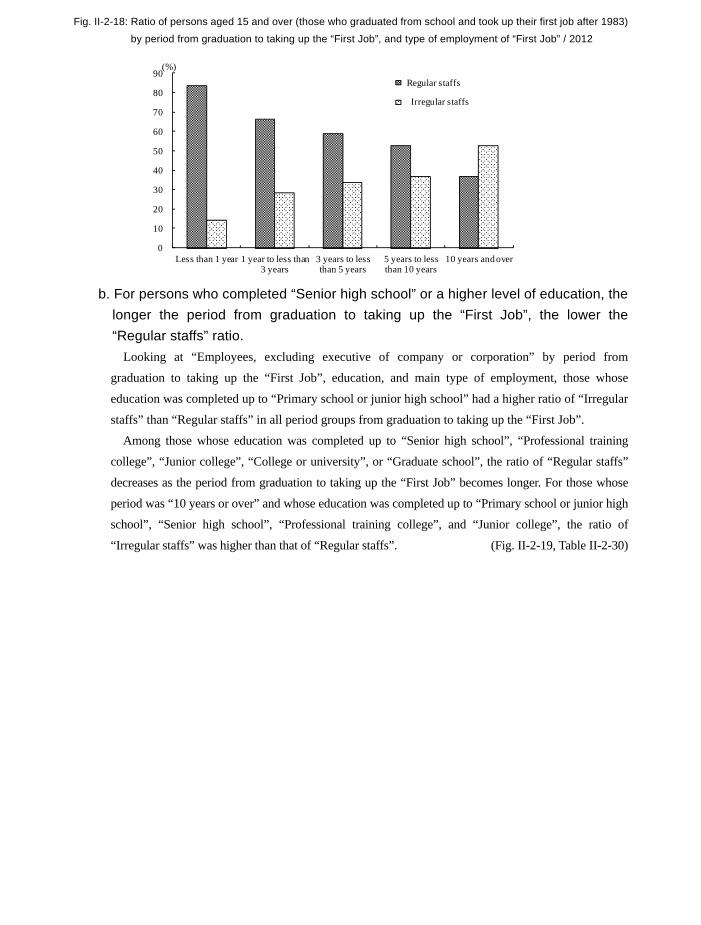
216
Fig. II-2-18: Ratio of persons aged 15 and over (those who graduated from school and took up their first job after 1983)
by period from graduation to taking up the “First Job”, and type of employment of “First Job” / 2012
b. For persons who completed “Senior high school” or a higher level of education, the longer the period from graduation to taking up the “First Job”, the lower the “Regular staffs” ratio.
Looking at “Employees, excluding executive of company or corporation” by period from
graduation to taking up the “First Job”, education, and main type of employment, those whose
education was completed up to “Primary school or junior high school” had a higher ratio of “Irregular
staffs” than “Regular staffs” in all period groups from graduation to taking up the “First Job”.
Among those whose education was completed up to “Senior high school”, “Professional training
college”, “Junior college”, “College or university”, or “Graduate school”, the ratio of “Regular staffs”
decreases as the period from graduation to taking up the “First Job” becomes longer. For those whose
period was “10 years or over” and whose education was completed up to “Primary school or junior high
school”, “Senior high school”, “Professional training college”, and “Junior college”, the ratio of
“Irregular staffs” was higher than that of “Regular staffs”. (Fig. II-2-19, Table II-2-30)
0
10
20
30
40
50
60
70
80
90
Less than 1 year 1 year to less than 3 years
3 years to less than 5 years
5 years to less than 10 years
10 years and over
(%)
Regular staffs
Irregular staffs
Fig. II-2-19: Ratio of regular staffs (those who graduated from school and took up their first job after 1983) by period
from graduation to taking up the “First Job” and education / 2012
0
10
20
30
40
50
60
70
80
90
100
Less than 1 year
1 year to less than 3 years
3 years to less than 5 years
5 years to less than 10 years
10 years and over
Graduate school
College or university
Junior college
Professional training college
Senior high school
Primary school or junior high school
(%)
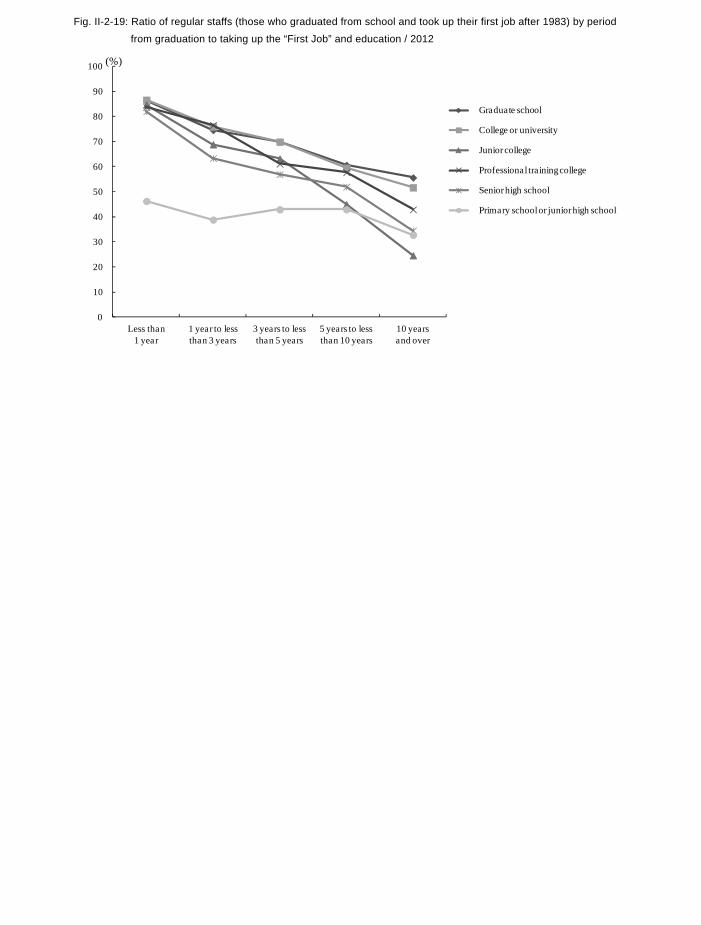
217
Fig. II-2-18: Ratio of persons aged 15 and over (those who graduated from school and took up their first job after 1983)
by period from graduation to taking up the “First Job”, and type of employment of “First Job” / 2012
b. For persons who completed “Senior high school” or a higher level of education, the longer the period from graduation to taking up the “First Job”, the lower the “Regular staffs” ratio.
Looking at “Employees, excluding executive of company or corporation” by period from
graduation to taking up the “First Job”, education, and main type of employment, those whose
education was completed up to “Primary school or junior high school” had a higher ratio of “Irregular
staffs” than “Regular staffs” in all period groups from graduation to taking up the “First Job”.
Among those whose education was completed up to “Senior high school”, “Professional training
college”, “Junior college”, “College or university”, or “Graduate school”, the ratio of “Regular staffs”
decreases as the period from graduation to taking up the “First Job” becomes longer. For those whose
period was “10 years or over” and whose education was completed up to “Primary school or junior high
school”, “Senior high school”, “Professional training college”, and “Junior college”, the ratio of
“Irregular staffs” was higher than that of “Regular staffs”. (Fig. II-2-19, Table II-2-30)
0
10
20
30
40
50
60
70
80
90
Less than 1 year 1 year to less than 3 years
3 years to less than 5 years
5 years to less than 10 years
10 years and over
(%)
Regular staffs
Irregular staffs
Fig. II-2-19: Ratio of regular staffs (those who graduated from school and took up their first job after 1983) by period
from graduation to taking up the “First Job” and education / 2012
0
10
20
30
40
50
60
70
80
90
100
Less than 1 year
1 year to less than 3 years
3 years to less than 5 years
5 years to less than 10 years
10 years and over
Graduate school
College or university
Junior college
Professional training college
Senior high school
Primary school or junior high school
(%)
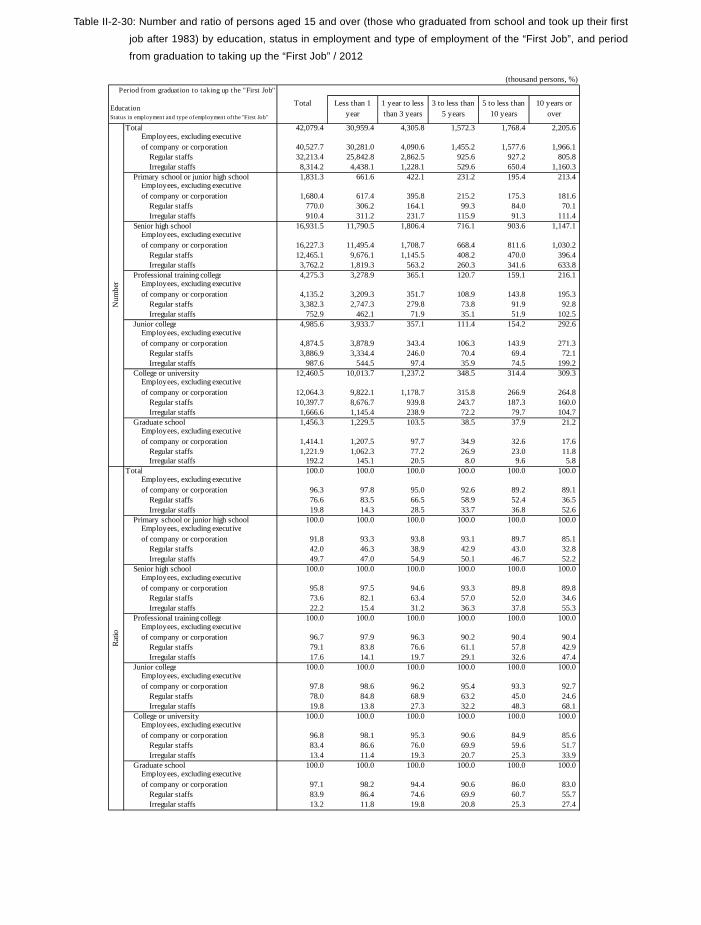
218
Table II-2-30: Number and ratio of persons aged 15 and over (those who graduated from school and took up their first
job after 1983) by education, status in employment and type of employment of the “First Job”, and period
from graduation to taking up the “First Job” / 2012
(thousand persons, %)
Period from graduation to taking up the "First Job"
Total 42,079.4 30,959.4 4,305.8 1,572.3 1,768.4 2,205.6 Employees, excluding executive of company or corporation 40,527.7 30,281.0 4,090.6 1,455.2 1,577.6 1,966.1 Regular staffs 32,213.4 25,842.8 2,862.5 925.6 927.2 805.8 Irregular staffs 8,314.2 4,438.1 1,228.1 529.6 650.4 1,160.3 Primary school or junior high school 1,831.3 661.6 422.1 231.2 195.4 213.4 Employees, excluding executive of company or corporation 1,680.4 617.4 395.8 215.2 175.3 181.6 Regular staffs 770.0 306.2 164.1 99.3 84.0 70.1 Irregular staffs 910.4 311.2 231.7 115.9 91.3 111.4 Senior high school 16,931.5 11,790.5 1,806.4 716.1 903.6 1,147.1 Employees, excluding executive of company or corporation 16,227.3 11,495.4 1,708.7 668.4 811.6 1,030.2 Regular staffs 12,465.1 9,676.1 1,145.5 408.2 470.0 396.4 Irregular staffs 3,762.2 1,819.3 563.2 260.3 341.6 633.8 Professional training college 4,275.3 3,278.9 365.1 120.7 159.1 216.1 Employees, excluding executive of company or corporation 4,135.2 3,209.3 351.7 108.9 143.8 195.3 Regular staffs 3,382.3 2,747.3 279.8 73.8 91.9 92.8 Irregular staffs 752.9 462.1 71.9 35.1 51.9 102.5 Junior college 4,985.6 3,933.7 357.1 111.4 154.2 292.6 Employees, excluding executive of company or corporation 4,874.5 3,878.9 343.4 106.3 143.9 271.3 Regular staffs 3,886.9 3,334.4 246.0 70.4 69.4 72.1 Irregular staffs 987.6 544.5 97.4 35.9 74.5 199.2 College or university 12,460.5 10,013.7 1,237.2 348.5 314.4 309.3 Employees, excluding executive of company or corporation 12,064.3 9,822.1 1,178.7 315.8 266.9 264.8 Regular staffs 10,397.7 8,676.7 939.8 243.7 187.3 160.0 Irregular staffs 1,666.6 1,145.4 238.9 72.2 79.7 104.7 Graduate school 1,456.3 1,229.5 103.5 38.5 37.9 21.2 Employees, excluding executive of company or corporation 1,414.1 1,207.5 97.7 34.9 32.6 17.6 Regular staffs 1,221.9 1,062.3 77.2 26.9 23.0 11.8 Irregular staffs 192.2 145.1 20.5 8.0 9.6 5.8Total 100.0 100.0 100.0 100.0 100.0 100.0 Employees, excluding executive of company or corporation 96.3 97.8 95.0 92.6 89.2 89.1 Regular staffs 76.6 83.5 66.5 58.9 52.4 36.5 Irregular staffs 19.8 14.3 28.5 33.7 36.8 52.6 Primary school or junior high school 100.0 100.0 100.0 100.0 100.0 100.0 Employees, excluding executive of company or corporation 91.8 93.3 93.8 93.1 89.7 85.1 Regular staffs 42.0 46.3 38.9 42.9 43.0 32.8 Irregular staffs 49.7 47.0 54.9 50.1 46.7 52.2 Senior high school 100.0 100.0 100.0 100.0 100.0 100.0 Employees, excluding executive of company or corporation 95.8 97.5 94.6 93.3 89.8 89.8 Regular staffs 73.6 82.1 63.4 57.0 52.0 34.6 Irregular staffs 22.2 15.4 31.2 36.3 37.8 55.3 Professional training college 100.0 100.0 100.0 100.0 100.0 100.0 Employees, excluding executive of company or corporation 96.7 97.9 96.3 90.2 90.4 90.4 Regular staffs 79.1 83.8 76.6 61.1 57.8 42.9 Irregular staffs 17.6 14.1 19.7 29.1 32.6 47.4 Junior college 100.0 100.0 100.0 100.0 100.0 100.0 Employees, excluding executive of company or corporation 97.8 98.6 96.2 95.4 93.3 92.7 Regular staffs 78.0 84.8 68.9 63.2 45.0 24.6 Irregular staffs 19.8 13.8 27.3 32.2 48.3 68.1 College or university 100.0 100.0 100.0 100.0 100.0 100.0 Employees, excluding executive of company or corporation 96.8 98.1 95.3 90.6 84.9 85.6 Regular staffs 83.4 86.6 76.0 69.9 59.6 51.7 Irregular staffs 13.4 11.4 19.3 20.7 25.3 33.9 Graduate school 100.0 100.0 100.0 100.0 100.0 100.0 Employees, excluding executive of company or corporation 97.1 98.2 94.4 90.6 86.0 83.0 Regular staffs 83.9 86.4 74.6 69.9 60.7 55.7 Irregular staffs 13.2 11.8 19.8 20.8 25.3 27.4
Num
ber
Rat
ioTotal Less than 1
year1 year to lessthan 3 years
3 to less than5 years
5 to less than10 years
10 years orover
EducationStatus in employment and type of employment of the "First Job"
7. Training or self-development (1) Sex, labour force status and age
a. About one in four people aged 15 and over did training or self-development over the past year.
As for the state of training or self-development by the population of 15 years old and over,
28,697 thousand persons did training or self-development over the past year (Oct. 2011 to Sept.
2012), accounting for 25.9% of the population aged 15 and over, an increase of 1,035 thousand
from 2007. (Table II-2-31)
b. Males have a higher ratio of persons who did training or self-development than females, both among persons engaged in work and persons not engaged in work.
In terms of the labour force status of those who did training or self-development over the past
year (Oct. 2011 to Sept. 2012), persons engaged in work numbered 24,479 thousand, accounting for
38.0% of all persons engaged in work. By sex, the ratio was 39.9% for males and 35.5% for
females, indicating a higher level of participation by males.
On the other hand, 4,218 thousand persons not engaged in work did training or self-development,
accounting for 9.1% of all persons not engaged in work. By sex, the ratio for males was higher at
11.6% compared to 7.7% for females.
Compared to 2007, the number of those who did training or self-development increased by 320
thousand among persons engaged in work, and increased by 716 thousand among persons not
engaged in work.
Looking at the ratio of those who did training or self-development by age group, the highest ratio
among persons engaged in work was in the age group of “25 to 34 years old” (46.0%), followed by
“15 to 24” (45.3%) and “45 to 54” (40.3%). Among persons not engaged in work, the highest ratio
was found in the age group of “15 to 24 years old” (21.5%), followed by “25 to 34” (20.9%) and
“35 to 44” (13.9%). (Table II-2-31/32)
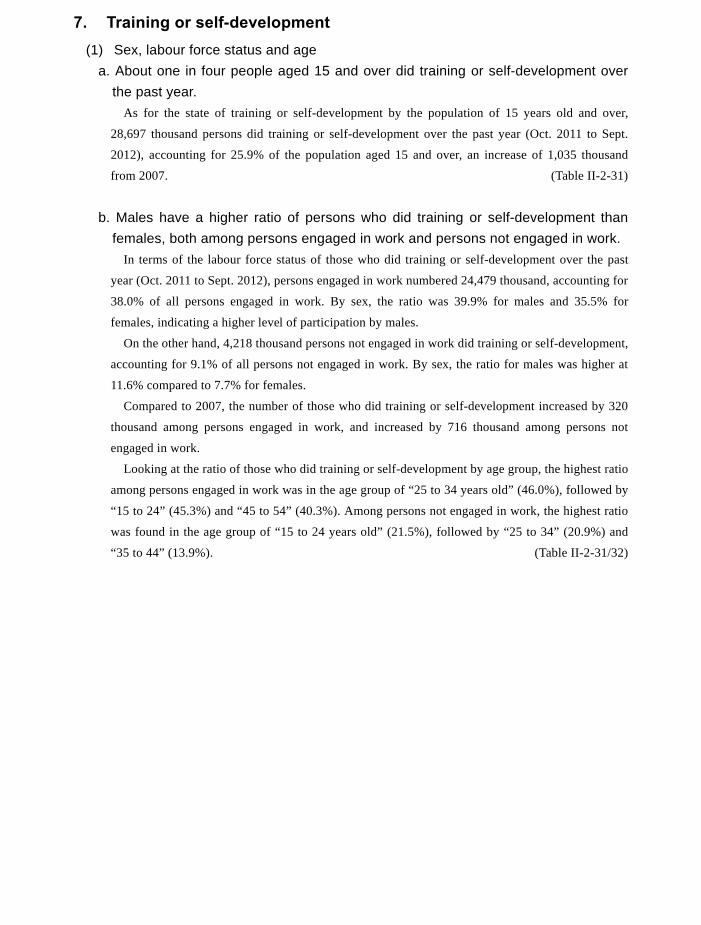
219
Table II-2-30: Number and ratio of persons aged 15 and over (those who graduated from school and took up their first
job after 1983) by education, status in employment and type of employment of the “First Job”, and period
from graduation to taking up the “First Job” / 2012
(thousand persons, %)
Period from graduation to taking up the "First Job"
Total 42,079.4 30,959.4 4,305.8 1,572.3 1,768.4 2,205.6 Employees, excluding executive of company or corporation 40,527.7 30,281.0 4,090.6 1,455.2 1,577.6 1,966.1 Regular staffs 32,213.4 25,842.8 2,862.5 925.6 927.2 805.8 Irregular staffs 8,314.2 4,438.1 1,228.1 529.6 650.4 1,160.3 Primary school or junior high school 1,831.3 661.6 422.1 231.2 195.4 213.4 Employees, excluding executive of company or corporation 1,680.4 617.4 395.8 215.2 175.3 181.6 Regular staffs 770.0 306.2 164.1 99.3 84.0 70.1 Irregular staffs 910.4 311.2 231.7 115.9 91.3 111.4 Senior high school 16,931.5 11,790.5 1,806.4 716.1 903.6 1,147.1 Employees, excluding executive of company or corporation 16,227.3 11,495.4 1,708.7 668.4 811.6 1,030.2 Regular staffs 12,465.1 9,676.1 1,145.5 408.2 470.0 396.4 Irregular staffs 3,762.2 1,819.3 563.2 260.3 341.6 633.8 Professional training college 4,275.3 3,278.9 365.1 120.7 159.1 216.1 Employees, excluding executive of company or corporation 4,135.2 3,209.3 351.7 108.9 143.8 195.3 Regular staffs 3,382.3 2,747.3 279.8 73.8 91.9 92.8 Irregular staffs 752.9 462.1 71.9 35.1 51.9 102.5 Junior college 4,985.6 3,933.7 357.1 111.4 154.2 292.6 Employees, excluding executive of company or corporation 4,874.5 3,878.9 343.4 106.3 143.9 271.3 Regular staffs 3,886.9 3,334.4 246.0 70.4 69.4 72.1 Irregular staffs 987.6 544.5 97.4 35.9 74.5 199.2 College or university 12,460.5 10,013.7 1,237.2 348.5 314.4 309.3 Employees, excluding executive of company or corporation 12,064.3 9,822.1 1,178.7 315.8 266.9 264.8 Regular staffs 10,397.7 8,676.7 939.8 243.7 187.3 160.0 Irregular staffs 1,666.6 1,145.4 238.9 72.2 79.7 104.7 Graduate school 1,456.3 1,229.5 103.5 38.5 37.9 21.2 Employees, excluding executive of company or corporation 1,414.1 1,207.5 97.7 34.9 32.6 17.6 Regular staffs 1,221.9 1,062.3 77.2 26.9 23.0 11.8 Irregular staffs 192.2 145.1 20.5 8.0 9.6 5.8Total 100.0 100.0 100.0 100.0 100.0 100.0 Employees, excluding executive of company or corporation 96.3 97.8 95.0 92.6 89.2 89.1 Regular staffs 76.6 83.5 66.5 58.9 52.4 36.5 Irregular staffs 19.8 14.3 28.5 33.7 36.8 52.6 Primary school or junior high school 100.0 100.0 100.0 100.0 100.0 100.0 Employees, excluding executive of company or corporation 91.8 93.3 93.8 93.1 89.7 85.1 Regular staffs 42.0 46.3 38.9 42.9 43.0 32.8 Irregular staffs 49.7 47.0 54.9 50.1 46.7 52.2 Senior high school 100.0 100.0 100.0 100.0 100.0 100.0 Employees, excluding executive of company or corporation 95.8 97.5 94.6 93.3 89.8 89.8 Regular staffs 73.6 82.1 63.4 57.0 52.0 34.6 Irregular staffs 22.2 15.4 31.2 36.3 37.8 55.3 Professional training college 100.0 100.0 100.0 100.0 100.0 100.0 Employees, excluding executive of company or corporation 96.7 97.9 96.3 90.2 90.4 90.4 Regular staffs 79.1 83.8 76.6 61.1 57.8 42.9 Irregular staffs 17.6 14.1 19.7 29.1 32.6 47.4 Junior college 100.0 100.0 100.0 100.0 100.0 100.0 Employees, excluding executive of company or corporation 97.8 98.6 96.2 95.4 93.3 92.7 Regular staffs 78.0 84.8 68.9 63.2 45.0 24.6 Irregular staffs 19.8 13.8 27.3 32.2 48.3 68.1 College or university 100.0 100.0 100.0 100.0 100.0 100.0 Employees, excluding executive of company or corporation 96.8 98.1 95.3 90.6 84.9 85.6 Regular staffs 83.4 86.6 76.0 69.9 59.6 51.7 Irregular staffs 13.4 11.4 19.3 20.7 25.3 33.9 Graduate school 100.0 100.0 100.0 100.0 100.0 100.0 Employees, excluding executive of company or corporation 97.1 98.2 94.4 90.6 86.0 83.0 Regular staffs 83.9 86.4 74.6 69.9 60.7 55.7 Irregular staffs 13.2 11.8 19.8 20.8 25.3 27.4
Num
ber
Rat
io
Total Less than 1year
1 year to lessthan 3 years
3 to less than5 years
5 to less than10 years
10 years orover
EducationStatus in employment and type of employment of the "First Job"
7. Training or self-development (1) Sex, labour force status and age
a. About one in four people aged 15 and over did training or self-development over the past year.
As for the state of training or self-development by the population of 15 years old and over,
28,697 thousand persons did training or self-development over the past year (Oct. 2011 to Sept.
2012), accounting for 25.9% of the population aged 15 and over, an increase of 1,035 thousand
from 2007. (Table II-2-31)
b. Males have a higher ratio of persons who did training or self-development than females, both among persons engaged in work and persons not engaged in work.
In terms of the labour force status of those who did training or self-development over the past
year (Oct. 2011 to Sept. 2012), persons engaged in work numbered 24,479 thousand, accounting for
38.0% of all persons engaged in work. By sex, the ratio was 39.9% for males and 35.5% for
females, indicating a higher level of participation by males.
On the other hand, 4,218 thousand persons not engaged in work did training or self-development,
accounting for 9.1% of all persons not engaged in work. By sex, the ratio for males was higher at
11.6% compared to 7.7% for females.
Compared to 2007, the number of those who did training or self-development increased by 320
thousand among persons engaged in work, and increased by 716 thousand among persons not
engaged in work.
Looking at the ratio of those who did training or self-development by age group, the highest ratio
among persons engaged in work was in the age group of “25 to 34 years old” (46.0%), followed by
“15 to 24” (45.3%) and “45 to 54” (40.3%). Among persons not engaged in work, the highest ratio
was found in the age group of “15 to 24 years old” (21.5%), followed by “25 to 34” (20.9%) and
“35 to 44” (13.9%). (Table II-2-31/32)

220
Table II-2-31: Number and ratio of persons aged 15 and over by sex, labour force status, whether did training or
self-development, and type of training or self-development / 2007, 2012
(thousand persons, %, points)Whether did Training or Self-Development
Type of Training or Self-Development
SexLabour Force Status
Both sexes 110,815.1 28,696.8 19,035.0 17,320.3 79,891.3 Engaged in work 64,420.7 24,478.9 17,983.7 13,711.1 38,989.4 Not engaged in work 46,394.4 4,217.9 1,051.4 3,609.2 40,901.9Male 53,413.2 16,575.5 11,363.4 9,648.2 35,820.8 Engaged in work 36,744.5 14,644.4 10,838.5 8,009.7 21,562.8 Not engaged in work 16,668.7 1,931.1 524.9 1,638.4 14,258.0Female 57,401.9 12,121.3 7,671.6 7,672.1 44,070.5 Engaged in work 27,676.2 9,834.5 7,145.1 5,701.4 17,426.5 Not engaged in work 29,725.7 2,286.9 526.5 1,970.8 26,643.9Both sexes 110,301.5 27,661.5 19,245.2 15,269.9 80,813.8 Engaged in work 65,977.5 24,159.4 18,285.6 12,390.7 40,928.9 Not engaged in work 44,324.0 3,502.1 959.6 2,879.2 39,884.9Male 53,282.5 16,432.6 11,880.3 8,592.6 35,972.2 Engaged in work 38,174.8 14,903.6 11,437.2 7,348.4 22,755.1 Not engaged in work 15,107.8 1,529.0 443.1 1,244.2 13,217.1Female 57,018.9 11,228.9 7,365.0 6,677.3 44,841.6 Engaged in work 27,802.7 9,255.8 6,848.4 5,042.3 18,173.8 Not engaged in work 29,216.2 1,973.1 516.5 1,635.0 26,667.7Both sexes 513.6 1,035.3 -210.2 2,050.4 -922.5 Engaged in work -1,556.8 319.5 -301.9 1,320.4 -1,939.5 Not engaged in work 2,070.4 715.8 91.8 730.0 1,017.0Male 130.7 142.9 -516.9 1,055.6 -151.4 Engaged in work -1,430.3 -259.2 -598.7 661.3 -1,192.3 Not engaged in work 1,560.9 402.1 81.8 394.2 1,040.9Female 383.0 892.4 306.6 994.8 -771.1 Engaged in work -126.5 578.7 296.7 659.1 -747.3 Not engaged in work 509.5 313.8 10.0 335.8 -23.8Both sexes 100.0 25.9 17.2 15.6 72.1 Engaged in work 100.0 38.0 27.9 21.3 60.5 Not engaged in work 100.0 9.1 2.3 7.8 88.2Male 100.0 31.0 21.3 18.1 67.1 Engaged in work 100.0 39.9 29.5 21.8 58.7 Not engaged in work 100.0 11.6 3.1 9.8 85.5Female 100.0 21.1 13.4 13.4 76.8 Engaged in work 100.0 35.5 25.8 20.6 63.0 Not engaged in work 100.0 7.7 1.8 6.6 89.6Both sexes 100.0 25.1 17.4 13.8 73.3 Engaged in work 100.0 36.6 27.7 18.8 62.0 Not engaged in work 100.0 7.9 2.2 6.5 90.0Male 100.0 30.8 22.3 16.1 67.5 Engaged in work 100.0 39.0 30.0 19.2 59.6 Not engaged in work 100.0 10.1 2.9 8.2 87.5Female 100.0 19.7 12.9 11.7 78.6 Engaged in work 100.0 33.3 24.6 18.1 65.4 Not engaged in work 100.0 6.8 1.8 5.6 91.3Both sexes - 0.8 -0.2 1.8 -1.2 Engaged in work - 1.4 0.2 2.5 -1.5 Not engaged in work - 1.2 0.1 1.3 -1.8Male - 0.2 -1.0 2.0 -0.4 Engaged in work - 0.9 -0.5 2.6 -0.9 Not engaged in work - 1.5 0.2 1.6 -2.0Female - 1.4 0.5 1.7 -1.8 Engaged in work - 2.2 1.2 2.5 -2.4 Not engaged in work - 0.9 0.0 1.0 -1.7
2007
Cha
nge
2012
2007
Cha
nge
Num
ber
Rat
io
2012
Total
Did training or self-developmentNot did training
or self-developmentTotal
Conducted byemployer
Initiated byoneself
Table II-2-32: Number and ratio of persons aged 15 and over by labour force status, age group, whether did training or
self-development, and type of training or self-development / 2012
c. Persons who did training “Conducted by employer” have the highest ratio of
“On-job training” for both sexes. Looking at persons who did training or self-development over the past year (Oct. 2011 to Sept.
2012) by type of training or self-development (conducted by employer), “On-job training” was
most numerous with 13,399 thousand, followed by “Participation in study sessions/workshops”
(5,293 thousand), and “Observation of training sessions/seminars” (4,069 thousand).
Compared to 2007, “Lectures at a university/graduate school” increased by 6 thousand, while
“Observation of training sessions/seminars” decreased by 360 thousand.
By sex, for males, the ratio of “On-job training” was highest with 7,997 thousand, followed by
“Participation in study sessions/workshops” (2,925 thousand) and “Observation of training
sessions/seminars” (2,643 thousand). For females, “On-job training” was highest with 5,403
thousand, followed by “Participation in study sessions/workshops” (2,368 thousand) and
“Observation of training sessions/seminars” (1,426 thousand). (Table II-2-33)
(thousand persons, %)
Labour Force Status
Total 110,815.1 28,696.8 19,035.0 17,320.3 79,891.3 Engaged in work 64,420.7 24,478.9 17,983.7 13,711.1 38,989.4 15 to 24 years old 5,000.7 2,265.8 1,703.0 1,253.8 2,678.7 25 to 34 12,035.5 5,532.7 4,157.8 3,229.2 6,334.1 35 to 44 15,324.2 6,147.5 4,559.8 3,430.1 8,951.8 45 to 54 13,244.9 5,332.5 4,046.8 2,882.8 7,727.4 55 to 64 12,261.7 3,789.1 2,715.8 2,024.6 8,295.2 65 years old and over 6,553.6 1,411.3 800.5 890.7 5,002.1 Not engaged in work 46,394.4 4,217.9 1,051.4 3,609.2 40,901.9 15 to 24 years old 7,281.2 1,562.0 468.8 1,303.0 5,663.6 25 to 34 2,796.8 585.5 139.9 517.5 2,148.9 35 to 44 3,533.1 490.3 79.6 442.4 2,964.4 45 to 54 2,619.9 351.4 67.8 309.8 2,188.9 55 to 64 5,928.9 474.4 114.2 403.8 5,290.3 65 years old and over 24,234.7 754.3 181.0 632.7 22,645.8Total 100.0 25.9 17.2 15.6 72.1 Engaged in work 100.0 38.0 27.9 21.3 60.5 15 to 24 years old 100.0 45.3 34.1 25.1 53.6 25 to 34 100.0 46.0 34.5 26.8 52.6 35 to 44 100.0 40.1 29.8 22.4 58.4 45 to 54 100.0 40.3 30.6 21.8 58.3 55 to 64 100.0 30.9 22.1 16.5 67.7 65 years old and over 100.0 21.5 12.2 13.6 76.3 Not engaged in work 100.0 9.1 2.3 7.8 88.2 15 to 24 years old 100.0 21.5 6.4 17.9 77.8 25 to 34 100.0 20.9 5.0 18.5 76.8 35 to 44 100.0 13.9 2.3 12.5 83.9 45 to 54 100.0 13.4 2.6 11.8 83.5 55 to 64 100.0 8.0 1.9 6.8 89.2 65 years old and over 100.0 3.1 0.7 2.6 93.4
Num
ber
Rat
io
Whether did T raining or Self-Development
Total
Did training or self-development Not did trainingor self-
development
Type of T raining or Self-DevelopmentTotal
Conducted byemployer
Initiated byoneselfAge
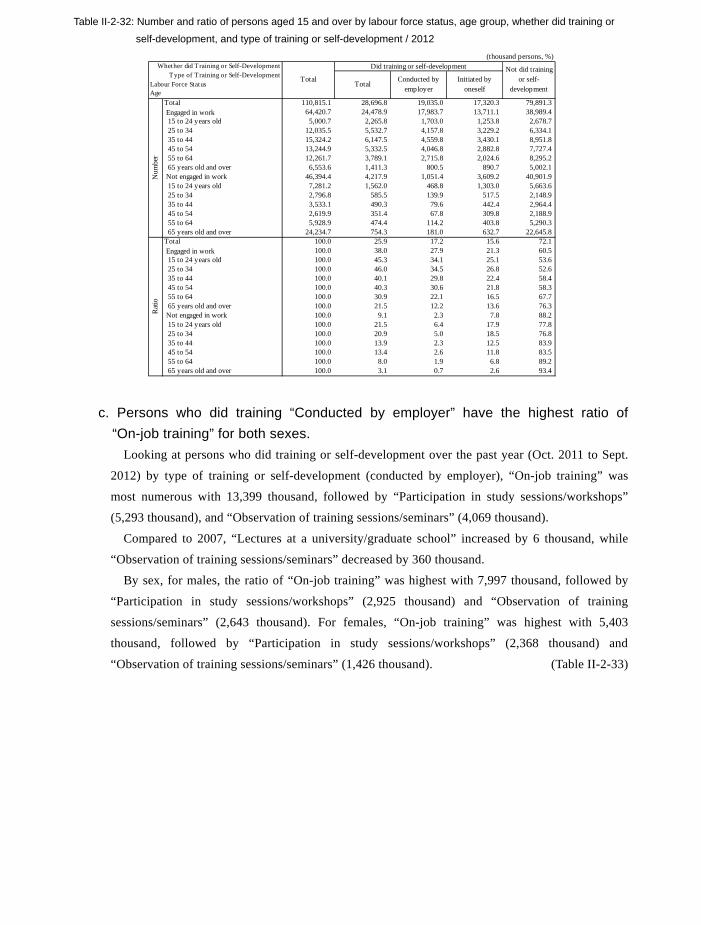
221
Table II-2-31: Number and ratio of persons aged 15 and over by sex, labour force status, whether did training or
self-development, and type of training or self-development / 2007, 2012
(thousand persons, %, points)Whether did Training or Self-Development
Type of Training or Self-Development
SexLabour Force Status
Both sexes 110,815.1 28,696.8 19,035.0 17,320.3 79,891.3 Engaged in work 64,420.7 24,478.9 17,983.7 13,711.1 38,989.4 Not engaged in work 46,394.4 4,217.9 1,051.4 3,609.2 40,901.9Male 53,413.2 16,575.5 11,363.4 9,648.2 35,820.8 Engaged in work 36,744.5 14,644.4 10,838.5 8,009.7 21,562.8 Not engaged in work 16,668.7 1,931.1 524.9 1,638.4 14,258.0Female 57,401.9 12,121.3 7,671.6 7,672.1 44,070.5 Engaged in work 27,676.2 9,834.5 7,145.1 5,701.4 17,426.5 Not engaged in work 29,725.7 2,286.9 526.5 1,970.8 26,643.9Both sexes 110,301.5 27,661.5 19,245.2 15,269.9 80,813.8 Engaged in work 65,977.5 24,159.4 18,285.6 12,390.7 40,928.9 Not engaged in work 44,324.0 3,502.1 959.6 2,879.2 39,884.9Male 53,282.5 16,432.6 11,880.3 8,592.6 35,972.2 Engaged in work 38,174.8 14,903.6 11,437.2 7,348.4 22,755.1 Not engaged in work 15,107.8 1,529.0 443.1 1,244.2 13,217.1Female 57,018.9 11,228.9 7,365.0 6,677.3 44,841.6 Engaged in work 27,802.7 9,255.8 6,848.4 5,042.3 18,173.8 Not engaged in work 29,216.2 1,973.1 516.5 1,635.0 26,667.7Both sexes 513.6 1,035.3 -210.2 2,050.4 -922.5 Engaged in work -1,556.8 319.5 -301.9 1,320.4 -1,939.5 Not engaged in work 2,070.4 715.8 91.8 730.0 1,017.0Male 130.7 142.9 -516.9 1,055.6 -151.4 Engaged in work -1,430.3 -259.2 -598.7 661.3 -1,192.3 Not engaged in work 1,560.9 402.1 81.8 394.2 1,040.9Female 383.0 892.4 306.6 994.8 -771.1 Engaged in work -126.5 578.7 296.7 659.1 -747.3 Not engaged in work 509.5 313.8 10.0 335.8 -23.8Both sexes 100.0 25.9 17.2 15.6 72.1 Engaged in work 100.0 38.0 27.9 21.3 60.5 Not engaged in work 100.0 9.1 2.3 7.8 88.2Male 100.0 31.0 21.3 18.1 67.1 Engaged in work 100.0 39.9 29.5 21.8 58.7 Not engaged in work 100.0 11.6 3.1 9.8 85.5Female 100.0 21.1 13.4 13.4 76.8 Engaged in work 100.0 35.5 25.8 20.6 63.0 Not engaged in work 100.0 7.7 1.8 6.6 89.6Both sexes 100.0 25.1 17.4 13.8 73.3 Engaged in work 100.0 36.6 27.7 18.8 62.0 Not engaged in work 100.0 7.9 2.2 6.5 90.0Male 100.0 30.8 22.3 16.1 67.5 Engaged in work 100.0 39.0 30.0 19.2 59.6 Not engaged in work 100.0 10.1 2.9 8.2 87.5Female 100.0 19.7 12.9 11.7 78.6 Engaged in work 100.0 33.3 24.6 18.1 65.4 Not engaged in work 100.0 6.8 1.8 5.6 91.3Both sexes - 0.8 -0.2 1.8 -1.2 Engaged in work - 1.4 0.2 2.5 -1.5 Not engaged in work - 1.2 0.1 1.3 -1.8Male - 0.2 -1.0 2.0 -0.4 Engaged in work - 0.9 -0.5 2.6 -0.9 Not engaged in work - 1.5 0.2 1.6 -2.0Female - 1.4 0.5 1.7 -1.8 Engaged in work - 2.2 1.2 2.5 -2.4 Not engaged in work - 0.9 0.0 1.0 -1.7
2007
Cha
nge
2012
2007
Cha
nge
Num
ber
Rat
io
2012
Total
Did training or self-developmentNot did training
or self-developmentTotal
Conducted byemployer
Initiated byoneself
Table II-2-32: Number and ratio of persons aged 15 and over by labour force status, age group, whether did training or
self-development, and type of training or self-development / 2012
c. Persons who did training “Conducted by employer” have the highest ratio of
“On-job training” for both sexes. Looking at persons who did training or self-development over the past year (Oct. 2011 to Sept.
2012) by type of training or self-development (conducted by employer), “On-job training” was
most numerous with 13,399 thousand, followed by “Participation in study sessions/workshops”
(5,293 thousand), and “Observation of training sessions/seminars” (4,069 thousand).
Compared to 2007, “Lectures at a university/graduate school” increased by 6 thousand, while
“Observation of training sessions/seminars” decreased by 360 thousand.
By sex, for males, the ratio of “On-job training” was highest with 7,997 thousand, followed by
“Participation in study sessions/workshops” (2,925 thousand) and “Observation of training
sessions/seminars” (2,643 thousand). For females, “On-job training” was highest with 5,403
thousand, followed by “Participation in study sessions/workshops” (2,368 thousand) and
“Observation of training sessions/seminars” (1,426 thousand). (Table II-2-33)
(thousand persons, %)
Labour Force Status
Total 110,815.1 28,696.8 19,035.0 17,320.3 79,891.3 Engaged in work 64,420.7 24,478.9 17,983.7 13,711.1 38,989.4 15 to 24 years old 5,000.7 2,265.8 1,703.0 1,253.8 2,678.7 25 to 34 12,035.5 5,532.7 4,157.8 3,229.2 6,334.1 35 to 44 15,324.2 6,147.5 4,559.8 3,430.1 8,951.8 45 to 54 13,244.9 5,332.5 4,046.8 2,882.8 7,727.4 55 to 64 12,261.7 3,789.1 2,715.8 2,024.6 8,295.2 65 years old and over 6,553.6 1,411.3 800.5 890.7 5,002.1 Not engaged in work 46,394.4 4,217.9 1,051.4 3,609.2 40,901.9 15 to 24 years old 7,281.2 1,562.0 468.8 1,303.0 5,663.6 25 to 34 2,796.8 585.5 139.9 517.5 2,148.9 35 to 44 3,533.1 490.3 79.6 442.4 2,964.4 45 to 54 2,619.9 351.4 67.8 309.8 2,188.9 55 to 64 5,928.9 474.4 114.2 403.8 5,290.3 65 years old and over 24,234.7 754.3 181.0 632.7 22,645.8Total 100.0 25.9 17.2 15.6 72.1 Engaged in work 100.0 38.0 27.9 21.3 60.5 15 to 24 years old 100.0 45.3 34.1 25.1 53.6 25 to 34 100.0 46.0 34.5 26.8 52.6 35 to 44 100.0 40.1 29.8 22.4 58.4 45 to 54 100.0 40.3 30.6 21.8 58.3 55 to 64 100.0 30.9 22.1 16.5 67.7 65 years old and over 100.0 21.5 12.2 13.6 76.3 Not engaged in work 100.0 9.1 2.3 7.8 88.2 15 to 24 years old 100.0 21.5 6.4 17.9 77.8 25 to 34 100.0 20.9 5.0 18.5 76.8 35 to 44 100.0 13.9 2.3 12.5 83.9 45 to 54 100.0 13.4 2.6 11.8 83.5 55 to 64 100.0 8.0 1.9 6.8 89.2 65 years old and over 100.0 3.1 0.7 2.6 93.4
Num
ber
Rat
io
Whether did T raining or Self-Development
Total
Did training or self-development Not did trainingor self-
development
Type of T raining or Self-DevelopmentTotal
Conducted byemployer
Initiated byoneselfAge
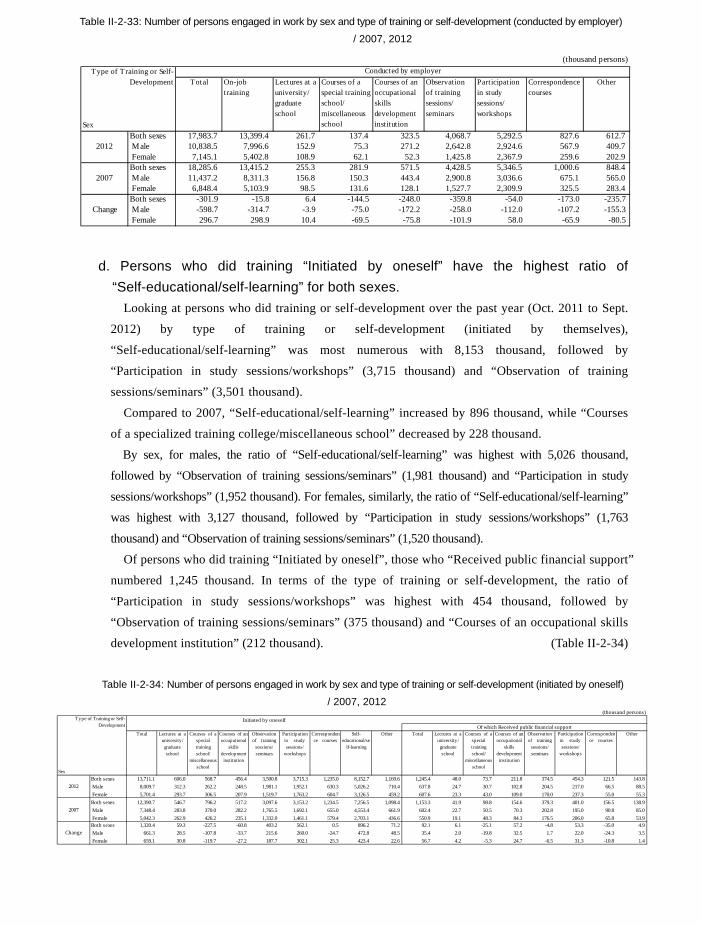
222
Table II-2-33: Number of persons engaged in work by sex and type of training or self-development (conducted by employer)
/ 2007, 2012
d. Persons who did training “Initiated by oneself” have the highest ratio of “Self-educational/self-learning” for both sexes.
Looking at persons who did training or self-development over the past year (Oct. 2011 to Sept.
2012) by type of training or self-development (initiated by themselves),
“Self-educational/self-learning” was most numerous with 8,153 thousand, followed by
“Participation in study sessions/workshops” (3,715 thousand) and “Observation of training
sessions/seminars” (3,501 thousand).
Compared to 2007, “Self-educational/self-learning” increased by 896 thousand, while “Courses
of a specialized training college/miscellaneous school” decreased by 228 thousand.
By sex, for males, the ratio of “Self-educational/self-learning” was highest with 5,026 thousand,
followed by “Observation of training sessions/seminars” (1,981 thousand) and “Participation in study
sessions/workshops” (1,952 thousand). For females, similarly, the ratio of “Self-educational/self-learning”
was highest with 3,127 thousand, followed by “Participation in study sessions/workshops” (1,763
thousand) and “Observation of training sessions/seminars” (1,520 thousand).
Of persons who did training “Initiated by oneself”, those who “Received public financial support”
numbered 1,245 thousand. In terms of the type of training or self-development, the ratio of
“Participation in study sessions/workshops” was highest with 454 thousand, followed by
“Observation of training sessions/seminars” (375 thousand) and “Courses of an occupational skills
development institution” (212 thousand). (Table II-2-34)
Table II-2-34: Number of persons engaged in work by sex and type of training or self-development (initiated by oneself)
/ 2007, 2012
SexBoth sexes 17,983.7 13,399.4 261.7 137.4 323.5 4,068.7 5,292.5 827.6 612.7
2012 Male 10,838.5 7,996.6 152.9 75.3 271.2 2,642.8 2,924.6 567.9 409.7 Female 7,145.1 5,402.8 108.9 62.1 52.3 1,425.8 2,367.9 259.6 202.9Both sexes 18,285.6 13,415.2 255.3 281.9 571.5 4,428.5 5,346.5 1,000.6 848.4
2007 Male 11,437.2 8,311.3 156.8 150.3 443.4 2,900.8 3,036.6 675.1 565.0 Female 6,848.4 5,103.9 98.5 131.6 128.1 1,527.7 2,309.9 325.5 283.4Both sexes -301.9 -15.8 6.4 -144.5 -248.0 -359.8 -54.0 -173.0 -235.7
Change Male -598.7 -314.7 -3.9 -75.0 -172.2 -258.0 -112.0 -107.2 -155.3 Female 296.7 298.9 10.4 -69.5 -75.8 -101.9 58.0 -65.9 -80.5
Other Type of T raining or Self-
Development Observationof trainingsessions/seminars
Participationin studysessions/workshops
Correspondencecourses
Total On-jobtraining
Lectures at auniversity/graduateschool
Courses of aspecial trainingschool/miscellaneousschool
Courses of anoccupationalskillsdevelopmentinstitution
(thousand persons)Conducted by employer
(thousand persons)
Sex
Total Lectures at auniversity/graduateschool
Courses of aspecialtrainingschool/
miscellaneousschool
Courses of anoccupational
skillsdevelopmentinstitution
Observationof training
sessions/seminars
Participationin studysessions/
workshops
Correspondence courses
Self-educational/se
lf-learning
Other Total Lectures at auniversity/graduateschool
Courses of aspecialtrainingschool/
miscellaneousschool
Courses of anoccupational
skillsdevelopmentinstitution
Observationof training
sessions/seminars
Participationin studysessions/
workshops
Correspondence courses
Other
Both sexes 13,711.1 606.0 568.7 456.4 3,500.8 3,715.3 1,235.0 8,152.7 1,169.6 1,245.4 48.0 73.7 211.8 374.5 454.3 121.5 143.82012 Male 8,009.7 312.3 262.2 248.5 1,981.1 1,952.1 630.3 5,026.2 710.4 637.8 24.7 30.7 102.8 204.5 217.0 66.5 88.5
Female 5,701.4 293.7 306.5 207.9 1,519.7 1,763.2 604.7 3,126.5 459.2 607.6 23.3 43.0 109.0 170.0 237.3 55.0 55.3Both sexes 12,390.7 546.7 796.2 517.2 3,097.6 3,153.2 1,234.5 7,256.5 1,098.4 1,153.3 41.9 98.8 154.6 379.3 401.0 156.5 138.9
2007 Male 7,348.4 283.8 370.0 282.2 1,765.5 1,692.1 655.0 4,553.4 661.9 602.4 22.7 50.5 70.3 202.8 195.0 90.8 85.0 Female 5,042.3 262.9 426.2 235.1 1,332.0 1,461.1 579.4 2,703.1 436.6 550.9 19.1 48.3 84.3 176.5 206.0 65.8 53.9Both sexes 1,320.4 59.3 -227.5 -60.8 403.2 562.1 0.5 896.2 71.2 92.1 6.1 -25.1 57.2 -4.8 53.3 -35.0 4.9
Change Male 661.3 28.5 -107.8 -33.7 215.6 260.0 -24.7 472.8 48.5 35.4 2.0 -19.8 32.5 1.7 22.0 -24.3 3.5 Female 659.1 30.8 -119.7 -27.2 187.7 302.1 25.3 423.4 22.6 56.7 4.2 -5.3 24.7 -6.5 31.3 -10.8 1.4
Initiated by oneselfOf which Received public financial support
Type of Training or Self-Development
(2) Training or self-development by persons engaged in work a. For “Employees, excluding executive of company or corporation” and
“Self-employed workers”, the ratio of persons who did training or self-development is higher among males than among females.
As the status of training or self-development by persons engaged in work, classified by status in
employment and type of employment, the ratio of those who did training or self-development was
highest among “Regular staff” with 47.7%, followed by “Contract employees” (37.3%) and
“Executives of company or corporation” (35.9%).
By sex, the ratio for males was highest among “Regular staffs” with 46.6%, followed by
“Executives of company or corporation” (38.4%) and “Contract employees” (32.9%). For females,
the ratio was highest among “Regular staffs” with 50.1%, followed by “Contract employees”
(42.2%) and “Self-employed workers” (32.3%). (Fig. II-2-20, Table II-2-35)
Fig. II-2-20: Ratio of persons who did training or self-development by sex, status in employment, and type of employment
/ 2012
Irregular staffs
Employees, excluding executive of company or corporation
0
10
20
30
40
50
60
70
Self-
empl
oyed
wor
kers
Fam
ily w
orke
rs
Exec
utiv
es o
f com
pany
or
corp
orat
ion
Reg
ular
sta
ffs
Part-
time
wor
kers
Arb
eit (
tem
pora
ry w
orke
rs)
Dis
patc
hed
wor
kers
from
te
mpo
rary
labo
ur a
genc
y
Con
tract
em
ploy
ees
(%)
Male Female
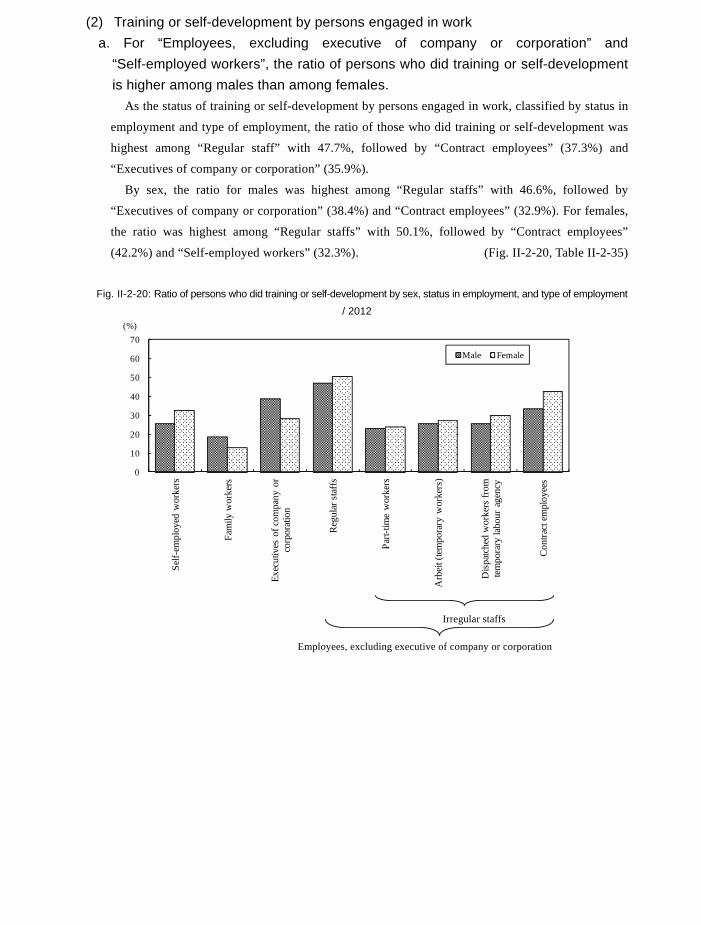
223
Table II-2-33: Number of persons engaged in work by sex and type of training or self-development (conducted by employer)
/ 2007, 2012
d. Persons who did training “Initiated by oneself” have the highest ratio of “Self-educational/self-learning” for both sexes.
Looking at persons who did training or self-development over the past year (Oct. 2011 to Sept.
2012) by type of training or self-development (initiated by themselves),
“Self-educational/self-learning” was most numerous with 8,153 thousand, followed by
“Participation in study sessions/workshops” (3,715 thousand) and “Observation of training
sessions/seminars” (3,501 thousand).
Compared to 2007, “Self-educational/self-learning” increased by 896 thousand, while “Courses
of a specialized training college/miscellaneous school” decreased by 228 thousand.
By sex, for males, the ratio of “Self-educational/self-learning” was highest with 5,026 thousand,
followed by “Observation of training sessions/seminars” (1,981 thousand) and “Participation in study
sessions/workshops” (1,952 thousand). For females, similarly, the ratio of “Self-educational/self-learning”
was highest with 3,127 thousand, followed by “Participation in study sessions/workshops” (1,763
thousand) and “Observation of training sessions/seminars” (1,520 thousand).
Of persons who did training “Initiated by oneself”, those who “Received public financial support”
numbered 1,245 thousand. In terms of the type of training or self-development, the ratio of
“Participation in study sessions/workshops” was highest with 454 thousand, followed by
“Observation of training sessions/seminars” (375 thousand) and “Courses of an occupational skills
development institution” (212 thousand). (Table II-2-34)
Table II-2-34: Number of persons engaged in work by sex and type of training or self-development (initiated by oneself)
/ 2007, 2012
SexBoth sexes 17,983.7 13,399.4 261.7 137.4 323.5 4,068.7 5,292.5 827.6 612.7
2012 Male 10,838.5 7,996.6 152.9 75.3 271.2 2,642.8 2,924.6 567.9 409.7 Female 7,145.1 5,402.8 108.9 62.1 52.3 1,425.8 2,367.9 259.6 202.9Both sexes 18,285.6 13,415.2 255.3 281.9 571.5 4,428.5 5,346.5 1,000.6 848.4
2007 Male 11,437.2 8,311.3 156.8 150.3 443.4 2,900.8 3,036.6 675.1 565.0 Female 6,848.4 5,103.9 98.5 131.6 128.1 1,527.7 2,309.9 325.5 283.4Both sexes -301.9 -15.8 6.4 -144.5 -248.0 -359.8 -54.0 -173.0 -235.7
Change Male -598.7 -314.7 -3.9 -75.0 -172.2 -258.0 -112.0 -107.2 -155.3 Female 296.7 298.9 10.4 -69.5 -75.8 -101.9 58.0 -65.9 -80.5
Other Type of T raining or Self-
Development Observationof trainingsessions/seminars
Participationin studysessions/workshops
Correspondencecourses
Total On-jobtraining
Lectures at auniversity/graduateschool
Courses of aspecial trainingschool/miscellaneousschool
Courses of anoccupationalskillsdevelopmentinstitution
(thousand persons)Conducted by employer
(thousand persons)
Sex
Total Lectures at auniversity/graduateschool
Courses of aspecialtrainingschool/
miscellaneousschool
Courses of anoccupational
skillsdevelopmentinstitution
Observationof training
sessions/seminars
Participationin studysessions/
workshops
Correspondence courses
Self-educational/se
lf-learning
Other Total Lectures at auniversity/graduateschool
Courses of aspecialtrainingschool/
miscellaneousschool
Courses of anoccupational
skillsdevelopmentinstitution
Observationof training
sessions/seminars
Participationin studysessions/
workshops
Correspondence courses
Other
Both sexes 13,711.1 606.0 568.7 456.4 3,500.8 3,715.3 1,235.0 8,152.7 1,169.6 1,245.4 48.0 73.7 211.8 374.5 454.3 121.5 143.82012 Male 8,009.7 312.3 262.2 248.5 1,981.1 1,952.1 630.3 5,026.2 710.4 637.8 24.7 30.7 102.8 204.5 217.0 66.5 88.5
Female 5,701.4 293.7 306.5 207.9 1,519.7 1,763.2 604.7 3,126.5 459.2 607.6 23.3 43.0 109.0 170.0 237.3 55.0 55.3Both sexes 12,390.7 546.7 796.2 517.2 3,097.6 3,153.2 1,234.5 7,256.5 1,098.4 1,153.3 41.9 98.8 154.6 379.3 401.0 156.5 138.9
2007 Male 7,348.4 283.8 370.0 282.2 1,765.5 1,692.1 655.0 4,553.4 661.9 602.4 22.7 50.5 70.3 202.8 195.0 90.8 85.0 Female 5,042.3 262.9 426.2 235.1 1,332.0 1,461.1 579.4 2,703.1 436.6 550.9 19.1 48.3 84.3 176.5 206.0 65.8 53.9Both sexes 1,320.4 59.3 -227.5 -60.8 403.2 562.1 0.5 896.2 71.2 92.1 6.1 -25.1 57.2 -4.8 53.3 -35.0 4.9
Change Male 661.3 28.5 -107.8 -33.7 215.6 260.0 -24.7 472.8 48.5 35.4 2.0 -19.8 32.5 1.7 22.0 -24.3 3.5 Female 659.1 30.8 -119.7 -27.2 187.7 302.1 25.3 423.4 22.6 56.7 4.2 -5.3 24.7 -6.5 31.3 -10.8 1.4
Initiated by oneselfOf which Received public financial support
Type of Training or Self-Development
(2) Training or self-development by persons engaged in work a. For “Employees, excluding executive of company or corporation” and
“Self-employed workers”, the ratio of persons who did training or self-development is higher among males than among females.
As the status of training or self-development by persons engaged in work, classified by status in
employment and type of employment, the ratio of those who did training or self-development was
highest among “Regular staff” with 47.7%, followed by “Contract employees” (37.3%) and
“Executives of company or corporation” (35.9%).
By sex, the ratio for males was highest among “Regular staffs” with 46.6%, followed by
“Executives of company or corporation” (38.4%) and “Contract employees” (32.9%). For females,
the ratio was highest among “Regular staffs” with 50.1%, followed by “Contract employees”
(42.2%) and “Self-employed workers” (32.3%). (Fig. II-2-20, Table II-2-35)
Fig. II-2-20: Ratio of persons who did training or self-development by sex, status in employment, and type of employment
/ 2012
Irregular staffs
Employees, excluding executive of company or corporation
0
10
20
30
40
50
60
70
Self-
empl
oyed
wor
kers
Fam
ily w
orke
rs
Exec
utiv
es o
f com
pany
or
corp
orat
ion
Reg
ular
sta
ffs
Part-
time
wor
kers
Arb
eit (
tem
pora
ry w
orke
rs)
Dis
patc
hed
wor
kers
from
te
mpo
rary
labo
ur a
genc
y
Con
tract
em
ploy
ees
(%)
Male Female
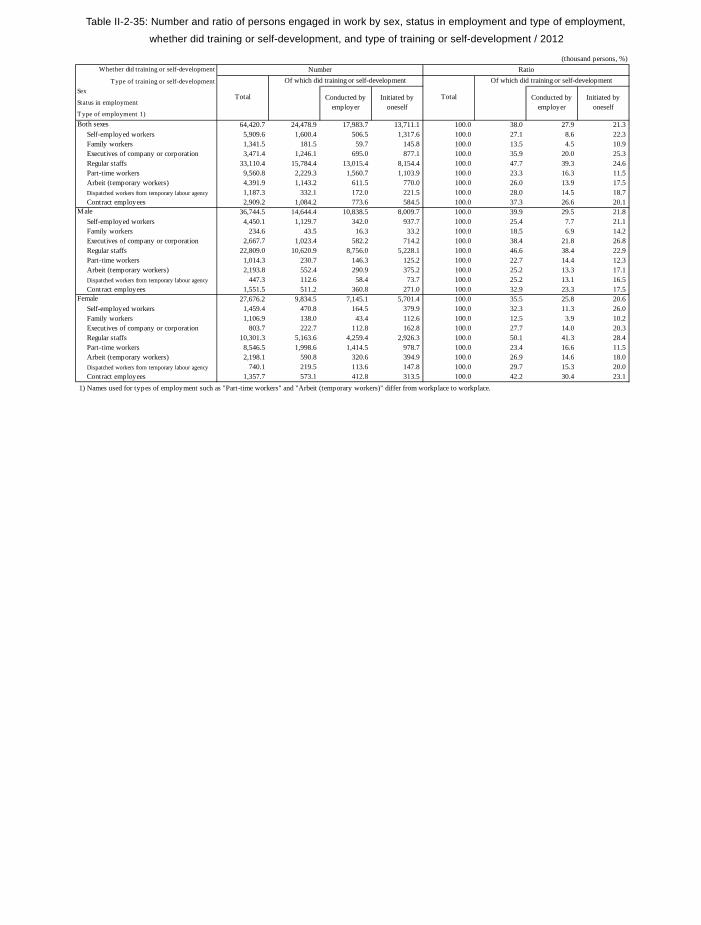
224
Table II-2-35: Number and ratio of persons engaged in work by sex, status in employment and type of employment,
whether did training or self-development, and type of training or self-development / 2012
(thousand persons, %)Whether did training or self-development Number Ratio
Type of training or self-development Of which did training or self-development Of which did training or self-development
64,420.7 24,478.9 17,983.7 13,711.1 100.0 38.0 27.9 21.3Self-employed workers 5,909.6 1,600.4 506.5 1,317.6 100.0 27.1 8.6 22.3Family workers 1,341.5 181.5 59.7 145.8 100.0 13.5 4.5 10.9Executives of company or corporation 3,471.4 1,246.1 695.0 877.1 100.0 35.9 20.0 25.3Regular staffs 33,110.4 15,784.4 13,015.4 8,154.4 100.0 47.7 39.3 24.6Part-time workers 9,560.8 2,229.3 1,560.7 1,103.9 100.0 23.3 16.3 11.5Arbeit (temporary workers) 4,391.9 1,143.2 611.5 770.0 100.0 26.0 13.9 17.5Dispatched workers from temporary labour agency 1,187.3 332.1 172.0 221.5 100.0 28.0 14.5 18.7Contract employees 2,909.2 1,084.2 773.6 584.5 100.0 37.3 26.6 20.1
36,744.5 14,644.4 10,838.5 8,009.7 100.0 39.9 29.5 21.8Self-employed workers 4,450.1 1,129.7 342.0 937.7 100.0 25.4 7.7 21.1Family workers 234.6 43.5 16.3 33.2 100.0 18.5 6.9 14.2Executives of company or corporation 2,667.7 1,023.4 582.2 714.2 100.0 38.4 21.8 26.8Regular staffs 22,809.0 10,620.9 8,756.0 5,228.1 100.0 46.6 38.4 22.9Part-time workers 1,014.3 230.7 146.3 125.2 100.0 22.7 14.4 12.3Arbeit (temporary workers) 2,193.8 552.4 290.9 375.2 100.0 25.2 13.3 17.1Dispatched workers from temporary labour agency 447.3 112.6 58.4 73.7 100.0 25.2 13.1 16.5Contract employees 1,551.5 511.2 360.8 271.0 100.0 32.9 23.3 17.5
27,676.2 9,834.5 7,145.1 5,701.4 100.0 35.5 25.8 20.6Self-employed workers 1,459.4 470.8 164.5 379.9 100.0 32.3 11.3 26.0Family workers 1,106.9 138.0 43.4 112.6 100.0 12.5 3.9 10.2Executives of company or corporation 803.7 222.7 112.8 162.8 100.0 27.7 14.0 20.3Regular staffs 10,301.3 5,163.6 4,259.4 2,926.3 100.0 50.1 41.3 28.4Part-time workers 8,546.5 1,998.6 1,414.5 978.7 100.0 23.4 16.6 11.5Arbeit (temporary workers) 2,198.1 590.8 320.6 394.9 100.0 26.9 14.6 18.0Dispatched workers from temporary labour agency 740.1 219.5 113.6 147.8 100.0 29.7 15.3 20.0Contract employees 1,357.7 573.1 412.8 313.5 100.0 42.2 30.4 23.1
1) Names used for types of employment such as "Part-time workers" and "Arbeit (temporary workers)" differ from workplace to workplace.
Male
Female
Both sexes
Total TotalConducted byemployer
Initiated byoneself
Conducted byemployer
Initiated byoneself
Sex
Status in employment
Type of employment 1)
b. The ratio of persons engaged in work who initiated their own training or self-development is highest in “Education, learning support”.
As for the status of training or self-development by persons engaged in work, classified by main
industry, the ratio of persons who did training or self-development was highest in “Education,
learning support” with 64.9%, followed by “Finance and insurance” (61.0%), and “Government,
except elsewhere classified” (57.6%).
By type of training or self-development (i.e., either conducted by employer or initiated by
oneself), in “Conducted by employer”, “Finance and insurance” had the highest ratio with 52.8%,
followed by “Government, except elsewhere classified” (47.7%) and “Education, learning support”
(47.7%). In “Initiated by oneself”, meanwhile, “Education, learning support” had the highest ratio
with 46.1%, followed by “Information and communications” (36.1%), and “Scientific research,
professional and technical services” (35.9%). (Fig. II-2-21, Table II-2-36)
Fig. II-2-21: Ratio of persons who did training or self-development by main industry and type of training or
self-development
/ 2012
0
10
20
30
40
50
60
Agr
icul
ture
and
for
estry
Con
stru
ctio
n
Man
ufac
turin
g
Info
rmat
ion
and
com
mun
icat
ions
Tran
spor
t and
pos
tal
activ
ities
Who
lesa
le a
nd re
tail
trade
Fina
nce
and
insu
ranc
e
Rea
l est
ate
and
good
s re
ntal
and
leas
ing
Scie
ntifi
c re
sear
ch, p
rofe
ssio
nal
and
tech
nica
l se
rvic
es
Acc
omm
odat
ions
, eat
ing
and
drin
king
ser
vice
s
Livi
ng-r
elat
ed a
nd p
erso
nal
serv
ices
and
am
usem
ent
serv
ices
Educ
atio
n, le
arni
ng s
uppo
rt
Med
ical
, hea
lth c
are
and
wel
fare
Serv
ices
, n.e
.c.
Gov
ernm
ent,
exce
pt
else
whe
re c
lass
ified
(%)
Initiated by oneself Conducted by employer
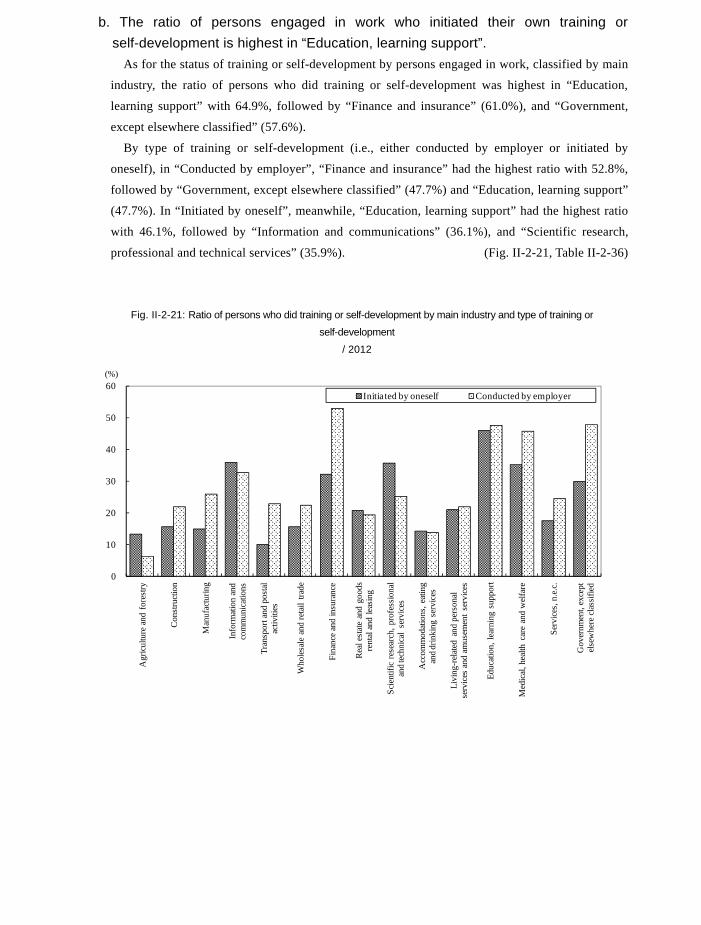
225
Table II-2-35: Number and ratio of persons engaged in work by sex, status in employment and type of employment,
whether did training or self-development, and type of training or self-development / 2012
(thousand persons, %)Whether did training or self-development Number Ratio
Type of training or self-development Of which did training or self-development Of which did training or self-development
64,420.7 24,478.9 17,983.7 13,711.1 100.0 38.0 27.9 21.3Self-employed workers 5,909.6 1,600.4 506.5 1,317.6 100.0 27.1 8.6 22.3Family workers 1,341.5 181.5 59.7 145.8 100.0 13.5 4.5 10.9Executives of company or corporation 3,471.4 1,246.1 695.0 877.1 100.0 35.9 20.0 25.3Regular staffs 33,110.4 15,784.4 13,015.4 8,154.4 100.0 47.7 39.3 24.6Part-time workers 9,560.8 2,229.3 1,560.7 1,103.9 100.0 23.3 16.3 11.5Arbeit (temporary workers) 4,391.9 1,143.2 611.5 770.0 100.0 26.0 13.9 17.5Dispatched workers from temporary labour agency 1,187.3 332.1 172.0 221.5 100.0 28.0 14.5 18.7Contract employees 2,909.2 1,084.2 773.6 584.5 100.0 37.3 26.6 20.1
36,744.5 14,644.4 10,838.5 8,009.7 100.0 39.9 29.5 21.8Self-employed workers 4,450.1 1,129.7 342.0 937.7 100.0 25.4 7.7 21.1Family workers 234.6 43.5 16.3 33.2 100.0 18.5 6.9 14.2Executives of company or corporation 2,667.7 1,023.4 582.2 714.2 100.0 38.4 21.8 26.8Regular staffs 22,809.0 10,620.9 8,756.0 5,228.1 100.0 46.6 38.4 22.9Part-time workers 1,014.3 230.7 146.3 125.2 100.0 22.7 14.4 12.3Arbeit (temporary workers) 2,193.8 552.4 290.9 375.2 100.0 25.2 13.3 17.1Dispatched workers from temporary labour agency 447.3 112.6 58.4 73.7 100.0 25.2 13.1 16.5Contract employees 1,551.5 511.2 360.8 271.0 100.0 32.9 23.3 17.5
27,676.2 9,834.5 7,145.1 5,701.4 100.0 35.5 25.8 20.6Self-employed workers 1,459.4 470.8 164.5 379.9 100.0 32.3 11.3 26.0Family workers 1,106.9 138.0 43.4 112.6 100.0 12.5 3.9 10.2Executives of company or corporation 803.7 222.7 112.8 162.8 100.0 27.7 14.0 20.3Regular staffs 10,301.3 5,163.6 4,259.4 2,926.3 100.0 50.1 41.3 28.4Part-time workers 8,546.5 1,998.6 1,414.5 978.7 100.0 23.4 16.6 11.5Arbeit (temporary workers) 2,198.1 590.8 320.6 394.9 100.0 26.9 14.6 18.0Dispatched workers from temporary labour agency 740.1 219.5 113.6 147.8 100.0 29.7 15.3 20.0Contract employees 1,357.7 573.1 412.8 313.5 100.0 42.2 30.4 23.1
1) Names used for types of employment such as "Part-time workers" and "Arbeit (temporary workers)" differ from workplace to workplace.
Male
Female
Both sexes
Total TotalConducted byemployer
Initiated byoneself
Conducted byemployer
Initiated byoneself
Sex
Status in employment
Type of employment 1)
b. The ratio of persons engaged in work who initiated their own training or self-development is highest in “Education, learning support”.
As for the status of training or self-development by persons engaged in work, classified by main
industry, the ratio of persons who did training or self-development was highest in “Education,
learning support” with 64.9%, followed by “Finance and insurance” (61.0%), and “Government,
except elsewhere classified” (57.6%).
By type of training or self-development (i.e., either conducted by employer or initiated by
oneself), in “Conducted by employer”, “Finance and insurance” had the highest ratio with 52.8%,
followed by “Government, except elsewhere classified” (47.7%) and “Education, learning support”
(47.7%). In “Initiated by oneself”, meanwhile, “Education, learning support” had the highest ratio
with 46.1%, followed by “Information and communications” (36.1%), and “Scientific research,
professional and technical services” (35.9%). (Fig. II-2-21, Table II-2-36)
Fig. II-2-21: Ratio of persons who did training or self-development by main industry and type of training or
self-development
/ 2012
0
10
20
30
40
50
60
Agr
icul
ture
and
for
estry
Con
stru
ctio
n
Man
ufac
turin
g
Info
rmat
ion
and
com
mun
icat
ions
Tran
spor
t and
pos
tal
activ
ities
Who
lesa
le a
nd re
tail
trade
Fina
nce
and
insu
ranc
e
Rea
l est
ate
and
good
s re
ntal
and
leas
ing
Scie
ntifi
c re
sear
ch, p
rofe
ssio
nal
and
tech
nica
l se
rvic
es
Acc
omm
odat
ions
, eat
ing
and
drin
king
ser
vice
s
Livi
ng-r
elat
ed a
nd p
erso
nal
serv
ices
and
am
usem
ent
serv
ices
Educ
atio
n, le
arni
ng s
uppo
rt
Med
ical
, hea
lth c
are
and
wel
fare
Serv
ices
, n.e
.c.
Gov
ernm
ent,
exce
pt
else
whe
re c
lass
ified
(%)
Initiated by oneself Conducted by employer
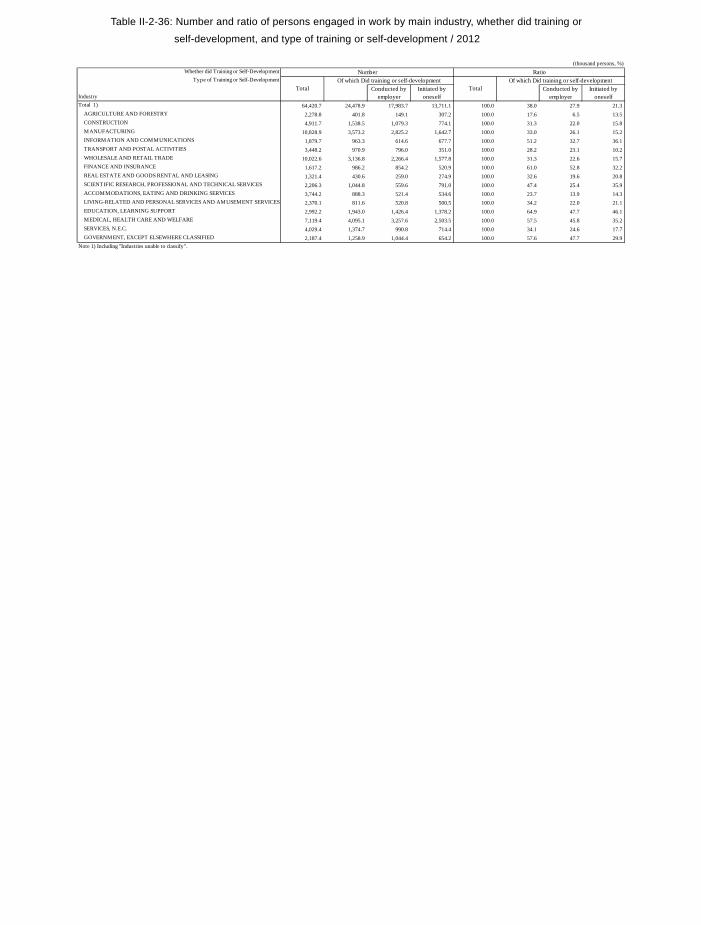
226
Table II-2-36: Number and ratio of persons engaged in work by main industry, whether did training or
self-development, and type of training or self-development / 2012
(thousand persons, %)
Whether did Training or Self-DevelopmentType of Training or Self-Development Of which Did training or self-development Of which Did training or self-development
IndustryTotal 1) 64,420.7 24,478.9 17,983.7 13,711.1 100.0 38.0 27.9 21.3 AGRICULTURE AND FORESTRY 2,278.8 401.8 149.1 307.2 100.0 17.6 6.5 13.5 CONSTRUCTION 4,911.7 1,538.5 1,079.3 774.1 100.0 31.3 22.0 15.8 MANUFACTURING 10,828.9 3,573.2 2,825.2 1,642.7 100.0 33.0 26.1 15.2 INFORMATION AND COMMUNICATIONS 1,879.7 963.3 614.6 677.7 100.0 51.2 32.7 36.1 TRANSPORT AND POSTAL ACTIVITIES 3,448.2 970.9 796.0 351.0 100.0 28.2 23.1 10.2 WHOLESALE AND RETAIL TRADE 10,022.6 3,136.8 2,266.4 1,577.8 100.0 31.3 22.6 15.7 FINANCE AND INSURANCE 1,617.2 986.2 854.2 520.9 100.0 61.0 52.8 32.2 REAL ESTATE AND GOODS RENTAL AND LEASING 1,321.4 430.6 259.0 274.9 100.0 32.6 19.6 20.8 SCIENTIFIC RESEARCH, PROFESSIONAL AND TECHNICAL SERVICES 2,206.3 1,044.8 559.6 791.0 100.0 47.4 25.4 35.9 ACCOMMODATIONS, EATING AND DRINKING SERVICES 3,744.2 888.3 521.4 534.6 100.0 23.7 13.9 14.3 LIVING-RELATED AND PERSONAL SERVICES AND AMUSEMENT SERVICES 2,370.1 811.6 520.8 500.5 100.0 34.2 22.0 21.1 EDUCATION, LEARNING SUPPORT 2,992.2 1,943.0 1,426.4 1,378.2 100.0 64.9 47.7 46.1 MEDICAL, HEALTH CARE AND WELFARE 7,119.4 4,095.1 3,257.6 2,503.5 100.0 57.5 45.8 35.2 SERVICES, N.E.C. 4,029.4 1,374.7 990.8 714.4 100.0 34.1 24.6 17.7 GOVERNMENT, EXCEPT ELSEWHERE CLASSIFIED 2,187.4 1,258.9 1,044.4 654.2 100.0 57.6 47.7 29.9Note 1) Including "Industries unable to classify".
Initiated byoneself
Conducted byemployer
Initiated byoneself
Number Ratio
Total TotalConducted byemployer
(3) Training or self-development by persons not engaged in work (initiated by oneself) The ratio of persons wishing to work who initiated training or self-development by
themselves is about 30% among persons seeking a job, and about 10% among persons not seeking a job.
As for the status of training or self-development of persons not engaged in work, 3,609 thousand
persons (7.8% of all persons not engaged in work) initiated training or self-development by themselves.
By sex, males numbered 1,638 thousand (9.8% of all males not engaged in work), and females
1,971 thousand (6.6% of all females not engaged in work).
Among persons not engaged in work but wishing to work who initiated training or
self-development by themselves, classified by whether seeking a job, persons seeking a job numbered
1,235 thousand (26.3% of all persons seeking a job), and persons not seeking a job numbered 760
thousand (12.3% of all persons not seeking a job). (Table II-2-37)
Table II-2-37: Number and ratio of persons not engaged in work who did training or self-development initiated by
oneself by sex, age group, whether wishing to work, and whether seeking a job / 2012
(thousand persons, %)
Wishing to work Not wishing to work Whether did Training or Self-Development Seeking a job
Sex
Age
Both sexes 46,394.4 3,609.2 10,933.3 1,998.8 4,691.0 1,235.1 6,180.8 759.9 35,189.6 1,608.6 15 to 24 years old 7,281.2 1,303.0 1,739.2 487.7 913.2 306.4 818.4 180.4 5,521.8 815.0 25 to 34 2,796.8 517.5 1,804.5 424.6 847.7 270.8 952.1 151.7 980.7 92.8 35 to 44 3,533.1 442.4 2,229.5 375.3 991.1 243.7 1,233.2 131.4 1,290.4 67.1Male 16,668.7 1,638.4 4,123.8 901.4 2,062.8 603.5 2,034.1 295.7 12,437.1 736.1 15 to 24 years old 3,798.9 698.5 878.8 269.7 488.2 176.2 386.4 93.1 2,907.7 428.4 25 to 34 713.6 213.0 515.3 176.8 352.2 128.1 160.0 47.3 191.5 36.0 35 to 44 630.5 124.6 462.0 112.6 299.8 88.8 160.4 23.8 164.1 12.0Female 29,725.7 1,970.8 6,809.5 1,097.4 2,628.2 631.6 4,146.6 464.2 22,752.5 872.5 15 to 24 years old 3,482.3 604.5 860.4 218.0 425.0 130.2 432.0 87.3 2,614.1 386.6 25 to 34 2,083.2 304.5 1,289.2 247.8 495.5 142.7 792.1 104.4 789.2 56.8 35 to 44 2,902.6 317.8 1,767.6 262.6 691.3 154.9 1,072.7 107.6 1,126.4 55.1Both sexes 100.0 7.8 100.0 18.3 100.0 26.3 100.0 12.3 100.0 4.6 15 to 24 years old 100.0 17.9 100.0 28.0 100.0 33.6 100.0 22.0 100.0 14.8 25 to 34 100.0 18.5 100.0 23.5 100.0 31.9 100.0 15.9 100.0 9.5 35 to 44 100.0 12.5 100.0 16.8 100.0 24.6 100.0 10.7 100.0 5.2Male 100.0 9.8 100.0 21.9 100.0 29.3 100.0 14.5 100.0 5.9 15 to 24 years old 100.0 18.4 100.0 30.7 100.0 36.1 100.0 24.1 100.0 14.7 25 to 34 100.0 29.8 100.0 34.3 100.0 36.4 100.0 29.6 100.0 18.8 35 to 44 100.0 19.8 100.0 24.4 100.0 29.6 100.0 14.8 100.0 7.3Female 100.0 6.6 100.0 16.1 100.0 24.0 100.0 11.2 100.0 3.8 15 to 24 years old 100.0 17.4 100.0 25.3 100.0 30.6 100.0 20.2 100.0 14.8 25 to 34 100.0 14.6 100.0 19.2 100.0 28.8 100.0 13.2 100.0 7.2 35 to 44 100.0 10.9 100.0 14.9 100.0 22.4 100.0 10.0 100.0 4.9
Of which Didtraining or self-development
Of which Didtraining or self-development
Num
ber
Rat
io
Not seeking a job
Whether Wishing to WorkTotalWhether Seeking a Job
Of which Didtraining or self-development
Of which Didtraining or self-development
Of which Didtraining or self-development
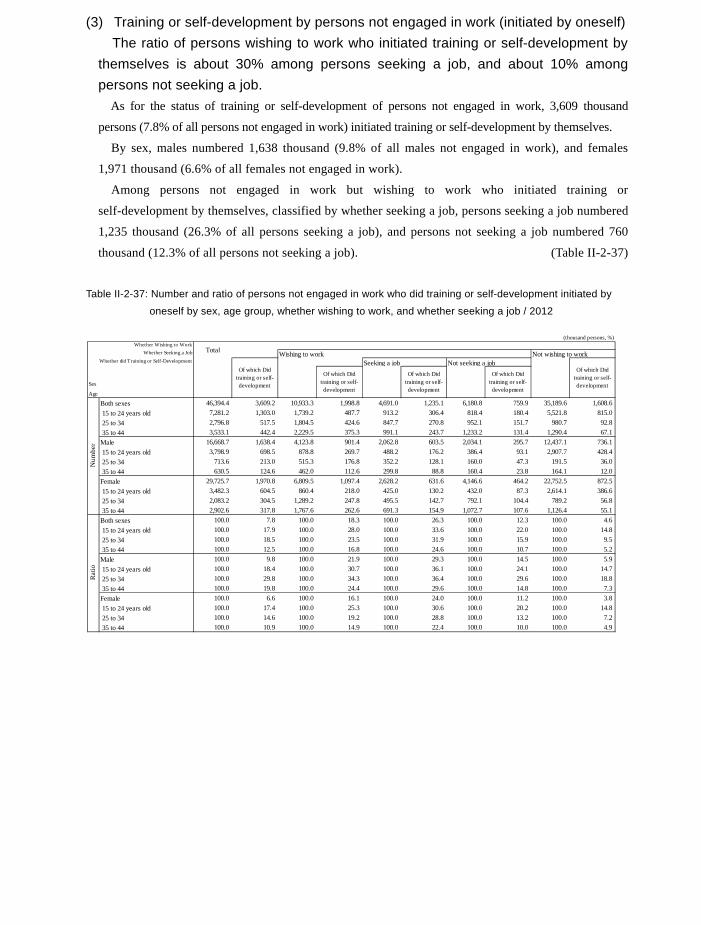
227
Table II-2-36: Number and ratio of persons engaged in work by main industry, whether did training or
self-development, and type of training or self-development / 2012
(thousand persons, %)
Whether did Training or Self-DevelopmentType of Training or Self-Development Of which Did training or self-development Of which Did training or self-development
IndustryTotal 1) 64,420.7 24,478.9 17,983.7 13,711.1 100.0 38.0 27.9 21.3 AGRICULTURE AND FORESTRY 2,278.8 401.8 149.1 307.2 100.0 17.6 6.5 13.5 CONSTRUCTION 4,911.7 1,538.5 1,079.3 774.1 100.0 31.3 22.0 15.8 MANUFACTURING 10,828.9 3,573.2 2,825.2 1,642.7 100.0 33.0 26.1 15.2 INFORMATION AND COMMUNICATIONS 1,879.7 963.3 614.6 677.7 100.0 51.2 32.7 36.1 TRANSPORT AND POSTAL ACTIVITIES 3,448.2 970.9 796.0 351.0 100.0 28.2 23.1 10.2 WHOLESALE AND RETAIL TRADE 10,022.6 3,136.8 2,266.4 1,577.8 100.0 31.3 22.6 15.7 FINANCE AND INSURANCE 1,617.2 986.2 854.2 520.9 100.0 61.0 52.8 32.2 REAL ESTATE AND GOODS RENTAL AND LEASING 1,321.4 430.6 259.0 274.9 100.0 32.6 19.6 20.8 SCIENTIFIC RESEARCH, PROFESSIONAL AND TECHNICAL SERVICES 2,206.3 1,044.8 559.6 791.0 100.0 47.4 25.4 35.9 ACCOMMODATIONS, EATING AND DRINKING SERVICES 3,744.2 888.3 521.4 534.6 100.0 23.7 13.9 14.3 LIVING-RELATED AND PERSONAL SERVICES AND AMUSEMENT SERVICES 2,370.1 811.6 520.8 500.5 100.0 34.2 22.0 21.1 EDUCATION, LEARNING SUPPORT 2,992.2 1,943.0 1,426.4 1,378.2 100.0 64.9 47.7 46.1 MEDICAL, HEALTH CARE AND WELFARE 7,119.4 4,095.1 3,257.6 2,503.5 100.0 57.5 45.8 35.2 SERVICES, N.E.C. 4,029.4 1,374.7 990.8 714.4 100.0 34.1 24.6 17.7 GOVERNMENT, EXCEPT ELSEWHERE CLASSIFIED 2,187.4 1,258.9 1,044.4 654.2 100.0 57.6 47.7 29.9Note 1) Including "Industries unable to classify".
Initiated byoneself
Conducted byemployer
Initiated byoneself
Number Ratio
Total TotalConducted byemployer
(3) Training or self-development by persons not engaged in work (initiated by oneself) The ratio of persons wishing to work who initiated training or self-development by
themselves is about 30% among persons seeking a job, and about 10% among persons not seeking a job.
As for the status of training or self-development of persons not engaged in work, 3,609 thousand
persons (7.8% of all persons not engaged in work) initiated training or self-development by themselves.
By sex, males numbered 1,638 thousand (9.8% of all males not engaged in work), and females
1,971 thousand (6.6% of all females not engaged in work).
Among persons not engaged in work but wishing to work who initiated training or
self-development by themselves, classified by whether seeking a job, persons seeking a job numbered
1,235 thousand (26.3% of all persons seeking a job), and persons not seeking a job numbered 760
thousand (12.3% of all persons not seeking a job). (Table II-2-37)
Table II-2-37: Number and ratio of persons not engaged in work who did training or self-development initiated by
oneself by sex, age group, whether wishing to work, and whether seeking a job / 2012
(thousand persons, %)
Wishing to work Not wishing to work Whether did Training or Self-Development Seeking a job
Sex
Age
Both sexes 46,394.4 3,609.2 10,933.3 1,998.8 4,691.0 1,235.1 6,180.8 759.9 35,189.6 1,608.6 15 to 24 years old 7,281.2 1,303.0 1,739.2 487.7 913.2 306.4 818.4 180.4 5,521.8 815.0 25 to 34 2,796.8 517.5 1,804.5 424.6 847.7 270.8 952.1 151.7 980.7 92.8 35 to 44 3,533.1 442.4 2,229.5 375.3 991.1 243.7 1,233.2 131.4 1,290.4 67.1Male 16,668.7 1,638.4 4,123.8 901.4 2,062.8 603.5 2,034.1 295.7 12,437.1 736.1 15 to 24 years old 3,798.9 698.5 878.8 269.7 488.2 176.2 386.4 93.1 2,907.7 428.4 25 to 34 713.6 213.0 515.3 176.8 352.2 128.1 160.0 47.3 191.5 36.0 35 to 44 630.5 124.6 462.0 112.6 299.8 88.8 160.4 23.8 164.1 12.0Female 29,725.7 1,970.8 6,809.5 1,097.4 2,628.2 631.6 4,146.6 464.2 22,752.5 872.5 15 to 24 years old 3,482.3 604.5 860.4 218.0 425.0 130.2 432.0 87.3 2,614.1 386.6 25 to 34 2,083.2 304.5 1,289.2 247.8 495.5 142.7 792.1 104.4 789.2 56.8 35 to 44 2,902.6 317.8 1,767.6 262.6 691.3 154.9 1,072.7 107.6 1,126.4 55.1Both sexes 100.0 7.8 100.0 18.3 100.0 26.3 100.0 12.3 100.0 4.6 15 to 24 years old 100.0 17.9 100.0 28.0 100.0 33.6 100.0 22.0 100.0 14.8 25 to 34 100.0 18.5 100.0 23.5 100.0 31.9 100.0 15.9 100.0 9.5 35 to 44 100.0 12.5 100.0 16.8 100.0 24.6 100.0 10.7 100.0 5.2Male 100.0 9.8 100.0 21.9 100.0 29.3 100.0 14.5 100.0 5.9 15 to 24 years old 100.0 18.4 100.0 30.7 100.0 36.1 100.0 24.1 100.0 14.7 25 to 34 100.0 29.8 100.0 34.3 100.0 36.4 100.0 29.6 100.0 18.8 35 to 44 100.0 19.8 100.0 24.4 100.0 29.6 100.0 14.8 100.0 7.3Female 100.0 6.6 100.0 16.1 100.0 24.0 100.0 11.2 100.0 3.8 15 to 24 years old 100.0 17.4 100.0 25.3 100.0 30.6 100.0 20.2 100.0 14.8 25 to 34 100.0 14.6 100.0 19.2 100.0 28.8 100.0 13.2 100.0 7.2 35 to 44 100.0 10.9 100.0 14.9 100.0 22.4 100.0 10.0 100.0 4.9
Of which Didtraining or self-development
Of which Didtraining or self-development
Num
ber
Rat
io
Not seeking a job
Whether Wishing to WorkTotalWhether Seeking a Job
Of which Didtraining or self-development
Of which Didtraining or self-development
Of which Didtraining or self-development
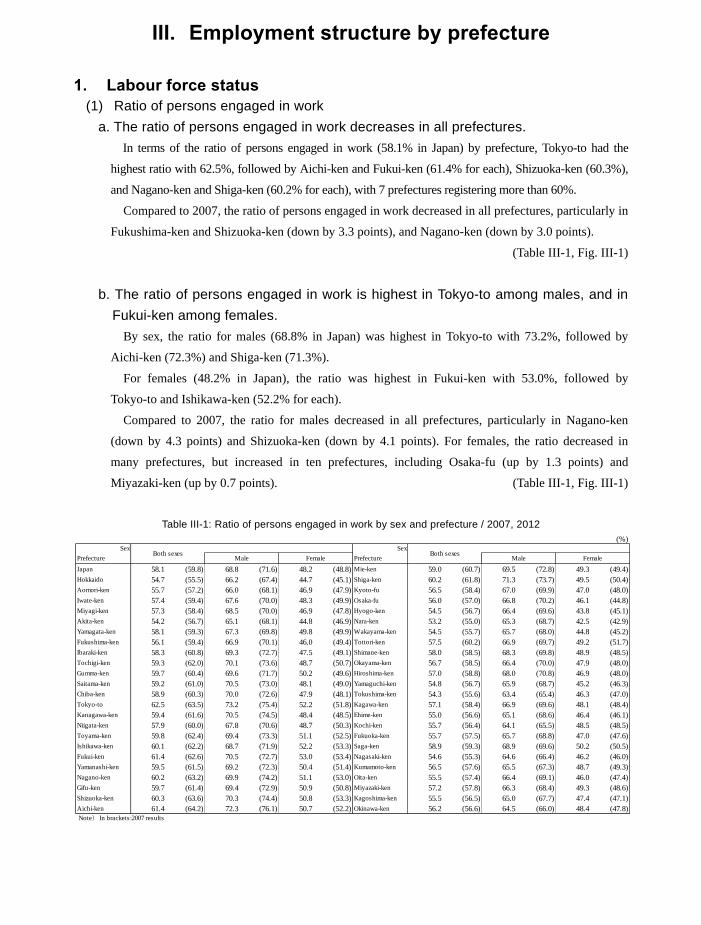
228
III. Employment structure by prefecture
1. Labour force status (1) Ratio of persons engaged in work
a. The ratio of persons engaged in work decreases in all prefectures. In terms of the ratio of persons engaged in work (58.1% in Japan) by prefecture, Tokyo-to had the
highest ratio with 62.5%, followed by Aichi-ken and Fukui-ken (61.4% for each), Shizuoka-ken (60.3%),
and Nagano-ken and Shiga-ken (60.2% for each), with 7 prefectures registering more than 60%.
Compared to 2007, the ratio of persons engaged in work decreased in all prefectures, particularly in
Fukushima-ken and Shizuoka-ken (down by 3.3 points), and Nagano-ken (down by 3.0 points).
(Table III-1, Fig. III-1)
b. The ratio of persons engaged in work is highest in Tokyo-to among males, and in Fukui-ken among females.
By sex, the ratio for males (68.8% in Japan) was highest in Tokyo-to with 73.2%, followed by
Aichi-ken (72.3%) and Shiga-ken (71.3%).
For females (48.2% in Japan), the ratio was highest in Fukui-ken with 53.0%, followed by
Tokyo-to and Ishikawa-ken (52.2% for each).
Compared to 2007, the ratio for males decreased in all prefectures, particularly in Nagano-ken
(down by 4.3 points) and Shizuoka-ken (down by 4.1 points). For females, the ratio decreased in
many prefectures, but increased in ten prefectures, including Osaka-fu (up by 1.3 points) and
Miyazaki-ken (up by 0.7 points). (Table III-1, Fig. III-1)
Table III-1: Ratio of persons engaged in work by sex and prefecture / 2007, 2012
(%)Sex Sex
Prefecture Male Female Prefecture Male FemaleJapan 58.1 (59.8) 68.8 (71.6) 48.2 (48.8) Mie-ken 59.0 (60.7) 69.5 (72.8) 49.3 (49.4)Hokkaido 54.7 (55.5) 66.2 (67.4) 44.7 (45.1) Shiga-ken 60.2 (61.8) 71.3 (73.7) 49.5 (50.4)Aomori-ken 55.7 (57.2) 66.0 (68.1) 46.9 (47.9) Kyoto-fu 56.5 (58.4) 67.0 (69.9) 47.0 (48.0)Iwate-ken 57.4 (59.4) 67.6 (70.0) 48.3 (49.9) Osaka-fu 56.0 (57.0) 66.8 (70.2) 46.1 (44.8)Miyagi-ken 57.3 (58.4) 68.5 (70.0) 46.9 (47.8) Hyogo-ken 54.5 (56.7) 66.4 (69.6) 43.8 (45.1)Akita-ken 54.2 (56.7) 65.1 (68.1) 44.8 (46.9) Nara-ken 53.2 (55.0) 65.3 (68.7) 42.5 (42.9)Yamagata-ken 58.1 (59.3) 67.3 (69.8) 49.8 (49.9) Wakayama-ken 54.5 (55.7) 65.7 (68.0) 44.8 (45.2)Fukushima-ken 56.1 (59.4) 66.9 (70.1) 46.0 (49.4) Tottori-ken 57.5 (60.2) 66.9 (69.7) 49.2 (51.7)Ibaraki-ken 58.3 (60.8) 69.3 (72.7) 47.5 (49.1) Shimane-ken 58.0 (58.5) 68.3 (69.8) 48.9 (48.5)Tochigi-ken 59.3 (62.0) 70.1 (73.6) 48.7 (50.7) Okayama-ken 56.7 (58.5) 66.4 (70.0) 47.9 (48.0)Gumma-ken 59.7 (60.4) 69.6 (71.7) 50.2 (49.6) Hiroshima-ken 57.0 (58.8) 68.0 (70.8) 46.9 (48.0)Saitama-ken 59.2 (61.0) 70.5 (73.0) 48.1 (49.0) Yamaguchi-ken 54.8 (56.7) 65.9 (68.7) 45.2 (46.3)Chiba-ken 58.9 (60.3) 70.0 (72.6) 47.9 (48.1) Tokushima-ken 54.3 (55.6) 63.4 (65.4) 46.3 (47.0)Tokyo-to 62.5 (63.5) 73.2 (75.4) 52.2 (51.8) Kagawa-ken 57.1 (58.4) 66.9 (69.6) 48.1 (48.4)Kanagawa-ken 59.4 (61.6) 70.5 (74.5) 48.4 (48.5) Ehime-ken 55.0 (56.6) 65.1 (68.6) 46.4 (46.1)Niigata-ken 57.9 (60.0) 67.8 (70.6) 48.7 (50.3) Kochi-ken 55.7 (56.4) 64.1 (65.5) 48.5 (48.5)Toyama-ken 59.8 (62.4) 69.4 (73.3) 51.1 (52.5) Fukuoka-ken 55.7 (57.5) 65.7 (68.8) 47.0 (47.6)Ishikawa-ken 60.1 (62.2) 68.7 (71.9) 52.2 (53.3) Saga-ken 58.9 (59.3) 68.9 (69.6) 50.2 (50.5)Fukui-ken 61.4 (62.6) 70.5 (72.7) 53.0 (53.4) Nagasaki-ken 54.6 (55.3) 64.6 (66.4) 46.2 (46.0)Yamanashi-ken 59.5 (61.5) 69.2 (72.3) 50.4 (51.4) Kumamoto-ken 56.5 (57.6) 65.5 (67.3) 48.7 (49.3)Nagano-ken 60.2 (63.2) 69.9 (74.2) 51.1 (53.0) Oita-ken 55.5 (57.4) 66.4 (69.1) 46.0 (47.4)Gifu-ken 59.7 (61.4) 69.4 (72.9) 50.9 (50.8) Miyazaki-ken 57.2 (57.8) 66.3 (68.4) 49.3 (48.6)Shizuoka-ken 60.3 (63.6) 70.3 (74.4) 50.8 (53.3) Kagoshima-ken 55.5 (56.5) 65.0 (67.7) 47.4 (47.1)Aichi-ken 61.4 (64.2) 72.3 (76.1) 50.7 (52.2) Okinawa-ken 56.2 (56.6) 64.5 (66.0) 48.4 (47.8) Note)In brackets:2007 results
Both sexes Both sexes
Fig. III-1: Ratio of persons engaged in work by prefecture / 2012
c. Fukui-ken has the highest ratio of persons engaged in work to working-age population.
As the ratio of persons engaged in work to those aged 15 to 64 (working-age population) (72.3% in
Japan), Fukui-ken was highest with 77.4%, followed by Toyama-ken (76.7%), Shimane-ken,
Yamagata-ken and Ishikawa-ken (75.8% for each), and Nagano-ken (75.2%).
Compared to 2007 by sex, the ratio for males decreased in most prefectures, particularly in
Nagano-ken (down by 3.1 points) and Kanagawa-ken (down by 2.6 points). On the other hand, the
ratio increased in five prefectures, particularly in Saga-ken (up by 0.6 points).
For females, the ratio increased in most prefectures, particularly in Osaka-fu (up by 4.0 points) and
Ehime-ken (up by 3.5 points). On the other hand, it decreased in six prefectures, particularly in
Fukushima-ken (down by 2.6 points)
(Table III-2, Fig. III-2)
(%)
60.0 and over
58.0 to less than 60.0
56.0 to less than 58.0
Less than 56.0
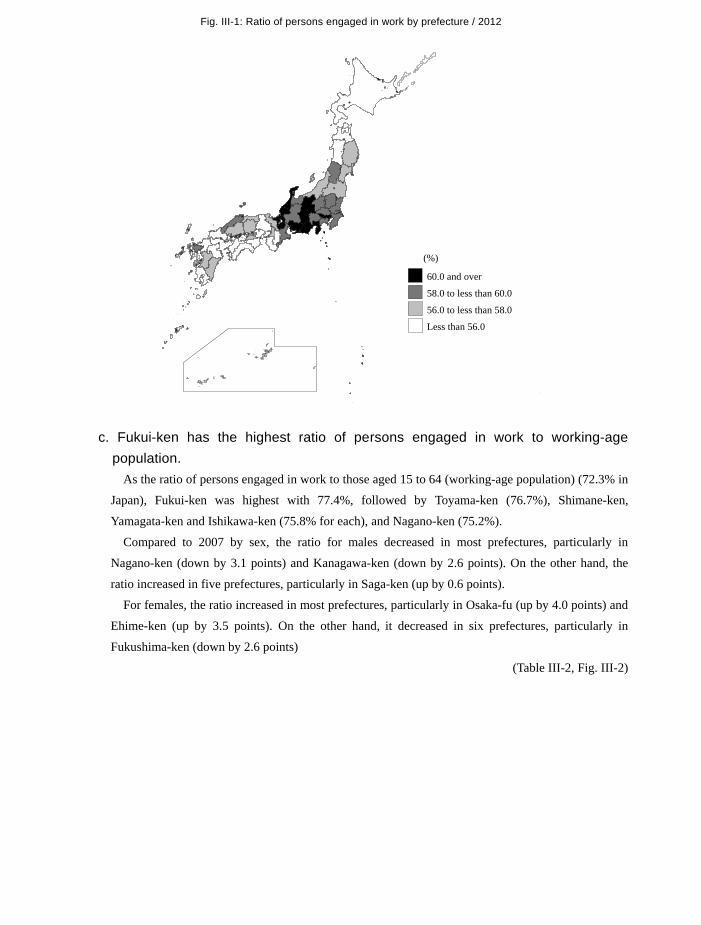
229
III. Employment structure by prefecture
1. Labour force status (1) Ratio of persons engaged in work
a. The ratio of persons engaged in work decreases in all prefectures. In terms of the ratio of persons engaged in work (58.1% in Japan) by prefecture, Tokyo-to had the
highest ratio with 62.5%, followed by Aichi-ken and Fukui-ken (61.4% for each), Shizuoka-ken (60.3%),
and Nagano-ken and Shiga-ken (60.2% for each), with 7 prefectures registering more than 60%.
Compared to 2007, the ratio of persons engaged in work decreased in all prefectures, particularly in
Fukushima-ken and Shizuoka-ken (down by 3.3 points), and Nagano-ken (down by 3.0 points).
(Table III-1, Fig. III-1)
b. The ratio of persons engaged in work is highest in Tokyo-to among males, and in Fukui-ken among females.
By sex, the ratio for males (68.8% in Japan) was highest in Tokyo-to with 73.2%, followed by
Aichi-ken (72.3%) and Shiga-ken (71.3%).
For females (48.2% in Japan), the ratio was highest in Fukui-ken with 53.0%, followed by
Tokyo-to and Ishikawa-ken (52.2% for each).
Compared to 2007, the ratio for males decreased in all prefectures, particularly in Nagano-ken
(down by 4.3 points) and Shizuoka-ken (down by 4.1 points). For females, the ratio decreased in
many prefectures, but increased in ten prefectures, including Osaka-fu (up by 1.3 points) and
Miyazaki-ken (up by 0.7 points). (Table III-1, Fig. III-1)
Table III-1: Ratio of persons engaged in work by sex and prefecture / 2007, 2012
(%)Sex Sex
Prefecture Male Female Prefecture Male FemaleJapan 58.1 (59.8) 68.8 (71.6) 48.2 (48.8) Mie-ken 59.0 (60.7) 69.5 (72.8) 49.3 (49.4)Hokkaido 54.7 (55.5) 66.2 (67.4) 44.7 (45.1) Shiga-ken 60.2 (61.8) 71.3 (73.7) 49.5 (50.4)Aomori-ken 55.7 (57.2) 66.0 (68.1) 46.9 (47.9) Kyoto-fu 56.5 (58.4) 67.0 (69.9) 47.0 (48.0)Iwate-ken 57.4 (59.4) 67.6 (70.0) 48.3 (49.9) Osaka-fu 56.0 (57.0) 66.8 (70.2) 46.1 (44.8)Miyagi-ken 57.3 (58.4) 68.5 (70.0) 46.9 (47.8) Hyogo-ken 54.5 (56.7) 66.4 (69.6) 43.8 (45.1)Akita-ken 54.2 (56.7) 65.1 (68.1) 44.8 (46.9) Nara-ken 53.2 (55.0) 65.3 (68.7) 42.5 (42.9)Yamagata-ken 58.1 (59.3) 67.3 (69.8) 49.8 (49.9) Wakayama-ken 54.5 (55.7) 65.7 (68.0) 44.8 (45.2)Fukushima-ken 56.1 (59.4) 66.9 (70.1) 46.0 (49.4) Tottori-ken 57.5 (60.2) 66.9 (69.7) 49.2 (51.7)Ibaraki-ken 58.3 (60.8) 69.3 (72.7) 47.5 (49.1) Shimane-ken 58.0 (58.5) 68.3 (69.8) 48.9 (48.5)Tochigi-ken 59.3 (62.0) 70.1 (73.6) 48.7 (50.7) Okayama-ken 56.7 (58.5) 66.4 (70.0) 47.9 (48.0)Gumma-ken 59.7 (60.4) 69.6 (71.7) 50.2 (49.6) Hiroshima-ken 57.0 (58.8) 68.0 (70.8) 46.9 (48.0)Saitama-ken 59.2 (61.0) 70.5 (73.0) 48.1 (49.0) Yamaguchi-ken 54.8 (56.7) 65.9 (68.7) 45.2 (46.3)Chiba-ken 58.9 (60.3) 70.0 (72.6) 47.9 (48.1) Tokushima-ken 54.3 (55.6) 63.4 (65.4) 46.3 (47.0)Tokyo-to 62.5 (63.5) 73.2 (75.4) 52.2 (51.8) Kagawa-ken 57.1 (58.4) 66.9 (69.6) 48.1 (48.4)Kanagawa-ken 59.4 (61.6) 70.5 (74.5) 48.4 (48.5) Ehime-ken 55.0 (56.6) 65.1 (68.6) 46.4 (46.1)Niigata-ken 57.9 (60.0) 67.8 (70.6) 48.7 (50.3) Kochi-ken 55.7 (56.4) 64.1 (65.5) 48.5 (48.5)Toyama-ken 59.8 (62.4) 69.4 (73.3) 51.1 (52.5) Fukuoka-ken 55.7 (57.5) 65.7 (68.8) 47.0 (47.6)Ishikawa-ken 60.1 (62.2) 68.7 (71.9) 52.2 (53.3) Saga-ken 58.9 (59.3) 68.9 (69.6) 50.2 (50.5)Fukui-ken 61.4 (62.6) 70.5 (72.7) 53.0 (53.4) Nagasaki-ken 54.6 (55.3) 64.6 (66.4) 46.2 (46.0)Yamanashi-ken 59.5 (61.5) 69.2 (72.3) 50.4 (51.4) Kumamoto-ken 56.5 (57.6) 65.5 (67.3) 48.7 (49.3)Nagano-ken 60.2 (63.2) 69.9 (74.2) 51.1 (53.0) Oita-ken 55.5 (57.4) 66.4 (69.1) 46.0 (47.4)Gifu-ken 59.7 (61.4) 69.4 (72.9) 50.9 (50.8) Miyazaki-ken 57.2 (57.8) 66.3 (68.4) 49.3 (48.6)Shizuoka-ken 60.3 (63.6) 70.3 (74.4) 50.8 (53.3) Kagoshima-ken 55.5 (56.5) 65.0 (67.7) 47.4 (47.1)Aichi-ken 61.4 (64.2) 72.3 (76.1) 50.7 (52.2) Okinawa-ken 56.2 (56.6) 64.5 (66.0) 48.4 (47.8) Note)In brackets:2007 results
Both sexes Both sexes
Fig. III-1: Ratio of persons engaged in work by prefecture / 2012
c. Fukui-ken has the highest ratio of persons engaged in work to working-age population.
As the ratio of persons engaged in work to those aged 15 to 64 (working-age population) (72.3% in
Japan), Fukui-ken was highest with 77.4%, followed by Toyama-ken (76.7%), Shimane-ken,
Yamagata-ken and Ishikawa-ken (75.8% for each), and Nagano-ken (75.2%).
Compared to 2007 by sex, the ratio for males decreased in most prefectures, particularly in
Nagano-ken (down by 3.1 points) and Kanagawa-ken (down by 2.6 points). On the other hand, the
ratio increased in five prefectures, particularly in Saga-ken (up by 0.6 points).
For females, the ratio increased in most prefectures, particularly in Osaka-fu (up by 4.0 points) and
Ehime-ken (up by 3.5 points). On the other hand, it decreased in six prefectures, particularly in
Fukushima-ken (down by 2.6 points)
(Table III-2, Fig. III-2)
(%)
60.0 and over
58.0 to less than 60.0
56.0 to less than 58.0
Less than 56.0
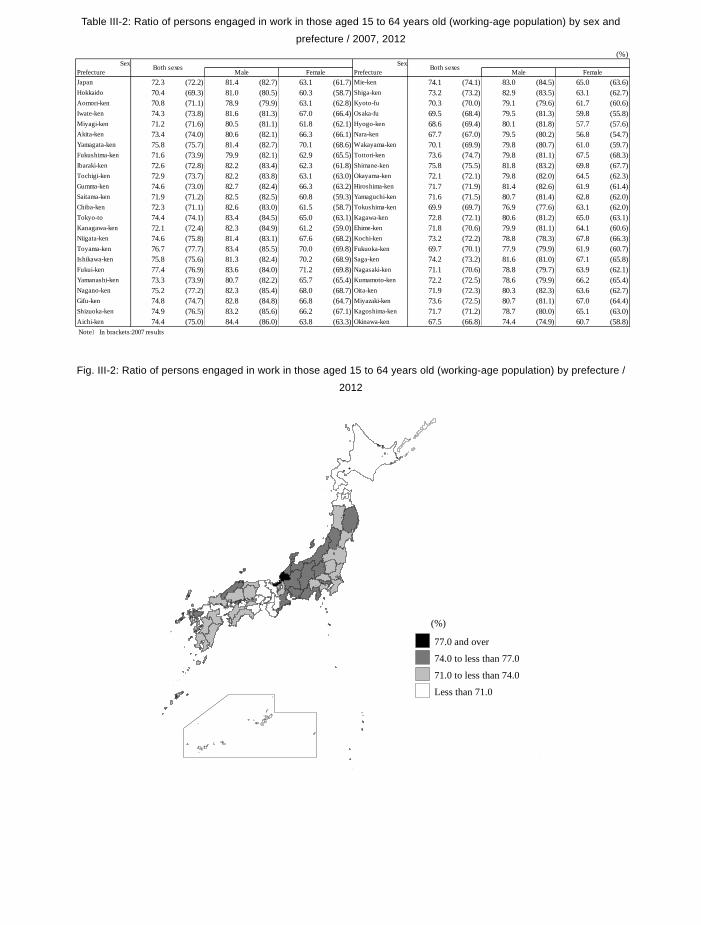
230
Table III-2: Ratio of persons engaged in work in those aged 15 to 64 years old (working-age population) by sex and
prefecture / 2007, 2012
Fig. III-2: Ratio of persons engaged in work in those aged 15 to 64 years old (working-age population) by prefecture /
2012
(%)Sex Sex
Prefecture Male Female Prefecture Male FemaleJapan 72.3 (72.2) 81.4 (82.7) 63.1 (61.7) Mie-ken 74.1 (74.1) 83.0 (84.5) 65.0 (63.6)Hokkaido 70.4 (69.3) 81.0 (80.5) 60.3 (58.7) Shiga-ken 73.2 (73.2) 82.9 (83.5) 63.1 (62.7)Aomori-ken 70.8 (71.1) 78.9 (79.9) 63.1 (62.8) Kyoto-fu 70.3 (70.0) 79.1 (79.6) 61.7 (60.6)Iwate-ken 74.3 (73.8) 81.6 (81.3) 67.0 (66.4) Osaka-fu 69.5 (68.4) 79.5 (81.3) 59.8 (55.8)Miyagi-ken 71.2 (71.6) 80.5 (81.1) 61.8 (62.1) Hyogo-ken 68.6 (69.4) 80.1 (81.8) 57.7 (57.6)Akita-ken 73.4 (74.0) 80.6 (82.1) 66.3 (66.1) Nara-ken 67.7 (67.0) 79.5 (80.2) 56.8 (54.7)Yamagata-ken 75.8 (75.7) 81.4 (82.7) 70.1 (68.6) Wakayama-ken 70.1 (69.9) 79.8 (80.7) 61.0 (59.7)Fukushima-ken 71.6 (73.9) 79.9 (82.1) 62.9 (65.5) Tottori-ken 73.6 (74.7) 79.8 (81.1) 67.5 (68.3)Ibaraki-ken 72.6 (72.8) 82.2 (83.4) 62.3 (61.8) Shimane-ken 75.8 (75.5) 81.8 (83.2) 69.8 (67.7)Tochigi-ken 72.9 (73.7) 82.2 (83.8) 63.1 (63.0) Okayama-ken 72.1 (72.1) 79.8 (82.0) 64.5 (62.3)Gumma-ken 74.6 (73.0) 82.7 (82.4) 66.3 (63.2) Hiroshima-ken 71.7 (71.9) 81.4 (82.6) 61.9 (61.4)Saitama-ken 71.9 (71.2) 82.5 (82.5) 60.8 (59.3) Yamaguchi-ken 71.6 (71.5) 80.7 (81.4) 62.8 (62.0)Chiba-ken 72.3 (71.1) 82.6 (83.0) 61.5 (58.7) Tokushima-ken 69.9 (69.7) 76.9 (77.6) 63.1 (62.0)Tokyo-to 74.4 (74.1) 83.4 (84.5) 65.0 (63.1) Kagawa-ken 72.8 (72.1) 80.6 (81.2) 65.0 (63.1)Kanagawa-ken 72.1 (72.4) 82.3 (84.9) 61.2 (59.0) Ehime-ken 71.8 (70.6) 79.9 (81.1) 64.1 (60.6)Niigata-ken 74.6 (75.8) 81.4 (83.1) 67.6 (68.2) Kochi-ken 73.2 (72.2) 78.8 (78.3) 67.8 (66.3)Toyama-ken 76.7 (77.7) 83.4 (85.5) 70.0 (69.8) Fukuoka-ken 69.7 (70.1) 77.9 (79.9) 61.9 (60.7)Ishikawa-ken 75.8 (75.6) 81.3 (82.4) 70.2 (68.9) Saga-ken 74.2 (73.2) 81.6 (81.0) 67.1 (65.8)Fukui-ken 77.4 (76.9) 83.6 (84.0) 71.2 (69.8) Nagasaki-ken 71.1 (70.6) 78.8 (79.7) 63.9 (62.1)Yamanashi-ken 73.3 (73.9) 80.7 (82.2) 65.7 (65.4) Kumamoto-ken 72.2 (72.5) 78.6 (79.9) 66.2 (65.4)Nagano-ken 75.2 (77.2) 82.3 (85.4) 68.0 (68.7) Oita-ken 71.9 (72.3) 80.3 (82.3) 63.6 (62.7)Gifu-ken 74.8 (74.7) 82.8 (84.8) 66.8 (64.7) Miyazaki-ken 73.6 (72.5) 80.7 (81.1) 67.0 (64.4)Shizuoka-ken 74.9 (76.5) 83.2 (85.6) 66.2 (67.1) Kagoshima-ken 71.7 (71.2) 78.7 (80.0) 65.1 (63.0)Aichi-ken 74.4 (75.0) 84.4 (86.0) 63.8 (63.3) Okinawa-ken 67.5 (66.8) 74.4 (74.9) 60.7 (58.8) Note)In brackets:2007 results
Both sexes Both sexes
(%)
77.0 and over
74.0 to less than 77.0
71.0 to less than 74.0
Less than 71.0
(2) Ratio of persons engaged in work by industry In all prefectures, the secondary industry ratio falls while the tertiary industry ratio
rises. As for the ratio of persons engaged in work by industry, the ratio for primary industries (4.0% in
Japan) was highest in Aomori-ken with 13.2%, followed by Kochi-ken (12.0%), Kumamoto-ken
(11.0%), Miyazaki-ken (10.8%), and Iwate-ken (10.4%).
As for secondary industries (25.4% in Japan), the ratio was highest in Aichi-ken with 35.0%,
followed by Shiga-ken (34.2%), Toyama-ken (33.5%), Tochigi-ken (33.1%), and Shizuoka-ken (32.9%).
For tertiary industries (70.6% in Japan), the ratio was highest in Tokyo-to with 81.5%, followed by
Okinawa-ken (78.6%), Hokkaido (75.7%), and Fukuoka-ken and Chiba-ken (75.4% for each).
Compared to 2007, the ratio of tertiary industries increased in all prefectures, while primary industries
decreased in most prefectures and secondary industries increased in all prefectures. (Table III-3)
Table III-3: Ratio of persons engaged in work by industry and prefecture / 2007, 2012
(%)
Prefecture Primary industries Secondaryindustries
Tertiary industries Prefecture Primary industries Secondaryindustries
Tertiary industries
Japan 4.0 (4.3) 25.4 (26.9) 70.6 (68.8) Mie-ken 4.5 (4.5) 32.3 (34.7) 63.2 (60.9)Hokkaido 6.0 (5.7) 18.3 (19.1) 75.7 (75.2) Shiga-ken 3.1 (2.9) 34.2 (36.5) 62.8 (60.5)Aomori-ken 13.2 (13.1) 20.9 (22.2) 65.9 (64.7) Kyoto-fu 2.2 (2.4) 23.7 (25.3) 74.1 (72.3)Iwate-ken 10.4 (12.3) 25.4 (27.1) 64.2 (60.5) Osaka-fu 0.4 (0.5) 25.2 (26.9) 74.4 (72.5)Miyagi-ken 4.5 (5.3) 24.5 (24.9) 71.0 (69.8) Hyogo-ken 1.6 (2.2) 27.2 (28.3) 71.2 (69.6)Akita-ken 9.2 (8.9) 24.6 (28.3) 66.2 (62.9) Nara-ken 2.7 (2.6) 24.0 (25.9) 73.4 (71.6)Yamagata-ken 9.9 (10.0) 29.0 (30.9) 61.1 (59.1) Wakayama-ken 10.0 (9.6) 22.5 (23.9) 67.5 (66.5)Fukushima-ken 7.0 (7.9) 31.0 (31.9) 62.0 (60.2) Tottori-ken 9.7 (10.2) 23.0 (25.6) 67.3 (64.3)Ibaraki-ken 6.1 (6.7) 30.5 (32.2) 63.3 (61.1) Shimane-ken 8.7 (8.4) 23.7 (26.3) 67.7 (65.4)Tochigi-ken 5.2 (6.7) 33.1 (34.3) 61.6 (59.0) Okayama-ken 4.8 (5.6) 27.6 (31.4) 67.5 (62.9)Gumma-ken 5.1 (5.8) 32.7 (34.4) 62.2 (59.8) Hiroshima-ken 3.5 (3.8) 28.2 (28.7) 68.3 (67.5)Saitama-ken 1.8 (2.0) 25.9 (27.6) 72.3 (70.4) Yamaguchi-ken 5.1 (6.0) 25.7 (27.2) 69.3 (66.8)Chiba-ken 3.4 (3.9) 21.2 (21.9) 75.4 (74.2) Tokushima-ken 9.7 (9.3) 24.5 (25.1) 65.8 (65.6)Tokyo-to 0.4 (0.5) 18.1 (18.8) 81.5 (80.7) Kagawa-ken 6.0 (6.1) 25.5 (26.7) 68.6 (67.2)Kanagawa-ken 0.8 (1.0) 24.2 (25.4) 75.0 (73.6) Ehime-ken 7.6 (8.6) 24.0 (26.4) 68.4 (65.1)Niigata-ken 6.2 (7.0) 29.2 (31.7) 64.6 (61.3) Kochi-ken 12.0 (11.5) 18.6 (19.0) 69.5 (69.5)Toyama-ken 3.6 (3.7) 33.5 (36.5) 63.0 (59.7) Fukuoka-ken 3.4 (3.9) 21.2 (21.6) 75.4 (74.5)Ishikawa-ken 3.2 (3.7) 28.2 (30.2) 68.6 (66.1) Saga-ken 10.0 (10.5) 24.5 (24.7) 65.5 (64.8)Fukui-ken 3.7 (4.4) 32.1 (34.2) 64.2 (61.4) Nagasaki-ken 8.9 (9.0) 21.3 (21.9) 69.8 (69.1)Yamanashi-ken 7.6 (7.5) 29.0 (32.8) 63.4 (59.7) Kumamoto-ken 11.0 (11.5) 21.7 (22.8) 67.3 (65.7)Nagano-ken 9.7 (9.5) 30.0 (31.1) 60.3 (59.4) Oita-ken 7.0 (8.3) 24.9 (25.5) 68.1 (66.1)Gifu-ken 3.3 (3.4) 32.4 (35.1) 64.4 (61.5) Miyazaki-ken 10.8 (11.6) 21.1 (23.7) 68.1 (64.7)Shizuoka-ken 4.7 (4.6) 32.9 (36.0) 62.4 (59.5) Kagoshima-ken 10.2 (11.2) 20.1 (21.8) 69.6 (67.0)Aichi-ken 2.3 (2.5) 35.0 (35.1) 62.7 (62.4) Okinawa-ken 5.4 (4.8) 16.0 (16.7) 78.6 (78.5)
Note 1) "Industries unable to classify" have been excluded from the calculation of ratios.Note 2) Values given in parentheses indicate the results for 2007.Primary industries: "Agriculture and forestry" and "Fisheries"Secondary industries: "Mining and quarrying of stone and gravel", "Construction" and "Manufacturing"Tertiary industries: "Electricity, gas, heat supply and water", "Information and communications", "Transport and postal activities", "Wholesale and retail trade", "Finance and insurance", "Real estate and goods rental and leasing", "Scientific research, professional and technical services", "Accommodations, eating and drinking services", "Living-related and personal services and amusement services", "Education, learning support", "Medical, health care and welfare", "Compound services", "Services not elsewhere classified" and "Government not elsewhere classified"
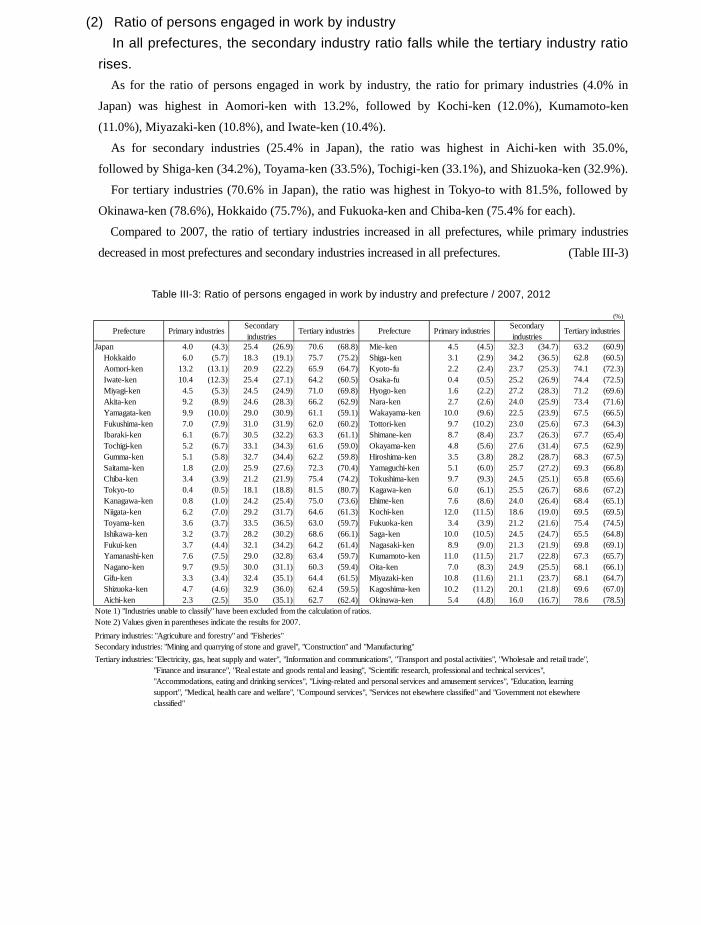
231
Table III-2: Ratio of persons engaged in work in those aged 15 to 64 years old (working-age population) by sex and
prefecture / 2007, 2012
Fig. III-2: Ratio of persons engaged in work in those aged 15 to 64 years old (working-age population) by prefecture /
2012
(%)Sex Sex
Prefecture Male Female Prefecture Male FemaleJapan 72.3 (72.2) 81.4 (82.7) 63.1 (61.7) Mie-ken 74.1 (74.1) 83.0 (84.5) 65.0 (63.6)Hokkaido 70.4 (69.3) 81.0 (80.5) 60.3 (58.7) Shiga-ken 73.2 (73.2) 82.9 (83.5) 63.1 (62.7)Aomori-ken 70.8 (71.1) 78.9 (79.9) 63.1 (62.8) Kyoto-fu 70.3 (70.0) 79.1 (79.6) 61.7 (60.6)Iwate-ken 74.3 (73.8) 81.6 (81.3) 67.0 (66.4) Osaka-fu 69.5 (68.4) 79.5 (81.3) 59.8 (55.8)Miyagi-ken 71.2 (71.6) 80.5 (81.1) 61.8 (62.1) Hyogo-ken 68.6 (69.4) 80.1 (81.8) 57.7 (57.6)Akita-ken 73.4 (74.0) 80.6 (82.1) 66.3 (66.1) Nara-ken 67.7 (67.0) 79.5 (80.2) 56.8 (54.7)Yamagata-ken 75.8 (75.7) 81.4 (82.7) 70.1 (68.6) Wakayama-ken 70.1 (69.9) 79.8 (80.7) 61.0 (59.7)Fukushima-ken 71.6 (73.9) 79.9 (82.1) 62.9 (65.5) Tottori-ken 73.6 (74.7) 79.8 (81.1) 67.5 (68.3)Ibaraki-ken 72.6 (72.8) 82.2 (83.4) 62.3 (61.8) Shimane-ken 75.8 (75.5) 81.8 (83.2) 69.8 (67.7)Tochigi-ken 72.9 (73.7) 82.2 (83.8) 63.1 (63.0) Okayama-ken 72.1 (72.1) 79.8 (82.0) 64.5 (62.3)Gumma-ken 74.6 (73.0) 82.7 (82.4) 66.3 (63.2) Hiroshima-ken 71.7 (71.9) 81.4 (82.6) 61.9 (61.4)Saitama-ken 71.9 (71.2) 82.5 (82.5) 60.8 (59.3) Yamaguchi-ken 71.6 (71.5) 80.7 (81.4) 62.8 (62.0)Chiba-ken 72.3 (71.1) 82.6 (83.0) 61.5 (58.7) Tokushima-ken 69.9 (69.7) 76.9 (77.6) 63.1 (62.0)Tokyo-to 74.4 (74.1) 83.4 (84.5) 65.0 (63.1) Kagawa-ken 72.8 (72.1) 80.6 (81.2) 65.0 (63.1)Kanagawa-ken 72.1 (72.4) 82.3 (84.9) 61.2 (59.0) Ehime-ken 71.8 (70.6) 79.9 (81.1) 64.1 (60.6)Niigata-ken 74.6 (75.8) 81.4 (83.1) 67.6 (68.2) Kochi-ken 73.2 (72.2) 78.8 (78.3) 67.8 (66.3)Toyama-ken 76.7 (77.7) 83.4 (85.5) 70.0 (69.8) Fukuoka-ken 69.7 (70.1) 77.9 (79.9) 61.9 (60.7)Ishikawa-ken 75.8 (75.6) 81.3 (82.4) 70.2 (68.9) Saga-ken 74.2 (73.2) 81.6 (81.0) 67.1 (65.8)Fukui-ken 77.4 (76.9) 83.6 (84.0) 71.2 (69.8) Nagasaki-ken 71.1 (70.6) 78.8 (79.7) 63.9 (62.1)Yamanashi-ken 73.3 (73.9) 80.7 (82.2) 65.7 (65.4) Kumamoto-ken 72.2 (72.5) 78.6 (79.9) 66.2 (65.4)Nagano-ken 75.2 (77.2) 82.3 (85.4) 68.0 (68.7) Oita-ken 71.9 (72.3) 80.3 (82.3) 63.6 (62.7)Gifu-ken 74.8 (74.7) 82.8 (84.8) 66.8 (64.7) Miyazaki-ken 73.6 (72.5) 80.7 (81.1) 67.0 (64.4)Shizuoka-ken 74.9 (76.5) 83.2 (85.6) 66.2 (67.1) Kagoshima-ken 71.7 (71.2) 78.7 (80.0) 65.1 (63.0)Aichi-ken 74.4 (75.0) 84.4 (86.0) 63.8 (63.3) Okinawa-ken 67.5 (66.8) 74.4 (74.9) 60.7 (58.8) Note)In brackets:2007 results
Both sexes Both sexes
(%)
77.0 and over
74.0 to less than 77.0
71.0 to less than 74.0
Less than 71.0
(2) Ratio of persons engaged in work by industry In all prefectures, the secondary industry ratio falls while the tertiary industry ratio
rises. As for the ratio of persons engaged in work by industry, the ratio for primary industries (4.0% in
Japan) was highest in Aomori-ken with 13.2%, followed by Kochi-ken (12.0%), Kumamoto-ken
(11.0%), Miyazaki-ken (10.8%), and Iwate-ken (10.4%).
As for secondary industries (25.4% in Japan), the ratio was highest in Aichi-ken with 35.0%,
followed by Shiga-ken (34.2%), Toyama-ken (33.5%), Tochigi-ken (33.1%), and Shizuoka-ken (32.9%).
For tertiary industries (70.6% in Japan), the ratio was highest in Tokyo-to with 81.5%, followed by
Okinawa-ken (78.6%), Hokkaido (75.7%), and Fukuoka-ken and Chiba-ken (75.4% for each).
Compared to 2007, the ratio of tertiary industries increased in all prefectures, while primary industries
decreased in most prefectures and secondary industries increased in all prefectures. (Table III-3)
Table III-3: Ratio of persons engaged in work by industry and prefecture / 2007, 2012
(%)
Prefecture Primary industries Secondaryindustries
Tertiary industries Prefecture Primary industries Secondaryindustries
Tertiary industries
Japan 4.0 (4.3) 25.4 (26.9) 70.6 (68.8) Mie-ken 4.5 (4.5) 32.3 (34.7) 63.2 (60.9)Hokkaido 6.0 (5.7) 18.3 (19.1) 75.7 (75.2) Shiga-ken 3.1 (2.9) 34.2 (36.5) 62.8 (60.5)Aomori-ken 13.2 (13.1) 20.9 (22.2) 65.9 (64.7) Kyoto-fu 2.2 (2.4) 23.7 (25.3) 74.1 (72.3)Iwate-ken 10.4 (12.3) 25.4 (27.1) 64.2 (60.5) Osaka-fu 0.4 (0.5) 25.2 (26.9) 74.4 (72.5)Miyagi-ken 4.5 (5.3) 24.5 (24.9) 71.0 (69.8) Hyogo-ken 1.6 (2.2) 27.2 (28.3) 71.2 (69.6)Akita-ken 9.2 (8.9) 24.6 (28.3) 66.2 (62.9) Nara-ken 2.7 (2.6) 24.0 (25.9) 73.4 (71.6)Yamagata-ken 9.9 (10.0) 29.0 (30.9) 61.1 (59.1) Wakayama-ken 10.0 (9.6) 22.5 (23.9) 67.5 (66.5)Fukushima-ken 7.0 (7.9) 31.0 (31.9) 62.0 (60.2) Tottori-ken 9.7 (10.2) 23.0 (25.6) 67.3 (64.3)Ibaraki-ken 6.1 (6.7) 30.5 (32.2) 63.3 (61.1) Shimane-ken 8.7 (8.4) 23.7 (26.3) 67.7 (65.4)Tochigi-ken 5.2 (6.7) 33.1 (34.3) 61.6 (59.0) Okayama-ken 4.8 (5.6) 27.6 (31.4) 67.5 (62.9)Gumma-ken 5.1 (5.8) 32.7 (34.4) 62.2 (59.8) Hiroshima-ken 3.5 (3.8) 28.2 (28.7) 68.3 (67.5)Saitama-ken 1.8 (2.0) 25.9 (27.6) 72.3 (70.4) Yamaguchi-ken 5.1 (6.0) 25.7 (27.2) 69.3 (66.8)Chiba-ken 3.4 (3.9) 21.2 (21.9) 75.4 (74.2) Tokushima-ken 9.7 (9.3) 24.5 (25.1) 65.8 (65.6)Tokyo-to 0.4 (0.5) 18.1 (18.8) 81.5 (80.7) Kagawa-ken 6.0 (6.1) 25.5 (26.7) 68.6 (67.2)Kanagawa-ken 0.8 (1.0) 24.2 (25.4) 75.0 (73.6) Ehime-ken 7.6 (8.6) 24.0 (26.4) 68.4 (65.1)Niigata-ken 6.2 (7.0) 29.2 (31.7) 64.6 (61.3) Kochi-ken 12.0 (11.5) 18.6 (19.0) 69.5 (69.5)Toyama-ken 3.6 (3.7) 33.5 (36.5) 63.0 (59.7) Fukuoka-ken 3.4 (3.9) 21.2 (21.6) 75.4 (74.5)Ishikawa-ken 3.2 (3.7) 28.2 (30.2) 68.6 (66.1) Saga-ken 10.0 (10.5) 24.5 (24.7) 65.5 (64.8)Fukui-ken 3.7 (4.4) 32.1 (34.2) 64.2 (61.4) Nagasaki-ken 8.9 (9.0) 21.3 (21.9) 69.8 (69.1)Yamanashi-ken 7.6 (7.5) 29.0 (32.8) 63.4 (59.7) Kumamoto-ken 11.0 (11.5) 21.7 (22.8) 67.3 (65.7)Nagano-ken 9.7 (9.5) 30.0 (31.1) 60.3 (59.4) Oita-ken 7.0 (8.3) 24.9 (25.5) 68.1 (66.1)Gifu-ken 3.3 (3.4) 32.4 (35.1) 64.4 (61.5) Miyazaki-ken 10.8 (11.6) 21.1 (23.7) 68.1 (64.7)Shizuoka-ken 4.7 (4.6) 32.9 (36.0) 62.4 (59.5) Kagoshima-ken 10.2 (11.2) 20.1 (21.8) 69.6 (67.0)Aichi-ken 2.3 (2.5) 35.0 (35.1) 62.7 (62.4) Okinawa-ken 5.4 (4.8) 16.0 (16.7) 78.6 (78.5)
Note 1) "Industries unable to classify" have been excluded from the calculation of ratios.Note 2) Values given in parentheses indicate the results for 2007.Primary industries: "Agriculture and forestry" and "Fisheries"Secondary industries: "Mining and quarrying of stone and gravel", "Construction" and "Manufacturing"Tertiary industries: "Electricity, gas, heat supply and water", "Information and communications", "Transport and postal activities", "Wholesale and retail trade", "Finance and insurance", "Real estate and goods rental and leasing", "Scientific research, professional and technical services", "Accommodations, eating and drinking services", "Living-related and personal services and amusement services", "Education, learning support", "Medical, health care and welfare", "Compound services", "Services not elsewhere classified" and "Government not elsewhere classified"
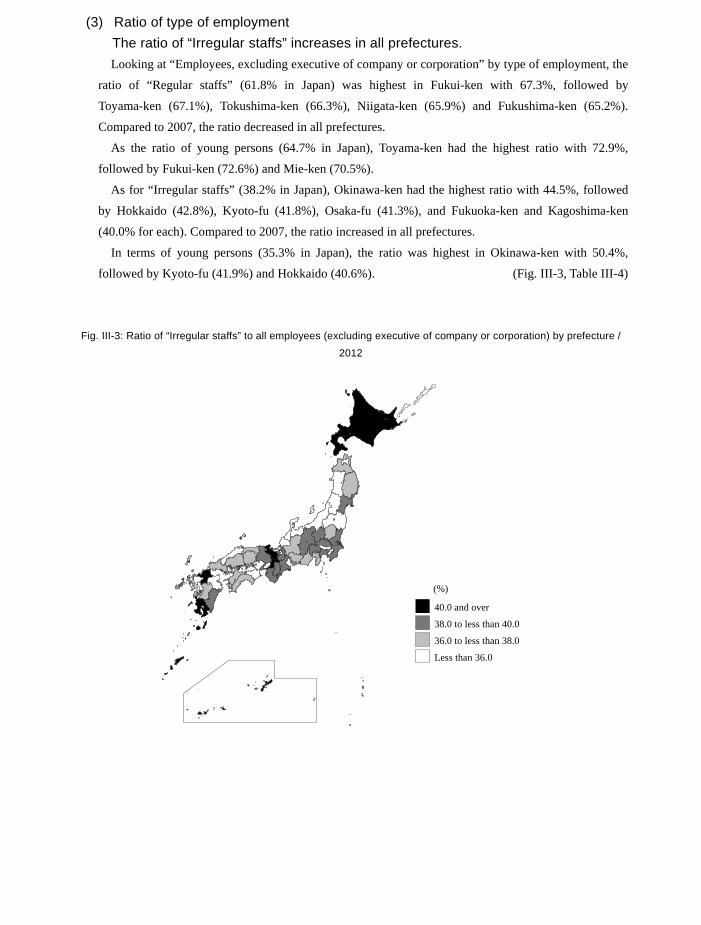
232
(3) Ratio of type of employment The ratio of “Irregular staffs” increases in all prefectures. Looking at “Employees, excluding executive of company or corporation” by type of employment, the
ratio of “Regular staffs” (61.8% in Japan) was highest in Fukui-ken with 67.3%, followed by
Toyama-ken (67.1%), Tokushima-ken (66.3%), Niigata-ken (65.9%) and Fukushima-ken (65.2%).
Compared to 2007, the ratio decreased in all prefectures.
As the ratio of young persons (64.7% in Japan), Toyama-ken had the highest ratio with 72.9%,
followed by Fukui-ken (72.6%) and Mie-ken (70.5%).
As for “Irregular staffs” (38.2% in Japan), Okinawa-ken had the highest ratio with 44.5%, followed
by Hokkaido (42.8%), Kyoto-fu (41.8%), Osaka-fu (41.3%), and Fukuoka-ken and Kagoshima-ken
(40.0% for each). Compared to 2007, the ratio increased in all prefectures.
In terms of young persons (35.3% in Japan), the ratio was highest in Okinawa-ken with 50.4%,
followed by Kyoto-fu (41.9%) and Hokkaido (40.6%). (Fig. III-3, Table III-4)
Fig. III-3: Ratio of “Irregular staffs” to all employees (excluding executive of company or corporation) by prefecture /
2012
(%)
40.0 and over
38.0 to less than 40.0
36.0 to less than 38.0
Less than 36.0
Table III-4: Ratio of employees (excluding executive of company or corporation) by main type of employment and prefecture
/ 2007, 2012
(%)Type of employment Type of employment
Prefecture
Of whichyoung
persons
Of whichyoung
persons Prefecture
Of whichyoung
persons
Of whichyoung
personsJapan 61.8 (64.4) 64.7 38.2 (35.5) 35.3 Mie-ken 61.4 (63.7) 70.5 38.6 (36.2) 29.5
Hokkaido 57.2 (61.8) 59.4 42.8 (38.2) 40.6 Shiga-ken 61.6 (62.3) 66.2 38.4 (37.7) 33.8Aomori-ken 62.1 (65.8) 63.0 37.9 (34.1) 37.1 Kyoto-fu 58.2 (59.9) 58.1 41.8 (40.0) 41.9Iwate-ken 62.4 (66.4) 63.3 37.6 (33.5) 36.7 Osaka-fu 58.7 (61.3) 62.4 41.3 (38.6) 37.6Miyagi-ken 60.7 (63.9) 61.4 39.3 (35.9) 38.6 Hyogo-ken 61.0 (63.1) 65.1 39.0 (36.8) 34.9Akita-ken 64.7 (66.0) 70.1 35.3 (33.9) 29.9 Nara-ken 60.3 (63.0) 60.9 39.7 (36.9) 39.2Yamagata-ken 64.2 (67.8) 69.2 35.8 (32.0) 30.8 Wakayama-ken 61.5 (64.5) 66.1 38.5 (35.3) 33.9Fukushima-ken 65.2 (66.0) 68.9 34.7 (34.0) 31.1 Tottori-ken 63.8 (67.6) 67.3 36.1 (32.4) 32.9Ibaraki-ken 61.4 (64.7) 64.9 38.6 (35.2) 35.2 Shimane-ken 64.9 (67.3) 69.1 35.1 (32.6) 30.9Tochigi-ken 63.3 (65.0) 67.1 36.7 (35.0) 32.9 Okayama-ken 63.3 (69.2) 66.2 36.7 (30.7) 33.7Gumma-ken 61.7 (64.5) 65.6 38.3 (35.4) 34.4 Hiroshima-ken 63.2 (64.8) 67.3 36.8 (35.0) 32.7Saitama-ken 60.4 (63.5) 62.6 39.6 (36.4) 37.4 Yamaguchi-ken 63.9 (67.0) 70.4 36.1 (32.9) 29.6Chiba-ken 60.6 (62.0) 61.6 39.4 (37.9) 38.4 Tokushima-ken 66.3 (70.1) 66.9 33.7 (29.8) 33.1Tokyo-to 64.3 (65.2) 64.7 35.7 (34.7) 35.3 Kagawa-ken 64.7 (69.4) 68.6 35.3 (30.5) 31.4Kanagawa-ken 61.8 (64.9) 64.6 38.2 (35.0) 35.4 Ehime-ken 63.3 (67.1) 69.3 36.7 (32.9) 30.7Niigata-ken 65.9 (69.0) 69.6 34.1 (30.9) 30.4 Kochi-ken 63.2 (66.5) 64.2 36.8 (33.3) 35.8Toyama-ken 67.1 (70.7) 72.9 32.9 (29.2) 27.1 Fukuoka-ken 60.0 (63.4) 60.3 40.0 (36.5) 39.7Ishikawa-ken 64.4 (68.2) 66.9 35.6 (31.8) 33.2 Saga-ken 65.0 (67.5) 67.8 35.0 (32.4) 32.1Fukui-ken 67.3 (69.9) 72.6 32.7 (29.9) 27.4 Nagasaki-ken 64.3 (66.3) 67.4 35.7 (33.6) 32.7Yamanashi-ken 60.5 (63.6) 63.2 39.5 (36.4) 36.7 Kumamoto-ken 63.2 (65.3) 63.9 36.8 (34.6) 36.1Nagano-ken 61.2 (64.7) 69.4 38.8 (35.2) 30.7 Oita-ken 64.4 (66.8) 70.4 35.6 (33.1) 29.7Gifu-ken 62.3 (63.6) 69.9 37.7 (36.3) 30.1 Miyazaki-ken 61.0 (66.9) 66.2 39.0 (33.1) 33.8Shizuoka-ken 62.4 (64.2) 68.9 37.6 (35.7) 31.2 Kagoshima-ken 60.0 (65.1) 65.1 40.0 (34.8) 34.9Aichi-ken 62.7 (64.8) 67.5 37.3 (35.2) 32.5 Okinawa-ken 55.5 (59.2) 49.7 44.5 (40.7) 50.4
Note 1) Values given in parentheses indicate the results for 2007. Note 2) "Young persons" are those aged 15 to 34.
Regular staffs Irregular staffs Regular staffs Irregular staffs
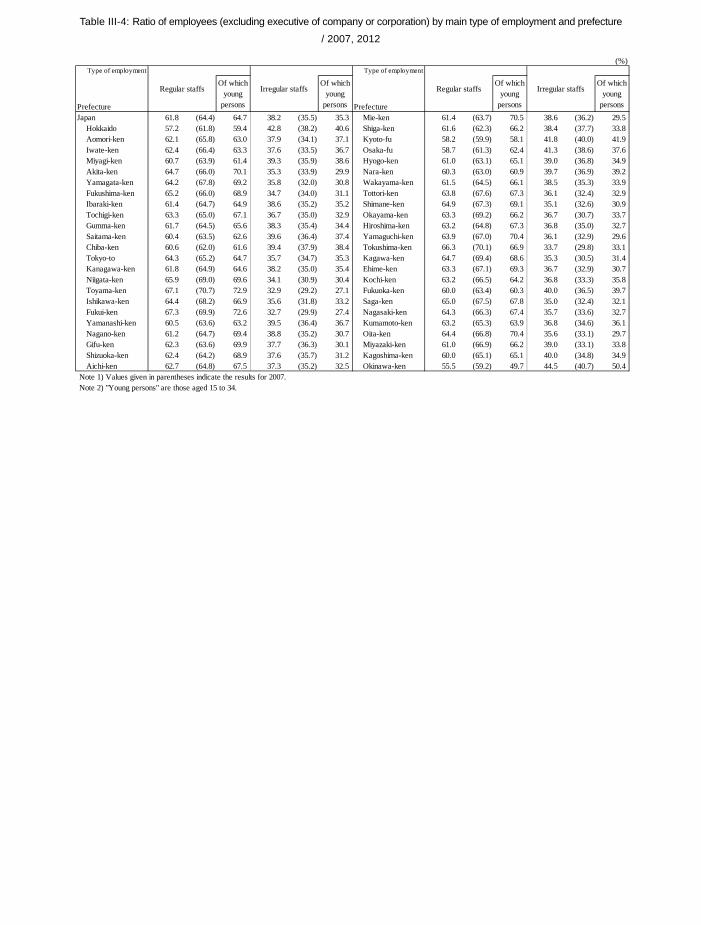
233
(3) Ratio of type of employment The ratio of “Irregular staffs” increases in all prefectures. Looking at “Employees, excluding executive of company or corporation” by type of employment, the
ratio of “Regular staffs” (61.8% in Japan) was highest in Fukui-ken with 67.3%, followed by
Toyama-ken (67.1%), Tokushima-ken (66.3%), Niigata-ken (65.9%) and Fukushima-ken (65.2%).
Compared to 2007, the ratio decreased in all prefectures.
As the ratio of young persons (64.7% in Japan), Toyama-ken had the highest ratio with 72.9%,
followed by Fukui-ken (72.6%) and Mie-ken (70.5%).
As for “Irregular staffs” (38.2% in Japan), Okinawa-ken had the highest ratio with 44.5%, followed
by Hokkaido (42.8%), Kyoto-fu (41.8%), Osaka-fu (41.3%), and Fukuoka-ken and Kagoshima-ken
(40.0% for each). Compared to 2007, the ratio increased in all prefectures.
In terms of young persons (35.3% in Japan), the ratio was highest in Okinawa-ken with 50.4%,
followed by Kyoto-fu (41.9%) and Hokkaido (40.6%). (Fig. III-3, Table III-4)
Fig. III-3: Ratio of “Irregular staffs” to all employees (excluding executive of company or corporation) by prefecture /
2012
(%)
40.0 and over
38.0 to less than 40.0
36.0 to less than 38.0
Less than 36.0
Table III-4: Ratio of employees (excluding executive of company or corporation) by main type of employment and prefecture
/ 2007, 2012
(%)Type of employment Type of employment
Prefecture
Of whichyoung
persons
Of whichyoung
persons Prefecture
Of whichyoung
persons
Of whichyoung
personsJapan 61.8 (64.4) 64.7 38.2 (35.5) 35.3 Mie-ken 61.4 (63.7) 70.5 38.6 (36.2) 29.5
Hokkaido 57.2 (61.8) 59.4 42.8 (38.2) 40.6 Shiga-ken 61.6 (62.3) 66.2 38.4 (37.7) 33.8Aomori-ken 62.1 (65.8) 63.0 37.9 (34.1) 37.1 Kyoto-fu 58.2 (59.9) 58.1 41.8 (40.0) 41.9Iwate-ken 62.4 (66.4) 63.3 37.6 (33.5) 36.7 Osaka-fu 58.7 (61.3) 62.4 41.3 (38.6) 37.6Miyagi-ken 60.7 (63.9) 61.4 39.3 (35.9) 38.6 Hyogo-ken 61.0 (63.1) 65.1 39.0 (36.8) 34.9Akita-ken 64.7 (66.0) 70.1 35.3 (33.9) 29.9 Nara-ken 60.3 (63.0) 60.9 39.7 (36.9) 39.2Yamagata-ken 64.2 (67.8) 69.2 35.8 (32.0) 30.8 Wakayama-ken 61.5 (64.5) 66.1 38.5 (35.3) 33.9Fukushima-ken 65.2 (66.0) 68.9 34.7 (34.0) 31.1 Tottori-ken 63.8 (67.6) 67.3 36.1 (32.4) 32.9Ibaraki-ken 61.4 (64.7) 64.9 38.6 (35.2) 35.2 Shimane-ken 64.9 (67.3) 69.1 35.1 (32.6) 30.9Tochigi-ken 63.3 (65.0) 67.1 36.7 (35.0) 32.9 Okayama-ken 63.3 (69.2) 66.2 36.7 (30.7) 33.7Gumma-ken 61.7 (64.5) 65.6 38.3 (35.4) 34.4 Hiroshima-ken 63.2 (64.8) 67.3 36.8 (35.0) 32.7Saitama-ken 60.4 (63.5) 62.6 39.6 (36.4) 37.4 Yamaguchi-ken 63.9 (67.0) 70.4 36.1 (32.9) 29.6Chiba-ken 60.6 (62.0) 61.6 39.4 (37.9) 38.4 Tokushima-ken 66.3 (70.1) 66.9 33.7 (29.8) 33.1Tokyo-to 64.3 (65.2) 64.7 35.7 (34.7) 35.3 Kagawa-ken 64.7 (69.4) 68.6 35.3 (30.5) 31.4Kanagawa-ken 61.8 (64.9) 64.6 38.2 (35.0) 35.4 Ehime-ken 63.3 (67.1) 69.3 36.7 (32.9) 30.7Niigata-ken 65.9 (69.0) 69.6 34.1 (30.9) 30.4 Kochi-ken 63.2 (66.5) 64.2 36.8 (33.3) 35.8Toyama-ken 67.1 (70.7) 72.9 32.9 (29.2) 27.1 Fukuoka-ken 60.0 (63.4) 60.3 40.0 (36.5) 39.7Ishikawa-ken 64.4 (68.2) 66.9 35.6 (31.8) 33.2 Saga-ken 65.0 (67.5) 67.8 35.0 (32.4) 32.1Fukui-ken 67.3 (69.9) 72.6 32.7 (29.9) 27.4 Nagasaki-ken 64.3 (66.3) 67.4 35.7 (33.6) 32.7Yamanashi-ken 60.5 (63.6) 63.2 39.5 (36.4) 36.7 Kumamoto-ken 63.2 (65.3) 63.9 36.8 (34.6) 36.1Nagano-ken 61.2 (64.7) 69.4 38.8 (35.2) 30.7 Oita-ken 64.4 (66.8) 70.4 35.6 (33.1) 29.7Gifu-ken 62.3 (63.6) 69.9 37.7 (36.3) 30.1 Miyazaki-ken 61.0 (66.9) 66.2 39.0 (33.1) 33.8Shizuoka-ken 62.4 (64.2) 68.9 37.6 (35.7) 31.2 Kagoshima-ken 60.0 (65.1) 65.1 40.0 (34.8) 34.9Aichi-ken 62.7 (64.8) 67.5 37.3 (35.2) 32.5 Okinawa-ken 55.5 (59.2) 49.7 44.5 (40.7) 50.4
Note 1) Values given in parentheses indicate the results for 2007. Note 2) "Young persons" are those aged 15 to 34.
Regular staffs Irregular staffs Regular staffs Irregular staffs
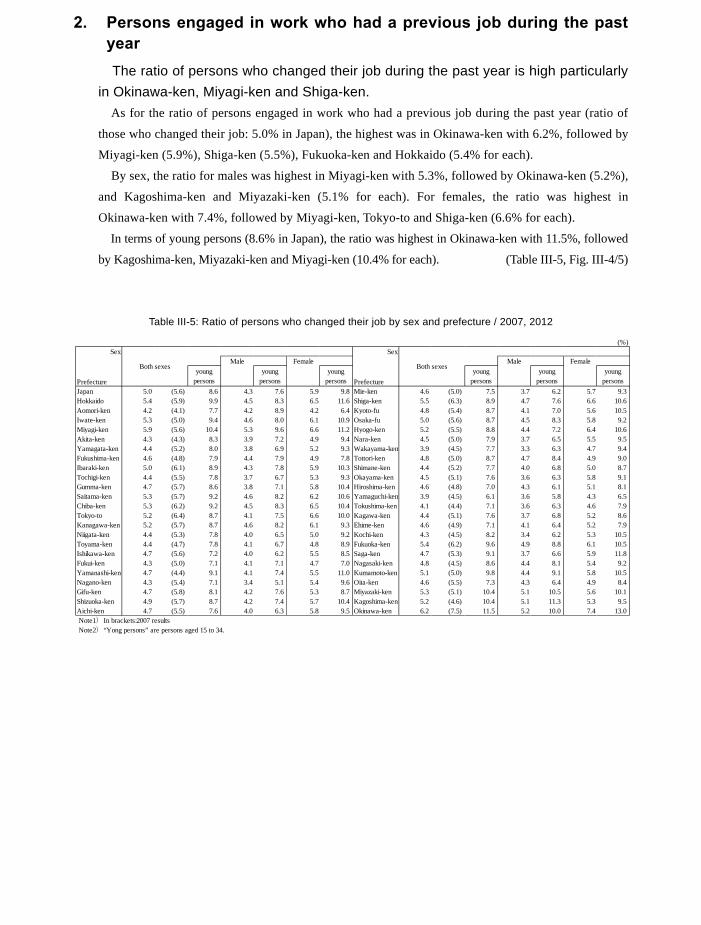
234
2. Persons engaged in work who had a previous job during the past year The ratio of persons who changed their job during the past year is high particularly
in Okinawa-ken, Miyagi-ken and Shiga-ken. As for the ratio of persons engaged in work who had a previous job during the past year (ratio of
those who changed their job: 5.0% in Japan), the highest was in Okinawa-ken with 6.2%, followed by
Miyagi-ken (5.9%), Shiga-ken (5.5%), Fukuoka-ken and Hokkaido (5.4% for each).
By sex, the ratio for males was highest in Miyagi-ken with 5.3%, followed by Okinawa-ken (5.2%),
and Kagoshima-ken and Miyazaki-ken (5.1% for each). For females, the ratio was highest in
Okinawa-ken with 7.4%, followed by Miyagi-ken, Tokyo-to and Shiga-ken (6.6% for each).
In terms of young persons (8.6% in Japan), the ratio was highest in Okinawa-ken with 11.5%, followed
by Kagoshima-ken, Miyazaki-ken and Miyagi-ken (10.4% for each). (Table III-5, Fig. III-4/5)
Table III-5: Ratio of persons who changed their job by sex and prefecture / 2007, 2012
(%)Sex Sex
Male Female Male Female
Prefectureyoung
personsyoung
personsyoung
persons Prefectureyoung
personsyoung
personsyoung
personsJapan 5.0 (5.6) 8.6 4.3 7.6 5.9 9.8 Mie-ken 4.6 (5.0) 7.5 3.7 6.2 5.7 9.3Hokkaido 5.4 (5.9) 9.9 4.5 8.3 6.5 11.6 Shiga-ken 5.5 (6.3) 8.9 4.7 7.6 6.6 10.6Aomori-ken 4.2 (4.1) 7.7 4.2 8.9 4.2 6.4 Kyoto-fu 4.8 (5.4) 8.7 4.1 7.0 5.6 10.5Iwate-ken 5.3 (5.0) 9.4 4.6 8.0 6.1 10.9 Osaka-fu 5.0 (5.6) 8.7 4.5 8.3 5.8 9.2Miyagi-ken 5.9 (5.6) 10.4 5.3 9.6 6.6 11.2 Hyogo-ken 5.2 (5.5) 8.8 4.4 7.2 6.4 10.6Akita-ken 4.3 (4.3) 8.3 3.9 7.2 4.9 9.4 Nara-ken 4.5 (5.0) 7.9 3.7 6.5 5.5 9.5Yamagata-ken 4.4 (5.2) 8.0 3.8 6.9 5.2 9.3 Wakayama-ken 3.9 (4.5) 7.7 3.3 6.3 4.7 9.4Fukushima-ken 4.6 (4.8) 7.9 4.4 7.9 4.9 7.8 Tottori-ken 4.8 (5.0) 8.7 4.7 8.4 4.9 9.0Ibaraki-ken 5.0 (6.1) 8.9 4.3 7.8 5.9 10.3 Shimane-ken 4.4 (5.2) 7.7 4.0 6.8 5.0 8.7Tochigi-ken 4.4 (5.5) 7.8 3.7 6.7 5.3 9.3 Okayama-ken 4.5 (5.1) 7.6 3.6 6.3 5.8 9.1Gumma-ken 4.7 (5.7) 8.6 3.8 7.1 5.8 10.4 Hiroshima-ken 4.6 (4.8) 7.0 4.3 6.1 5.1 8.1Saitama-ken 5.3 (5.7) 9.2 4.6 8.2 6.2 10.6 Yamaguchi-ken 3.9 (4.5) 6.1 3.6 5.8 4.3 6.5Chiba-ken 5.3 (6.2) 9.2 4.5 8.3 6.5 10.4 Tokushima-ken 4.1 (4.4) 7.1 3.6 6.3 4.6 7.9Tokyo-to 5.2 (6.4) 8.7 4.1 7.5 6.6 10.0 Kagawa-ken 4.4 (5.1) 7.6 3.7 6.8 5.2 8.6Kanagawa-ken 5.2 (5.7) 8.7 4.6 8.2 6.1 9.3 Ehime-ken 4.6 (4.9) 7.1 4.1 6.4 5.2 7.9Niigata-ken 4.4 (5.3) 7.8 4.0 6.5 5.0 9.2 Kochi-ken 4.3 (4.5) 8.2 3.4 6.2 5.3 10.5Toyama-ken 4.4 (4.7) 7.8 4.1 6.7 4.8 8.9 Fukuoka-ken 5.4 (6.2) 9.6 4.9 8.8 6.1 10.5Ishikawa-ken 4.7 (5.6) 7.2 4.0 6.2 5.5 8.5 Saga-ken 4.7 (5.3) 9.1 3.7 6.6 5.9 11.8Fukui-ken 4.3 (5.0) 7.1 4.1 7.1 4.7 7.0 Nagasaki-ken 4.8 (4.5) 8.6 4.4 8.1 5.4 9.2Yamanashi-ken 4.7 (4.4) 9.1 4.1 7.4 5.5 11.0 Kumamoto-ken 5.1 (5.0) 9.8 4.4 9.1 5.8 10.5Nagano-ken 4.3 (5.4) 7.1 3.4 5.1 5.4 9.6 Oita-ken 4.6 (5.5) 7.3 4.3 6.4 4.9 8.4Gifu-ken 4.7 (5.8) 8.1 4.2 7.6 5.3 8.7 Miyazaki-ken 5.3 (5.1) 10.4 5.1 10.5 5.6 10.1Shizuoka-ken 4.9 (5.7) 8.7 4.2 7.4 5.7 10.4 Kagoshima-ken 5.2 (4.6) 10.4 5.1 11.3 5.3 9.5Aichi-ken 4.7 (5.5) 7.6 4.0 6.3 5.8 9.5 Okinawa-ken 6.2 (7.5) 11.5 5.2 10.0 7.4 13.0 Note1)In brackets:2007 results Note2)“Yong persons” are persons aged 15 to 34.
Both sexes Both sexes
Fig. III-4: Ratio of persons who changed their job by prefecture / 2012
Fig. III-5: Ratio of persons who changed their job (young persons) by prefecture / 2012
(%)
5.5 and over
5.0 to less than 5.5
4.5 to less than 5.0
Less than 4.5
(%)
10.0 and over
9.0 to less than 10.0
8.0 to less than 9.0
Less than 8.0
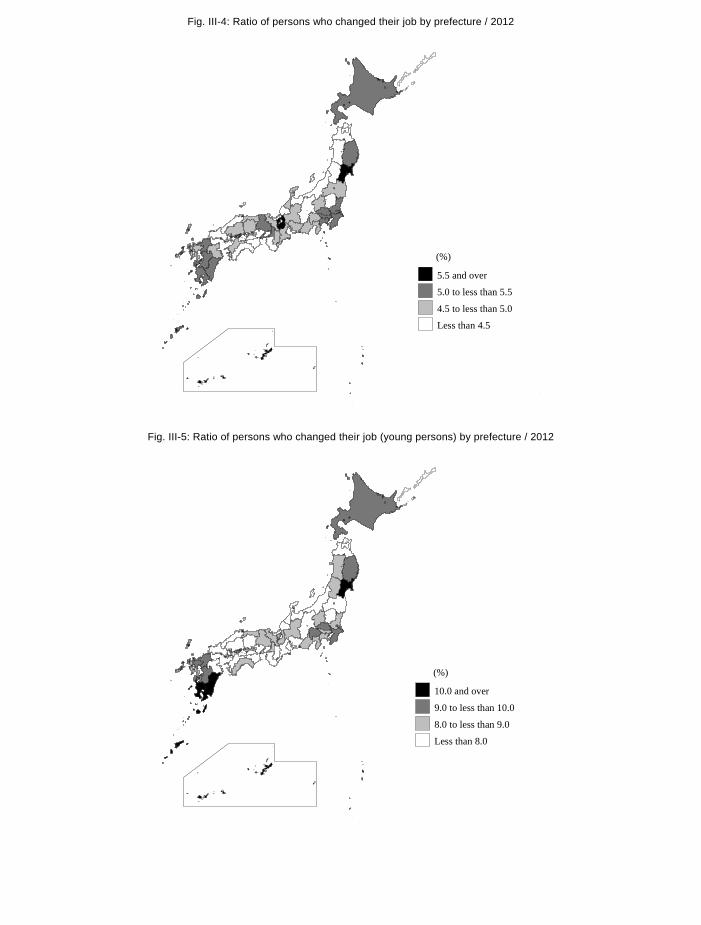
235
2. Persons engaged in work who had a previous job during the past year The ratio of persons who changed their job during the past year is high particularly
in Okinawa-ken, Miyagi-ken and Shiga-ken. As for the ratio of persons engaged in work who had a previous job during the past year (ratio of
those who changed their job: 5.0% in Japan), the highest was in Okinawa-ken with 6.2%, followed by
Miyagi-ken (5.9%), Shiga-ken (5.5%), Fukuoka-ken and Hokkaido (5.4% for each).
By sex, the ratio for males was highest in Miyagi-ken with 5.3%, followed by Okinawa-ken (5.2%),
and Kagoshima-ken and Miyazaki-ken (5.1% for each). For females, the ratio was highest in
Okinawa-ken with 7.4%, followed by Miyagi-ken, Tokyo-to and Shiga-ken (6.6% for each).
In terms of young persons (8.6% in Japan), the ratio was highest in Okinawa-ken with 11.5%, followed
by Kagoshima-ken, Miyazaki-ken and Miyagi-ken (10.4% for each). (Table III-5, Fig. III-4/5)
Table III-5: Ratio of persons who changed their job by sex and prefecture / 2007, 2012
(%)Sex Sex
Male Female Male Female
Prefectureyoung
personsyoung
personsyoung
persons Prefectureyoung
personsyoung
personsyoung
personsJapan 5.0 (5.6) 8.6 4.3 7.6 5.9 9.8 Mie-ken 4.6 (5.0) 7.5 3.7 6.2 5.7 9.3Hokkaido 5.4 (5.9) 9.9 4.5 8.3 6.5 11.6 Shiga-ken 5.5 (6.3) 8.9 4.7 7.6 6.6 10.6Aomori-ken 4.2 (4.1) 7.7 4.2 8.9 4.2 6.4 Kyoto-fu 4.8 (5.4) 8.7 4.1 7.0 5.6 10.5Iwate-ken 5.3 (5.0) 9.4 4.6 8.0 6.1 10.9 Osaka-fu 5.0 (5.6) 8.7 4.5 8.3 5.8 9.2Miyagi-ken 5.9 (5.6) 10.4 5.3 9.6 6.6 11.2 Hyogo-ken 5.2 (5.5) 8.8 4.4 7.2 6.4 10.6Akita-ken 4.3 (4.3) 8.3 3.9 7.2 4.9 9.4 Nara-ken 4.5 (5.0) 7.9 3.7 6.5 5.5 9.5Yamagata-ken 4.4 (5.2) 8.0 3.8 6.9 5.2 9.3 Wakayama-ken 3.9 (4.5) 7.7 3.3 6.3 4.7 9.4Fukushima-ken 4.6 (4.8) 7.9 4.4 7.9 4.9 7.8 Tottori-ken 4.8 (5.0) 8.7 4.7 8.4 4.9 9.0Ibaraki-ken 5.0 (6.1) 8.9 4.3 7.8 5.9 10.3 Shimane-ken 4.4 (5.2) 7.7 4.0 6.8 5.0 8.7Tochigi-ken 4.4 (5.5) 7.8 3.7 6.7 5.3 9.3 Okayama-ken 4.5 (5.1) 7.6 3.6 6.3 5.8 9.1Gumma-ken 4.7 (5.7) 8.6 3.8 7.1 5.8 10.4 Hiroshima-ken 4.6 (4.8) 7.0 4.3 6.1 5.1 8.1Saitama-ken 5.3 (5.7) 9.2 4.6 8.2 6.2 10.6 Yamaguchi-ken 3.9 (4.5) 6.1 3.6 5.8 4.3 6.5Chiba-ken 5.3 (6.2) 9.2 4.5 8.3 6.5 10.4 Tokushima-ken 4.1 (4.4) 7.1 3.6 6.3 4.6 7.9Tokyo-to 5.2 (6.4) 8.7 4.1 7.5 6.6 10.0 Kagawa-ken 4.4 (5.1) 7.6 3.7 6.8 5.2 8.6Kanagawa-ken 5.2 (5.7) 8.7 4.6 8.2 6.1 9.3 Ehime-ken 4.6 (4.9) 7.1 4.1 6.4 5.2 7.9Niigata-ken 4.4 (5.3) 7.8 4.0 6.5 5.0 9.2 Kochi-ken 4.3 (4.5) 8.2 3.4 6.2 5.3 10.5Toyama-ken 4.4 (4.7) 7.8 4.1 6.7 4.8 8.9 Fukuoka-ken 5.4 (6.2) 9.6 4.9 8.8 6.1 10.5Ishikawa-ken 4.7 (5.6) 7.2 4.0 6.2 5.5 8.5 Saga-ken 4.7 (5.3) 9.1 3.7 6.6 5.9 11.8Fukui-ken 4.3 (5.0) 7.1 4.1 7.1 4.7 7.0 Nagasaki-ken 4.8 (4.5) 8.6 4.4 8.1 5.4 9.2Yamanashi-ken 4.7 (4.4) 9.1 4.1 7.4 5.5 11.0 Kumamoto-ken 5.1 (5.0) 9.8 4.4 9.1 5.8 10.5Nagano-ken 4.3 (5.4) 7.1 3.4 5.1 5.4 9.6 Oita-ken 4.6 (5.5) 7.3 4.3 6.4 4.9 8.4Gifu-ken 4.7 (5.8) 8.1 4.2 7.6 5.3 8.7 Miyazaki-ken 5.3 (5.1) 10.4 5.1 10.5 5.6 10.1Shizuoka-ken 4.9 (5.7) 8.7 4.2 7.4 5.7 10.4 Kagoshima-ken 5.2 (4.6) 10.4 5.1 11.3 5.3 9.5Aichi-ken 4.7 (5.5) 7.6 4.0 6.3 5.8 9.5 Okinawa-ken 6.2 (7.5) 11.5 5.2 10.0 7.4 13.0 Note1)In brackets:2007 results Note2)“Yong persons” are persons aged 15 to 34.
Both sexes Both sexes
Fig. III-4: Ratio of persons who changed their job by prefecture / 2012
Fig. III-5: Ratio of persons who changed their job (young persons) by prefecture / 2012
(%)
5.5 and over
5.0 to less than 5.5
4.5 to less than 5.0
Less than 4.5
(%)
10.0 and over
9.0 to less than 10.0
8.0 to less than 9.0
Less than 8.0
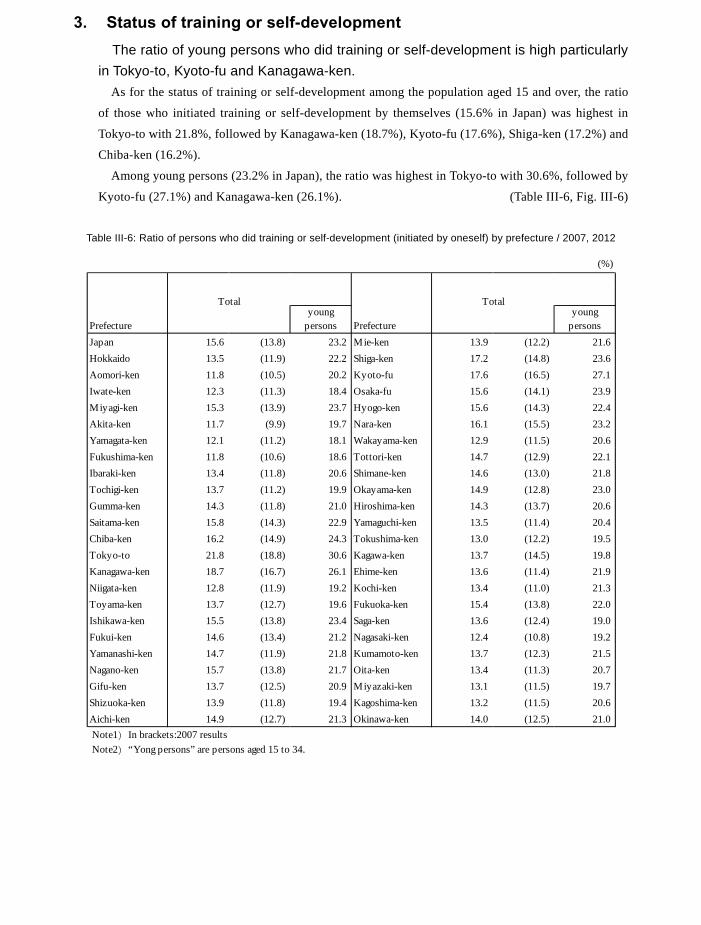
236
3. Status of training or self-development The ratio of young persons who did training or self-development is high particularly
in Tokyo-to, Kyoto-fu and Kanagawa-ken. As for the status of training or self-development among the population aged 15 and over, the ratio
of those who initiated training or self-development by themselves (15.6% in Japan) was highest in
Tokyo-to with 21.8%, followed by Kanagawa-ken (18.7%), Kyoto-fu (17.6%), Shiga-ken (17.2%) and
Chiba-ken (16.2%).
Among young persons (23.2% in Japan), the ratio was highest in Tokyo-to with 30.6%, followed by
Kyoto-fu (27.1%) and Kanagawa-ken (26.1%). (Table III-6, Fig. III-6)
Table III-6: Ratio of persons who did training or self-development (initiated by oneself) by prefecture / 2007, 2012
(%)
Prefectureyoung
persons Prefectureyoung
personsJapan 15.6 (13.8) 23.2 Mie-ken 13.9 (12.2) 21.6Hokkaido 13.5 (11.9) 22.2 Shiga-ken 17.2 (14.8) 23.6Aomori-ken 11.8 (10.5) 20.2 Kyoto-fu 17.6 (16.5) 27.1Iwate-ken 12.3 (11.3) 18.4 Osaka-fu 15.6 (14.1) 23.9Miyagi-ken 15.3 (13.9) 23.7 Hyogo-ken 15.6 (14.3) 22.4Akita-ken 11.7 (9.9) 19.7 Nara-ken 16.1 (15.5) 23.2Yamagata-ken 12.1 (11.2) 18.1 Wakayama-ken 12.9 (11.5) 20.6Fukushima-ken 11.8 (10.6) 18.6 Tottori-ken 14.7 (12.9) 22.1Ibaraki-ken 13.4 (11.8) 20.6 Shimane-ken 14.6 (13.0) 21.8Tochigi-ken 13.7 (11.2) 19.9 Okayama-ken 14.9 (12.8) 23.0Gumma-ken 14.3 (11.8) 21.0 Hiroshima-ken 14.3 (13.7) 20.6Saitama-ken 15.8 (14.3) 22.9 Yamaguchi-ken 13.5 (11.4) 20.4Chiba-ken 16.2 (14.9) 24.3 Tokushima-ken 13.0 (12.2) 19.5Tokyo-to 21.8 (18.8) 30.6 Kagawa-ken 13.7 (14.5) 19.8Kanagawa-ken 18.7 (16.7) 26.1 Ehime-ken 13.6 (11.4) 21.9Niigata-ken 12.8 (11.9) 19.2 Kochi-ken 13.4 (11.0) 21.3Toyama-ken 13.7 (12.7) 19.6 Fukuoka-ken 15.4 (13.8) 22.0Ishikawa-ken 15.5 (13.8) 23.4 Saga-ken 13.6 (12.4) 19.0Fukui-ken 14.6 (13.4) 21.2 Nagasaki-ken 12.4 (10.8) 19.2Yamanashi-ken 14.7 (11.9) 21.8 Kumamoto-ken 13.7 (12.3) 21.5Nagano-ken 15.7 (13.8) 21.7 Oita-ken 13.4 (11.3) 20.7Gifu-ken 13.7 (12.5) 20.9 Miyazaki-ken 13.1 (11.5) 19.7Shizuoka-ken 13.9 (11.8) 19.4 Kagoshima-ken 13.2 (11.5) 20.6Aichi-ken 14.9 (12.7) 21.3 Okinawa-ken 14.0 (12.5) 21.0
Total Total
Note1)In brackets:2007 results Note2)“Yong persons” are persons aged 15 to 34.
Fig. III-6: Ratio of persons who did training or self-development (initiated by oneself) by prefecture / 2012
(%)
17.0 and over
15.0 to less than 17.0
13.0 to less than 15.0
Less than 13.0
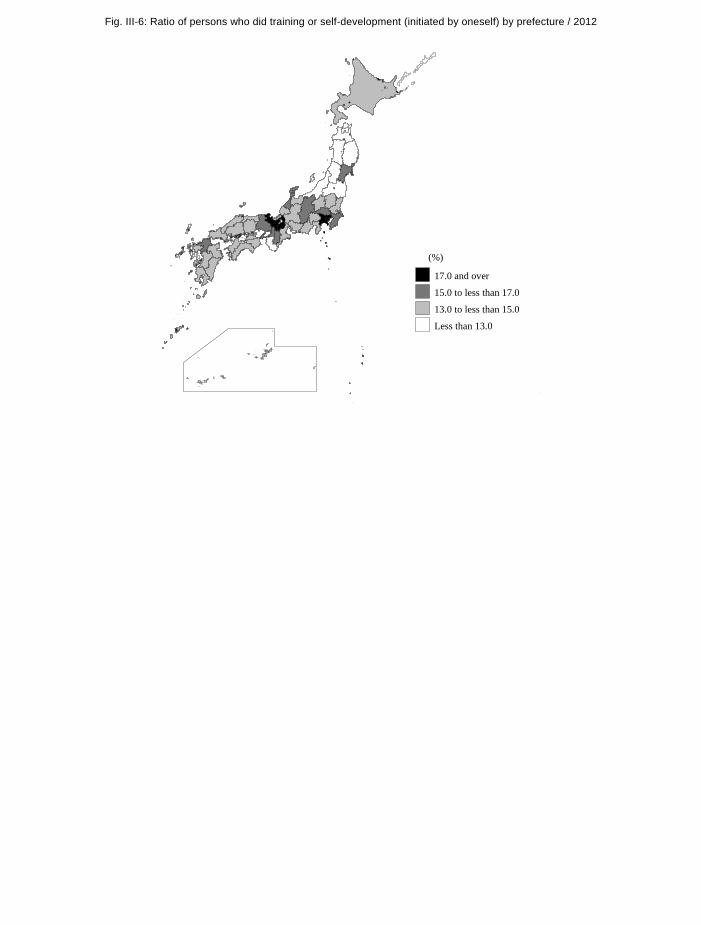
237
3. Status of training or self-development The ratio of young persons who did training or self-development is high particularly
in Tokyo-to, Kyoto-fu and Kanagawa-ken. As for the status of training or self-development among the population aged 15 and over, the ratio
of those who initiated training or self-development by themselves (15.6% in Japan) was highest in
Tokyo-to with 21.8%, followed by Kanagawa-ken (18.7%), Kyoto-fu (17.6%), Shiga-ken (17.2%) and
Chiba-ken (16.2%).
Among young persons (23.2% in Japan), the ratio was highest in Tokyo-to with 30.6%, followed by
Kyoto-fu (27.1%) and Kanagawa-ken (26.1%). (Table III-6, Fig. III-6)
Table III-6: Ratio of persons who did training or self-development (initiated by oneself) by prefecture / 2007, 2012
(%)
Prefectureyoung
persons Prefectureyoung
personsJapan 15.6 (13.8) 23.2 Mie-ken 13.9 (12.2) 21.6Hokkaido 13.5 (11.9) 22.2 Shiga-ken 17.2 (14.8) 23.6Aomori-ken 11.8 (10.5) 20.2 Kyoto-fu 17.6 (16.5) 27.1Iwate-ken 12.3 (11.3) 18.4 Osaka-fu 15.6 (14.1) 23.9Miyagi-ken 15.3 (13.9) 23.7 Hyogo-ken 15.6 (14.3) 22.4Akita-ken 11.7 (9.9) 19.7 Nara-ken 16.1 (15.5) 23.2Yamagata-ken 12.1 (11.2) 18.1 Wakayama-ken 12.9 (11.5) 20.6Fukushima-ken 11.8 (10.6) 18.6 Tottori-ken 14.7 (12.9) 22.1Ibaraki-ken 13.4 (11.8) 20.6 Shimane-ken 14.6 (13.0) 21.8Tochigi-ken 13.7 (11.2) 19.9 Okayama-ken 14.9 (12.8) 23.0Gumma-ken 14.3 (11.8) 21.0 Hiroshima-ken 14.3 (13.7) 20.6Saitama-ken 15.8 (14.3) 22.9 Yamaguchi-ken 13.5 (11.4) 20.4Chiba-ken 16.2 (14.9) 24.3 Tokushima-ken 13.0 (12.2) 19.5Tokyo-to 21.8 (18.8) 30.6 Kagawa-ken 13.7 (14.5) 19.8Kanagawa-ken 18.7 (16.7) 26.1 Ehime-ken 13.6 (11.4) 21.9Niigata-ken 12.8 (11.9) 19.2 Kochi-ken 13.4 (11.0) 21.3Toyama-ken 13.7 (12.7) 19.6 Fukuoka-ken 15.4 (13.8) 22.0Ishikawa-ken 15.5 (13.8) 23.4 Saga-ken 13.6 (12.4) 19.0Fukui-ken 14.6 (13.4) 21.2 Nagasaki-ken 12.4 (10.8) 19.2Yamanashi-ken 14.7 (11.9) 21.8 Kumamoto-ken 13.7 (12.3) 21.5Nagano-ken 15.7 (13.8) 21.7 Oita-ken 13.4 (11.3) 20.7Gifu-ken 13.7 (12.5) 20.9 Miyazaki-ken 13.1 (11.5) 19.7Shizuoka-ken 13.9 (11.8) 19.4 Kagoshima-ken 13.2 (11.5) 20.6Aichi-ken 14.9 (12.7) 21.3 Okinawa-ken 14.0 (12.5) 21.0
Total Total
Note1)In brackets:2007 results Note2)“Yong persons” are persons aged 15 to 34.
Fig. III-6: Ratio of persons who did training or self-development (initiated by oneself) by prefecture / 2012
(%)
17.0 and over
15.0 to less than 17.0
13.0 to less than 15.0
Less than 13.0
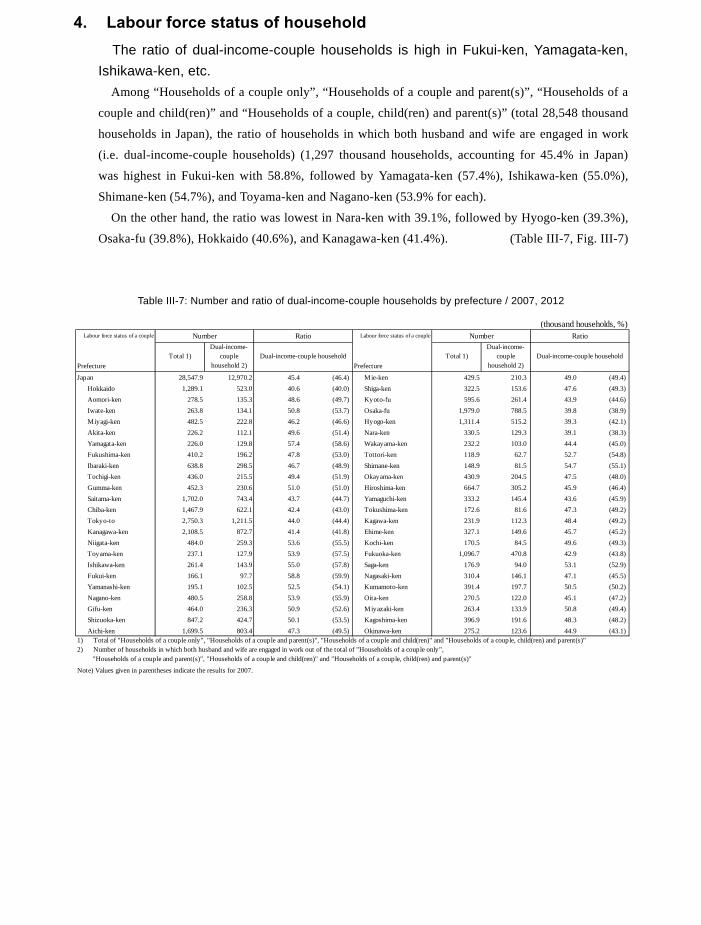
238
4. Labour force status of household The ratio of dual-income-couple households is high in Fukui-ken, Yamagata-ken,
Ishikawa-ken, etc. Among “Households of a couple only”, “Households of a couple and parent(s)”, “Households of a
couple and child(ren)” and “Households of a couple, child(ren) and parent(s)” (total 28,548 thousand
households in Japan), the ratio of households in which both husband and wife are engaged in work
(i.e. dual-income-couple households) (1,297 thousand households, accounting for 45.4% in Japan)
was highest in Fukui-ken with 58.8%, followed by Yamagata-ken (57.4%), Ishikawa-ken (55.0%),
Shimane-ken (54.7%), and Toyama-ken and Nagano-ken (53.9% for each).
On the other hand, the ratio was lowest in Nara-ken with 39.1%, followed by Hyogo-ken (39.3%),
Osaka-fu (39.8%), Hokkaido (40.6%), and Kanagawa-ken (41.4%). (Table III-7, Fig. III-7)
Table III-7: Number and ratio of dual-income-couple households by prefecture / 2007, 2012
(thousand households, %)Labour force status of a couple Labour force status of a couple
Prefecture Prefecture
Japan 28,547.9 12,970.2 45.4 (46.4) Mie-ken 429.5 210.3 49.0 (49.4) Hokkaido 1,289.1 523.0 40.6 (40.0) Shiga-ken 322.5 153.6 47.6 (49.3) Aomori-ken 278.5 135.3 48.6 (49.7) Kyoto-fu 595.6 261.4 43.9 (44.6) Iwate-ken 263.8 134.1 50.8 (53.7) Osaka-fu 1,979.0 788.5 39.8 (38.9) Miyagi-ken 482.5 222.8 46.2 (46.6) Hyogo-ken 1,311.4 515.2 39.3 (42.1) Akita-ken 226.2 112.1 49.6 (51.4) Nara-ken 330.5 129.3 39.1 (38.3) Yamagata-ken 226.0 129.8 57.4 (58.6) Wakayama-ken 232.2 103.0 44.4 (45.0) Fukushima-ken 410.2 196.2 47.8 (53.0) Tottori-ken 118.9 62.7 52.7 (54.8) Ibaraki-ken 638.8 298.5 46.7 (48.9) Shimane-ken 148.9 81.5 54.7 (55.1) Tochigi-ken 436.0 215.5 49.4 (51.9) Okayama-ken 430.9 204.5 47.5 (48.0) Gumma-ken 452.3 230.6 51.0 (51.0) Hiroshima-ken 664.7 305.2 45.9 (46.4) Saitama-ken 1,702.0 743.4 43.7 (44.7) Yamaguchi-ken 333.2 145.4 43.6 (45.9) Chiba-ken 1,467.9 622.1 42.4 (43.0) Tokushima-ken 172.6 81.6 47.3 (49.2) Tokyo-to 2,750.3 1,211.5 44.0 (44.4) Kagawa-ken 231.9 112.3 48.4 (49.2) Kanagawa-ken 2,108.5 872.7 41.4 (41.8) Ehime-ken 327.1 149.6 45.7 (45.2) Niigata-ken 484.0 259.3 53.6 (55.5) Kochi-ken 170.5 84.5 49.6 (49.3) Toyama-ken 237.1 127.9 53.9 (57.5) Fukuoka-ken 1,096.7 470.8 42.9 (43.8) Ishikawa-ken 261.4 143.9 55.0 (57.8) Saga-ken 176.9 94.0 53.1 (52.9) Fukui-ken 166.1 97.7 58.8 (59.9) Nagasaki-ken 310.4 146.1 47.1 (45.5) Yamanashi-ken 195.1 102.5 52.5 (54.1) Kumamoto-ken 391.4 197.7 50.5 (50.2) Nagano-ken 480.5 258.8 53.9 (55.9) Oita-ken 270.5 122.0 45.1 (47.2) Gifu-ken 464.0 236.3 50.9 (52.6) Miyazaki-ken 263.4 133.9 50.8 (49.4) Shizuoka-ken 847.2 424.7 50.1 (53.5) Kagoshima-ken 396.9 191.6 48.3 (48.2) Aichi-ken 1,699.5 803.4 47.3 (49.5) Okinawa-ken 275.2 123.6 44.9 (43.1)
Note) Values given in parentheses indicate the results for 2007.
Number Ratio Number Ratio
Total 1)Dual-income-
couplehousehold 2)
Dual-income-couple household Total 1)Dual-income-
couplehousehold 2)
Dual-income-couple household
1) Total of "Households of a couple only", "Households of a couple and parent(s)", "Households of a couple and child(ren)" and "Households of a couple, child(ren) and parent(s)"2) Number of households in which both husband and wife are engaged in work out of the total of "Households of a couple only", "Households of a couple and parent(s)", "Households of a couple and child(ren)" and "Households of a couple, child(ren) and parent(s)"
Fig. III-7: Ratio of dual-income-couple households by prefecture / 2012
(%)
57.0 and over
52.0 to less than 57.0
47.0 to less than 52.0
Less than 47.0
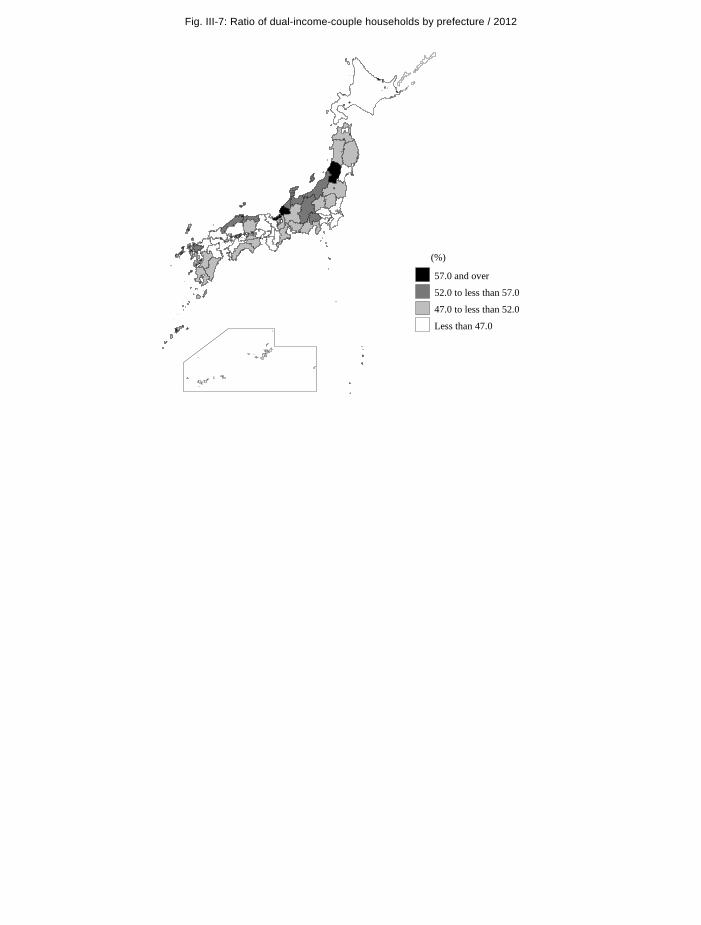
239
4. Labour force status of household The ratio of dual-income-couple households is high in Fukui-ken, Yamagata-ken,
Ishikawa-ken, etc. Among “Households of a couple only”, “Households of a couple and parent(s)”, “Households of a
couple and child(ren)” and “Households of a couple, child(ren) and parent(s)” (total 28,548 thousand
households in Japan), the ratio of households in which both husband and wife are engaged in work
(i.e. dual-income-couple households) (1,297 thousand households, accounting for 45.4% in Japan)
was highest in Fukui-ken with 58.8%, followed by Yamagata-ken (57.4%), Ishikawa-ken (55.0%),
Shimane-ken (54.7%), and Toyama-ken and Nagano-ken (53.9% for each).
On the other hand, the ratio was lowest in Nara-ken with 39.1%, followed by Hyogo-ken (39.3%),
Osaka-fu (39.8%), Hokkaido (40.6%), and Kanagawa-ken (41.4%). (Table III-7, Fig. III-7)
Table III-7: Number and ratio of dual-income-couple households by prefecture / 2007, 2012
(thousand households, %)Labour force status of a couple Labour force status of a couple
Prefecture Prefecture
Japan 28,547.9 12,970.2 45.4 (46.4) Mie-ken 429.5 210.3 49.0 (49.4) Hokkaido 1,289.1 523.0 40.6 (40.0) Shiga-ken 322.5 153.6 47.6 (49.3) Aomori-ken 278.5 135.3 48.6 (49.7) Kyoto-fu 595.6 261.4 43.9 (44.6) Iwate-ken 263.8 134.1 50.8 (53.7) Osaka-fu 1,979.0 788.5 39.8 (38.9) Miyagi-ken 482.5 222.8 46.2 (46.6) Hyogo-ken 1,311.4 515.2 39.3 (42.1) Akita-ken 226.2 112.1 49.6 (51.4) Nara-ken 330.5 129.3 39.1 (38.3) Yamagata-ken 226.0 129.8 57.4 (58.6) Wakayama-ken 232.2 103.0 44.4 (45.0) Fukushima-ken 410.2 196.2 47.8 (53.0) Tottori-ken 118.9 62.7 52.7 (54.8) Ibaraki-ken 638.8 298.5 46.7 (48.9) Shimane-ken 148.9 81.5 54.7 (55.1) Tochigi-ken 436.0 215.5 49.4 (51.9) Okayama-ken 430.9 204.5 47.5 (48.0) Gumma-ken 452.3 230.6 51.0 (51.0) Hiroshima-ken 664.7 305.2 45.9 (46.4) Saitama-ken 1,702.0 743.4 43.7 (44.7) Yamaguchi-ken 333.2 145.4 43.6 (45.9) Chiba-ken 1,467.9 622.1 42.4 (43.0) Tokushima-ken 172.6 81.6 47.3 (49.2) Tokyo-to 2,750.3 1,211.5 44.0 (44.4) Kagawa-ken 231.9 112.3 48.4 (49.2) Kanagawa-ken 2,108.5 872.7 41.4 (41.8) Ehime-ken 327.1 149.6 45.7 (45.2) Niigata-ken 484.0 259.3 53.6 (55.5) Kochi-ken 170.5 84.5 49.6 (49.3) Toyama-ken 237.1 127.9 53.9 (57.5) Fukuoka-ken 1,096.7 470.8 42.9 (43.8) Ishikawa-ken 261.4 143.9 55.0 (57.8) Saga-ken 176.9 94.0 53.1 (52.9) Fukui-ken 166.1 97.7 58.8 (59.9) Nagasaki-ken 310.4 146.1 47.1 (45.5) Yamanashi-ken 195.1 102.5 52.5 (54.1) Kumamoto-ken 391.4 197.7 50.5 (50.2) Nagano-ken 480.5 258.8 53.9 (55.9) Oita-ken 270.5 122.0 45.1 (47.2) Gifu-ken 464.0 236.3 50.9 (52.6) Miyazaki-ken 263.4 133.9 50.8 (49.4) Shizuoka-ken 847.2 424.7 50.1 (53.5) Kagoshima-ken 396.9 191.6 48.3 (48.2) Aichi-ken 1,699.5 803.4 47.3 (49.5) Okinawa-ken 275.2 123.6 44.9 (43.1)
Note) Values given in parentheses indicate the results for 2007.
Number Ratio Number Ratio
Total 1)Dual-income-
couplehousehold 2)
Dual-income-couple household Total 1)Dual-income-
couplehousehold 2)
Dual-income-couple household
1) Total of "Households of a couple only", "Households of a couple and parent(s)", "Households of a couple and child(ren)" and "Households of a couple, child(ren) and parent(s)"2) Number of households in which both husband and wife are engaged in work out of the total of "Households of a couple only", "Households of a couple and parent(s)", "Households of a couple and child(ren)" and "Households of a couple, child(ren) and parent(s)"
Fig. III-7: Ratio of dual-income-couple households by prefecture / 2012
(%)
57.0 and over
52.0 to less than 57.0
47.0 to less than 52.0
Less than 47.0