personalized cancer treatment and patient stratification ...€¦ · personalized cancer treatment...
TRANSCRIPT

Personalized Cancer Treatment and Patient
Stratification Using NGS and Other OMICs Data
Broadcast Date: Thursday, January 31, 2013
Time: 11am ET, 8am PT
Sponsored by
Personalized Cancer Treatment and Patient
Stratification Using NGS and Other OMICs Data
Personalized Cancer Treatment and Patient
Stratification Using NGS and Other OMICs Data
Your Moderator
John Sterling Editor-in-Chief
Genetic Engineering & Biotechnology News

Personalized Cancer Treatment and Patient
Stratification Using NGS and Other OMICs Data
Rolf A. Stahel, M.D. Professor, Laboratory of Molecular Oncology
Clinic for Thoracic Surgery and Policlinic for Oncology
University Hospital of Zurich
ESMO President-Elect

Rolf Stahel
University Hospital
Zürich
Switzerland
From standardized
to personalized treatment in
oncology:
The example of advanced non-
small cell lung cancer
Zürich, December 29, 2012

Personlized therapy of lung cancer
Taking into account not only patient characteristics, but
also molecular tumor characteristics and thus:
Moving away from empiricism and serendipity to a
biology-based therapy
Matching the right drug with the right cancer type
Defining on each patient’s tumor biomarkers of
response to targeted agents

Histological classification is necessary for
today‘s decision making
A diagnosis of “non-small cell lung cancer”
is no longer acceptable as sufficient basis for
treatment decisions:
– Benefit of bevacizumab added to first line
chemotherapy in non-squamous cell carcinoma Sandler, JCO 2006; Reck JCO 2009
– Differential effect of pemetrexed in non-squamous
vs squamous cell carcinoma Scagliotti, JCO 2008
– Histology will help guide decision about which
molecular analysis is performed

Molecular classification: Present necessities
and future directions
Adenocarcinoma of the lung is not a uniform disease and needs to be classified by additional molecular analysis
– Present needs include EGFR mutation status and determination of EML4-ALK fusion gene
– Emerging opportunities of targeting other oncogenic drivers and technological advances in molecular testing will lead to a shift from sequential testing of selected molecular alterations to multiplex testing and next generation sequencing
Potential driver mutations are also being identified in squamous cell lung cancer
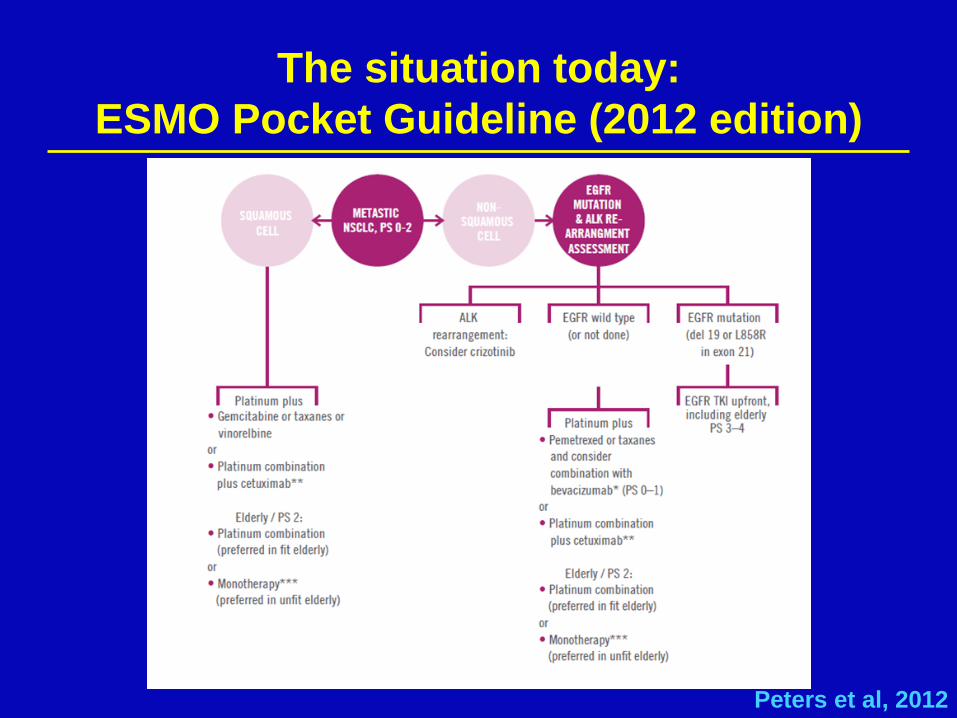
The situation today:
ESMO Pocket Guideline (2012 edition)
Peters et al, 2012

IPASS: Objective RR in EGFR mutation
positive and negative patients with gefitinib
as compared to chemotherapy
Gefitinib
Carboplatin / paclitaxel
EGFR M+ odds ratio (95% CI) = 2.75
(1.65, 4.60), p=0.0001
EGFR M- odds ratio (95% CI) = 0.04
(0.01, 0.27), p=0.0013
Overall
response
rate (%)
(n=132) (n=129) (n=91) (n=85)
Odds ratio >1 implies greater chance of response on gefitinib
71.2%
47.3%
1.1%
23.5%
Mok, ESMO 2008; NEJM 2009

First line EFGR TKI or chemotherapy for
non-squamous cell lung cancer
harboring activating EGFR mutation
Author Study N RR (TKI vs
Chemo) PFS (HR, 95%CI)
Mok IPASS 261 71% vs 47% 0.48 (0.36, 0.64)
Lee First-SIGNAL 42 85% vs 38% 0.61 (0.31, 1.22)
Mitsudomi WJTOG 3405 198 62% vs 32% 0.49 (0.34, 0.71)
Kobayashi NEJGSG002 177 75% vs 29% 0.36 (0.25, 0.51)
Zhou Optimal 165 83% vs 36% 0.16 (0.10, 0.26)
Rosell EUROTAC 174 58% vs 15% 0.42 (0.27, 0.64)
Yang LUX-Lung 3 345 56% vs 22% 0.58 (0-43. 0.78)
Mok, NEJM 2009; Lee, WCLC 2009; Mitsudomi,Lancet Oncology 2010;
Kobayahsi, ASCO 2009; Yang, ESMO 2010; Rosell ASCO 2011, Yang ASCO 2012
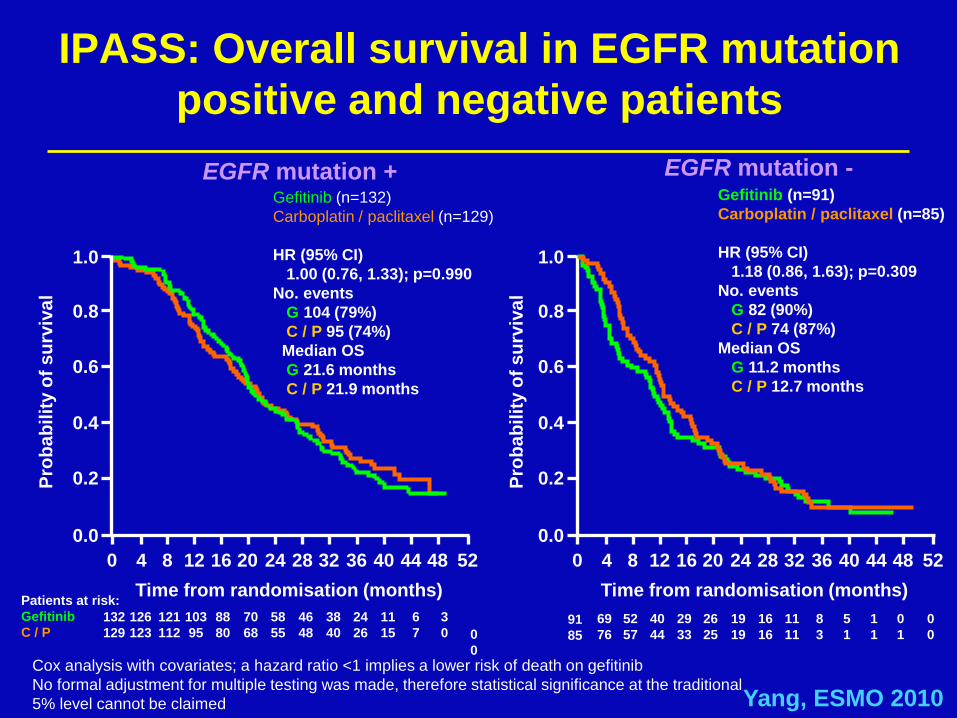
IPASS: Overall survival in EGFR mutation
positive and negative patients
EGFR mutation +
0
0
Patients at risk:
Gefitinib
C / P 132
129
126
123
103
95
70
68
24
26
11
15
121
112
88
80
58
55
46
48
38
40
6
7
3
0
Time from randomisation (months)
Pro
ba
bil
ity o
f s
urv
iva
l
EGFR mutation -
52 0 4 8 12 16 20 44 24 28 32 36 40 48
1.0
0.8
0.6
0.4
0.2
0.0
0
0
5
1 91
85
69
76
52
57
40
44
29
33
26
25
1
1
19
19
16
16
11
11
8
3
0
1
Time from randomisation (months)
52 0 4 8 12 16 20 44 24 28 32 36 40 48
1.0
0.8
0.6
0.4
0.2
0.0
Pro
ba
bil
ity o
f s
urv
iva
l
Gefitinib (n=132)
Carboplatin / paclitaxel (n=129)
HR (95% CI)
1.00 (0.76, 1.33); p=0.990
No. events
G 104 (79%)
C / P 95 (74%)
Median OS
G 21.6 months
C / P 21.9 months
Gefitinib (n=91)
Carboplatin / paclitaxel (n=85)
HR (95% CI)
1.18 (0.86, 1.63); p=0.309
No. events
G 82 (90%)
C / P 74 (87%)
Median OS
G 11.2 months
C / P 12.7 months
Cox analysis with covariates; a hazard ratio <1 implies a lower risk of death on gefitinib
No formal adjustment for multiple testing was made, therefore statistical significance at the traditional
5% level cannot be claimed Yang, ESMO 2010

Comparison of survival for patients with
lung adenocarcinoma in Japan before
and after gefitinib approval
All patients FGFR mut+ patients
Takano, JCO 2008
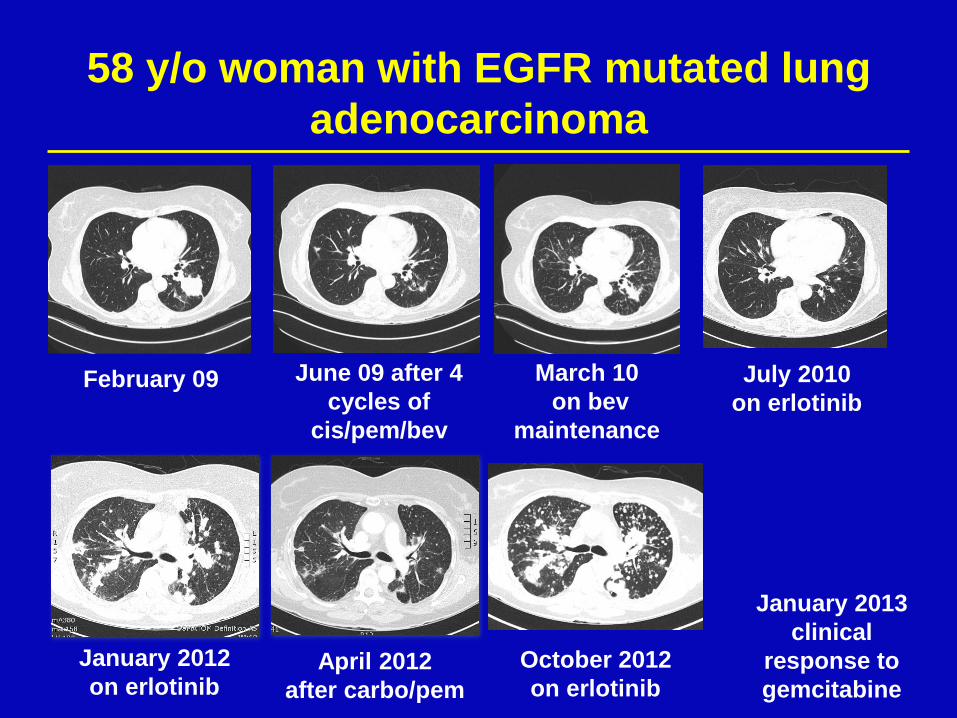
58 y/o woman with EGFR mutated lung
adenocarcinoma
February 09 June 09 after 4
cycles of
cis/pem/bev
March 10
on bev
maintenance
July 2010
on erlotinib
January 2012
on erlotinib April 2012
after carbo/pem
October 2012
on erlotinib
January 2013
clinical
response to
gemcitabine

Disease flare after discontinuation of EGFR
TKI in patients with acquired resistance
61 pts participating in trials on patients with acquired
EGFR resistance mandating TKI discontinuation:
– 23% disease flare
– Association
with shorter time to
progression
– Association with
pleural or CNS
diseaase
„Drug holiday not
recommanded
Chaft, CCR 2011

EGFR TKI resistance (simplified)
Kosaka, J Biomed Biotechn 2011

Characteristics of tumours with acquired
resistance to EGFR TKI
Sequist, Sci Transl Med 2011
Unknown
mechanism
(30%)
T790M
(49%)
MET amp
(5%)
PIK3CA
(5%)
SCLC
transformation
(14%)
With
EGFR
amp
*
*1 pt with PIK3CA and SCLC transformation
Pathological and molecular analysis of tumor
biopsies from 37 pts with aquired resistance to EGFR
inhibitors:

FISH
PCR/Sequencing IHC
ALK positive lung cancer
Nature, 2007
60
40
20
0
–20
–40
–60
–80
–100
Progressive disease
Stable disease
Confirmed partial response
Confirmed complete response
Maxim
um
ch
an
ge i
n t
um
or
siz
e (
%)
–30%
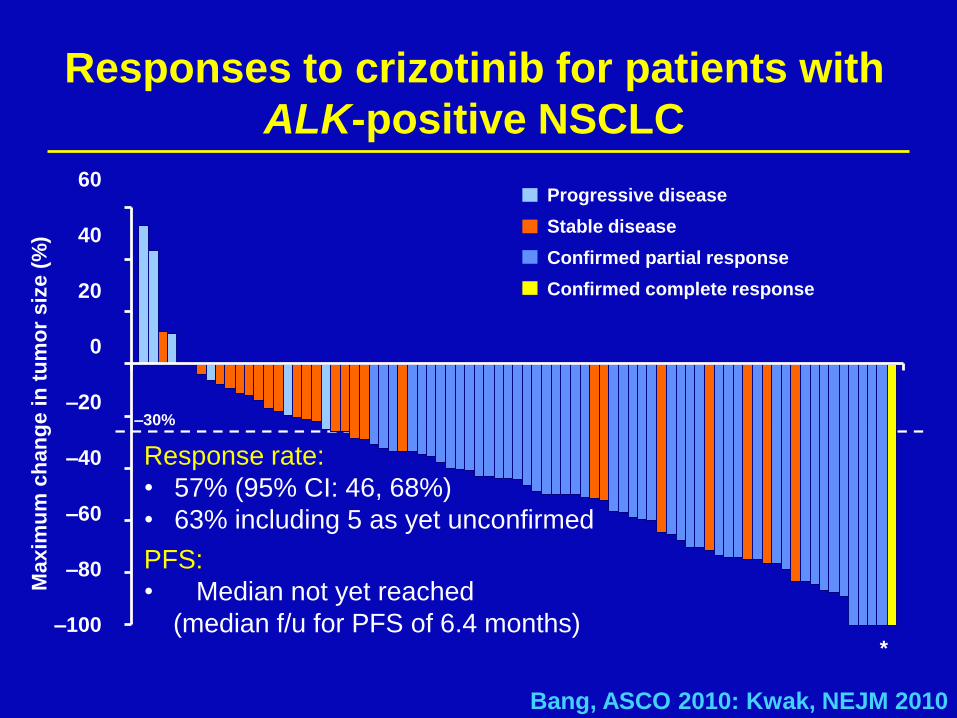
Responses to crizotinib for patients with
ALK-positive NSCLC
*
Bang, ASCO 2010: Kwak, NEJM 2010
Response rate:
• 57% (95% CI: 46, 68%)
• 63% including 5 as yet unconfirmed
PFS:
• Median not yet reached
(median f/u for PFS of 6.4 months)
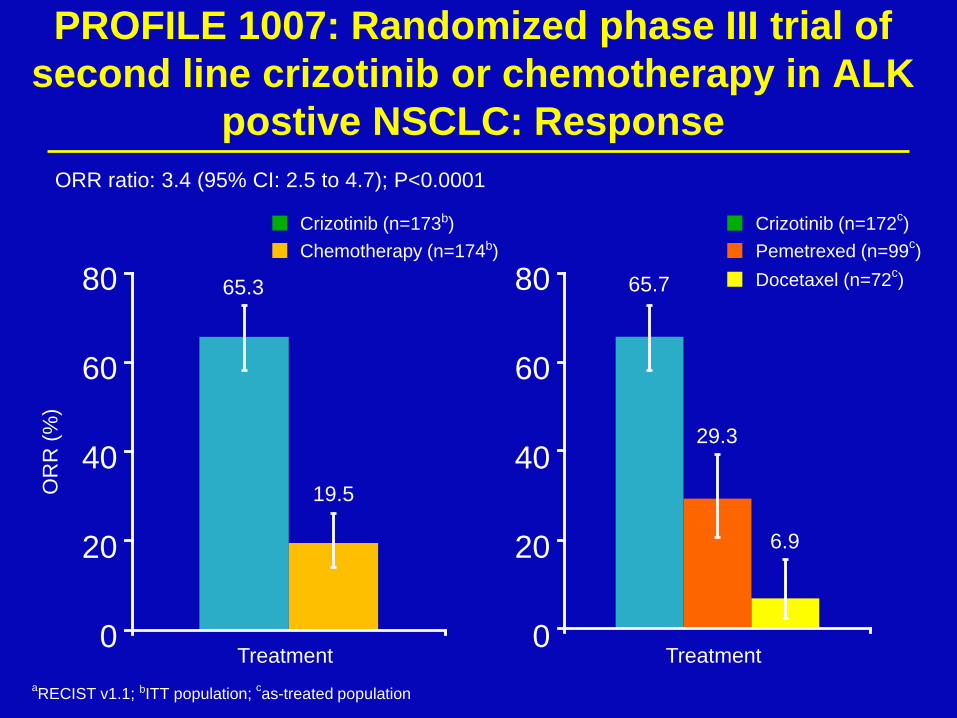
aRECIST v1.1; bITT population;
cas-treated population
PROFILE 1007: Randomized phase III trial of
second line crizotinib or chemotherapy in ALK
postive NSCLC: Response
65.3
19.5 OR
R (
%)
ORR ratio: 3.4 (95% CI: 2.5 to 4.7); P<0.0001
Crizotinib (n=173b)
Chemotherapy (n=174b)
80
60
40
20
0 Treatment
65.7
29.3
6.9
Crizotinib (n=172c)
Pemetrexed (n=99c)
Docetaxel (n=72c)
Treatment
80
60
40
20
0

Lungscape ALK study: Flow chart
20 | Adenocarcinoma patients with available ALK IHC data
N=1099
ALK IHC +
N=69 (6.3%)
ALK IHC -
N=1030
ALK IHC 1:2 Matched Cohort N=207
Matching factors in order of importance:
Stage, Gender/Smoking Status,
Center/Year of surgery/ Age
ALK IHC – N=138
22 FISH + 38 FISH -
9 FISH ND
1 FISH +
137 FISH -
ALK IHC + N=69
=
23 FISH +
(2.1%)
46 FISH -
ETOP | Lungscape | ESMO Vienna, September 29, 2012
ALK FISH 1:2 Matched
sub-cohort
N=69

Association of ALK IHC and FISH, N=198 21 |
ETOP | Lungscape | ESMO Vienna, September 29, 2012
36.7% of IHC+ are FISH+

Crizotinib
(n=172a)
Pemetrexed
(n=99a)
Docetaxel
(n=72a)
Events, n (%) 100 (58) 72 (73) 54 (75)
Median, mo 7.7 4.2 2.6
HRb (95% CI) 0.59 (0.43 to 0.80) 0.30 (0.21 to 0.43)
P 0.0004 <0.0001
PROFILE 1007: Progression-free survival
of crizotinib vs pemetrexed or docetaxel P
robabili
ty o
f surv
ival w
ithout
pro
gre
ssio
n (
%)
100
80
60
40
20
0
0 5 10 15 20 25
Time (months)
172 93 38 11 2 0
99 36 12 3 1 0
72 13 3 1 0
No. at risk
Crizotinib
Pemetrexed
Docetaxel
aAs-treated population: excludes 1 patient in crizotinib arm who did not receive study treatment and 3 patients in chemotherapy
arm who did not receive study treatment; bvs crizotinib Shaw, ESMO 2012
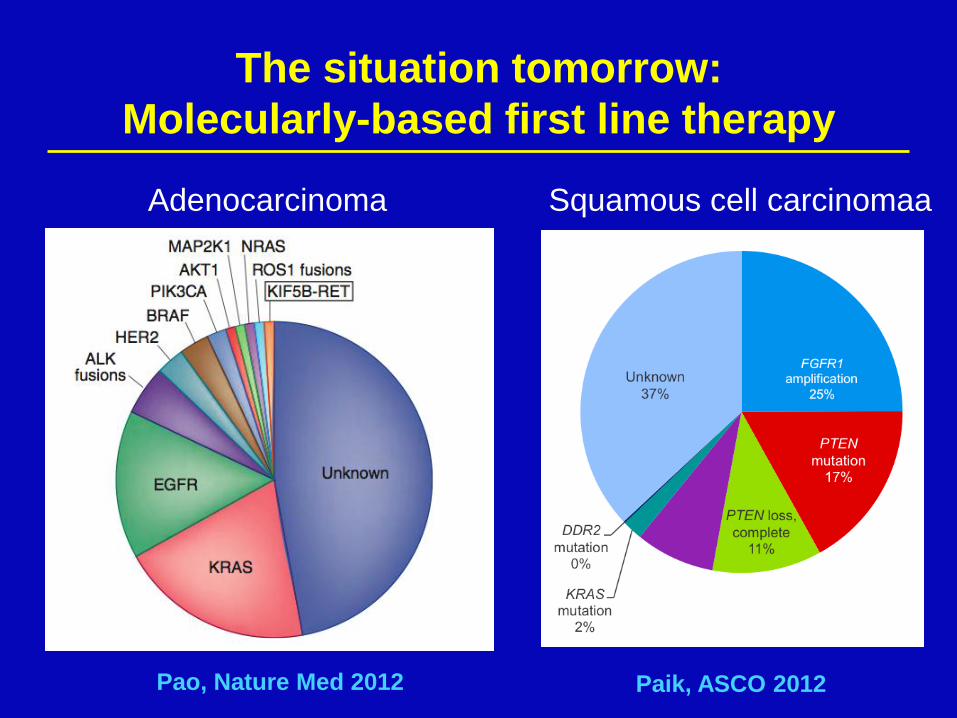
The situation tomorrow:
Molecularly-based first line therapy
Adenocarcinoma Squamous cell carcinomaa
Pao, Nature Med 2012 Paik, ASCO 2012

Thunnissen,
Lung Cancer 2012

Other oncogenic driver mutations: HER2
Amplification and exon 20 mutation.
Response to
paclitaxel and
trastuzumab Cappzuzzo, NEJM 2006
Response to afatinib in 3 patients with HER2 mutation De Grève, Lung Cancer 2012
46 pts with HER2 mutations identified, predominantly
women and never smokers. 20 pts with advanced
disease received targeted therapy: 9 PR and 7 SD Mazière, ESMO 2012
Baseline 4 months

BRAF mutations

ROS1 rearragments are another target of
crizotinib
18/1073 (1.7%) ROS1 fusion positive tumors identified
by FISH. In vitro activity and clinical response to
crizotinib Bergethon, JCO 2012
Expanded experience Sequist, ASCO 2012
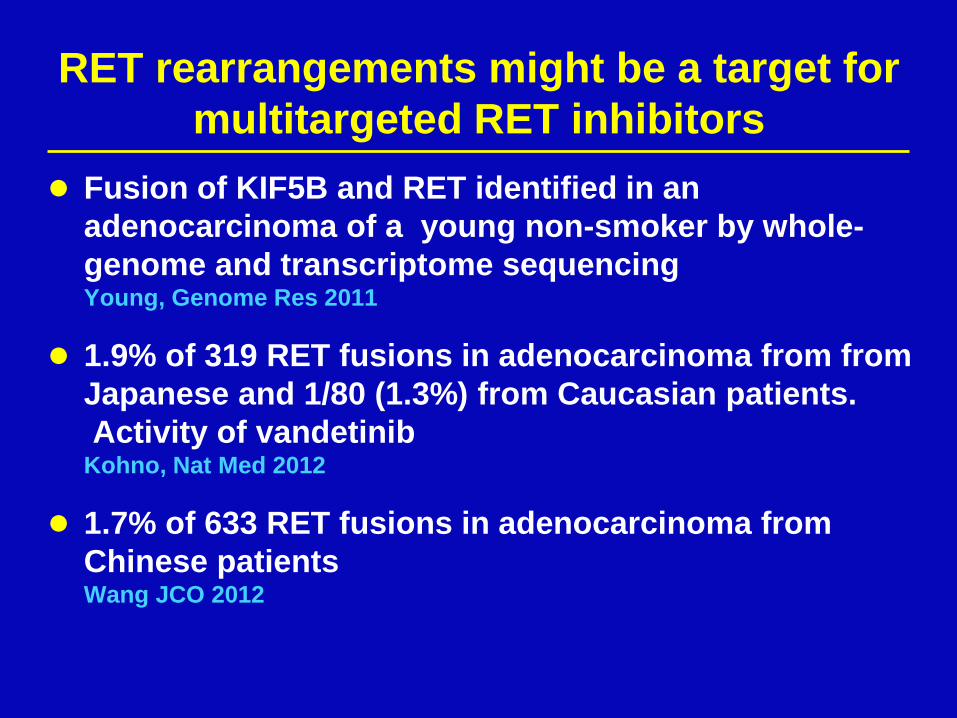
RET rearrangements might be a target for
multitargeted RET inhibitors
Fusion of KIF5B and RET identified in an
adenocarcinoma of a young non-smoker by whole-
genome and transcriptome sequencing Young, Genome Res 2011
1.9% of 319 RET fusions in adenocarcinoma from from
Japanese and 1/80 (1.3%) from Caucasian patients.
Activity of vandetinib Kohno, Nat Med 2012
1.7% of 633 RET fusions in adenocarcinoma from
Chinese patients Wang JCO 2012
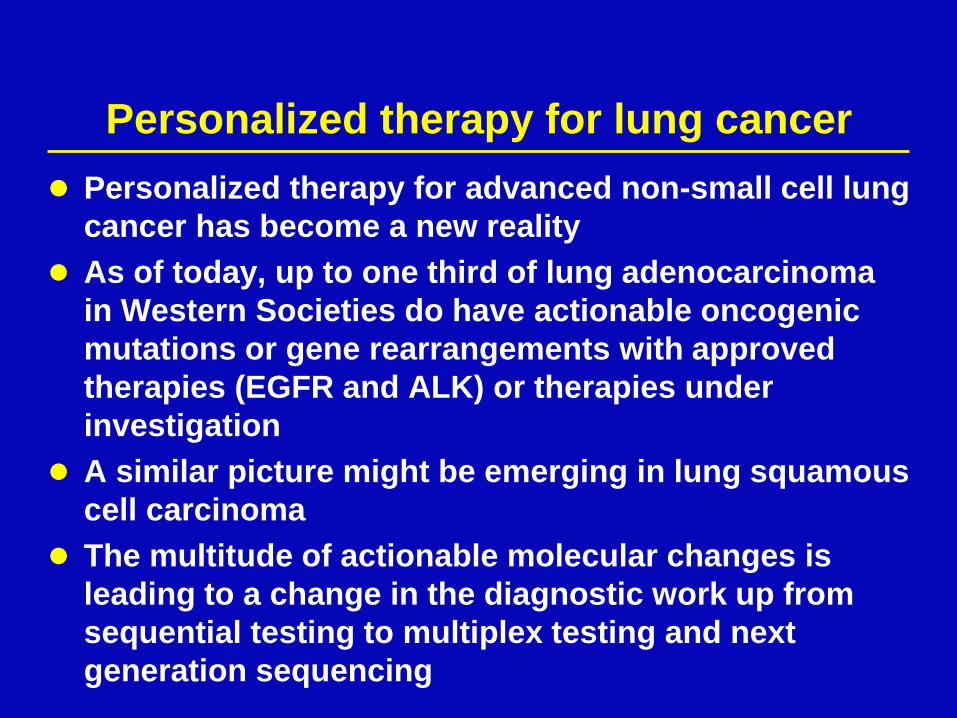
Personalized therapy for lung cancer
Personalized therapy for advanced non-small cell lung
cancer has become a new reality
As of today, up to one third of lung adenocarcinoma
in Western Societies do have actionable oncogenic
mutations or gene rearrangements with approved
therapies (EGFR and ALK) or therapies under
investigation
A similar picture might be emerging in lung squamous
cell carcinoma
The multitude of actionable molecular changes is
leading to a change in the diagnostic work up from
sequential testing to multiplex testing and next
generation sequencing
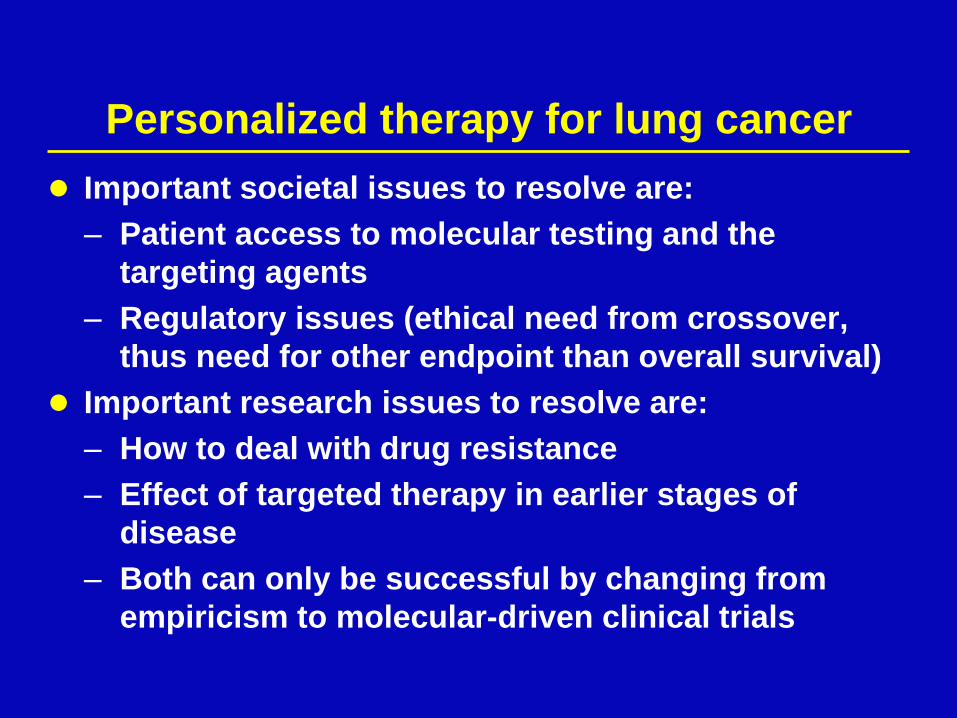
Personalized therapy for lung cancer
Important societal issues to resolve are:
– Patient access to molecular testing and the
targeting agents
– Regulatory issues (ethical need from crossover,
thus need for other endpoint than overall survival)
Important research issues to resolve are:
– How to deal with drug resistance
– Effect of targeted therapy in earlier stages of
disease
– Both can only be successful by changing from
empiricism to molecular-driven clinical trials
Personalized Cancer Treatment and Patient
Stratification Using NGS and Other OMICs Data
Martin Edelman, M.D. Professor of Medicine
University of Maryland School of Medicine
Director, Solid Tumor Oncology
Greenebaum Cancer Center

Personalization of Therapy in Advanced NSCLC: Optimization of Current and Future Drugs
Martin J. Edelman, MD

Personalization of Therapy in NSCLC
• Clearly applicable for non-squamous carcinoma – Histology and use of bevacizumab, pemetrexed – DNA sequencing for EGFR TKI, ?Ret – FISH for EML4/ALK, ROS1
• The above represents a minority of NSCLC and does not address the fact that virtually all advanced NSCLC will relapse and require additional therapy
– Median TTP for erlotinib, crizotinib is about 10 months
• Most current approaches do not assess for tumor heterogeneity, require tissue.

Personalization for the diseases without drugs, for the drugs that exist and drugs in
development
• Squamous carcinoma
• Cytotoxic chemotherapy
• Real time assessment for presence of markers of susceptibility/resistance: nuclear imaging
• Personalization of the immunotherapy
• Toxicity prevention/anticipation

SQUAMOUS CELL CANCER

New molecular targets in squamous cell lung cancer
• Sox-2 – Genomic amplification in 10-20%
• FGFR – Genomic amplification in 10-20%
– ?FGFR inhibition
– Phase I studies with BGJ398, a pan-FGFR inhibitor (Novartis)
• DDR2 – Recurrent mutations of this poorly studied
tyrosine kinase in 3-4%
– ?dasatinib

Comments: Personalization of therapy for squamous carcinoma
• Several interesting and potentially targetable pathways have been identified.
• Trials are in progress
• None are truly “actionable” at this time, i.e. you cannot write a prescription for an approved agent.

CYTOTOXIC THERAPY

Cytotoxic Therapies: Effective agents that can be made better
• Current role in curative treatment
• More sophisticated use of current agents
– Histology (and its limitations)
– Molecular variables (and their limitations)
• New and improved cytotoxics
– New molecules with the same basic target
– New molecules targeting different areas of the old target

Excision Repair Cross-complementation Group 1 (ERCC1)
• Cisplatin cytotoxicity requires creation of DNA adducts followed by covalent cross-linking between DNA strands
• Nucleotide excision important in DNA repair and cell survival
• ERCC1 is one such enzyme
Gazdar AF. N Engl J Med. 2007;356:771-773. Bepler et al. J Clin Oncol. 2006;24:4737-4745

Ribonucleotide Reductase M1 (RRM1)
• Regulatory subunit of RR
• Only known enzyme to convert ribonuclotides to deoxyribonuclotides, needed for DNA repair
• Likely intracellular target of gemcitabine
• High levels improved outcome in early NSCLC
• High levels are the dominant component of gemcitabine resistance
Bepler G,. Lung Cancer. 2006;54(Suppl 2):S3-S7; Gazdar AF. N Engl J Med. 2007;356:771-
773.

NSCLC
Stage IIIB /
IV
No prior trt
PS 0 - 1
(n = 60)
Docetaxel +
carboplatin
Real-time RTPCR and
starting treatment (n = 53)
Low RRM1 High RRM1
Gemcitabine
+ carboplatin
Docetaxel +
gemcitabine
Withdrawn if tumor
tissue insufficient
Feasibility & Efficacy of Molecular Analysis-Directed Therapy
Simon G, et al. J Clin Oncol. 2007;25:2741-2746.
Low ERCC1 Low ERCC1 High ERCC1 High ERCC1
Docetaxel +
vinorelbine
Core needle biopsy,
immediately frozen,
laser capture
microdissection
The MADe IT Trial

Feasibility & Efficacy of Molecular Analysis-Directed Therapy
Bepler G. Lung Cancer. 2006;54(Suppl 2):S3-S7; Simon G, et al. J Clin Oncol. 2007;25:2741-2746.
Historical comparators
General feasibility of MADeIT design limited, due to infrastructure required
MADeIT (Directed)
MCC-12621 (Carbo + gem)
E1594 (All)
Median OS (mo) 13.4 6.7 8.0
6-mo survival (%) 87 58 58
12-mo survival (%) 62 38 33
CR+PR (%) 42 24 19
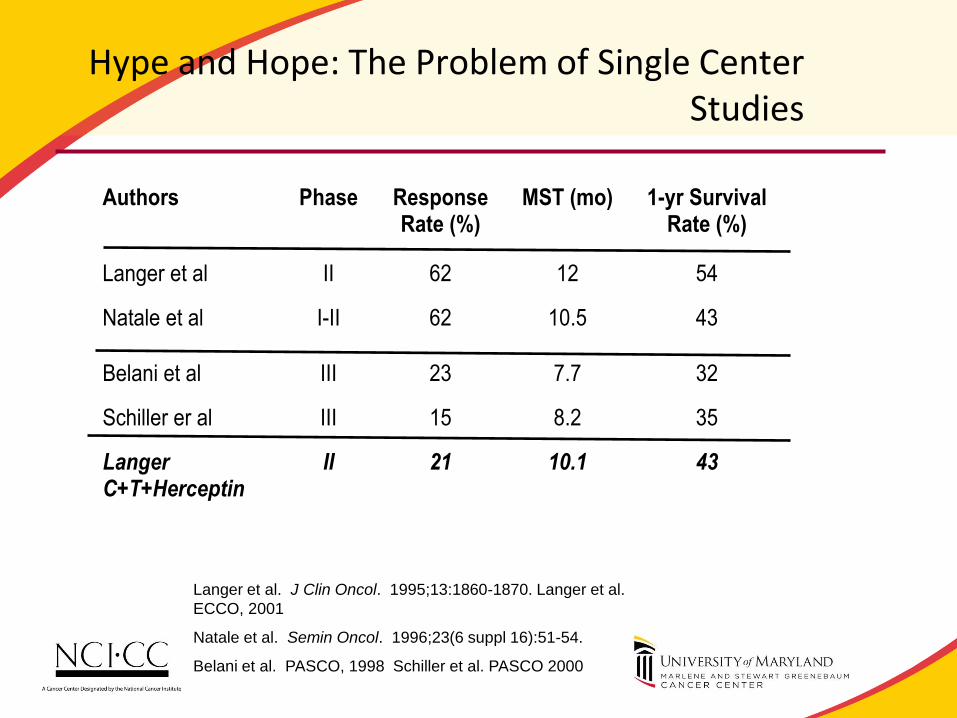
Hype and Hope: The Problem of Single Center Studies
Authors Phase Response
Rate (%) MST (mo) 1-yr Survival
Rate (%)
Langer et al II 62 12 54
Natale et al I-II 62 10.5 43
Belani et al III 23 7.7 32
Schiller er al III 15 8.2 35
Langer C+T+Herceptin
II 21 10.1 43
Langer et al. J Clin Oncol. 1995;13:1860-1870. Langer et al.
ECCO, 2001
Natale et al. Semin Oncol. 1996;23(6 suppl 16):51-54.
Belani et al. PASCO, 1998 Schiller et al. PASCO 2000

Referral Populations
• Referral populations inherently do better.
• Possible reasons:
– Socioeconomics
– Nutrition
– Inherent biology
Lamont, JNCI, 2001

Stage IIIB / IV NSCLC, PS 0-1 Tumor block available
N = 267
Docetaxel +
carboplatin
Treatment Selection by AQUA
Low RRM1 High RRM1
Gemcitabine
+ carboplatin
Docetaxel +
gemcitabine
Clinical Trial of Molecular Analysis-Directed Therapy: MADe IT Phase III
Available at: http://www.clinicaltrials.gov/ct2/show/NCT00499109. Accessed February 10, 2009.
Low ERCC1 Low ERCC1 High ERCC1 High ERCC1
Docetaxel +
vinorelbine
Randomization 2:1
Standard of care
Gemcitabine + carboplatin
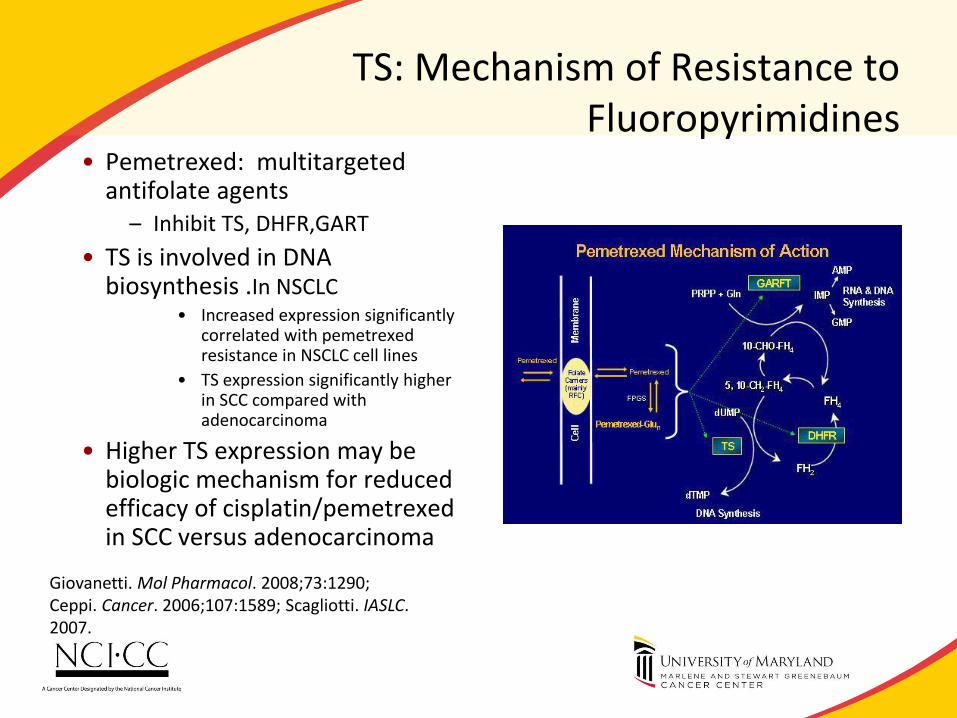
TS: Mechanism of Resistance to Fluoropyrimidines
• Pemetrexed: multitargeted antifolate agents
– Inhibit TS, DHFR,GART
• TS is involved in DNA biosynthesis .In NSCLC
• Increased expression significantly correlated with pemetrexed resistance in NSCLC cell lines
• TS expression significantly higher in SCC compared with adenocarcinoma
• Higher TS expression may be biologic mechanism for reduced efficacy of cisplatin/pemetrexed in SCC versus adenocarcinoma
Giovanetti. Mol Pharmacol. 2008;73:1290; Ceppi. Cancer. 2006;107:1589; Scagliotti. IASLC. 2007.

TS and TTF-1 to Predict Response to Pemetrexed
Journal of Thoracic Oncology. 6(8):1392-1399, August 2011.

Comments: Personalization of cytotoxic therapy
• Numerous potential targets of sensitivity and resistance for cytotoxics have been described.
• None have yet been validated and can be utilized in routine practice.
– No standardized tests: e.g. ERCC1 expression varies with antibody used and may not be reproducible.
– No randomized controlled trial has demonstrated benefit

IMAGING AND PERSONALIZATION:THE EXAMPLE OF EC145

EC145 targets cancer cells; avoids normal cells
51
Folate Receptor Reduced Folate Carrier
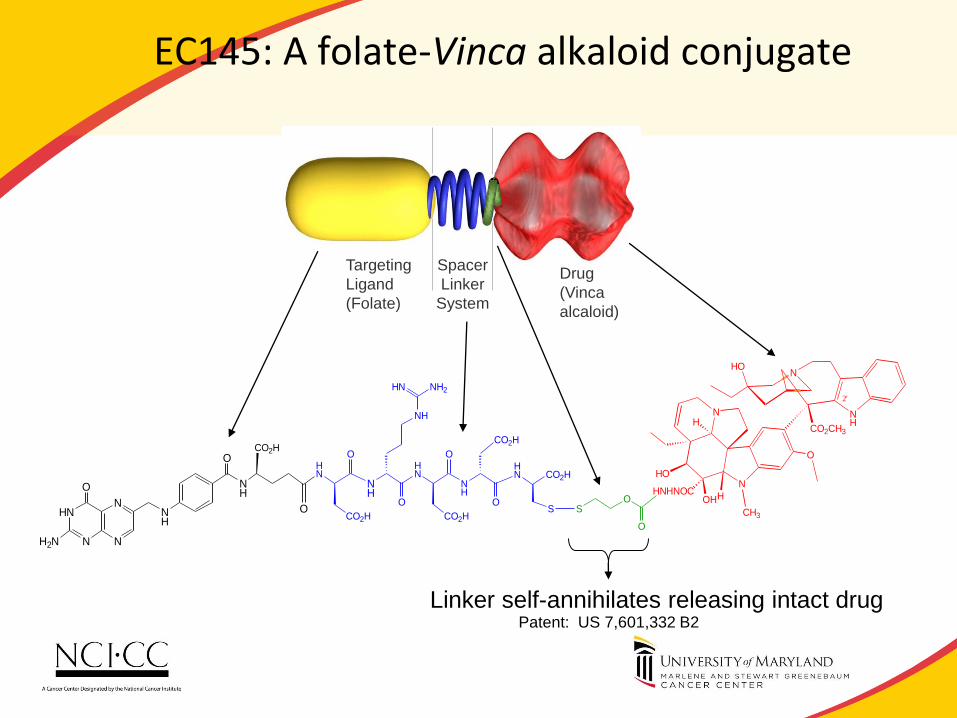
EC145: A folate-Vinca alkaloid conjugate
NH
NHO
N
N
CH3
HOHHNHNOC
HO
H
O
CO2CH3
O
OS
2'
CO2H
NH
NH
CO2H
O
O
NH
H2N
O
N
NHN
N
NH
NH2HN
O
HN
O
NH
CO2H
HN
O
CO2HS
HN CO2H
O
Linker self-annihilates releasing intact drug Patent: US 7,601,332 B2
Drug
(Vinca
alcaloid)
Spacer
Linker
System
Targeting
Ligand
(Folate)

Patient with RECIST PR
Target Lesion EC20 Scan CT Baseline
Size
CT 8 Week
Size
Change
T1 Positive 34mm 15mm -56%
T2 Positive 25mm 10mm -60%
Post-treatment Pre-treatment
WCLC 2009 Abstract 3.4.4
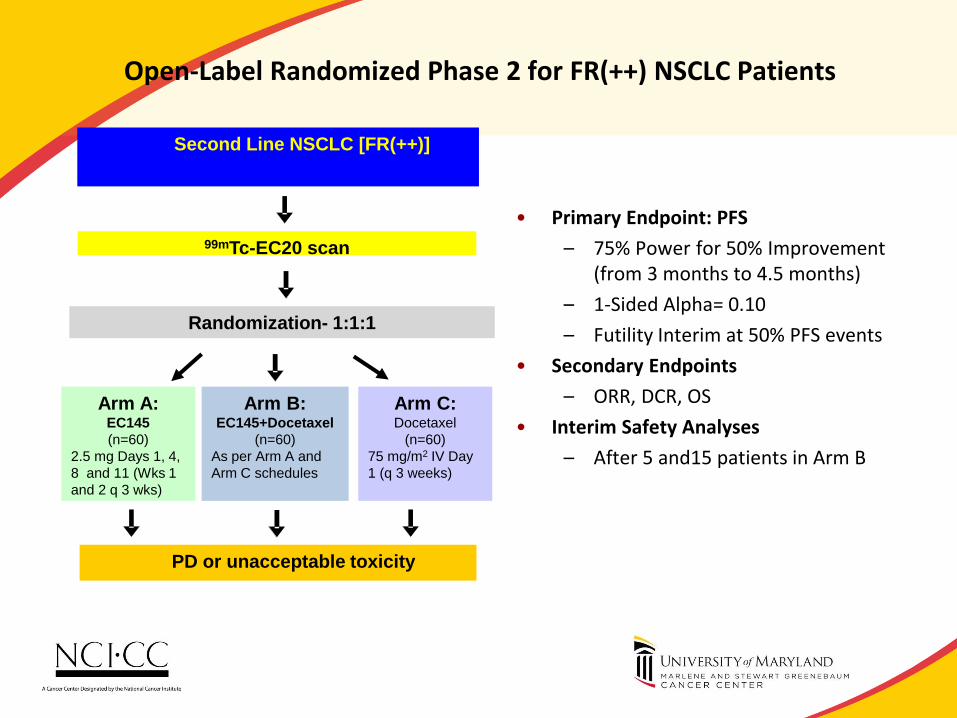
Open-Label Randomized Phase 2 for FR(++) NSCLC Patients
• Primary Endpoint: PFS
– 75% Power for 50% Improvement (from 3 months to 4.5 months)
– 1-Sided Alpha= 0.10
– Futility Interim at 50% PFS events
• Secondary Endpoints
– ORR, DCR, OS
• Interim Safety Analyses
– After 5 and15 patients in Arm B
99mTc-EC20 scan
Arm A: EC145
(n=60)
2.5 mg Days 1, 4,
8 and 11 (Wks 1
and 2 q 3 wks)
Arm C: Docetaxel
(n=60)
75 mg/m2 IV Day
1 (q 3 weeks)
PD or unacceptable toxicity
Randomization- 1:1:1
Arm B: EC145+Docetaxel
(n=60)
As per Arm A and
Arm C schedules
Second Line NSCLC [FR(++)]

IMMUNOTHERAPY: PD-1 AND CTLA4

PD-1 Role in T Cell Activation
What is PD-1? • Involved in T cell regulation • Expressed by activated memory and regulatory T cell • Down regulates T cell by binding to PD-L1/L2
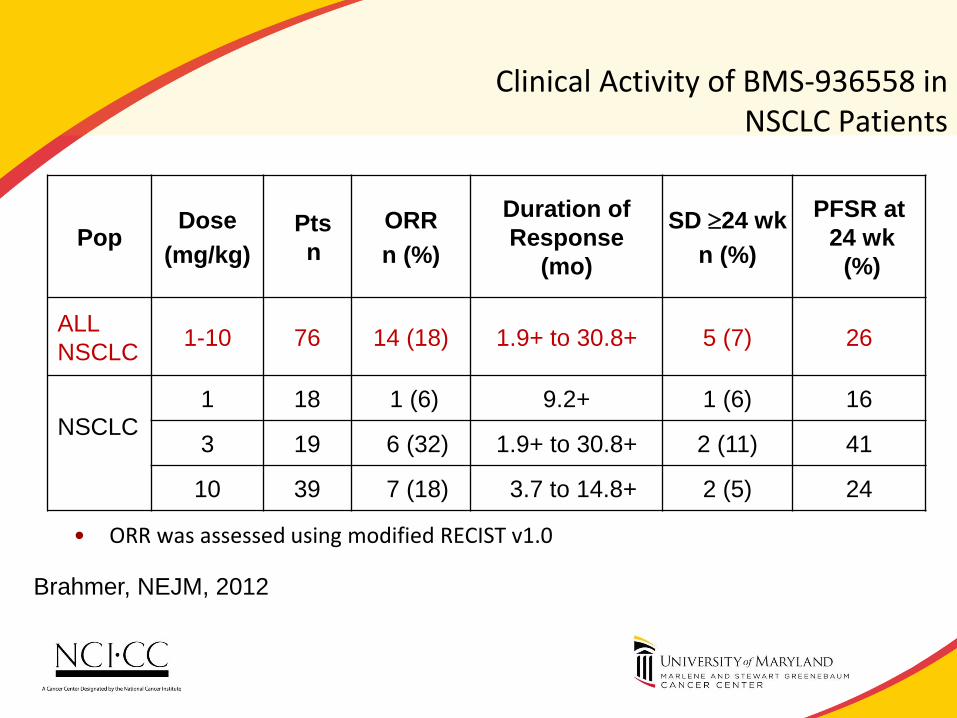
Clinical Activity of BMS-936558 in NSCLC Patients
• ORR was assessed using modified RECIST v1.0
patients had a persistent reduction in baseline target lesions in the presence of new lesions but were not classified as responders for the ORR calculation
Pop Dose
(mg/kg)
Pts
n
ORR
n (%)
Duration of
Response
(mo)
SD 24 wk
n (%)
PFSR at
24 wk
(%)
ALL
NSCLC 1-10 76 14 (18) 1.9+ to 30.8+ 5 (7) 26
NSCLC
1 18 1 (6) 9.2+ 1 (6) 16
3 19 6 (32) 1.9+ to 30.8+ 2 (11) 41
10 39 7 (18) 3.7 to 14.8+ 2 (5) 24
Brahmer, NEJM, 2012
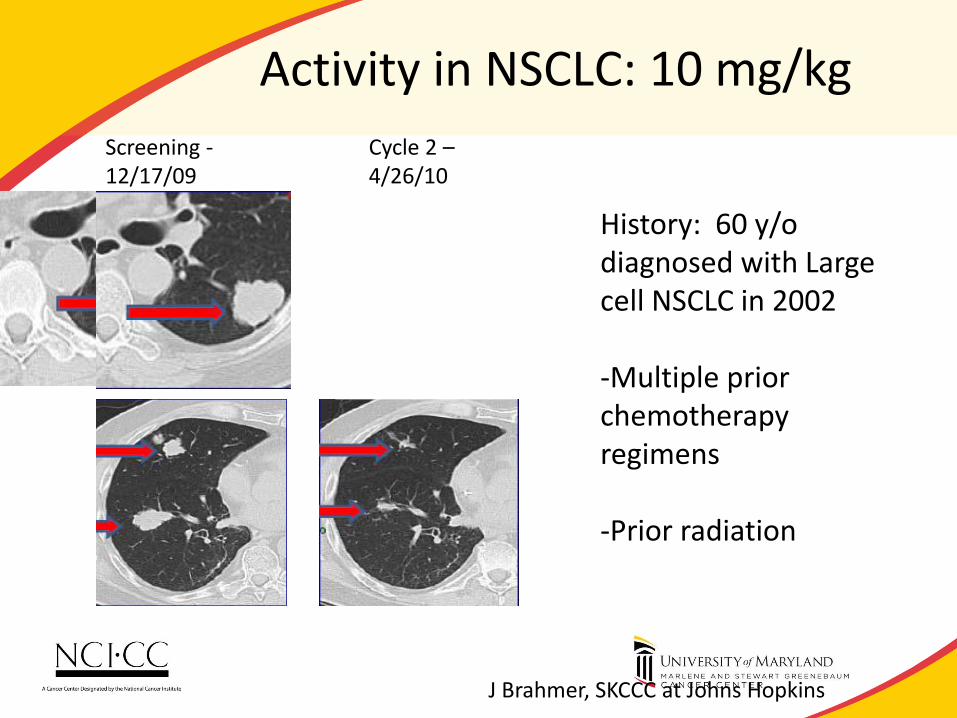
Activity in NSCLC: 10 mg/kg
History: 60 y/o diagnosed with Large cell NSCLC in 2002 -Multiple prior chemotherapy regimens -Prior radiation
Screening - 12/17/09
Cycle 2 – 4/26/10
J Brahmer, SKCCC at Johns Hopkins

Tumor PD-L1 / B7-H1 Expression
• Potential way tumor cells evade immune system (self-defense)
• Poor prognosis in multiple tumor types including NSCLC1
• More commonly seen in Adeno vs. Squamous1
• NSCLC- membranous staining Ig Anti B7-H1
1Mu CY et al Med Oncol 2010, Taube J personal communication

Comments
• Anti-PD-1 and anti PD-L1 are unique and likely to become validated targets.
• Significant questions
– What will be the precise role? (refractory, in combination with chemotherapy, adjuvant etc).
– Can this modality be combined with radiotherapy? (pneumonitis).
• Drugs are currently being evaluated in phase III trials
– Correlative studies may define the role of predictive markers.

PERSONALIZATION AND TOXICITY

Toxicity: Germline Analysis
• There is clear evidence that germline polymorphisms (e.g. drug metabolism enzymes) can predict toxicity (and also outcome).
• “Common arm” analysis of clinical trials
• Examples – Irinotecan
• Marked differences in toxicity and outcome in trials between US and Japan
– Sunitinib
• CYP3A5*1 (rs776746) high metabolising allele associated with dose modifications for toxicity in renal cancer
Mack P, Expert Rev Anticancer Ther. 2012 12:1591-6
Garcia-Donas J, Lancet Oncol. 2011, 12:1143-50.

PERSONALIZATION: A NOTE OF CAUTION

Lung Cancer is Genetically Very Complex
• Carcinogen associated epithelial cancer (colon, lung, melanoma) are exceedingly complex.
• Single “determinants” of benefit are likely to be useful for only a part of the tumor population.

Personalized Cancer Treatment and Patient
Stratification Using NGS and Other OMICs Data
Yuri Nikolsky, Ph.D. Vice President, Research & Development
Intellectual Property & Science
Thomson Reuters

Cross-analysis of different types of OMICs data in cancer Methods of functional analysis of OMICs data for personalized & translational medicine
Yuri Nikolsky VP Research & Development 858 756 7996 [email protected]

CANCER DRUG RESPONSE MARKERS
• Current state of art
– Individual drug response markers at DNA and RNA level
• EGFR mutations for gefitinib in lung adenocarcinoma
• KRAS mutations for sorafenib (Kim E.S., et al., Cancer Disc., 2011, 1, 44-53)
• BRAF V600 mutation for zelboraf in melanoma (Bollag G. et al.,
Nature, 2010, 467, 596-599
– Prognostic markers for cancer progression
• 21, 70-gene expression gene signatures for breast cancer
• Other ones?
• Near future
– Clinical cancer re-sequencing: whole genome and exome
– Sequence variants, amplifications, deletions, fusion genes
– RNA-Seq: highly diverse quantitatively, splice variants
– ENCODE data

DATA AND OMICS ASSAYS IN ONCOLOGY
Epigenetics
-Methylation
-Histones
-Nucleosomes
Germline abberations
Somatic mutations
Amplifications
Deletions
Gene expression:
-mRNA: abundance, splicing
-miRNA
Protein changes:
-Mutated
-PTMs
Metabolites:
-Major misbalances
-Energy
-Protein synthesis
DNA
RNA
Protein
Metabolites
Signaling
Effect

ISSUES WITH OMICS DATA ANALYSIS
• No single level data can generate sufficiently accurate descriptors
(biomarkers) or explain cancerogenesis mechanisms - Poor performance of single feature markers
- Growing evidence that multi-variant markers (gene signatures) perform poorly in large datasets,
more complex endpoints
• Datasets assayed at different levels generally do not overlap at gene
level : mutations – amplifications, methylation – expression, expression –
proteomics, DNA – metabolism
• Statistical correlation between data of different types is based on
independent variables and works poorly

SYSTEMS (PATHWAY) ANALYSIS IS THE ENGINE FOR TRANSLATIONAL RESEARCH
Animal Models
Cell Lines
Research in Clinical Setting
Human Model
Clinical Samples
Basic Biomedical Research
From bench to bedside
From bedside to bench
© Joseph Blender, M.D. of National Cancer Institute
Systems
Biology

SYSTEMS BIOLOGY RESEARCH: KEY PUBLICATIONS
• Hartwell et al (1999) article proposed study of
“modules” instead of genes

SIGNALING PATHWAYS IN NETWORK
What network properties are
required for reconstruction of real
biological pathways?
Binary relationships between proteins
(interactions) can be depicted as edges on
pathways

SIGNALING PATHWAYS IN NETWORK
What network properties are
required for reconstruction of real
biological pathways?
Nodes should reflect the molecular function
of corresponding biomolecule (receptor,
phosphatase etc.)

MUTATIONS IN PATHWAYS, NOT INDIVIDUAL GENES DEFINE CANCEROGENESIS

Ligand
Receptor
Adaptor
Enzyme
TF
TF target
Ligand
Receptor
Second
messenger
Enzyme
TF
Ligand
TF
TF target
Reaction
metabolite
Different linear unidirectional multistep pathways that connect all levels of cellular life and are widely accepted and
supported by the literature are considered Canonical Pathways (~200,000).
Groups of such pathways that may share the same signaling theme or same cascade regulators or effectors are
represented on GeneGo Maps (~nearly 1000 used for enrichment analyses)
Signaling pathways

7
6
How to compare apples and oranges?
Enrichment analysis:
- Concordance in distributions
- Synergy in distributions
Pathway reconstruction:
- Pathway-based networks
- Restores most likely linear
pathways between datasets
“Hidden nodes”:
- Topology-based
- Prioritized regulators
Interactome:
- 1-step Interactions cross-set
- Overconnected proteins
How to compare apples and oranges? Application: comparison of different types of OMICs data

TOPOLOGICAL SCORING AND CAUSAL NETWORKS
77
NF-kB – overconnected
transcription factor
TGF-beta receptor type 1
“hidden node”

TRANSLATIONAL BIOMARKERS: DELIVERABLES FOR A SINGLE REGIMENT DRUG
MECHANISM OF RESISTANCE MECHANISM OF SENSITIVITY

CAUSAL NETWORKS FOR PERSONALIZED CANCER TREATMENT
• Expression data from 1 patient cancer sample were processed by
GC-RMA along with 64 Normal pancreas samples from 3 different
GEO datasets (provided at the same array Affy u133 plus2)
• For each feature ID (EntrezGene) from Patient Sample a Fold
Change and p-values were calculated (Patient Cancer Sample
versus 64 Normal Pancreas Sample)
• 276 IDs are differential expressed (DEGs) in Patient Sample with p-
value<0.05
1 Pancreatic
Cancer Sample
64 Pancreatic
Normal Samples
276 DEGs

Overview Network INDIVIDUAL CAUSAL MODEL
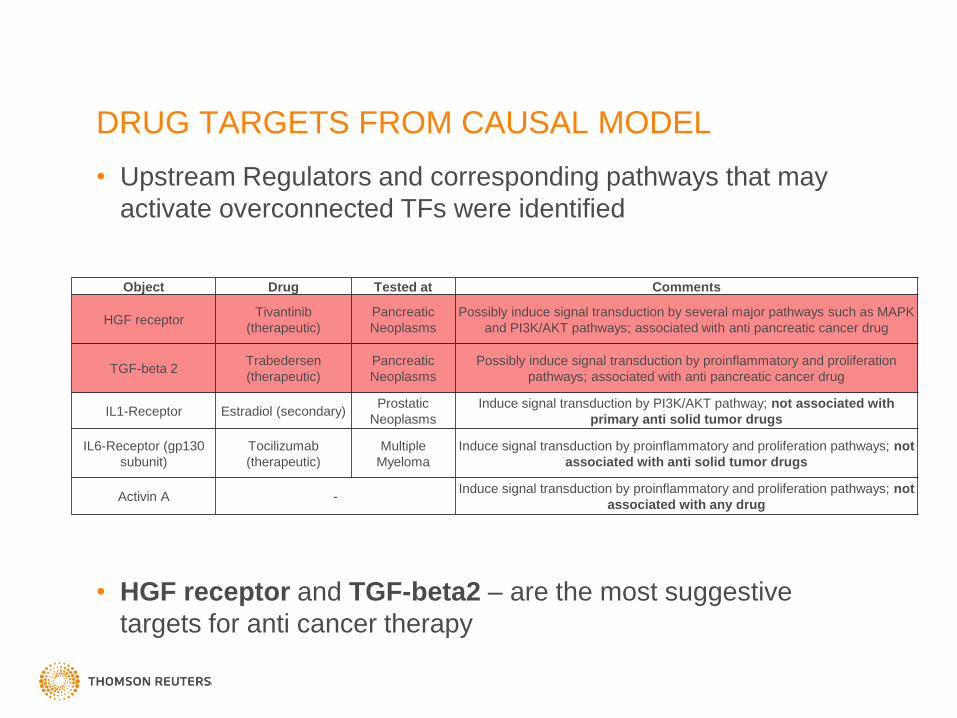
DRUG TARGETS FROM CAUSAL MODEL
• Upstream Regulators and corresponding pathways that may
activate overconnected TFs were identified
• HGF receptor and TGF-beta2 – are the most suggestive
targets for anti cancer therapy
Object Drug Tested at Comments
HGF receptor Tivantinib
(therapeutic)
Pancreatic
Neoplasms
Possibly induce signal transduction by several major pathways such as MAPK
and PI3K/AKT pathways; associated with anti pancreatic cancer drug
TGF-beta 2 Trabedersen
(therapeutic)
Pancreatic
Neoplasms
Possibly induce signal transduction by proinflammatory and proliferation
pathways; associated with anti pancreatic cancer drug
IL1-Receptor Estradiol (secondary) Prostatic
Neoplasms
Induce signal transduction by PI3K/AKT pathway; not associated with
primary anti solid tumor drugs
IL6-Receptor (gp130
subunit)
Tocilizumab
(therapeutic)
Multiple
Myeloma
Induce signal transduction by proinflammatory and proliferation pathways; not
associated with anti solid tumor drugs
Activin A - Induce signal transduction by proinflammatory and proliferation pathways; not
associated with any drug

METAMINER PARTNERSHIPS
Oncology1 Cystic Fibrosis
Toxicology
Exclusive
Project Elan
FDA
Vertex
Eli Lilly
Millennium J&J
Tgen
Van Andel
Harvard
Johns
Hopkins
CRUK
Stem Cells
CNS
Dry Eye
Vertex, IOP
Prostate
Cancer
Metabolic
Eli Lilly
TNO
FDA
University of
Amsterdam
Unilever
Skin
Asthma
AZ, JNJ, Merck
Astra Zeneca Eli Lilly
Novartis
Chicago
Children’s
Hospital
University
of Glasgow
University
of Sheffield
University
of Queensland
USC
J&J
Completed Ongoing
CFF
Foundation
COPD
AZ
Respiratory
JNJ, Merck
Hematology
Exclusive Project
Starting soon
Oncology2
Millennium
Tgen
CRUK
Alzheimer’s
A Big Pharma

METAMINER ONCOLOGY DELIVERABLES
Number of Maps Number of
Associated
Genes
Associated Gene
Variants (e.g.
SNP, deletions)
Number of OMICs
datasets
Hepatocelluar
Carcinoma
25 1,231 774 18
Gastric Cancer 25 2,401 1,848 11
Pancreatic Cancer 26 1,315 1,122 11
Multiple Myeloma 27 783 475 5
Lung Cancer 28 2,767 4,288 17
Breast Cancer 25 3,004 6,285 10
Colorectal Cancer 25 2,586 6,174 0
Melanoma 25 854 1,227 0
TOTAL 206 (unique) 6,119 (unique) 16,549 (unique) 72 (unique)
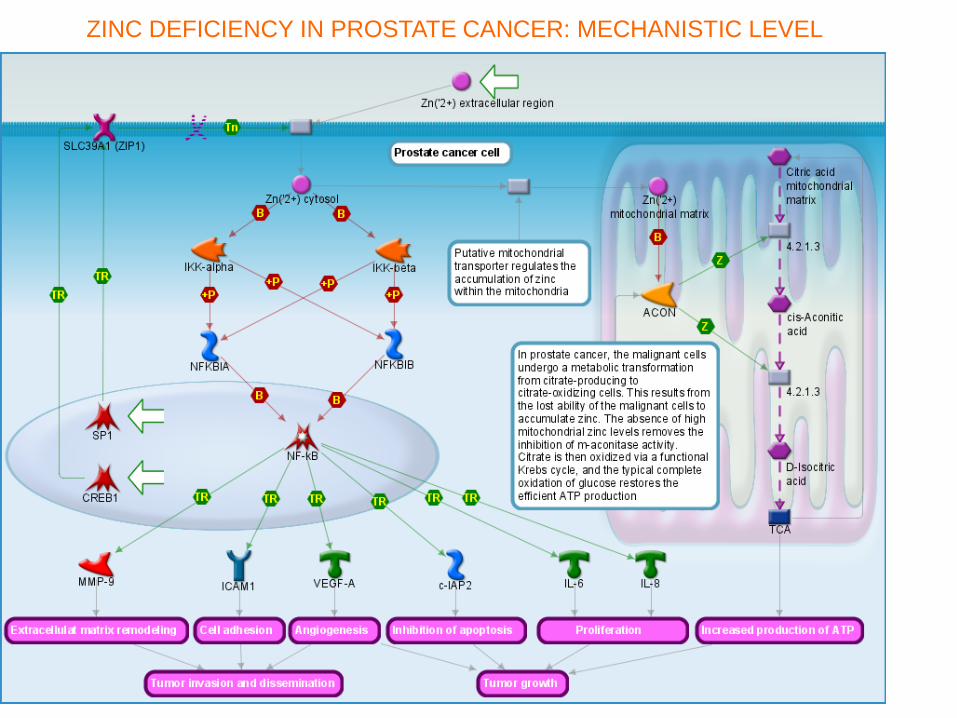
ZINC DEFICIENCY IN PROSTATE CANCER: MECHANISTIC LEVEL

1) Decrease of expression level
2) Decrease of abundance
Increase of abundance
1) Single Nucleotide Polymorphism (SNP)
2) Increase of expression level
3) Increase of abundance
Decrease amount
Increase of activity
Decrease amount
Decrease amount
Increase amount
Increase amount
Single Nucleotide Polymorphism (SNP)
1) Single Nucleotide Polymorphism (SNP)
2) Alternative transcript
3) Increase of expression level
4) Increase of abundance
1) Single Nucleotide Polymorphism (SNP)
2) Increase of abundance
1) Single Nucleotide Polymorphism (SNP)
2) Increase of abundance
Zinc deficiency in Prostate Cancer. Causal gene-disease associations ZINC DEFICIENCY IN PROSTATE CANCER: ASSOCIATIONS

CAUSAL ASSOCIATIONS IN METAMINER
DNA level
Amplification
Fusion genes
Rearrangement
Locus change
Haplotype/SNP
Epigenetics
RNA level
Alternative transcript
Major transcript
Protein level
Isoform
Mutant protein
Phosphorylation
Other PTM
(posttranscriptional
modification)
Peptide
Protein,
Protein complex,
Protein group
Endogenous
compounds
Unspecified
associations
Disease-specific
Characteristics
Abundance
Gain/Lost of function
Activity
Organ or Tissue distribution
Subcellular Localization
change
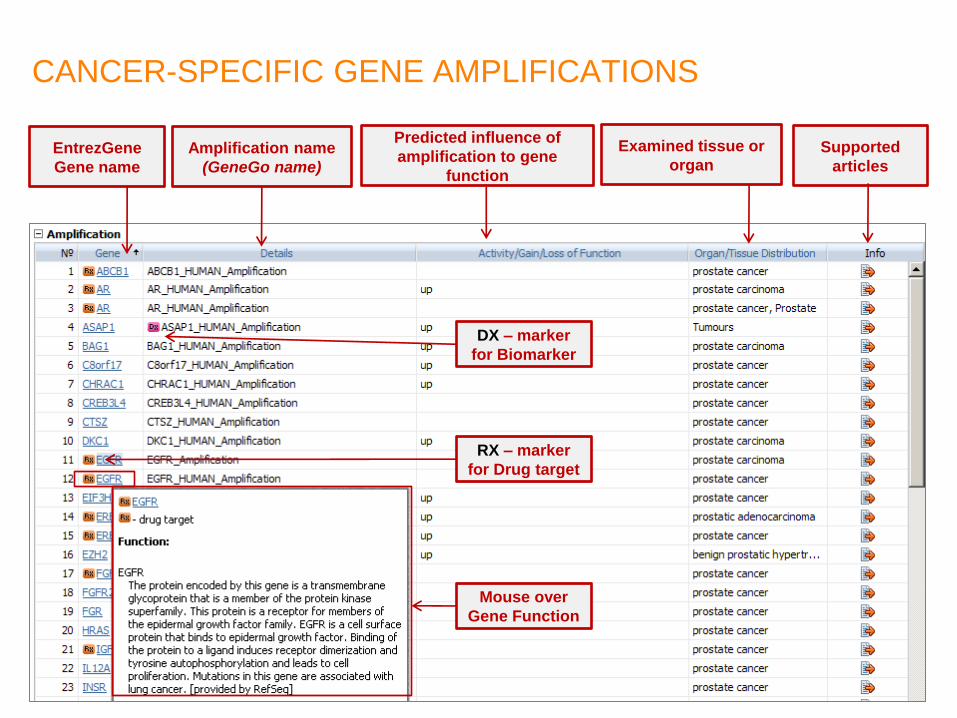
CANCER-SPECIFIC GENE AMPLIFICATIONS
EntrezGene
Gene name
Mouse over
Gene Function
Amplification name
(GeneGo name)
Predicted influence of
amplification to gene
function
Examined tissue or
organ Supported
articles
DX – marker
for Biomarker
RX – marker
for Drug target

21.01.2013
88
ZINC DEFICIENCY IN PROSTATE CANCER: CAUSAL LEVEL

DISEASE MAPS RANKED BY MM BIOMARKERS
Name p-Value Gene/Compound
Role of DNA methylation in progression of multiple myeloma 1.85E-27 APC
Inhibition of apoptosis in multiple myeloma 1.38E-19 BCL2
Suppression of p53 signaling in multiple myeloma 2.32E-18 APAF1
Role of osteoblasts in bone lesions formation in multiple myeloma 1.82E-17 ALPL
Influence of multiple myeloma cells on bone marrow stromal cells 3.88E-16 CD40
Transition of Monoclonal gammopathy of undetermined significance to active multiple myeloma (schema) 2.00E-15 CCL3
NF-kB pathway in multiple myeloma 2.15E-13 BCL2
Influence of bone marrow cell environment on progression of multiple myeloma 1.25E-11 Ca('2+)
Transition of Smoldering multiple myeloma to active multiple myeloma (schema) 3.49E-11 CCL2
Multiple Myeloma (general scheme) 5.40E-11 CCL4
Mechanisms of drug resistance in multiple myeloma 6.68E-11 ABCB1
IL-6 signaling in multiple myeloma 2.74E-10 AKT1
DKK1 signaling in multiple myeloma 1.35E-09 ALPL
Main signaling cascades in myeloma cells 1.44E-09 AKT1
Mechanisms of CAM-DR in multiple myeloma 1.56E-09 BCL2L11
Interleukin-6 signaling in multiple myeloma 4.49E-09 AKT1
Role of IGH translocations in multiple myeloma 6.24E-08 CCND1
VEGF signaling in multiple myeloma 9.71E-07 ABCB1
Rb proteins signaling in multiple myeloma 1.25E-06 CCND1
IGF-1 signaling in multiple myeloma 2.72E-06 AKT1
Activation of osteoclast differentiation in bone lesions formation in multiple myeloma 7.48E-06 CCL3

Pathways classifiers in GWAS studies
• GWAS miss most of valuable data
- Very few if any of “valid” SNPs
- Data points are not random variables
• Solution
- Filter “weak hits” through pathways
- Use pathways as descriptors
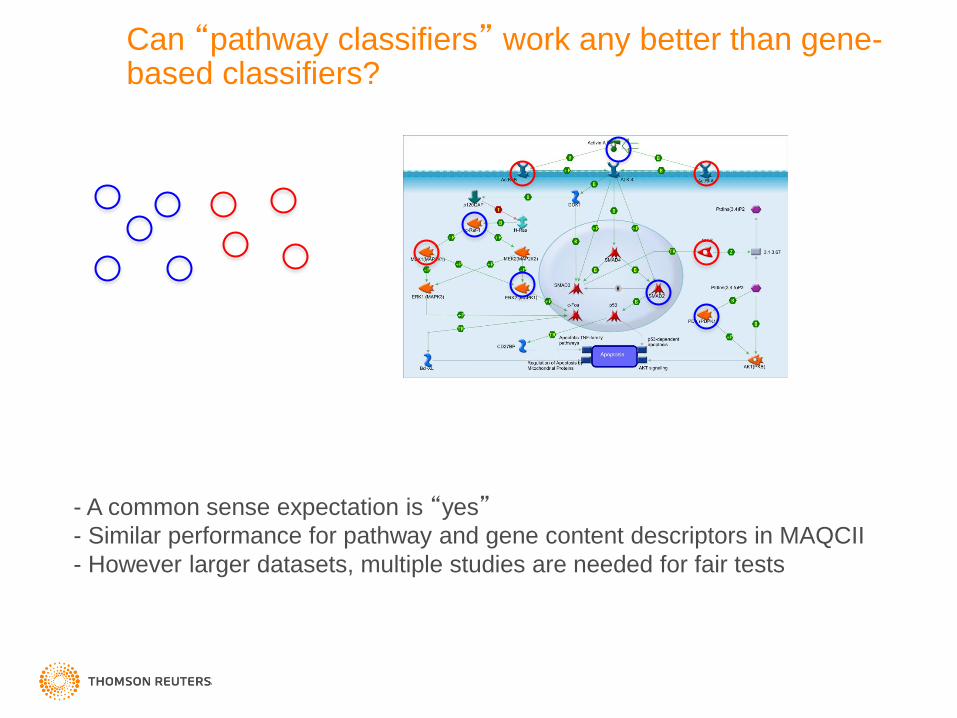
Can “pathway classifiers” work any better than gene-based classifiers?
- A common sense expectation is “yes” - Similar performance for pathway and gene content descriptors in MAQCII
- However larger datasets, multiple studies are needed for fair tests

Pharmacological Mechanisms of Action (targets and drugs)
PATHWAY BARCODING OF PHENOTYPES
LC
DII
…
…
…
LT
KD
PC
Applications:
- New target hypotheses
- Drug repositioning
- Targets for combination drugs
- Market intelligence
- Personalized medicine
- Translational medicine
- Scoring,
- Ranking,
- Prioritization
- Reporting
Normal Pathways
Pathology Pathways
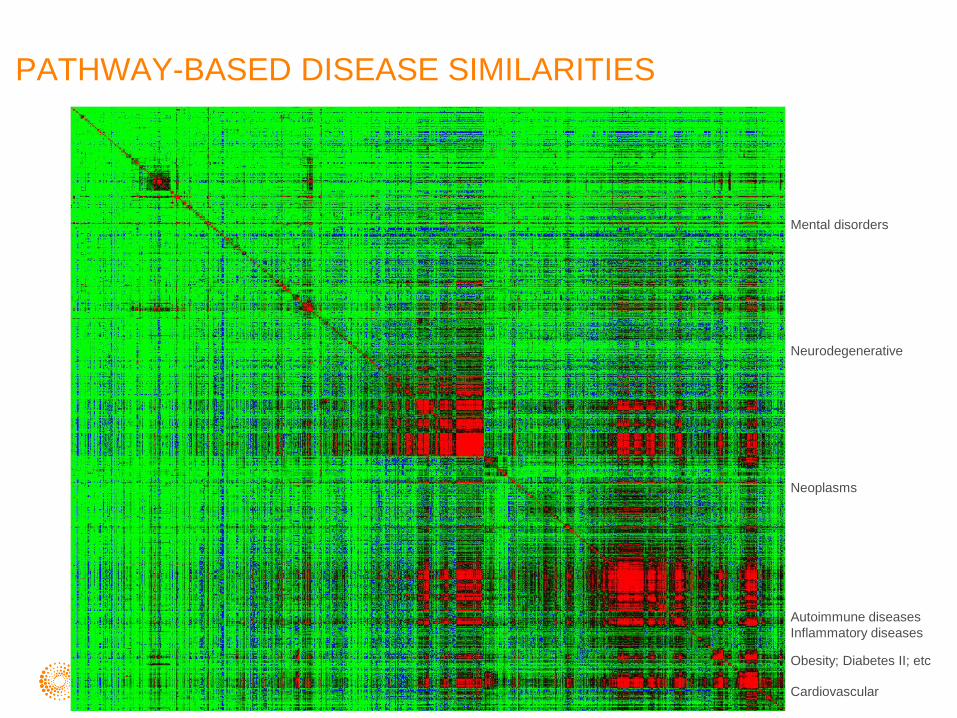
PATHWAY-BASED DISEASE SIMILARITIES
Mental disorders
Neurodegenerative
Neoplasms
Autoimmune diseases
Inflammatory diseases
Obesity; Diabetes II; etc
Cardiovascular
Vision disorders

PATHWAY (FUNCTONAL GROUPS) CLUSTERING
A B C D E F G H I J K L M
Individual profiling based on EA in multiple
ontologies
Pathway-based similarity tree
Patients (samples) in one cohort, say
Breast cancer study of 400 patients
Clustering based on tree
A.B,C.. – individual samples

Personalized Cancer Treatment and Patient
Stratification Using NGS and Other OMICs Data
Personalized Cancer Treatment and Patient
Stratification Using NGS and Other OMICs Data
Q&A

Personalized Cancer Treatment and Patient
Stratification Using NGS and Other OMICs Data
Your Moderator
John Sterling Editor-in-Chief
Genetic Engineering & Biotechnology News

Personalized Cancer Treatment and Patient
Stratification Using NGS and Other OMICs Data
Rolf A. Stahel, M.D. Professor, Laboratory of Molecular Oncology
Clinic for Thoracic Surgery and Policlinic for Oncology
University Hospital of Zurich
ESMO President-Elect

Personalized Cancer Treatment and Patient
Stratification Using NGS and Other OMICs Data
Martin Edelman, M.D. Professor of Medicine
University of Maryland School of Medicine
Director, Solid Tumor Oncology
Greenebaum Cancer Center
Personalized Cancer Treatment and Patient
Stratification Using NGS and Other OMICs Data
Yuri Nikolsky, Ph.D. Vice President, Research & Development
Intellectual Property & Science
Thomson Reuters

Personalized Cancer Treatment and Patient
Stratification Using NGS and Other OMICs Data
Broadcast Date: Thursday, January 31, 2013
Time: 11am ET, 8am PT
Sponsored by
Thank you for attending
Personalized Cancer Treatment and Patient
Stratification Using NGS and Other OMICs Data