personalized battery lifetime prediction for mobile … consumption and time spent in each...
TRANSCRIPT

Copyright 2011. The Korean Institute of Information Scientists and Engineers pISSN: 1976-4677 eISSN: 2093-8020
Regular PaperJournal of Computing Science and Engineering,
Vol. 5, No. 4, December 2011, pp. 338-345
Personalized Battery Lifetime Prediction for Mobile Devicesbased on Usage Patterns
Joon-Myung Kang* Department of Electrical and Computer Engineering, University of Toronto, Toronto, ON, Canada
Sin-seok SeoDepartment of Computer Science and Engineering, Pohang University of Science and Technology (POSTECH), Pohang, Korea
James Won-Ki HongDivision of IT Convergence and Engineering, Pohang University of Science and Technology (POSTECH), Pohang, Korea
AbstractNowadays mobile devices are used for various applications such as making voice/video calls, browsing the Internet, listening to music
etc. The average battery consumption of each of these activities and the length of time a user spends on each one determines the
battery lifetime of a mobile device. Previous methods have provided predictions of battery lifetime using a static battery consumption
rate that does not consider user characteristics. This paper proposes an approach to predict a mobile device’s available battery lifetime
based on usage patterns. Because every user has a different pattern of voice calls, data communication, and video call usage, we can
use such usage patterns for personalized prediction of battery lifetime. Firstly, we define one or more states that affect battery
consumption. Then, we record time-series log data related to battery consumption and the use time of each state. We calculate the
average battery consumption rate for each state and determine the usage pattern based on the time-series data. Finally, we predict the
available battery time based on the average battery consumption rate for each state and the usage pattern. We also present the
experimental trials used to validate our approach in the real world.
Category: Embedded computing
Keywords: Battery lifetime prediction; Resource management; Performance management; Usage pattern; Mobile device
I. INTRODUCTION
As the growth of mobile networks and services has acceler-
ated, battery powered mobile devices (e.g., mobile handsets or
PDAs) have emerged as important tools in our lives [1]. Mobile
devices are used for various applications such as making voice/
video calls, browsing the Internet, playing games etc. The bat-
tery consumption of these activities affects the battery lifetime
of mobile devices. A mobile device that has a short battery life-
time can cause much inconvenience for users and reduce the
device’s usefulness [2, 3]. Mechanisms to provide long and sta-
ble battery life are therefore required. One of the methods to
guarantee a long battery life is to minimize battery consumption
by reducing unnecessary battery usage.
The key to minimizing battery consumption is accurately
predicting the battery consumption of the various operating
Received 00 J 2011, Accepted 00 A 2011
*Corresponding Author
Open Access http://dx.doi.org/10.5626/JCSE.2011.5.4.338 http://jcse.kiise.orgThis is an Open Access article distributed under the terms of the Creative Commons Attribution Non-Commercial License (http://creativecommons.org/licenses/
by-nc/3.0/) which permits unrestricted non-commercial use, distribution, and reproduction in any medium, provided the original work is properly cited.

Personalized Battery Lifetime Prediction for Mobile Devices based on Usage Patterns
Joon-Myung Kang et al. 339 http://jcse.kiise.org
states of mobile devices. Much work has focused on hardware
or operating system (OS) level predictions [4, 5], model-based
battery life predictions [6], and battery consumption by a CPU
when executing a particular instruction [7-9]; furthermore, bat-
tery lifetime has usually been predicted using a static battery
consumption rate, which the manufacturers of batteries and
mobile devices have determined via experiments. The con-
sumption rate has also been predicted by an arithmetic mean of
the consumed power. However, previous methods have not been
able to predict battery lifetime in terms of user characteristics,
because such methods have not considered usage patterns. That
is, every user has a different mix of voice call, data communica-
tion, and video call usage. If each user has a consistent usage
pattern [10], we can predict battery lifetime on an individual
basis.
In this paper, we propose a method for predicting available
battery lifetime in mobile devices based on the usage patterns of
individual users. We define possible mobile device states based
on the device’s basic functions, e.g., voice call and data commu-
nication. We develop daily (i.e., morning/afternoon/evening/
night) and weekly (i.e., weekday/weekend) user profiles that
reflect each user’s life patterns, i.e., working, resting, and sleep-
ing patterns for both weekdays and weekends. We measure the
battery consumption and time spent in each operational state.
Then, we develop usage patterns based on various modes (e.g.,
sleeping, resting, and working). In our previous work [11], we
did not consider user life patterns for predicting battery lifetime.
Here we present a method for predicting battery lifetime using
usage patterns generated by the probability that a user will
spend a certain time in each operational state for each mode. We
then present the numerical results of a simple use case, which
accurately predicts battery lifetime. We also present an experi-
mental trial used to validate our proposed method in the real
world.
The main contributions of the paper are as follows: 1)
Because the proposed method presents real-time predicted bat-
tery lifetime in terms of an on-line analysis based on usage pat-
terns rather than an off-line analysis, this method is more useful
to users than previous ones. 2) The proposed method enables
effective battery usage by reducing useless battery consumption
and detects abnormal battery usage by comparing operating
times between normal and abnormal states.
The organization of this paper is as follows. Section II
describes previous work for predicting battery lifetime and
mobile applications for battery management. Section III defines
the problem and describes our approach. Section IV presents
our experimental trials with real log data from smartphones.
Finally, we draw conclusions and suggest future work in Sec-
tion V.
II. RELATED WORK
Many mobile devices provide battery lifetime prediction via
hardware and OS support as an integral component of power
management systems. Advanced Power Management (APM)
[4] has been widely used in power management for computer
systems. The Advanced Configuration and Power Interface
(ACPI) [5] recently proposed by Intel, Microsoft and Toshiba is
an advanced version of APM. ACPI defines power configura-
tion and management functions between a Basic Input Output
System (BIOS) and the OS. In particular, it uses the remaining
battery capacity and present rate of battery drain to predict the
remaining battery life. Currently, ACPI is used in power man-
agement for desktops and laptops. The SBS Forum [12] has
proposed a smart battery system, which is a specification for
determining accurate battery readings; it allows the OS to per-
form power management operations based on estimated run
times. This system predicts battery lifetime given a user-speci-
fied rate or rolling average over a fixed interval. Such simple
approaches consider only a very short discharge history and are
therefore inaccurate.
Another area of related research is model-based battery life
prediction. Given the discharge profile of the entire lifetime of
the battery, a well-designed battery model can provide a highly
accurate battery life prediction. One such accurate model,
described in [6], uses the low-level electrochemical phenome-
non of battery discharge. This model is commonly used as a
simulator to verify other battery models.
Moreover, Tiwari et al. [7, 9] and Saputra et al. [8] have
studied power consumption characteristics at the processor
instruction level. Combining these characteristics with battery
models, one can estimate battery consumption. Model-based
methods have limitations that make them unsuitable for online,
dynamic and adaptive battery life prediction, such as situations
where there is a need for a large number of parameters and there
is a high computation cost (especially for simulation models).
Our proposed method focuses on predicting battery lifetime
based on the empirical usage patterns of each user, and no
model-driven approach is needed.
Krintz et al. [3] proposed application-level prediction of bat-
tery dissipation by investigating the degree to which battery dis-
sipation, as induced by program execution, can be measured by
application-level software tools and predicted by a compiler and
runtime system. They presented a black-box approach in which
they attempted to observe the dissipation characteristics at the
application-level. However, they did not consider the effect of
usage patterns at the individual user level. Thus, while this
method focuses on applications, our method focuses on a user’s
behavioral operating states and reflects the user’s characteris-
tics, taking a more user-centric approach.
Recently, Zhang et al. [13] proposed PowerBooter, an auto-
mated power model construction technique that uses built-in
battery voltage sensors and knowledge of battery discharge
behavior to monitor power consumption while explicitly con-
trolling the power management and activity states of individual
components. They also presented PowerTutor, which is an
Android application for power management and activity state
introspection based on a tool that uses the model generated by
PowerBooter for online power estimation. This proposed
method is highly related to our work but we mainly focused on
using user characteristics for power estimation.
III. PROPOSED METHOD
In this section, we present our method for predicting battery
lifetime based on usage patterns. We firstly present a problem
Journal of Computing Science and Engineering, Vol. 5, No. 4, December 2011, pp. 338-345
http://dx.doi.org/10.5626/JCSE.2011.5.4.338 340 Joon-Myung Kang et al.
definition. We then describe our proposed method for solving
the problem.
A. Problem Definition
In order to define the problem in this paper, we also assume
that a mobile device has n possible states. Firstly, we present the
following symbolic notations and formulae:
(1)
(2)
where Bi is the average battery consumption rate of the ith state,
and pi is the use time rate of the ith state, which is determined to
satisfy pi = 1. Because each user has a different vector, ,
according to the usage pattern, this vector is defined for the
symbol that represents their usage pattern.
We can formulate our problem as follows.
Problem Formulation: Determine the average battery
consumption rate vector and the usage pattern vector to
minimize the Mean Square Error (MSE) of a predictor
, (3)
where is an estimator from our prediction method and θ is the
true values measured from users. We predict the available
battery lifetime based on usage patterns using the following
formula.
(4)
where T is the available time predicted by usage patterns, and V
is the total battery capacity. Because each user has a different
, every user’s battery has a different remaining lifetime.
Previous approaches cannot represent a user’s personal
characteristics, because they do not consider usage patterns.
B. Solution
In this section, we describe a solution to the problem defined
in Section III-A. The hypothesis we present in this paper is that
the most accurate prediction of a mobile device’s battery
lifetime is based on usage patterns and minimization of the
prediction error. When a mobile device is turned on, a battery
monitoring application begins collecting data on the operating
time and battery consumption of each state based on a
timestamp. This time-series data is used to measure the average
battery consumption rate ( ) and usage patterns ( ). Finally,
the application provides a prediction of battery lifetime based
on these two vectors. Firstly, we collect the time-series data for
each state. To this end, we append the time and battery level to a
log file after entering and exiting the state. The symbol for the
log data is the vector = ( ), where is a
vector of the jth log data, is the time-series data of the jth log
data, D1 is a state of the mobile device, D2 is battery consumption,
D3 is use time, and D
4 is a timestamp. Next, we calculate the
average battery consumption rate and the usage pattern using
time-series log data. As defined in Section IIIA, we assume that
a mobile device has n possible states and the log file has m
entries. We denote the total battery consumption by the vector
= (b1, ..., bn). The value of this vector is the total battery
consumption of the ith state via the sum of the second element
of each log entry for which the state is i. We also denote the use
time by the vector = (t1, ..., tn). The value of this vector is the
use time of the ith state via the sum of the third element of each
log entry for which the state is i. Thus,
(5)
(6)
where . We define the average battery consumption rate
and usage pattern for each user using Equations (5) and (6).
(7)
(8)
where Bi is the average battery consumption rate of the ith state,
and pi is the use time rate of the ith state, which is determined to
satisfy pi = 1. This usage pattern represents not only the
past usage pattern, but also the probability of spending the same
amount of time in each state in the future [10].
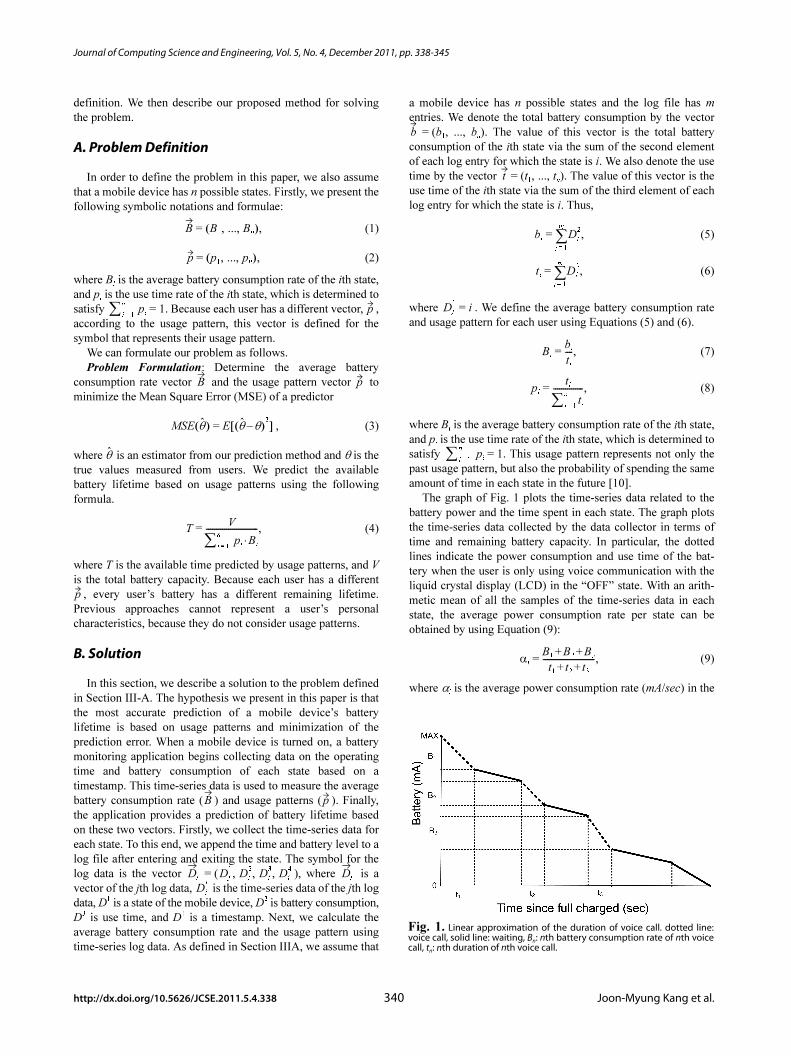
The graph of Fig. 1 plots the time-series data related to the
battery power and the time spent in each state. The graph plots
the time-series data collected by the data collector in terms of
time and remaining battery capacity. In particular, the dotted
lines indicate the power consumption and use time of the bat-
tery when the user is only using voice communication with the
liquid crystal display (LCD) in the “OFF” state. With an arith-
metic mean of all the samples of the time-series data in each
state, the average power consumption rate per state can be
obtained by using Equation (9):
(9)
where αi is the average power consumption rate (mA/sec) in the
B B1, ..., Bn( ),=
p p1, ..., pn( ),=
i 1=
n
∑ p
B p
MSE θ̂( ) E θ̂ θ–( )2
[ ]=
θ̂
TV
i 1=
n
∑ pi Bi⋅--------------------------,=
p
B p
Dj Dj
1
, Dj
2
, Dj
3
, Dj
4
Dj
Dj
i
b
t
bi Dj
2
,j 1=
m
∑=
ti Dj
3
,j 1=
m
∑=
Dj
1
i=
Bi
bi
ti----,=
pi
ti
i 1=
n
∑ ti
---------------,=
i 1=
n
∑
αi
B1 B2 B3+ +
t1 t2 t3+ +--------------------------,=
Fig. 1. Linear approximation of the duration of voice call. dotted line:voice call, solid line: waiting, Bn: nth battery consumption rate of nth voicecall, tn: nth duration of nth voice call.
Personalized Battery Lifetime Prediction for Mobile Devices based on Usage Patterns
Joon-Myung Kang et al. 341 http://jcse.kiise.org
state, Bj is the power consumption amount (mA) for the jth voice
communication, and tj is the call duration of the jth voice
communication or the use time (sec). The usage pattern of each
user can be determined as a numerical value based on their use
time rate (vecpi) in each state, because the rate is different for
each user. There are numerous methods for calculating the use
time rate per state. The simplest method is to divide the use time
in each state by the sum of the use time in all states, based on
the time-series data collected by the data collector. Another
method to calculate the use time rate per state is to predict
future data based on past time-series data, for example, the
Autoregressive Model (AR) [14] or the Holt-Winters model [15].
Although the usage pattern is also based on past time-series
data, weight factors can be adjusted so that recent data have
more weight. In future work, we will apply these forecasting
methods to calculate usage patterns. We have described how to
determine the usage pattern vector of each user by recording
the time spent in each state. However, the life patterns of most
users differ according to the day or week, e.g., working, resting
and sleeping (a day) and weekday and weekend (a week). In
addition, users have variable life patterns, e.g., vacations or
business trips. We consider user life patterns for predicting
battery lifetime. We divide each day and week into several
modes based on a user’s life patterns. If a mobile device has n
possible states and a user defines l modes, we define the usage
pattern vector with Equation (10).
= ( ..., ), (i = 1, ..., l), (10)
where is the usage pattern of the ith mode, and is the use
time rate of the jth state of the ith mode, which is determined to
satisfy = 1. If we predict the battery lifetime of the ith
mode, we use the vector .
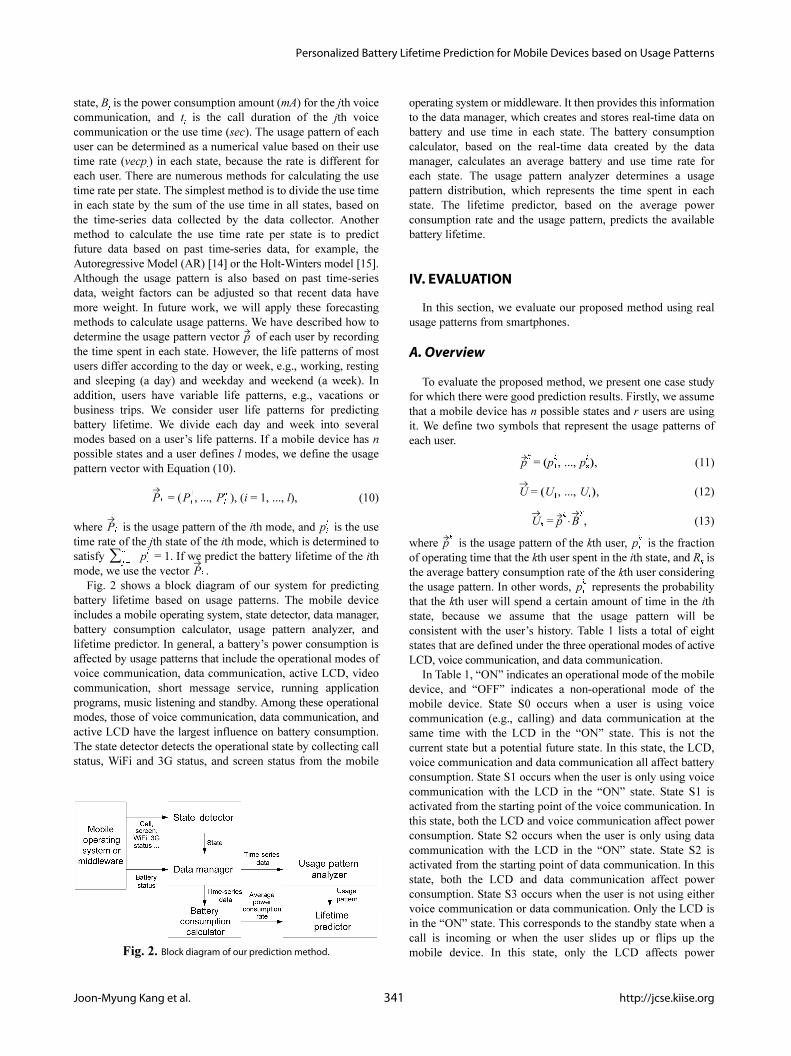
Fig. 2 shows a block diagram of our system for predicting
battery lifetime based on usage patterns. The mobile device
includes a mobile operating system, state detector, data manager,
battery consumption calculator, usage pattern analyzer, and
lifetime predictor. In general, a battery’s power consumption is
affected by usage patterns that include the operational modes of
voice communication, data communication, active LCD, video
communication, short message service, running application
programs, music listening and standby. Among these operational
modes, those of voice communication, data communication, and
active LCD have the largest influence on battery consumption.
The state detector detects the operational state by collecting call
status, WiFi and 3G status, and screen status from the mobile
operating system or middleware. It then provides this information
to the data manager, which creates and stores real-time data on
battery and use time in each state. The battery consumption
calculator, based on the real-time data created by the data
manager, calculates an average battery and use time rate for
each state. The usage pattern analyzer determines a usage
pattern distribution, which represents the time spent in each
state. The lifetime predictor, based on the average power
consumption rate and the usage pattern, predicts the available
battery lifetime.
IV. EVALUATION
In this section, we evaluate our proposed method using real
usage patterns from smartphones.
A. Overview
To evaluate the proposed method, we present one case study
for which there were good prediction results. Firstly, we assume
that a mobile device has n possible states and r users are using
it. We define two symbols that represent the usage patterns of
each user.
(11)
(12)
(13)
where is the usage pattern of the kth user, is the fraction
of operating time that the kth user spent in the ith state, and Rk is
the average battery consumption rate of the kth user considering
the usage pattern. In other words, represents the probability
that the kth user will spend a certain amount of time in the ith
state, because we assume that the usage pattern will be
consistent with the user’s history. Table 1 lists a total of eight
states that are defined under the three operational modes of active
LCD, voice communication, and data communication.
In Table 1, “ON” indicates an operational mode of the mobile
device, and “OFF” indicates a non-operational mode of the
mobile device. State S0 occurs when a user is using voice
communication (e.g., calling) and data communication at the
same time with the LCD in the “ON” state. This is not the
current state but a potential future state. In this state, the LCD,
voice communication and data communication all affect battery
consumption. State S1 occurs when the user is only using voice
communication with the LCD in the “ON” state. State S1 is
activated from the starting point of the voice communication. In
this state, both the LCD and voice communication affect power
consumption. State S2 occurs when the user is only using data
communication with the LCD in the “ON” state. State S2 is
activated from the starting point of data communication. In this
state, both the LCD and data communication affect power
consumption. State S3 occurs when the user is not using either
voice communication or data communication. Only the LCD is
in the “ON” state. This corresponds to the standby state when a
call is incoming or when the user slides up or flips up the
mobile device. In this state, only the LCD affects power
p
Pi Pi
1
, Pi
n
Pi pi
j
j 1=
n
∑ pi
j
Pi
pk
p1
k, ..., pn
k( ),=
U U1, ..., Ur( ),=
Uk pk
BT
,⋅=
pk
pi
k
pi
k
Fig. 2. Block diagram of our prediction method.
Journal of Computing Science and Engineering, Vol. 5, No. 4, December 2011, pp. 338-345
http://dx.doi.org/10.5626/JCSE.2011.5.4.338 342 Joon-Myung Kang et al.
consumption. State S4 occurs when the user is using voice
communication and data communication at the same time with
the LCD in the “OFF” state. This is not the current state but a
potential future state. In this state, both voice communication
and data communication affect power consumption. State S5
occurs when the user is only using voice communication with
the LCD in the “OFF” state. This occurs after the user has
started voice communication and a certain amount of time has
elapsed. In this state, voice communication affects power
consumption. State S6 occurs when the user is only using data
communication with the LCD in the “OFF” state. This is not the
current state but a potential future state.. In this state, data
communication affects power consumption. State S7 occurs
when the user is not using either voice communication or data
communication with the LCD in the “OFF” state. This corresponds
to the standby state when there is no incoming call, when the
mobile phone has been slid down or flipped down, or when the
mobile phone has simply timed out. In this state, periodic
connection with a base station affects power consumption. The
problem can be simplified by reducing the number of possible
states to minimize the complexity. The bottom row of Table 1
shows the simplified possible states of a mobile device. We
merge states S3 and S7 to form state SS0. In this state, a user is
not using either voice or data communication and periodic
connection with a base station and waiting for calls affect power
consumption. We also merge states S1 and S5 to form state SS1.
In this state, a user is only using voice communication and this
affects power consumption. Finally, we define the state S2 as
state SS2. In this state, data communication affects power
consumption.
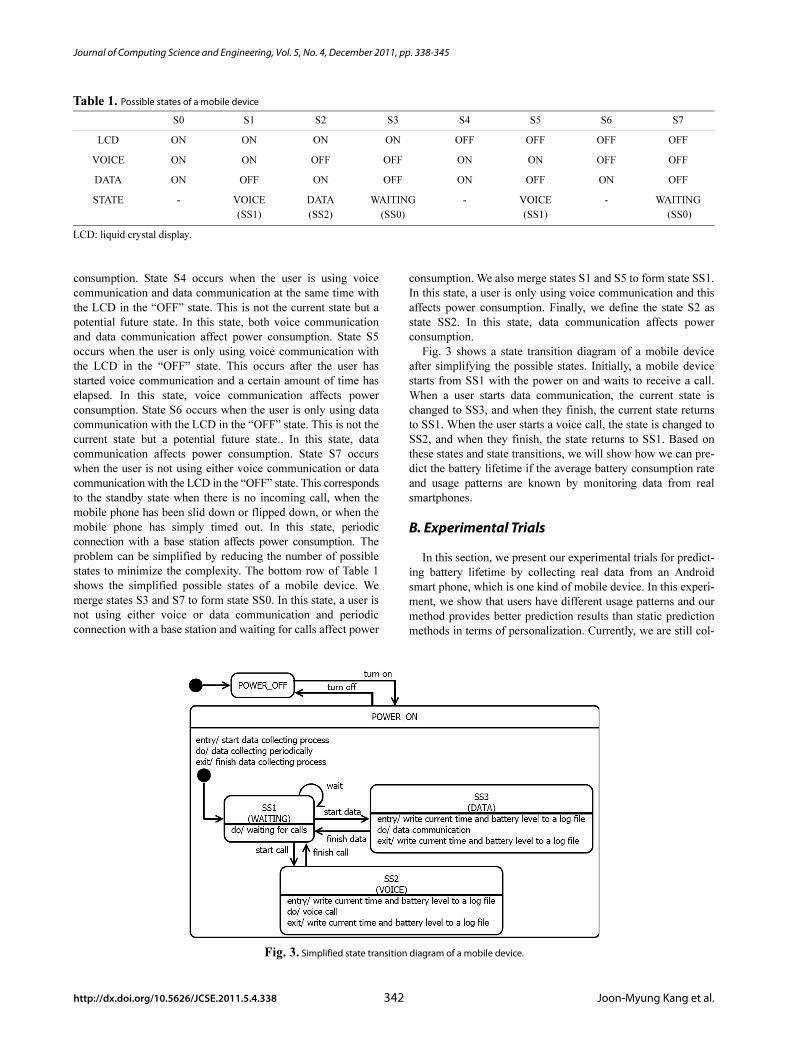
Fig. 3 shows a state transition diagram of a mobile device
after simplifying the possible states. Initially, a mobile device
starts from SS1 with the power on and waits to receive a call.
When a user starts data communication, the current state is
changed to SS3, and when they finish, the current state returns
to SS1. When the user starts a voice call, the state is changed to
SS2, and when they finish, the state returns to SS1. Based on
these states and state transitions, we will show how we can pre-
dict the battery lifetime if the average battery consumption rate
and usage patterns are known by monitoring data from real
smartphones.
B. Experimental Trials
In this section, we present our experimental trials for predict-
ing battery lifetime by collecting real data from an Android
smart phone, which is one kind of mobile device. In this experi-
ment, we show that users have different usage patterns and our
method provides better prediction results than static prediction
methods in terms of personalization. Currently, we are still col-
Table 1. Possible states of a mobile device
S0 S1 S2 S3 S4 S5 S6 S7
LCD ON ON ON ON OFF OFF OFF OFF
VOICE ON ON OFF OFF ON ON OFF OFF
DATA ON OFF ON OFF ON OFF ON OFF
STATE - VOICE
(SS1)
DATA
(SS2)
WAITING
(SS0)
- VOICE
(SS1)
- WAITING
(SS0)
LCD: liquid crystal display.
Fig. 3. Simplified state transition diagram of a mobile device.
Personalized Battery Lifetime Prediction for Mobile Devices based on Usage Patterns
Joon-Myung Kang et al. 343 http://jcse.kiise.org
lecting a large volume of battery usage data from various partic-
ipants. We present our experimental setup and ongoing work.
Firstly, we implemented a data collecting application for ana-
lyzing user usage patterns. Our application was written in Java
and runs on any Android-based platform. It periodically records
the following information to a log file. Currently, it is scheduled
to store the information every second.● Timestamp. The timestamp for the date and time of the
measurement.● Screen status. Whether the screen (LCD) status is in the
“ON” state or “OFF” state.● WiFi status. Whether the WiFi status is in the “ON” state
or “OFF” state.● 3G status. Whether the 3G status is in the “ON” state or
“OFF” state.● Voice call status. Whether the voice call status is in the
“ON” state or “OFF” state.● Battery status. The remaining battery power, temperature,
voltage, and charging status as reported by the Android
platform.
We also implemented a server system to collect log files
from smart phones. The data collecting application sends the
log file to the server system and then removes it from the smart
phone. When we collect log files, we also collect a device spec-
ification and a device ID by using the phone number. We do not
collect the phone number directly but convert it to a hash value,
which we are not allowed to inversely convert due to privacy
concerns. Firstly, we implemented the application on the project
homepage (Battery Logger Project, http://dpnm.postech.ac.kr/
battery) on February 17, 2011. To obtain users for the study, we
made an announcement that we were seeking anonymous vol-
unteers, using an online bulletin board for our campus, and we
posted online advertisements to social network services such as
Twitter or Facebook to obtain more users outside campus. Over-
all, we collected 40 users from March to April, 2011 (We are
still collecting usage logs for our future work). For this paper,
we used the logs from the 20 users with the longest total
recorded time. The data from these 20 users is 1.5 Gbytes and
1.26 Mbytes per log on average.
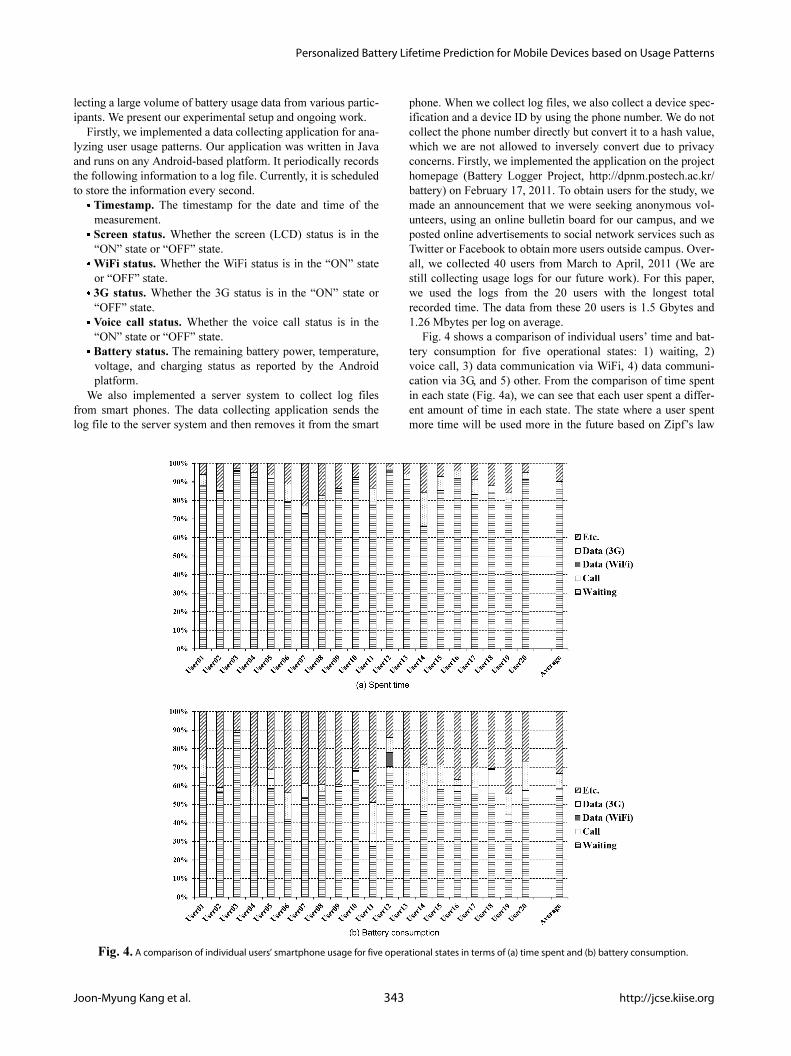
Fig. 4 shows a comparison of individual users’ time and bat-
tery consumption for five operational states: 1) waiting, 2)
voice call, 3) data communication via WiFi, 4) data communi-
cation via 3G, and 5) other. From the comparison of time spent
in each state (Fig. 4a), we can see that each user spent a differ-
ent amount of time in each state. The state where a user spent
more time will be used more in the future based on Zipf’s law
Fig. 4. A comparison of individual users’ smartphone usage for five operational states in terms of (a) time spent and (b) battery consumption.
Journal of Computing Science and Engineering, Vol. 5, No. 4, December 2011, pp. 338-345
http://dx.doi.org/10.5626/JCSE.2011.5.4.338 344 Joon-Myung Kang et al.
[10] and users have their own long-term usage patterns. Hence,
we assume that this usage pattern is one of the user’s character-
istics. The ultimate goal of our study is to make an analytic
model of user smartphone usage behavior. Fig. 4b shows the
battery power consumed in each state for individual users and
the differences between the time patterns shown in Fig. 4a. This
chart shows that battery consumption differs in each state. As
shown in Fig. 4a, most users spent more time on average in the
waiting state, but every user had their own usage pattern.
The average battery consumption rates ( ) of each state
based on the collected time-series data are as follows:
= (0.048, 0.252, 0.300, 0.132, 0.271), (14)
If the usage pattern is given as Fig. 4a, we can define for
User12, User14, and User18 as follows:
= (15)
where the row and column values represent the usage pattern of
each user and each state, respectively: column 1 is Waiting, col-
umn 2 is voice call, column 3 is WiFi, column 4 is 3G, and col-
umn 5 is other. For example, User12 spent more time in the
WiFi state than other users. User14 spent more time in the 3G
state, and User18 spent more time in the voice call state. To pre-
dict the battery lifetime of users with different usage patterns,
we compare our proposed method with a method based on a
static value derived from the arithmetic mean of all battery con-
sumption rates.
The average battery consumption rate based on the arith-
metic mean is about 0.2006. However, the following are the
average battery consumption rates for each user by our pro-
posed method.
(16)
where the average battery consumption rates of User12, User14,
and User18 are 0.058294, 0.097198, and 0.087325, respec-
tively. From this case study, we can present different battery
consumption rates for each user, based on their usage patterns.
Furthermore, we can adaptively predict the battery lifetime of a
mobile device using dynamic usage patterns.
V. CONCLUDING REMARKS
Predicting the battery lifetime of mobile devices is important
to minimize battery consumption at the application level. In this
paper, we have proposed a prediction model based on usage pat-
terns, such as the battery consumption rate when making voice
calls, using data communication, or waiting for calls. We have
also shown the usefulness of our proposed method through a
case study.
In future work, we hope to offer a more concrete validation
of this method using log data that we continue to collect from
end users. We will show usage pattern distributions, battery life-
time prediction results for each user, and comparisons with
other prediction methods. We will also develop and deploy a
mobile application to provide personalized battery management
for mobile devices including battery lifetime prediction. Ulti-
mately, we will contribute to personalized power management
for mobile devices.
ACKNOWLEDGMENTS
The authors would like to thank all the anonymous partici-
pants who contributed smartphone usage logs. This research
was supported by the World Class University (WCU) program
through the National Research Foundation of Korea (NRF)
funded by the Ministry of Education, Science and Technology
(No. R31-2010-000-10100-0) and the Ministry of Knowledge
Economy (MKE), Korea, under the Information Technology
Research Center (ITRC) support program supervised by
National IT Industry Promotion Agency (NIPA) (NIPA-2011-
C1090-1131-0009).
REFERENCES
1. S. Rollins and C. Chang-Yit, “A battery-aware algorithm for sup-
porting collaborative applications,” Collaborative Computing:
Networking, Applications and Worksharing. Lecture Notes of the
Institute for Computer Sciences, Social Informatics and Telecom-
munications Engineering, E. Bertino and J. B. D. Joshi, Eds.,
Heidelberg, Germany: Springer Berlin, 2009, pp. 594-608.
2. L. Benini, A. Bogliolo, and G. De Micheli, “Dynamic power
management of electronic systems,” Proceedings of the IEEE/
ACM International Conference on Computer-Aided Design, San
Jose, CA, 1998, pp. 696-702.
3. C. Krintz, Y. Wen, and R. Wolski, “Application-level prediction
of battery dissipation,” Proceedings of the International Sympo-
sium on Lower Power Electronics and Design, Newport Beach,
CA, 2004, pp. 224-229.
4. Intel Corporation and Microsoft Corporation, Advanced Power
Management (APM) BIOS Interface Specification Revision 1.2,
1996.
5. Compaq Computer Corporation, Intel Corporation, Microsoft
Corporation, Phoenix Technologies Ltd., and Toshiba Corpora-
tion, Advanced Configuration and Power Interface Specification,
Revision 2.0b, 2002.
6. M. Doyle, T. Fuller, and J. Newman, “Modeling of galvanostatic
charge and discharge of the lithium/polymer/insertion cell,” Jour-
nal of the Electrochemical Society, vol. 140, no. 6, pp. 1526-
1533, 1993.
7. V. Tiwari, S. Malik, A. Wolfe, and M. T. C. Lee, “Instruction
level power analysis and optimization of software,” Journal of
VLSI Signal Processing Systems, vol. 13, no. 2-3, pp. 223-238,
1996.
8. H. Saputra, M. Kandemir, N. Vijaykrishnan, M. J. Irwin, J. S.
Hu, C. H. Hsu, and U. Kremer, “Energy-conscious compilation
based on voltage scaling,” Proceedings of the Joint Conference
on Languages, Compilers and Tools for Embedded Systems and
Software and Compilers for Embedded Systems, Berlin, Ger-
B
B
p
p
0.94504 0.00527 0.01345 0.01622 0.02003
0.63739 0.00788 0 0.22672 0.12801
0.81914 0.04231 0.00001 0.00146 0.13708⎝ ⎠⎜ ⎟⎜ ⎟⎛ ⎞
,
U p BT
⋅0.058294
0.097198
0.087325⎝ ⎠⎜ ⎟⎜ ⎟⎛ ⎞
,= =
Personalized Battery Lifetime Prediction for Mobile Devices based on Usage Patterns
Joon-Myung Kang et al. 345 http://jcse.kiise.org
many, 2002, pp. 2-11.
9. V. Tiwari, S. Malik, and A. Wolfe, “Power analysis of embed-
ded software: a first step towards software power minimization,”
IEEE Transactions on Very Large Scale Integration (VLSI) Sys-
tems, vol. 2, no. 4, pp. 437-445, 1994.
10. G. K. Zipf, Human Behavior and the Principle of Least Effort:
An Introduction to Human Ecology, New York, NY: Hafner Pub-
lishing Co., 1965.
11. J. M. Kang, C. K. Park, S. S. Seo, M. J. Choi, and J. Hong,
“User-centric prediction for battery lifetime of mobile devices,”
Challenges for Next Generation Network Operations and Ser-
vice Management. Lecture Notes in Computer Science Vol. 5297,
Y. Ma, D. Choi, and S. Ata, Eds., Heidelberg, Germany: Springer
Berlin, 2008, pp. 531-534.
12. Benchmarq Microelectronics Inc., Duracell Inc., Energizer Power
Systems, Intel Corporation, Linear Technology, Maxim Inte-
grated Products, Mitsubishi Electric Corporation, National Semi-
conductor Corporation, and Toshiba Battery Co., Smart Battery
Data Specification, Revision 1.1, 1998.
13. L. Zhang, B. Tiwana, R. P. Dick, Z. Qian, Z. M. Mao, Z. Wang,
and L. Yang, “Accurate online power estimation and automatic
battery behavior based power model generation for smart-
phones,” Proceedings of the 8th IEEE/ACM International Con-
ference on Hardware/Software-Co-Design and System Synthesis,
Scottsdale, AZ, 2010, pp. 105-114.
14. R. G. Brown, Statistical Forecasting for Inventory Control, New
York, NY: McGraw-Hill, 1959.
15. P. R. Winters, “Forecasting sales by exponentially weighted mov-
ing averages,” Management Science, vol. 6, no. 3, pp. 324-342,
1960.
Joon-Myung Kang
Joon-Myung Kang ([email protected]) received his B.Sc. and Ph.D. in Computer Science and Engineeringfrom POSTECH, Pohang, Korea in 2005 and 2011, respectively. From 2000 to 2004, he worked at Alticast Corporation, asa software engineer. He was a Postdoctoral Felllow in the Dept. of Computer Science and Engineering at POSTECH,Pohang, Korea from March 2011 to September 2011. Currently, he is a Postdoctoral Fellow in the Dept. of Electrical andComputer Engineering at University of Toronto, Toronto, ON, Canada. His research interests include mobile devicemanagement, autonomic network management, personalized services, and future internet management.
Sin-seok Seo
Sin-seok Seo ([email protected]) received his B.Sc. degree in Computer Science and Engineering from Inha Universityin 2008. Currently, he is a PhD candidate in the Dept. of Computer Science and Engineering, POSTECH, Pohang, Republicof Korea. His research interests include autonomic network management and mobile device management.
James Won-Ki Hong
James Won-Ki Hong ([email protected]) is the Head and professor in the Division of IT Convergence Engineeringand Dept. of Computer Science and Engineering, POSTECH. He received a Ph.D. degree from University of Waterloo in1991 and an M.S. degree from the University of Western Ontario in 1985. His research interests include network andsystems management, distributed computing, network monitoring and analysis, and network planning. He has servedas Technical Chair (1998-2000), Vice Chair (2003-2005), and Chair (2005-present) of the IEEE ComSoc TechnicalCommittee on Network Operations and Management (CNOM). He has also served as Director of Online Content for IEEEComSoc (2004–2005). He is a NOMS/IM Steering Committee Member and a Steering Committee Member of APNOMS.He was technical co-chair of NOMS 2000 and APNOMS ’99. He was Finance Chair for IM ’09, NOMS ’06 and IM ’05, and
Finance Chair and Chair of the Local Planning Committee for NOMS ‘04. He was General Chair of APNOMS ’06 andGeneral Co-Chair of APNOMS’08 and APNOMS 2011. He was a General Co-Chair of NOMS 2010, which was held in Osaka,Japan in April 2010. He is an Associate Editor-in-Chief of IJNM and an editorial board member of IEEE TNSM, JNSM, JCN,and JTM. He is also Editor-in-Chief of KNOM Review Journal. He is a member of KICS, KNOM and KISS.