personality processes and individual...
TRANSCRIPT
PERSONALITY PROCESSES AND INDIVIDUAL DIFFERENCES IGenetic and Environmental Influences on Observed Personality:Evidence From the German Observational Study of Adult Twins
Peter BorkenauMartin-Luther-Universitat
Rainer RiemannFriedrich-Schiller-Universitat
Alois Angleitner and Frank M. SpinathUniversitat Bielefeld
Previous behavior-genetic research on adult personality relied primarily on self-reports or peer reportsthat may be subject to contrast effects, resulting in biased estimates of genetic and environmentalinfluences. In the German Observational Study of Adult Twins (GOSAT), personality traits of 168monozygotic (MZ).and 132 dizygotic (DZ) twin pairs were rated on 35 adjective scales, largely markersof the Big 5. The ratings were provided by 120 judges who never met the twins but observed videotapedbehaviors of 1 twin of each pair in 1 of 15 different settings. The aggregated video-based trait ratingswere highly reliable, and substantial correlations were obtained between MZ as well as DZ twins.Model-fit analyses suggested about 40% genetic, 25% shared environmental, and 35% nonsharedenvironmental influence. Extraversion was the only trait that seemed not to be influenced by sharedenvironment.
Numerous behavior-genetic studies suggest that individual dif-ferences in adult personality are almost exclusively accounted forby genetic and nonshared environmental influences. In a meta-analysis of behavior-genetic studies on personality, Loehlin (1992)concluded that additive effects of genes accounted for 22-46% ofthe phenotypic variance, that nonshared environment accountedfor another 44-55%, and that shared environmental influences
Peter Borkenau, Department of Psychology, Martin-Luther-Universitat,Halle, Germany; Rainer Riemann, Department of Psychology, Friedrich-Schiller-Universitat, Jena, Germany; Alois Angleitner and Frank M.Spinath, Department of Psychology, Universitat Bielefeld, Bielefeld,Germany.
This article is based on a keynote lecture given by Rainer Riemann at ajoint meeting of the Behavior Genetics Association and the InternationalSociety for the Study of Individual Differences, July 1999, Vancouver,Canada.
The research reported in this article was supported by a grant from theGerman Research Foundation (Deutsche Forschungsgemeinschaft).
We are indebted to the twins and to the judges for their participation; tothe experimenters, Susanne Hempel, Veronika Koch, Holger Lorenz,Conny Post, Beatrice Rammstedt, Birgit Schlangen, and Robert Weiss, forcollecting the data; to Holger Lorenz and Wolfgang Thiel for their help inthe data analysis; and to Jeremy Miles for power calculations.
Correspondence concerning this article should be addressed to PeterBorkenau, Department of Psychology, Martin-Luther-Universitat, D-06099Halle, Germany. Electronic mail may be sent to [email protected].
were weak, accounting for 0-11% of individual differences inpersonality. More recently, Plomin, DeFries, McClearn, and Rutter(1997) suggested that genes accounted for about 40% of thevariance in personality, that nonshared environment accounted forthe other 60%, and that there were no effects of the sharedenvironment.
Whereas it is now generally accepted that genes have a substan-tial influence on individual differences in personality, it is still apuzzle why almost all environmental influences on personalityseem to be of the nonshared variety. Shared environment is definedas environmental factors that contribute to twin and sibling simi-larity, whereas nonshared environment is defined as environmentalfactors that do not contribute to sibling similarity. Sometimes onereads that the nonshared environment makes siblings differentfrom one another, but that definition is ambiguous: Nonsharedenvironmental influence attenuates the otherwise positive correla-tions between all kinds of relatives, but it does not result innegative correlations. If negative correlations between relativesare observed, they indicate contrast effects that make relatives, orthe personality descriptions of relatives, different from oneanother (Heath, Neale, Kessler, Eaves, & Kendler, 1992; Spinath& Angleitner, 1998).
Lack of importance of the shared environment is inferred fromthree findings. First, the correlations between adoptive siblings andthose between adoptees and their adoptive parents tend to be small,usually about .05 (Loehlin, Willerman, & Horn, 1987; Plomin,Corley, Caspi, Fulker, & DeFries, 1998; Scarr, Webber, Weinberg,
Journal of Personality and Social Psychology, 2001, Vol. 80, No. 4, 655-668Copyright 2001 by the American Psychological Association, Inc. 0022-3514/01/$5.00 DOI: 10.1037//0022-3514.80.4.655
655
656 BORKENAU, RIEMANN, ANGLEITNER, AND SPINATH
& Wittig, 1981). Second, twins reared together are not systemat-ically more similar in personality than are twins reared apart(Loehlin, 1992). Finally, the correlations between monozygotic(MZ) twins tend to be twice or even more than twice as high as arethe correlations between dizygotic (DZ) twins (Loehlin, 1989,1992; Plomin, DeFries, McClearn, & Rutter, 1997), which sug-gests genetic and nonshared environmental but no shared environ-mental influence.
Psychology has reacted to these findings in several ways. Someauthors (Rowe, 1994; Harris, 1995, 1998) have suggested theoriesof peer socialization to explain why children in the same family areso different from one another. Other authors have set out todemonstrate that there are shared environmental influences on atleast some traits, such as religious orthodoxy (Beer, Arnold, &Loehlin, 1998). Finally, theorists have suggested that the impor-tance of the shared environment may be systematically underesti-mated in adoption studies, because of range restriction (Stool-miller, 1999), as well as in studies that rely on self-reports orratings by knowledgeable informants, because of contrast effects(Miles & Carey, 1997; Rose, 1995; Saudino & Eaton, 1991). Thepresent article focuses on the latter hypothesis.
Problems With Self-Reports inBehavior-Genetic Research
Almost all behavior-genetic studies on adult personality rely onself-reports (Brody, 1993). One problem with self-reports inbehavior-genetic research is that they do not allow for appropriateestimates of those sources of measurement error that actuallyattenuate the correlations between relatives. This problem haspreviously been dealt with in two ways. The first is that errorvariance and nonshared environment have not been disentangled,and their combined effects have been used as estimates of non-shared environmental influence, resulting in inflated estimates ofthis source of individual differences. Researchers have also sug-gested that twin correlations should be corrected for lack of reli-ability of the measures used, relying on coefficients of internalconsistency and of temporal stability as reliability estimates (Tel-legen et al., 1988). This latter approach suffers from the problemthat coefficients of internal consistency estimate the generalizabil-ity of personality scores across item samples, whereas measure-ment error caused by item sampling does not attenuate the corre-lations between relatives who are administered the samepersonality scales. Moreover, another source of measurement er-ror, lack of rater agreement, is not accounted for. Thus, correctionsfor unreliability of measurement that are based on the scales'internal consistencies and temporal stabilities are also notsatisfactory.
Fortunately, there are reliability estimates that are more appro-priate for studies on family resemblance in personality: As corre-lations between self-reports by relatives are correlations betweenjudgments of different target persons by different perceivers, anappropriate reliability estimate is the consensus between differentperceivers of the same targets. Obviously, this consensus cannot beestimated from self-report data alone, as there is only one con-ceivable self-observer for each person. Rather, judgments by out-side observers are required.
Research on other perception shows that consensus betweenperceivers is moderate at best, implying that the reliability problem
in behavior-genetic self-report studies may be more serious than issuggested by the scales' internal consistencies. Kenny (1994;Kenny, Albright, Malloy, & Kashy, 1994) reported consensuscorrelations of merely .15 for groups of largely unacquaintedstudents. Indeed, consensus correlations of about .40 have beenobtained in studies (e.g., Amelang & Borkenau, 1982; Borkenau &Liebler, 1993; Funder & Colvin, 1988; McCrae & Costa, 1987)that rely on ratings by acquaintances who have been nominated bythe target persons; however, even then the consensus hardly everexceeds .60. It is important to note that the correlations betweenMZ twins' personality inventory scores are of a similar size andthat the correlations between DZ twins tend to be half that size(Loehlin, 1989, 1992). From this pattern of findings, one mighteven infer that the reliable variance in self-reports of personality isalmost entirely accounted for by genetic factors, whereas the largeinfluence that is usually attributed to the nonshared environmentactually reflects error of measurement. To be clear, we do notsuggest this conclusion, as self-reports differ from peer reports andbecause judges' meaning systems (Kenny, 1994) may be geneti-cally influenced, implying that consensus may be higher betweenMZ twins than between unrelated persons. Nevertheless, theseconsiderations show that measurement error may be an importantsource of variance in behavior-genetic studies on personality.Thus, we endorse Brody's (1993) and Rose's (1995) warning thatbehavior-genetic research on adult personality should not rely onself-report data exclusively.
Peer Report Studies on Adult Twins
Peer reports by at least two independent judges per target allowone to separate reliable target variance from perceiver effects andthus overcome a drawback of self-reports. Despite that advantage,however, there are only two peer-report studies on adult person-ality in twins (Heath et al., 1992; Riemann, Angleitner, & Strelau,1997). In the study by Heath et al. (1992), 460 pairs of MZ and 366pairs of same-gender DZ twins described their own and theirtwin's extraversion and neuroticism. Genes accounted for 63% ofthe reliable variance in Neuroticism and for 73% of the reliablevariance in Extraversion, the remaining variance being accountedfor by nonshared environment. Riemann, Angleitner, and Strelau(1997) administered the German self-report version (Borkenau &Ostendorf, 1993) of Costa and McCrae's (1992) NEO Five-FactorInventory (NEO-FFI) to 660 pairs of MZ and 200 pairs of same-gender DZ twins and collected additional peer reports by twoacquaintances per twin, using the peer report version of the NEO-FFI. In their analyses, the broad-sense heritabilities of the truescores ranged from 57% to 81% for the five trait domains mea-sured by the NEO-FFI, the remaining variance being accounted forby nonshared environment. Thus, these two peer report studiessuggest that genes account for about two thirds and nonsharedenvironment accounts for the other third of the reliable variance inpeer reports of adult personality. This is quite different from the40% genetic and 60% nonshared environmental variance that areusually estimated from self-report studies (Plomin, DeFries, et al.,1997).
Contrast Effects
However, self-reports and peer reports share the problem thatthey may be subject to contrast effects. Two kinds of contrast
OBSERVATIONAL TWIN STUDY 657
effects have to be distinguished in behavior-genetic research onpersonality.
1. Relatives in general and twins in particular may mutuallyinfluence each other in ways that make their actual personalitiesdifferent from one another. An example might be different rolestaken by twins or siblings to emphasize their unique identities.
2. Apart from the relatives' actual behavioral similarity, contrasteffects may affect the similarity of their personality descriptions,because they may be compared (and may compare themselves)with each other instead of with the population mean. This kind ofrater bias would inflate the differences within and reduce thedifferences between pairs, resulting in lower correlations betweenrelatives. Such a process is quite plausible, as persons tend tocompare the targets of personality descriptions with particularother persons who come to their minds (Schwarz, 1999), and fortwins, a particularly accessible other person may be their cotwin.Consider, for example, the questionnaire item "Do you enjoygoing to parties?" that is a marker of Extraversion. Twins mayendorse this item if they enjoy parties more than their cotwin does,and they may deny it if the cotwin enjoys parties more. This wouldreduce the correlations between cotwins and result in underesti-mates of the importance of the shared environment, no matterwhether it operated in MZ and DZ twins alike or whether the effectwas stronger in DZ twins.
Both kinds of contrast effects may yield negative correlationsbetween relatives, a phenomenon that is inconsistent with thestandard behavior-genetic models that imply positive (or at leastzero) correlations between all kinds of relatives. But even for DZtwins who share half their genes in addition to their family envi-ronment, negative correlations have repeatedly been found (Heathet al., 1992), particularly if young twins were described by theirparents (Neale & Stevenson, 1989; Spinath & Angleitner, 1998).Such negative correlations indicate one or the other sort of contrasteffect.
Whereas negative correlations between relatives clearly indicatecontrast effects, positive correlations are no proof of the lack ofcontrast effects. This is because contrast effects may attenuate theusually positive correlations between relatives without turningthem negative. If contrast effects affect the actual behavior ofrelatives only, the influence of shared environment will actually bereduced and the parameter estimates will not be biased. However,if rater bias is involved, the importance of the shared environmentmay be underestimated. This makes it desirable to use personalitymeasures in twin research that may not be subject to that kind ofrater bias. That requires observational studies. Actually, not allobservational studies on relatives prevent rater bias, but they canbe designed in such a way that rater bias cannot occur.
Observational Twin and Adoption Studies
We identified about a dozen observational studies on twins andadoptees and reviewed them in another article (Borkenau, Rie-mann, Spinath, & Angleitner, 2000). In none of these studies werethe observed target persons adults. Generally, lack of shared en-vironmental influence is not as clearly suggested by these obser-vational studies as it is by studies that rely on self-reports andratings by knowledgeable informants. However, most of the ob-servational studies used small samples, and in many of these
studies, short-term external influences shared by cotwins or adopt-ees may have contributed to the similarity of their behavior.
Miles and Carey (1997) published a meta-analysis on geneticand environmental influences on human aggression and concludedthat shared environmental effects seemed to be stronger for obser-vational than for rating measures. However, their meta-analysisincluded only two observational studies on aggression in children.Moreover, they did not find the behavioral measures of aggressionconvincing, arguing that "perhaps one or both of the studiescapitalized on state-specific, reciprocal influences of twin or adop-tive dyads when they were tested at the same time" (p. 213).
Thus, the answer to the question of whether there is sharedenvironmental influence on children's behavior is still open. How-ever, even if observational studies on children conveyed a clearmessage, any straightforward inference from these studies to adultpersonality would be questionable: Behavior-genetic evidencesuggests that genetic and environmental influences on humanbehavior change across the life span and that shared environmentalinfluence decreases with age (McCartney, Harris, & Bernieri,1990; Plomin, DeFries, et al., 1997). Thus, observational behavior-genetic studies on adult personality are highly desirable. This wasthe prime reason that we started the German Observational Studyof Adult Twins (GOSAT).
Method
A comprehensive description of the procedure and the data that werecollected in GOSAT has been published elsewhere (Spinath et al., 1999).Therefore, we describe only those measures here for which results arereported below.
Participants
Three hundred pairs of adult twins (168 MZ and 132 DZ) who had beenrecruited from all over Germany by reports in German media participatedin GOSAT. They were invited for a 1-day testing session that took place atthe University of Bielefeld in Germany. The participants were reimbursedfor their travel expenses and received a flat rate of 30 DM, (approximately$15) per person for catering. Women (234 pairs) participated more fre-quently than men did (66 pairs), with gender not significantly associatedwith zygosity, ^ ( 1 , N = 300) = 2.00, p = .16. The twins' age variedbetween 18 and 70 years, with a mean of 34.28 (SD = 12.99) and a medianof 30.5 years. An analysis of variance (ANOVA) showed that neithergender nor zygosity nor their interaction was significantly related to theparticipants' age, all Fs £ 1.
Zygosity Diagnosis
For 248 twin pairs, zygosity diagnosis was based on semiautomatedgenome mapping on 5 highly polymorphic dinucleotide repeat marker loci(Becker et al., 1997), with the probability of misclassifying DZ as MZtwins less than 0.9%. For 35 twin pairs, zygosity determination relied onsemiautomated genome mapping on 10 highly polymorphic dinucleotiderepeat marker loci, with an according error rate of less than 0.1%. Theremaining 17 pairs were classified on the basis of questionnaire measures(Oniszczenko, Angleitner, Strelau, & Angert, 1993) or physical similaritydata, with an estimated error rate of 7.0%. The total proportion of correctzygosity diagnoses in GOSAT is therefore close to 99.0%.
Measures
Self-reports and peer reports. Most of the GOSAT twin pairs hadpreviously participated in the peer rating study reported by Riemann et al.

658 BORKENAU, RIEMANN, ANGLEITNER, AND SPINATH
(1997), in which they had been administered, among others, the Germanversion of Costa and McCrae's (1992) NEO-FFI. The NEO-FFI measuresthe personality domains Neuroticism, Extraversion, Openness to Experi-ence, Agreeableness, and Conscientiousness with 12 items each. Moreover,each twin had been described by two acquaintances who differed betweencotwins, using the peer-report version of the NEO-FFI, in which the itemsare worded in the third person instead of the first person singular. A fewtwin pairs had not participated in the peer rating study, but for most of thesepairs, self-reports and peer reports could be collected in GOSAT.
Videotaped behavior sequences. A main goal of GOSAT was to obtainreliable and valid personality measures of twins that could not be subjectto rater bias. We achieved this by (a) videotaping the twins in 15 settingsin which they had to complete different tasks, (b) presenting these video-tapes to judges who never met the twins they described, and (c) neverletting a judge of 1 twin observe the cotwin as well.
Because it was desirable to collect personality descriptions by strangersthat were highly informative of the targets' actual personality, we wantedto have the twins complete tasks in which personality differences werelikely to become observable. Assessment centers are confronted withsimilar problems, as they have to predict the aptitude of testees forpositions in organizations from short-term behavior observations in struc-tured settings. Thus, we made use of the literature on assessment centers.Specifically, our tasks included the following (with average duration inparentheses):
1. Introduce oneself (1.25 min).2. Arrange three photographs in a meaningful order and tell an interesting
story that the three pictures might illustrate (4.50 min).3. Tell dramatic stories about three cards from Murray's (1943) Thematic
Apperception Test (6.00 min).4. Tell a joke to an experimental confederate (1.50 min).5. Persuade an "obstinate neighbor" (actually a confederate) on the phone
to reduce the volume of her stereo after 11 PM (2.25 min).6. Refuse a request for help by "a friend" (actually a confederate) who
says that she has just had a car accident (2.00 min).7. Introduce oneself to a stranger (an experimental confederate) and tell
her about one's hobbies after the confederate has introduced herself(12.00 min).
8. Recall objects that one has just seen in a waiting room (3.00 min).9. Solve a complex logical problem as fast as possible. Another "partic-
ipant" (actually the confederate) received the same problem and os-tensibly "solved" it at an enormous speed (4.50 min).
10. Introduce the stranger from Setting 4 to the experimenter (2.50 min).11. Invent a "definition" for a neologism and provide arguments for why
that definition would be appropriate (6.25 min).12. Rig up a high and stable paper tower within 5 min, using scissors,
paper, and glue only (5.25 min).13. Read 14 newspaper headlines and their subtitles aloud (3.00 min).14. Describe multiple uses of a brick, using pantomime only (2.75 min).15. Sing a song of one's choice (1.00 min).
Approximately 60 min of videotapes per participant, or about 600 hrs ofvideotapes altogether, were collected this way.
Video-based personality ratings. Numerous judges provided trait rat-ings of the twins, relying solely on these videotapes. To increase thereliability of the trait ratings, each twin was observed in each setting byfour independent judges. Moreover, the behavior in different settings wasrated by different panels of four judges to secure independence of ratingsfor different settings. Finally, different panels of judges were employed fortwins from the same pair to prevent contrast effects in twin perception.Thus, 4 (parallel judgments) X 15 (number of settings) X 2 (cotwins) =120 judges were employed, each of them providing ratings of 300 persons.All judges were students either of the University of Bielefeld or of theUniversity of Halle and were paid for their participation.
The judges provided by a computer their ratings on 35 bipolar 5-pointratings scales. Each of Goldberg's (1990) Big Five factors (i.e., Extraver-sion, Agreeableness, Conscientiousness, Emotional Stability, and Intellect)was represented by 4 scales, and 4 additional scales were included tomeasure Openness to Experience (McCrae & Costa, 1987). The selectionof these 24 scales relied on a large trait-taxonomic study of the Germanpersonality-descriptive language by Ostendorf (1990). Two of the 4 scalesthat measured each factor were reverse scored to control for acquiescenceresponse set. Moreover, ratings of the targets' attractiveness and likeabilitywere included, mainly to control for the higher expected similarity of MZtwins in physical attractiveness. The remaining 9 adjective scales differedbetween the 15 settings and were included to account for setting-specificbehavior that is not dealt with in this article.
The judges' work stations were equipped with a video recorder, a videomonitor, and a computer. The judges were instructed to watch a videosequence for 1 twin and then provide the 35 trait ratings for that twin usingthe computer keyboard, then restart the video recorder to watch 1 twin fromanother pair, and so forth, until they had provided ratings of 300 persons, 1twin of each pair. The computer had been programmed (a) to present the 35adjective scales in a random order that differed between video sequencesand (b) to store the judges' responses. Previous to the ratings of the twins,we checked the judges' understanding of the instruction through somepractice trials for which an extra videotape displaying other target personswas used. Altogether, we collected 1.26 million video-based ratings thisway, taking more than 4,100 hrs for observation and ratings.
Ratings by experimenters and confederates. The twins were also de-scribed by the experimenter and the confederate, using the peer-ratingversion of the NEO-FFI. The (always female) confederate was involved insix observational settings (Setting 4-Setting 9), and she provided herdescriptions when she had interacted with the target for about 1 hr. Theexperimenter described the target at the end of the observation day afterabout 6 hrs of interaction and observation. Whereas the experimenter sawboth cotwins of a pair (although 1 much longer than the other), theconfederate met only 1 twin sibling.
Data Analyses
Control for covariates. Twin correlations were computed not only forthe unconnected scores but also for three types of residuals. Following asuggestion by McGue and Bouchard (1984), we first regressed all person-ality scores on the twins' age and gender, as these biographical variablesinflate correlations between same-gender twins for those personality traitswith which they are correlated. Second, we additionally regressed thevideo-based ratings on the targets' perceived physical attractiveness, as itmay substantially affect personality ratings by outside observers (Kenny,1994), who are influenced by an attractiveness stereotype in the sense that"what is beautiful is good" (Dion, Berscheid, & Walster, 1972, p. 289). Asthe averaged attractiveness ratings correlated .67 for MZ twins but .28 forDZ twins when age and gender were controlled, an attractiveness stereo-type might have inflated the MZ-DZ differences and, thus, the heritabilityestimates. As these regression analyses were run at the level of theindividual judges, the mean of the residualized ratings by each judge foreach trait was zero, implying that systematic perceiver effects were alsocontrolled. Specifically, the video-based ratings by a particular judge wereregressed on the physical attractiveness ratings by that judge, whereas thepersonality descriptions by the experimenters and their confederates (whodid not provide attractiveness ratings) were regressed on the averagedattractiveness ratings by the judges who provided the video-based ratings.The reliability of these averaged attractiveness ratings (intraclass correla-tion [ICC] 1, 60, according to the taxonomy of ICCs suggested by Shrout& Fleiss, 1979) was .96. Finally, the video-based ratings were adjusted forsystematic effects of the experimenters, using dummy codings (West,Aiken, & Krull, 1996). As cotwins were always taken care of by differentexperimenters, experimenter effects would otherwise have reduced the twin

OBSERVATIONAL TWIN STUDY 659
correlations. Altogether, seven experimenters were involved in GOSAT,each of them taking care of between 28 and 133 twins.
Aggregation of video-based ratings. The unconnected and the residu-alized scores obtained from the video-based personality ratings were ag-gregated in several steps. First, they were averaged within the 15 settingsand within the 35 adjective scales across the four judges who had beenexposed to the same behavioral information. Second, for the 26 adjectivescales that had been administered to describe the twins' behavior in all 15settings, the composite scores from Step 1 were averaged across the 15settings. For 11 twin pairs, one or a few videotaped behavior sequences inindividual settings were not available for technical reasons, but for no twinpair were more than three sequences missing. In these cases, we averagedthe ratings for 12 to 14 settings. Third, we averaged the video-basedpersonality ratings for these 26 adjective scales across seven settings(Settings 1, 3, 5, 7, 9, 11, and 13; i.e., the odd settings) and across eightsettings (Settings 2, 4, 6, 8, 10, 12, 14, and 15; i.e., the even settings) toobtain two independent reliable indicators for each latent phenotype. Thismade it possible for us to run multivariate latent-phenotype models thatseparated measurement error from nonshared environmental influence.Fourth, we averaged the composite scores from Step 1 across thoseadjectives that referred to the same personality domain, yielding setting-specific domain scores for Extraversion, Agreeableness, Conscientious-ness, Emotional Stability, Openness to Experience, and Intellect. Usuallywe aggregated four adjectives per personality domain, but for EmotionalStability, it turned out that the scale even-tempered did not correlate withthe other three scales. Therefore, only the three correlating markers ofEmotional Stability were combined. Finally, we averaged the compositescores for the six personality domains across the odd settings, across theeven settings, and across all 15 settings, resulting in global measures of thesix personality domains.
Results
Reliability and Convergent Validity of Measures
The interrater reliabilities of the peer reports, experimenterratings, and video-based personality ratings (at the highest level ofaggregation) are reported in Table 1. As the mean correlationbetween the descriptions by two peers was .40, these scores wereaveraged, and the reliability of this composite score (ICC 1, 2) isreported. The average ICC between the trait descriptions by ex-perimenters and confederates was .42, and therefore their descrip-tions were also combined. The latter ratings are henceforth referredto as experimenter ratings.
Table 1Reliabilities of Peer Reports, Experimenter Ratings,and Video-Based Personality Ratings
Trait
ExtraversionAgreeablenessConscientiousnessEmotional StabilityIntellectOpenness to Experience
Peer ratingsr2
.64
.50
.53
.58
.59
Experimenterratings
r2
.64
.52
.57
.54
.67
Video-basedratings
rw
.96
.93
.92
.94
.95
.93
Note. All ratings were partialed for the twins' age and gender, and theexperimenter ratings and video-based personality ratings were also par-tialed for target attractiveness and experimenter effects.
Table 1 shows that error of measurement was substantial in thedescriptions by peers and experimenters: Even the reliabilities ofthe averaged descriptions did not exceed .67. By comparison, thereliabilities of the video-based personality ratings, aggregatedacross all 15 settings, varied around .94, reflecting the largenumber of judges involved. For the subsets of odd settings andeven settings, the interrater reliabilities for the domain scoresvaried from .86 to .93, qualifying them as useful indicators formultivariate latent phenotype analyses.
The correlations between self-descriptions, averaged peer de-scriptions, averaged experimenter ratings, and video-based person-ality ratings (at the highest level of aggregation) are reported inTable 2. Evidently, the correlations between the self-descriptionsand peer descriptions were high, given the limited reliability ofthese data. However, these correlations may have been inflated bycommunication between informants. The correlations of the video-based personality ratings with the ratings by experimenters werealso high, in view of the limited reliability of the experimenterratings. In contrast to self-peer agreement, however, inflation ofthese correlations by communication between judges was ruledout; rather, they reflected similar independent inferences from thetwins' observed behavior. By comparison, the correlations of theself- and peer reports with the experimenter and video-basedpersonality ratings were lower. This may reflect either that thetwins' behavior on the observation day was not representative oftheir everyday behavior or that the twins and their peers usedstandards of comparison for their trait inferences that differed fromthe standards that were applied by the experimenters and thejudges who provided the video-based personality ratings. It isimportant to note that if self- and peer reports of twins weredistorted by rater bias, this would attenuate their correlations withmeasures that are not subject to rater bias.
Factor Structure of the Video-Based Personality Ratings
The video-based ratings for different trait domains were morehighly correlated among each other than is usually found forself-reports and peer reports. This is consistent with findings byBorkenau and Liebler (1993) that personality impressions becomemore complex the more the perceivers are acquainted with thetargets. We ran a principal components analysis of the 24 setting-unspecific residualized composite scores (controlled for age, gen-der, attractiveness, and experimenter effects and aggregated acrossobservers and observational settings), and the first six eigenvalueswere 10.67, 5.44, 3.79, 1.33, 0.79, and 0.49. The first unrotatedfactor accounted for 44% of the variance, the first four factors for88%, and the first six factors for 94%. We then rotated four factors(on the basis of the eigenvalue criterion) or six factors (on the basisof the origin of our rating scales) using a direct oblimin procedurewith delta set to zero. We chose an oblique rotation, as the factorsOpenness to Experience and Intellect were assumed to be corre-lated from the beginning. The rotated six-factor solution is re-ported in Table 3.
The four markers of Openness to Experience had loadingsbeyond .90 on Factor 1, the four markers of Conscientiousness hadloadings beyond .90 on Factor 2, the four markers of Agreeable-ness had loadings beyond .90 on Factor 3, three of the four markersof Emotional Stability had loadings beyond .80 on Factor 4, thefour markers of Extraversion had loadings beyond .90 on Factor 5,

660 BORKENAU, RIEMANN, ANGLEITNER, AND SPINATH
Table 2Correlations Among the Self-Descriptions and the Averaged Peer Descriptions, Experimenter Ratings, and Video-Based Ratings
Trait
ExtraversionAgreeablenessConscientiousnessEmotional StabilityOpenness to Experience
Self XPeer
.63
.50
.45
.52
.53
Self XExperimenter
.39
.21
.19
.22
.43
Self XVideo-Based
.30
.22
.08
.13
.30
Correlated ratings
Peer XExperimenter
.41
.28
.21
.36
.41
Peer XVideo-Based
.38
.26
.17
.22
.32
Experimenter XVideo-Based
.63
.42
.58
.52
.49
Note. Correlations beyond .08 are significant at p < .05.
and three of the four markers of Intellect had loadings beyond .80on Factor 6. In addition to these extremely high loadings by sets ofmarker variables, however, there were also substantial loadings byother adjectives. Thus, although the six trait domains could bedistinguished in the structure matrix, the criteria for simple struc-ture were clearly missed, reflecting the high correlations betweenratings for different trait domains. When four instead of six factorswere rotated, one factor combined Openness to Experience andIntellect and another factor combined Extraversion and EmotionalStability, whereas Agreeableness and Conscientiousness formedseparate factors. Given this somewhat vague factor structure of thevideo-based ratings, the behavior-genetic analyses were run not
Table 3Oblimin-Rotated Structure Matrix of the Video-Based RatingsControlling for Target Age, Gender, Attractiveness,and Experimenter Effects
Adjective
FrankActiveTalkativeGregariousAssertiveCalmSelf-confidentEven-temperedKindPoliteAgreeablePleasantThoroughNeatConscientiousSystematicInventiveImaginativeOriginalCreativeRefinedIntelligentSophisticatedFlexible
1
.67
.74
.56
.57
.57
.44
.58-.47
.31
.12
.27
.36
.29
.14
.22
.28
.96
.97
.92
.96
.15
.56
.65
.90
2
.01
.15-.05-.17
.35
.36
.34
.15
.16
.41
.25
.36
.96
.96
.96
.95
.40
.37-.02
.35
.76
.72
.59
.32
3
- .04- .08-.14-.14-.10- .08
.13
.49-.95-.91-.95-.93- .30- .23- .36-.17-.31- .34- .14- .32- .40- .25- .10- .35
Factor
4
.51
.43
.25
.27
.84
.94
.82
.42- .28- .25-.19- .08
.22
.37
.16
.38
.31
.24
.24
.24-.07
.28
.26
.39
5
-.94-.91-.98-.97- .66-.41-.67
.68-.26- .02- .13- .29-.01
.11
.07
.00-.59- .58- .66- .54
.06-.17- .24-.65
6
.01
.20
.01- .10
.28
.21
.28
.09
.09
.39
.11
.20
.67
.61
.65
.64
.39
.38
.17
.41
.88
.88
.87
.32
Note. The ratings were aggregated across the 15 settings and across thefour observers per setting. Marker variables are in italics.
only at the level of the six trait domains but also at the level ofthe 24 individual adjectives.
Behavior-Genetic Analyses of the Video-BasedPersonality Ratings
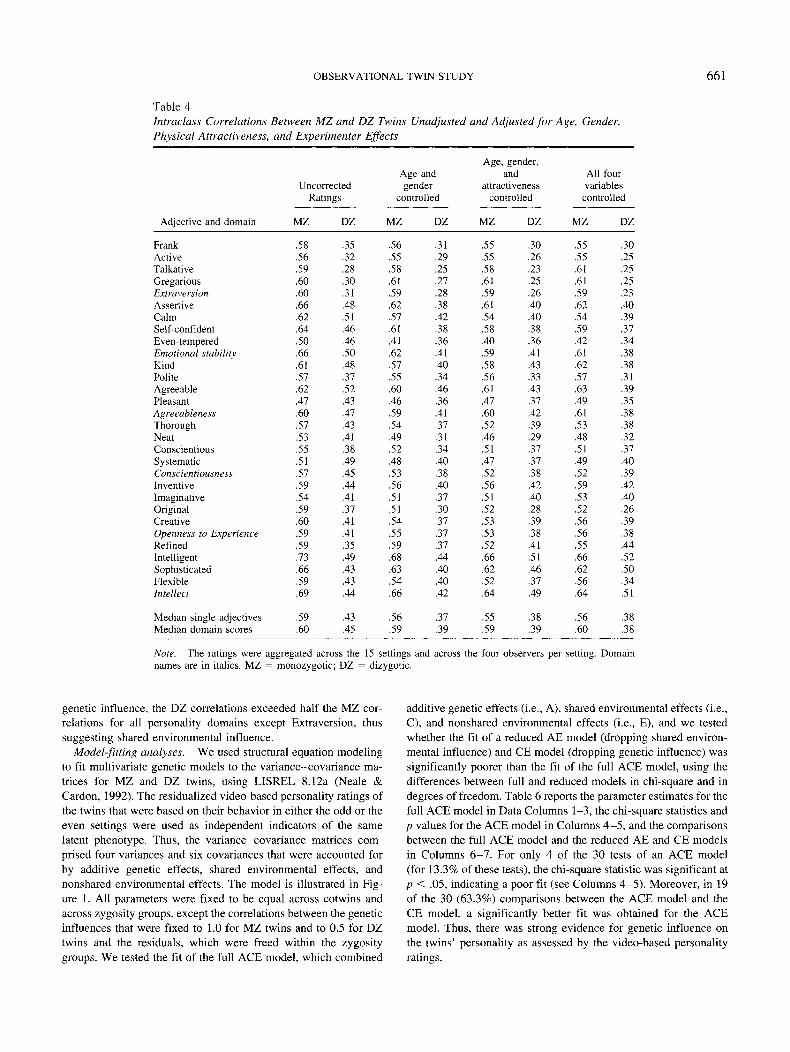
Twin correlations. The ICCs between MZ twins and DZ twinswere calculated for the uncorrected video-based personality ratingsas well as for the residualized scores, controlling for (a) target ageand gender, (b) target age, target gender, and target attractiveness,and (c) target age, target gender, target attractiveness, and exper-imenter effects. These twin correlations (all relying on ratingsaggregated across the 15 settings and the four observers persetting) are reported in Table 4; the last two rows report the mediantwin correlations separately for the 24 single adjectives and the sixdomain scores. Whereas the twin correlations between the unad-justed ratings were somewhat higher than the residualized ratings,the other adjustments changed the median twin correlations by .02at best. Estimates of shared environmental influence, using theformula c2 = 2rDZ - rMZ (Loehlin & Nichols, 1976), where c1 isthe parameter estimate of the effects of the shared environment andrDZ and rMZ are the median ICCs for DZ and MZ twins, resultedin the highest estimates if based on the uncorrected ratings,whereas the estimates from the three kinds of residualized scoreswere very similar to each other. In the ensuing analyses, we rely onthe residualized scores that control for target age, gender, andattractiveness as well as experimenter effects.
Table 5 reports the interrater reliabilities and the ICCs betweenMZ and DZ twins separately for the 7 odd settings, the 8 evensettings, and all 15 settings. Thus, the last two columns of Table 4and of Table 5 are identical. The interrater reliabilities predict theICC of the averaged rating by 28 (odd settings), 32 (even settings),or 60 (all settings) judges with averaged ratings by the samenumber of hypothetical judges who observed the same targets.This is a useful standard of comparison for the correlations be-tween cotwins who were observed by different panels of judges:The differences between the reliability coefficients and the MZcorrelations estimate the contribution of the nonshared environ-ment apart from error of measurement. As the reliabilities of thevideo-based personality ratings were about .35 higher than the MZcorrelations, nonshared environmental influence turned out to besubstantial even when measurement error was controlled.
Another notable feature in Table 5 is that although the MZcorrelations were higher than the DZ correlations, suggesting
OBSERVATIONAL TWIN STUDY 661
Table 4Intraclass Correlations Between MZ and DZ Twins Unadjusted and Adjusted for Age, Gender,Physical Attractiveness, and Experimenter Effects
Adjective and domain
FrankActiveTalkativeGregariousExtraversionAssertiveCalmSelf-confidentEven-temperedEmotional stabilityKindPoliteAgreeablePleasantAgreeablenessThoroughNeatConscientiousSystematicConscientiousnessInventiveImaginativeOriginalCreativeOpenness to ExperienceRefinedIntelligentSophisticatedFlexibleIntellect
Median single adjectivesMedian domain scores
UncorrectedRatings
MZ
.58
.56
.59
.60
.60
.66
.62
.64
.50
.66
.61
.57
.62
.47
.60
.57
.53
.55
.51
.57
.59
.54
.59
.60
.59
.59
.73
.66
.59
.69
.59
.60
DZ
.35
.32
.28
.30
.31
.48
.51
.46
.46
.50
.48
.37
.52
.43
.47
.43
.41
.38
.49
.45
.44
.41
.37
.41
.41
.35
.49
.43
.43
.44
.43
.45
Age andgender
controlled
MZ
.56
.55
.58
.61
.59
.62
.57
.61
.41
.62
.57
.55
.60
.46
.59
.54
.49
.52
.48
.53
.56
.51
.51
.54
.55
.59
.68
.63
.54
.66
.56
.59
DZ
.31
.29
.25
.27
.28
.38
.42
.38
.36
.41
.40
.34
.46
.36
.41
.37
.31
.34
.40
.38
.40
.37
.30
.37
.37
.37
.44
.40
.40
.42
.37
.39
Age, gender,and
attractivenesscontrolled
MZ
.55
.55
.58
.61
.59
.61
.54
.58
.40
.59
.58
.56
.61
.47
.60
.52
.46
.51
.47
.52
.56
.51
.52
.53
.53
.52
.66
.62
.52
.64
.55
.59
DZ
.30
.26
.23
.25
.26
.40
.40
.38
.36
.41
.43
.33
.43
.37
.42
.39
.29
.37
.37
.38
.42
.40
.28
.39
.38
.41
.51
.46
.37
.49
.38
.39
All:fourvariablescontrolled
MZ
.55
.55
.61
.61
.59
.62
.54
.59
.42
.61
.62
.57
.63
.49
.61
.53
.48
.51
.49
.52
.59
.53
.52
.56
.56
.55
.66
.62
.56
.64
.56
.60
DZ
.30
.25
.25
.25
.23
.40
.39
.37
.34
.38
.38
.31
.39
.35
.38
.38
.32
.37
.40
.39
.42
.40
.26
.39
.38
.44
.52
.50
.34
.51
.38
.38
Note. The ratings were aggregated across the 15 settings and across the four observers per setting. Domainnames are in italics. MZ = monozygotic; DZ = dizygotic.
genetic influence, the DZ correlations exceeded half the MZ cor-relations for all personality domains except Extraversion, thussuggesting shared environmental influence.
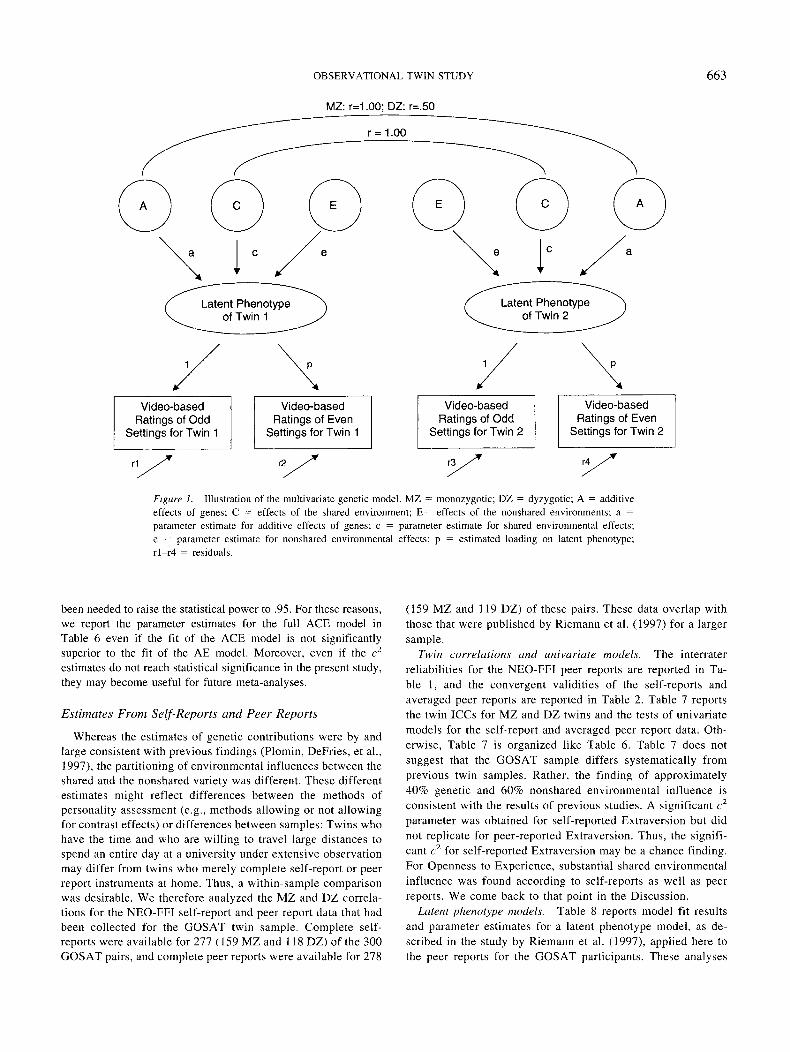
Model-fitting analyses. We used structural equation modelingto fit multivariate genetic models to the variance- covariance ma-trices for MZ and DZ twins, using LISREL 8.12a (Neale &Cardon, 1992). The residualized video-based personality ratings ofthe twins that were based on their behavior in either the odd or theeven settings were used as independent indicators of the samelatent phenotype. Thus, the variance-covariance matrices com-prised four variances and six covariances that were accounted forby additive genetic effects, shared environmental effects, andnonshared environmental effects. The model is illustrated in Fig-ure 1. All parameters were fixed to be equal across cotwins andacross zygosity groups, except the correlations between the geneticinfluences that were fixed to 1.0 for MZ twins and to 0.5 for DZtwins and the residuals, which were freed within the zygositygroups. We tested the fit of the full ACE model, which combined
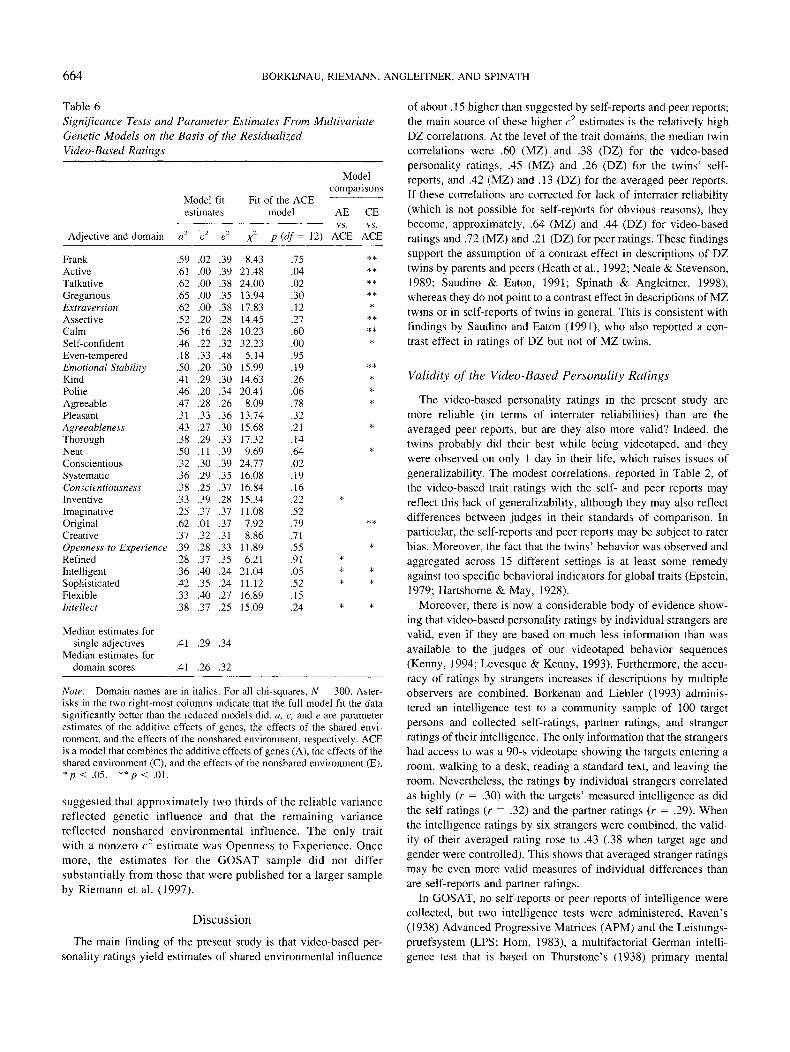
additive genetic effects (i.e., A), shared environmental effects (i.e.,C), and nonshared environmental effects (i.e., E), and we testedwhether the fit of a reduced AE model (dropping shared environ-mental influence) and CE model (dropping genetic influence) wassignificantly poorer than the fit of the full ACE model, using thedifferences between full and reduced models in chi-square and indegrees of freedom. Table 6 reports the parameter estimates for thefull ACE model in Data Columns 1-3, the chi-square statistics andp values for the ACE model in Columns 4-5, and the comparisonsbetween the full ACE model and the reduced AE and CE modelsin Columns 6-7. For only 4 of the 30 tests of an ACE model(for 13.3% of these tests), the chi-square statistic was significant atp < .05, indicating a poor fit (see Columns 4-5). Moreover, in 19of the 30 (63.3%) comparisons between the ACE model and theCE model, a significantly better fit was obtained for the ACEmodel. Thus, there was strong evidence for genetic influence onthe twins' personality as assessed by the video-based personalityratings.
662 BORKENAU, RIEMANN, ANGLEITNER, AND SPINATH
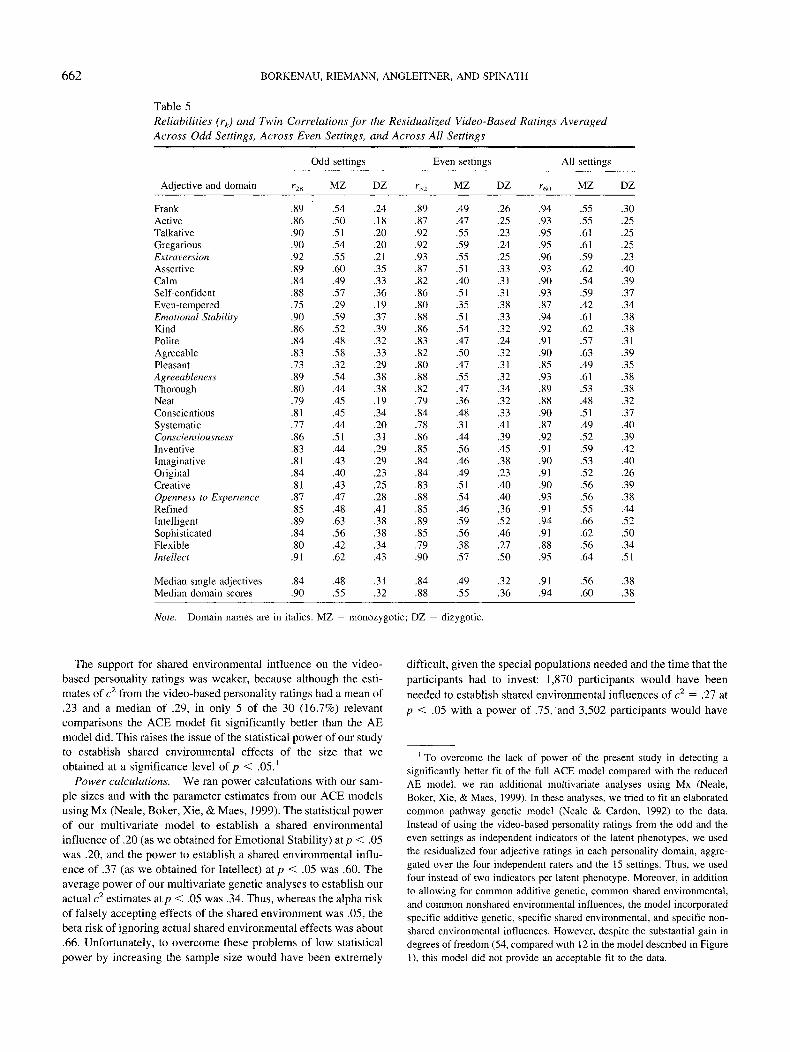
Table 5Reliabilities (rk) and Twin Correlations for the Residualized Video-Based Ratings AveragedAcross Odd Settings, Across Even Settings, and Across All Settings
Adjective and domain
FrankActiveTalkativeGregariousExtroversionAssertiveCalmSelf-confidentEven-temperedEmotional StabilityKindPoliteAgreeablePleasantAgreeablenessThoroughNeatConscientiousSystematicConscientiousnessInventiveImaginativeOriginalCreativeOpenness to ExperienceRefinedIntelligentSophisticatedFlexibleIntellect
Median single adjectivesMedian domain scores
r28
.89
.86
.90
.90
.92
.89
.84
.88
.75
.90
.86
.84
.83
.73
.89
.80
.79
.81
.77
.86
.83
.81
.84
.81
.87
.85
.89
.84
.80
.91
.84
.90
Odd settings
MZ
.54
.50
.51
.54
.55
.60
.49
.57
.29
.59
.52
.48
.58
.32
.54
.44
.45
.45
.44
.51
.44
.43
.40
.43
.47
.48
.63
.56
.42
.62
.48
.55
DZ
.24
.18
.20
.20
.21
.35
.33
.36
.19
.37
.39
.32
.33
.29
.38
.38
.19
.34
.20
.31
.29
.29
.23
.25
.28
.41
.38
.38
.34
.43
.31
.32
.89
.87
.92
.92
.93
.87
.82
.86
.80
.88
.86
.83
.82
.80
.88
.82
.79
.84
.78
.86
.85
.84
.84
.83
.88
.85
.89
.85
.79
.90
.84
.88
Even settings
MZ
.49
.47
.55
.59
.55
.51
.40
.51
.35
.51
.54
.47
.50
.47
.55
.47
.36
.48
.31
.44
.56
.46
.49
.51
.54
.46
.59
.56
.38
.57
.49
.55
DZ
.26
.25
.23
.24
.25
.33
.31
.31
.38
.33
.32
.24
.32
.31
.32
.34
.32
.33
.41
.39
.45
.38
.23
.40
.40
.36
.52
.46
.27
.50
.32
.36
.94
.93
.95
.95
.96
.93
.90
.93
.87
.94
.92
.91
.90
.85
.93
.89
.88
.90
.87
.92
.91
.90
.91
.90
.93
.91
.94
.91
.88
.95
.91
.94
All settings
MZ
.55
.55
.61
.61
.59
.62
.54
.59
.42
.61
.62
.57
.63
.49
.61
.53
.48
.51
.49
.52
.59
.53
.52
.56
.56
.55
.66
.62
.56
.64
.56
.60
DZ
.30
.25
.25
.25
.23
.40
.39
.37
.34
.38
.38
.31
.39
.35
.38
.38
.32
.37
.40
.39
.42
.40
.26
.39
.38
.44
.52
.50
.34
.51
.38
.38
Note. Domain names are in italics. MZ = monozygotic; DZ = dizygotic.
The support for shared environmental influence on the video-based personality ratings was weaker, because although the esti-mates of c2 from the video-based personality ratings had a mean of.23 and a median of .29, in only 5 of the 30 (16.7%) relevantcomparisons the ACE model fit significantly better than the AEmodel did. This raises the issue of the statistical power of our studyto establish shared environmental effects of the size that weobtained at a significance level of p < .05.'
Power calculations. We ran power calculations with our sam-ple sizes and with the parameter estimates from our ACE modelsusing Mx (Neale, Boker, Xie, & Maes, 1999). The statistical powerof our multivariate model to establish a shared environmentalinfluence of .20 (as we obtained for Emotional Stability) atp < .05was .20, and the power to establish a shared environmental influ-ence of .37 (as we obtained for Intellect) at p < .05 was .60. Theaverage power of our multivariate genetic analyses to establish ouractual c2 estimates atp < .05 was .34. Thus, whereas the alpha riskof falsely accepting effects of the shared environment was .05, thebeta risk of ignoring actual shared environmental effects was about.66. Unfortunately, to overcome these problems of low statisticalpower by increasing the sample size would have been extremely
difficult, given the special populations needed and the time that theparticipants had to invest: 1,870 participants would have beenneeded to establish shared environmental influences of c2 = .27 atp < .05 with a power of .75, and 3,502 participants would have
1 To overcome the lack of power of the present study in detecting asignificantly better fit of the full ACE model compared with the reducedAE model, we ran additional multivariate analyses using Mx (Neale,Boker, Xie, & Maes, 1999). In these analyses, we tried to fit an elaboratedcommon pathway genetic model (Neale & Cardon, 1992) to the data.Instead of using the video-based personality ratings from the odd and theeven settings as independent indicators of the latent phenotypes, we usedthe residualized four adjective ratings in each personality domain, aggre-gated over the four independent raters and the 15 settings. Thus, we usedfour instead of two indicators per latent phenotype. Moreover, in additionto allowing for common additive genetic, common shared environmental,and common nonshared environmental influences, the model incorporatedspecific additive genetic, specific shared environmental, and specific non-shared environmental influences. However, despite the substantial gain indegrees of freedom (54, compared with 12 in the model described in Figure1), this model did not provide an acceptable fit to the data.
OBSERVATIONAL TWIN STUDY
MZ: r=1.00; DZ: r=.50
663
Latent Phenotypeof Twin 1
Latent Phenotypeof Twin 2
Video-basedRatings of Odd
Settings for Twin 1
Video-basedRatings of Even
Settings for Twin 1
Video-basedRatings of Odd
Settings for Twin 2
Video-basedRatings of Even
Settings for Twin 2
r1 r2 r3 r4
Figure 1. Illustration of the multivariate genetic model. MZ = monozygotic; DZ = dyzygotic; A = additiveeffects of genes; C = effects of the shared environment; E= effects of the nonshared environments; a =parameter estimate for additive effects of genes; c = parameter estimate for shared environmental effects;e = parameter estimate for nonshared environmental effects; p = estimated loading on latent phenotype;rl-r4 = residuals.
been needed to raise the statistical power to .95. For these reasons,we report the parameter estimates for the full ACE model inTable 6 even if the fit of the ACE model is not significantlysuperior to the fit of the AE model. Moreover, even if the c2
estimates do not reach statistical significance in the present study,they may become useful for future meta-analyses.
Estimates From Self-Reports and Peer Reports
Whereas the estimates of genetic contributions were by andlarge consistent with previous findings (Plomin, DeFries, et al.,1997), the partitioning of environmental influences between theshared and the nonshared variety was different. These differentestimates might reflect differences between the methods ofpersonality assessment (e.g., methods allowing or not allowingfor contrast effects) or differences between samples: Twins whohave the time and who are willing to travel large distances tospend an entire day at a university under extensive observationmay differ from twins who merely complete self-report or peerreport instruments at home. Thus, a within-sample comparisonwas desirable. We therefore analyzed the MZ and DZ correla-tions for the NEO-FFI self-report and peer report data that hadbeen collected for the GOSAT twin sample. Complete self-reports were available for 277 (159 MZ and 118 DZ) of the 300GOSAT pairs, and complete peer reports were available for 278
(159 MZ and 119 DZ) of these pairs. These data overlap withthose that were published by Riemann et al. (1997) for a largersample.
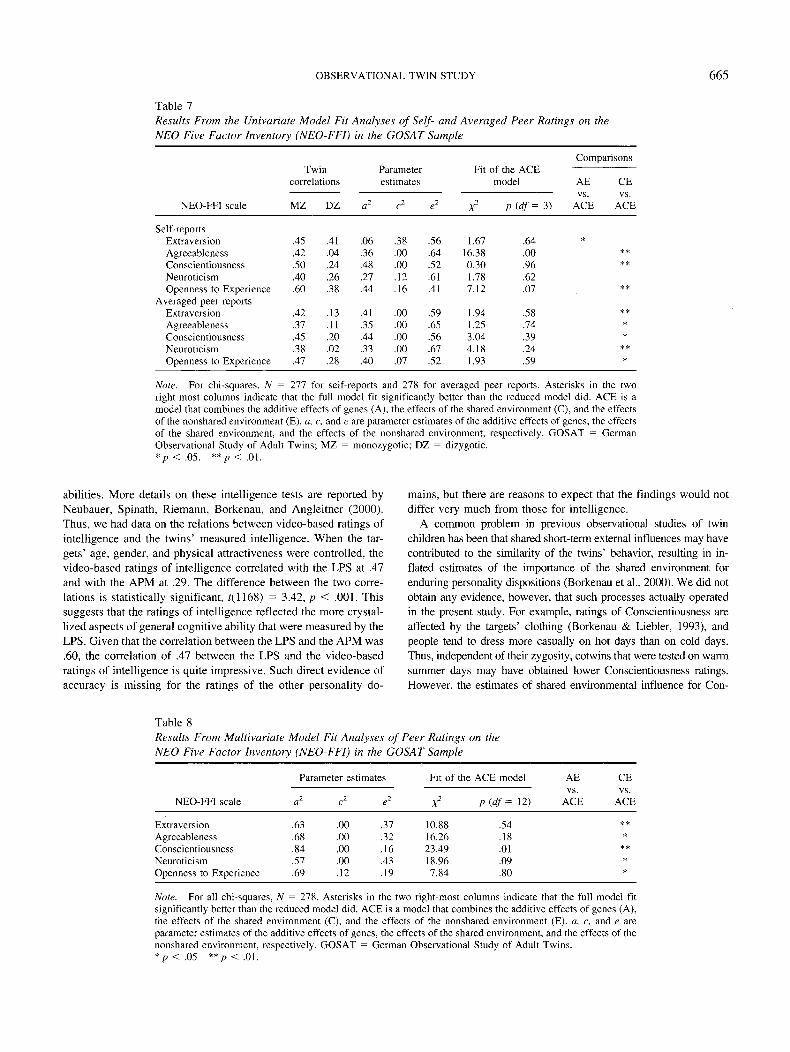
Twin correlations and univariate models. The interraterreliabilities for the NEO-FFI peer reports are reported in Ta-ble 1, and the convergent validities of the self-reports andaveraged peer reports are reported in Table 2. Table 7 reportsthe twin ICCs for MZ and DZ twins and the tests of univariatemodels for the self-report and averaged peer report data. Oth-erwise, Table 7 is organized like Table 6. Table 7 does notsuggest that the GOSAT sample differs systematically fromprevious twin samples. Rather, the finding of approximately40% genetic and 60% nonshared environmental influence isconsistent with the results of previous studies. A significant c2
parameter was obtained for self-reported Extraversion but didnot replicate for peer-reported Extraversion. Thus, the signifi-cant c1 for self-reported Extraversion may be a chance finding.For Openness to Experience, substantial shared environmentalinfluence was found according to self-reports as well as peerreports. We come back to that point in the Discussion.
Latent phenotype models. Table 8 reports model fit resultsand parameter estimates for a latent phenotype model, as de-scribed in the study by Riemann et al. (1997), applied here tothe peer reports for the GOSAT participants. These analyses
664 BORKENAU, RIEMANN, ANGLEITNER, AND SPINATH
Table 6Significance Tests and Parameter Estimates From MultivariateGenetic Models on the Basis of the ResidualizedVideo-Based Ratings
Adjective and domain
FrankActiveTalkativeGregariousExtroversionAssertiveCalmSelf-confidentEven-temperedEmotional StabilityKindPoliteAgreeablePleasantAgreeablenessThoroughNeatConscientiousSystematicConscientiousnessInventiveImaginativeOriginalCreativeOpenness to ExperienceRefinedIntelligentSophisticatedFlexibleIntellect
Median estimates forsingle adjectives
Median estimates fordomain scores
Moaei fitestimates
a2
.59
.61
.62
.65
.62
.52
.56
.46
.18
.50
.41
.46
.47
.31
.43
.38
.50
.32
.36
.38
.33
.25
.62
.37
.39
.28
.36
.42
.33
.38
.41
.41
c2
.02
.00
.00
.00
.00
.20
.16
.22
.33
.20
.29
.20
.28
.33
.27
.29
.11
.30
.29
.25
.39
.37
.01
.32
.28
.37
.40
.35
.40
.37
.29
.26
e1
.39
.39
.38
.35
.38
.28
.28
.32
.48
.30
.30
.34
.26
.36
.30
.33
.39
.39
.35
.37
.28
.37
.37
.31
.33
.35
.24
.24
.27
.25
.34
.32
Fit
x2
8.4321.4824.0013.9417.8314.4510.2332.235.14
15.9914.6320.41
8.0913.7415.6817.329.69
24.7716.0816.8415.3411.087.928.86
11.896.21
21.0411.1216.8915.09
of the ACEmodel
p(df= 12)
.75
.04
.02
.30
.12
.27
.60
.00
.95
.19
.26
.06
.78
.32
.21
.14
.64
.02
.19
.16
.22
.52
.79
.71
.55
.91
.05
.52
.15
.24
Modelcomparisons
AE CE
vs. vs.ACE ACE
*******#******
****
*
*
*
* *
Note. Domain names are in italics. For all chi-squares, N = 300. Aster-isks in the two right-most columns indicate that the full model fit the datasignificantly better than the reduced models did. a, c, and e are parameterestimates of the additive effects of genes, the effects of the shared envi-ronment, and the effects of the nonshared environment, respectively. ACEis a model that combines the additive effects of genes (A), the effects of theshared environment (C), and the effects of the nonshared environment (E).*p<.05. ** />< .01 .
suggested that approximately two thirds of the reliable variancereflected genetic influence and that the remaining variancereflected nonshared environmental influence. The only traitwith a nonzero c2 estimate was Openness to Experience. Oncemore, the estimates for the GOSAT sample did not differsubstantially from those that were published for a larger sampleby Riemann et al. (1997).
Discussion
The main finding of the present study is that video-based per-sonality ratings yield estimates of shared environmental influence
of about .15 higher than suggested by self-reports and peer reports;the main source of these higher c2 estimates is the relatively highDZ correlations. At the level of the trait domains, the median twincorrelations were .60 (MZ) and .38 (DZ) for the video-basedpersonality ratings, .45 (MZ) and .26 (DZ) for the twins' self-reports, and .42 (MZ) and .13 (DZ) for the averaged peer reports.If these correlations are corrected for lack of interrater reliability(which is not possible for self-reports for obvious reasons), theybecome, approximately, .64 (MZ) and .44 (DZ) for video-basedratings and .72 (MZ) and .21 (DZ) for peer ratings. These findingssupport the assumption of a contrast effect in descriptions of DZtwins by parents and peers (Heath et al., 1992; Neale & Stevenson,1989; Saudino & Eaton, 1991; Spinath & Angleitner, 1998),whereas they do not point to a contrast effect in descriptions of MZtwins or in self-reports of twins in general. This is consistent withfindings by Saudino and Eaton (1991), who also reported a con-trast effect in ratings of DZ but not of MZ twins.
Validity of the Video-Based Personality Ratings
The video-based personality ratings in the present study aremore reliable (in terms of interrater reliabilities) than are theaveraged peer reports, but are they also more valid? Indeed, thetwins probably did their best while being videotaped, and theywere observed on only 1 day in their life, which raises issues ofgeneralizability. The modest correlations, reported in Table 2, ofthe video-based trait ratings with the self- and peer reports mayreflect this lack of generalizability, although they may also reflectdifferences between judges in their standards of comparison. Inparticular, the self-reports and peer reports may be subject to raterbias. Moreover, the fact that the twins' behavior was observed andaggregated across 15 different settings is at least some remedyagainst too specific behavioral indicators for global traits (Epstein,1979; Hartshorne & May, 1928).
Moreover, there is now a considerable body of evidence show-ing that video-based personality ratings by individual strangers arevalid, even if they are based on much less information than wasavailable to the judges of our videotaped behavior sequences(Kenny, 1994; Levesque & Kenny, 1993). Furthermore, the accu-racy of ratings by strangers increases if descriptions by multipleobservers are combined. Borkenau and Liebler (1993) adminis-tered an intelligence test to a community sample of 100 targetpersons and collected self-ratings, partner ratings, and strangerratings of their intelligence. The only information that the strangershad access to was a 90-s videotape showing the targets entering aroom, walking to a desk, reading a standard text, and leaving theroom. Nevertheless, the ratings by individual strangers correlatedas highly (r = .30) with the targets' measured intelligence as didthe self-ratings (r = .32) and the partner ratings (r = .29). Whenthe intelligence ratings by six strangers were combined, the valid-ity of their averaged rating rose to .43 (.38 when target age andgender were controlled). This shows that averaged stranger ratingsmay be even more valid measures of individual differences thanare self-reports and partner ratings.
In GOSAT, no self-reports or peer reports of intelligence werecollected, but two intelligence tests were administered, Raven's(1938) Advanced Progressive Matrices (APM) and the Leistungs-pruefsystem (LPS; Horn, 1983), a multifactorial German intelli-gence test that is based on Thurstone's (1938) primary mental
OBSERVATIONAL TWIN STUDY 665
Table 7Results From the Univariate Model Fit Analyses of Self- and Averaged Peer Ratings on theNEO Five Factor Inventory (NEO-FFI) in the GOSAT Sample
NEO-FFI scale
Self-reportsExtraversionAgreeablenessConscientiousnessNeuroticismOpenness to Experience
Averaged peer reportsExtraversionAgreeablenessConscientiousnessNeuroticismOpenness to Experience
Twincorrelations
MZ
.45
.42
.50
.40
.60
.42
.37
.45
.38
.47
DZ
.41
.04
.24
.26
.38
.13
.11
.20
.02
.28
a2
.06
.36
.48
.27
.44
.41
.35
.44
.33
.40
Parameterestimates
c2
.38
.00
.00
.12
.16
.00
.00
.00
.00
.07
e2
.56
.64
.52
.61
.41
.59
.65
.56
.67
.52
Fit
x2
1.6716.380.301.787.12
1.941.253.044.181.93
of the ACEmodel
p(df=3)
.64
.00
.96
.62
.07
.58
.74
.39
.24
.59
Comparisons
AE
vs.ACE
CE
vs.ACE
#**
Note. For chi-squares, N = 277 for self-reports and 278 for averaged peer reports. Asterisks in the tworight-most columns indicate that the full model fit significantly better than the reduced model did. ACE is amodel that combines the additive effects of genes (A), the effects of the shared environment (C), and the effectsof the nonshared environment (E). a, c, and e are parameter estimates of the additive effects of genes, the effectsof the shared environment, and the effects of the nonshared environment, respectively. GOSAT = GermanObservational Study of Adult Twins; MZ = monozygotic; DZ = dizygotic.* p < .05. ** p < .01.
abilities. More details on these intelligence tests are reported byNeubauer, Spinath, Riemann, Borkenau, and Angleitner (2000).Thus, we had data on the relations between video-based ratings ofintelligence and the twins' measured intelligence. When the tar-gets' age, gender, and physical attractiveness were controlled, thevideo-based ratings of intelligence correlated with the LPS at .47and with the APM at .29. The difference between the two corre-lations is statistically significant, f(1168) = 3.42, p < .001. Thissuggests that the ratings of intelligence reflected the more crystal-lized aspects of general cognitive ability that were measured by theLPS. Given that the correlation between the LPS and the APM was.60, the correlation of .47 between the LPS and the video-basedratings of intelligence is quite impressive. Such direct evidence ofaccuracy is missing for the ratings of the other personality do-
mains, but there are reasons to expect that the findings would notdiffer very much from those for intelligence.
A common problem in previous observational studies of twinchildren has been that shared short-term external influences may havecontributed to the similarity of the twins' behavior, resulting in in-flated estimates of the importance of the shared environment forenduring personality dispositions (Borkenau et al., 2000). We did notobtain any evidence, however, that such processes actually operatedin the present study. For example, ratings of Conscientiousness areaffected by the targets' clothing (Borkenau & Liebler, 1993), andpeople tend to dress more casually on hot days than on cold days.Thus, independent of their zygosity, cotwins that were tested on warmsummer days may have obtained lower Conscientiousness ratings.However, the estimates of shared environmental influence for Con-
Table 8Results From Multivariate Model Fit Analyses of Peer Ratings on theNEO Five Factor Inventory (NEO-FFI) in the GOSAT Sample
NEO-FFI scale
ExtraversionAgreeablenessConscientiousnessNeuroticismOpenness to Experience
Parameter estimates
a2
.63
.68
.84
.57
.69
c2
.00
.00
.00
.00
.12
e2
.37
.32
.16
.43
.19
Fit of the
x2
10.8816.2623.4918.967.84
ACE model
p(df = 12)
.54
.18
.01
.09
.80
AE
vs.ACE
CE
vs.ACE
*****
*
Note. For all chi-squares, N = 278. Asterisks in the two right-most columns indicate that the full model fitsignificantly better than the reduced model did. ACE is a model that combines the additive effects of genes (A),the effects of the shared environment (C), and the effects of the nonshared environment (E). a, c, and e areparameter estimates of the additive effects of genes, the effects of the shared environment, and the effects of thenonshared environment, respectively. GOSAT = German Observational Study of Adult Twins.* p < . 0 5 ** />< .01 .

666 BORKENAU, RIEMANN, ANGLE1TNER, AND SPINATH
scientiousness were not particularly high, and they were lower forneat than for thorough and systematic. Thus, clothing is unlikely tohave inflated the twin correlations.
Another factor that is to be discussed is whether the twins'attitude toward our study might have raised the twin correlations.Indeed, as cotwins were invited as pairs and arrived on the sameday, they probably talked about our study. However, it is unlikelythat twin pairs with an unfavorable attitude participated at all,given that they had to spend 1 or 2 days to participate in a researchproject in which they obtained no material gratification. It istherefore to be expected that all participants had a favorableattitude and that the small remaining differences had no noticeableeffect on differences in their behavior.
Differences Between Personality Domains
Generally, the video-based personality ratings suggest moreshared environmental influence than do the self-reports and peerreports. But there are also differences between personality do-mains. Thus, we did not find any shared environmental influenceon Extraversion. This is consistent with the results of Loehlins's(1989, 1992) meta-analyses, which identified Extraversion as thedomain that was least influenced by the shared environment.Moreover, the lack of shared environmental influence on Extra-version in our study shows that there is no general bias that inflatedthe DZ-twin correlations.
The trait domain that was most strongly influenced by sharedenvironment was Intellect, which raises the issue of whether sub-stantial shared environmental influence on Intellect is also found ifit is measured by intelligence tests. In his model-fitting meta-analysis of studies on family resemblance in IQ, Loehlin (1989)concluded that environments shared by twins account for 39% oftheir individual differences in IQ. Admittedly, there is some con-sensus now that this estimate relies largely on studies of intelli-gence in children and should not be generalized to adults, as theimportance of shared environment for IQ tends to decrease withage (McCartney et al., 1990; Plomin, Fulker, Corley, & DeFries,1997; Wilson, 1983). Thus, it is useful to look at the intelligencetest data that were collected for the GOSAT sample.
In a behavior-genetic analysis of these data that is reported indetail by Neubauer et al. (2000), no shared environmental influ-ence on Raven's APM was found. It is important to note, however,that the APM was less strongly related to the video-based ratingsof Intellect than was the LPS. Thus, the behavior-genetic findingsfor the LPS are of greater interest here. Shared environmentaccounted for 24% of the variance in the LPS scores (Neubauer etal., 2000), thus supporting the assumption that the video-basedratings of Intellect reflect actual shared environmental influence onthis trait.
Limitations of the Twin Design
It is widely known that the twin design has several limitations,as it relies on three assumptions that can only be tested withadditional data: (a) the equal environments assumption, (b) theassumption of random mating, and (c) the assumption that thereare no interactive effects of genes. If the equal environmentsassumption does not hold, environmental effects are misinterpretedas genetic effects, resulting in underestimates of the importance of
the shared environment. Similarly, interactive effects of genes aredetected by twin studies only if they overrule all possible effects ofthe shared environment and result in MZ correlations that exceedtwice the DZ correlations. Otherwise, interactive effects of genesresult in overestimates of additive genetic influence and underes-timates of shared environmental influence. Consequently, our es-timates of shared environment would be too low if there wereunequal environments for MZ and DZ twins or interactive effectsof genes.
Assortative mating has opposite effects, in that it increases theDZ but not the MZ correlation and thus inflates the estimates ofshared environmental influence (Jensen, 1978). Assortative matingfor personality traits like Extraversion, Agreeableness, Conscien-tiousness, and Emotional Stability is low, but it is substantial forintelligence and social attitudes (Beer et al., 1998; Buss, 1985) thatmay be related to Openness to Experience. Thus, it would bedesirable to have an observational adoption study that is notplagued by interactive effects of genes and effects of assortativemating.
If some reasonable assumptions are made, however, one canestimate whether our findings of shared environment for Opennessto Experience and for Intellect might reflect assortative mating. Letus assume that assortative mating for Openness to Experience andfor Intellect is .35 (Bouchard & McGue, 1981), that there are nointeractive effects of genes, and that the heritabilities of Opennessto Experience and of Intellect are a2 = .50, where a2 is theparameter estimate of the additive effects of genes (we estimatedheritabilities of less than .40, but these might be underestimates,because of the assumption of random mating). According to Loeh-lin (1989), the phenotypic correlation between DZ twins that is dueto additive effects of shared genes would no longer be .5a2 = .25,as it would be if mating were random, but .5a2(l + a2m), wherem refers to the coefficient of assortative mating. Using our esti-mates, the correlation between DZ twins would then become .50 X.50 X (1 + .50 X .35) = .294, whereas the MZ correlation that isnot affected by assortative mating would be .50. Thus, we wouldexpect an MZ correlation that is 1.7 times the DZ correlation.According to Table 5, however, the MZ correlation is 1.47 (.56 /.38) times the DZ correlation for Openness to Experience and 1.25(.64 / .51) times the DZ correlation for Intellect. Thus, even ifreasonable estimates of assortative mating are taken into consid-eration, the present study still suggests some shared environmentalinfluence. Obviously, these estimates are subject to sampling error,and replication of these findings by another study is highlydesirable.
Need of Awareness of Measurement Issues
A more general conclusion from our study is that behavior-genetic research needs a widened awareness of assessment issues.Wahlsten (1999) recently pointed to the need of more carefulbehavioral testing in animal behavior research, but that argumentis probably also true for human behavior-genetic research. Geneticresearch has its roots mainly in biology and in medicine, wheremeasurement issues cause less problems than in psychology. How-ever, when it comes to the genetics of personality, where the dataare self-reports and observer ratings, awareness of psychometricprinciples and of social-psychological evidence on person percep-
OBSERVATIONAL TWIN STUDY 667
tion are indispensable, and multimethod studies that incorporatesuch considerations become highly desirable.
References
Amelang, M., & Borkenau, P. (1982). Ueber die faktorielle Struktur undexterne Validitaet einiger Fragebogen-Skalen zur Erfassung von Dimen-sionen der Extraversion und emotionalen Labilitaet [On the factor struc-ture and external validity of some inventory scales for measuring extra-version and emotional lability]. Zeitschrift fuer Differentielle undDiagnostische Psychologie, 3, 119-146.
Becker, A., Busjahn, A., Faulhaber, H. -D., Baehring, S., Robertson, J.,Schuster, H., & Luft, F. C. (1997). Twin zygosity: Automated determi-nation with microsatellites. Journal of Reproductive Medicine, 42, 260-266.
Beer, J. M, Arnold, R. D., & Loehlin, J. C. (1998). Genetic and environ-mental influences on MMPI factor scales: Joint model fitting to twin andadoption data. Journal of Personality and Social Psychology, 74, 818—827.
Borkenau, P., & Liebler, A. (1993). Convergence of stranger ratings ofpersonality and intelligence with self-ratings, partner ratings, and mea-sured intelligence. Journal of Personality and Social Psychology, 65,546-553.
Borkenau, P., & Ostendorf, F. (1993). NEO-Fuenf-Faktoren-Inventar(NEO-FFI) nach Costa und McCrae [NEO Five-Factor Inventory byCosta & McCrae]. Goettingen, Germany: Hogrefe.
Borkenau, P., Riemann, R., Spinath, F. M, & Angleitner, A. (2000).Behavior-genetics of personality: The case of observational studies. In I.Mervielde (Series Ed.) & S. E. Hampson (Vol. Ed.), Advances inpersonality psychology (Vol. 1, pp. 107-137). Philadelphia: Taylor &Francis.
Bouchard, T. J., & McGue, M. (1981). Familial studies of intelligence.Science, 212, 1055-1059.
Brody, N. (1993). Intelligence and the behavioral genetics of personality.In R. Plomin & G. E. McClearn (Eds.), Nature, nurture, and psychology(pp. 161-178). Washington, DC: American Psychological Association.
Buss, D. M. (1985). Human mate selection. American Scientist, 73, 47-51.Costa, P. T., & McCrae, R. R. (1992). Revised NEO Personality Inventory
(NEO-PI-R) and NEO Five-Factor Inventory (NEO-FFI) professionalmanual. Odessa, FL: Psychological Assessment Resources.
Dion, K., Berscheid, E., & Walster, E. (1972). What is beautiful is good.Journal of Personality and Social Psychology, 24, 285-290.
Epstein, S. (1979). The stability of behavior: I. On predicting most of thepeople much of the time. Journal of Personality and Social Psychol-ogy, 37, 1097-1126.
Funder, D. C, & Colvin, C. R. (1988). Friends and strangers: Acquain-tanceship, agreement, and the accuracy of personality judgment. Journalof Personality and Social Psychology, 55, 149-158.
Goldberg, L. R. (1990). An alternative "description of personality": Thebig-five factor structure. Journal of Personality and Social Psychol-ogy, 59, 1216-1229.
Harris, J. R. (1995). Where is the child's environment? A group socializa-tion theory of development. Psychological Review, 102, 458-489.
Harris, J. R. (1998). The nurture assumption: Why children turn out theway they do. New York: The Free Press.
Hartshorne, H., & May, M. A. (1928). Studies in the nature of character:I. Studies in deceit. New York: MacMillan.
Heath, A. C, Neale, M. C , Kessler, R. C , Eaves, L. J., & Kendler, K. S.(1992). Evidence for genetic influences on personality from self-reportsand informant ratings. Journal of Personality and Social Psychology, 63,85-96.
Horn, W. (1983). Performance Testing System [Leistungspruefsystem].Gottingen, Germany: Hogrefe.
Jensen, A. R. (1978). Genetic and behavioral effects of nonrandom mating.
In R. T. Osborne, C. E. Noble, & N. Weyl (Eds.), Human variation: Thebiopsychology of age, race, and sex (pp. 51-105). New York: AcademicPress.
Kenny, D. A. (1994). Interpersonal perception: A social relations analysis.New York: Guilford Press.
Kenny, D. A., Albright, L., Malloy, T. E., & Kashy, D. A. (1994).Consensus in interpersonal perception: Acquaintance and the big five.Psychological Bulletin, 116, 245-258.
Levesque, M. J., & Kenny, D. A. (1993). Accuracy of behavioral predic-tions at zero acquaintance: A social relations analysis. Journal of Per-sonality and Social Psychology, 65, 1178-1187.
Loehlin, J. C. (1989). Partitioning environmental and genetic contributionsto behavioral development. American Psychologist, 44, 1285-1292.
Loehlin, J. C. (1992). Genes and environment in personality development.Newbury Park, CA: Sage.
Loehlin, J. C, & Nichols, R. C. (1976). Heredity, environment, andpersonality. Austin, TX: University of Texas Press.
Loehlin, J. C, Willerman, L., & Horn, J. M. (1987). Personality resem-blance in adoptive families: A 10-year-following-up. Journal of Person-ality and Social Psychology, 53, 961-969.
McCartney, K., Harris, M. J., & Bernieri, F. (1990). Growing up andgrowing apart: A developmental meta-analysis of twin studies. Psycho-logical Bulletin, 107, 226-237.
McCrae, R. R., & Costa, P. T. (1987). Validation of the five factor modelof personality across instruments and observers. Journal of Personalityand Social Psychology, 52, 81-90.
McGue, M., & Bouchard, T. J. (1984). Adjustment of twin data for theeffects of age and sex. Behavior Genetics, 14, 325-343.
Miles, D. R., & Carey, G. (1997). Genetic and environmental architectureof human aggression. Journal of Personality and Social Psychology, 72,207-217.
Murray, H. A. (1943). Thematic apperception test manual. Cambridge,MA: Harvard University Press.
Neale, M. C, Boker, S. M, Xie, G., & Maes, H. H. (1999). Mx: Statisticalmodeling (5th Ed.) [Computer software]. Richmond, VA: Department ofPsychiatry, Virginia Commonwealth University.
Neale, M. C , & Cardon, L. R. (1992). Methodology for genetic studies oftwins and families. Dordrecht, the Netherlands: Kluwer.
Neale, M. C, & Stevenson, J. (1989). Rater bias in the EASI temperamentscales: A twin study. Journal of Personality and Social Psychology, 56,446-455.
Neubauer, A. C , Spinath, F. M., Riemann, R., Borkenau, P., & Angleitner,A. (2000). Genetic and environmental influences on two measures ofspeed of information processing and their relation to psychometricintelligence. Intelligence, 26, 267-289.
Oniszczenko, W., Angleitner, A., Strelau, J., & Angert, T. (1993). Thequestionnaire of twins' physical resemblance. Unpublished manuscript,University of Warsaw, Poland.
Ostendorf, F. (1990). Sprache und Persoenlichkeitsstruktur: Zur Validitaetdes Fuenf-Faktoren-Modells der Persoenlichkeit [Language and person-ality structure: On the validity of the five-factor model of personality].Regensburg, Germany: Roderer.
Plomin, R., Corley, R., Caspi, A., Fulker, D. W., & DeFries, J. C. (1998).Adoption results for self-reported personality: Evidence for nonadditiveeffects? Journal of Personality and Social Psychology, 75, 211-218.
Plomin, R., DeFries, J. C , McClearn, G. E., & Rutter, M. (1997). Behav-ioral genetics. New York: Freeman.
Plomin, R., Fulker, D. W., Corley, R., & DeFries, J. C. (1997). Nature,nurture, and cognitive development from 1 to 16 years: A parent-offspring adoption study. Psychological Science, 8, 442-447.
Raven, J. C. (1938). Progressive matrices. London: Lewis.Riemann, R., Angleitner, A., & Strelau, J. (1997). Genetic and environ-
mental influences on personality: A study of twins reared together using

668 BORKENAU, RIEMANN, ANGLEITNER, AND SPINATH
the self- and peer report NEO-FFI scales. Journal of Personality, 65,449-475.
Rose, R. (1995). Genes and human behavior. Annual Review of Psychol-ogy, 46, 625-654.
Rowe, D. C. (1994). The limits of family influence: Genes, experience, andbehavior. New York: Guilford Press.
Saudino, K. J., & Eaton, W. O. (1991). Infant temperament and genetics:An objective twin study of motor activity level. Child Development, 62,1167-1174.
Scarr, S., Webber, P. L., Weinberg, R. A., & Wittig, M. A. (1981).Personality resemblance among adolescents and their parents in biolog-ically related and adoptive families. Journal of Personality and SocialPsychology, 40, 885-898.
Schwarz, N. (1999). Self-reports: How the questions shape the answers.American Psychologist, 54, 93-105.
Shrout, P. E., & Fleiss, J. L. (1979). Intraclass correlations: Uses inassessing rater reliability. Psychological Bulletin, 86, 420-428.
Spinath, F. M., & Angleitner, A. (1998). Contrast effects in Buss andPlomin's EAS questionnaire: A behavioral genetic study on early de-veloping personality traits assessed through parental ratings. Personalityand Individual Differences, 25, 947-963.
Spinath, F. M., Riemann, R., Hempel, S., Schlangen, B., Weiss, R.,Borkenau, P., & Angleitner, A. (1999). A day in the life: Description ofthe German Observational Study of Adult Twins (GOSAT) assessing
twin similarity in controlled laboratory settings. In I. Mervielde, I.Deary, F. de Fruyt, & F. Ostendorf (Eds.), Personality psychology inEurope (Vol. 7, pp. 311-333). Tilburg, the Netherlands: Tilburg Uni-versity Press.
Stoolmiller, M. (1999). Implications of the restricted range of familyenvironments for estimates of heritability and nonshared environment inbehavior-genetic adoption studies. Psychological Bulletin, 125, 392-409.
Tellegen, A., Lykken, D. T., Bouchard, T. J., Wilcox, K. J., Segal, N. L.,& Rich, S. (1988). Personality similarity in twins reared apart andtogether. Journal of Personality and Social Psychology, 54, 1031-1039.
Thurstone, L. L. (1938). Primary mental abilities. Chicago: University ofChicago Press.
Wahlsten, D. (1999). Single-gene influences on brain and behavior. AnnualReview of Psychology, 50, 599-624.
West, S. G., Aiken, L. S., & Krull, J. L. (1996). Experimental personalitydesigns: Analyzing categorical by continuous variable interactions.Journal of Personality, 64, 1-48.
Wilson, R. S. (1983). The Louisville Twin Study: Developmental synchro-nies in behavior. Child Development, 54, 298-316.
Received November 22, 1999Revision received September 15, 2000
Accepted October 1, 2000 •