personal, national and societal attitudes of israeli youth
TRANSCRIPT

Personal, National and Societal
Attitudes of Israeli Youth
The 4th Youth Study of the Friedrich-Ebert-Stiftung
December 2016
Edited by Dr. Roby Nathanson and Itamar Gazala

Table of Contents
Preface ...............................................................................................................................1
Chapter 1: Periodic Demographic Data on Teenagers and Young People in Israel Dr.
Roby Nathanson, Itamar Gazala and Ron Leyzer ........................................................5
General Data .......................................................................................................................... 5
Sector and Religion ............................................................................................................... 7
Education ............................................................................................................................. 10
From Education to Employment ......................................................................................... 13
Exclusion and Poverty ......................................................................................................... 16
Summary ............................................................................................................................. 20
Bibliography ........................................................................................................................ 22
Chapter 2: Teenagers and Young People – What Do They Think of Themselves and
What Do They Think of the State? Findings of a Survey
Dr. Mina Zemach ...........................................................................................................23
Aims of the Research .......................................................................................................... 23
Methodology ....................................................................................................................... 24
Findings ............................................................................................................................... 27
Appendix: Link with Socio-Demographic Characteristics .................................................. 72
Chapter 3: Summary of the findings of the qualitative study – personal, national and
social positions of teenagers and young people
Michal Shapira ...............................................................................................................86
Background and Aims ......................................................................................................... 86
Methodology and Population .............................................................................................. 86
Main Findings in the Jewish Sector ..................................................................................... 87
Main Findings in the Arab Sector ....................................................................................... 96
Chapter 4: Teenagers and Young People of Israel, Yesterday and Today: Comparison
of Public Opinion Trends over Time
Dr. Dahlia Scheindlin ...................................................................................................102
Introduction ....................................................................................................................... 102
1. Who Are the Youth Now Compared to the Past? .......................................................... 103
2. Mood: Optimism Declining for Jews, Rising for Arabs? .............................................. 107
3. Sense of Security: Falling .............................................................................................. 109
4. Trust in State Institutions............................................................................................... 110
5. Social Relations in Israel ............................................................................................... 115
6. The Holocaust ................................................................................................................ 119
Conclusion ......................................................................................................................... 121

List of Tables
Chapter 1: Periodic Demographic Data on Teenagers and Young People in Israel
Table 1: Average Gross Income (NIS) per month and per hour worked for Salaried Employees 15-24 years old,
by sex, 2015 ........................................................................................................................................................... 19
Chapter 2: Teenagers and Young People – What Do They Think of Themselves and What Do They
Think of the State? Findings of a Survey
Table 2: Employment situation ............................................................................................................................. 28
Table 3: Economic support ................................................................................................................................... 29
Table 4: Ideological positioning ........................................................................................................................... 31
Table 5: Level of religiosity .................................................................................................................................. 31
Table 6: Goals in life – mark two main goals ....................................................................................................... 32
Table 7: Goals in life, ranked by order of importance .......................................................................................... 33
Table 8: Sense of belonging .................................................................................................................................. 35
Table 9: Level of economic security ..................................................................................................................... 37
Table 10: Level of exposure to personal violence ................................................................................................ 38
Table 11: Threat to personal security or of those close to you ............................................................................. 38
Table 12: General level of security ....................................................................................................................... 39
Table 13: Perceptions about the likelihood of achieving goals ............................................................................. 41
Table 14: Level of importance attributed to giving basic rights to minorities ...................................................... 43
Table 15: Level of importance attributed to freedom of expression ..................................................................... 43
Table 16: Democratic principles against needs of state security........................................................................... 44
Table 17: Profile of values desired by the state .................................................................................................... 45
Table 18: Other values – summary table .............................................................................................................. 50
Table 19: Profile of the State of Israel by indicators relating to democracy, according to interviewees'
perceptions ............................................................................................................................................................. 51
Table 20: Trust in government institutions ........................................................................................................... 54
Table 21: Trust in government institutions, ranked in order ................................................................................. 58
Table 22: The most important problems that the government must deal with ...................................................... 59
Table 23: The disputes that most endanger Israeli society .................................................................................... 60
Table 24: The most important problems that the government has to deal with, ranked in order .......................... 61
Table 25: The disputes that most endanger Israeli society, ranked in order ......................................................... 62
Table 26: Optimism or pessimism about the future of the state ............................................................................ 63
Table 27: Positions on Jewish-Arab coexistence .................................................................................................. 65
Table 28: Level of preoccupation with the Holocaust .......................................................................................... 67
Table 29: Perceptions about Germany today ........................................................................................................ 68
Table 30: Economic support from parents ............................................................................................................ 72
Table 31: Goals in life .......................................................................................................................................... 73
Table 32: Sense of belonging ................................................................................................................................ 74
Table 33: Sense of security ................................................................................................................................... 74
Table 34: Perceptions about the likelihood of achieving goals ............................................................................. 77
Table 35: Importance of democratic values and preferences for security needs and democratic requirements .... 77
Table 36: Assessments about the presence of various democratic characteristics in the State of Israel (3-level
scale) ...................................................................................................................................................................... 79
Table 37: Average trust in government institutions (4-level scale) ...................................................................... 79
Table 38: Perceptions about the problems in the state requiring treatment and the disputes threatening Israeli
society .................................................................................................................................................................... 80
Table 39: Optimism/pessimism about the future of the state ................................................................................ 82
Table 40: Positions about Jewish-Arab coexistence in Israel ............................................................................... 82
Table 41: Interest in the Holocaust ....................................................................................................................... 83
Table 42: Average attitudes toward Germany (scale from 1, the most negative attitudes, to 4, the most positive
attitudes) ................................................................................................................................................................ 85

List of Figures
Chapter 1: Periodic Demographic Data on Teenagers and Young People in Israel
Figure 1: Population of Israel and persons aged 15-24 (thousands) 1955-2015 ..................................................... 5
Figure 2: Proportion of persons aged 15-24 in the whole population 1955-2015 .................................................. 6
Figure 3: Proportion of persons aged 15-24 out of the whole population in OECD countries, 2013 ..................... 6
Figure 4: Geographic Distribution of Ages 15-24, by District, 2015 ..................................................................... 7
Figure 5: Proportion of Pupils in Higher Classes, by Education Stream, 2000-2015 ............................................. 8
Figure 6: Annual Rate of Growth by Education Stream, 2000-2015 ...................................................................... 9
Figure 7: Ages 15-24 by National Group, 1955-2015 ............................................................................................ 9
Figure 8: Ages 15-24, by Religion, Selected Years .............................................................................................. 10
Figure 9: Proportion of Young People Expected to Attain High School Education (as a percentage of all 15-25
year-olds) 2014 ...................................................................................................................................................... 11
Figure 10: Proportion of Young People Expecting to Obtain a High School Education (as a percentage of all
persons aged 15-24) by sex, 2014 .......................................................................................................................... 11
Figure 11: The Demand for Fields of Study at Universities and Colleges*, Selected Years ................................ 12
Figure 12: Proportion of Students for a First Degree (as a percentage of the population group), Selected Years 13
Figure 13: Ages 20-24 in the Education System, by Labour Force Status, 2015 ................................................. 14
Figure 14: Proportion of Unemployed Ages 18-24, by number of years of education and sector, 2015 .............. 15
Figure 15: Unemployment Rates for ages 20-24 not in the Education System, 2015 .......................................... 15
Figure 16: Ages 15-19 Not in Employment or Studies, 2015 ............................................................................... 16
Figure 17: Ages 20-24 not in Employment or Studies, 2015 ................................................................................ 17
Figure 18: Dropout rate from Educational Frameworks, by Sector and Grade, 2015 .......................................... 17
Figure 19: Rate of Entitlement to Matriculation Certificate, by Sector, 2015 ...................................................... 18
Figure 20: Average Gross Income (NIS) for Salaried Employees Aged 15-24, by Years of Education and Sex,
2014 ....................................................................................................................................................................... 19
Figure 21: Average Gross Income (NIS) for Salaried Workers aged 15-24, by Sector and Sex, 2014 ................ 20
Chapter 2: Teenagers and Young People – What Do They Think of Themselves and What Do They
Think of the State? Findings of a Survey
Figure 22: Economic support by parents, ages 21-24 ........................................................................................... 29
Figure 23: Goals in life – mark two main goals.................................................................................................... 33
Figure 24: Sense of belonging .............................................................................................................................. 35
Figure 25: Sense of security – summary (10-level scale) ..................................................................................... 40
Figure 26: Democratic principles against needs of state security ......................................................................... 44
Figure 27: Democratic values – summary ............................................................................................................ 49
Figure 28: Distribution of the interviewees who think that the following values exist in the state to the
appropriate degree ................................................................................................................................................. 53
Figure 29: Trust in government institutions, have trust or complete trust ............................................................ 57
Figure 30: The most important problems that the government must deal with .................................................... 60
Figure 31: The disputes that most endanger Israeli society .................................................................................. 61
Figure 32: Optimism or pessimism about the future of the state .......................................................................... 64
Figure 33: "Arab citizens of Israel should be prohibited from being elected to the Knesset", among Jews ......... 66
Figure 34: "Germany today is among the countries friendly to Israel", among Jews ........................................... 69
Figure 35: "Germany today is no different than Germany in the past, and a Nazi regime could arise there",
among Jews............................................................................................................................................................ 70
Figure 36: "The extermination of Jews was supported, in effect, by the majority of the German people and not
only by the Nazi leadership", among Jews ........................................................................................................... 70

Chapter 4: Teenagers and Young People of Israel, Yesterday and Today: Comparison of Public
Opinion Trends over Time
Figure 37: Religious self-definition among Jews, 1998, 2004 and 2016 ............................................................ 104
Figure 38: Political identity self-definition, 2004 and 2016 ............................................................................... 105
Figure 39: Optimistic about fulfilling goals in Israel, 1998-2016 ...................................................................... 108
Figure 40: Trust in legal system among Jews, 1998-2016 .................................................................................. 111
Figure 41: "Complete trust" in the IDF among Jews, 1998-2016 ....................................................................... 112
Figure 42: Trust in police among Arabs, 1998-2016 .......................................................................................... 113
Figure 43: Full political equality "very important", 1998-2016.......................................................................... 116
Figure 44: Most endangering dispute among Jews, 2004-2016 .......................................................................... 118
Figure 45: Attitudes towards Arabs among Jews, 2004-2016 ............................................................................ 119
Figure 46: "The extermination of Jews was supported, in effect, by the majority of the German people and not
only by the Nazi leadership" (% agree), 1998-2016 ............................................................................................ 121

1
Preface
The joint research of the Macro Center for Political Economics and the Israel office of
the Friedrich Ebert Foundation in 2016 is the fourth in a series of studies conducted
every six years, beginning in 1998. The objectives of these studies are to try to present
the personal, national and social views of Israel's young generation and how they have
shifted over the years.
The aspect of long-term tracking existing in the study, starting in 1998, following the
years 2004 and 2010 and ending in 2016, offers a unique perspective on how every
young generation is different from its predecessors and how trends have changed over
time.
The study conducted in 1998 revealed that Israeli youth shows signs of ambition,
individualism, and suspicious attitude towards the major institutions of the decision
making process. On the other hand, it was possible to find encouraging findings, e.g.
the somewhat convergence of positions of the non-Jewish youth to those of the rest of
Israeli society. The survey findings reinforced the prevailing view that it is necessary
to equip the youth with education tools, especially democracy and participation in
decision-making, in order to deal with the difficult issues on the agenda in the near
future. However, one of the key insights that emerged from this study was that in
order to solve the problem of alienation that has developed, perhaps an emphasis
should be placed on changes in the structure of government.
The leading deviations in the responses of the Jewish and Arab youth in the study of
2004 were probably a result of the significant developments that have occurred in
Israel since the end of 2000: the outbreak of the intifada and the economic crisis.
These deviations were reflected in a decline of the value of democracy among Jewish
youth and a slight increase among Arab youth, the decline in trust of Arab youth in
state institutions, especially the police and military. The survey also reflected the
intensity of the conflict between Jews and Arabs in Israel - most Jews have agreed to
ban Arab Israeli citizens to vote and the conflict between the two nations was
perceived as most dangerous to Israel. Other perilous deviations found are the
increase in youth who support violent civil disobedience and the rate of youth who
believe that another murder of an Israeli prime minister may occur. The decline in the
value of democracy along with political events relevant to that period have again
2
raised the issue of violent resistance to the evacuation of settlements and the issue of
the feasibility of another political assassination of a prime minister in Israel.
The findings of the study conducted in 2010 indicated that, given the complex and
contradictory reality, teenagers and young people in Israel have developed a core
pattern of "both" which does not give rise to the dissolution of inconsistencies in the
perception of the reality among young people, but incorporates them into their own
personal views. Basically, although they are in favor of peace with the Palestinians,
many of them rejected any compromise in the peace process and favored the status
quo. They perceive democracy as an important fundamental value, but about half
would rather Arab Israeli citizens not have the right to be represented in the Knesset.
The complex situation of their country did not cause them general fear or apathy, and
with regard to their expectations about their personal future and happiness –
relationships, family and profession – they showed clear positive attitudes.
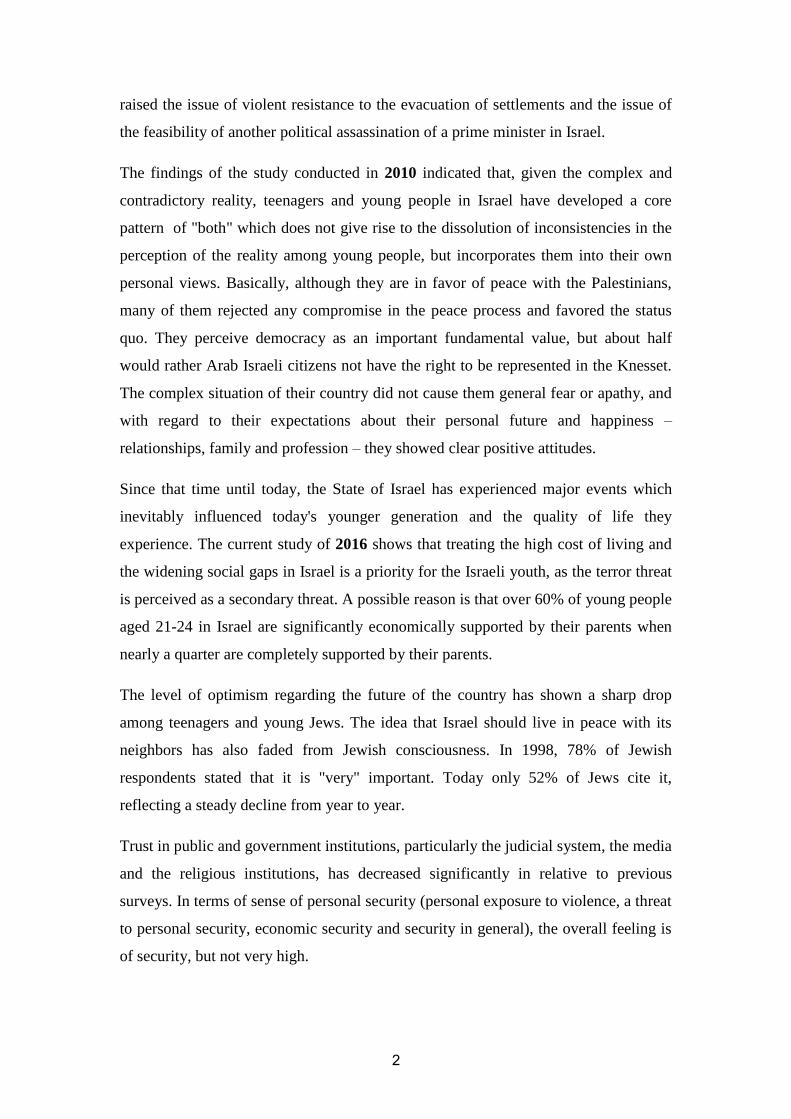
Since that time until today, the State of Israel has experienced major events which
inevitably influenced today's younger generation and the quality of life they
experience. The current study of 2016 shows that treating the high cost of living and
the widening social gaps in Israel is a priority for the Israeli youth, as the terror threat
is perceived as a secondary threat. A possible reason is that over 60% of young people
aged 21-24 in Israel are significantly economically supported by their parents when
nearly a quarter are completely supported by their parents.
The level of optimism regarding the future of the country has shown a sharp drop
among teenagers and young Jews. The idea that Israel should live in peace with its
neighbors has also faded from Jewish consciousness. In 1998, 78% of Jewish
respondents stated that it is "very" important. Today only 52% of Jews cite it,
reflecting a steady decline from year to year.
Trust in public and government institutions, particularly the judicial system, the media
and the religious institutions, has decreased significantly in relative to previous
surveys. In terms of sense of personal security (personal exposure to violence, a threat
to personal security, economic security and security in general), the overall feeling is
of security, but not very high.

3
The deep social polarization felt in Israel in recent years, especially in the relationship
between Jewish and Arab citizens of Israel, is expressed more intensely in the present
study. The survey findings indicate a continued decline in the share of Jews who think
that full political equality is very important, 50% in 1998 to 35% today. However,
there are encouraging data in this regard. The latest youth studies regularly tested
whether Israeli Jews were willing to prevent Arab citizens from civil rights, such as
the right to be elected to the Israeli parliament. In 2004, more than half of the Jewish
respondents supported this position while in the current survey it decreased to 39%.
The research project combines quantitative and qualitative research. The qualitative
research was conducted in four focus groups among specific segments of the youth
population. The findings and insights gained from the focus groups contributed much
to the formulation of the final survey questionnaire and to the interpretation given
subsequently.
The quantitative research was divided into three parts: The first part included the
collection, processing and analysis of periodic demographic data of Israeli youth from
various official sources, local and international.
The second part included a comprehensive survey by "Midgam – Research and
Consulting" among a sample of 1,264 people (the 15-18 age group sample was of 631
respondents – 486 Jews and 145 Arabs, the 21-24 age group sample was of 633
respondents – 470 Jews and 163 Arabs). Analysis of the survey results included:
screening questions periodically by the detainee issue, weighting the data file to
correct sampling biases, building and testing measures the relationship between the
findings Demographic characteristics of youth and young people. Analysis of the
survey results included: sorting the questions into chapters according to the subject
studied, weighting the data file to correct sampling biases, building measures and
testing the relationship between the findings and demographic characteristics of
Israeli youth.
The third part dealt with substantive issues that were monitored over time. In other
words, the analysis of the results of the tracking questions from the current survey
compared to those of the three previous surveys (1998, 2004 and 2010). In the
framework of this analysis a mapping of Israeli youth and how it has changed in
relation to the basic terms of demographic characteristics and political orientation,

4
was prepared. In addition, data from the time series was presented, while providing a
social and historical context to explain statistical changes - or, alternatively, consistent
findings.
Throughout this book, the term "teenagers" refers to ages 15-18 and the use of the
term "young people" refers to ages 21-24.

5
Chapter 1: Periodic Demographic Data on Teenagers
and Young People in Israel Dr. Roby Nathanson, Itamar Gazala and Ron Leyzer
In this chapter, statistical data on the youth population in Israel between the ages of 15
and 24 will be presented as a basis and background for the survey. Throughout the
chapter, the term "young people" will be used to refer to those aged 15-24, unless
otherwise stated. The data presented here will attempt to profile the young people in
Israel in the context of demography and on the subjects of sector and religion,
education, employment, poverty and exclusion. This will be presented in comparison
to data from OECD countries.
General Data
In 2015, there were some 1.26 million young people in Israel between the ages of 15
and 24. The proportion of young people in the total population decreased from 20% in
the 1970s to 17.2% at the beginning of the 1980s, and in 2015 constituted some 15%.
The difference in the proportions of the young people between these time periods is a
product of the difference in the composition of the population in Israel when the state
was founded in comparison to the current composition of the population. A large
proportion of the citizens of the state in the early years after it was founded were
immigrants and for that reason the proportion of children and teenagers was lower.
The proportion began to increase until it reached a peak at the beginning of the 1970s.
In the 1980s, the proportion of teenagers and young people dropped to 17.5%, and
since then it has been decreasing gradually.
Figure 1: Population of Israel and persons aged 15-24 (thousands), 1955-2015
Source: Central Bureau of Statistics, Statistical Yearbook of Israel 2016, Table 2.5
27
4.9
32
2
60
4.8
67
2.9
84
4.2
99
3.3
1,0
89
.4
1,1
81
.4
12
40
.6
1,7
89
.1
2,1
50
.4
3,0
22
.1
3,9
21
.7
4,8
21
.7
5,6
12
.3
6,3
69
.3
7,6
95
.1
8,2
96
.9
0
2,000
4,000
6,000
8,000
10,000
1955 1960 1970 1980 1990 1995 2000 2010 2014
Young People Total Population

6
Figure :2 Proportion of persons aged 15-24 in the whole population, 1955-2015
Source: Central Bureau of Statistics, Statistical Yearbook of Israel 2016, Table 2.5
Despite this, the proportion of young people in Israel was among the highest in the
OECD countries. It was exceeded only by Mexico, Turkey and Chile, with Israel in
fourth place, and was higher than the OECD average by 2.1 percentage points.
Figure 3: Proportion of persons aged 15-24 out of the whole population in OECD
countries, 2013
Source: OECD Stat
In 2015, some 286,200 young people lived in the Central District (23%), some
238,400 in the Northern District (19%), some 193,900 in the Southern District (15%),
some 186,500 in the Jerusalem District (15%), some 156,500 in the Tel Aviv District
(12%), some 140,600 in the Haifa District (11%) and some 59,900 young people lived
in the area of Judea and Samaria (5%).
15.4% 15.0%
20.0%
17.2% 17.5% 17.7% 17.1%
15.4% 15.1%
10%
12%
14%
16%
18%
20%
22%
1955 1960 1970 1980 1990 1995 2000 2010 2015
13.1% 15.2%
0% 2% 4% 6% 8%
10% 12% 14% 16% 18% 20%
Jap
an
Spai
n
Ital
y
Slo
ven
ia
Po
rtu
gal
Ger
man
y
Cze
ch R
epu
blic
Irel
and
Esto
nia
Fran
ce
Hu
nga
ry
Au
stri
a
Fin
lan
d
Net
her
lan
ds
Swed
en
Slo
vak
Rep
ub
lic
Un
ited
Kin
gdo
m
Den
mar
k
OEC
D -
To
tal
No
rway
Au
stra
lia
Ko
rea
Un
ited
Sta
tes
New
Zea
lan
d
Isra
el
Ch
ile
Turk
ey
Mex
ico

7
Figure 4: Geographic Distribution of Ages 15-24, by District, 2015
Source: Central Bureau of Statistics, Statistical Yearbook of Israel 2015, Table 2.19
Sector and Religion
Young people in Israel, like the general population, can be classified into four sectors:
Jewish secular (state school system), Jewish state-religious, Jewish ultra-Orthodox,
and Arab. Each sector has different cultural characteristics, and unique values. There
are also characteristics that are common to some sectors, such as common festivals in
the Jewish sectors in contrast to the Arab sector.
The proportion of each sector in the total population of school children in Israel has
changed over the years. The proportion of pupils in the higher classes in the Arab
sector increased from 12% in 2000 to 19% in 2015. The proportion of the ultra-
Orthodox grew from 13% in 2000 to 20% in 2015. Conversely, there were noticeable
trends of shrinkage in the state-religious and state-secular sectors. In 2000, the
proportion of pupils in the state-religious stream of education was approximately
15%, while in 2015 this sector constituted only 13% of the total population of pupils.
This strong trend is even more marked in the secular Jewish sector. In 2000, the group
of secular Jewish pupils constituted some 60% whereas in 2015 this percentage
decreased to just 47%. Nonetheless, the secular Jewish sector still constitutes the
lion's share of all pupils in the higher classes.
Jerusalem District 15%
Northern District
19%
Haifa District 11% Central District
23%
Tel Aviv District 12%
Southern District 15%
Judea and Samaria 5%

8
Figure 5: Proportion of Pupils in Higher Classes, by Education Stream, 2000-
2015
Source: Ministry of Education
There was a difference in the population groups as the annual growth rate of each of
the education streams changed. In 2000 the rate of growth in the Arab and ultra-
Orthodox sectors was high: 1.067. At the beginning of 2015 the growth rate of the
Arab sector was 1.023 and the ultra-Orthodox was 1.051. The fertility rate of the
ultra-Orthodox is very high, but in recent years that has been a significant drop in
fertility in this group. The reason for this is that the ultra-Orthodox society is
undergoing social, cultural and economic change. One of the factors that accelerated
this change was the cutback in child allowances which brought ultra-Orthodox
women and men into the labour market (Malach & Rebhun 2008). The significant
drop in the pace of annual growth in the Arab population was linked to the general
process of modernization that Arab society is undergoing, as well as the cut in child
allowances starting from 2002 (Malach & Rebhun 2008). In contrast, the rate of
growth in the secular and state-religious streams rose slightly from 1.003 and 1.006 in
2000 to 1.031 and 1.035 in the year 2015 respectively.
0%
10%
20%
30%
40%
50%
60%
70%
80%
90%
100%
13
.4%
13
.6%
13
.8%
13
.8%
13
.7%
13
.9%
14
.0%
14
.4%
14
.2%
14
.2%
14
.3%
14
.6%
14
.6%
14
.8%
14
.9%
15
.2%
20
.3%
20
.0%
19
.4%
19
.1%
18
.9%
18
.5%
17
.7%
17
.1%
17
.2%
16
.6%
16
.0%
15
.2%
14
.7%
14
.2%
13
.5%
13
.0%
47
.0%
47
.3%
47
.8%
48
.4%
49
.2%
50
.0%
50
.8%
51
.6%
52
.2%
53
.6%
54
.9%
56
.3%
57
.6%
58
.2%
59
.1%
59
.7%
19
.3%
19
.1%
19
.0%
18
.7%
18
.2%
17
.7%
17
.4%
16
.9%
16
.4%
15
.6%
14
.8%
13
.8%
13
.1%
12
.8%
12
.5%
12
.1%
State-Religious Ultra-Orthodox
State-Secular Arab

9
Figure 6: Annual Rate of Growth by Education Stream, 2000-2015
Source: Taub Center
Another classification of the young people can be by national affiliation, and
particularly by Jewish and non-Jewish youth, because there are cultural characteristics
such as festivals as well as values and perceptions that differ between these groups. In
1955, the number of Jews aged 15-24 was some 238,200, which constituted
approximately 86.6% of this population group and 10.3% of the entire Jewish
population. This proportion decreased and in 2015 was 68.9% -- some 867,000 Jewish
young people. The proportion of non-Jewish young people constituted 13.4% in 1955
– some 36,700. This proportion increased and in 2015 constituted 31.1% -- some
391,600 non-Jewish teenagers and young people. The number of Arab teenagers and
young people in Israel was approximately 350,400 in 2015, some 4.2% of the whole
population. It is notable that the proportion of Jewish young people dropped in
comparison with the proportion of those who are not Jewish.
Figure 7: Ages 15-24 by National Group, 1955-2015
Source: Central Bureau of Statistics, Statistical Yearbook of Israel 2016, Table 2.5
0.92
0.94
0.96
0.98
1
1.02
1.04
1.06
1.08
2000 2001 2002 2003 2004 2005 2006 2007 2008 2009 2010 2011 2012 2013 2014
Arab Ultra-Orthodox State-Religious State-Secular
238.2 275.2 527.8 539.3 655.0 767.8 823.0 837.8 867.0
36.7 46.9 76.9 133.4 189.2 225.6 265.8 343.2 391.6
0%
20%
40%
60%
80%
100%
1955 1960 1970 1980 1990 1995 2000 2010 2015
Jewish Youth Non-Jewish Youth

11
The proportion of teenagers and young people (15-24) who identify with the Muslim
religion out of the total population of young people rose from 17% in 1998 to 24% in
2015. The proportion of Druze remained largely unchanged. The proportion of
Christians also remained stable over the years. The proportion of Jewish young people
decreased from 76.8% in 1998 to 68.7% in 2015. This rate is in keeping with the birth
rate in these population groups.
Figure 8: Ages 15-24, by Religion, Selected Years
Source: Central Bureau of Statistics, Statistical Yearbook of Israel
Education
The proportion of young people in Israel expecting to attain a high school education
during their lifetime is higher than the average in the OECD and is estimated at 89.6%
of all young people in this age group. The OECD average is 85.4%.
Jews 74.3%
Muslims 17.5%
Christians 2.0%
Druze
1.9%
No religious classification
4.2%
2004
Jews 76.8%
Muslims 17.0%
Christians2.1%
Druze
2.0%
No religious classification
2.1%
1998
Jews 68.7%
Muslims 23.9%
Christians 2.0%
Druze
2.1%
No religious classification
3.3%
2015
Jews 71.3%
Muslims 20.9%
Christians 2.1%
Druze
2.0%
No religious classification
3.7%
2010

11
Figure 9: Proportion of Young People Expected to Attain High School Education
(as a percentage of all 15-25 year-olds) 2014
Source: OECD Stat
The proportion of girls expected to obtain a high school education is somewhat higher
than the proportion of boys aged 15-24 – 92.8% as compared with 86.7%, and is
higher than the OECD average by 4.5 and 4.2 percentage points, respectively.
Figure 10: Proportion of Young People Expecting to Obtain a High School
Education (as a percentage of all persons aged 15-24) by sex, 2014
Source: OECD Stat
The rate of participation of ages 20-24 in the Israeli education system is very low in
comparison to OECD countries. In Israel the rate of participation is estimated to be
28.1% against an average 44.8% for OECD countries. The reason for this is connected
to compulsory military service in Israel.
The demand for different areas of study has changed over the years. In 1998, some
23.5% of the candidates intended to study for a degree in the Humanities, in
85.4% 89.6%
0%
20%
40%
60%
80%
100% M
exic
o
Turk
ey
Swed
en
Luxe
mb
ou
rg
Cze
ch R
epu
blic
Spai
n
Un
ited
Sta
tes
Po
lan
d
Slo
vak
Rep
ub
lic
No
rway
OEC
D a
vera
ge
Ch
ile
Latv
ia
Hu
nga
ry
Can
ada
Icel
and
Isra
el
Au
stri
a
Slo
ven
ia
Ger
man
y
Ital
y
Den
mar
k
Ko
rea
Net
her
lan
ds
New
Zea
lan
d
Jap
an
Fin
lan
d
Po
rtu
gal
83% 87% 88% 93%
0% 10% 20% 30% 40% 50% 60% 70% 80% 90%
100%
Mex
ico
Turk
ey
Swed
en
Cze
ch R
epu
blic
Luxe
mb
ou
rg
Spai
n
Slo
vak
Rep
ub
lic
Po
lan
d
Un
ited
Sta
tes
OEC
D a
vera
ge
Ger
man
y
No
rway
Au
stri
a
Hu
nga
ry
Ch
ile
Slo
ven
ia
Latv
ia
Isra
el
Can
ada
Ko
rea
Ital
y
Jap
an
Den
mar
k
Net
her
lan
ds
New
Zea
lan
d
Po
rtu
gal
Icel
and
Fin
lan
d
Boys Girls

12
comparison with 14.3% in 2015. The proportion of those wishing to study Social
Sciences dropped from 30.7% in 1998 to 23.2% in 2015, but some of this decrease
can be explained by the fact that, in 2010, an extra category of "Business and
Management Sciences" was added, many areas of which were previously considered
part of the Social Sciences. The proportion of those intending to study Law rose from
5.5% in 1990 to 9.6% in 2015. The proportion of people intending to study
Engineering and Architecture increased from 12.9% to 16.7%. The proportion of
those wishing to study Natural Sciences and Mathematics dropped from 15.1% to
12%. The proportion of those intending to study Agriculture decreased from 0.8% to
0.6% which is relatively stable. The proportion of those intending to study Medicine
and Para-Medical Studies fluctuated – in 1998 it constituted 11.6%, in 2004 it was
15.6% and in 2010 it dropped to 9.5% then increasing to 12% in 2015.
During the years 2010-2015, in many areas of study the trend changed. For example,
in contrast to the trend, there was an increase in the proportion of those wanting to
study the Humanities, the Natural Sciences and Mathematics, and Agriculture while,
at the same time, there was a concomitant decrease in the proportion of those wishing
to study Engineering and Architecture. It should be noted that some of the difference
in the data can be explained by the fact that 1998 and 2004 data refer only to the
universities.
Figure 11: The Demand for Fields of Study at Universities and Colleges*,
Selected Years
Humanities17.4%
Social Sciences32.1% Law 6.1%
Medicine and Para-Medical Studies ,15.6%
Natural Sciences and Mathematics
13.7%
Agriculture
1.0% Engineering and
Architecture14.1%
2004
Humanities23.5%
Social Sciences30.7%
Law 5.5%
Medicine and Para-Medical Studies 11.6%
Natural Sciences and Mathematics
15.1%
Agriculture0.8% Engineering
and Architecture
12.9%
1998

13
Source: Central Bureau of Statistics, Statistical Yearbook of Israel
* 1998 and 2004 refer only to universities
The proportion of students studying for a B.A. degree among young people rose from
21.6% in 2005 to 24.2% in 2015. Because the majority of young people comply with
their duty to serve in the military, the percentage of ages 22-24 entitled to this degree
is more than three times higher than that of ages 18-21 in 2014.
Figure 12: Proportion of Students for a First Degree (as a percentage of the
population group), Selected Years
Source: Central Bureau of Statistics, Statistical Yearbook of Israel 2016, Table 8.53
From Education to Employment
In 2014, the proportion of young people employed was the highest since 2000 and
was estimated at approximately 8.8% as against 7.2%. 58% of the employed young
people work up to 4 hours per week, 25% work 4-8 hours weekly and 33% of them
work 8-20 hours weekly. 40% of those 16-18 reported that their studies had been
harmed because of their jobs (The Israel National Council for the Child, 2015).
Humanities14.3%
Social Sciences
23.2% Law 9.6%
Medicine and Para-Medical Studies 12.0%
Natural Sciences &
Mathematics 12.0%
Agriculture
0.6%
Engineering &
Architecture16.7%
Business & Management
11.7%
2015
Humanities12.5%
Social Sciences
28.5% Law 8.4%
Medicine & Para-Medical
Studies 9.5%
Natural Sciences &
Mathematics10.2%
Agriculture
0.4%
Engineering &
Architecture17.7%
Business & management
12.8%
2010
6.0% 5.5% 5.5% 4.8%
18.2% 19.0% 19.1% 16.8%
0%
5%
10%
15%
20%
25%
2015 2012 2010 2005
18-21 22-24

14
The rates of employment of Israeli young people aged 15-24 are high in comparison
to OECD countries. In Israel, 26.3% of teenagers aged 15-19 are employed in contrast
with the OECD average of 22.8% and 64.7% of young people aged 20-24 in contrast
with the OECD average of 56.4%. The rate of young people aged 20-24 in Israel
combine working and studying more than the OECD average, 44.4% versus 33.4%.
This figure can attest to the difficulty of these younger ages to support themselves
during their studies or alternatively, young Israelis are trying to start their professional
careers before completing their studies.
Figure 13: Ages 20-24 in the Education System, by Labour Force Status, 2015
Source: OECD Stat
The unemployment rates for ages 18-24 increase as the number of years of education
goes up (except for the unemployment in the non-Jewish sector with 0-8 years of
schooling. Nevertheless, it should be stated that the number is very low –some 690
persons only). In 2015, 21,800 Jewish 18-24 year-olds had an education level of 0-12
years and were not employed; this constitutes 6.7% of the Jewish population in the
labour force for these ages with the same education level. In contrast, 8,600 non-Jews
of these ages with the same education level were not employed, constituting 10.1% of
the non-Jewish population in the workforce for these ages and level of education.
There were 7,700 Jews with 13-15 years of education who were not employed – this
constitutes 7.4% of the Jewish population in the workforce of these ages and the same
education levels and there were some 3,000 non-Jewish unemployed constituting
about 13.2% of the non-Jewish population in the workforce of those ages and
education levels. There were some 2,000 Jews with 16 years of education and above
33
.4%
44
.4%
62
.1%
52
.6%
0%
20%
40%
60%
80%
100%
Hu
nga
ry
Ital
y
Slo
vak
Rep
ub
lic
Bel
giu
m
Gre
ece
Cze
ch R
epu
blic
Po
rtu
gal
Spai
n
Luxe
mb
ou
rg
Po
lan
d
Ko
rea
Ch
ile
Fran
ce
Slo
ven
ia
Irel
and
Mex
ico
Latv
ia
Swed
en
OEC
D a
vera
ge
Jap
an
Turk
ey
Esto
nia
Fin
lan
d
Un
ited
Kin
gdo
m
Isra
el
Au
stri
a
No
rway
Un
ited
Sta
tes
Can
ada
Ger
man
y
New
Zea
lan
d
Den
mar
k
Swit
zerl
and
Net
her
lan
ds
Au
stra
lia
Icel
and
Employed Unemployed Inactive

15
who were not employed, constituting 11.2% of the Jewish population in the workforce
of those ages and level of education, and some 1,300 non-Jews were unemployed –
14.6% of the non-Jews in the workforce of those ages and that level of education. The
data indicate a higher level of unemployment among the non-Jewish population in all
the groups by education levels.
Figure 14: Proportion of Unemployed Ages 18-24, by number of years of
education and sector, 2015
Source: Central Bureau of Statistics, Statistical Yearbook of Israel 2016, Table 8.73
The rate of unemployment of young people in Israel who are not in the education
system is somewhat higher in comparison to the OECD average – 18.6% as compared
with 17%. It should be noted that soldiers serving in the army during their compulsory
military service are counted as employed in the economy as is the practice in the
countries with a similar type of service. Likewise, it must be noted that the general
rates of unemployment in Israel are very low compared to OECD counties. One of the
reasons that the rate of unemployment of ages 20-24 is high, despite the low general
rate of unemployment, is the late entry of discharged soldiers into the workforce due
to their military service duties.
Figure 15: Unemployment Rates for ages 20-24 not in the Education System,
2015
Source: OECD Stat
0%
10%
20%
0-8 9-12 13-15 16+
0.0%
6.7% 7.4% 11.2% 12.1% 10.1%
13.2% 14.6%
Jews Non-Jews
18.6% 17.0%
0% 5%
10% 15% 20% 25% 30% 35%
Ital
y
Turk
ey
Gre
ece
Spai
n
Mex
ico
Ko
rea
Ch
ile
Fran
ce
Po
rtu
gal
Irel
and
Slo
vak
Rep
ub
lic
Isra
el
Po
lan
d
Hu
nga
ry
Fin
lan
d
Slo
ven
ia
Oec
d A
vera
ge
Bel
giu
m
Un
ited
Sta
tes
Un
ited
…
Esto
nia
New
Zea
lan
d
Can
ada
Latv
ia
Au
stra
lia
Den
mar
k
Swit
zerl
and
Swed
en
Au
stri
a
Cze
ch R
epu
blic
No
rway
Jap
an
Luxe
mb
ou
rg
Ger
man
y
Net
her
lan
ds
Icel
and

16
Exclusion and Poverty
Teenagers and young people not in Education, Employment, or Training (NEET) are
at greatest risk of being socially excluded, of having a low income, of being below the
poverty line, and of lacking the skills to improve their socio-economic situation. In
Israel the proportion of young people aged 15-19 lacking any framework is the
highest in the OECD countries, constituting 8.83% where the OECD average is
6.34%.
Figure 16: Ages 15-19 Not in Employment or Studies, 2015
Source: OECD Stat
The rate of young people aged 20-24 who are not in training, education or
employment is above the OECD average, as well. A possible explanation for this is
the compulsory military service. Young Israelis enter the labour market and the higher
education system later than in other developed countries due to the intense military
service that they undergo. Many of them require a long time to recover before they
"begin their lives" and some even choose to travel the world for months after
discharge from military service. Conscription exists in other OECD countries such as
Finland and Switzerland, but the military service in Israel lasts between two and three
years, which is longer in comparison to similar service in other OECD countries
(Education at a glance 2016, OECD indicators). Furthermore, military service in
Israel is for men and women alike; this is not necessarily characteristic of other
OECD countries with compulsory military service.
8.83%
6.34%
0%
2%
4%
6%
8%
10%
12%
14%
16%
18%
20%
TUR
MEX
IT
A
ESP
IS
R
GB
R
GR
C
IRL
FRA
N
ZL
USA
C
AN
O
AV
G
SVK
H
UN
AU
S A
UT
PR
T ES
T
PO
L FI
N
SVN
B
EL
CH
E D
NK
N
LD
ISL
SWE
LVA
CZE
N
OR
LU
X
DEU

17
Figure 17: Ages 20-24 not in Employment or Studies, 2015
Source: OECD Stat
The rate of dropout from the educational frameworks varies between the sectors of the
Jewish population, and is dispersed among the various age groups. As of 2015, in the
ultra-Orthodox sector there has been a very significant dropout rate in the 10th
to 12th
grades that has reached 7.4% as compared with an overall dropout rate of 1.6% in the
state-secular and state-religious sectors, and an approximate 3.1% dropout rate in the
Arab population. The most significant rate of dropping out occurs in the eleventh
grade in all of the sectors. In the ultra-Orthodox sector, the dropout rate in eleventh
grade is 15.6%. These high rates of dropping out indicate that they will not be
obtaining a "Bagrut" (matriculation) certificate which predicts future difficulty in
becoming integrated into employment or higher education.
Figure 18: Dropout rate from Educational Frameworks, by Sector and Grade,
2015
Source: Central Bureau of Statistics, Statistical Yearbook of Israel, Table 8.35
18.55% 16.91%
0%
5%
10%
15%
20%
25%
30%
35% IT
A
TUR
G
RC
ES
P
MEX
FR
A
PR
T IR
L SV
K
ISR
P
OL
HU
N
FIN
SV
N
OA
VG
B
EL
USA
G
BR
ES
T N
ZL
CA
N
LVA
A
US
DN
K
CH
E SW
E A
UT
CZE
N
OR
LU
X
DEU
N
LD
ISL
0%
2%
4%
6%
8%
10%
12%
14%
16%
12th grade 11th grade 10th grade
0.7% 2.3% 1.8%
0.7% 2.3% 1.7%
3.6%
15.6%
3.1%
1.0%
3.9% 4.3%
State-Secular State-Religious Ultra-Orthodox Arab

18
There is a significant difference between the secular and religious sectors as compared
with the Arab and ultra-Orthodox sectors with regard to entitlement to a matriculation
certificate. Above 80% of the religious and secular streams within the state education
system are entitled to a matriculation certificate as opposed to 61.4% of Arab youth,
and only 33.9% of ultra-Orthodox youth. This absence of entitlement is accompanied
by an absence of the skills required for acceptance into the workforce or to higher
education.
Figure 19: Rate of Entitlement to Matriculation Certificate, by Sector, 2015
Source: Central Bureau of Statistics, Statistical Yearbook of Israel, Table 8.27
At working ages, the rate of risk of poverty is the highest for ages 18-24 in all
European countries as well as in Israel. In Israel, some 30% of the 18-24 year-old age
group is at risk of poverty (Central Bureau of Statistics, Report on Society in Israel).
An international comparison of poverty among ages 18-25 ranks Israel in the sixth
place among OECD countries with a poverty rate of 18.2% as compared with an
OECD average of 13.7% (National Insurance Institute, Annual Report 2015).
For 15-24 year-olds, the average gross income for salaried employees is NIS 2,917
per month, NIS 18.5 per hour worked (below the minimum wage) and the median
income is NIS 2,003 per month. The average salary for men in this age group was NIS
3,195 per month and NIS 18.9 per hour and for women this was NIS 2,610 and NIS
18.1 respectively. In 2015, the average monthly income for a salaried employee in
Israel was estimated at approximately NIS 9,503, NIS 55.7 per hour worked and the
33.9%
61.4%
80.2% 81.8%
0%
10%
20%
30%
40%
50%
60%
70%
80%
90%
Ultra-Orthodox Arab State-Religious State-Secular

19
median income was NIS 6,884. The low income of young people makes economic
support necessary and does not facilitate full economic independence.
Table 1: Average Gross Income (NIS) per month and per hour worked for
Salaried Employees 15-24 years old, by sex, 2015
Average Gross
Income
(NIS per month)
Average Gross Income
(NIS per hour worked)
Minimum Wage
(NIS per hour worked)*
Total 719,2 ,.81 Up to the age of 16 – 18.82
Up to the age of 17 – 20.16
Up to the age of 16 – 22.31
18 and above – 25.00
Men 51,91 ,.89
Women 716,2 ,.8,
* As of 01.04.2015. Starting 01.07.2016, the minimum wage was adjusted and stands at NIS 19.52 (Up
to 16), NIS 20.92 (up to 17), NIS 23.15 (up to 18) and NIS 25.94 (18 and above), per hour worked.
Source: Central Bureau of Statistics, Household Expenditure Survey 2015
The average gross income of teenagers and young people (aged 15-24) was estimated
to be approximately NIS 2,400 for women and NIS 2,854 for men with 9-12 years
education. For those with 13-15 years of education the average was somewhat higher
reaching NIS 3,233 for women and NIS 3,928 for men. In relation to the poverty line
which is calculated according to the number of people in the family, in 2014 a single
person whose income was less than NIS 3,077 was defined by the state as poor.
Below NIS 4,923 a couple is defined as poor, and for 3 souls the amount is NIS 6,522
(National Insurance Institute, 2015).
Figure 20: Average Gross Income (NIS) for Salaried Employees Aged 15-24, by
Years of Education and Sex, 2014
Source: Central Bureau of Statistics, Statistical Yearbook of Israel 2016, Table 8.74
For 15-25 year-old Jewish men the average gross income for a salaried worker was
NIS 2,798 and for Jewish women NIS 2,659. For Arab men in the same age group, the
income was NIS 4,245 and for Arab women NIS 3,344.
3,260 3,819
2,671 3,370
0
1,000
2,000
3,000
4,000
5,000
9-12 13-15 Men Women

21
Figure 21: Average Gross Income (NIS) for Salaried Workers aged 15-24, by
Sector and Sex, 2014
Source: Central Bureau of Statistics, Statistical Yearbook of Israel 2016, Table 8.74
Summary
In Israel, young people constitute a smaller percentage of the general population and
in 2015 were some 15% of the total population. Despite the decrease in the proportion
of young people in the total population, in an international comparison, the percentage
of young people in the total population is among the highest in the Western world.
The proportion of Arab and ultra-Orthodox young people in the total population of
young people has grown, at the same time as there has been a drop in the proportion
of secular and national-religious Jewish young people. In 2015 the proportion of
Arabs in the senior classes was estimated at 19%, the proportion of ultra-Orthodox
pupils was some 20%, the proportion of pupils in the state-religious track was
estimated at some 13% and the proportion of pupils studying in the state-secular track
was some 47%. The proportion of Jewish young people is shrinking relative to the
proportion of young people in general. In 2015, the proportion of Jewish young
people was some 68.9%, compared with 77.6% and 88.6% in 1990 and 1955
respectively. Most of the young people live in the large districts – the central,
Jerusalem, southern and Haifa districts.
The proportion of young people in Israel expecting to obtain a high school education
in their lifetime is higher than the average in the OECD and is estimated to be 89.6%
of all young people of these age groups, compared with an OECD average of 85.4%.
On the other hand, the rate of participation of young people (20-24) in the education
system in Israel is very low in an international comparison and is estimated to be
2,798
4,245
2,659
3,344
0
1000
2000
3000
4000
5000
Jews Arabs Men Women

21
28.1% corresponding with compulsory military service for those ages. In 2014, more
young people chose to study engineering and architecture, while fewer were interested
in studying the Humanities and Law as compared with the year 1990. The proportion
of 18-24 year olds earning a B.A. degree was estimated to be 24.3% in 2014.
The proportion of young people in employment in 2014 was the highest since 2000.
The integration of young people into employment is likely to harm their educational
achievements. In an international comparison, it is evident that the rate of
employment of 15-19 year olds is high compared to OECD countries and is estimated
to be 32.6% of young people. For ages 18-24, there is a higher proportion of those not
employed among persons with 13-15 years of study, with the proportion of those not
employed in the Jewish population being lower than the proportion of non-Jews who
are not employed. The rate of unemployment of Israeli young people in 2015 is
slightly higher than the OECD average. This statistic is surprising since the rate of
unemployment in Israel is very low in an international comparison.
In Israel there is a high proportion of young people who neither work nor study and
this is estimated to be approximately 8.82%, compared to the OECD average of
6.34%. Young people not fitting in to any framework will have difficulty in
integrating into the labour market and are liable to be shunted to the margins of
society. The proportion of young people in the 15-24 year old age group who are not
in any framework is above the OECD average. The highest proportion of dropouts in
the 10th to 12th grades in the population tracks can be observed among the ultra-
Orthodox and was estimated at 7.4% in 2015. Some 81% of religious and secular
youth in the general or state education track are entitled to a matriculation certificate,
as compared with 61.4% of Arab youth and only 33.9% of ultra-Orthodox youth. The
high rate of dropouts together with the low rate of entitlement for the matriculation
certificate will cause difficulties in integrating into the labour market and acceptance
for higher education. The income of teenagers and young people is low relative to the
average and median income according to 2014 data. This low income does not allow
for economic independence for those age groups.

22
Bibliography
1. Malach, Gilad & Rebhun, Uzi (2008). Demographic Trends in Israel. Jerusalem,
Metzilah Center.
http://www.metzilah.org.il/webfiles/fck/file/Demo%20Book%20final.pdf
2. Central Bureau of Statistics (2016). Central Databank. Jerusalem.
http://www.cbs.gov.il/ts
3. Central Bureau of Statistics (1985-2016). Statistical Yearbook of Israel.
Jerusalem.
4. Bleich, Haim; Blass, Nahum (2016). Demographics in the Education System:
Changes and Transitions Between Educational Streams. Jerusalem: Taub Center.
http://taubcenter.org.il/wp-content/files_mf/transfersineducationheb.pdf
5. Ministry of Education, Communications and Information Systems Administration
(2016). A Broad Overview – Numbers on Education.
http://ic.education.gov.il/mabatrachav/HomePage.htm
6. National Insurance Institute, Research and Planning Administration (2015).
Dimensions of Poverty and Social Gaps, Annual Report. Jerusalem.
https://www.btl.gov.il/Publications/oni_report/Documents/oni2014.pdf
7. Israel National Council for the Child (2015). Collection of Data from the Annual
"Children in Israel 2015". Jerusalem.
http://www.children.org.il/Files/File/SHNATON/Leket2015.pdf
8. OECD Stat
https://stats.oecd.org

23
Chapter 2: Teenagers and Young People – What Do
They Think of Themselves and What Do They Think
of the State? Findings of a Survey Dr. Mina Zemach
Aims of the Research
The current survey is the fourth in a series of surveys tracking the positions and
perceptions of Israeli teenagers (aged 15-18) and young people (aged 21-24). The
previous three surveys were conducted in 1998, 2004, and 2010. The present survey
examined the following subjects, some of which were examined in the preceding
surveys and others touch on the spirit of the present:
A. Personal Identity and the Sense of Belonging
Employment situation and economic independence
Political positioning and affiliation with religion
Personal goals
Interviewees' perceptions about their future (whether or not they will
succeed in realizing their personal goals)
Sense of belonging and involvement with Israeli society
Sense of personal security
B. Perceptions and Positions about Israeli Society
Desired characteristics of the State of Israel
Trust in government institutions
Various assessments about the State of Israel (on subjects related to
democracy)
Perceptions about threats to the State of Israel
C. Positions about Israel-Arab Coexistence
D. Positions on the Israel-Palestinian Conflict
E. Positions about Germany
Perceptions about Germany's attitude to Jews and Judaism in general and
about Israel in particular
Level of involvement with the Holocaust

24
Methodology
A. Research population and sample
The research population consisted of the following groups which were the
target population in the previous surveys too: teenagers aged 15-18 and young
people aged 21-24.1
For the 15-18 age group, a group of 546 interviewees was sampled – 420
Jews, and 144 Arabs; for the 21-24 age group the sample was 634
interviewees – 476 Jews and 158 Arabs. These samples were formed using
stratified sampling; in the Jewish sector the strata were defined according to
the following variables: gender, place of residence, level of religiosity. In the
Arab sector the strata were defined by religion and place of residence.
B. Data collection
In the Jewish sector, interviews were conducted with both age groups by
means of the internet. In the Arab sector, different methods were used
according to the age group: teenagers were interviewed face to face; young
people were interviewed by telephone.
C. Time of conducting the survey
The interviews were conducted at the end of August and the beginning of
September 2016.
D. Data analysis
1. The questions were classified into sections according to the subject being
examined:
After the answers were received, the survey questions were classified into
sections and sub-sections. This division was carried out using two criteria:
the a priori one was internal validity, that is to say, the assessment of
which questions provide answers to that subject and relate to that same
content domain. The second criterion used to classify the questions was
empirical – analysis of the facets in order to locate the questions having a
common element that indicate that they belong to the same content
1 Due to their service in the military, the age groups between 18 (and above) and 21 (and below) were
not included in this research population.

25
domain. It ought to be noted that there was congruence in the division
between these two criteria.
2. Weighting of the data file to correct sampling biases:
The data file for the Jewish sector was weighted according to the variable
of affiliation with religion; the data file of the Arab sector was weighted by
the variable of religion. In the combination of data for the whole sample,
each sector was assigned the weighting in accordance with its weight in
the population.
3. Building the indicators:
The findings of the analysis of the components served as the basis for
creating the indicators. An indicator was formed from items that the
component analysis identified as belonging to the same content domain
and whose internal consistency is Cronbach's α ≥0.60.2 The test of internal
consistency of the measure that is the result of two questions was
conducted by means of an examination of the simple correlation
coefficient. The tests were conducted on each of the groups, teenagers and
young people, separately.
4. Examining the link between socio-demographic characteristics:
The connection between the socio-demographic characteristics was
examined only in the Jewish sector.3 When it was possible to join several
questions into a combined indicator, the common indicator was examined.
The socio-demographic characteristics that were examined were:
nationality, age group, gender, religiosity, and self-positioning on a left-
right continuum. In order to examine the link between the socio-
demographic characteristics and the value of the indicator, use was made
of variance analysis and the t test; the statistical significance of the links
with the individual item was examined by means of the chi-squared test.
2 When a component analysis indicates a common factor, it is justified to use the marginal value of
0.60. 3 The number of cases sampled from the Arab sector in each age group did not allow for further
segmentation.

26
5. Remarks about the data key:
a) In this chapter there are tables presenting the distribution of responses
to each of the research questions. These tables present data about the
whole sample and for each of the research groups, by nationality (Jews
and Arabs) and age. The tables that present the link, in the Jewish
sector, between socio-demographic characteristics and the answers to
the questions studied are presented in an appendix at the end of the
chapter (the number of the table in the appendix is the same as the
number of the respective table in the body of the chapter). In the body
of the chapter, only the insights derived from the tables are presented.
In order not to overburden the reader, in the tables presenting the link
between the socio-demographic characteristics and the positions
examined several answers were combined. The pattern of this
combination was determined by empirical considerations, in other
words, according to the full distribution of the answers. For example,
when the empirical distribution showed that the correct cut-off point
was between "strongly agree" and "somewhat agree" but empirically
there is no cut-off point between "somewhat disagree" and "strongly
disagree, the two categories of the latter questions were combined
whereas the former two were separately presented. When the scale of
the questions was numerical, the criterion for combination was equal
distribution, to the extent possible, between the combined categories
(quintiles, quartiles, tertiles). The averages presented in the table were
based on the detailed distribution (in which there are 5 or 10 levels)
and not on the combined data.
b) Each of the parts in the chapter on findings is divided into sub-
chapters. In each sub-chapter, each table is presented together with
questions relevant to it. The insights derived from the data in the
specific table appear after the table. In the narrative summary of the
link between the examined positions and the socio-demographic
characteristics, only the links that were found to be significant are
presented. If a particular link is not mentioned, this means that it was
not statistically significant. The summary of the findings about the

27
links is presented through the pattern of the link (for example, a rising
positive link, a type-U link, etc.). Sometimes only the layers in which
the responses differ significantly from the responses in other layers are
presented.
c) In this chapter, the precise level of statistical significance of the
various links or gaps was not stated. If a link or gap was mentioned as
significant, that means that the level of significance was less than 0.05.
d) The questions are written in masculine form only for the sake of
convenience.
Findings
1. The identity of the interviewees – personal characteristics and aspirations
a. Identity of the interviewees
The survey examined the following personal characteristics:
o Employment situation (the questionnaire presented the
interviewees with various options of employment and they were
asked "which of the following best describes what you do at
present?")
o Economic support ("Do your parents support you economically in
any way, such as, for example, giving you money for housing,
helping with paying for your residence, buying you commodities
you need on a regular basis?")
o Level of religiosity (Jews only "How do you define yourself from a
religious point of view?")
o Positioning in terms of ideology ("How do you describe yourself
ideologically, politically?" The answers were on a right-left
continuum)

28
Table 2: Employment situation
Jews Arabs Total
Age Groups 51-51 15-12 51-51 15-12 51-51 15-12
Which of
the
following
best
describes
what you
are
doing at
present?
Studying 74.0% 46.2% 95.5% 34.6% 79.0% 43.2%
Specializing in a
particular
profession
2.0% 4.5%
18.1% 1.6% 8.0%
Working full time 4.7% 27.8% 1.9% 15.1% 4.1% 24.5%
Working part-time
because I haven't
found a full time
position
2.5% 3.1%
4.2% 1.9% 3.4%
Working in a part-
time position by
choice
7.1% 9.1% 2.6% 4.4% 6.0% 7.9%
Looking for work 3.3% 4.8%
4.9% 2.5% 4.9%
Not working and
not studying 3.9% 3.4%
18.6% 3.0% 7.3%
Don't know/refuse 2.5% 1.1%
1.9% .8%
Total 100.0% 100.0% 100.0% 100.0% 100.0% 100.0%
N 486 470 145 163 631 633

29
Table 3: Economic support
Jews Arabs Total
Age Groups 51-51 15-12 51-51 15-12 51-51 15-12
Do your
parents
support you
economically
in any way?
Such as, for
example,
giving you
money,
providing
housing,
helping with
paying for
your
residence,
buying you
commodities
you need on
a regular
basis?
Parents
support me
completely
54.6% 20.3% 63.5% 33.5% 56.7% 23.7%
Parents
support me
significantly
30.2% 41.8% 25.2% 26.9% 29.0% 38.0%
Parents help
me just a
little
8.8% 23.6% 7.5% 14.4% 8.5% 21.2%
Parents don't
help me at all 2.0% 10.6% 1.4% 9.6% 1.9% 10.4%
Parents don't
help me at all
and I even
support them
.3% 2.6%
15.6% .3% 5.9%
Don't
know/refuse 4.1% 1.0% 2.3%
3.7% .8%
Total 100.0% 100.0% 100.0% 100.0% 100.0% 100.0%
N 486 470 145 163 631 633
Figure 22: Economic support by parents, ages 21-24
23.7%
38.0%
21.2%
10.4%
5.9%
0%
5%
10%
15%
20%
25%
30%
35%
40%
Completely support
Significantly support
Modest support No support I support my parents

31
Data about the sample population and the gap between Jews and Arabs:
1. Teenagers – each national group separately and comparison between the
groups:
The great majority are studying and not working (74% of the Jews and 96% of
the Arabs). Most of them report that their parents support them economically
completely or significantly (85% of the Jews and 89% of the Arabs). As this
data shows, among the Arabs the proportion of teenagers who study and do
not work is higher than the respective proportion among the Jews. Conversely,
among the Jews, the proportion of teenagers who work full time is relatively
high (15% as against 5%). No differences were found between the two
national groups regarding the proportion of those supported by their parents.
2. Young people – each national group separately and comparison between the
groups:
Approximately half of the young people (51% in the Jewish sector and 53% in
the Arab sector) are studying. Some 60% of Jews and Arabs are supported by
their parents; 16% of the Arab young people support their parents. In the Arab
sector there is a relatively higher proportion of those who neither work nor
study than in the Jewish sector.
3. Gaps between teenagers and young people:
Only the expected gaps were found regarding employment and parental
support.
No gaps were found between gender groups, groups distinguished by
affiliation with religion, and positioning on the right-left continuum.

31
Table 4: Ideological positioning
Jews Arabs Total
Age group 51-51 15-12 51-51 15-12 51-51 15-12
How would
you define
yourself
ideologically
politically?
Very right-wing 13.1% 11.2% 1.6% 1.2% 10.5% 8.6%
Right-wing 32.5% 36.7% 5.9% 2.1% 26.4% 27.8%
Center right 19.1% 24.9% 3.9% 1.9% 15.6% 19.0%
Center 11.0% 8.6% 44.0% 34.5% 18.6% 15.3%
Center left 10.2% 9.2% 1.3% 2.9% 8.2% 7.6%
Left-wing 4.5% 4.4% 2.7% 10.8% 4.0% 6.0%
Very left-wing .4% .9% 2.0% 4.5% .8% 1.8%
Don't know/refuse 9.2% 4.1% 38.5% 42.1% 15.9% 13.9%
Total 100.0% 100.0% 100.0% 100.0% 100.0% 100.0%
N 486 470 145 163 631 633
Table 5: Level of religiosity
Jews
Age Group 51-51 15-12
How do you define yourself
from a religious point of view?
Secular 40.7% 40.8%
Traditional 35.6% 34.9%
Religious 9.8% 9.3%
Ultra-Orthodox 13.9% 15.0%
Total 100.0% 100.0%
N 486 470
Data for the sample groups and the gap between Jews and Arabs (positioned on a
right-left continuum:
When we talk of positioning on a right-left axis we cannot talk of teenagers and
young people in general, but we must distinguish between the two national groups. As
will be described below, Jewish teenagers and young people tend towards the right,
while Arabs position themselves in the center. Among the Arabs, a high percentage

32
does not position themselves on this continuum at all (39% of teenagers, 42% of
young people) and those that do position themselves tend towards the center (44% of
all teenagers, 35% of young people).
Affiliation with religion (Jews):
Approximately a quarter of the Jewish teenagers define themselves as religious (10%)
or ultra-Orthodox (14%); similar percentages of young people define themselves as
religious (9%), or ultra-Orthodox (15%).
b. Goals that the interviewees wish to attain at this stage of their lives
The questionnaire presented the interviewees with several goals and they were asked
("Which of these best expresses your goals in life?")
Table 6: Goals in life – mark two main goals
Jews Arabs Total
Age group 51-51 15-12 51-51 15-12 51-51 15-12
Which of
these best
expresses
your goals in
life?
Economic success 43.2% 63.0% 38.8% 41.2% 42.2% 57.3%
Obtaining higher
education 47.6% 37.7% 58.2% 33.3% 50.1% 36.5%
Enjoying life,
entertainment, good
meals, beach
34.5% 41.1% 33.3% 48.7% 34.2% 43.1%
Contributing to the
state and society 21.2% 16.6% 18.2% 9.4% 20.5% 14.8%
Volunteering for
important issues 8.0% 8.0% 8.3% 7.5% 8.1% 7.8%
Going to live
overseas 6.7% 7.9% 9.7% 4.2% 7.4% 6.9%
Contributing as
much as possible to
the IDF
15.2% 1.4% 4.5% .9% 12.8% 1.3%
Don't know/refuse 4.4% 3.7% 1.3% 2.2% 3.7% 3.3%
N 486 470 145 163 631 633

33
Figure 23: Goals in life – mark two main goals
1) Following are the goals according to the frequency the interviewees mentioned
them as the two main ones.
Table 7: Goals in life, ranked by order of importance
Jews Arabs
Age group 51-51 15-12 51-51 15-12
Obtaining higher education 5 3 5 3
Economic success 1 5 1 1
Pleasures in life 3 1 3 5
Contribution to society 2 2 2 2
Contribution to IDF 1 7 7 7
Volunteer work 6 1-6 6 1
Emigrating overseas 7 1-6 1 6
2) Among teenagers in both the Arab sector and the Jewish sector, the most
prominent goal is obtaining higher education (48% among the Jews and 58%
among the Arabs mentioned this as one of their two main goals).
Among the young people, Jews and Arabs, hedonistic goals are prominent.
Among the Jews, economic success is in the first place (63%) and pleasures in
life is in the second place (41%); among the Arabs the same goals are
prominent but in reverse order – pleasures in life (49%), economic success
(41%).
43
.20
%
47
.60
%
34
.50
%
63
.00
%
37
.70
%
41
.10
%
38
.80
% 5
8.2
0%
33
.30
%
41
.20
%
33
.30
% 48
.70
%
0%
10%
20%
30%
40%
50%
60%
70%
Economic success
Obtaining higher
education
Enjoying life Contributing to the state and society
Volunteering Going to live overseas
Contributing to the IDF
Don't know
Jews 15-18 Jews 21-24 Arabs 15-18 Arabs 21-24

34
3) Among the teenagers, the girls aspire more to obtain higher education (54% as
compared with 46% for the boys) and the boys aspire more to economic
success (47% compared with 39%). No gender differences were found among
the young people.
Among the teenagers, there is a gradual increase in the desire to obtain higher
education as the affiliation with religion increases (from 49% among the
secular ones to 60% among the ultra-Orthodox). The desire for economic
success is particularly prominent among the ultra-Orthodox (51%) and is
lowest among the religious (32%). The desire to enjoy life decreases in
correlation with the affiliation with religion (from 48% among the secular to
14% and 21% among the religious and the ultra-Orthodox respectively).
Contributing to the state is particularly notable among the religious (58%). For
young people, the desire to enjoy life is prominent among the secular and the
traditional (52% and 47%, respectively) and the desire to contribute to the
state is notable among the religious (49%).
c. Sense of belonging
The interviewees were asked "Which of the following sentences is most
correct for you? – I feel like a citizen with rights equal to other citizens/ I feel
that I don't belong to Israeli society".
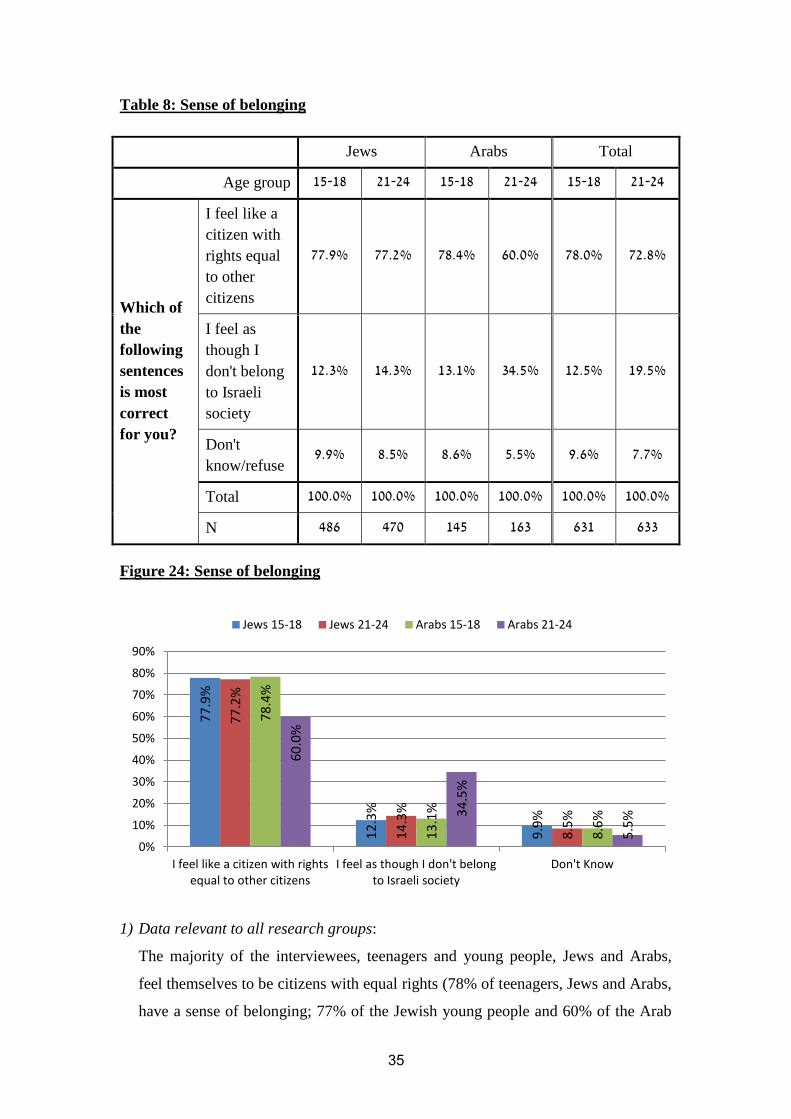
35
Table 8: Sense of belonging
Jews Arabs Total
Age group 51-51 15-12 51-51 15-12 51-51 15-12
Which of
the
following
sentences
is most
correct
for you?
I feel like a
citizen with
rights equal
to other
citizens
77.9% 77.2% 78.4% 60.0% 78.0% 72.8%
I feel as
though I
don't belong
to Israeli
society
12.3% 14.3% 13.1% 34.5% 12.5% 19.5%
Don't
know/refuse 9.9% 8.5% 8.6% 5.5% 9.6% 7.7%
Total 100.0% 100.0% 100.0% 100.0% 100.0% 100.0%
N 486 470 145 163 631 633
Figure 24: Sense of belonging
1) Data relevant to all research groups:
The majority of the interviewees, teenagers and young people, Jews and Arabs,
feel themselves to be citizens with equal rights (78% of teenagers, Jews and Arabs,
have a sense of belonging; 77% of the Jewish young people and 60% of the Arab
77
.9%
12
.3%
9.9
%
77
.2%
14
.3%
8.5
%
78
.4%
13
.1%
8.6
%
60
.0%
34
.5%
5.5
%
0%
10%
20%
30%
40%
50%
60%
70%
80%
90%
I feel like a citizen with rights equal to other citizens
I feel as though I don't belong to Israeli society
Don't Know
Jews 15-18 Jews 21-24 Arabs 15-18 Arabs 21-24
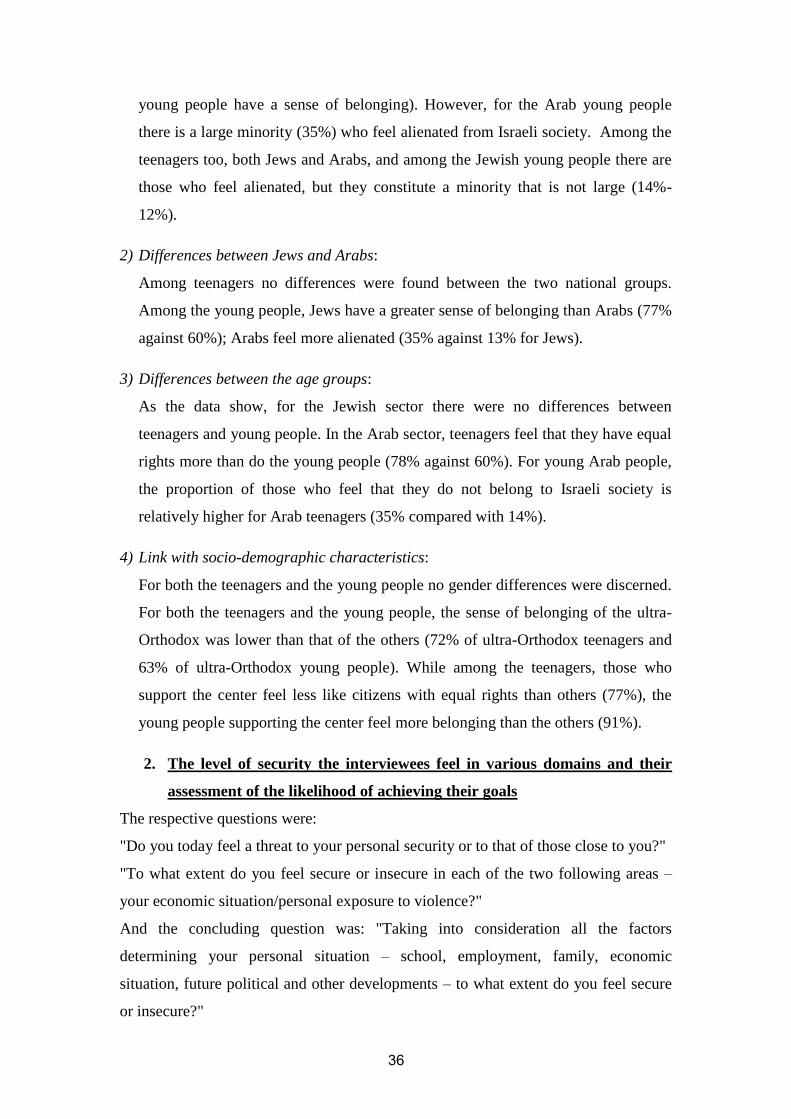
36
young people have a sense of belonging). However, for the Arab young people
there is a large minority (35%) who feel alienated from Israeli society. Among the
teenagers too, both Jews and Arabs, and among the Jewish young people there are
those who feel alienated, but they constitute a minority that is not large (14%-
12%).
2) Differences between Jews and Arabs:
Among teenagers no differences were found between the two national groups.
Among the young people, Jews have a greater sense of belonging than Arabs (77%
against 60%); Arabs feel more alienated (35% against 13% for Jews).
3) Differences between the age groups:
As the data show, for the Jewish sector there were no differences between
teenagers and young people. In the Arab sector, teenagers feel that they have equal
rights more than do the young people (78% against 60%). For young Arab people,
the proportion of those who feel that they do not belong to Israeli society is
relatively higher for Arab teenagers (35% compared with 14%).
4) Link with socio-demographic characteristics:
For both the teenagers and the young people no gender differences were discerned.
For both the teenagers and the young people, the sense of belonging of the ultra-
Orthodox was lower than that of the others (72% of ultra-Orthodox teenagers and
63% of ultra-Orthodox young people). While among the teenagers, those who
support the center feel less like citizens with equal rights than others (77%), the
young people supporting the center feel more belonging than the others (91%).
2. The level of security the interviewees feel in various domains and their
assessment of the likelihood of achieving their goals
The respective questions were:
"Do you today feel a threat to your personal security or to that of those close to you?"
"To what extent do you feel secure or insecure in each of the two following areas –
your economic situation/personal exposure to violence?"
And the concluding question was: "Taking into consideration all the factors
determining your personal situation – school, employment, family, economic
situation, future political and other developments – to what extent do you feel secure
or insecure?"

37
(Aside from the first question about personal security, the answers to the questions
were given on a scale of 1-10 where 1 was completely insecure and 10 was
completely secure).
An additional question dealt with the interviewees' perception of the likelihood of
their achieving their goals: "To what extent are you sure or unsure that you will be
able to achieve your personal goals in Israel?"
Table 9: Level of economic security
Jews Arabs Total
Age group 51-51 15-12 51-51 15-12 51-51 15-12
To what
extent do you
feel secure or
insecure
about your
economic
situation
where 1 is
completely
insecure and
10 is
completely
secure
1-5 20.8% 38.0% 6.9% 26.8% 17.6% 35.1%
6-7 28.1% 39.5% 17.6% 36.5% 25.7% 38.7%
8-10 38.9% 20.4% 75.4% 36.8% 47.3% 24.6%
Don't
know/refuse 12.2% 2.2% 9.4% 1.6%
Total 100.0% 100.0% 100.0% 100.0% 100.0% 100.0%
N 486 470 145 163 631 633
Average 7.0 6.0 8.6 6.7 7.4 6.2
Standard
deviation 2.0 1.9 1.9 2.0 2.1 2.0
Frequency 426 460 145 163 571 623
Minimum 1 1 2 1 1 1
Maximum 10 10 10 10 10 10

38
Table 10: Level of exposure to personal violence
Jews Arabs Total
Age group 51-51 15-12 51-51 15-12 51-51 15-12
To what
extent do you
feel secure or
insecure
about
personal
exposure to
violence,
where 1 is
completely
insecure and
10 is
completely
secure
1-4 29.9% 29.2% 21.9% 31.4% 28.1% 29.7%
5-8 32.3% 39.6% 13.4% 28.5% 28.0% 36.7%
9-10 29.8% 27.5% 59.8% 38.6% 36.7% 30.3%
Don't
know/refuse 8.0% 3.8% 4.9% 1.6% 7.3% 3.2%
Total 100.0% 100.0% 100.0% 100.0% 100.0% 100.0%
N 486 470 145 163 631 633
Average 6.2 6.2 7.6 6.3 6.6 6.2
Standard
deviation 3.1 3.0 3.5 3.6 3.2 3.2
Frequency 447 452 138 161 585 613
Minimum 1 1 1 1 1 1
Maximum 10 10 10 10 10 10
Table 11: Threat to personal security or of those close to you
Jews Arabs Total
Age group 51-51 15-12 51-51 15-12 51-51 15-12
Do you feel a
threat to
your
personal
security or to
that of those
close to you?
Feel a very
great threat 6.6% 5.3% 4.6% 1.1% 6.2% 4.2%
Feel a fairly
great threat 22.9% 29.4% 5.0% 2.8% 18.8% 22.6%
Feel a fairly
low threat 43.6% 43.7% 29.0% 22.7% 40.2% 38.3%
Feel no threat
at all 20.7% 18.4% 60.0% 71.6% 29.7% 32.1%
Don't
know/refuse 6.2% 3.2% 1.3% 1.8% 5.1% 2.9%
Total 100.0% 100.0% 100.0% 100.0% 100.0% 100.0%
N 486 470 145 163 631 633

39
Table 12: General level of security
Jews Arabs Total
Age group 51-51 15-12 51-51 15-12 51-51 15-12
Taking into
consideration all the
factors determining
your personal situation
– school, employment,
family, economic
situation, future
political and other
developments – to what
extent do you feel secure
or insecure? Where 1 is
completely insecure and
10 is completely secure.
1-5 13.4% 19.2% 8.2% 11.3% 12.2% 17.2%
6-7 32.4% 38.0% 30.4% 29.9% 31.9% 35.9%
8 29.3% 24.2% 18.8% 16.7% 26.9% 22.3%
9-10 25.0% 18.6% 42.5% 42.1% 29.0% 24.6%
Total 100.0% 100.0% 100.0% 100.0% 100.0% 100.0%
N 486 470 145 163 631 633
Average 7.4 7.0 8.1 7.9 7.6 7.3
Standard
deviation 1.6 1.7 1.7 1.8 1.7 1.8
Frequency 486 470 145 163 631 633
Minimum 1 2 4 1 1 1
Maximum 10 10 10 10 10 10
1) The various dimensions of the security cannot be explained by a common
factor and the links between them are not strong. Theoretically, this means that
it is not possible to address the sense of security, in general, beyond assessing
all the subjects that determine the security of the individuals. Nonetheless, as
is evident from the interviewees' reactions, most of them are able to report that
they feel a general level of security. So it seems that individuals can sum up
their assessment of their sense of security, but the factors contributing to this
differ for the individuals.
2) The overall feeling, for both teenagers and young people is that they are
secure, but this is not high.
Following are the averages that summarize the sense of security in general and the
sense of security in various domains:

41
Figure 25: Sense of security – summary (10-level scale)
3) Among the young people, Jews and Arabs, the sense of personal security in
the face of threat is higher than the security in other domains. Among the
teenagers, personal security is similar to security in other domains.
It is worth stating that more than a quarter of the Jewish teenagers (29%) and
approximately one-third (35%) of Jewish young people feels a high level or
fairly high level of threat to their personal security. Furthermore, 44% of
Jewish teenagers feel a low level of threat. Only about one-fifth (21%) of
Jewish teenagers feel no threat at all.
For Arab teenagers, the proportion of those who do not feel any threat at all is
significantly higher (60% of teenagers and 72% of young people).
4) Among the Jewish groups, the sense of economic security of teenagers is
higher than that of the young people. No differences were found between the
age groups regarding exposure to violence and personal security in the face of
threat. Moreover, no differences were found between the two age groups
regarding the overall sense of security.
Among the Arabs, there is no specific pattern of difference between the levels
of security of the various age groups.
5) Among both the teenagers and the young people no link was found between
the socio-demographic characteristics that were examined and economic
security, personal exposure to violence and general assessment of their
personal situation. However, in relation to personal security it was found that
7.4 7.0 6.3
7.1 7.0 6.0 6.2
6.9
8.1 8.6
7.6 8.6 8.9
6.7 6.3
9.1
0 1 2 3 4 5 6 7 8 9
10
General Security Economic security Exposure to violence Personal security in the face of threat
Jews 15-18 Jews 21-24 Arabs 15-18 Arabs 21-24

41
there were differences between the socio-demographic groups. Among both
the teenagers and the young people, girls experience a greater feeling of threat
than boys, and among the interviewees whose political positions were on the
left, the percentage that feels a great threat is relatively low.
Table 13: Perceptions about the likelihood of achieving goals
Jews Arabs Total
Age group 51-51 15-12 51-51 15-12 51-51 15-12
To what extent
do you feel sure
or unsure that
you will be able
to achieve your
personal goals in
Israel?
Very sure 15.5% 16.4% 23.9% 18.2% 17.4% 16.9%
Fairly sure 42.4% 38.3% 55.7% 50.5% 45.4% 41.5%
Not so sure 33.7% 38.2% 14.1% 19.3% 29.2% 33.3%
Not sure at
all 4.8% 5.0% 3.1% 6.9% 4.4% 5.5%
Don't
know/refuse 3.7% 2.0% 3.3% 5.1% 3.6% 2.8%
Total 100.0% 100.0% 100.0% 100.0% 100.0% 100.0%
N 486 470 145 163 631 633
1) Teenagers, two national groups and the differences between the groups:
Most of the teenagers, Jews and Arabs, are sure or fairly sure that they will be able to
achieve their personal goals in Israel (58% Jews and 80% Arabs). As is apparent from
the data, the proportion of Arab teenagers who think that they will be able to achieve
their goals in Israel is higher than the respective proportion among the Jews.
2) Young people, two national groups and the differences between the groups:
Most young people think that they will be able to achieve their personal goals in Israel
(55% of Jews and 69% of Arabs). However, attention must be paid to the proportion
of those who think that they will not be able to achieve their goals in Israel (43% of
Jews and 26% of Arabs). From this data, it is apparent that the proportion of Arab
young people who think they will be able to achieve their goals in Israel is higher than
the respective proportion of Jews (69% against 55%). Among the Jews, there is a
higher proportion of those who think they will not be able to achieve their goals (43%
against 26%).

42
3) Teenagers compared with young people:
In the Jewish sector no significant differences were found between teenagers and
young people. In the Arab sector, the proportion of teenagers who believe that they
will be able to achieve their goals in Israel is higher than the respective proportion
among the young people (80% against 69%).
4) For both age groups no gender differences were discerned; the closer to
religion the higher the level of certainty about achieving goals; and among the
supporters of the left, the proportion of those who were sure they could achieve their
goals in Israel was relatively low.
3. The importance attributed to various values
The importance attributed to various values was examined both by means of direct
questions and by means of questions that examine the value profile desirable for the
state.
One direct question related to two values – basic rights for minorities, freedom of
expression and the interviewees were asked to state: "To what extent is this important
or unimportant to you?" (The answers were on a 10- level scale where 1 was
completely unimportant and 10 was very important).
Another direct question concerned preferences in case of a conflict between the
requirements of democracy and the requirements of state security: "Sometimes the
principles of democracy clash with the needs of state security. When that occurs, what
should be the decisive factor – the requirements of the state or the democratic
values?"
Indirect questions dealt with the desired value profile of the state. The interviewees
were presented with a list of characteristics of states – economic equality between
citizens, democracy, the nation-state (for Arabs, a state of all citizens), peace with the
neighboring states, full equality for political rights for all, high standard of living,
gender equality – for each of these they were asked to "State if it is important or
unimportant for you that this should exist in the State of Israel." The answers were
given on a 5-level scale where 1 was completely unimportant, 5 was very important.
Another question related to the conflict between the needs of democracy and the
security needs of the state.
Tables 14-17 present the interviewees' reactions:

43
Table 14: Level of importance attributed to giving basic rights to minorities
Jews Arabs Total
Age group 51-51 15-12 51-51 15-12 51-51 15-12
To what
extent is it
important or
unimportant
to you that
basic rights
should be
given to
minorities,
where 1 is
completely
unimportant
and 10 is
very
important?
1-5 18.7% 30.9% 3.3% 8.0% 15.1% 25.0%
6-7 20.4% 22.4% 6.9% 6.6% 17.3% 18.3%
8-9 26.5% 21.6% 12.6% 10.5% 23.3% 18.8%
10 27.7% 22.5% 76.3% 73.5% 38.9% 35.6%
Don't
know/refuse 6.7% 2.6% 1.0% 1.5% 5.4% 2.3%
Total 100.0% 100.0% 100.0% 100.0% 100.0% 100.0%
N 486 470 145 163 631 633
Average 7.5 6.8 9.4 9.1 8.0 7.4
Standard deviation 2.5 2.7 1.4 2.0 2.4 2.7
Frequency 453 458 144 161 597 619
Minimum 1 1 2 1 1 1
Maximum 10 10 10 10 10 10
Table 15: Level of importance attributed to freedom of expression
Jews Arabs Total
Age group 51-51 15-12 51-51 15-12 51-51 15-12
To what
extent is
freedom of
expression
important or
unimportant
to you, where
1 is completely
unimportant
and 10 is very
important?
1-7 26.1% 40.5% 9.2% 9.1% 22.2% 32.4%
8-9 34.9% 30.6% 7.1% 9.8% 28.5% 25.3%
10 35.6% 28.0% 82.8% 79.7% 46.4% 41.3%
Don't know/refuse 3.4% .8% 1.0% 1.5% 2.8% 1.0%
Total 100.0% 100.0% 100.0% 100.0% 100.0% 100.0%
N 486 470 145 163 631 633
Average 8.2 7.7 9.4 9.3 8.5 8.1
Standard deviation 2.2 2.1 1.5 1.8 2.1 2.2
Frequency 469 466 144 161 613 627
Minimum 1 1 1 1 1 1
Maximum 10 10 10 10 10 10

44
Table 16: Democratic principles against needs of state security
Jews Arabs Total
Age group 51-51 15-12 51-51 15-12 51-51 15-12
Sometimes
democratic
principles
clash with the
needs of state
security.
When that
occurs, what
should be the
determining
factor – state
security
requirements
or democratic
principles?
Always security
needs 33.0% 34.4% 20.8% 29.6% 30.2% 33.2%
Usually security
needs, except in
exceptional
circumstances
42.6% 47.2% 24.8% 16.6% 38.5% 39.3%
Usually democratic
principles except for
exceptional
circumstances
14.6% 14.8% 18.5% 19.6% 15.5% 16.0%
Democratic principles
always 1.7% 1.0% 17.7% 17.7% 5.4% 5.3%
Don't know/refuse 8.1% 2.6% 18.2% 16.6% 10.4% 6.2%
Total 100.0% 100.0% 100.0% 100.0% 100.0% 100.0%
N 486 470 145 163 631 633
Figure 26: Democratic principles against needs of state security
33
.0%
42
.6%
14
.6%
1.7
%
8.1
%
34
.4%
47
.2%
14
.8%
1.0
%
2.6
%
20
.8%
24
.8%
18
.5%
17
.7%
18
.2%
29
.6%
16
.6%
19
.6%
17
.7%
16
.6%
0%
5%
10%
15%
20%
25%
30%
35%
40%
45%
50%
Always security needs
Usually security needs, except in
exceptional circumstances
Usually democratic
principles except for exceptional circumstances
Democratic principles always
Don't know
Jews 15-18 Jews 21-24 Arabs 15-18 Arabs 21-24

45
Table 17: Profile of values desired by the state
For each of the following, state
if it is important or not
important to you that these
things should exist in the State
of Israel, where 1 is completely
unimportant and 5 is very
important
Jews Arabs Total
51-51 15-12 51-51 15-12 51-51 15-12
A state in
which there
is more
economic
equality
between the
citizens
1-3 23.3% 26.3% 1.3% 5.2% 18.2% 20.9%
4 29.4% 29.0% 8.7% 11.2% 24.6% 24.4%
5 43.6% 44.2% 89.0% 82.7% 54.1% 54.2%
Don't know/refuse 3.8% .5% 1.0% .9% 3.1% .6%
Total 100.0% 100.0% 100.0% 100.0% 100.0% 100.0%
N 486 470 145 163 631 633
Average 4.1 4.0 4.9 4.8 4.3 4.2
Standard deviation 1.0 1.1 .5 .6 1.0 1.0
Frequency 467 468 144 162 611 630
Minimum 1 1 1 2 1 1
Maximum 5 5 5 5 5 5
A
democratic
state
1-3 11.1% 16.4% 3.0% 4.6% 9.2% 13.3%
4 17.2% 26.6% 10.0% 9.3% 15.6% 22.1%
5 68.4% 56.4% 87.0% 86.2% 72.7% 64.1%
Don't know/refuse 3.4% .7% 2.6% .5%
Total 100.0% 100.0% 100.0% 100.0% 100.0% 100.0%
N 486 470 145 163 631 633
Average 4.5 4.4 4.8 4.8 4.6 4.5
Standard deviation .8 .9 .5 .6 .8 .8
Frequency 469 467 145 163 615 630
Minimum 1 1 2 2 1 1
Maximum 5 5 5 5 5 5

46
For each of the following, state
if it is important or not
important to you that these
things should exist in the State
of Israel, where 1 is completely
unimportant and 5 is very
important
Jews Arabs Total
51-51 15-12 51-51 15-12 51-51 15-12
1-3 3.7% 6.2% 4.7% 7.1%
A Jewish
State/ For
Arabs: A
state of all
citizens
4 9.3% 8.1% 9.0% 7.0%
5 85.7% 84.0% 86.3% 85.9%
Don't know/refuse 1.3% 1.7%
Total 100.0% 100.0% 100.0% 100.0%
N 486 470 145 163
Average 4.9 4.7 4.8 4.8
Standard deviation .5 .6 .6 .7
Frequency 431 447 145 163
Minimum 1 1 1 1
Maximum 5 5 5 5
A state living
in peace with
its neighbors
1-3 21.0% 22.6% 6.4% 6.1% 17.7% 18.3%
4 22.0% 27.6% 6.6% 7.3% 18.5% 22.3%
5 54.4% 49.2% 87.0% 86.6% 61.9% 58.9%
Don't know/refuse 2.6% .6% 2.0% .5%
Total 100.0% 100.0% 100.0% 100.0% 100.0% 100.0%
N 486 470 145 163 631 633
Average 4.2 4.1 4.8 4.8 4.3 4.3
Standard deviation 1.1 1.1 .7 .5 1.1 1.0
Frequency 473 467 145 163 618 630
Minimum 1 1 1 3 1 1
Maximum 5 5 5 5 5 5

47
For each of the following, state
if it is important or not
important to you that these
things should exist in the State
of Israel, where 1 is completely
unimportant and 5 is very
important
Jews Arabs Total
51-51 15-12 51-51 15-12 51-51 15-12
A state in
which all
groups have
full equality
in political
rights
1-3 28.9% 39.4% 4.3% 3.7% 23.2% 30.2%
4 26.2% 29.2% 8.0% 9.2% 22.0% 24.0%
5 40.6% 29.5% 87.7% 86.2% 51.4% 44.1%
Don't know/refuse 4.3% 1.9% .9% 3.3% 1.7%
Total 100.0% 100.0% 100.0% 100.0% 100.0% 100.0%
N 486 470 145 163 631 633
Average 4.0 3.7 4.8 4.8 4.2 4.0
Standard deviation 1.1 1.1 .6 .5 1.1 1.1
Frequency 465 461 145 162 610 623
Minimum 1 1 1 3 1 1
Maximum 5 5 5 5 5 5
A state with
a
high
standard of
living
1-3 10.2% 14.4% 2.3% 5.5% 8.3% 12.1%
4 24.3% 30.2% 7.9% 11.0% 20.5% 25.3%
5 63.5% 55.2% 88.1% 82.6% 69.2% 62.2%
Don't know/refuse 2.0% .2% 1.6% .9% 1.9% .4%
Total 100.0% 100.0% 100.0% 100.0% 100.0% 100.0%
N 486 470 145 163 631 633
Average 4.5 4.4 4.9 4.8 4.6 4.5
Standard deviation .8 .8 .5 .5 .7 .7
Frequency 476 469 143 162 619 631
Minimum 1 2 2 3 1 2
Maximum 5 5 5 5 5 5

48
For each of the following, state
if it is important or not
important to you that these
things should exist in the State
of Israel, where 1 is completely
unimportant and 5 is very
important
Jews Arabs Total
51-51 15-12 51-51 15-12 51-51 15-12
A state in
which
women and
men are
equal
1-3 16.5% 20.4% 2.0% 5.5% 13.1% 16.6%
4 17.3% 18.8% 9.2% 8.6% 15.5% 16.2%
5 64.1% 60.5% 87.8% 85.9% 69.6% 67.1%
Don't know/refuse 2.1% .2% 1.0% 1.8% .2%
Total 100.0% 100.0% 100.0% 100.0% 100.0% 100.0%
N 485 466 145 163 630 629
Average 4.4 4.3 4.9 4.8 4.5 4.4
Standard deviation 1.0 1.0 .4 .6 .9 .9
Frequency 475 465 144 163 619 628
Minimum 1 1 3 1 1 1
Maximum 5 5 5 5 5 5
1) It was found that the reactions to the direct questions about the importance of
democratic values (equal rights for minorities, freedom of expression, and
aspiration to a democratic country) have one common element and they can be
combined into one indicator (Cronbach α = .810). This element is not
common to other characteristics that the survey dealt with in the context of the
desired profile of the state – Jewish state/state of all citizens, peace, and high
standard of living – and the three have no common element.
2) The interviewees attribute great importance to democratic values. The
averages that express the importance of theoretical values and the importance
associated with the various components of the profile of the state are as
follows (on a 5-level scale).

49
Figure 27: Democratic values – summary
*The original scale had 10 levels; for the purposes of comparison it was changed into a 5-
level scale.
3) Despite the great importance attributed to democratic values among both the
Jews and the Arabs, in the two age groups, there was a preference for security
needs rather than democratic needs if a conflict were to arise between the two
factors: Among Jewish teenagers 74% would give preference to security and
18% to democracy; among the Arabs 46% expressed priority for security
against 36% for democracy.
Among Jewish young people 82% prioritized security over democracy 16%;
among the Arabs 46% prioritized security over 37% for democracy.
4) The data show that the Arabs assign greater importance to democratic values
than the Jews do. As noted, for both national groups there is a preference for
security needs, but this preference is significantly more prominent in the
Jewish sector than in the Arab sector.
5) No disparities were found between the age groups.
6) Regarding other values that are not expressions of democracy, it was found
that the importance attached to them was similar to that attached to democratic
values.
3.8 4.1 4.1 4
4.4 4.5
3.4 3.9 4
3.7
4.3 4.4 4.7 4.7 4.9 4.8 4.9 4.8 4.6 4.7 4.8 4.8 4.8 4.7
0
1
2
3
4
5
Minority rights*
Freedom of expression*
Economic equality
Equal political rights
Gender equality
Democratic state
Jews 15-18 Jews 21-24 Arabs 15-18 Arabs 21-24

51
Table 18: Other values – summary table
Jews Arabs
15-18 21-24 15-18 21-24
Jewish state/all citizens 2.4 2.7 2.1 2.1
A state at peace with its neighbors 2.1 2.5 2.1 2.1
High standard of living 2.1 2.2 2.4 2.1
7) Both among the teenagers and the young people no gender disparities were
found for the above values. The more closly people were affiliated to religion
the more the importance of democratic values decreased. Both for teenagers
and for young people no link was found between how the individual
positioned himself on political positions and the importance attached to
democratic values.
8) With regard to other values whose importance was examined in this survey –
Jewish state/state of all citizens, peace, high standard of living – no link was
found between the socio-demographic characteristics and the importance
attributed to these values.
4. Perceptions about the state
This chapter examines the following subjects:
- The positioning of the state according to various subjects
- Trust in government institutions
- The problems and the disputes that threaten the state
- The level of optimism (or pessimism) about the future of the state
a. Positioning of the state according to various indicators
The interviewees were presented with several components of democracy and were
asked "For each of them, please state if it exists in the State of Israel at an appropriate
level, too much, or too little".

51
Table 19: Profile of the State of Israel by indicators relating to democracy,
according to interviewees' perceptions
Jews Arabs Total
51-51 15-12 51-51 15-12 51-51 15-12
Majority rule
Exists too little 19.2% 26.8% 13.7% 28.0% 17.9% 27.1%
Exists in
appropriate
amount
54.9% 48.4% 50.1% 36.4% 53.8% 45.3%
Too much 14.3% 15.5% 30.6% 30.6% 18.0% 19.4%
Don't know/
refuse 11.7% 9.3% 5.6% 5.0% 10.3% 8.2%
Total 100.0% 100.0% 100.0% 100.0% 100.0% 100.0%
N 486 470 145 163 631 633
Minority
rights,
protection
and
representation
of minorities
Exists too little 49.7% 43.1% 34.8% 71.7% 46.3% 50.4%
Exists in
appropriate
amount
28.7% 29.2% 45.6% 22.1% 32.6% 27.3%
Too much 11.3% 20.5% 15.0% 1.3% 12.1% 15.6%
Don't know/
refuse 10.3% 7.3% 4.6% 5.0% 9.0% 6.7%
Total 100.0% 100.0% 100.0% 100.0% 100.0% 100.0%
N 486 470 145 163 631 633
Freedom of
expression
Exists too little 24.9% 22.9% 37.0% 54.1% 27.6% 30.9%
Exists in
appropriate
amount
44.6% 46.6% 44.2% 37.1% 44.5% 44.1%
Too much 24.5% 27.9% 16.3% 4.5% 22.6% 21.9%
Don't know/
refuse 6.0% 2.7% 2.6% 4.3% 5.2% 3.1%
Total 100.0% 100.0% 100.0% 100.0% 100.0% 100.0%
N 486 470 145 163 631 633

52
Jews Arabs Total
51-51 15-12 51-51 15-12 51-51 15-12
Social
involvement
Exists too little 28.8% 40.1% 36.0% 58.9% 30.4% 44.9%
Exists in
appropriate
amount
54.2% 45.5% 43.4% 27.7% 51.7% 40.9%
Too much 7.8% 7.1% 14.0% 8.1% 9.2% 7.4%
Don't know/
refuse 9.2% 7.3% 6.6% 5.3% 8.6% 6.8%
Total 100.0% 100.0% 100.0% 100.0% 100.0% 100.0%
N 486 470 145 163 631 633
Equality
Exists too little 61.8% 60.1% 49.9% 72.3% 59.1% 63.2%
Exists in
appropriate
amount
29.4% 30.6% 32.2% 18.2% 30.1% 27.4%
Too much 3.7% 7.1% 14.7% 5.2% 6.3% 6.6%
Don't know/
refuse 5.0% 2.2% 3.3% 4.3% 4.6% 2.8%
Total 100.0% 100.0% 100.0% 100.0% 100.0% 100.0%
N 486 470 145 163 631 633
1) It was found that there is a common factor in the assessment given to the state
according to various indicators (Cronbach α =0.62).
2) In each of the groups in the research there is no majority for those who
thought that the values surveyed exist in the state to an appropriate degree,
except for teenagers in which there is a majority (even though it is small) who
state that in relation to two value components – majority rule and social
involvement – that they do exist in the state at an appropriate level.
53
Figure 28: Distribution of the interviewees who think that the following values
exist in the state to the appropriate degree
3) Disparities between the national groups:
In the Jewish sector, the two characteristics that were perceived as existing to
a more appropriate degree than others were majority rule and social
involvement and after them came freedom of expression. The two
characteristics that were perceived as existing to a lesser degree than others
were minority rights and equality. In the Arab sector, the two most prominent
characteristics that exist to an appropriate degree were majority rule and
freedom of expression and after that came social involvement. The subjects
perceived as less prominent were, like in the Jewish sector, minority rights and
equality.
4) Disparities between the age groups:
In the Jewish sector, with regard to two values, majority rule and social
involvement, more teenagers than young people thought that they exist in the
state to an appropriate degree (55% against 48% and 54% against 46%
respectively.
In the Arab sector, in four out of the five values examined, teenagers thought
more than young people that they are present in the state to an appropriate
degree: majority rule (50% against 16%), protection of minority rights (46%
against 22), social involvement 43% against 28%) and equality (32% against
18%).
55
%
54
%
46
%
28
%
28
%
48
%
46
%
47
%
29
%
30
%
50
%
43
%
44
%
46
%
32
%
36
%
29
% 3
7%
22
%
18
%
0%
10%
20%
30%
40%
50%
60%
Majority rule Social involvement Freedom of expression
Minority rights Equality
Jews 15-18 Jews 21-24 Arabs 15-18 Arabs 21-24

54
5) In examining the link between socio-demographic characteristics and the
average assessments of the state according to the various indicators mentioned,
it is apparent that in the two age groups there are no gender differences and
there are no differences between the groups that are differentiated according to
their affiliation with religion. In both age groups there was a gradual decrease
in the average of the assessment given to the situation in the state as the
individual's positioning tended more to the left. Among teenagers, from 1.8
among those who position themselves as on the right, to 1.6 among those who
position themselves in the center, to 1.5 among those who position themselves
on the left. Among the young people the respective values were 1.9, 1.7 and
1.4.
b. Trust in government institutions
The survey addressed the following institutions: the Israel Defense Forces (IDF), legal
system, the Knesset, the media, religious institutions, the police, the political parties,
and the Histadrut General Federation of Labor. For each of these, the interviewees
were asked to state "To what extent do you or do you not trust them (you rely or don't
rely on them)?"
Table 20: Trust in government institutions
Jews Arabs Total
51-51 15-12 51-51 15-12 51-51 15-12
IDF
Have complete trust 44.7% 36.2% 14.1% 19.1% 37.7% 31.8%
Have trust 42.2% 47.2% 24.6% 18.5% 38.2% 39.8%
Have almost no trust 6.6% 11.1% 19.6% 16.3% 9.6% 12.5%
Have no trust at all 1.1% 4.6% 21.5% 25.7% 5.8% 10.1%
Don't know/refuse 5.3% .8% 20.2% 20.5% 8.7% 5.9%
Total 100.0% 100.0% 100.0% 100.0% 100.0% 100.0%
N 486 470 145 163 631 633

55
Jews Arabs Total
51-51 15-12 51-51 15-12 51-51 15-12
Legal
system
Have complete trust 13.0% 5.8% 8.9% 17.5% 12.1% 8.8%
Have trust 45.9% 42.1% 30.1% 36.9% 42.2% 40.8%
Have almost no trust 25.1% 33.5% 21.0% 20.0% 24.2% 30.1%
Have no trust at all 8.9% 17.0% 17.6% 12.1% 10.9% 15.7%
Don't know/refuse 7.1% 1.5% 22.5% 13.5% 10.6% 4.6%
Total 100.0% 100.0% 100.0% 100.0% 100.0% 100.0%
N 486 470 145 163 631 633
The
Knesset
Have complete trust 4.4% 1.5% 7.2% 3.3% 5.0% 1.9%
Have trust 32.8% 23.1% 28.6% 28.5% 31.9% 24.5%
Have almost no trust 41.1% 44.6% 23.6% 33.3% 37.1% 41.7%
Have no trust at all 12.4% 28.6% 16.6% 20.8% 13.3% 26.6%
Don't know/refuse 9.3% 2.2% 24.1% 14.2% 12.7% 5.3%
Total 100.0% 100.0% 100.0% 100.0% 100.0% 100.0%
N 486 470 145 163 631 633
The media
Have complete trust 4.6% 1.8% 7.8% 5.5% 5.3% 2.8%
Have trust 32.9% 19.5% 22.4% 35.9% 30.5% 23.7%
Have almost no trust 33.3% 40.7% 27.7% 28.0% 32.0% 37.4%
Have no trust at all 23.7% 36.8% 21.1% 20.2% 23.1% 32.5%
Don't know/refuse 5.6% 1.2% 21.0% 10.4% 9.1% 3.6%
Total 100.0% 100.0% 100.0% 100.0% 100.0% 100.0%
N 486 470 145 163 631 633
Religious
institutions
like the
Rabbinate/
for Arabs
only
religious
institutions
Have complete trust 14.1% 9.3% 10.6% 7.7% 13.3% 8.9%
Have trust 23.9% 23.2% 30.0% 38.4% 25.3% 27.1%
Have almost no trust 22.0% 25.1% 17.7% 19.2% 21.0% 23.6%
Have no trust at all 30.3% 38.5% 19.3% 18.6% 27.8% 33.3%
Don't know/refuse 9.7% 4.0% 22.4% 16.1% 12.6% 7.1%
Total 100.0% 100.0% 100.0% 100.0% 100.0% 100.0%
N 486 470 145 163 631 633
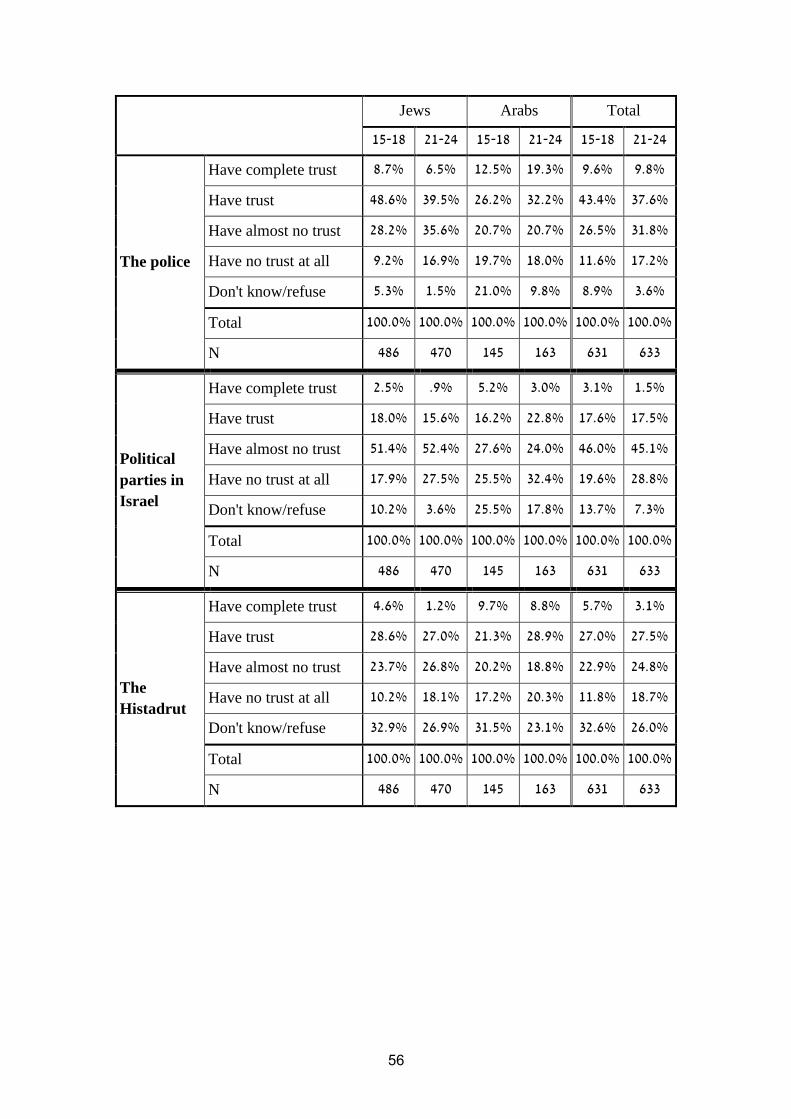
56
Jews Arabs Total
51-51 15-12 51-51 15-12 51-51 15-12
The police
Have complete trust 8.7% 6.5% 12.5% 19.3% 9.6% 9.8%
Have trust 48.6% 39.5% 26.2% 32.2% 43.4% 37.6%
Have almost no trust 28.2% 35.6% 20.7% 20.7% 26.5% 31.8%
Have no trust at all 9.2% 16.9% 19.7% 18.0% 11.6% 17.2%
Don't know/refuse 5.3% 1.5% 21.0% 9.8% 8.9% 3.6%
Total 100.0% 100.0% 100.0% 100.0% 100.0% 100.0%
N 486 470 145 163 631 633
Political
parties in
Israel
Have complete trust 2.5% .9% 5.2% 3.0% 3.1% 1.5%
Have trust 18.0% 15.6% 16.2% 22.8% 17.6% 17.5%
Have almost no trust 51.4% 52.4% 27.6% 24.0% 46.0% 45.1%
Have no trust at all 17.9% 27.5% 25.5% 32.4% 19.6% 28.8%
Don't know/refuse 10.2% 3.6% 25.5% 17.8% 13.7% 7.3%
Total 100.0% 100.0% 100.0% 100.0% 100.0% 100.0%
N 486 470 145 163 631 633
The
Histadrut
Have complete trust 4.6% 1.2% 9.7% 8.8% 5.7% 3.1%
Have trust 28.6% 27.0% 21.3% 28.9% 27.0% 27.5%
Have almost no trust 23.7% 26.8% 20.2% 18.8% 22.9% 24.8%
Have no trust at all 10.2% 18.1% 17.2% 20.3% 11.8% 18.7%
Don't know/refuse 32.9% 26.9% 31.5% 23.1% 32.6% 26.0%
Total 100.0% 100.0% 100.0% 100.0% 100.0% 100.0%
N 486 470 145 163 631 633

57
Figure 29: Trust in government institutions, have trust or complete trust
1) It was found that there was one common factor in the degree of trust that the
interviewees give to the various government institutions. An examination of
the correlation between the degrees of trust in various institutions, between
one another, shows that they can be joined together into one combined
indicator (Cronbach α =0 .63) which can be termed "Trust in government
institutions".
2) Most of the interviewees did not display trust in most of the government
institutions that the study covered. Following is the order of the government
institutions according to the percentage of interviewees who trust in them (1 is
the institute having the highest level of trust and 8 indicates the institute in
which the trust was the lowest).
86
.9%
58
.9%
37
.2%
37
.5%
38
.0%
57
.3%
20
.5%
33
.2%
83
.4%
47
.9%
24
.6%
21
.3%
32
.5%
46
.0%
16
.5%
28
.2%
38
.7%
39
.0%
35
.8%
30
.2%
40
.6%
38
.7%
21
.4%
31
.0%
37
.6%
54
.4%
31
.8%
41
.4%
46
.1%
51
.5%
25
.8%
37
.7%
0%
10%
20%
30%
40%
50%
60%
70%
80%
90%
IDF Legal system
The Knesset
The media Religious institutions
The police Political parties
The Histadrut
Jews 15-18 Jews 21-24 Arabs 15-18 Arabs 21-24

58
Table 21: Trust in government institutions, ranked in order
Jews Arabs
Age group 51-51 15-12 51-51 15-12
IDF 5 5 5-2 1-6
Legal system 1 1-3 5-2 5-1
Police 3 1-3 5-2 5-1
Media 2-1 7 6-7 2
Knesset 2-1 1-6 1 7-1
Religious institutions 6-7 2 5-2 3
Histadrut 6-7 1-6 6-7 1-6
Political parties 1 1 1 7-1
In the Jewish sector, for both age groups, only the IDF has the majority of those
trusting in it (87% among teenagers and 83% among young people). Among teenagers
there are two other institutions, both of them from the field of legal enforcement that
are trusted by most of the interviewees, the legal system (59%) and the police (57%);
the other institutions examined by the study do not enjoy a majority of persons
trusting in them.
In the Arab sector, among teenagers none of the government institutions obtain a
majority who trust them. In this age group, the proportion of those who did not know
how to decide whether it was possible or not possible to trust the institutions was
especially high (between 20% who were undecided about the IDF up to 33% who
were undecided about the Histadrut). Among the Arab young people, only the
institutions in charge of law enforcement obtained a majority who trusted in them: the
legal system (54%) and the police (52%).
3) As expected, no correlation was found between the two national groups
regarding the ranking of the government institutions by percentage of the
interviewees who trusted them.
4) In each of the national groups no correlation was found between the two age
groups regarding the order of the institutions that are trusted.

59
5) Both among the teenagers and the young people no link was found between
socio-demographic characteristics and the component of trust in government
institutions, that is, the average trust in government institutions (aside from all
the government institutions that were studied).
c. The problems and disputes that threaten the state
The interviewees were presented with a list of problems and were asked: "Which of
the two problems that the State of Israel is grappling with today are the most
important two problems to which the government must give first priority."
The question about the tensions that constitute a threat to the state listed
disagreements and the interviewees were asked "Which of these disputes most
endangers Israeli society?"
Table 22: The most important problems that the government must deal with
Jews Arabs Total
51-51 15-12 51-51 15-12 51-51 15-12
Which of
the
following
problems
that Israel
grapples
with today
are the two
most
important
problems
that the
government
must assign
the highest
priority
Level of living
expenses/social
gaps
61.1% 73.9% 34.7% 47.3% 55.0% 67.1%
National
security/terror 61.9% 62.0% 11.1% 16.8% 50.2% 50.3%
Education 27.3% 30.0% 45.3% 25.9% 31.4% 28.9%
Relations
between Jews
and Arabs in
Israel
23.3% 14.7% 39.7% 54.0% 27.1% 24.8%
Advancing the
negotiations
between Israel
and the
Palestinians
13.0% 11.8% 27.9% 11.0% 16.4% 11.6%
Don't
know/refuse 2.5% .4% 4.8% 3.4% 3.0% 1.2%
Total 189.1% 192.8% 163.5% 158.4% 183.2% 183.9%
N 486 470 145 163 631 633

61
Figure 30: The most important problems that the government must deal with
Table 23: The disputes that most endanger Israeli society
Jews Arabs Total
51-51 15-12 51-51 15-12 51-51 15-12
Which
dispute
most
endangers
Israeli
society?
Between Jewish
and Arab
citizens of Israel
50.1% 40.2% 48.0% 55.0% 49.6% 44.0%
Between the
right-wing and
the left-wing
26.6% 30.6% 10.4% 8.9% 22.9% 25.0%
Between the
religious and the
secular
9.3% 14.9% 7.9% 14.7% 9.0% 14.8%
Between the rich
and the poor 5.0% 8.0% 22.9% 6.6% 9.1% 7.6%
Between
Ashkenazim and
Mizrahim4
2.5% 2.7% .7% 3.0% 2.1% 2.7%
Don't
know/refuse 6.6% 3.7% 10.1% 11.8% 7.4% 5.8%
Total 100.0% 100.0% 100.0% 100.0% 100.0% 100.0%
N 486 470 145 163 631 633
4 Ashkenazim - Jews descended mainly from Central and Eastern Europe .Mizrahim - Jews descended
mainly from the Middle East and North Africa.
61
.1%
61
.9%
27
.3%
23
.3%
13
.0%
2.5
%
73
.9%
62
.0%
30
.0%
14
.7%
11
.8%
0.4
%
34
.7%
11
.1%
45
.3%
39
.7%
27
.9%
4.8
% 47
.3%
16
.8%
25
.9%
54
.0%
11
.0%
3.4
%
0% 10% 20% 30% 40% 50% 60% 70% 80%
Level of living expenses/social
gaps
National security/terror
Education Relations between Jews and Arabs in
Israel
Advancing the negotiations
between Israel and the
Palestinians
Don't know
Jews 15-18 Jews 21-24 Arabs 15-18 Arabs 21-24

61
Figure 31: The disputes that most endanger Israeli society
1) Following is the order of the problems that the interviewees in the various
samples assessed, by the degree of priority that should be given to dealing
with them (where 1 is the highest priority and 5 is the lowest):
Table 24: The most important problems that the government has to deal with,
ranked in order
Jews Arabs
Age group ,1-,. 7,-72 ,1-,. 7,-72
Cost of living expenses , , 5 7
National security/terror 7 7 1 2
Education 5 5 , 5
Relations between Jews and Arabs 2 2 7 ,
Advancing the negotiations between
Israel and the Palestinians 1 1 2 1
Aside from the fact that the topic of advancing negotiation between Israel and the
Palestinians was relegated to the bottom of the scale, there is a lack of correlation
between the perceptions of Jews and the perceptions of the Arabs regarding the
priority for problems requiring treatment. In the Jewish sector, there was a complete
correlation between the teenagers and the young people with regard to the ranking of
the problems in order of the importance attributed to them. In the Arab sector, there is
similarity between the two age groups, but it is not full correlation.
50.1%
26.6%
40.2%
30.6%
48.0%
10.4%
55.0%
8.9%
0%
10%
20%
30%
40%
50%
60%
Between Jewish and Arab
citizens of Israel
Between Left wing & Right
wing
Between secular and
religious people
Between rich and poor
Between Sephardim and
Ashkenazim
Don't know
Jews 15-18 Jews 21-24 Arabs 15-18 Arabs 21-24

62
2) The order of the disputes according to the extent to which they are perceived
as endangering Israeli society follows (where 1 indicates that the dispute
endangers Israeli society more than all the others and 5 less than all the
others).
Table 25: The disputes that most endanger Israeli society, ranked in order
Jews Arabs
Age group ,1-,. 7,-72 ,1-,. 7,-72
Between Jews and Arabs , , , ,
Between right-wing and left-wing 7 7 5 5
Between religious and secular 5 5 2 7
Between the rich and the poor 2 2 7 2
Between Ashkenazim and Mizrahim 1 1 1 1
All the groups in the sample agree both about the problem that most endangers Israeli
society – the dispute between Jews and Arabs – and about the problem that least
endangers Israeli society – the disputes between Ashkenazim and Mizrahim. In the
Jewish sector, there is full correlation and in the Arab sector there is almost full
correlation between teenagers and young people regarding the ranking of the disputes
by the level of danger that they pose to Israeli society.
3) With regard to the problems of the state considered most pressing both for the
teenagers and for the young people, there were no perceived gender
disparities.
4) Both among teenagers and among young people, the religious attribute greater
importance than others to national security (84% for teenagers and 75% for
young people). Both among teenagers and among young people, the
percentage of those attributing prime importance to advancing the negotiations
with the Palestinians is relatively higher among the secular (19% among
teenagers and 17% among the young people).
The subject of national security was particularly important for those
supporting the right (73% of teenagers and 71% of young people). The closer
their personal positioning on the right-left continuum was to the left, the

63
greater the importance given to advancing the negotiation between Israel and
the Palestinians was - increasing gradually - (among teenagers from 5% for
those positioning themselves on the right, to 17% positioning themselves in
the center, to 33% of those positioning themselves on the left; among the
young people the respective values were 5%, 29%, and 36%).
5) With regard to the disputes that endanger Israeli society, among the
teenagers no link was found between the socio-demographic factors that were
examined and the level of danger posed by the various disputes. Among the
young people, it was found that girls more than boys attribute threatening
power to disputes between Jewish and Arab citizens of Israel (47% against
34%), the secular and traditional persons perceive a greater threat than do the
religious and the ultra-Orthodox (44%-45%, as opposed to 28% and 37%
respectively). However, those who positioned themselves on the left perceive
a lower threat in this dispute than do the other interviewees (30%). The
disputes between right and left are less threatening for the secular and the
ultra-Orthodox than for the traditional and the religious.
d. Level of optimism (or pessimism) about the future of the state
The concluding question in this chapter was "To what extent are you optimistic or
pessimistic about the future of the state?"
Table 26: Optimism or pessimism about the future of the state
Jews Arabs Total
51-51 15-12 51-51 15-12 51-51 15-12
To what
extent are
you
optimistic or
pessimistic
about the
future of the
state?
Very pessimistic 3.2% 7.2% 7.5% 9.0% 4.2% 7.7%
Fairly pessimistic 31.7% 39.4% 19.5% 15.9% 28.9% 33.3%
Fairly optimistic 44.9% 38.3% 41.2% 43.3% 44.1% 39.6%
Very optimistic 9.5% 8.6% 25.8% 16.2% 13.2% 10.6%
Don't
know/refuse 10.7% 6.6% 6.0% 15.5% 9.6% 8.9%
Total 100.0% 100.0% 100.0% 100.0% 100.0% 100.0%
N 486 470 145 163 631 633

64
Figure 32: Optimism or pessimism about the future of the state
1) A significant majority of the Arabs (67% of teenagers and 60% of the young
people) and a small majority of the Jewish teenagers (54%) were optimistic
about the future of the state. The Jewish young people were divided between
optimism and pessimism (47% each).
2) Arab teenagers and young people are more optimistic than Jews about the
future of the state.
3) For both national groups, the teenagers are slightly more optimistic than the
young people although the differences are not statistically significant.
4) In both age groups no gender disparities are found. In both age groups, the
religious people are more optimistic than the others (89% in both age groups)
and the secular are more pessimistic than the others (51% among the teenagers
and 63% among the young people). In both groups, as they move from right to
left, the optimism decreases and the pessimism increases.
5. Positions about Jewish-Arab coexistence
The interviewees were asked two questions about this subject: "To what extent
do you agree with or oppose the following assertion: Arab citizens of Israel
should be prohibited from being elected to the Knesset" and "Do you oppose
3.2
%
31
.7%
44
.9%
9.5
%
10
.7%
7.2
%
39
.4%
38
.3%
8.6
%
6.6
%
7.5
% 1
9.5
%
41
.2%
25
.8%
6.0
%
9.0
%
15
.9%
43
.3%
16
.2%
15
.5%
0%
5%
10%
15%
20%
25%
30%
35%
40%
45%
50%
Very pessimistic Fairly pessimistic Fairly optimistic Very optimistic Don't know
Jews 15-18 Jews 21-24 Arabs 15-18 Arabs 21-24
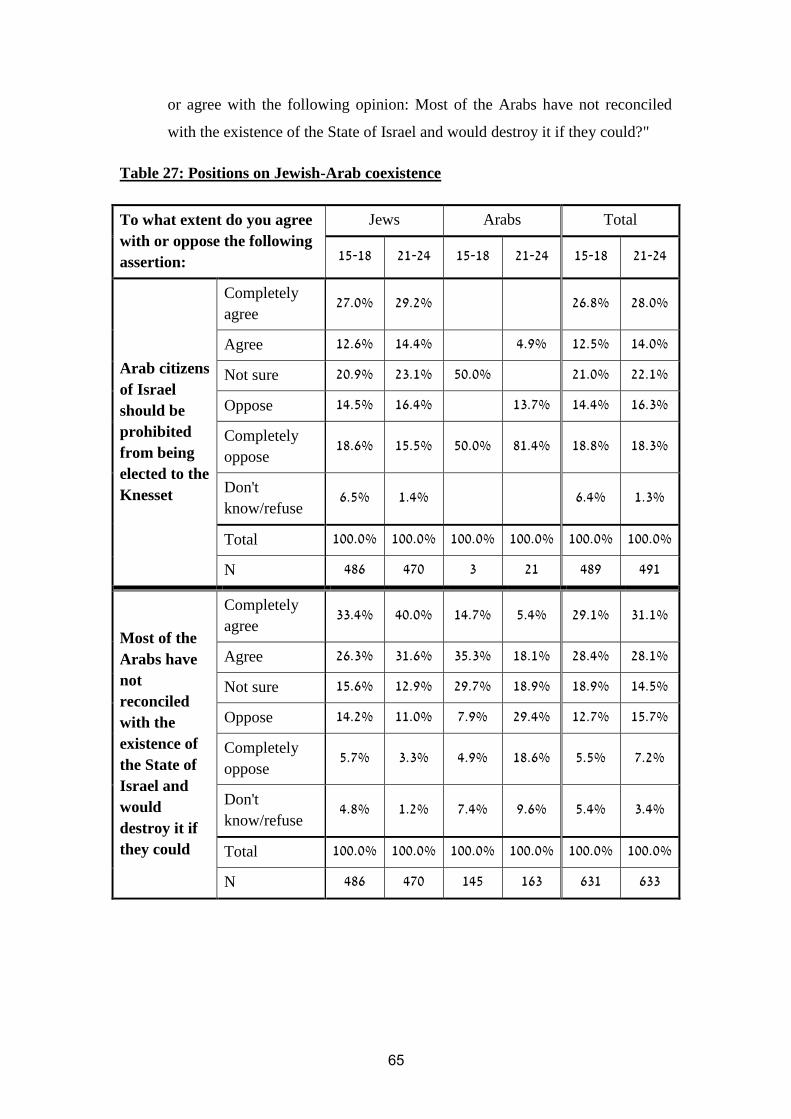
65
or agree with the following opinion: Most of the Arabs have not reconciled
with the existence of the State of Israel and would destroy it if they could?"
Table 27: Positions on Jewish-Arab coexistence
To what extent do you agree
with or oppose the following
assertion:
Jews Arabs Total
51-51 15-12 51-51 15-12 51-51 15-12
Arab citizens
of Israel
should be
prohibited
from being
elected to the
Knesset
Completely
agree 27.0% 29.2%
26.8% 28.0%
Agree 12.6% 14.4%
4.9% 12.5% 14.0%
Not sure 20.9% 23.1% 50.0%
21.0% 22.1%
Oppose 14.5% 16.4%
13.7% 14.4% 16.3%
Completely
oppose 18.6% 15.5% 50.0% 81.4% 18.8% 18.3%
Don't
know/refuse 6.5% 1.4%
6.4% 1.3%
Total 100.0% 100.0% 100.0% 100.0% 100.0% 100.0%
N 486 470 3 21 489 491
Most of the
Arabs have
not
reconciled
with the
existence of
the State of
Israel and
would
destroy it if
they could
Completely
agree 33.4% 40.0% 14.7% 5.4% 29.1% 31.1%
Agree 26.3% 31.6% 35.3% 18.1% 28.4% 28.1%
Not sure 15.6% 12.9% 29.7% 18.9% 18.9% 14.5%
Oppose 14.2% 11.0% 7.9% 29.4% 12.7% 15.7%
Completely
oppose 5.7% 3.3% 4.9% 18.6% 5.5% 7.2%
Don't
know/refuse 4.8% 1.2% 7.4% 9.6% 5.4% 3.4%
Total 100.0% 100.0% 100.0% 100.0% 100.0% 100.0%
N 486 470 145 163 631 633

66
Figure 33: "Arab citizens of Israel should be prohibited from being elected to the
Knesset", among Jews
1) More than a third (40%) of Jewish teenagers and 44% of Jewish young people
think that Arab citizens of Israel should be prohibited from being elected to the
Knesset.
2) Most of the Jewish interviewees agree with the opinion that states that most
Arabs have not become reconciled with the State of Israel and would destroy it
if they could (60% of teenagers and 72% of young people). It is worth noting
that among the Arabs, half of the teenagers and about a quarter of the young
people (23%) agree with this claim; it is possible that some of them related
only to the first part of the statement which says that Arabs have not become
reconciled to the existence of the State of Israel.
3) Among teenagers no gender disparities were found. Among the young people,
women more than men agree that Arab citizens of Israel should be prevented
from being elected to the Knesset (50% as opposed to 37%). In both age
groups, the closer the interviewees are to religion, and the closer they are to
the right, the more there is a gradual increase in the percentage of those
agreeing to those statements.
27.0%
12.6%
20.9%
14.5%
18.6%
6.5%
29.2%
14.4%
23.1%
16.4% 15.5%
1.4%
0%
5%
10%
15%
20%
25%
30%
35%
Completely agree
Agree Not sure Oppose Completely oppose
Don't know
15-18 21-24

67
6. Level of preoccupation with the Holocaust and perceptions about
Germany (for Jews only)
a. Level of preoccupation with the Holocaust
The extent of preoccupation with the Holocaust was examined both on the personal
level ("Are you personally interested or not interested in the subject of the
Holocaust?") and on the level of assessments regarding Israeli society ("Of the
following, which is the one that best states Israeli society's view of the Holocaust –
Israeli society deals with the Holocaust too much, more than is appropriate/Israeli
society deals with the Holocaust too little/Israeli society deals with the Holocaust at
an appropriate level").
Table 28: Level of preoccupation with the Holocaust
Jews
51-51 15-12
Are you personally
interested in the
Holocaust?
Not at all 2.4% 3.2%
Somewhat 24.6% 31.8%
Greatly 41.4% 44.8%
Very greatly 28.4% 18.9%
Don't know/refuse 3.2% 1.3%
Total 100.0% 100.0%
N 486 470
Of the following,
which best states
Israeli society's
preoccupation with
the Holocaust – select
one only
Israeli society deals with the
Holocaust too much 10.2% 8.8%
Israeli society deals too little
with the Holocaust, much too
little
31.6% 36.6%
Israeli society deals with the
Holocaust at an appropriate level 52.5% 51.2%
Don't know/refuse 5.8% 3.3%
Total 100.0% 100.0%
N 486 470

68
1) A large majority of the interviewees in both age groups are interested in the
Holocaust at least somewhat. About two-thirds (70% of the teenagers and 64%
of the young people) are greatly or very greatly interested in the Holocaust.
About half of the interviewees in both age groups (52% and 51% respectively)
think that Israeli society deals with the Holocaust at an appropriate level, but
about one-third (32% of teenagers and 37% of young people) think that there
is too little preoccupation with the Holocaust.
2) Among the teenagers, girls are more interested in the Holocaust than boys
(78% against 69%) and the ultra-Orthodox are less interested than others
(53%). Among the young people, no link was found between socio-
demographic factors, except for the relatively high interest of the religious
(71%).
b. Perceptions about Germany of today
The interviewees were presented with several opinions about present-day
Germany ("Germany today is among the countries friendly to
Israel"/"Germany today is no different than Germany in the past, and a Nazi
regime could arise there"/" The extermination of Jews was supported, in
effect, by the majority of the German people and not only by the Nazi
leadership") and for each of them, they were asked to state "Is this true or not
true in your opinion?" Table 31 presents the interviewees' responses.
Table 29: Perceptions about Germany today
Jews
51-51 15-12
Germany today is among
the countries friendly to
Israel
Completely wrong 6.3% 4.1%
Somewhat wrong 11.3% 16.6%
Somewhat correct 42.8% 46.5%
Very correct 20.4% 19.2%
Don't know/refuse 19.2% 13.7%
Total 100.0% 100.0%
N 486 470

69
Germany today is no
different than Germany in
the past, and a Nazi regime
could arise there
Completely wrong 31.3% 27.8%
Somewhat wrong 32.2% 40.9%
Somewhat correct 19.9% 16.7%
Very correct 6.8% 7.0%
Don't know/refuse 9.8% 7.6%
Total 100.0% 100.0%
N 486 470
The extermination of Jews
was supported, in effect, by
the majority of the
German people and not
only by the Nazi
leadership
Completely wrong 7.6% 7.0%
Somewhat wrong 23.2% 24.3%
Somewhat correct 34.5% 35.8%
Very correct 22.0% 22.6%
Don't know/refuse 12.7% 10.3%
Total 100.0% 100.0%
N 486 470
Figure 34: "Germany today is among the countries friendly to Israel", among
Jews
6.3%
11.3%
42.8%
20.4% 19.2%
4.1%
16.6%
46.5%
19.2%
13.7%
0%
5%
10%
15%
20%
25%
30%
35%
40%
45%
50%
Completely wrong
Somewhat wrong Somewhat correct
Very correct Don't know
15-18 21-24

71
Figure 35: "Germany today is no different than Germany in the past, and a Nazi
regime could arise there", among Jews
Figure 36: "The extermination of Jews was supported, in effect, by the majority
of the German people and not only by the Nazi leadership", among Jews
1) All of the above three assertions regarding Germany have a common factor
(Cronbach α = 0.78) that can be termed "The image of Germany in the context
of the Jewish people and Israel".
2) Slightly more than half of the interviewees (56% of the teenagers and 58% of
the young people) think that most of the German people supported the
extermination of the Jews during the Holocaust. However, at the same time,
some two-thirds (64% of teenagers and 69% of young people) do not agree
31.3% 32.2%
19.9%
6.8% 9.8%
27.8%
40.9%
16.7%
7.0% 7.6%
0%
5%
10%
15%
20%
25%
30%
35%
40%
45%
Completely wrong
Somewhat wrong Somewhat correct
Very correct Don't know
15-18 21-24
7.6%
23.2%
34.5%
22.0%
12.7%
7.0%
24.3%
35.8%
22.6%
10.3%
0%
5%
10%
15%
20%
25%
30%
35%
40%
Completely wrong
Somewhat wrong Somewhat correct
Very correct Don't know
15-18 21-24

71
with the statement that Germany of today is no different from Germany in the
past and similar percentages (63% of teenagers and 65% of young people)
think that Germany today is one of the countries that is friendly to Israel.
3) The examination of the links to socio-demographic characteristics shows that:
a. No gender disparities are found in the assessments of Germany.
b. As the association with religion decreases, so there is a gradual increase in
the assessment of Germany, from an average of 2.1 (on a 4-level scale)
among the ultra-Orthodox to 2.9 (on the same scale) among the secular.
This data is true for both teenagers and young people.
c. For both teenagers and young people no significant link was found
between where the individual positioned himself on the right-left
ideological continuum and their assessments regarding Germany.

72
Appendix: Link with Socio-Demographic Characteristics
Table 30: Economic support from parents
Teenagers
Gender How do you define yourself in terms of
religion?
How would you define yourself ideologically
politically?
Male Female Secular Traditional Religious Ultra-
Orthodox Right
Center-
right Center Left
Don't know/
refuse
Parents support me
economically 11.1% 4..7% 11.4% 11.1% 43.1% 17.1% 17..% 12.7% 42.7% 4..1% 12.2%
Parents do not
support me
economically
52.5% 4..% 5..1% 52.1% 6.1% 51.1% 53..% 51.3% 1.3% 1.1% 51.7%
Parents do not
support me
economically and I
even support them
1%. 3%. 4%. 4%. 1.4%
Total 5..% 5..% 5..% 5..% 5..% 5..% 5..% 5..% 5..% 5..% 5..%
N 157 516 511 56. 23 56 561 12 21 61 31
Young People
Gender How do you define yourself in terms of
religion?
How would you define yourself ideologically
politically?
Male Female Secular Traditional Religious Ultra-
Orthodox Right
Center-
right Center Left
Don't
know/refuse
Parents support me
economically 14.1% 61.1% 62.3% 65..% 27.7% 71.6% 63.1% 61.4% 6..5% 6..5% 11..%
Parents do not
support me
economically
34.3% 35..% 33.4% 32.5% 1..6% 17.2% 32.3% 31.1% 31.5% 31.6% 33.1%
Parents do not
support me
economically and I
even support them
5.2% 3.1% 5.4% 2.4% 5.6% 1.1% 5.6% 2.4% 5.3% 55.1%
Total 5..% 5..% 5..% 5..% 5..% 5..% 5..% 5..% 5..% 5..% 5..%
N 197 17. 514 563 22 75 111 551 2. 66 51

73
Table 31: Goals in life
Teenagers
Gender How do you define yourself in terms of
religion?
How would you define yourself ideologically
politically?
Male Female Secular Traditional Religious Ultra-
Orthodox Right
Center-
right Center Left
Don't
know/refuse
Obtaining higher
education 21.4% 12.5% 21.7% 24.1% 11.1% 14.4% 24.1% 13.7% 26.1% 15.1% 23.7%
Economic success 27.5% 31.7% 21.1% 27..% 35.4% 15.2% 15.5% 34.1% 31.1% 14.1% 1..5%
Enjoying life,
entertainment, good
food, beach
37.3% 37.7% 27.4% 33.6% 53.1% 15.5% 11.1% 25.4% 22.1% 26.4% 23.2%
Contributing to the
state and society 11.6% 11.5% 51.4% 54.1% 11..% 15.2% 17.2% 51.3% 51.4% 11.4% 1..%
Contributing as
much as I can to
IDF
1...% 53..% 52.1% 54.1% 54.3% 15.3% 53.7% 57.1% 55.3% 55.1%
Volunteering for
important subjects 3.1% 51.1% 1.5% 6.1% 5..1% 5...% 1.1% 55.5% 1.3% 55.3% 6.1%
Moving overseas 7.1% 6.1% 4.5% 6.1% 3.4% 1.7% 6.1% 51.6% 4.2% 5..4%
Total 5..% 5..% 5..% 5..% 5..% 5..% 5..% 5..% 5..% 5..% 5..%
N 154 517 516 565 26 53 573 13 1. 66 32
Young People
Gender How do you define yourself in terms of
religion?
How would you define yourself ideologically
politically?
Male Female Secular Traditional Religious Ultra-
Orthodox Right
Center-
right Center Left
Don't
know/refuse
Economic success 67.4% 63.1% 63.1% 67..% 11.3% 73.1% 72.3% 11.1% 15.4% 14.1% 15.4%
Enjoying life,
entertainment, good
food, beach
2..4% 22..% 15.6% 27..% 1..1% 57.2% 37.3% 21..% 21.5% 13.1% 14.1%
Obtaining higher
education 36.3% 25.1% 2...% 37.6% 36.3% 21.7% 31.1% 25.1% 26.6% 33.1% 34.7%
Contributing to the
state and society 57.1% 57.5% 51.3% 51.5% 21.7% 56.1% 51.2% 51.2% 5..5% 51.7% 51.4%
Volunteering for
important subjects 6.1% 4.6% 2..% 4.3% 5..2% 57.4% 2.4% 4.6% 57.2% 4..% 51.5%
Moving overseas 5..1% 6.7% 55.3% 7.6% 1..% 5.7% 7.1% 7.6% 6.7% 53..% 6..%
Contributing as
much as I can to
IDF
3.5% 1%. 5..% 7%. 1.5% 5.3% 5.1% 1.1%
Total 5..% 5..% 5..% 5..% 5..% 5..% 5..% 5..% 5..% 5..% 5..%
N 54. 162 545 561 23 11 157 556 2. 61 56

74
Table 32: Sense of belonging
Teenagers
Gender How do you define yourself in terms of
religion?
How would you define yourself ideologically
politically?
Male Female Secular Traditional Religious Ultra-
Orthodox Right
Center-
right Center Left
Don't
know/refuse
I feel like a citizen
with equal rights to
other citizens
17..% 16.2% 14.1% 12..% 4..1% 71.3% 16.4% 4..6% 76.4% 4..1% 11.6%
I feel as though I
don't belong to
Israeli society
53..% 53.6% 5..1% 56..% 4.1% 17.7% 53.5% 4.2% 13.5% 4.1% 57.2%
Total 5..% 5..% 5..% 5..% 5..% 5..% 5..% 5..% 5..% 5..% 5..%
N 155 573 571 51. 23 51 511 1. 1. 67 14
Young people
Gender How do you define yourself in terms of
religion?
How would you define yourself ideologically
politically?
Male Female Secular Traditional Religious Ultra-
Orthodox Right
Center-
right Center Left
Don't
know/refuse
I feel like a citizen
with equal rights to
other citizens
12.7% 12..% 11..% 45.1% 14.5% 61.4% 11.2% 11.1% 45.2% 71.4% 11.3%
I feel as though I
don't belong to
Israeli society
51.3% 56..% 51..% 1.1% 5..4% 37.5% 55.6% 57.1% 1.6% 12.5% 22.7%
Total 5..% 5..% 5..% 5..% 5..% 5..% 5..% 5..% 5..% 5..% 5..%
N 511 127 571 51. 25 63 15. 555 36 14 56
Table 33: Sense of security
Teenagers
Economic security (10-level scale)
Gender How do you define yourself in terms of
religion?
How would you define yourself ideologically
politically?
Male Female Secular Traditional Religious Ultra-
Orthodox Right
Center-
right Center Left
Don't
know/refuse
Average 7.1 6.7 7.1 6.1 7.5 6.2 7.. 6.7 6.7 7.2 7.1
Standard
deviation 1.. 1.5 1.. 1.5 1.1 1.1 1.5 1.5 5.4 5.7 1.5
Frequency 1.1 566 575 521 25 52 511 71 21 62 35
Minimum 5 5 5 5 5 1 5 5 5 3 1
Maximum 5. 5. 5. 5. 5. 5. 5. 5. 5. 5. 5.

75
Exposure to violence (10-level scale)
Gender How do you define yourself in terms of
religion?
How would you define yourself ideologically
politically?
Male Female Secular Traditional Religious Ultra-
Orthodox Right
Center-
right Center Left
Don't
know/refuse
Average 6.2 6.. 6.1 6.. 6.1 7.. 6.5 6.1 1.7 6.1 6.4
Standard
deviation 1.4 3.3 3.. 3.5 3.. 3.1 3.5 3.3 3.3 1.3 1.3
Frequency 1.1 51. 513 524 21 53 511 15 24 61 35
Minimum 5 5 5 5 5 5 5 5 5 5 5
Maximum 5. 5. 5. 5. 5. 5. 5. 5. 5. 5. 5.
Personal threat
Gender How do you define yourself in terms of
religion?
How would you define yourself
ideologically politically?
Male Female Secular Traditional Religious Ultra-
Orthodox Right
Center
-right Center Left
Don't
know/refuse
Feel great sense of
threat 13.1% 37.1% 11.3% 35.1% 17.1% 11..% 31.1% 35.1% 32.1% 51.1% 16.1%
Feel a low sense of
threat 24.3% 26.1% 11.1% 26.3% 31.7% 21..% 31.2% 11.3% 11.1% 61.1% 15.6%
Feel no threat at all 17.1% 56..% 54.1% 15.4% 33.1% 3...% 14.1% 51.4% 53..% 51.4% 15.4%
Total 5..% 5..% 5..% 5..% 5..% 5..% 5..% 5..% 5..% 5..% 5..%
N 151 574 574 516 22 51 561 13 27 61 11
General security (10-level scale)
Gender How do you define yourself in terms of
religion?
How would you define yourself ideologically
politically?
Male Female Secular Traditional Religious Ultra-
Orthodox Right
Center-
right Center Left
Don't
know/refuse
Average 7.6 7.1 7.2 7.2 7.6 7.1 7.6 7.3 7.1 7.2 7.1
Standard
deviation 5.6 5.7 5.6 5.6 1.. 5.1 5.7 5.7 5.1 5.1 5.6
Frequency 116 542 54. 561 26 56 572 11 1. 7. 2.
Minimum 1 5 5 5 5 2 1 5 5 3 2
Maximum 10 10 10 10 10 10 10 10 10 10 10
Young people
Economic security (10-level scale)
Gender How do you define yourself in terms of
religion?
How would you define yourself ideologically
politically?
Male Female Secular Traditional Religious Ultra-
Orthodox Right
Center-
right Center Left
Don't
know/refuse
Average 6.1 1.4 6.5 1.6 6.. 6.7 6.1 1.1 1.4 6.1 6.2
Standard
deviation 5.4 1.. 1.. 5.4 5.4 5.4 1.. 5.1 1.1 5.1 5.4
Frequency 542 167 54. 561 21 61 11. 551 2. 61 57
Minimum 5 5 5 5 3 5 5 5 1 3 3
Maximum 10 10 10 10 10 10 10 10 10 10 10

76
Exposure to violence (10-level scale)
Gender How do you define yourself in terms of
religion?
How would you define yourself ideologically
politically?
Male Female Secular Traditional Religious Ultra-
Orthodox Right
Center-
right Center Left
Don't
know/refuse
Average 6.1 6.1 6.1 1.6 6.7 7.1 6.2 1.1 6.5 6.3 6.2
Standard
deviation 1.4 3.5 1.1 3.. 3.5 3.1 3.. 3.5 1.1 1.7 3.1
Frequency 545 163 512 565 2. 64 151 552 31 67 57
Minimum 5 5 5 5 5 5 5 5 5 5 5
Maximum 10 10 10 10 10 10 10 10 10 10 10
Personal threat
Gender How do you define yourself in terms of
religion?
How would you define yourself ideologically
politically?
Male Female Secular Traditional Religious Ultra-
Orthodox Right
Center-
right Center Left
Don't
know/refuse
Feel great sense of
threat 12.6% 22.2% 3..1% 23.3% 33.2% 31..% 34.1% 22.1% 12.2% 57.1% 11.3%
Feel a low sense of
threat 24.1% 25.4% 11.6% 21.5% 36.5% 36.4% 37.4% 21.6% 13.2% 75.3% 14.5%
Feel no threat at all 11.4% 53.1% 56.6% 52.6% 3..1% 11..% 11.2% 51.6% 11.1% 5..4% 21.6%
Total 5..% 5..% 5..% 5..% 5..% 5..% 5..% 5..% 5..% 5..% 5..%
N 543 163 511 517 23 64 157 551 34 61 57
General security (10-level scale)
Gender How do you define yourself in terms of
religion?
How would you define yourself ideologically
politically?
Male Female Secular Traditional Religious Ultra-
Orthodox Right
Center-
right Center Left
Don't
know/refuse
Average 7.. 7.5 6.1 6.7 7.2 1.5 7.1 6.7 7.. 7.. 7.6
Standard
deviation 5.1 5.7 5.7 5.7 5.1 5.7 5.1 5.6 5.1 5.7 1.1
Frequency 544 173 541 561 22 75 116 551 2. 61 1.
Minimum 1 1 1 1 2 3 1 3 3 1 3
Maximum 10 10 10 10 10 10 10 10 10 10 10

77
Table 34: Perceptions about the likelihood of achieving goals
Teenagers
Gender How do you define yourself in terms of
religion?
How would you define yourself ideologically
politically?
Male Female Secular Traditional Religious Ultra-
Orthodox Right
Center-
right Center Left
Don't
know/refuse
Certain 14.1% 11.2% 15.6% 14.1% 13.1% 75.3% 64.3% 15.5% 6..5% 21.2% 12..%
Not certain 2..1% 25.6% 21.2% 2..1% 56.1% 11.7% 3..7% 21.4% 34.4% 12.6% 26..%
Total 5..% 5..% 5..% 5..% 5..% 5..% 5..% 5..% 5..% 5..% 5..%
N 151 514 512 563 21 52 575 13 1. 64 32
Young people
Gender How do you define yourself in terms of
religion?
How would you define yourself ideologically
politically?
Male Female Secular Traditional Religious Ultra-
Orthodox Right
Center-
right Center Left
Don't
know/refuse
Certain 16.2% 11.1% 27.1% 24.7% 71.2% 15.7% 65.7% 21.1% 15.5% 26.6% 72.1%
Not certain 23.6% 22.1% 11.1% 1..3% 12.6% 51.3% 31.3% 15.1% 21.4% 13.2% 11.1%
Total 5..% 5..% 5..% 5..% 5..% 5..% 5..% 5..% 5..% 5..% 5..%
N 541 167 516 562 22 64 111 551 2. 62 54
Table 35: Importance of democratic values and preferences for security needs
and democratic requirements
Teenagers
Average importance of democratic values (10-level scale)
Gender How do you define yourself in terms of
religion?
How would you define yourself ideologically
politically?
Male Female Secular Traditional Religious Ultra-
Orthodox Right Center-right Center Left
Don't
know/refuse
Average 1.. 7.4 1.1 7.6 7.1 6.1 7.2 7.7 1.2 4.. 1.7
Standard
deviation 1.5 1.5 5.7 1.1 1.1 1.1 1.1 5.4 1.. 5.1 5.6
Frequency 157 54. 516 561 21 51 567 12 1. 7. 37
Minimum 5 5 1 5 5 5 5 1 5 1.1 3.1
Maximum 5. 5. 5. 5. 5. 5. 5. 5. 5. 5. 5.
Average importance of democratic expressions in Israel (5-level scale)
Gender How do you define yourself in terms of
religion?
How would you define yourself ideologically
politically?
Male Female Secular Traditional Religious Ultra-
Orthodox Right Center-right Center Left
Don't
know/refuse
Average 2.3 2.3 2.1 2.1 3.4 3.6 2.5 2.3 2.2 2.6 2.2
Standard
deviation 7. 7. 6. 7. 1. 5.. 1. 7. 7. 1. 1.
Frequency 112 543 514 561 21 51 573 11 1. 7. 31
Minimum 5.1 5 5.1 5.71 5.71 5 5 1.1 1.11 5.71 5.1
Maximum 1 1 1 1 1 1 1 1 1 1 1

78
Security needs compared to democratic needs
Gender How do you define yourself in terms of
religion?
How would you define yourself ideologically
politically?
Male Female Secular Traditional Religious Ultra-
Orthodox Right
Center-
right Center Left
Don't
know/refuse
Always security
needs 32.4% 3..4% 15.1% 21.1% 2..3% 11.4% 26.7% 31.1% 17.3% 6..% 17.3%
Usually security
needs, aside from
exceptional
situations
22.7% 1..4% 21.3% 26.1% 1..5% 23.3% 23.1% 13.1% 25.2% 15.2% 1..1%
Always/usually
democratic values 1..2% 51.5% 14.4% 55.3% 4.6% 3.1% 4.1% 53.3% 35.5% 21.6% 11.5%
Total 5..% 5..% 5..% 5..% 5..% 5..% 5..% 5..% 5..% 5..% 5..%
N 151 571 577 512 23 53 561 11 22 67 17
Young people
Average importance of democratic values (10-level scale)
Gender How do you define yourself in terms of
religion?
How would you define yourself ideologically
politically?
Male Female Secular Traditional Religious Ultra-
Orthodox Right Center-right Center Left
Don't
know/refuse
Average 7.5 7.2 7.7 7.1 6.4 6.1 6.7 7.6 7.4 1.6 6.2
Standard
deviation 1.1 1.5 5.4 1.5 1.5 1.2 1.1 5.4 1.. 5.2 1.1
Frequency 547 175 54. 563 22 75 111 551 2. 61 1.
Minimum 5 5 5 5 5 5 5 5 3.1 3.1 1
Maximum 5. 5. 5. 5. 5. 5. 5. 5. 5. 5. 5.
Average importance of democratic expressions in Israel (5-level scale)
Gender How do you define yourself in terms of
religion?
How would you define yourself ideologically
politically?
Male Female Secular Traditional Religious Ultra-
Orthodox Right Center-right Center Left
Don't
know/refuse
Average 2.. 2.1 2.3 2.5 3.4 3.1 2.. 2.1 2.5 2.1 3.1
Standard
deviation 1. 7. 7. 7. 7. 1. 7. 6. 4. 7. 4.
Frequency 544 171 541 561 22 7. 116 551 2. 61 54
Minimum 5.67 1.11 1 1.11 1 5.67 5.67 1.71 1.11 1 1.11
Maximum 1 1 1 1 1 1 1 1 1 1 1
Security needs compared to democratic needs
Gender How do you define yourself in terms of
religion?
How would you define yourself ideologically
politically?
Male Female Secular Traditional Religious Ultra-
Orthodox Right
Center-
right Center Left
Don't
know/refuse
Always security
needs 31.3% 31.2% 13.1% 31.2% 15.1% 1..1% 11.1% 11.6% 51.7% 5.2% 21.1%
Usually security
needs, aside from
exceptional
situations
21.1% 21.7% 15.3% 15..% 36.4% 21.5% 21..% 17.5% 61.2% 27..% 21.3%
Always/usually
democratic values 56.2% 51.4% 11.5% 5..6% 55.6% 7.7% 1.1% 52.3% 15.4% 15.1% 51.1%
Total 5..% 5..% 5..% 5..% 5..% 5..% 5..% 5..% 5..% 5..% 5..%
N 541 162 516 563 21 64 115 551 34 61 56

79
Table 36: Assessments about the presence of various democratic characteristics
in the State of Israel (3-level scale)
Teenagers
Gender How do you define yourself in terms of
religion?
How would you define yourself ideologically
politically?
Male Female Secular Traditional Religious Ultra-
Orthodox Right Center-right Center Left
Don't
know/refuse
Average 5.1 5.7 5.6 5.1 5.4 5.7 5.1 5.1 5.6 5.1 5.7
Standard
deviation 2. 2. 2. 2. 2. 2. 2. 2. 2. 3. 3.
Frequency 113 514 511 561 22 51 571 11 1. 7. 31
Minimum 5 5 5 5 5 5 5 5 5 5 5
Maximum 3 1.67 3 1.67 1.6 1.6 1.6 1.6 3 1.6 1.2
Young people
Gender How do you define yourself in terms of
religion?
How would you define yourself ideologically
politically?
Male Female Secular Traditional Religious Ultra-
Orthodox Right Center-right Center Left
Don't
know/refuse
Average 5.1 5.7 5.7 5.1 1.. 5.1 5.4 5.7 5.7 5.2 5.4
Standard
deviation 2. 2. 2. 2. 2. 1. 2. 2. 2. 2. 2.
Frequency 547 164 545 563 23 64 113 557 34 61 54
Minimum 5 5 5 5 5 5 5 5 5 5 5.11
Maximum 3 3 1.1 1.1 3 3 3 1.67 1.6 3 3
Table 37: Average trust in government institutions (4-level scale)
Teenagers
Gender How do you define yourself in terms of
religion?
How would you define yourself ideologically
politically?
Male Female Secular Traditional Religious Ultra-
Orthodox Right Center-right Center Left
Don't
know/refuse
Average 1.1 1.1 1.2 1.1 1.1 1.2 1.1 1.1 1.2 1.2 1.1
Standard
deviation 1. 1. 2. 1. 1. 2. 1. 2. 2. 2. 6.
Frequency 11. 514 517 561 23 52 564 11 1. 7. 32
Minimum 5 5.1 5 5.1 5.31 5.1 5.31 5.63 5.63 5 5
Maximum 2 2 2 3.11 2 3.11 2 3.11 3.71 3.31 2
Young people
Gender How do you define yourself in terms of
religion?
How would you define yourself ideologically
politically?
Male Female Secular Traditional Religious Ultra-
Orthodox Right Center-right Center Left
Don't
know/refuse
Average 1.1 1.1 1.1 1.3 1.2 1.1 1.3 1.1 1.1 1.1 1.1
Standard
deviation 1. 1. 2. 1. 1. 1. 1. 1. 2. 2. 6.
Frequency 541 173 545 561 22 75 116 551 2. 61 54
Minimum 5 5 5 5 5 5 5 5 5.1 5 5

81
Maximum 2 2 2 2 2 3 2 2 3.11 3 3.1
Table 38: Perceptions about the problems in the state requiring treatment and
the disputes threatening Israeli society
Teenagers
Problems requiring treatment
Gender How do you define yourself in terms of
religion?
How would you define yourself
ideologically politically?
Male Female Secular Traditional Religious Ultra-
Orthodox Right
Center
-right Center Left
Don't
know/refuse
Cost of living
expenses/social
gaps
61.4% 65.1% 66.3% 62.1% 13.4% 6..5% 61..% 61.1% 71.1% 65.6% 12.1%
National
security/terror 14.5% 61.6% 15.1% 61.3% 13.1% 63.1% 76.7% 64.2% 21.1% 36..% 11.3%
Education 17.1% 14.2% 35.1% 11.6% 17.6% 54.5% 17.1% 1..5% 31.1% 32.1% 36.1%
Relations between
Jews and Arabs in
Israel
11.1% 12.4% 11.6% 11..% 15.2% 16..% 51.6% 11.5% 3...% 11.1% 11.1%
Advancing the
negotiations
between Israel and
the Palestinians
51.2% 53.1% 54.1% 7.1% 3.4% 11.4% 2.7% 1.1% 57.1% 33.1% 51.7%
Total 5..% 5..% 5..% 5..% 5..% 5..% 5..% 5..% 5..% 5..% 5..%
N 111 54. 517 561 22 51 571 11 1. 61 31
Disputes threatening Israeli society
Gender How do you define yourself in terms of
religion?
How would you define yourself
ideologically politically?
Male Female Secular Traditional Religious Ultra-
Orthodox Right
Center
-right Center Left
Don't
know/refuse
Between Jewish
and Arab citizens of
Israel
1..7% 11.1% 1..6% 16.4% 24.2% 11.6% 11.5% 12.3% 14.1% 23.2% 24.3%
Between right-wing
and left-wing 14.7% 16.4% 17.1% 11.4% 34.1% 3..3% 3..2% 17.6% 57.4% 3..4% 3..1%
Between religious
and secular 4.4% 4.4% 53.2% 1.6% 4.7% 51.6% 7.6% 1.6% 51.6% 51.1% 55.5%
Between rich and
poor 6..% 1.1% 1.5% 1.1% 5.5% 2.5% 6.1% 7.3% 1.6% 6.7%
Between
Ashkenazim and
Mizrahim
3.6% 5.7% 3.1% 1.1% 2.1% 1.4% 3..% 2.3% 1.5%
Total 5..% 5..% 5..% 5..% 5..% 5..% 5..% 5..% 5..% 5..% 5..%
N 153 51. 513 511 21 52 567 13 21 66 3.

81
Young people
Problems requiring treatment
Gender How do you define yourself in terms of
religion?
How would you define yourself
ideologically politically?
Male Female Secular Traditional Religious Ultra-
Orthodox Right
Center
-right Center Left
Don't
know/refuse
Cost of living
expenses/social
gaps
73.4% 72.1% 71.2% 72.4% 61.7% 76.7% 73.6% 74.5% 65.4% 77.1% 61..%
National
security/terror 11..% 61.2% 11.1% 7..3% 71..% 61.2% 77.7% 63..% 13.4% 57.1% 11.6%
Education 14.1% 3..2% 14.4% 11.4% 31.7% 37.1% 14.2% 3..6% 12.5% 35.4% 23.6%
Relations between
Jews and Arabs in
Israel
51.4% 53.4% 54.5% 5...% 57.2% 55.4% 4.3% 52.1% 15.5% 35.1% 4.4%
Advancing the
negotiations
between Israel and
the Palestinians
53.1% 5..2% 57..% 55.4% 3.5% 3..% 2.6% 2.1% 14.3% 36.3% 1..1%
Total 5..% 5..% 5..% 5..% 5..% 5..% 5..% 5..% 5..% 5..% 5..%
N 541 171 541 563 22 75 111 551 2. 61 54
Disputes threatening Israeli society
Gender How do you define yourself in terms of
religion?
How would you define yourself
ideologically politically?
Male Female Secular Traditional Religious Ultra-
Orthodox Right
Center
-right Center Left
Don't
know/refuse
Between Jewish
and Arab citizens of
Israel
32.3% 27.3% 23.4% 21..% 11.4% 36.1% 23.2% 21.1% 23..% 14.6% 23.1%
Between right-wing
and left-wing 33.3% 3..6% 14.5% 37.7% 21.6% 51.1% 33.1% 3..6% 11.7% 31.7% 51..%
Between religious
and secular 57..% 52.1% 52.7% 1.3% 51.6% 31..% 53.1% 51.2% 53.6% 11.6% 51.7%
Between rich and
poor 55.2% 1.4% 5..6% 7..% 4.4% 3.3% 7.1% 7.5% 57.7% 7.2% 51.6%
Between
Ashkenazim and
Mizrahim
3.4% 5.4% 5.6% 1..% 4.7% 1.2% 5.7% 2.1% 53.6%
Total 5..% 5..% 5..% 5..% 5..% 5..% 5..% 5..% 5..% 5..% 5..%
N 541 563 517 56. 23 62 11. 556 31 61 56

82
Table 39: Optimism/pessimism about the future of the state
Teenagers
Gender How do you define yourself in terms of
religion?
How would you define yourself ideologically
politically?
Male Female Secular Traditional Religious Ultra-
Orthodox Right
Center-
right Center Left
Don't
know/refuse
Pessimistic 36.1% 23.5% 15.2% 31.1% 55.1% 24.7% 17.1% 25.1% 27.7% 6..3% 34.3%
Optimistic 63.1% 16.4% 21.6% 67.1% 11.1% 1..3% 71.1% 11.1% 11.3% 34.7% 6..7%
Total 5..% 5..% 5..% 5..% 5..% 5..% 5..% 5..% 5..% 5..% 5..%
N 1.7 57. 571 527 21 53 56. 77 22 61 17
Young people
Gender How do you define yourself in terms of
religion?
How would you define yourself ideologically
politically?
Male Female Secular Traditional Religious Ultra-
Orthodox Right
Center-
right Center Left
Don't
know/refuse
Pessimistic 21..% 15.1% 63.3% 27.3% 55.6% 23.1% 37.5% 16.4% 11..% 72.6% 27.1%
Optimistic 11..% 21.1% 36.7% 11.7% 11.2% 16.1% 61.4% 23.5% 21..% 11.2% 11.1%
Total 5..% 5..% 5..% 5..% 5..% 5..% 5..% 5..% 5..% 5..% 5..%
N 511 113 577 56. 21 61 1.4 553 37 61 57
Table 40: Positions about Jewish-Arab coexistence in Israel
Teenagers
Arab citizens of Israel should be prohibited from being elected to the Knesset
Gender How do you define yourself in terms of
religion?
How would you define yourself ideologically
politically?
Male Female Secular Traditional Religious Ultra-
Orthodox Right
Center-
right Center Left
Don't
know/refuse
Agree 31.4% 31.1% 1..1% 27..% 16.3% 71.4% 6..1% 33..% 53.3% 1.1% 3...%
Not certain 11.2% 16.2% 11.5% 11.4% 11.1% 6.1% 15.1% 37..% 3..7% 1.3% 37.3%
Oppose 25.6% 32.1% 17.5% 12.5% 1..4% 52.6% 51..% 3...% 16..% 14.5% 31.6%
Total 5..% 5..% 5..% 5..% 5..% 5..% 5..% 5..% 5..% 5..% 5..%
N 156 576 515 513 21 51 567 13 26 64 17
Arabs have not become reconciled to the existence of the State of Israel and would destroy it if they could
Gender How do you define yourself in terms of
religion?
How would you define yourself ideologically
politically?
Male Female Secular Traditional Religious Ultra-
Orthodox Right
Center-
right Center Left
Don't
know/refuse
Absolutely agree 35.1% 3..2% 54..% 37.1% 27.2% 11.4% 11.1% 11.1% 51..% 1.3% 5...%
Agree 16.6% 3..3% 13.2% 33.1% 17.1% 32..% 11.5% 37.7% 35.4% 4.7% 25.1%
No opinion/Not
certain 57..% 51.4% 11.2% 52.2% 51.1% 6.2% 53.1% 55.5% 16.6% 12.2% 32.4%
Oppose 12.1% 1..1% 31.1% 52.3% 4.1% 3.7% 6..% 11.7% 14.1% 63.7% 53.4%
Total 5..% 5..% 5..% 5..% 5..% 5..% 5..% 5..% 5..% 5..% 5..%
N 154 513 511 565 21 52 575 13 24 7. 14

83
Young people
Arab citizens of Israel should be prohibited from being elected to the Knesset
Gender How do you define yourself in terms of
religion?
How would you define yourself ideologically
politically?
Male Female Secular Traditional Religious Ultra-
Orthodox Right
Center-
right Center Left
Don't
know/refuse
Agree 37.1% 24.7% 17.4% 22.5% 66.2% 71.2% 61..% 35.1% 57.3% 17.1%
Not certain 11.2% 15.1% 11.1% 11.2% 51.2% 5..1% 1..3% 31.3% 32.1% 53.5% 51..%
Oppose 37.3% 11.1% 26.3% 17.1% 51.1% 52.5% 55.7% 36.1% 21..% 16.4% 12.1%
Total 5..% 5..% 5..% 5..% 5..% 5..% 5..% 5..% 5..% 5..% 5..%
N 544 166 54. 56. 22 75 116 557 34 61 56
Arabs have not become reconciled to the existence of the State of Israel and would destroy it if they could
Gender How do you define yourself in terms of
religion?
How would you define yourself ideologically
politically?
Male Female Secular Traditional Religious Ultra-
Orthodox Right
Center-
right Center Left
Don't
know/refuse
Absolutely agree 36.5% 23.4% 16.5% 21.3% 11.3% 61.6% 6..5% 17.1% 14..% 3.5% 21.3%
Agree 32.7% 14.4% 33.5% 36.5% 17.7% 11..% 35.1% 21.7% 11.3% 55.6% 53.2%
No opinion/Not
certain 51.6% 53.1% 51.1% 53.2% 6.5% 1.4% 2.1% 51.5% 11.4% 11.6% 11.6%
Oppose 56.7% 51.7% 11.6% 1.1% 53.4% 6.1% 2.1% 1.2% 56.7% 61.6% 51.1%
Total 5..% 5..% 5..% 5..% 5..% 5..% 5..% 5..% 5..% 5..% 5..%
N 544 167 545 565 22 7. 111 551 2. 61 51
Table 41: Interest in the Holocaust
Teenagers
Personal interest
Gender How do you define yourself in terms of
religion?
How would you define yourself ideologically
politically?
Male Female Secular Traditional Religious Ultra-
Orthodox Right
Center-
right Center Left
Don't
know/refuse
Not interested 35.3% 11..% 16.1% 17.1% 13..% 27..% 11.7% 13.1% 17.2% 15.4% 31.1%
Interested 61.7% 71..% 73.1% 71.1% 77..% 13..% 75.3% 76.1% 71.6% 71.5% 65.1%
Total 5..% 5..% 5..% 5..% 5..% 5..% 5..% 5..% 5..% 5..% 5..%
N 151 54. 513 561 22 51 57. 11 1. 7. 31

84
Assessments about Israeli society
Gender How do you define yourself in terms of
religion?
How would you define yourself
ideologically politically?
Male Female Secular Traditional Religious Ultra-
Orthodox Right
Center
-right Center Left
Don't
know/refuse
Israeli society deals
too much with the
Holocaust, more
than is appropriate
52.1% 1.1% 53.1% 51.6% 2.1% 5..5% 5...% 1.3% 15.7% 5..6%
Israeli society deals
too little with the
Holocaust, less than
is appropriate
3..6% 31.5% 11.5% 31.1% 11.3% 12.7% 31.1% 14.4% 33.4% 11..% 3..1%
Israeli society deals
with the Holocaust
to an appropriate
degree
12.1% 14.5% 11.5% 15.4% 73.1% 21.3% 12.7% 6..5% 17.1% 16.1% 11.4%
Total 5..% 5..% 5..% 5..% 5..% 5..% 5..% 5..% 5..% 5..% 5..%
N 156 512 515 562 23 51 567 11 1. 64 3.
Young people
Personal interest
Gender How do you define yourself in
terms of religion?
How would you define yourself ideologically
politically?
Male Female Secular Traditio
nal
Religio
us
Ultra-
Orthod
ox
Right Center-
right Center Left
Don't
know/re
fuse
Not interested 34.2% 31.6% 36..% 37.3% 14..% 33.6% 31.2% 32.1% 32..% 22.1% 26.7%
Interested 6..6% 67.2% 62..% 61.7% 75..% 66.2% 67.6% 61.1% 66..% 11.1% 13.3%
Total 5..% 5..% 5..% 5..% 5..% 5..% 5..% 5..% 5..% 5..% 5..%
N 546 17. 54. 563 21 75 111 556 34 67 54
Assessments about Israeli society
Gender How do you define yourself in
terms of religion?
How would you define yourself ideologically
politically?
Male Female Secular Traditio
nal
Religio
us
Ultra-
Orthod
ox
Right Center-
right Center Left
Don't
know/re
fuse
Israeli society deals too
much with the
Holocaust, much more
than is appropriate
4.7% 1.7% 51.3% 1.4% 1.5% 3.1% 1.3% 1.3% 52.3% 51.1% 57.1%
Israeli society deals too
little with the Holocaust,
much less than is
appropriate
33.5% 25.1% 31.5% 34..% 17.2% 1...% 23.2% 34.1% 37.1% 56..% 22.5%
Israeli society deals with
the Holocaust to an
appropriate degree
17.1% 24.1% 11.6% 11.5% 67.2% 26.1% 15.3% 11.1% 27.4% 61.7% 31.7%
Total 5..% 5..% 5..% 5..% 5..% 5..% 5..% 5..% 5..% 5..% 5..%
N 543 163 516 561 21 66 151 556 2. 66 56

85
Table 42: Average attitudes toward Germany (scale from 1, the most negative
attitudes, to 4, the most positive attitudes)
Teenagers
Gender How do you define yourself in terms of
religion?
How would you define yourself ideologically
politically?
Male Female Secular Traditional Religious Ultra-
Orthodox Right
Center
-right Center Left
Don't
know/refuse
Average 2.8 2.7 2.9 2.6 2.4 2.1 2.5 2.8 2.9 3.0 2.8
Standard
deviation .6 .7 .5 .6 .7 .8 .6 .6 .5 .6 .7
Frequency 219 180 186 159 41 13 165 83 49 70 32
Minimum 1 1 1 1 1 1 1 1.33 1.50 1 1.33
Maximum 4 4 4 4 4 3.67 4 4 3.67 4 4
Young people
Gender How do you define yourself in terms of
religion?
How would you define yourself ideologically
politically?
Male Female Secular Traditional Religious Ultra-
Orthodox Right
Center
-right Center Left
Don't
know/refuse
Average 2.7 2.6 2.9 2.7 2.5 2.0 2.5 2.8 2.9 3.0 2.2
Standard
deviation .6 .6 .5 .5 .7 .6 .6 .5 .5 .5 .8
Frequency 194 262 188 160 39 68 217 115 40 66 17
Minimum 1 1 1 1 1 1 1 1 1.67 1.50 1
Maximum 4 4 4 4 4 3.33 4 4 4 4 3.33

86
Chapter 3: Summary of the findings of the qualitative
study – personal, national and social positions of
teenagers and young people Michal Shapira
Background and Aims
The aim of the study is to map the perceptions and positions of teenagers and young
people on personal, social and national topics. These include:
Personal expectations about the future and personal happiness
Positions about Israeli society, the direction in which the State is moving,
democracy, human rights, religion and state, personal contribution to shaping
the state, and positions about relations with Germany.
Methodology and Population
The study was carried out using the methodology of focus groups and consisted of 4
groups that included men and women aged 15-24 divided as follows.
Group
No. Age Composition Region
1 15-12 Secular young men and women Center
2 15-22 Ultra-Orthodox young women Center
3 51-51 Teenagers (m &f)- religious and
traditional sector Center
4 51-51 Teenagers (m &f) – Arab sector Umm-el-Fahm
General remarks
The four sectors studied differ markedly from one another in the values
imbibed at home, contents of school studies, and religion.
The complex fabric of life in Israel makes it important to relate to each sector
separately.

87
Nevertheless, in relating to the Jewish sector, some of the research findings
indicate that there are common elements in the opinions of the participants that
cut across religion, age, and place of residence.
The first part of the following chapter will reveal the findings common to the
Jewish sector, placing specific emphasis on each sub-group within it.
The findings about the Arab sector will have a separate sub-section in this
chapter.
Main Findings in the Jewish Sector
a. Personal vision and future
Most of the participants assign a significant value to higher education in their
future. Teenagers express their intention to study academic studies, and most
young people are in the midst of the process of making this choice or investing
in higher education.
The perception of the importance of studying is an aspect of personal
fulfillment particularly in order to integrate into the work force with an
advantage.
"What I am studying is the direction, administration in a pharmaceutical
company; that will give me economic stability and employment security."
All the ultra-Orthodox young women have an academic degree in various
fields (law, accounting, architecture), and view their career as an important
value that they hope to implement in the future alongside establishing a
family. Even though this is not a representative sample, it is evident that this
trend that resonates in this group has been seen in the ultra-Orthodox sector in
recent years.
"I see myself teaching mathematics at the university in the future. I would like
that very much."
It is evident that the religious teenagers who participated in the study have a
very focused perception of their future and their aspirations are higher than
those of the participants from the secular sector.
"I don't have a defined dream. But I want to do something meaningful, so that
I am remembered. So that people know who Dvir Horwitz was, even if they

88
don't in the whole world, but here; let's say that there could be a theorem in
physics named after me."
One of the explanations that can be related to this is their young age and their
immediate future that is perceived as more structured. The older participants
are at a post-army or pre-studies crossroads and they are more confused.
"Concern, doubts, lack of sleep, anxiety about starting real life; I have no
direction about what to study and what to work at. I am interested in a lot of
things but in the end we have to choose something and I don't know what; I
thought of beginning to take courses and then deciding, I feel a bit lost."
All the participants in the study view establishing a family as an important
value. The great majority of the young people see themselves as having a
family within the next ten years.
All of the ultra-Orthodox women participants are married and all are planning
to be mothers of children in the near future.
b. In Israel or abroad
Most of the religious and traditional teenagers see their future in Israel.
A small proportion of the participants in the secular and ultra-Orthodox group
do not rule out moving abroad.
Moving abroad is perceived largely as an experiment, gathering experiences
and, for some, as the only option to cope economically.
Nonetheless, most of the participants see themselves as belonging to Israeli
society, and even those who see themselves emigrating, believe that they are
referring to an experience and not to permanent residence.
c. Sense of belonging to Israeli society
The participants feel a deep sense of belonging to Israeli society.
This finding is overwhelmingly present in all the sub-groups of the Jewish
sector.
Israeli society is described, in all its various segments, as one entity composed
of individuals that give it a unique character and tone.
Israelis are characterized by the participants as being warm, willing to help,
direct, sophisticated, and audacious, having weak manners, and lacking
courtesy.

89
The main variables on which the sense of belonging was based are: common
language, common culture, "mindset", and attitude to the army.
The participants are proud to belong to the entity they call "Israeli society".
Statements made by the participants:
"Israeli-ness is: warmth, family, short fuse, caring, audacity, ambitiousness,
technological progress."
"This Israeli audacity is something special, when there is a need to help in a war or
overseas, they will help; that is really the moment of truth."
"For example, I was on a trip to Barcelona and there we met some Israelis and, to
this day, we keep in touch and spend time together; that is something special, the
ability to join up."
"We got stuck near Tiberias 3 weeks ago at 3 in the morning and there wasn't a single
car that didn't stop and offer to help. Conversely, in Manhattan in the USA, my
mother stumbled over a stone and fell together with my father and people just walked
by them. That is something that would never happen in Israel. Never!!"
"I very much belong. I love Israel. You can see that mostly when you are overseas,
you are seen to be an Israeli and everyone immediately makes friends."
d. Perception of democracy
The participants believe (and hope) that the democracy in Israel is stable.
Nonetheless, some of them display ignorance about the term, and others would
like to live in a democracy in which there are limits on freedom of expression
for those entities perceived by them as extremists.
Many participants do not see any contradiction between the term democracy
and limiting freedom of expression.
Many participants understand that the advantages of democracy are reserved
for the majority and do not always apply to the minority.
Among religious and ultra-Orthodox teenagers, the matter of the conflict
between religion and state arises as a central obstacle to the existence of
democracy. Most of the participants in those groups view religious laws as

91
more obligatory than laws of the state. In other words, given a conflict
between them, the religious laws would take precedence.
Statements made by the participants:
"Freedom of opinion, the majority decides, everyone can express himself as he
wishes, I am in favor of democracy but, really, the weak ones who are the minority
are hurt by it. For the Arabs, for example, it is harder to live here than for us."
"There is [democracy] in name, but in content it gets to places where you come
across people speaking in the name of democracy, doing things in the name of
democracy, for example, Ahmed Tibi who sits in the Knesset."
"There is a danger in freedom of expression because of the extremist, violent criticism
which is not justified in my opinion, because there is a limit to expressing an opinion,
and it could get to the point of prohibiting people from saying certain things."
"Democracy is not life. It is clear that we live in a democratic state. There are
elections, but I don't think that it can be fully realized because there is such a diverse
population. For me as an ultra-Orthodox woman, my democracy is that I have chosen
the Torah and that is my democracy and my voice. We expect there to be full
democracy but for us as ultra-Orthodox women it cannot be 100% put into effect,
because of the laws of the Torah to which I am subject first and foremost."
"Not always. I don't think there always has to be democracy."
e. Human rights
Just like the perception of democracy, the perception of human rights is also
infused with many contradictions.
The participants declare that they are in favor of human rights, but from in-
depth questioning it is apparent that some of them believe that there are people
entitled to more rights and those that are not.
Many participants view the sensitive human fabric in the state as well as the
existing separation between religion and state as an impediment to the
existence of equal human rights.

91
Statements made by the participants:
"The Israeli Arabs who do harm should have their rights withdrawn. There is a
Hamas representative in the Knesset, Hanin Zoabi, she must get out! How is it
possible that she is in the Knesset? She must be removed urgently."
"People don't get equal rights and also those rights can't be exercised equally.
Democracy goes to whoever was here."
Question: Who is deprived?
Answer: "The poor, the very old, women, Ethiopians, Russians, Arabs, gays."
f. Cost of living
The issue of the cost of living came up, unaided, as one of the urgent issues
the state must deal with.
The high cost of living is also perceived as a blow to the right to existence and
also as a real impediment among the young people who wish to build their
future in the state.
The issue of the high cost of living came up as an urgent matter particularly
for the group of young people because of the stage they are at in the cycle of
life when they have to contend with it.
Statements made by the participants:
"An apartment is something basic, it should be something to take for granted, and in
this country, as a person of my age, I find myself thinking whether I will manage or
won't manage to buy an apartment. A person who works ought to attain a certain
standard of living. In my opinion, there are populations which do not pay their dues
but they have rights. For example, the ultra-Orthodox who get allowances but don't
serve in the army, and that is at my expense."
g. Security
Security is associatively perceived as part of the question of the Jewish-Arab
conflict.
The "Intifada of Knives" is perceived as an immediate threat to the daily lives
of the participants.

92
The Iranian threat is also perceived as endangering the existence in the region
over the long term.
Nonetheless, it is apparent that while on a declarative level the security of the
state is in danger according to the participants, on the level of daily life, the
participants feel a high sense of security.
Statements made by the participants:
"All my associations relate to Arabs, terrorists, attacks..."
Question: Do you feel secure?
Answer: "Yes. I know that the situation in the country is not good and Jews are being
killed. That hurts me but I am not one of those people who are afraid to go to
Jerusalem."
"Arabs, terrorists, terror attacks. I personally am not afraid but it is a pity that that is
the situation."
"There isn't so much security; there are terror attacks, wars, people killed. On a daily
basis in my apartment in Ramat Aviv I feel secure. I am a little nervous about the
knives. It is impossible to know really what will happen when."
This is a charged subject with many responses, some of them contradictory.
h. Religion and state
The participants (religious and ultra-Orthodox) see themselves as Jews before
they are Israelis.
Among the female ultra-Orthodox participants and also for some the religious
teenagers and direct influenced by the level of their religiosity, the laws of the
Torah are perceived as taking precedence over the laws of the state (as
mentioned, in a situation of conflict the laws of the Torah would take
precedence).
Some of the secular participants view themselves primarily as Israelis.
Most of the participants want the state to have a Jewish character (in the
Orthodox religious sense), as determined in the Declaration of Independence.
With regard to the levels of religiosity – opinion is divided.

93
Statements made by the participants, female ultra-Orthodox and traditional religious:
"Why aren't there kosher places at Sarona (a shopping center in Tel Aviv)? Why are
they open on Shabbat? This is the Jewish state so we should bolster the connection
between religion and state."
"There are some things that we cannot compromise on like the matter of marriage, we
wouldn't be able to know whether the parents are Jews, and we would be causing
assimilation."
"Democracy, as secular people see it, cannot go together with the Torah. I am in
favor of democracy except for religious subjects. This is the Jewish state and anyone
who comes to live here knows and chooses to live in the Jewish state and we cannot
compromise because then you would lose the Jewish character of the state."
The secular participants:
"In my opinion there should be a complete separation; the religious coercion
distances people from tradition and from religion. The Law on Hametz (leavened
bread) – people eat Hametz on Passover, and the Brit Milah (circumcision) – there is
no law and everyone does it."
"I believe in the convergence between Judaism and the state and in the character of
the state while maintaining absolute separation."
i. Government intervention in the economy
Since the cost of living is perceived as one of the most pressing problems in
the state, many participants, particularly the young people, believe that the
state should undertake a controlled intervention in economic life. The goal of
this would be to minimize economic and social gaps and to allow a reasonable
standard of living for weakened populations.
Statements made by the participants:
"The economy, security and housing – the state should be responsible for the costs in
Israel, the gaps between the rich and the poor."
"There are very large gaps in the population and the government should intervene
more for the benefit of the weak."

94
j. The direction the state is taking
Differing perceptions of the religious/ultra-Orthodox and the secular
participants.
Secular participants express serious concern about the direction the state is
taking in the sense of lack of tolerance towards the other, in security senses,
demographic senses, increases in the gaps between the rich and the poor, and
the cost of living.
Statements made by the participants:
"We are living on borrowed time, the majority could change and become Arab, the
State of Israel is Jewish and democratic but in the future it will be only democratic
and not Jewish with an Arab majority or leftist organizations will take control and
their decisions will be in the majority."
"I think that we are not moving in a good direction, society is becoming extremist, the
Arabs will be more than 20%, and people hate one another."
"Extremism is increasing and hatred is gaining momentum in a worrying manner, and
even without the demographic problems it is frightening to think what will happen
here."
Religious and ultra-Orthodox participants expressed complete optimism with
regard to the future of the state.
"It is amazing from every point of view – technologically, socially, every aspect. It is
prospering scientifically, security-wise, the Temple will be built and we will be a 'light
unto the nations'."
k. Influence and social involvement
Even though all the participants intend to vote in the Knesset elections, and
those who had the right to vote in the previous elections had exercised their
right, most of them do not intend to participate in political and/or social
activity. The participants are focused on developing in directions that would
bring them economic well-being and personal happiness. Social/political
aspirations are not usually part of this script.

95
Statements made by the participants:
"I wouldn't be good at that. I can't quarrel with someone and then afterwards go to
his daughter's wedding."
"I thought about it once, but I have foreign citizenship which I don't intend to give
up."
"That's too big a responsibility for me."
l. Positions about Germany
The participants think that Israel should strengthen its ties with the countries
of the world to improve its standing in the world.
Germany is perceived as a country friendly to Israel. This friendship is
perceived as an outcome of guilt feelings that motivate Germany's policy
towards Israel and whose origins, of course, are historical.
The participants are very connected to the story of the Second World War and
the Holocaust of the Jews.
Although the present generation in Germany is not perceived as responsible
for the crimes of the previous generation, the attitude to the German people is
one of qualified caution.
The Holocaust is not perceived as a scenario that could be repeated, largely
because of the strength of the state and the army.
Statements made by the participants:
"The present generation is not connected to the Holocaust."
"It is a very influential and important country, they identify with us, the German
people's character has not changed despite the passage of 70 years, they are still
racist, and all the immigrants who are reaching there now – it may be taken out on
them."
"It [the Holocaust] cannot happen because we have a good, large army."
"Germany awarded us a lot of points in the Eurovision."

96
"It's complicated, many years have gone by, and people of the previous generation
have done things to atone, and the present generation says leave us alone, it's got
nothing to do with us, and it's impossible to know if they would do that and if another
country would do the same thing."
Question: Hasn't Germany changed?
A: "It has changed but we should still be cautious."
"We don't have so many connections that we could give up on this one."
Main Findings in the Arab Sector
a. Vision and personal future
As in the case of the Jewish sector, and even more so here, the participants
view higher education as an essential condition for integrating into society.
The participants are focused on their studies, and this is the main subject that
occupies their daily lives.
The girls who participated in the group view the advancement of women as
one of the main challenges facing traditional Arab society.
Statements made by the participants:
"Education is the ultimate weapon of the woman."
"Sometimes hobbies are alright, they go ahead and everything is fine, but the real
difficulty is in the sphere of studies and the matriculation examinations."
"Studying is not cool, or it actually depends on the school. I study in a school in
which the curriculum is dry – no activities outside the school and it is boring
sometimes; just studying all the time is not the solution."
Most of the participants didn't dare to dream of a future beyond employment
and family. It is evident that their dreams are influenced by the significance of
being a minority in the country, and even more so an Arab minority.

97
Statements made by the participants:
"I know someone who wants to study fashion, but because he is male, and because of
the state's restrictions it will be hard for him to realize his dream."
"The chances are fifty percent, because I'm not in a society that is all Arab; if I want
to be a football player I don't think I'll manage to do that."
"It depends on the dream, because in some spheres it is impossible to advance in this
country."
Among the girls, the matter of double exclusion was raised: exclusion based
on nationality and on gender.
Statements made by the participants:
"I am willing to go and study abroad but there is another obstacle and that is the
family's objection."
"I like to live the way I want and that suits me, and I often objected to things that
didn't suit me; I think Arab society supports boys more than girls."
b. The sense of belonging to Israeli society
The participants do not feel that they belong in Israeli society. The experience
of being a minority dominates this feeling and they do not share with the
Jewish participants any of the experiences that provide a feeling of belonging.
The layers on which the feeling of belonging is based as expressed by the
Jewish sector (language, mindset, culture, and army) are those very elements
that differentiate the Arabs and contribute to their exclusion and to their
feeling of not belonging.
Statements made by the participants:
"We don't feel we belong…"
"I do feel that I belong to the state because I train with Jews and because, during the
training we speak Hebrew."
"We are those who were here first, and we are the ones that assimilated them."
"The Arabs have more seniority in the country."

98
c. Perception of democracy and equal rights
The participants expressed great frustration in the face of what they perceive
as democracy and equal rights "for Jews only". The participants feel like
second class citizens in their own country that finds expression in daily
discrimination and racism towards them.
Statements made by the participants:
"There is no democracy in the State of Israel, no freedom, no equality, there is racism
towards Arabs in the sphere of work, and they are prevented from being promoted
and attaining a senior position and restrictions are placed on the Arab."
"It means treating us like human beings; Israel doesn't give us all our rights
compared to the Jews."
"The state does not treat us right; it doesn't even solve problems like murder and all
sorts of problems in Arab society which don't really interest the state."
d. Security
The participants feel a high sense of security in their daily lives in the state.
Israel is perceived as investing great resources in maintaining this security,
and even though they do not serve in the army, they enjoy the fruits of this
security.
Statements made by the participants:
"Actually the reverse is true, from the perspective of security, it is absolutely alright,
and the fact that a Jew is willing to sacrifice everything so that someone can live, they
take care of their lives."
e. The direction the state is taking
The participants are optimistic about the future of the state. It is worth noting
that their attitude to this issue touches mainly on the economic aspect and on
technological development.

99
Statements made by the participants:
"In the field of economics, Israel is a leader, and in the security field it is moving in
the right direction, because I feel secure in this country."
"In education and studies, Israel is a leader; it is a leader in construction and
development."
f. Influence and social involvement
The participants do not believe that they are able to have an influence,
especially in a country in which they are perceived as a minority. They prefer
to invest most of their energy in personal development.
Statements made by the participants:
"I really don't think we can make changes, we are the Arab minority and the most that
has been achieved is a few seats in the Knesset."
"I don't think that it [The Arab Joint List political party] is really helping me as an
Arab citizen of the state."
g. Positions about Germany
In general the level of involvement and interest in Israel's foreign policy is
low.
Nonetheless the participants believe that the relationship between Israel and
Germany is an outcome of history and, for that reason, Germany is inclined to
stand by Israel and help it.
"Germany is more supportive of Israel."
"Germany supports Israel economically as compensation for the Holocaust."
The participants believe that the German people, in contrast to Germany's
stated policy, tend to identify with the suffering of the Palestinian people.
"The German people support the Palestinians more, but their state doesn't do
anything special to help."
"It doesn't help and the world isn't interested in helping to solve the
Palestinian problem."

111
h. Positions towards Arab countries
Arab countries are not perceived as being reliable in all things concerning the
situation of the Arabs living in the State of Israel, in general, and Israeli Arabs
in particular.
"They have the economic and financial ability to help the Syrian refugees and
the Arabs but they don't help at all.
"No, even the Arab countries hate us as the Arabs of 1948."
Summary and conclusions
The participants in the study (Jewish and Arab sectors) are very focused on their
personal well-being, on their future, and their happiness.
The religious and the ultra-Orthodox (Jewish sector) are more focused, and their
path is clearer than that of the secular participants, the younger ones among them
feel confused and overwhelmed with anxiety and a sense of losing their way.
Teenagers who are in frameworks feel more secure than the young people who
are at the stage of life when they are expected to make decisions that are
perceived by them as critical with regard to their future.
All the participants view higher education as having significant value and as a
necessary condition for success in life. Among the Arab participants this feeling
was especially prominent. The obstacles to a successful life, as perceived by
them, are intensified due to their perceiving themselves as a minority and they
understand that, in order to overcome these, they must try harder.
The perceptions about Israeli democracy and equal rights are full of
contradictions among all the audiences surveyed.
In the Jewish sector, there is a perception that Israeli society is made up of
communities that enjoy greater or fewer privileges. Not everyone benefits from
full equal rights both in legal terms and in practice. This perception resonated
among the Arab participants who feel like second-class citizens in their country.
The perception of democracy suffers from contradictions both on the basis of
limits on freedom of expression which is seen by many as desirable, and on the

111
basis of the combination between religion and state and the perception of ultra-
Orthodox girls and some of the religious teenagers in the groups that the laws of
the Torah take precedence over the laws of the state.
All of the participants from the Jewish sector share a feeling of deep belonging to
Israeli society based on language, culture, and mindset. The participants from the
Arab sector do not share an equivalent feeling for exactly the same reasons.
The participants have a sense of personal security in their daily lives, although,
rationally, they are all aware of the security risks and threats to the state.
All the participants believe that the state should intervene actively in economic
life in order to reduce the cost of living, to diminish the gaps between the rich and
the poor, and to enable citizens to live with dignity.
Secular participants express pessimism with regard to the future of the state in
terms of demography, security, and society. Religious participants express
optimism in this context.
German-Israeli relations are perceived as an outcome of guilt feelings on the part
of the Germans and as an attempt to compensate for the past. Nonetheless, the
friendship with Germany is perceived as an important asset for Israel on the
world stage which is hostile to Israel.
Among the Arab participants there is severe disappointment with the Arab
countries which are perceived as not having the Arabs of the region in general
and of Israel in particular on their public agenda.

112
Chapter 4: Teenagers and Young People of Israel,
Yesterday and Today: Comparison of Public Opinion
Trends over Time Dr. Dahlia Scheindlin
Introduction
This chapter draws on the questions of the Youth Survey that have been asked in
previous years to provide an overview of trends over time. How are the ideas, beliefs,
hopes, values and experiences of teenagers and young people in Israel today different
from those of the past?
About half of the questions in the 2016 study were asked in 2010. Many of them were
also asked in previous years – some going as far back as 1998, others beginning in
2004. This fairly extensive tracking makes the Youth Survey a rare resource in the
study of public opinion in Israel. Working with the data archives allows us to learn
how the youth of yesterday, now adults, compare to people who are now the leaders
of tomorrow.
The chapter begins by mapping how teenagers and young people of Israel today have
changed from the past in terms of basic demographic characteristics and political
orientation.
The chapter then moves into substantive topics that were tracked over time. These
sections lay out the data emerging from the time series, while providing some social
and historical context to help explain statistical changes – or consistent findings.
The topics that haven tracked over the years include:
Levels of optimism or pessimism regarding the state and about their personal
role within society. Are young people more or less optimistic now? What do
they want and do they believe they can accomplish their goals in Israel?
Young people’s sense of security in Israel, regarding both the state and
individual experience.
Trust in institutions. The fundamental sense of optimism and security sets
the stage for how people view the institutions that make up Israeli civic life.
These questions all go back to 1998; changing attitudes on specific bodies tell

113
the story of individual institutional legitimacy over time, and changes among
specific demographic groups in attitudes towards these institutions.
Social interaction. The next section examines young people’s attitudes
towards social interaction and cohesion in Israel, particularly those who are
prone to friction. These questions address values about the nature of Israeli
society and politics; addresses the social schisms that threaten society,
relations between Jews and Arabs, and support for equal participation in
society.
Attitudes towards Germany and the Holocaust. As in all previous years,
the survey considers how young people view the history of Germany and the
Jews today, and how they view the current relationship between the two
peoples.
A note on methodology: The rich data set offers numerous dilemmas and a vast set of
directions for analysis. In past years, the Jewish and Arab populations have been
examined in the aggregate, while observing distinctions between teenagers and youth
where relevant. The current chapter preserves this structure, based on the finding that
these two populations are often distinctly different in their attitudes towards many
issues, though not all. The distinction between teenagers and young people exists but
is often less prominent than the different perspectives of Jews and Arabs, especially
regarding trends over time; therefore this is mentioned mainly when relevant.
Further, in the attempt to tell the story of how Israeli society has changed through its
youth, this chapter does not use a fixed framework for assessing attitudes by other
demographic or ideological groups. Rather, the chapter takes a narrative form,
observing patterns among subgroups defined by religion, ideology and gender, mainly
where they stand out.
1. Who Are the Youth Now Compared to the Past?
Throughout the history of Israeli public opinion research, religious observance has
been the strongest demographic characteristic affecting political attitudes of Jewish
citizens. For Arabs the variation of religious observance is not as closely tied to
political attitudes, and is measured differently.

114
But among Jews personal religiosity ranging from secular to ultra-orthodox strongly
predicts liberal/dovish/left attitudes, and society grows increasingly conservative,
hard-line and right-wing with each higher level of higher religious observance. In
other words, religious or secular identity affects a range of issues in Israel, not only
those directly related to religion; they affect how Jewish society view democratic
values, national identity, Jewish-Arab relations in Israel, opinions on the Israeli-
Palestinian conflict.
Therefore, it is important to realize that the level of religious observance in Israel is
growing. In 1998, nearly half of the young respondents were secular (49%), and in
2004 over half – 54%. In the intervening dozen years, the current survey shows that
just over 40% of Jewish respondents consider themselves secular.
The rise in self-definition of 'Masorti' (traditional) is also striking, from 29% and 26%
in 1998 and 2004, respectively, to the current level of 35% who consider themselves
traditional. This is important because on various measures (in this but also other
surveys), the biggest gap in political attitudes is found between the secular and
traditional groups. The latter is somewhat closer in range to the religious, and this
helps tilt society in favour of right wing attitudes.
At present, ten percent of the Jewish youth sample say they are religious and nearly
15% describe themselves as ultra-orthodox. The number of ultra-orthodox has
therefore risen significantly from just nine percent in 1998 and 2004. Most surveys
among the adult population of Israel (18+) show that ultra-orthodox are roughly 10%
of society.
Figure 37: Religious self-definition among Jews, 1998, 2004, 2010 and 2016
49%
54%
42%
41%
29%
26%
27%
35%
9%
10%
18%
10%
9%
9%
12%
14%
0% 10% 20% 30% 40% 50% 60% 70% 80% 90% 100%
1998
2004
2010
2016
Secular Traditional Religious Ultra-Orthodox

115
These demographic shifts indicate that unless religious or traditional attitudes become
less powerfully linked with right-wing political attitudes, the coming generation of
adult Israelis will be more right wing (hawkish), less liberal, and more religious than
previous ones.
Indeed, there has already been a corresponding change over the years in the
ideological leanings of young people. In 2004, following a general right-ward shift
among Israeli Jews during the second Intifada, 56% of all Jewish youth were right-
wing, 25% were left, and eight percent were centrists. At present, 16% of Jews
consider themselves left-wing – which includes people who define themselves as
“centrists leaning somewhat more left.”
The corollary on the right is very high: nearly three-quarters of young people are
right-wing (including center-leaning-right), and 62% among teenagers. True centrists
are just over 10% among Jews, without significant difference between the two age
groups. While data is not available for all years, and at points the question was asked
differently, the trend is clear: young Jews have become far more polarized now. Just
over ten percent now do not wish to identify as any leaning.
Figure 38: Political identity self-definition, 2004 and 2016
25%
50%
8%
5%
56%
11%
11%
35%
0% 20% 40% 60% 80% 100%
Jews
Arabs
2004
16%
10%
10%
40%
68%
8%
8%
41%
0% 20% 40% 60% 80% 100%
Jews
Arabs
2016
Left Center Right Unidentified

116
Arab young people are notably different. The outstanding finding is that a high
portion does not wish to identify with any political ideology: roughly 40%. But this is
not a new finding: there has been little significant change since the 2004 survey, when
35% also refrained from political self-definition.
Very small portions of Arab youth currently identify as right or left (8% or 10%,
respectively, combining both age groups, which showed only tiny variation between
them). But this finding contains a dramatic change: In 2004, fully half of all Arab
respondents openly identified as left-wing, even as over one-third chose not to
identify.
The intervening years have seen intensive strife – three wars in Gaza, renewed
violence from the West Bank, and growing hostility towards Arab citizens in Israel. In
this environment, many Arabs report significant fear among their communities, that
political activity or even identity has dangers or discomfort and therefore many more
prefer not to identify with the ideological left or right.
At the same time, young Arabs respondents who do not wish to identify may also be
expressing alienation from Arab leaders in Israel. Like so many voters in other
western democracies, they could be expressing disappointment and cynicism in
general about politics. For these reasons, even the relatively high self-definition as
“centrist” among Arabs in 2016 can be read more as a non-committal response, rather
than a definition of centrist attitudes according to the Jewish population.
Another observation about the Arab youth; like their adult counterparts in many other
surveys, they are far more likely to respond “don’t know” –not taking a position – on
sensitive questions. This can also be interpreted as a refusal, decline, or suspicion of
stating an opinion. It is not completely new, and can be seen in past years as well. But
the tendency highlights something about either alienation from the major questions in
Israeli society life, or worse – a fear that opinions have unwelcome repercussions. If
true, such fears can be expected to reflect their attitudes towards life beyond the
survey as well.

117
2. Mood: Optimism Declining for Jews, Rising for Arabs?
The 2016 survey shows a precipitous decline in the level of optimism regarding the
future of the state among young Jews. Just 51% of all Jewish respondents (15-18 and
21-25) felt optimistic about the future of the state, lower than at any point since the
1998 survey and over 10 points lower than in 2010 (62.6%). Yet by contrast to 2010,
age trends were reversed: teenagers showed more optimism (54%) regarding the
future of the state, while young people were slightly more pessimistic and just 47%
said they felt optimistic about the future of the state.
Arabs in 1998 showed 52% optimism in the future of the state, dropping to a low of
36% in 2004. This was a natural decline that characterized the entire population that
year, but was particularly pronounced among Arabs, probably due to the effect of the
Intifada and the clear memory of the October 2000 events (the killing of 13 Arab
citizens by Israeli police). Optimism was back up to 52% in 2010 – similar to 1998.
Given the sharp decline among Jews, it is notable that the 2016 survey found a high
point of 63%, nearly two-thirds of Arabs who said they feel optimistic about the
future of the state.
When asked how optimistic they are about being able to fulfill their personal
goals in Israel, once again the depressed state of young Israeli Jews is striking: 56%
of all Jewish respondents say they are very or somewhat certain they can fulfill their
aspirations in Israel. This is not only lower than at any point since 1998, it is nearly 30
points lower – a precipitous fall, and nearly 20 points below the second lowest score
in 2004, before it, after the peak of the second Intifada.
Optimism or the lack of it is also clearly linked to political and religious ideology.
The more religious each subgroup is among Jews, the more optimistic they are
regarding the chances of fulfilling their goals in Israel - almost: the national religious
youth are the most inspired, as nearly 80% are optimistic about fulfilling their goals.
71% of Haredi young people feel this way, but the number drops to 54% among
traditional – and actually dips just below half among seculars. Precisely the same
pattern is found among left, center and right-wing respondents. This trend is
consistent with findings in 2010.

118
Yet again, on this question, Arabs expressed a greater level of optimism than in the
past. They also display more diversity among age groups: 80% of Arab teenagers and
69% of young people felt they can achieve their personal goals – 74% in the
aggregate. This can be compared to 60% in 1998, 50% in 2004 during the depressed
years of the Intifada and October events; and a healthier 67% in 2010.
There are two potential and compelling explanations for the rise in optimism among
Arabs that they will be able to fulfil their personal goals in Israel. The first is that the
memory of the October 2000 events has faded somewhat for those who have just
come of age. In the intervening years, there have been some collective improvements
in the Arab community in Israel, including growing rates of higher education,
especially among women.
The second major development is the massive deterioration of other Arab countries in
the Middle East between the current and last survey in 2010. Arabs in Israel, no less
than viewers around the world, have witnessed the deadly chaos of Syria, Iraq and
know of the strict restrictions in other countries such as Saudi Arabia. They may be
more aware than ever that in a material sense their lives are more stable in Israel.
Figure 39: Optimistic about fulfilling goals in Israel, 1998-2016
What are these goals that people hope to accomplish as individuals? In the past, a
series of topics were listed and respondents were asked how important each specific
goal was to them. In the current survey, the format was changed and participants were
asked to rank them; further the answer “raise a family” was not asked, as it became
79%
74%
85%
56%
60%
50%
67%
74%
50%
55%
60%
65%
70%
75%
80%
85%
90%
1998 2004 2010 2016
Jews Arabs

119
obvious that this is always ranked top priority for all in Israel’s family-oriented
society. In the past, this top answer regarding family generally competed with
economic success, higher education and good friends for the top ratings of
importance.
In the present 2016 survey, the patterns have not significantly changed. Without the
“happy family” question, economic success, higher education and having good times
have reached the top of the list. As in the past, obtaining higher education is nearly
higher for Arabs than for Jews – it is the Arab youths’ first priority (45% choose this,
compared to 43% among Jews – within the margin of error). In fact, in previous years
(and despite the different style of the question), there has been a larger gap showing
higher importance of obtaining post-secondary education among Arabs relative to
Jews. Still, education was second place for Jews, with “economic success” in the top
position.
Among Arabs, economic success was ranked third-place – with “enjoying life” in
second. These top three goals, however, received very close rankings.
Among Jews and Arabs alike, the other life goals, including volunteering for a good
cause, giving to the Army (asked of Jews only) and living abroad are distant goals
compared to the other ones mentioned. But the change in methodology makes it
nearly impossible to compare them to past years.
3. Sense of Security: Falling
Nearly one-third of Jewish youth feel a personal threat to their security, while about
64% did not feel any threat or just a small threat. Among those who did feel
threatened, a much larger portion, over twice as many Jewish respondents, felt just a
mild threat, than those who felt a serious threat.
The low number of Jews who feel threatened has risen somewhat since 2010 (when
24% of Jews felt threatened), probably since two more wars have been fought in Gaza
since 2010, and the last two years have seen ongoing low level violence, mostly
stabbings and vehicular attacks, which escalated in the fall of 2015. Correspondingly,
the 64% who do not feel threatened fell from a high of three quarters (76%) in 2010,
but does not go as low as 55.7% found in 2004, following bitter years of a violent
Intifada starting from 2000.

111
At the same time, it is notable that about 36% of right-wing Jewish youth feel
personally threatened, roughly double the portion of center or left-leaning young
people. Another interesting finding that has remained consistent from 2010 is that
among Jews, young women are far more likely to feel a sense of personal threat – in
other words, experience fear – than young men: 41% to 23%, respectively. The
gender distinction among Jews has no simple explanation; perhaps the high climate of
fear based on attacks against civilians means young women fear physical violence –
or perhaps anywhere in a big world of physical threats and violence, women face
more fears than men. Yet it is notable that such a gap appears already among young
people, and from the last two surveys, it appears to be consistent.
Overall, the young Arab respondents actually reported particularly low personal threat
perceptions – with just seven percent who perceive a threat. This is lower than the
roughly 11% of Arabs who felt threatened in 2010 and significantly lower than 36%
from 2004 – again the shadow of the Intifada’s violence loomed large. While the
numbers are small, in fact the opposite trend is found among Arabs – twice as many
men feel personally threatened than women (nine percent, compared to about four
percent).
4. Trust in State Institutions
Alongside the deep decline in optimism noted in the Jewish community, there is a
harsh decline in the level of trust in the legal system. From a hearty three-quarters of
young Jews who said they trusted the system in 1998, this figure has been on a nearly
unbroken downward trend ever since. The decline paused only from 2004 to 2010, but
it was stable – never climbing. At present just over half of Jews say they trust the
courts. While teenagers show a stronger majority of 60%, among young people this
figure too is at its lowest since 1998, with just 48% - a minority – stating trust in the
legal system.
Yet both groups, and as a result, the average for Jews, show lower levels of trust than
at any point since testing began in 1998 – significantly lower.

111
Figure 40: Trust in legal system among Jews, 1998-2016
One consistent finding is that right wing Israeli young people are significantly less
likely to trust the court system than left wingers; the same pattern was observed in
2010. Thus at present just 47% of right-wing young people say they trust the court
system, compared to nearly three-quarters of left-wingers (among the total sample).
Again, very similar numbers appeared in 2010 based on religious levels.
A similar trust gap is seen among Jews based on religious identity: while among ultra-
Orthodox, the number has not declined (about 1/3 trust the courts in 2016, almost the
same as in 2010, the number of seculars who trust the court has declined from 81%
(among secular adolescents in 2010) to just 63% (of all young secular respondents) in
2016.
Among Arabs the level of trust is lower still, with 39% of teenagers who trust the
legal system, and 54% among young people – a 47% average of all young Arab
respondents. This too is a significant decline from 2010, when nearly 70% of Arab
youth trusted the courts – that number was similar in previous years. Among Arabs
the decline is also notable as contrast with the high optimism noted at the start, and
belies some of those positive findings.
74%
65% 64%
54%
72%
64%
53%
48%
76%
66%
74%
60%
45%
50%
55%
60%
65%
70%
75%
80%
1998 2004 2010 2016
Total Young people Teenagers

112
One of the great constants among Jewish attitudes has been the primacy of the IDF –
in every survey comparing trust in institutions, the IDF ranks number one by a large
margin. This pattern is repeated in the 2016 survey as well, in which roughly 85% of
Jews said they trust the IDF greatly, or somewhat. Yet this is slightly lower than the
91% average trust in the 2010 surveys.
Although the variation is minor – also relative to 90% in 1998 and 88% in 2004 –
there are two indications of a genuine decline. First, the current total level of trust is
the lowest of all four surveys. But more stark is the decline in intensity of trust. In the
past, the large majority of Jewish respondents showed very high levels of “total trust”
in the IDF: 63% in 1998, 58% in 2004, and 57% (statistically unchanged) in 2010. In
each previous survey, the young people have shown a slightly lower level of total
trust than teenagers.
However, in the current survey, this figure declines dramatically. Just 43% and 36%
of young people and teenagers, respectively show total trust – all the remainder say
they “trust” the IDF.
Figure 41: "Complete trust" in the IDF among Jews, 1998-2016
Arab trust in the IDF has always been significantly lower than for Jews, and logically
so. A large portion of the Arab citizens of Israel were governed by the IDF, living
under martial law for the first nearly-two decades of statehood. The older generation
harbor negative collective memories, while the younger generation know the IDF
primarily as an occupying army in the West Bank and Gaza.
63% 58%
57%
40%
58%
49% 48%
36%
67% 67% 66%
43%
30%
40%
50%
60%
70%
1998 2004 2010 2016
Total Young people Teenagers

113
The total level of trust among Arab youth at present is 38%. This is not a great
departure from previous years. In 1998 Arab youth showed 54% trust – but this turns
out to be the anomaly, perhaps a glimmer of the remaining hope from the Oslo years.
2004 saw the worst year for Arab attitudes towards the IDF, following four years of a
very violent Intifada and the killing of 13 Arab citizens in 2000. The latter was
perpetrated by police forces, but the bitter feeling surely spread broadly: fewer than
one-quarter of Arabs expressed trust of any kind towards the IDF in 2004. In 2010,
41% of Arabs trusted the IDF. But here too, the levels of “total trust” have declined
significantly from 2010 – resembling more closely the trends from the low point of
2004.
Similarly, levels of trust in the police itself have been erratic – from a high of 72% in
1998, the tail end of the Oslo years, to just 50% in 2004 following the October events.
A rise in 2010 to 61% was not matched this year, when Arab trust in the police fell
again to 46%.
This particular decline is not a surprise considering high levels of crime in the Arab
community, and the widespread sense that the government does not invest in law
enforcement in Arab areas. This issue came to the fore earlier in 2016 following an
attack on civilians by an Arab citizen from the Triangle region, and the Prime
Minister subsequently criticizing lawlessness in the community. But the problem is
older and deeper. In 2014 Arab citizens were outraged over a police killing of an Arab
demonstrator; in 2015 an internal police investigation against the officers decided
against indicting them. These developments surely contributed to the decline in trust
once again.
Figure 42: Trust in police among Arabs, 1998-2016
72%
50%
61%
46% 40%
50%
60%
70%
80%
1998 2004 2010 2016

114
Regarding Israel’s legislature, the Knesset, the numbers reflect cynicism about
politics seen in the adult population as well – something that is not particularly unique
to Israel. The findings in 2016 also land in between moderately better numbers in
1998, the worst levels in 2004 (only roughly one-quarter of both Arabs and Jews
expressed trust in the Knesset) and a rise to the low 40s in 2010. In 2016 there has
been a ten-point drop in trust for the Knesset, to 32% and 34% for Jews and Arabs,
respectively.
In 2010, differences among teenagers and young people were prominent; in 2016, the
gap was observed only among Jews: as in the past, younger respondents showed
higher levels of trust in the Knesset (37% compared to 25% among young people).
Among Arabs there was little significant difference between them. The lowering of
trust as people enter the adult world most likely reflects the widespread
disillusionment regarding state institutions as one comes into greater contact with
them.
Why the drop in trust from 2010? Since that time, the Knesset has passed legislation
that threaten democratic principles and target Arabs and left-wing attitudes. Since
2010 there has also been coalition instability leading to two further elections in quick
succession, in 2013 and 2015, ongoing coalition bargaining, collapse, re-formation
and rumours. Both a former President and a former Prime Minister have been sent to
jail. While there is some consolation in knowing that the system is acting against
those who transgress, the overriding feeling is jaded and angry towards the
lawmakers.
In their assessment of the media, Jewish young people are notably skeptical –
perhaps in a healthy way given the importance of critical thinking. In this case, 2010
appears to be the outlying year, when between 50-60% of young people (Jews and
Arabs alike) expressed trust in the media overall (strong or moderate levels of trust).
At present 30% of the Jewish young people say they trust the media partly (only a
very small portion of those say they completely trust the media). While this looks like
a precipitous drop from 53% in 2010, in fact it is much closer to the 1998 and 2004
data – for both years just 36% and 37% said they trust the media.

115
What is notable from the last two surveys (2016 and 2010) is that the young people
are significantly less trusting of the media than teenagers – by contrast to the first two
surveys where both groups showed similar levels (1998 and 2004). It might be
considered a normal and healthy development for growing teenagers to learn the
importance of reading the media critically, and becoming more sceptical. However,
more likely the lower trust among young people is part of the larger picture of
general, significant lower trust in state institutions for reasons of cynicism, based on
observation of such negative trends in public life. And the current level of 30% is still
lower than at any other point. Interestingly, the data in 2016 for Arabs is not
significantly different, in terms of low levels of trust for the media.
One incongruent finding relates to the religious institutions and the Rabbinate (for
Jews). Here the figure is lower than ever as well, and reflects a major drop from 2010:
from 60% trust to just 32%. Both the 1998 and 2004 surveys show 45% trust.
Among Arabs, in 2016 nearly half – 46% - say they trust the religious institutions.
This too is a significant decline from previous years – from 71% in 1998 to 61% in
2004 and about 70% in 2010. The lower level may likely reflect growing levels of
higher education in the Arab community, which may be correlated with greater
scepticism of institutional religious authority (although this is speculation, and it is
too speculative to tie education with changes in personal religious beliefs).
5. Social Relations in Israel
Given the low levels of trust in state institutions and the worrying downward trend, it
is valuable to consider what sort of state young people in Israel even want.
For Arabs, a high standard of living has often been considered extremely important
(in the mid 80% range) and at present, it is even higher, with about 95% who say this
is very or somewhat important.
Jews also rank this high, within the range of 80% to over 90% who say it is very or
somewhat important. It is notable, that the Jews shows a significant drop in the
percentage who say a “high standard of living” is very important (just 59% in 2016,
down from roughly 70% in previous years); but not entirely clear why

116
When asked how important it is to have a state of full equality of political rights,
Arabs responded very much as in previous years: that full equality is important or
very important. The numbers are generally close to a consensus and over the years
have ranged from the low 80s to a high of 95% this year.
However, the current survey shows a continuing decline in the portion of Jews who
think full political equality is very important, from: 50%, to 56%, down to 42% and at
present 35%.
Figure 43: Full political equality "very important", 1998-2016
The idea that Israel should be at peace with its neighbours is fading from Jewish
consciousness as well. In 1998, fully 78% of Jews said this was “very” important. At
present just 52% of Jews say so, reflecting a steady decline from year to year.
High support for gender equality is seen among both – but as in the past, is even
higher for Arab young people: in all surveys since 1998, over three-quarters of Arab
respondents have said this was “very important;” in the current survey this number
rose to 87%.
The character of the state involves values, but also the nature of social relations. Israel
has always been a highly divided society. These surveys show how perceptions about
the divisions that are most threatening to social cohesion have changed or remained
the same. In fact, throughout the years of the study, the Arab-Jewish divide has
59% 61%
42%
35%
59%
77%
67%
87%
30%
50%
70%
90%
1998 2004 2010 2016
Jews Arabs

117
always been perceived as the most threatening by the highest portion of respondents
among both Arabs and Jews, since the question has been asked in 2004.
Among young Arab respondents, the sense of social schism was highest during the
second Intifada – in 2004, fully two-thirds, 68%, said this was the most threatening
divide. In 2010 the figure dropped somewhat to about 45%. However, the last few
years have seen increasingly severe rhetoric against the Arab community in Israel,
from far-right nationalist politicians. It is therefore notable that the portion of Arabs
who cited this divide in 2016 was to 52% - a seven-point rise from 2010.
The other social divisions tested include Ashkenazi/Mizrahi, rich and poor, religious
and secular and left or right. The findings have not significantly changed the ranking
of these divisions – after the Arab-Jewish divide, the religious-secular divide is
viewed as most threatening by the next-highest portion, although the actual number
has fallen somewhat compared to previous years, and shows a similar portion as those
who cite the division between rich and poor as the most threatening.
The Ashkenazi-Mizrahi social schism has received a certain extra measure of
attention over the last two years as new generation of young Mizrahi activists have
become increasingly vocal in the media and policy circles. During the time the survey
was conducted, there was a highly publicized report advising the Minister of
Education to include more Mizrahi heritage in Israeli education. Despite this, the
young respondents appear fairly immune to such developments; this divide still ranks
last and the numbers have not changed significantly from previous years: just over
three percent view it as the most threatening divide.
In fact, among perception of social schisms there has only been one significant and
important shift. In 2004, 17% of all young Jewish respondents thought the left-right
divide was the most threatening. By 2016, this number has risen to 28% among Jews.

118
Figure 44: Most endangering dispute among Jews, 2004-2016
The change is an important indicator of a deep perceived polarization. Since Israel has
always been an argumentative society, it is not always clear whether political
polarization is worse than at any time in the past. But the fact that over one-quarter of
young people view political divisions as the top social threat means either that the
bitterness of these divides is worsening; or that political difference is increasingly
seen as a danger to society. The latter is a worrying indicator of political intolerance.
Despite all this, the core tension of Israeli life is between Jews and Arabs. This is not
only a matter of underlying feelings; there are policy implications. The youth studies
have regularly tested whether young Israeli Jews were prepared to deny Arab citizens
of civil rights, such as the right to be elected to Israel’s parliament. In 2004, over half
of Jewish respondents supported this position. In 2010, that the number declined to
46% and in the current survey fell again to 39% in the aggregate for Jews. Teenagers
were slightly less likely to support this position (35%), compared to nearly 44% of
young people (in 2010 there was hardly any difference between the two groups).
Yet there has been no change in the highly negative assumptions among Jewish young
people that Arabs have not accepted the existence of Israel and wish to destroy it. In
2004 this portion reached two-thirds – in both 2010 and 2014, roughly 64% agreed.
Just like in 2010, young people were significantly more likely to think the worst about
Arabs – fully 72% believed they wish to destroy Israel, a very slight rise from 2010.
17% 19%
28%
21% 23%
12%
10%
20%
30%
2004 2010 2016
Left-Right Religious-Secular

119
Figure 45: Attitudes towards Arabs among Jews, 2004-2016
Incidentally, a portion of Arabs agree with the statement that Arabs have not accepted
the state and would destroy it – fully half of teenagers, but much fewer, just under
one-quarter of young people. Since a high portion of teenagers also say they are not
sure – 30% - and then starkly grow out of it (given the large drop among young
people), the position seems to be bluster more than reality. Still it is troubling bluster.
In 1998, about 34% of Arabs in total agreed with the statement and again 30% said
they weren’t sure; in fact this trend has hardly changed.
6. The Holocaust
Since 2009, Prime Minister Benjamin Netanyahu has led the country with a heavy
focus on existential threats; he has raised the theme of the Holocaust repeatedly. This
was somewhat more marked during his term from 2009-2013, as part of his rhetoric
linking the Iranian nuclear program to the Holocaust. In 2010, Jewish youth expressed
the highest level of interest since the survey began in 1998 – over 80%, up from in the
mid-60% range in earlier years. This could also be due to the accumulated impact of
years of educational programming involving visits to Poland for high school students.
In the current survey, the number has decreased once again to precisely two-thirds of
Jews who are very, or extremely interested in the Holocaust. But it remains a
51%
46%
39%
67% 64% 64%
30%
50%
70%
2004 2010 2016
Arab citizens of Israel should be prohibited from being elected to the Knesset
Most of the Arabs have not reconciled with the existence of the State of Israel and would destroy it if they could

121
consensus, with hardly any demographic variation or difference of interest based on
political ideology – left, right and center, religious and secular alike, show the same
high levels of interest. Further, their assessment of the quantity of attention has not
changed – as in the past, over half say Israel deals with topic in just the right amount,
while between 30% to 34% (in 2016) say Israel should address it more than it does. It
is however interesting to note that as in the past, slightly more young women among
Jews take interest compared to men – about 70% to 63%, respectively.
Among Arabs, 20% are interested (very or very much) in the topic, unchanged within
the broad range of 7-30% found in previous years. About one-third believe that Israel
deals with the topic too much, which is similar to the level in 1998. Again it is not
surprising that 2004 was the year for bitter attitude among Arabs; at that time a high
of over half – 53% - said Israel placed too much focus on the Holocaust. Here again
there is an interesting gender distinction: more than double the number of young
women say they take a “little” interest, compared to men (63% compared to 31%),
and roughly half as many women as men say they take “no” interest (16% compared
to 30%)5
It is also interesting to note that the belief that Germany is among the friendly nations
to Israel has reached a high in 2016 among Jews: 64% say this is true or very true –
relative to around the 40% mark in the first two surveys (1998 and 2004) and 60% in
2010. One potential reason is that over the intervening years from the last survey,
other Western countries have become increasingly critical. Young people who are
attuned to news may hear regular reports about criticism of Israel from western
capitals, with German solidly supporting Israel in forums such as the UN.
Finally, just a small percentage believe Germany has not changed and could still see
the rise of a Nazi regime: just 25% among Jews, the lowest since the question has
been asked in 1998.There is another interesting development in this survey: In all
previous years, nearly three-quarters of Jews agreed with the statement that most
ordinary Germans supported the Holocaust. Only in the current 2016 study has this
number fallen to 57%.
5 In 2016 the question was asked of only 23 Arab respondents.

121
Figure 46: "The extermination of Jews was supported, in effect, by the majority
of the German people and not only by the Nazi leadership" (% agree), 1998-2016
Conclusion
Trend over time are not totally consistent – in some ways, 2004 was still the most
depressed year in attitudes among youth. If the same questionnaire was held among
the adult population this may be the case for them too.
Certain specific data points have improved over time – threat perception is not as high
as during those Intifada years, and on one measure of Jewish attitudes towards Arabs
there is a declining portion who would deny civil rights of Arabs to be elected.
However, the 2016 survey stands out for the deep decline in optimism and trust in
state institutions, particularly among the Jewish population. These findings reveal a
sense that the state is stagnating, the institutions are either malfunctioning or worse –
functioning according to unfair systems – and ultimately they point to alienation.
While the Jewish Arab divide in Israeli society is no less profound among youth – if
not more – the religious-secular and partly overlapping ideological divide is
prominent. It is the split between those major world views that underlies some of the
more dramatic changes in the survey, such as optimism for the future of the state.
Given that Israel has been governed by right-wing governments almost consistently
since 2001, perhaps these findings reflect the more optimistic perspective of the group
that knows it is poised to shape the future of the country, in their lifetime.
67%
62% 61%
57%
50%
55%
60%
65%
70%
1998 2004 2010 2016