personal income tax in ireland: the future of the
TRANSCRIPT

EUROPEAN ECONOMY
Economic and Financial Affairs
ISSN 2443-8030 (online)
Peter McQuade Sara Riscado and Stefano Santacroce
ECONOMIC BRIEF 028 | JULY 2017
Personal income tax in Ireland the future of the Universal Social Charge
EUROPEAN ECONOMY
European Economy Economic Briefs are written by the staff of the European Commissionrsquos Directorate-General for Economic and Financial Affairs to inform discussion on economic policy and to stimulate debate The views expressed in this document are solely those of the author(s) and do not necessarily represent the official views of the European Commission Authorised for publication by Servaas Deroose Deputy Director-General for Economic and Financial Affairs
LEGAL NOTICE Neither the European Commission nor any person acting on its behalf may be held responsible for the use which may be made of the information contained in this publication or for any errors which despite careful preparation and checking may appear This paper exists in English only and can be downloaded from httpseceuropaeuinfopublicationseconomic-and-financial-affairs-publications_en
Europe Direct is a service to help you find answers to your questions about the European Union
Freephone number ()
00 800 6 7 8 9 10 11 () The information given is free as are most calls (though some operators phone boxes or hotels may charge you)
More information on the European Union is available on httpeuropaeu
Luxembourg Publications Office of the European Union 2017
KC-BE-17-028-EN-N (online) KC-BE-17-028-EN-C (print) ISBN 978-92-79-64850-2 (online) ISBN 978-92-79-64849-6 (print) doi10276526658 (online) doi102765424238 (print)
copy European Union 2017 Reproduction is authorised provided the source is acknowledged For any use or reproduction of photos or other material that is not under the EU copyright permission must be sought directly from the copyright holders
European Commission Directorate-General for Economic and Financial Affairs
Personal income tax in Ireland the future of the Universal Social Charge
By Peter McQuade Sara Riscado and Stefano Santacroce Summary Government plans to gradually but completely phase-out the Universal Social Charge one pillar of the current personal income tax system face an evident trilemma how to continue to generate revenue and maintain progressivity without imposing distortionary high marginal tax rates The brief first provides a detailed analysis of the main features of the Irish income tax system Then using the EUROMOD microsimulation model it looks at the impact of alternative tax reforms including on the distribution of disposable income The brief does not advocate or prescribe any specific tax reform Instead the brief demonstrates the difficulty of designing a reform of the Irish income tax system that simultaneously reduces high marginal rates and is revenue neutral without being regressive Potential reforms might include a broadening of the tax base and the introduction of a third income tax band However the ultimate resolution to the tax trilemma could lie beyond the income tax system More comprehensive structural reforms could instead entail a shift toward other tax heads Acknowledgements We are grateful to the useful comments by Christian Weise and Stefan Kuhnert A special thanks to Dominique Paturot (OECD) for the valuable guidance through the OECD taxation database and to Fidel Picos and Alberto Tumino for their help with the EUROMOD simulations Contact Peter McQuade European Commission Directorate General for Economic and Financial Affairs petermcquadeeceuropaeu Sara Riscado Joint Research Centre (JRC) ndash Seville sarariscadoeceuropaeu Stefano Santacroce European Commission Directorate General for Economic and Financial Affairs stefanosantacroceeceuropaeu
EUROPEAN ECONOMY Economic Brief 028
European Economy Economic Briefs Issue 028 | July 2017
2
Introduction
After years of fiscal consolidation Ireland has successfully brought its public finances back to a sustainable path Now boosted by a stronger-than-expected economic rebound Irish governments have started to reverse some of the revenue generating structural reforms implemented during the EU-IMF economic assistance programme In particular the focus has been on lowering the burden of the Universal Social Charge (USC) This is a low-rate broad-based personal income tax introduced in 2011 which has provided very substantial and stable revenues Despite this plans to gradually but completely phase-out the USC appear to be central in the coalition governmentrsquos programme In advancing this plan and given the need to ensure the sustainability of public finances the government is facing an apparent trilemma how to continue to generate revenue and maintain progressivity without imposing very high and distortionary marginal rates
In this economic brief we provide detailed analysis of the main features of the Irish income tax system comparing relevant indicators ndash such as tax burden or marginal tax rate ndash across other EUOECD countries In addition we use the EUROMOD1 microsimulation model to look at the impact of alternative tax reforms including an investigation of their impact on the distribution of disposable income The brief does not intend to prescribe any specific tax reform It outlines alternative ways to reduce the marginal personal income tax rate without narrowing the tax base ndash namely introducing a third income tax band2
The USC a purposeful but unloved tax
Irelands personal income tax system has two pillars a standard income tax (hereafter PIT) which is generally applicable to all sources of personal income and the Universal Social Charge (USC) an individualised tax charged on gross income (see Box 1) The USC was introduced on 2011 and replaced both the income levy and the health levy which were increased in 2009 following the bursting of the housing bubble to fill the hole in public revenues left by vanishing stamp duties The USC aimed to simplify the tax system while strengthening fiscal consolidation including by broadening the income tax-base3 It should not be confused with employee social security contributions or pay-related social insurance (PRSI) which are paid separately
The USC is a valuable source of revenue The USC generated nearly EUR 4 billion in 2016 ndash which
represents approximately 22 of income tax revenues or 10 of total tax revenues ndash and it is projected to reach around EUR 56 billion by 2021 under no-policy-change assumption4
Graph 1 Effective income tax and employees social security contribution rates (2016)
Note for single earner (no children) Source European Commission
The USC has a number of advantages in terms of revenue generation compared to the standard income tax system Earnings become liable to USC at a lower level compared to the PIT and it is the entry-point (37 of the average wage) to personal taxation for most taxpayers5 Moreover it has few exemptions that reduce the tax liability compared to other income taxes Thus the USC has a relatively broad base
Yet the new programme for a Partnership Government6 (May 2016) includes a clear will to further reduce personal income tax through the complete phasing-out of the USC This follows two consecutive budgets (2015 and 2016) of income tax cuts7 Given the need for fiscal prudence the government may seek alternative sources of revenue to compensate for the loss of the USC Recent developments indicate that a reform of USC could be part of a wider personal income tax reform
According to the government Irelands current rates of personal taxation could hinder economic growth and erode international competitiveness In particular personal taxation is considered by the government as an increasingly important factor in the international war for talent targeting high-skilled high-earning individuals a key element of Irelands overarching priority of attracting mobile foreign direct investment8 Finally pressure to reverse austerity measures introduced during the crisis also play a role in the desire to scrap the USC
European Economy Economic Briefs Issue 028 | July 2017
3
Box 1 Features of the Irish personal income tax and social contribution system
In Ireland individual incomes are taxed twice Since 2011 in addition to the two-rate standard personal income tax (PIT) the Universal Social Charge (USC) is paid on gross income before tax deductions arising from a range of available tax credits and reliefs are applied Employees (and the self-employed) also contribute to the social security system via a Pay-Related-Social-Insurance (PRSI) charge
PIT The standard income tax is operated under a two rate structure with different thresholds depending on family type A standard rate of 20 applies on all income up to the band threshold whereupon income is taxed up to a higher rate of 40 This band threshold is currently at EUR 33 800 (97 of the average wage of 34 847 in 2015) for a tax payer who is assessed on an individual basis (single) EUR 42 800 for a jointly assessed one-income couple and EUR 67 600 for a two-income couple A one-parent family has a threshold of EUR 37 800 The Irish tax system is not fully individualised the second earner in a married two-earner couple has a non-transferable standard rate band of EUR 24 800 and the remaining EUR 9 000 of herhis standard rate band may be transferred to herhis spouse a feature which further complicates the income tax structure The income tax is progressive primarily due to the availability of tax credits
USC The USC is operated on the basis of low rates with a broad base The first EUR 12 012 is liable at 1 A 3 rate applies between income from EUR 12 012 to EUR 18 668 a 55 rate between EUR 18 668 to EUR 70 044 and a 8 rate for earnings above EUR 70 044 An additional rate of 11 applies to the self-employed with earnings above EUR 100 000 The ceiling of the second rate-band ensures that a full-time employee on the minimum wage is not liable to the third rate of USC and thus pays the minimum USC rate of 3 Medical card holders and persons aged over 70 whose income does not exceed EUR 60 000 are liable to a maximum of 3 Individuals become liable to USC at an income of EUR 13 000 As a result of the multiple rate-band structure the USC increases the progressivity of the tax system While the entry-threshold has been raised during the years from EUR 4 004 when initially introduced in 2011 to EUR 13 000 in 2016 the USC still represents the entry-point to personal income taxation for most taxpayers Budget 2017 reduced the three lowest USC rates by 05 percentage points
PRSI Social security contributions are a smaller component of labour taxation in Ireland The pay-related social insurance (PRSI) is a social insurance charge payable on employment self-employment and most investment income Most employees in Ireland are insurable under Class A and pay PRSI at a rate of 4 Employees have no liability to PRSI if income is below EUR 352 per week (annual equivalent EUR 18 304) As in the case of the USC social welfare income is exempt from PRSI
Tax credits and reliefs
The liability calculated on the taxable income is reduced by several tax credits available to taxpayers The most common of these include i) the basic personal tax credit which is currently EUR 1 650 per year for a single person and EUR 3 300 per year for a married couple ii) the employee tax credit which is also EUR 1 650 is awarded to employees and others who pay tax under the Pay-As-You-Earn scheme iii) the earned income credit of EUR 550 for self-employed people who do not qualify for the employee tax credit Other tax credits relate to specific circumstances such as the single person child carer credit (EUR 1 650) for people who are caring for children on their own or the home carer credit (EUR 1 000) which can be claimed by one spouse or civil partner (the home carer) caring for one or more dependent persons Other two non-standard tax reliefs which are granted at source are the mortgage interest relief and the medical insurance relief Tax credits or tax relief (except for certain capital allowances) cannot be used to reduce the amount of USC an individual must pay
European Economy Economic Briefs Issue 028 | July 2017
4
How does Irelandrsquos Personal Income Tax System compare to other countries
The overall personal income tax burden9 in Ireland as a percentage of GDP is generally considered relatively low compared to other EU countries in part due to low contributions to the social security system (Graph 2) A recent OECD report10 shows that the effective average tax rate11 for a single earner at the average wage is the second lowest rate among those EU members who are members of the OECD (EU21-OECD) and well below the OECD average While it rises sharply with income particularly in the case of childless single earners it remains below the EU21-OECD average across all income levels and different family types (Annex I)
Graph 2 Personal income tax burden (2015)
Source European Commission
A different picture emerges however when the effective marginal tax rate is considered12 The OECD report indicates that single earners in Ireland face among the highest marginal tax rates in the EU At an income of EUR 33 800 (97 of the average wage) the marginal tax rate is already at 495 (51 before the last tax cuts introduced in 2016 Budget) This reflects the combination of USC PIT and PRSI In other words a very high marginal tax rate in Ireland is reached at a relatively low point in the income distribution While marginal tax rates for couples at the average wage (with or without children) remain below the EU21-OECD average they sharply increase with income
By the same token estimates from the OECD report indicate that Ireland has the most progressive income tax system in the EU and well above the OECD average (see Annex I) In particular the
difference in the effective average tax rate is remarkable when comparing individuals at the average wage with those earning 167 of the average level The tax system is also comparatively progressive for couples with two children when their income is jointly assessed
Those features have led some observers13 to argue that the high marginal tax rate in Ireland especially but not only for single earners is the combined product of the desire to achieve strong progressivity while exempting a relatively large proportion of earnings from tax liability Despite the numbers of measures in recent years aimed at broadening the income tax base such as the winding down of most property reliefs and the restrictions to use tax relief over certain earnings the income tax base remains relatively narrow
Graph 3 Tax entry threshold
Note The tax entry threshold refers to the percentage of average wage at which average tax rate for a single earner without children exceeds 0 The 14 countries are Switzerland the Czech Republic Germany Greece Spain Finland France Hungary Italy Japan Poland Portugal Slovenia Turkey Source OECD European Commission
While there is no standard measure of the breadth of a tax base as a proxy we compare the tax entry threshold indicator across OECD members The tax entry threshold refers to the percentage of the average wage at which the average tax rate for a single earner without children becomes positive From this it is evident that individuals in Ireland can have relatively high earnings before being subject to income tax (see Graph 3) Indeed there are 14 OECD countries where the incomes of a single person with no children are subject to positive average income tax rates from the first euro earned In contrast a similar individual in Ireland is not subject to positive average income tax rates
0
5
10
15
20
25
30
35
40
14 C
ount
ries US
DK LU SE NO NL
AT IS BE SK EE UK IE
European Economy Economic Briefs Issue 028 | July 2017
5
(including social security contributions) until they earn approximately 35 of the average wage
This demonstrates the relative narrowness of the tax base in Ireland and broadly applies even when an alternative threshold average tax rate of 25 is used Moreover this indicator would be even higher in Ireland were it not for the existence of the USC Similarly the Irish authorities report that while 36 of earners are currently exempt from income tax only 29 are exempt from the USC14 It follows that eliminating the USC would raise the tax entry threshold and further narrow the tax base
Overall and as it stands the Irish personal income tax system including the USC delivers lower than average revenue is relatively progressive but narrow and at the cost of relatively high marginal rates
The Tax Trilemma
In pursuing their objectives of reducing the tax burden and disincentives to work while keeping a sufficient stream of revenue the Irish government is confronted with a policy trilemma For any tax the amount of revenue generated is a function of the base to which it is applied and the rate(s) Policy makers in all countries face a trade-off along these three dimensions as illustrated in Graph 4 Compared to the OECD average Ireland generates relatively little income tax revenue as a share of GDP applying high marginal rates to a relatively narrow base
Graph 4 The tax trilemma
Note Data are expressed as an index where the average of the available observations equals 100 The tax threshold refers to the percentage of the average wage at which the tax rate exceeds 25 The index for the tax entry threshold on the vertical is the inverse such that lower values suggest a narrower tax base The mean marginal tax rate is the mean of the marginal tax rate applied to income between 50 and 250 of the average wage Income tax revenue as a percentage of GDP is calculated using taxes on income and wealth (ESA 10 D5) and compulsory non-pension contributions (ESA 10 D613CE) Average of OECD countries for which data was available Source OECD Eurostat
Graph 5 The tax trilemma in OECD countries
Note The tax entry threshold refers to the percentage of average wage at which tax rate exceeds 25 The mean marginal tax rate is the mean of the marginal tax rate applied to income between 50 and 250 of the average wage Income tax revenue as a of GDP is calculated using taxes on income and wealth (Eurostat D5) and compulsory non-pension contributions (D613CE) Source European Commission
Moreover Graph 5 Panel A shows that among OECD countries there is a tendency to combine high marginal rates with broader tax base (ie lower tax
70
11485
50
75
100
125
Tax Base Threshold
MarginalRates
Revenueto GDP
Ireland Average (OECD)
ATBE
CZ
DK
FIFR
DE
EL
HU
IE
ITLUNL
PL
PT
SK
SI
ES
SE
UK
0
20
40
60
80
100
120
140
160
180
0 10 20 30 40
Tax
base
th
resh
old
Income tax revenue as a of GDP
B
AT
BE
CZ
DK
EE
FI
FR
DE
EL
HU
IE
IT
LU
NL
PL
PT
SI
ES
SE
UK
00
100
200
300
400
500
600
700
0 10 20 30 40
Mea
n M
argi
nal R
ate
Income tax revenue as a of GDP
C
AT BE
CZ
DK
FIFR
DE
EL
HU
IS
IE
IT
JP
LUNLNO
PL
PT
SI
ES
SE
TR
UK
US
0
20
40
60
80
100
120
140
160
180
0 10 20 30 40 50 60
Tax
base
thr
esho
ld
Mean Marginal Rate
A
Nar
row
erta
x ba
seN
arro
wer
tax
base
European Economy Economic Briefs Issue 028 | July 2017
6
thresholds) As both of these policies contribute to greater revenue generation this might indicate that governments are optimising tax policies in order to achieve target levels of revenue or more generally fund a given size of government
Panels B and C clearly illustrate the trade-off between the amount of revenue and tax policies Countries that have higher income tax revenue as a percentage of GDP generally attempt to expand the tax base by having a lower threshold at which income is taxed and apply higher marginal rates
Overall each country must find an acceptable combination of these tax policies While Ireland is not an outlier along any dimension when compared to other OECD members it is possible that another mix could represent a better trade-off by delivering similar revenue along with a broader base and lower marginal rates
Changing the status quo is undoubtedly a challenge as it would have substantial economic and distributional consequences Yet the alternatives that have been proposed to date such as raising the existing tax bands or reducing tax credits appear to be costly and fail to replicate a number of valuable features of the USC These proposed alternatives to the USC tend to generate less revenue andor further narrow the tax base while keeping marginal rates for individuals on average or high incomes as they are
Is there room for a broader reform
The governments determination to gradually phase-out the USC deserves a careful analysis of its fiscal and distributional implications The following section aims to explore potential alternative long-run tax reforms within the constraints of the trilemma
Using the EUROMOD microsimulation model we compare the current two-pillar personal income tax system as described in box 1 (the baseline scenario) with alternative scenarios where the USC is fully replaced by a PIT-only tax system (see Annex II for more details and other simulated scenarios)
The first scenario entails the complete abolition of the USC (Table 1 Column 1) while the standard and the second PIT rates are maintained at 20 and 40 respectively This corresponds to the announced medium-term government policy The simulation shows that this scenario would come at very high price for public finances as it would entail a reduction of around 20 in total personal income tax receipts Under this scenario the entry-point to
the tax system for an average taxpayer will increase from EUR 13 000 (in the baseline scenario) to EUR 16 500 Furthermore this would have a regressive impact on the income distribution resulting in a significant increase of the GINI15 coefficient
Table 1 Alternative tax reforms
Source European Commission Joint Research Centre based on the EUROMOD model
In the second scenario (Table 1 Column 2) the standard rate is maintained at 20 while the second tax-band rate is increased from 40 to 45 According to the simulation this would only recover around a third of the lost revenues compared to the baseline scenario The majority of the benefit from the reform would still accrue to the highest income deciles
In the third scenario (Table 1 Column 3) in addition to reforms outlined in the second scenario we also reduce the main tax credits (from EUR 1 650 to EUR 1 350) in order to compensate for the narrowing of the tax-base that would result from the abolition of the USC In so doing the entry-point to the tax system would fall to EUR 13 500 instead of EUR 16 500 in the second scenario Under this scenario almost 70 of the lost revenues would be recouped However a single earner at the average wage would still face the highest marginal tax rate among OECD countries (49 )
Building on the previous scenarios in the fourth scenario we also introduce a third intermediate tax band at a rate of 35 targeting incomes between EUR 29 800 and EUR 37 800 (Table 1 Column 4)16 The PIT income tax system would therefore be based on three income tax-bands and rates (20 35 and 45 respectively) This scenario would recover 80 of the revenues forgone as a result of the abolition of the USC Moreover the marginal tax rate for the average single employee would drop to
(1) (2) (3) (4)
baseline No USCNo USC + PIT
rates 20-45
No USC + PIT rates 20-45 + tax
credits 1650=gt1350
No USC + PIT rates 20-35-45 + tax credits
1650=gt1350
revenue losses compared to the baseline
- 100 66 30 20
marginal tax rate (single 100 AW)
495 44 49 49 39
tax entry threshold 124 148 138 131 128
change in the GINI
coefficient0 42 21 17 14
scenarios
The tax entry threshold refers to the percentage of the average w age at w hich the effective tax rate exceeds 25
European Economy Economic Briefs Issue 028 | July 2017
7
the EU average thanks to the smoothing of the overall tax profile Compared to scenario 3 such a reform would further reduce the effect of the abolition of the USC on income distribution as the GINI coefficient would stay slightly closer to current values
The distributional effects of the simulated reforms are shown in Graph 6 which displays the change in the mean equivalised disposable income17 for each decile compared to the baseline scenario The chart illustrates the regressive distributional impact of the government plan to gradually eliminate the USC (scenario 1) In contrast scenarios 3 and 4 could mitigate the regressive impact of the full removal of the USC on the income distribution
Graph 6 Change to the mean equivalised disposable income of households
Note The deciles are fixed to the baseline regime Source European Commission Joint Research Centre based on the EUROMOD model
Nevertheless according to the simulation in scenarios 3 and 4 the upper deciles would still benefit most while the first two deciles of households would be slightly worse-off compared to the baseline18 However the gains in disposable income of the richer decile are now much lower compared with all the other reforms including the governments plan (see also Annex II) A tapered withdrawal of tax credits for income above EUR 70 000 would help to further reduce the impact on income distribution and to improve the burden-sharing19 It would increase the share of tax paid by higher deciles and return the GINI coefficient to the level of the baseline
Conclusion
Overall the analysis indicates the difficulty of designing a reform of the existing Irish income tax system that simultaneously reduces high marginal rates and is revenue neutral without being regressive There is an ineluctable trade-off between these three objectives if policymakers restrict themselves to taxing income even though a parametric reform of the income tax system with less negative distributional effects does appear feasible
The analysis showed that it would only be possible to recover a substantial part of revenue losses by lowering the entry-point to the tax system via a reduction of the tax credits At the same time the introduction of a third intermediate tax band would help to reduce the marginal tax rates in such constrained set of policy choices They could also be elements of a more ambitious and comprehensive structural tax reform
Overall the solution to the tax trilemma might lie in looking beyond changes to the income tax system including to other direct and indirect tax heads
European Economy Economic Briefs Issue 028 | July 2017
8
References (Century Gothic 12 bold)
Brady G (2016) Rethinking the tax debate ndash the key issues for the election IBEC policy brief Issue 0316
European Commission (2015) Tax reforms in EU Member States 2015 Institutional paper 82015
Goldrick-Kelly (2016) How Does Irelandrsquos Income Tax Compare NERI Research inBrief No 37
Irish Tax Institute (2016) Perspectives on Irelands personal income tax system ndash a medium to long term approach Dublin
OrsquoConnor B (2013) ldquoThe Structure of Irelandrsquos Tax System and Options for Growth Enhancing Reformrdquo The Economic and Social Review Vol 44 pp 511-540
OrsquoConnor B et al (2016) ldquoSearching for the inclusive growth tax grail The distributional impact of growth enhancing tax reform in Irelandrdquo The Economic and Social Review Vol 47 pp 155-184
OECD (2016) Taxing Wages 2016 OECD Publishing Paris
Paturot D K Mellbye and B Brys (2013) ldquoAverage Personal Income Tax Rate and Tax Wedge Progression in OECD Countriesrdquo OECD Taxation Working Papers No 15 OECD Publishing Paris
Tax Strategy Group (2016) Income Tax and Universal Social Charge Incorporating an ex-ante equality impact assessment of possible changes to the income tax system Department of Finance Dublin
European Economy Economic Briefs Issue 028 | July 2017
9
Annex I Average and marginal effective tax rates international comparisons The OECD Taxing Wages 2016 report provides an interesting point of departure to analyse the full impact of taxes and benefits on an employees take-home pay and provides a comparative illustration of the average and marginal tax rate across OECD economies including the 21 EU Members State who are members of the OECD (EU21-OECD) The Report shows among other indicators the amounts of taxes social security contributions payroll taxes and cash benefits for eight family-types which differ by income level and household composition It also presents the resulting average and marginal tax rates
The effective average tax rate
In Ireland a single full-time employee at the average wagexx pays nearly 20 of hisher gross wage in personal income taxes and social security contributions net of cash benefits This is the second lowest rate after Estonia among the EU21-OECD countries and well below both the OECD and EU21-OECD averagexxi (Graph a)
The effective average tax rate rises sharply with the increase in income particularly in the case of childless single earners pointing to a highly progressive tax system At 167 of average wage the 322 effective average tax rate borne by a single employee in Ireland is above the OECD average (31 ) but still lower than the EU21-OECD average (346 ) However the effective average tax rate in Ireland remains below the OECD and the EU21-OECD average across the other different family types (Graph b) Compared to the OECD and the EU21-OECD average the Irish tax system appears to be particularly generous with married couples or civil partners with or without children thanks to the effect of the marital status relief child benefits home carers allowance and the family income supplement Graph a Income tax plus employee contributions less cash benefits (single 100 AW) 2015
Graph b Effective average tax rates by family-types and wage levels 2015
Source OECD
The effective marginal tax rate
The effective marginal tax rate shows the incremental change to personal income tax and employee social security contributions less cash benefits when gross wage earnings rise marginally The OECDs report indicates that a childless single earner on the average wage in Ireland faces among the highest marginal tax rates in the EU (the third highest before Germany and Belgium) and above the OECD average (Graph c) Looking at different family compositions and earnings the marginal rate of income tax (plus employee contributions less cash benefits) remains well above the OECD and the EU21-OECD average for single employees The higher marginal rate for single employees with children is explained by the reduction of the family income supplement (means tested) when earnings increase (the equation does not take into account however the one parent family payment) For couples or civil partnerships the marginal tax rate on average wage is not particularly high However marginal tax rates pick up again when earnings rise above the average wage
European Economy Economic Briefs Issue 028 | July 2017
10
Graph c marginal income tax rate plus employee contributions less cash benefits (single 100 AW) 2015
Graph d marginal income tax rates by family-types and wage levels 2015
Source OECD
The degree of tax progressivity
An important consideration in the design of an income tax is the level of progressivity that is the rate at which the income tax burden increases with income The degree of progressivity of the personal income tax system can be generally assessed by comparing the burden faced by single persons earning 67 or 100 of the average wage with that faced by their counterparts earning 167 of the average wage Estimates from the OECDs report indicate that Ireland has the most progressive income tax system in the EU and well above the OECD average at least for single earners In particular the difference in the effective average tax rate is remarkable when comparing individuals at the average wage with those earning 167 of the average level (Graph e) The tax system remains comparatively higher also for couples with two children when their income is jointly assessed Comparing the effective tax rate faced by a family with the first earner at the gross average wage and the second increasing herhis earning from 33 to 100 of the average gross wage Ireland is the fourth highest among EU and still above OECD average (Graph f) Graph e average tax rate moving from 67 to 167 of the average gross wage (single no children) 2015
Graph f average tax rate moving from 133 to 200 of the average gross wage (couple 2 children) 2015
Source OECD European Commission
European Economy Economic Briefs Issue 028 | July 2017
11
Annex II The simulated impact of the policy reforms and EUROMOD modelling approach EUROMOD is a microsimulation model that replicates the tax and benefit systems of all EU Member States allowing the quantification of the most relevant income taxes social contributions and benefits and their effects on household disposable income More specifically EUROMOD applies a set of policy rules to representative micro-data of households and individuals and it calculates income taxes social contributions family and housing benefits social assistance and other income-related benefits on the basis of individual and household characteristicsxxii It delivers the results of the tax-benefit calculations as well as disposable income at the individual and household level Furthermore EUROMOD encodes the policies and the corresponding parameters of the tax-benefit systems currently in force and also those of recent years Importantly EUROMOD captures the interaction of the tax-benefit systems in the sense that changes in one policy may affect eligibility for others This is especially relevant for the analysis of the fiscal and equity impact of tax reforms However EUROMOD only delivers the first-round effects of the simulations and does not take into account the behavioural response of individuals to a given policy change Long-term policy effects are also not addressed with this mode
The simulation of ad hoc tax reforms for Ireland has required substantial adaptations to the EUROMOD microsimulation model First of all the 2015 tax system (last available tax system in our present version of EUROMOD) has been updated to the changes introduced in the 2016 Budgetxxiii The creation of a third income tax band in the standard personal income tax system has required the creation of a new tax schedule in the baseline system in order to consider three different tax units In particular the EUR 9 000 of allowable income transfer within a couple has been maintainedxxiv
Thresholds of the third middle-income tax band
Personal income tax
Taxpayer First tax band Second tax band
Single EUR 29 800 EUR 37 800
Single parent EUR 33 800 EUR 41 800
Married ndash one earner EUR 38 800 EUR 46 800
Married ndash two earners EUR 59 600 EUR 75 600
Several types of tax reforms have been simulated The first entailed changes in the two-rate standard PIT system including a reduction of the basic personal the employee and the Single Person Child Carer tax credits More specifically the simulations performed on the two-rate PIT system were
1) Elimination of the USC (scenario n 1 in the main text) 2) Elimination of the USC combined with an increase in the standard PIT rate to 25 3) Elimination of the USC combined with an increase in the high PIT rate to 45 (scenario n 2 in the
main text) 4) Elimination of the USC combined with a decrease in the tax above mentioned credits to EUR 1 350 5) Elimination of the USC combined with an increase in the high PIT rate to 45 and a decrease in
the above mentioned tax credits to EUR 1 350 (scenario n 3 in the main text)
We then considered the introduction of an intermediate income tax-band In the reformed three-rate PIT system we have simulated the following combinations
6) Elimination of the USC combined with a three-rate PIT system 20 -30 -40 7) Elimination of the USC combined with a three-rate PIT system 20 -30 -40 and a decrease in
the above mentioned tax credits to EUR 1 350 8) Elimination of the USC combined with a three-rate PIT system 20 -30 -45 9) Elimination of the USC combined with a three-rate PIT system 20 -30 -45 and a decrease in
the above mentioned tax credits to EUR 1 350
European Economy Economic Briefs Issue 028 | July 2017
12
10) Elimination of the USC combined with a three-rate PIT system 20 -35 -45 11) Elimination of the USC combined with a three-rate PIT system 20 -35 -45 and a decrease in
the above mentioned tax credits to EUR 1 350 (scenario n 4 in the main text) 12) In addition scenarios with an a provide for a tapered withdrawal of tax credits for income above
EUR 70 000 Tables below summarise the main results
Table IIa Relative fiscal impact of the simulated reform
Note all values are percentage Source European Commission Joint Research Centre based on the EUROMOD model
Table IIb change in the mean equivalised disposable income
Source European Commission Joint Research Centre based on the EUROMOD model
1 EUROMOD is a microsimulation model that replicates the tax and benefit systems of all EU Member States allowing the quantification of the most relevant income taxes social contributions and benefits and their effects on household disposable income EUROMOD is developed by the Institute for Social and Economic Research at the University of Essex in collaboration with national experts It is financed by the EU Programme for Employment and Social Innovation run by the European Commission (DG Employment) Since March 2013 it has been used as the main modelling tool of the Fiscal Policy Analysis Unit of the Joint Research Centre of the European Commission More information is provided in Annex II
[1][0] [2][0] [3][0] [4][0] [4a][0] [5][0] [5a][0] [6][0] [7][0] [7a][0] [8][0] [9][0] [9a][0] [10][0] [11][0] [11a][0]
No USC
No USC and standard
rate 20=gt25
No USC and high rate
40=gt45
No USC and tax credits
1650=gt1350
No USC tax credits
1650=gt1350 phasing out
of the employee tax credit
(from EUR 70000)
No USC and high rate
40=gt45 and tax credits
1650=gt1350
No USC and high rate
40=gt45 tax credits
1650=gt1350 and phasing
out of employee tax credit
(from EUR 70000)
No USC and three
PIT brackets
20-30-40
No USC and three PIT brackets
20-30-40 and tax
credits 1650=gt1350
No USC and three PIT brackets
20-30-40 tax
credits 1650=gt1350
and tax phasing out
of employee tax credit
(from EUR 70000)
No USC and three
PIT brackets
20-30-45
No USC and three PIT brackets
20-30-45 and tax
credits 1650=gt1350
No USC and three PIT brackets
20-30-45 tax
credits 1650=gt1350 and phasing
out of employee tax credit
(from EUR 70000)
No USC and three PIT brackets
20-35-45
No USC and three PIT brackets
20-35-45 and tax
credits 1650=gt1350
No USC and three PIT brackets
20-35-45 tax
credits 1650=gt1350 and phasing
out of employee tax credit
(from EUR 70000)
PIT 10000 12071 10756 10820 10885 11576 11642 10046 10866 10931 10679 11499 11565 10949 11768 11834 Universal social charge 000 000 000 000 000 000 000 000 000 000 000 000 000 000 000 000Total taxes 8315 9865 8881 8929 8978 9495 9544 8349 8963 9012 8823 9437 9486 9025 9638 9688 SIC employee 10000 10000 10000 10000 10000 10000 10000 10000 10000 10000 10000 10000 10000 10000 10000 10000 SIC employer 10000 10000 10000 10000 10000 10000 10000 10000 10000 10000 10000 10000 10000 10000 10000 10000 SIC self-employed 10000 10000 10000 10000 10000 10000 10000 10000 10000 10000 10000 10000 10000 10000 10000 10000 Total SIC 10000 10000 10000 10000 10000 10000 10000 10000 10000 10000 10000 10000 10000 10000 10000 10000 Pensions 10000 10000 10000 10000 10000 10000 10000 10000 10000 10000 10000 10000 10000 10000 10000 10000 Means tested benefits 9980 9992 9980 9986 9986 9986 9986 9980 9986 9986 9980 9986 9986 9980 9986 9986 Non-means tested benefits 10000 9998 10000 9998 9998 9998 9998 10000 9998 9998 10000 9998 9998 10000 9998 9998 Total benefits 9992 9996 9992 9993 9993 9993 9993 9992 9993 9993 9992 9993 9993 9992 9993 9993 Net budgetary effect 5005 9614 6695 6831 6977 8520 8666 5108 6933 7080 6524 8348 8494 7125 8948 9095 Mean equiv disp income 10356 10021 10235 10225 10215 10104 10094 10348 10217 10207 10247 10116 10106 10203 10072 10062 Gini coefficient 10423 10252 10214 10384 10351 10172 10140 10418 10379 10347 10236 10194 10191 10181 10138 10106
[1][0] [2][0] [3][0] [4][0] [4a][0] [5][0] [5a][0] [6][0] [7][0] [7a][0] [8][0] [9][0] [9a][0] [10][0] [11][0] [11a][0]
Deciles No USC
No USC and standard
rate 20=gt25
No USC and high rate
40=gt45
No USC and tax credits
1650=gt1350
No USC tax credits
1650=gt1350 phasing out
of the employee tax credit
(from EUR 70000)
No USC and high rate
40=gt45 and tax credits
1650=gt1350
No USC and high rate
40=gt45 tax credits
1650=gt1350 and phasing
out of employee tax credit
(from EUR 70000)
No USC and three PIT brackets
20-30-40
No USC and three PIT brackets
20-30-40 and tax
credits 1650=gt1350
No USC and three PIT brackets
20-30-40 tax
credits 1650=gt1350
and tax phasing out
of employee tax credit
(from EUR 70000)
No USC and three PIT brackets
20-30-45
No USC and three PIT brackets
20-30-45 and tax
credits 1650=gt1350
No USC and three PIT brackets
20-30-45 tax
credits 1650=gt1350 and phasing
out of employee tax credit
(from EUR 70000)
No USC and three PIT brackets
20-35-45
No USC and three PIT brackets
20-35-45 and tax
credits 1650=gt1350
No USC and three PIT
brackets 20-35-45 tax
credits 1650=gt1350 and phasing
out of employee tax
credit (from EUR 70000)
1 020 -075 020 -032 -030 -032 -030 019 -032 -030 019 -032 -030 019 -033 -031
2 020 -052 015 -023 -020 -023 -020 015 -023 -020 015 -023 -020 015 -023 -020
3 047 -056 041 -010 -007 -011 -009 042 -010 001 041 -011 -009 040 000 -010
4 099 -102 095 -005 003 -009 -001 097 -006 027 095 -009 000 092 000 -004
5 156 -132 146 016 026 007 018 150 011 058 144 005 015 136 000 007
6 230 -103 200 076 080 047 050 224 071 126 203 050 053 183 029 033
7 290 -108 240 123 126 075 077 277 111 169 242 077 079 208 043 045
8 363 -066 284 204 200 127 122 343 186 232 288 131 127 234 077 073
9 450 -018 308 284 276 144 136 435 270 321 330 165 158 251 088 080
10 726 343 371 598 553 242 197 721 593 602 406 278 233 324 195 150
All 356 021 235 225 215 104 094 348 217 251 247 116 106 203 072 062
Note Mean values are calculated for all householdsNote 2 All values are percentages
European Economy Economic Briefs Issue 028 | July 2017
13
2 It is acknowledged that an alternative solution to the tax trilemma might lie in looking beyond changes to the labour tax system for instance in property or environmental taxation 3 In the years up to the crisis policy measures with regard to income tax were mostly aimed at increasing tax credits and income-tax-bands to the point where around 40 of income earners were exempted from income tax and only 20 of earners were liable to the higher rate of income tax The sudden falls in incomes and employment at the onset of the crisis meant that the income tax base narrowed drastically According to the Department of Finance over 45 of income earners were exempt from income tax in 2010 and just over 13 were liable to higher rate of income tax 4 Parliamentary question n 842016 addressed to the Minister for Finance (Deputy Michael Noonan) by Deputy Pearse Doherty 5 The entry-threshold of the USC has been raised during the years from EUR 4 004 in 2011 when initially introduced to EUR 13 000 in 2016 6 See new government programme at httpwwwmerrionstreetieMerrionStreetenImageLibraryProgramme_for_Partnership_Governmentpdf 7 2016 Budget in particular focused on changes to the Universal Social Charge (USC) The USC rates were cut in each of the three lowest bands from 15 to 1 from 35 to 3 and from 7 to 55 The Budget also increased the entry threshold of the USC from EUR12 012 to EUR13 000 removing approximately 42 500 earners from the scope of the charge while the middle threshold was also increased by over EUR1000 to EUR18 668 8 Indeed the Irish labour force is characterised by an unusual degree of international mobility and it has the third largest international workforce in the EU as 15 of the labour force are immigrants The Irish Central Statistical Office has recently estimated that nearly 32 000 international citizens moved to Ireland in the 12 months to April of 2016 9 The analysis focuses on the tax burden which combines income tax plus employees social security contributions (SSC) in order to emphasise the attractiveness of Ireland for workers in the context of its high international labour mobility Taking into account employees SSC also facilitates international comparison as Ireland has low SSC contributions compared to the EU average 10 OECD (2016) The Report shows the amounts of taxes social security contributions payroll taxes and cash benefits for eight family-types which differ by income level and household composition It also presents the resulting average and marginal tax rates 11 The sum of personal income taxes and employee social security contributions net of cash benefits as a percentage of gross wages 12 This indicator shows the incremental change to personal income tax and employee social security contributions less cash benefits when gross wage earnings rise marginally 13 See for example OrsquoConnor et al (2016) 14 For a single employee entry into PIT tax occurs at approximately EUR 16 500 and entry into social contributions (PRSI) occurs at EUR 18 304 15 While Ireland has relatively high income inequality before tax and transfers the Gini coefficient after taxes and transfers is below the EU average demonstrating the highly progressive nature of tax and welfare systems 16 Thresholds for couples and single parents have been changed accordingly 17 According to Eurostat the equivalised disposable income is the total income of a household after tax and other deductions that is available for spending or saving divided by the number of household members converted into equivalised adults household members are equalised or made equivalent by weighting each according to their age using the so-called modified OECD equivalence scale (httpeceuropaeueurostatstatistics-explainedindexphpGlossaryEquivalised_disposable_income) 18 Although some of the losses in disposable income for lower deciles are due to the sizeable reduction of tax credits it primarily reflects the difficulties of reforming the existing income tax system in an equitable manner 19 Other ways to simplify the income tax system could be to terminate incentives to stay at home andor move to a fully individualised tax system Under the latter the tax band for single earners would be the same as the married one-earner band and each spouse in a married couple would have the same non-transferable standard rate band Both measures could also expand the tax base by encouraging more people to seek employment However such reforms could be difficult to implement as they could provoke resistance xx The average production worker in Ireland earned EUR 34 847 in 2015 according to the OECDs estimates xxi Income tax liabilities account also for the basic tax credit relief (EUR 1 650) and the employee credit (EUR 1 650) xxii The micro-data used in the EUROMOD simulations come from the EU Statistics on Income and Living Conditions survey (EU-SILC) in its cross-section version and consist mainly of data on personal and household characteristics several types of income (eg market income pensions or social transfers) certain expenditures (eg housing costs or life insurance payments) and other variables related to living conditions Most of the taxes contributions and benefits are simulated based on these variables xxiii It involved updating the 2015 tax rates of the USC schedule to the ones applied in 2016 increasing the Home Carer tax credit from 810 to 1 000 Euros raising also the home carers income threshold from EUR 5 080 to EUR 7 200 introducing a PRSI relief for employees of a maximum of EUR 12 per week commencing at income of EUR 35201 Euros weekly tapering out at a rate of one-sixth of income in excess of this threshold (ie relief ends as income reaches EUR 424 per week) increasing the weekly threshold of the employers PRSI from EUR 35601 to EUR 37601 and updating the rate applied to the first bracket of this contributions schedule from 425 to 85 xxiv The minimum income earned by each spouse to be in the first band would be EUR 20800 (EUR 29800 ndash EUR 9000) and to be in the second band would be EUR 28 800 (EUR 37 800 ndash EUR 9 000) This would be equivalent to the married one earner first and second thresholds computed as the sum of the single thresholds plus the EUR 9 000 allowable transfer
EUROPEAN ECONOMY ECONOMIC BRIEFS
European Economy Economic Briefs can be accessed and downloaded free of charge from the following address httpseceuropaeuinfopublicationseconomic-and-financial-affairs-publications_enfield_eurovoc_taxonomy_target_id_selective=Allampfield_core_nal_countries_tid_selective=Allampfield_core_date_published_value[value][year]=Allampfield_core_tags_tid_i18n=22614 Titles published before July 2015 can be accessed and downloaded free of charge from
bull httpeceuropaeueconomy_financepublicationseconomic_briefsindex_enhtm (ECFIN Economic Briefs)
bull httpeceuropaeueconomy_financepublicationscountry_focusindex_enhtm (ECFIN Country Focus)
Alternatively hard copies may be ordered via the ldquoPrint-on-demandrdquo service offered by the EU Bookshop httpbookshopeuropaeu
HOW TO OBTAIN EU PUBLICATIONS Free publications bull one copy
via EU Bookshop (httpbookshopeuropaeu) bull more than one copy or postersmaps
- from the European Unionrsquos representations (httpeceuropaeurepresent_enhtm) - from the delegations in non-EU countries (httpseeaseuropaeuheadquartersheadquarters- homepageareageo_en) - by contacting the Europe Direct service (httpeuropaeueuropedirectindex_enhtm) or calling 00 800 6 7 8 9 10 11 (freephone number from anywhere in the EU) () () The information given is free as are most calls (though some operators phone boxes or hotels may charge you)
Priced publications bull via EU Bookshop (httpbookshopeuropaeu)
ISBN 978-92-79-64850-2
KC-BE-17-028-EN-N
- NEW_EB_index_enpdf
-
- EUROPEAN ECONOMY ECONOMIC BRIEFS
-
- Blank Page
-

European Economy Economic Briefs Issue 028 | July 2017
5
(including social security contributions) until they earn approximately 35 of the average wage
This demonstrates the relative narrowness of the tax base in Ireland and broadly applies even when an alternative threshold average tax rate of 25 is used Moreover this indicator would be even higher in Ireland were it not for the existence of the USC Similarly the Irish authorities report that while 36 of earners are currently exempt from income tax only 29 are exempt from the USC14 It follows that eliminating the USC would raise the tax entry threshold and further narrow the tax base
Overall and as it stands the Irish personal income tax system including the USC delivers lower than average revenue is relatively progressive but narrow and at the cost of relatively high marginal rates
The Tax Trilemma
In pursuing their objectives of reducing the tax burden and disincentives to work while keeping a sufficient stream of revenue the Irish government is confronted with a policy trilemma For any tax the amount of revenue generated is a function of the base to which it is applied and the rate(s) Policy makers in all countries face a trade-off along these three dimensions as illustrated in Graph 4 Compared to the OECD average Ireland generates relatively little income tax revenue as a share of GDP applying high marginal rates to a relatively narrow base
Graph 4 The tax trilemma
Note Data are expressed as an index where the average of the available observations equals 100 The tax threshold refers to the percentage of the average wage at which the tax rate exceeds 25 The index for the tax entry threshold on the vertical is the inverse such that lower values suggest a narrower tax base The mean marginal tax rate is the mean of the marginal tax rate applied to income between 50 and 250 of the average wage Income tax revenue as a percentage of GDP is calculated using taxes on income and wealth (ESA 10 D5) and compulsory non-pension contributions (ESA 10 D613CE) Average of OECD countries for which data was available Source OECD Eurostat
Graph 5 The tax trilemma in OECD countries
Note The tax entry threshold refers to the percentage of average wage at which tax rate exceeds 25 The mean marginal tax rate is the mean of the marginal tax rate applied to income between 50 and 250 of the average wage Income tax revenue as a of GDP is calculated using taxes on income and wealth (Eurostat D5) and compulsory non-pension contributions (D613CE) Source European Commission
Moreover Graph 5 Panel A shows that among OECD countries there is a tendency to combine high marginal rates with broader tax base (ie lower tax
70
11485
50
75
100
125
Tax Base Threshold
MarginalRates
Revenueto GDP
Ireland Average (OECD)
ATBE
CZ
DK
FIFR
DE
EL
HU
IE
ITLUNL
PL
PT
SK
SI
ES
SE
UK
0
20
40
60
80
100
120
140
160
180
0 10 20 30 40
Tax
base
th
resh
old
Income tax revenue as a of GDP
B
AT
BE
CZ
DK
EE
FI
FR
DE
EL
HU
IE
IT
LU
NL
PL
PT
SI
ES
SE
UK
00
100
200
300
400
500
600
700
0 10 20 30 40
Mea
n M
argi
nal R
ate
Income tax revenue as a of GDP
C
AT BE
CZ
DK
FIFR
DE
EL
HU
IS
IE
IT
JP
LUNLNO
PL
PT
SI
ES
SE
TR
UK
US
0
20
40
60
80
100
120
140
160
180
0 10 20 30 40 50 60
Tax
base
thr
esho
ld
Mean Marginal Rate
A
Nar
row
erta
x ba
seN
arro
wer
tax
base
European Economy Economic Briefs Issue 028 | July 2017
6
thresholds) As both of these policies contribute to greater revenue generation this might indicate that governments are optimising tax policies in order to achieve target levels of revenue or more generally fund a given size of government
Panels B and C clearly illustrate the trade-off between the amount of revenue and tax policies Countries that have higher income tax revenue as a percentage of GDP generally attempt to expand the tax base by having a lower threshold at which income is taxed and apply higher marginal rates
Overall each country must find an acceptable combination of these tax policies While Ireland is not an outlier along any dimension when compared to other OECD members it is possible that another mix could represent a better trade-off by delivering similar revenue along with a broader base and lower marginal rates
Changing the status quo is undoubtedly a challenge as it would have substantial economic and distributional consequences Yet the alternatives that have been proposed to date such as raising the existing tax bands or reducing tax credits appear to be costly and fail to replicate a number of valuable features of the USC These proposed alternatives to the USC tend to generate less revenue andor further narrow the tax base while keeping marginal rates for individuals on average or high incomes as they are
Is there room for a broader reform
The governments determination to gradually phase-out the USC deserves a careful analysis of its fiscal and distributional implications The following section aims to explore potential alternative long-run tax reforms within the constraints of the trilemma
Using the EUROMOD microsimulation model we compare the current two-pillar personal income tax system as described in box 1 (the baseline scenario) with alternative scenarios where the USC is fully replaced by a PIT-only tax system (see Annex II for more details and other simulated scenarios)
The first scenario entails the complete abolition of the USC (Table 1 Column 1) while the standard and the second PIT rates are maintained at 20 and 40 respectively This corresponds to the announced medium-term government policy The simulation shows that this scenario would come at very high price for public finances as it would entail a reduction of around 20 in total personal income tax receipts Under this scenario the entry-point to
the tax system for an average taxpayer will increase from EUR 13 000 (in the baseline scenario) to EUR 16 500 Furthermore this would have a regressive impact on the income distribution resulting in a significant increase of the GINI15 coefficient
Table 1 Alternative tax reforms
Source European Commission Joint Research Centre based on the EUROMOD model
In the second scenario (Table 1 Column 2) the standard rate is maintained at 20 while the second tax-band rate is increased from 40 to 45 According to the simulation this would only recover around a third of the lost revenues compared to the baseline scenario The majority of the benefit from the reform would still accrue to the highest income deciles
In the third scenario (Table 1 Column 3) in addition to reforms outlined in the second scenario we also reduce the main tax credits (from EUR 1 650 to EUR 1 350) in order to compensate for the narrowing of the tax-base that would result from the abolition of the USC In so doing the entry-point to the tax system would fall to EUR 13 500 instead of EUR 16 500 in the second scenario Under this scenario almost 70 of the lost revenues would be recouped However a single earner at the average wage would still face the highest marginal tax rate among OECD countries (49 )
Building on the previous scenarios in the fourth scenario we also introduce a third intermediate tax band at a rate of 35 targeting incomes between EUR 29 800 and EUR 37 800 (Table 1 Column 4)16 The PIT income tax system would therefore be based on three income tax-bands and rates (20 35 and 45 respectively) This scenario would recover 80 of the revenues forgone as a result of the abolition of the USC Moreover the marginal tax rate for the average single employee would drop to
(1) (2) (3) (4)
baseline No USCNo USC + PIT
rates 20-45
No USC + PIT rates 20-45 + tax
credits 1650=gt1350
No USC + PIT rates 20-35-45 + tax credits
1650=gt1350
revenue losses compared to the baseline
- 100 66 30 20
marginal tax rate (single 100 AW)
495 44 49 49 39
tax entry threshold 124 148 138 131 128
change in the GINI
coefficient0 42 21 17 14
scenarios
The tax entry threshold refers to the percentage of the average w age at w hich the effective tax rate exceeds 25
European Economy Economic Briefs Issue 028 | July 2017
7
the EU average thanks to the smoothing of the overall tax profile Compared to scenario 3 such a reform would further reduce the effect of the abolition of the USC on income distribution as the GINI coefficient would stay slightly closer to current values
The distributional effects of the simulated reforms are shown in Graph 6 which displays the change in the mean equivalised disposable income17 for each decile compared to the baseline scenario The chart illustrates the regressive distributional impact of the government plan to gradually eliminate the USC (scenario 1) In contrast scenarios 3 and 4 could mitigate the regressive impact of the full removal of the USC on the income distribution
Graph 6 Change to the mean equivalised disposable income of households
Note The deciles are fixed to the baseline regime Source European Commission Joint Research Centre based on the EUROMOD model
Nevertheless according to the simulation in scenarios 3 and 4 the upper deciles would still benefit most while the first two deciles of households would be slightly worse-off compared to the baseline18 However the gains in disposable income of the richer decile are now much lower compared with all the other reforms including the governments plan (see also Annex II) A tapered withdrawal of tax credits for income above EUR 70 000 would help to further reduce the impact on income distribution and to improve the burden-sharing19 It would increase the share of tax paid by higher deciles and return the GINI coefficient to the level of the baseline
Conclusion
Overall the analysis indicates the difficulty of designing a reform of the existing Irish income tax system that simultaneously reduces high marginal rates and is revenue neutral without being regressive There is an ineluctable trade-off between these three objectives if policymakers restrict themselves to taxing income even though a parametric reform of the income tax system with less negative distributional effects does appear feasible
The analysis showed that it would only be possible to recover a substantial part of revenue losses by lowering the entry-point to the tax system via a reduction of the tax credits At the same time the introduction of a third intermediate tax band would help to reduce the marginal tax rates in such constrained set of policy choices They could also be elements of a more ambitious and comprehensive structural tax reform
Overall the solution to the tax trilemma might lie in looking beyond changes to the income tax system including to other direct and indirect tax heads
European Economy Economic Briefs Issue 028 | July 2017
8
References (Century Gothic 12 bold)
Brady G (2016) Rethinking the tax debate ndash the key issues for the election IBEC policy brief Issue 0316
European Commission (2015) Tax reforms in EU Member States 2015 Institutional paper 82015
Goldrick-Kelly (2016) How Does Irelandrsquos Income Tax Compare NERI Research inBrief No 37
Irish Tax Institute (2016) Perspectives on Irelands personal income tax system ndash a medium to long term approach Dublin
OrsquoConnor B (2013) ldquoThe Structure of Irelandrsquos Tax System and Options for Growth Enhancing Reformrdquo The Economic and Social Review Vol 44 pp 511-540
OrsquoConnor B et al (2016) ldquoSearching for the inclusive growth tax grail The distributional impact of growth enhancing tax reform in Irelandrdquo The Economic and Social Review Vol 47 pp 155-184
OECD (2016) Taxing Wages 2016 OECD Publishing Paris
Paturot D K Mellbye and B Brys (2013) ldquoAverage Personal Income Tax Rate and Tax Wedge Progression in OECD Countriesrdquo OECD Taxation Working Papers No 15 OECD Publishing Paris
Tax Strategy Group (2016) Income Tax and Universal Social Charge Incorporating an ex-ante equality impact assessment of possible changes to the income tax system Department of Finance Dublin
European Economy Economic Briefs Issue 028 | July 2017
9
Annex I Average and marginal effective tax rates international comparisons The OECD Taxing Wages 2016 report provides an interesting point of departure to analyse the full impact of taxes and benefits on an employees take-home pay and provides a comparative illustration of the average and marginal tax rate across OECD economies including the 21 EU Members State who are members of the OECD (EU21-OECD) The Report shows among other indicators the amounts of taxes social security contributions payroll taxes and cash benefits for eight family-types which differ by income level and household composition It also presents the resulting average and marginal tax rates
The effective average tax rate
In Ireland a single full-time employee at the average wagexx pays nearly 20 of hisher gross wage in personal income taxes and social security contributions net of cash benefits This is the second lowest rate after Estonia among the EU21-OECD countries and well below both the OECD and EU21-OECD averagexxi (Graph a)
The effective average tax rate rises sharply with the increase in income particularly in the case of childless single earners pointing to a highly progressive tax system At 167 of average wage the 322 effective average tax rate borne by a single employee in Ireland is above the OECD average (31 ) but still lower than the EU21-OECD average (346 ) However the effective average tax rate in Ireland remains below the OECD and the EU21-OECD average across the other different family types (Graph b) Compared to the OECD and the EU21-OECD average the Irish tax system appears to be particularly generous with married couples or civil partners with or without children thanks to the effect of the marital status relief child benefits home carers allowance and the family income supplement Graph a Income tax plus employee contributions less cash benefits (single 100 AW) 2015
Graph b Effective average tax rates by family-types and wage levels 2015
Source OECD
The effective marginal tax rate
The effective marginal tax rate shows the incremental change to personal income tax and employee social security contributions less cash benefits when gross wage earnings rise marginally The OECDs report indicates that a childless single earner on the average wage in Ireland faces among the highest marginal tax rates in the EU (the third highest before Germany and Belgium) and above the OECD average (Graph c) Looking at different family compositions and earnings the marginal rate of income tax (plus employee contributions less cash benefits) remains well above the OECD and the EU21-OECD average for single employees The higher marginal rate for single employees with children is explained by the reduction of the family income supplement (means tested) when earnings increase (the equation does not take into account however the one parent family payment) For couples or civil partnerships the marginal tax rate on average wage is not particularly high However marginal tax rates pick up again when earnings rise above the average wage
European Economy Economic Briefs Issue 028 | July 2017
10
Graph c marginal income tax rate plus employee contributions less cash benefits (single 100 AW) 2015
Graph d marginal income tax rates by family-types and wage levels 2015
Source OECD
The degree of tax progressivity
An important consideration in the design of an income tax is the level of progressivity that is the rate at which the income tax burden increases with income The degree of progressivity of the personal income tax system can be generally assessed by comparing the burden faced by single persons earning 67 or 100 of the average wage with that faced by their counterparts earning 167 of the average wage Estimates from the OECDs report indicate that Ireland has the most progressive income tax system in the EU and well above the OECD average at least for single earners In particular the difference in the effective average tax rate is remarkable when comparing individuals at the average wage with those earning 167 of the average level (Graph e) The tax system remains comparatively higher also for couples with two children when their income is jointly assessed Comparing the effective tax rate faced by a family with the first earner at the gross average wage and the second increasing herhis earning from 33 to 100 of the average gross wage Ireland is the fourth highest among EU and still above OECD average (Graph f) Graph e average tax rate moving from 67 to 167 of the average gross wage (single no children) 2015
Graph f average tax rate moving from 133 to 200 of the average gross wage (couple 2 children) 2015
Source OECD European Commission
European Economy Economic Briefs Issue 028 | July 2017
11
Annex II The simulated impact of the policy reforms and EUROMOD modelling approach EUROMOD is a microsimulation model that replicates the tax and benefit systems of all EU Member States allowing the quantification of the most relevant income taxes social contributions and benefits and their effects on household disposable income More specifically EUROMOD applies a set of policy rules to representative micro-data of households and individuals and it calculates income taxes social contributions family and housing benefits social assistance and other income-related benefits on the basis of individual and household characteristicsxxii It delivers the results of the tax-benefit calculations as well as disposable income at the individual and household level Furthermore EUROMOD encodes the policies and the corresponding parameters of the tax-benefit systems currently in force and also those of recent years Importantly EUROMOD captures the interaction of the tax-benefit systems in the sense that changes in one policy may affect eligibility for others This is especially relevant for the analysis of the fiscal and equity impact of tax reforms However EUROMOD only delivers the first-round effects of the simulations and does not take into account the behavioural response of individuals to a given policy change Long-term policy effects are also not addressed with this mode
The simulation of ad hoc tax reforms for Ireland has required substantial adaptations to the EUROMOD microsimulation model First of all the 2015 tax system (last available tax system in our present version of EUROMOD) has been updated to the changes introduced in the 2016 Budgetxxiii The creation of a third income tax band in the standard personal income tax system has required the creation of a new tax schedule in the baseline system in order to consider three different tax units In particular the EUR 9 000 of allowable income transfer within a couple has been maintainedxxiv
Thresholds of the third middle-income tax band
Personal income tax
Taxpayer First tax band Second tax band
Single EUR 29 800 EUR 37 800
Single parent EUR 33 800 EUR 41 800
Married ndash one earner EUR 38 800 EUR 46 800
Married ndash two earners EUR 59 600 EUR 75 600
Several types of tax reforms have been simulated The first entailed changes in the two-rate standard PIT system including a reduction of the basic personal the employee and the Single Person Child Carer tax credits More specifically the simulations performed on the two-rate PIT system were
1) Elimination of the USC (scenario n 1 in the main text) 2) Elimination of the USC combined with an increase in the standard PIT rate to 25 3) Elimination of the USC combined with an increase in the high PIT rate to 45 (scenario n 2 in the
main text) 4) Elimination of the USC combined with a decrease in the tax above mentioned credits to EUR 1 350 5) Elimination of the USC combined with an increase in the high PIT rate to 45 and a decrease in
the above mentioned tax credits to EUR 1 350 (scenario n 3 in the main text)
We then considered the introduction of an intermediate income tax-band In the reformed three-rate PIT system we have simulated the following combinations
6) Elimination of the USC combined with a three-rate PIT system 20 -30 -40 7) Elimination of the USC combined with a three-rate PIT system 20 -30 -40 and a decrease in
the above mentioned tax credits to EUR 1 350 8) Elimination of the USC combined with a three-rate PIT system 20 -30 -45 9) Elimination of the USC combined with a three-rate PIT system 20 -30 -45 and a decrease in
the above mentioned tax credits to EUR 1 350
European Economy Economic Briefs Issue 028 | July 2017
12
10) Elimination of the USC combined with a three-rate PIT system 20 -35 -45 11) Elimination of the USC combined with a three-rate PIT system 20 -35 -45 and a decrease in
the above mentioned tax credits to EUR 1 350 (scenario n 4 in the main text) 12) In addition scenarios with an a provide for a tapered withdrawal of tax credits for income above
EUR 70 000 Tables below summarise the main results
Table IIa Relative fiscal impact of the simulated reform
Note all values are percentage Source European Commission Joint Research Centre based on the EUROMOD model
Table IIb change in the mean equivalised disposable income
Source European Commission Joint Research Centre based on the EUROMOD model
1 EUROMOD is a microsimulation model that replicates the tax and benefit systems of all EU Member States allowing the quantification of the most relevant income taxes social contributions and benefits and their effects on household disposable income EUROMOD is developed by the Institute for Social and Economic Research at the University of Essex in collaboration with national experts It is financed by the EU Programme for Employment and Social Innovation run by the European Commission (DG Employment) Since March 2013 it has been used as the main modelling tool of the Fiscal Policy Analysis Unit of the Joint Research Centre of the European Commission More information is provided in Annex II
[1][0] [2][0] [3][0] [4][0] [4a][0] [5][0] [5a][0] [6][0] [7][0] [7a][0] [8][0] [9][0] [9a][0] [10][0] [11][0] [11a][0]
No USC
No USC and standard
rate 20=gt25
No USC and high rate
40=gt45
No USC and tax credits
1650=gt1350
No USC tax credits
1650=gt1350 phasing out
of the employee tax credit
(from EUR 70000)
No USC and high rate
40=gt45 and tax credits
1650=gt1350
No USC and high rate
40=gt45 tax credits
1650=gt1350 and phasing
out of employee tax credit
(from EUR 70000)
No USC and three
PIT brackets
20-30-40
No USC and three PIT brackets
20-30-40 and tax
credits 1650=gt1350
No USC and three PIT brackets
20-30-40 tax
credits 1650=gt1350
and tax phasing out
of employee tax credit
(from EUR 70000)
No USC and three
PIT brackets
20-30-45
No USC and three PIT brackets
20-30-45 and tax
credits 1650=gt1350
No USC and three PIT brackets
20-30-45 tax
credits 1650=gt1350 and phasing
out of employee tax credit
(from EUR 70000)
No USC and three PIT brackets
20-35-45
No USC and three PIT brackets
20-35-45 and tax
credits 1650=gt1350
No USC and three PIT brackets
20-35-45 tax
credits 1650=gt1350 and phasing
out of employee tax credit
(from EUR 70000)
PIT 10000 12071 10756 10820 10885 11576 11642 10046 10866 10931 10679 11499 11565 10949 11768 11834 Universal social charge 000 000 000 000 000 000 000 000 000 000 000 000 000 000 000 000Total taxes 8315 9865 8881 8929 8978 9495 9544 8349 8963 9012 8823 9437 9486 9025 9638 9688 SIC employee 10000 10000 10000 10000 10000 10000 10000 10000 10000 10000 10000 10000 10000 10000 10000 10000 SIC employer 10000 10000 10000 10000 10000 10000 10000 10000 10000 10000 10000 10000 10000 10000 10000 10000 SIC self-employed 10000 10000 10000 10000 10000 10000 10000 10000 10000 10000 10000 10000 10000 10000 10000 10000 Total SIC 10000 10000 10000 10000 10000 10000 10000 10000 10000 10000 10000 10000 10000 10000 10000 10000 Pensions 10000 10000 10000 10000 10000 10000 10000 10000 10000 10000 10000 10000 10000 10000 10000 10000 Means tested benefits 9980 9992 9980 9986 9986 9986 9986 9980 9986 9986 9980 9986 9986 9980 9986 9986 Non-means tested benefits 10000 9998 10000 9998 9998 9998 9998 10000 9998 9998 10000 9998 9998 10000 9998 9998 Total benefits 9992 9996 9992 9993 9993 9993 9993 9992 9993 9993 9992 9993 9993 9992 9993 9993 Net budgetary effect 5005 9614 6695 6831 6977 8520 8666 5108 6933 7080 6524 8348 8494 7125 8948 9095 Mean equiv disp income 10356 10021 10235 10225 10215 10104 10094 10348 10217 10207 10247 10116 10106 10203 10072 10062 Gini coefficient 10423 10252 10214 10384 10351 10172 10140 10418 10379 10347 10236 10194 10191 10181 10138 10106
[1][0] [2][0] [3][0] [4][0] [4a][0] [5][0] [5a][0] [6][0] [7][0] [7a][0] [8][0] [9][0] [9a][0] [10][0] [11][0] [11a][0]
Deciles No USC
No USC and standard
rate 20=gt25
No USC and high rate
40=gt45
No USC and tax credits
1650=gt1350
No USC tax credits
1650=gt1350 phasing out
of the employee tax credit
(from EUR 70000)
No USC and high rate
40=gt45 and tax credits
1650=gt1350
No USC and high rate
40=gt45 tax credits
1650=gt1350 and phasing
out of employee tax credit
(from EUR 70000)
No USC and three PIT brackets
20-30-40
No USC and three PIT brackets
20-30-40 and tax
credits 1650=gt1350
No USC and three PIT brackets
20-30-40 tax
credits 1650=gt1350
and tax phasing out
of employee tax credit
(from EUR 70000)
No USC and three PIT brackets
20-30-45
No USC and three PIT brackets
20-30-45 and tax
credits 1650=gt1350
No USC and three PIT brackets
20-30-45 tax
credits 1650=gt1350 and phasing
out of employee tax credit
(from EUR 70000)
No USC and three PIT brackets
20-35-45
No USC and three PIT brackets
20-35-45 and tax
credits 1650=gt1350
No USC and three PIT
brackets 20-35-45 tax
credits 1650=gt1350 and phasing
out of employee tax
credit (from EUR 70000)
1 020 -075 020 -032 -030 -032 -030 019 -032 -030 019 -032 -030 019 -033 -031
2 020 -052 015 -023 -020 -023 -020 015 -023 -020 015 -023 -020 015 -023 -020
3 047 -056 041 -010 -007 -011 -009 042 -010 001 041 -011 -009 040 000 -010
4 099 -102 095 -005 003 -009 -001 097 -006 027 095 -009 000 092 000 -004
5 156 -132 146 016 026 007 018 150 011 058 144 005 015 136 000 007
6 230 -103 200 076 080 047 050 224 071 126 203 050 053 183 029 033
7 290 -108 240 123 126 075 077 277 111 169 242 077 079 208 043 045
8 363 -066 284 204 200 127 122 343 186 232 288 131 127 234 077 073
9 450 -018 308 284 276 144 136 435 270 321 330 165 158 251 088 080
10 726 343 371 598 553 242 197 721 593 602 406 278 233 324 195 150
All 356 021 235 225 215 104 094 348 217 251 247 116 106 203 072 062
Note Mean values are calculated for all householdsNote 2 All values are percentages
European Economy Economic Briefs Issue 028 | July 2017
13
2 It is acknowledged that an alternative solution to the tax trilemma might lie in looking beyond changes to the labour tax system for instance in property or environmental taxation 3 In the years up to the crisis policy measures with regard to income tax were mostly aimed at increasing tax credits and income-tax-bands to the point where around 40 of income earners were exempted from income tax and only 20 of earners were liable to the higher rate of income tax The sudden falls in incomes and employment at the onset of the crisis meant that the income tax base narrowed drastically According to the Department of Finance over 45 of income earners were exempt from income tax in 2010 and just over 13 were liable to higher rate of income tax 4 Parliamentary question n 842016 addressed to the Minister for Finance (Deputy Michael Noonan) by Deputy Pearse Doherty 5 The entry-threshold of the USC has been raised during the years from EUR 4 004 in 2011 when initially introduced to EUR 13 000 in 2016 6 See new government programme at httpwwwmerrionstreetieMerrionStreetenImageLibraryProgramme_for_Partnership_Governmentpdf 7 2016 Budget in particular focused on changes to the Universal Social Charge (USC) The USC rates were cut in each of the three lowest bands from 15 to 1 from 35 to 3 and from 7 to 55 The Budget also increased the entry threshold of the USC from EUR12 012 to EUR13 000 removing approximately 42 500 earners from the scope of the charge while the middle threshold was also increased by over EUR1000 to EUR18 668 8 Indeed the Irish labour force is characterised by an unusual degree of international mobility and it has the third largest international workforce in the EU as 15 of the labour force are immigrants The Irish Central Statistical Office has recently estimated that nearly 32 000 international citizens moved to Ireland in the 12 months to April of 2016 9 The analysis focuses on the tax burden which combines income tax plus employees social security contributions (SSC) in order to emphasise the attractiveness of Ireland for workers in the context of its high international labour mobility Taking into account employees SSC also facilitates international comparison as Ireland has low SSC contributions compared to the EU average 10 OECD (2016) The Report shows the amounts of taxes social security contributions payroll taxes and cash benefits for eight family-types which differ by income level and household composition It also presents the resulting average and marginal tax rates 11 The sum of personal income taxes and employee social security contributions net of cash benefits as a percentage of gross wages 12 This indicator shows the incremental change to personal income tax and employee social security contributions less cash benefits when gross wage earnings rise marginally 13 See for example OrsquoConnor et al (2016) 14 For a single employee entry into PIT tax occurs at approximately EUR 16 500 and entry into social contributions (PRSI) occurs at EUR 18 304 15 While Ireland has relatively high income inequality before tax and transfers the Gini coefficient after taxes and transfers is below the EU average demonstrating the highly progressive nature of tax and welfare systems 16 Thresholds for couples and single parents have been changed accordingly 17 According to Eurostat the equivalised disposable income is the total income of a household after tax and other deductions that is available for spending or saving divided by the number of household members converted into equivalised adults household members are equalised or made equivalent by weighting each according to their age using the so-called modified OECD equivalence scale (httpeceuropaeueurostatstatistics-explainedindexphpGlossaryEquivalised_disposable_income) 18 Although some of the losses in disposable income for lower deciles are due to the sizeable reduction of tax credits it primarily reflects the difficulties of reforming the existing income tax system in an equitable manner 19 Other ways to simplify the income tax system could be to terminate incentives to stay at home andor move to a fully individualised tax system Under the latter the tax band for single earners would be the same as the married one-earner band and each spouse in a married couple would have the same non-transferable standard rate band Both measures could also expand the tax base by encouraging more people to seek employment However such reforms could be difficult to implement as they could provoke resistance xx The average production worker in Ireland earned EUR 34 847 in 2015 according to the OECDs estimates xxi Income tax liabilities account also for the basic tax credit relief (EUR 1 650) and the employee credit (EUR 1 650) xxii The micro-data used in the EUROMOD simulations come from the EU Statistics on Income and Living Conditions survey (EU-SILC) in its cross-section version and consist mainly of data on personal and household characteristics several types of income (eg market income pensions or social transfers) certain expenditures (eg housing costs or life insurance payments) and other variables related to living conditions Most of the taxes contributions and benefits are simulated based on these variables xxiii It involved updating the 2015 tax rates of the USC schedule to the ones applied in 2016 increasing the Home Carer tax credit from 810 to 1 000 Euros raising also the home carers income threshold from EUR 5 080 to EUR 7 200 introducing a PRSI relief for employees of a maximum of EUR 12 per week commencing at income of EUR 35201 Euros weekly tapering out at a rate of one-sixth of income in excess of this threshold (ie relief ends as income reaches EUR 424 per week) increasing the weekly threshold of the employers PRSI from EUR 35601 to EUR 37601 and updating the rate applied to the first bracket of this contributions schedule from 425 to 85 xxiv The minimum income earned by each spouse to be in the first band would be EUR 20800 (EUR 29800 ndash EUR 9000) and to be in the second band would be EUR 28 800 (EUR 37 800 ndash EUR 9 000) This would be equivalent to the married one earner first and second thresholds computed as the sum of the single thresholds plus the EUR 9 000 allowable transfer
EUROPEAN ECONOMY ECONOMIC BRIEFS
European Economy Economic Briefs can be accessed and downloaded free of charge from the following address httpseceuropaeuinfopublicationseconomic-and-financial-affairs-publications_enfield_eurovoc_taxonomy_target_id_selective=Allampfield_core_nal_countries_tid_selective=Allampfield_core_date_published_value[value][year]=Allampfield_core_tags_tid_i18n=22614 Titles published before July 2015 can be accessed and downloaded free of charge from
bull httpeceuropaeueconomy_financepublicationseconomic_briefsindex_enhtm (ECFIN Economic Briefs)
bull httpeceuropaeueconomy_financepublicationscountry_focusindex_enhtm (ECFIN Country Focus)
Alternatively hard copies may be ordered via the ldquoPrint-on-demandrdquo service offered by the EU Bookshop httpbookshopeuropaeu
HOW TO OBTAIN EU PUBLICATIONS Free publications bull one copy
via EU Bookshop (httpbookshopeuropaeu) bull more than one copy or postersmaps
- from the European Unionrsquos representations (httpeceuropaeurepresent_enhtm) - from the delegations in non-EU countries (httpseeaseuropaeuheadquartersheadquarters- homepageareageo_en) - by contacting the Europe Direct service (httpeuropaeueuropedirectindex_enhtm) or calling 00 800 6 7 8 9 10 11 (freephone number from anywhere in the EU) () () The information given is free as are most calls (though some operators phone boxes or hotels may charge you)
Priced publications bull via EU Bookshop (httpbookshopeuropaeu)
ISBN 978-92-79-64850-2
KC-BE-17-028-EN-N
- NEW_EB_index_enpdf
-
- EUROPEAN ECONOMY ECONOMIC BRIEFS
-
- Blank Page
-
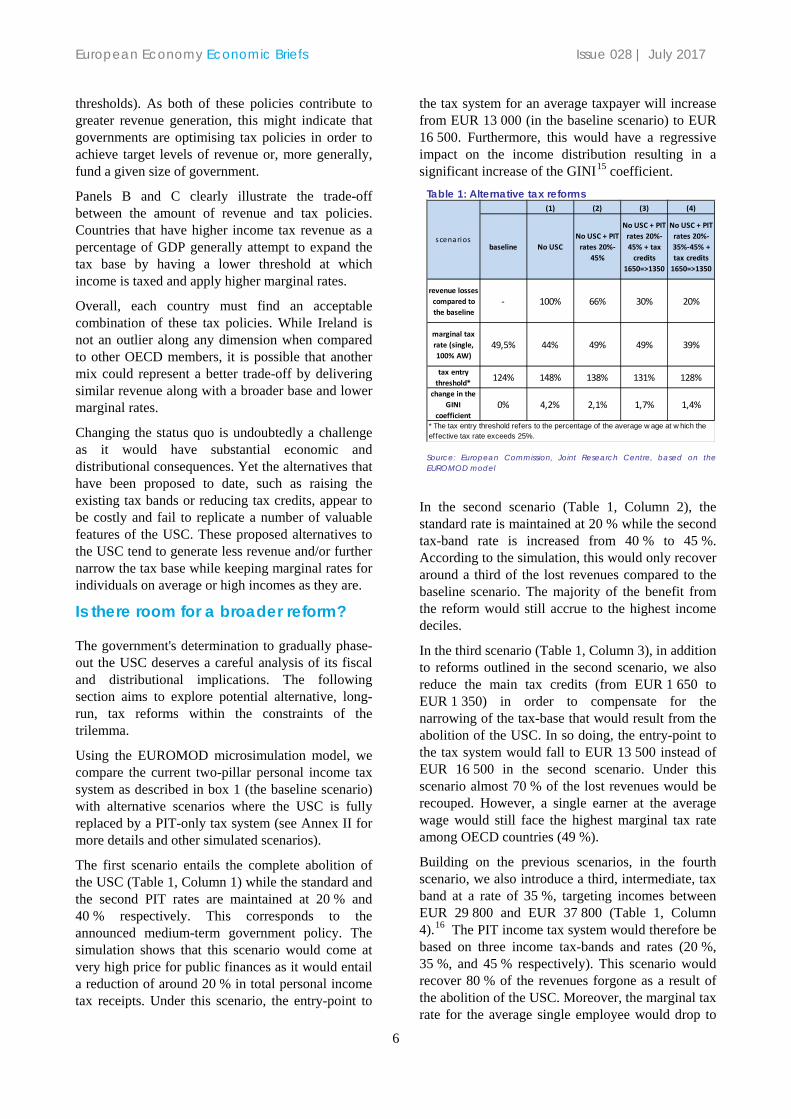
European Economy Economic Briefs Issue 028 | July 2017
13
2 It is acknowledged that an alternative solution to the tax trilemma might lie in looking beyond changes to the labour tax system for instance in property or environmental taxation 3 In the years up to the crisis policy measures with regard to income tax were mostly aimed at increasing tax credits and income-tax-bands to the point where around 40 of income earners were exempted from income tax and only 20 of earners were liable to the higher rate of income tax The sudden falls in incomes and employment at the onset of the crisis meant that the income tax base narrowed drastically According to the Department of Finance over 45 of income earners were exempt from income tax in 2010 and just over 13 were liable to higher rate of income tax 4 Parliamentary question n 842016 addressed to the Minister for Finance (Deputy Michael Noonan) by Deputy Pearse Doherty 5 The entry-threshold of the USC has been raised during the years from EUR 4 004 in 2011 when initially introduced to EUR 13 000 in 2016 6 See new government programme at httpwwwmerrionstreetieMerrionStreetenImageLibraryProgramme_for_Partnership_Governmentpdf 7 2016 Budget in particular focused on changes to the Universal Social Charge (USC) The USC rates were cut in each of the three lowest bands from 15 to 1 from 35 to 3 and from 7 to 55 The Budget also increased the entry threshold of the USC from EUR12 012 to EUR13 000 removing approximately 42 500 earners from the scope of the charge while the middle threshold was also increased by over EUR1000 to EUR18 668 8 Indeed the Irish labour force is characterised by an unusual degree of international mobility and it has the third largest international workforce in the EU as 15 of the labour force are immigrants The Irish Central Statistical Office has recently estimated that nearly 32 000 international citizens moved to Ireland in the 12 months to April of 2016 9 The analysis focuses on the tax burden which combines income tax plus employees social security contributions (SSC) in order to emphasise the attractiveness of Ireland for workers in the context of its high international labour mobility Taking into account employees SSC also facilitates international comparison as Ireland has low SSC contributions compared to the EU average 10 OECD (2016) The Report shows the amounts of taxes social security contributions payroll taxes and cash benefits for eight family-types which differ by income level and household composition It also presents the resulting average and marginal tax rates 11 The sum of personal income taxes and employee social security contributions net of cash benefits as a percentage of gross wages 12 This indicator shows the incremental change to personal income tax and employee social security contributions less cash benefits when gross wage earnings rise marginally 13 See for example OrsquoConnor et al (2016) 14 For a single employee entry into PIT tax occurs at approximately EUR 16 500 and entry into social contributions (PRSI) occurs at EUR 18 304 15 While Ireland has relatively high income inequality before tax and transfers the Gini coefficient after taxes and transfers is below the EU average demonstrating the highly progressive nature of tax and welfare systems 16 Thresholds for couples and single parents have been changed accordingly 17 According to Eurostat the equivalised disposable income is the total income of a household after tax and other deductions that is available for spending or saving divided by the number of household members converted into equivalised adults household members are equalised or made equivalent by weighting each according to their age using the so-called modified OECD equivalence scale (httpeceuropaeueurostatstatistics-explainedindexphpGlossaryEquivalised_disposable_income) 18 Although some of the losses in disposable income for lower deciles are due to the sizeable reduction of tax credits it primarily reflects the difficulties of reforming the existing income tax system in an equitable manner 19 Other ways to simplify the income tax system could be to terminate incentives to stay at home andor move to a fully individualised tax system Under the latter the tax band for single earners would be the same as the married one-earner band and each spouse in a married couple would have the same non-transferable standard rate band Both measures could also expand the tax base by encouraging more people to seek employment However such reforms could be difficult to implement as they could provoke resistance xx The average production worker in Ireland earned EUR 34 847 in 2015 according to the OECDs estimates xxi Income tax liabilities account also for the basic tax credit relief (EUR 1 650) and the employee credit (EUR 1 650) xxii The micro-data used in the EUROMOD simulations come from the EU Statistics on Income and Living Conditions survey (EU-SILC) in its cross-section version and consist mainly of data on personal and household characteristics several types of income (eg market income pensions or social transfers) certain expenditures (eg housing costs or life insurance payments) and other variables related to living conditions Most of the taxes contributions and benefits are simulated based on these variables xxiii It involved updating the 2015 tax rates of the USC schedule to the ones applied in 2016 increasing the Home Carer tax credit from 810 to 1 000 Euros raising also the home carers income threshold from EUR 5 080 to EUR 7 200 introducing a PRSI relief for employees of a maximum of EUR 12 per week commencing at income of EUR 35201 Euros weekly tapering out at a rate of one-sixth of income in excess of this threshold (ie relief ends as income reaches EUR 424 per week) increasing the weekly threshold of the employers PRSI from EUR 35601 to EUR 37601 and updating the rate applied to the first bracket of this contributions schedule from 425 to 85 xxiv The minimum income earned by each spouse to be in the first band would be EUR 20800 (EUR 29800 ndash EUR 9000) and to be in the second band would be EUR 28 800 (EUR 37 800 ndash EUR 9 000) This would be equivalent to the married one earner first and second thresholds computed as the sum of the single thresholds plus the EUR 9 000 allowable transfer
EUROPEAN ECONOMY ECONOMIC BRIEFS
European Economy Economic Briefs can be accessed and downloaded free of charge from the following address httpseceuropaeuinfopublicationseconomic-and-financial-affairs-publications_enfield_eurovoc_taxonomy_target_id_selective=Allampfield_core_nal_countries_tid_selective=Allampfield_core_date_published_value[value][year]=Allampfield_core_tags_tid_i18n=22614 Titles published before July 2015 can be accessed and downloaded free of charge from
bull httpeceuropaeueconomy_financepublicationseconomic_briefsindex_enhtm (ECFIN Economic Briefs)
bull httpeceuropaeueconomy_financepublicationscountry_focusindex_enhtm (ECFIN Country Focus)
Alternatively hard copies may be ordered via the ldquoPrint-on-demandrdquo service offered by the EU Bookshop httpbookshopeuropaeu
HOW TO OBTAIN EU PUBLICATIONS Free publications bull one copy
via EU Bookshop (httpbookshopeuropaeu) bull more than one copy or postersmaps
- from the European Unionrsquos representations (httpeceuropaeurepresent_enhtm) - from the delegations in non-EU countries (httpseeaseuropaeuheadquartersheadquarters- homepageareageo_en) - by contacting the Europe Direct service (httpeuropaeueuropedirectindex_enhtm) or calling 00 800 6 7 8 9 10 11 (freephone number from anywhere in the EU) () () The information given is free as are most calls (though some operators phone boxes or hotels may charge you)
Priced publications bull via EU Bookshop (httpbookshopeuropaeu)
ISBN 978-92-79-64850-2
KC-BE-17-028-EN-N
- NEW_EB_index_enpdf
-
- EUROPEAN ECONOMY ECONOMIC BRIEFS
-
- Blank Page
-

ISBN 978-92-79-64850-2
KC-BE-17-028-EN-N
- NEW_EB_index_enpdf
-
- EUROPEAN ECONOMY ECONOMIC BRIEFS
-
- Blank Page
-