personal account investment options and portfolio · pdf fileindividual account investment...
TRANSCRIPT
NBER WORKING PAPER SERIES
INDIVIDUAL ACCOUNT INVESTMENT OPTIONS AND PORTFOLIO CHOICE:BEHAVIORAL LESSONS FROM 401(K) PLANS
Jeffrey R. BrownNellie Liang
Scott Weisbenner
Working Paper 13169http://www.nber.org/papers/w13169
NATIONAL BUREAU OF ECONOMIC RESEARCH1050 Massachusetts Avenue
Cambridge, MA 02138June 2007
This research was supported by the U.S. Social Security Administration through grant #10-P-98363-1to the National Bureau of Economic Research as part of the SSA Retirement Research Consortium.The opinions and conclusions expressed are solely those of the author(s) and do not represent theopinions or policy of SSA, any agency of the Federal Government, or the NBER. We are gratefulto the Social Security Administration for this financial support. We thank Julie Agnew, Matias Eklof,Wei Jiang, Brigitte Madrian, Clemens Sialm, and conference participants at the 2005 Retirement ResearchConsortium, the 2006 American Economic Association meetings, the 2006 Trans-Atlantic Public EconomicsSeminar, and the 2007 Wharton Household Portfolio Choice and Financial Decision-Making conference. Vivek Choudhary, Soonho Lee, and Yoon Sok Lee provided excellent research assistance.
© 2007 by Jeffrey R. Brown, Nellie Liang, and Scott Weisbenner. All rights reserved. Short sectionsof text, not to exceed two paragraphs, may be quoted without explicit permission provided that fullcredit, including © notice, is given to the source.
Individual Account Investment Options and Portfolio Choice: Behavioral Lessons from 401(k)PlansJeffrey R. Brown, Nellie Liang, and Scott WeisbennerNBER Working Paper No. 13169June 2007JEL No. D1,D12,D14,G11,H55,J32
ABSTRACT
This paper examines how the menu of investment options made available to workers in defined contributionplans influences portfolio choice. Using unique panel data of 401(k) plans in the U.S., we presentthree principle findings. First, we show that the share of investment options in a particular asset class(i.e., company stock, equities, fixed income, and balanced funds) has a significant effect on aggregateparticipant portfolio allocations across these asset classes. Second, we document that the vast majorityof the new funds added to 401(k) plans are high-cost actively managed equity funds, as opposed tolower-cost equity index funds. Third, because the average share of assets invested in low-cost equityindex funds declines with an increase in the number of options, average portfolio expenses increaseand average portfolio performance is thus depressed. All of these findings are obtained from a paneldata set, enabling us to control for heterogeneity in the investment preferences of workers across firmsand across time.
Jeffrey R. BrownDepartment of FinanceUniversity of Illinois at Urbana-Champaign340 Wohlers Hall, MC-7061206 South Sixth StreetChampaign, IL 61820-9080and [email protected]
Nellie LiangFederal Reserve Board20th and Constitution Ave NWWashington, DC [email protected]
Scott WeisbennerDepartment of FinanceUniversity of Illinois, Urbana-Champaign304C David Kinley Hall1407 W. Gregory DriveUrbana, IL 61801and [email protected]
1. Introduction Over two dozen countries around the world now include individual investment accounts
as part of their public pension systems. Other countries, notably including the U.S., are also
considering reforms that would allow individuals to directly invest part of their Social Security
contributions in individual accounts. A key issue in designing such a program is determining
what investment choices to offer individual participants. The simplest portfolio theory suggests
that it is sufficient to provide a choice consisting of one portfolio of risky assets – the market
portfolio – and one risk-free asset, and then to allow individuals to mix these two portfolios in
accordance with their individual risk preferences. Most public and private plans in the U.S. and
abroad, however, provide a large number and broad range of choices. For example, in the U.S.,
the vast majority of private sector defined contribution pension plans offer multiple investment
options, often allowing individuals to choose from among several equity, bond, market and
balanced fund options. Individuals also have thousands of mutual funds to choose from when
allocating their non-pension portfolios. In Sweden, the Social Security system provides
participants a menu of investment options that includes over 650 funds from which to choose.
The central question of this paper is whether the mix of investment options available to
participants in an individual accounts program matters for portfolio allocation. In particular, we
are interested in the “behavioral” response to the selection of fund options, over and above any
“mechanical” link by which we mean changes that flow directly from adding or relaxing a
binding constraint. For example, suppose an individual is prohibited from owning a particular
asset class. It is clearly the case that this constraint will alter their portfolio choice if, in the
absence of the constraint, the individual would have invested in this asset class. Instead, our
focus is on the “behavioral” response, which might occur when a change in the menu of
1
investment options leads to a large change in asset allocation, even though the investment
opportunity set has not significantly changed. For example, imagine that an investor, faced with
a choice between a diversified stock fund and a diversified bond fund, chose to allocate 50
percent of her portfolio to each fund. If this individual were provided a second diversified stock
fund as a third investment alternative, then the overall investment opportunity set of this
individual has not substantially changed because the additional stock fund is largely redundant of
the first. In this case, standard portfolio theory suggests that this individual’s optimal allocation
would still be close to 50 percent bonds and 50 percent stocks.
A growing body of evidence suggests, however, that many individual portfolio decisions
may be influenced by plan design. For example, Benartzi and Thaler (2001) suggest that many
people follow a “naïve” diversification strategy, such as evenly dividing contributions across all
available assets (e.g., a “1/n” strategy). If this is the case, then simply changing the relative
number of stock and bond funds may alter the allocation of an investor’s portfolio between
stocks and bonds. If people behave in this way, then firm managers or policymakers who are
charged with determining the set of investment options to make available to participants in a
corporate or government individual accounts program should consider how the choice of fund
options will influence individual portfolio allocations.
The private pension system in the U.S. – in particular, 401(k) plans, which are now the
single most common private pension in the U.S. – provides a useful research laboratory with
which to learn about these issues. Because plan sponsors have significant leeway in choosing
which investment options to make available, there is considerable time series and cross sectional
variation in the set of investment opportunities facing 401(k) participants. Using a rich panel
data set on fund options and fund contributions to 401(k) plans during the 1990s, we examine
2
several issues in this paper related to how the structure of investment options within a plan
affects participant diversification. Unlike past work in this area that focuses on cross-sectional
analyses, we are able to exploit the panel nature of our data to control for differences in the
investment preferences of workers across firms and over time to better identify the effect of a
change in 401(k) plan characteristics on participant behavior.
We focus primarily on how the set of investment alternatives effects portfolio
diversification. While some prior research has suggested that overall portfolio diversification is
affected by the menu of options (Benartzi and Thaler (2001)), Huberman and Jiang (2006)
highlight some of the difficulties in making inferences about individual behavior based on plan
level data. For example, even if there is evidence at the plan level that contributions are divided
roughly evenly across plan options, this could be because individuals are each following a 1/n
strategy because 1/n of the individuals are each concentrating their portfolio in one option, or
other intermediate combinations. Nonetheless, in considering the set of investment options to
make available to individuals through a large national pension system, the effect of the plan
choice set on aggregate portfolio allocations is of substantial interest.
Our data allows us to do a more comprehensive examination of plan level portfolio
responses both within and across multiple asset classes over many years. We find evidence that
the allocation of contributions is significantly affected by the number and mix of investment
options available, even after accounting for plan-level fixed effects. For example, our estimates
suggest that by increasing the share of equity funds from 1/3 to 1/2 (such as by adding an
additional equity fund option to a plan that already offers company stock, one equity fund, and
one bond fund), overall participant allocations to equity funds increase by 7.5 percentage points.
We find similar strong effects for allocations to bond funds and balanced funds. Given that the
3
fraction of equity options in the plan tends to increase substantially and the fraction of bond
options tends to decrease substantially as plans offer more options over time, this leads to 401(k)
participants taking on greater risk in their retirement portfolios with their higher equity
allocations.
We also address how the composition of actively vs. passively managed fund options has
affected allocation decisions within 401(k) plans. From 1990 to 2003, the number of mutual
funds available to investors in the U.S. rose from 3,100 to 8,100, with the dramatic growth in
actively managed equity funds (which quadrupled over the period) accounting for nearly 70% of
the total increase (Investment Company Institute, 2005). Consistent with this, we find the vast
majority of the new funds added to 401(k) plans are also high-cost actively managed equity
funds as opposed to lower-cost equity index funds. For example, actively-managed equity funds
represent nearly 2/3 of the new funds added to 401(k) plans in our sample over the period 1998-
2002, while index funds represent only about 1 out of 12 of the new funds added. This result has
strong implications for the relation between the investment performance of these retirement plans
and the composition and number of fund options provided. For example, we estimate that a
move from a plan with only index funds to a plan with only actively-managed funds is associated
with a 35 basis point increase in the annual plan-wide expense ratio paid by participants (as
participants are investing more in higher-cost funds which are much more likely to be added on
the margin). Given historically that actively-managed funds do not outperform index funds
(even before expenses), these investment patterns (coupled with actively-managed funds being
much more likely to be the marginal fund added to the plan) could result in a nontrivial reduction
in resources available for retirement.
4

While not the main focus of our paper, we also address the importance of firm-level
heterogeneity and investment restrictions upon the investment behavior of 401(k) participants. A
concern with any of the past cross-sectional analyses that have documented a strong relation
between plan parameters and participant decisions is that an omitted factor such as differences in
either the firms or the workers across firms could explain both the design of the 401(k) plan as
well as the workers’ investment decisions (e.g., differences in the risk aversion or investment
philosophy of workers across firms). Ruling out such an alternative explanation is essential for
identifying what role the characteristics of the plan (as opposed to unobserved characteristics of
the participants of the plan) play in influencing investment decisions and is thus essential for
public policy purposes.
We present evidence that both plan parameters and firm-level heterogeneity are important
determinants of how 401(k) assets are allocated across asset classes. For example, the number of
equity and bond options in the 401(k) plan is an important predictor of contributions to equity
and bond funds, respectively, even after accounting for firm-level fixed effects. On the other
hand, while both the relation between the number of options in the plan and allocations to
company stock and the “endorsement” effect found by Benartzi (2001)1 are very strong in the
cross-section, they are substantially diminished once firm-specific effects are accounted for in
the regression. This suggests that investments in company stock in pension plans appear to be
driven in no small part by firm-level heterogeneity in the desirability of company stock
investments (which manifests itself both in employee contributions to company stock, how many
non-company stock options are present in the 401(k) plan, and employer match policy).
1 Benartzi (2001) finds that workers in firms where the employer provides a match in company stock tend to invest substantially more of their own contributions in company stock and attributes this to the workers viewing a firm match in company stock as implicit investment advice.
5

This paper proceeds as follows. Section 2 provides background information on the range
of investment options offered in selected pension systems around the world, as well as in some
U.S. reform proposals. We also review the relevant literature relating to the influence of
investment options on portfolio allocation. In Section 3, we describe our data on 401(k) plans
and provide some initial summary statistics about the range of investment options available. In
Section 4, we provide evidence on how the number and mix of investment options influences the
allocation of contributions in 401(k) plans. Section 5 demonstrates how trends in the mutual
fund industry over the past decade such as the explosion of high-cost, actively-managed equity
funds have affected 401(k) plans and participants. Section 6 concludes with a discussion of
policy implications.
2. Background
2.1 Brief Overview of Range of Investment Options in Public Pension Plans Around the World
Over the past two decades, a large number of countries have incorporated individual
accounts into their public pension systems. These countries span the globe, and include highly
developed economies of Western Europe, transition economies from the former Soviet Union,
and developing countries. A notable exception to this trend is the United States, whose public
Social Security program is entirely a traditional pay-as-you-go, defined benefit system. Even in
the U.S., however, proposals to introduce personal accounts as part of, or in addition to, the
Social Security system have been forwarded by numerous commissions, think tanks, academics,
members of Congress, and even the President.
The plans that have been implemented around the world, as well as those proposed in the
U.S., vary along many dimensions, including account size, the source of funding, and the degree
6
of access to funds before and during retirement, just to name a few. One particularly important
difference is the degree of portfolio choice provided to individuals, particularly during the
account accumulation phase. In general, architects of alternative plans have made different
choices when faced with the trade-offs between allowing individual choice, ensuring some
minimum level of portfolio diversification, and keeping administrative costs low. As a result,
different plans provide very different degrees of choice.
At one end of the spectrum are plans that provide very limited choice. As discussed in a
recent survey by the GAO, “initially, several countries offered individuals choice among a
limited number of investment options and often restricted the portion of assets that could be
invested in certain products, such as publicly traded equities, private equities and foreign
securities” (GAO, 2005). For example, in Australia as of the late 1990s, the employer was
generally given the authority to select the fund for the workers, and thus most workers had
minimal choice in how to invest their retirement savings (CBO 1999). Some U.S. reform
proposals, such as Rep. Shaw’s “Social Security Guarantee Plus Act of 2003,” severely restrict
choice. For example, Shaw’s plan would require individuals to hold all account assets in a single
fund that can be changed at most once per year.2 The default option would be a portfolio
allocation of 60 percent stock index funds and 40 percent high-grade corporate bond index funds.
The only two alternative options simply allow slight deviations in the allocations (65 percent
stock / 35 percent bonds or 70 percent stock / 30 percent bonds). Another plan that starts out
with tight restrictions on choice is the Rep. DeMint’s “Social Security Savings Act of 2003,” in
which account balances would initially be maintained in a default portfolio with 65 percent in a
2 Details on Rep. Shaw’s proposal are taken from the January 7, 2003 memorandum to Rep. Shaw from the Social Security Office of the Chief Actuary “OASDI Financial Effects of the Social Security Guarantee Plus Act of 2003 (H.R. 75) – Information.”
7
specified broad index fund of equities of U.S. corporations and 35 percent in long-term bonds
issued by the Federal government.3
At the other end of the spectrum are plans that provide an extraordinarily wide range of
choice. In Sweden, for example, participants are able to choose from a menu of approximately
650 mutual funds (Palme, et al, 2004). However, participants are restricted to selecting at most
five funds from this extensive menu (GAO 2005). In the U.S. context, the Personal Security
Account option (commonly referred to as the Schieber/Weaver plan) from the 1994-96 Social
Security Advisory Council would have allowed virtually unfettered access to a broad universe of
private sector investments.
In between these two extremes is a wide range of plans. For example, Mexico now has age-
based investment options available. Chile requires each pension administrator to offer four types
of funds with varying degrees of risk, including a higher risk fund and a fixed income fund
(GAO 2005). For younger workers, a fifth option (higher risk) is also available.
How does the degree of investment choice affect portfolio behavior? In some cases, the
answer is obvious. For example, in the U.S. Shaw proposal mentioned above, individuals are
clearly forced into one of three pre-specified combinations of equities and bonds. In most other
cases, however, there are enough choices available that individual decisions about general asset
allocations are not restricted. Even in these cases, however, the potential exists for the menu of
investment options to influence participant decisions about how to invest their individual account
balances. For example, if, as the number of investment options rises, the fraction of investments
3 Once the individual account balance reaches a specified level, two additional investments are available – a broad index of small-cap equities and a broad index of mid-cap equities. Details on Rep. DeMint’s proposal are taken from the September 26, 2003 memorandum to Rep. DeMint from the Social Security Office of the Chief Actuary “Estimated Financial Effects of H.R. 3177, the Social Security Savings Act of 2003 – Information.”
8

that are in actively-managed equity funds also rises, might this influence overall portfolio
allocations?
The objective of this study is to provide empirical evidence on how the menu of investment
options offered in an individual accounts system is likely to influence participant portfolio
choices. We will do this by using data on private-sector 401(k) plans, which like individual
account programs around the world, are defined contribution retirement plans that provide
participants with a specified set of investment options. We can use both the time-series and
cross-sectional variation in the number and type of investment options available to employees to
learn how portfolio allocation is influenced by plan parameters. Exploiting such data can help
address the concern that firm-level differences in worker investing preferences may explain any
cross-sectional correlations found. This is an area that has been receiving increased attention in
the economics literature, which we now briefly review.
2.2 Literature on Investment Options and Portfolio Choice
Within a neoclassical economics framework, the number of investment options available to
an investor should matter only insofar as it alters one’s ability to diversify. For example, if
participants in a defined contribution account were provided with bond investment options only,
and no equity investment options, then their portfolio choices would be constrained in an
obvious way. In reality, however, most 401(k) plans do not restrict investments in such an overt
way. Rather, the typical 401(k) plan offers participants a range of funds that invest in equities
and bonds and allow participants to cover a wide range of the risk/return spectrum. As such, in a
world where all participants behave according to standard finance theory, the constraints
imposed by the firm’s choice of options are unlikely to have a first order effect on an
individual’s portfolio allocation across different asset classes.
9

Nonetheless, more recent “behavioral” research has shown that the composition of
investment options selected by an employer can have a significant influence on participant
portfolio allocation. For example, Benartzi (2001) and Brown, Liang and Weisbenner (2006)
examine the effect of employer 401(k) match policy, and find that when employers restrict
individuals to hold employer stock, employees tend to purchase more employer stock in their
own accounts, rather than less, as would be predicted by standard portfolio models. Also,
Benartzi and Thaler (2001) find evidence consistent with employees following “naïve
diversification strategies,” i.e., allocating e/n of their contributions to equities when there are n
investment choices available, e of which are equity funds, while Karlsson, Massa, and Simonov
(2006) suggest that investors choose assets as a function of the way they are represented in the
menu available to them.
Plan design can influence numerous other behaviors as well. Huberman, Iyengar, and Jiang
(2007) show that the availability of an employer match increases participation and contributions,
especially among low-income employees. Samuelson and Zeckhauser (1988) and Ameriks and
Zeldes (2001) show that investors are slow to rebalance portfolios, which can lead to allocations
of total holdings that look very different than allocations of contributions. Madrian and Shea
(2001), Agnew, Balduzzi, and Sunden (2003), and Choi, Laibson, Madrian, and Metrick (2004a)
document the importance of plan design and employee inertia as they show that many new plan
participants invest in the plan’s default investment option and are slow to move out of that option
for potentially higher-return assets. Agnew and Szykman (2005) also provide evidence that
individuals with below average financial knowledge become “overwhelmed” by making
investment decisions.
10
3. Data
3.1 Data Source
The primary source of data for this project is 401(k) plan level financial data from the
1990s. This rich source of data is compiled by hand from 11-k filings with the SEC, which a
company files when it provides an option to invest in company stock that is deemed an offering
of securities. From these filings, we collect information about the number and type of
investment options offered. We categorize each investment option into one of five categories –
company stock, equity funds (by which we precisely mean domestic equity funds excluding
employer stock), international equity funds, bond funds (which includes money market,
guaranteed investment contacts, government bonds, and corporate bond funds), and balanced
funds. For each investment option, we collect total participant contributions, total employer
contributions, and total assets. For the few firms with multiple plans, we collect data for the
largest plan.
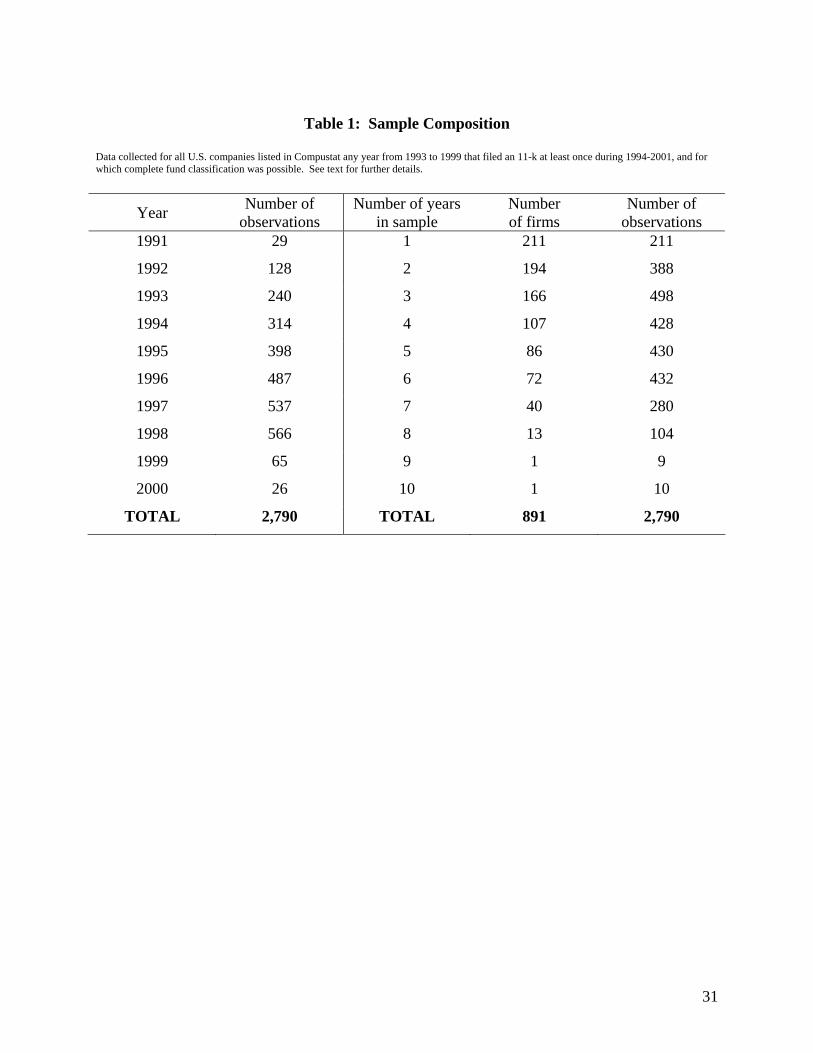
Starting with all U.S. firms listed in Compustat any year from 1993 to 1999, we identify
firms that filed an 11-k at least once during this period.4 We were able to hand-collect data for
891 companies for which we could accurately classify their investment option, yielding 2,790
firm-year observations. As reported in table 1, most of the data are in the period 1993 to 1998,
with the largest number of firms, 566, in 1998. On average, there are just over three
observations per firm, with 45 percent of the firms with two observations or less and 55 percent
of the firms with three or more observations. In 1999, there was a change in ERISA reporting
requirements that led to substantially fewer companies reporting contributions by asset category,
leaving us with contribution data for far fewer plans in 1999 and 2000 than in 1998. The 1999
4 11-k filings are available on the SEC’s Edgar website starting in 1994. The 1994 filing reports plan activity during 1993. Some firms will report not only plan activity during the past year, but also plan activity over the past three years. Thus, we have 128 observations in 1992 and 29 observations in 1991.
11
and later filings, while lacking good contribution data, still provide asset balances. We will
make use of this data (and describe it more fully) to augment our sample when we examine the
active vs. passive mutual fund choice below.
To characterize our initial sample, we focus on firms in the sample in 1998, one of the
more recent years with the largest number of firms. As shown in table 2a, about one-half of the
sample was a member of the S&P 1500 during 1998.5 Thus, the typical firm in our sample is
smaller, measured by both market value and employees, than the typical S&P 1500 firm, but is
larger than the average of all public companies as available from Compustat. The sample
represents a broad cross-section of industries. As noted in the table, 15 percent of the sample is
in the technology sector, somewhat less than the overall market.
Companies that issue shares for their retirement plan, rather than purchase shares on the
open market, are required to file an 11-k. While this raises the possibility that the sample could
be biased toward firms that do not repurchase stock, in separate work (Brown, Liang &
Weisbenner 2006) we document that repurchase activity by firms in our sample does not differ
from that at other publicly-traded firms.6
We also compare our sample of plans to those at publicly-traded firms as reported on
Form 5500 filed with the DOL.7 In the aggregate, for our sample of the largest plans at 566
companies in 1998, total plan assets were $249 billion, representing 36 percent of the $698
billion in plan assets at all publicly-traded companies (table 2b). Total contributions by
participant and company for our sample totaled $13.9 billion, 28 percent of the $49.2 billion for 5 The S&P 1500 consists of the 1500 stocks that comprise the S&P 500 index, the S&P 400 MidCap index, and the S&P 600 SmallCap index. 6 In the uncommon event that the plan does not allow employees to purchase company stock but does provide the employer match in company stock, it would generally not be deemed an offer of securities, and the plan would not be required to file an 11-k. In our discussion with SEC staff, the onus is on the company to determine whether it needs to file an 11-k. 7 Publicly-traded companies in the DOL Form 5500 data set were identified by whether they had a CUSIP and matching EINs with those in Compustat.
12
publicly-traded firms. Estimates from the DOL for 1998 for all US companies, public and
private, are $1.54 trillion in assets and $135 billion in contributions.
As highlighted earlier, a key advantage to this data over data used in prior studies on
portfolio options and investment allocations is that we have a panel comprised of companies with
multiple years of plan information. As such, we are able to trace how changes in investment
structure influence portfolio behavior over time, while controlling for cross-sectional differences
in firms.
3.2 Summary Statistics on Fund Options
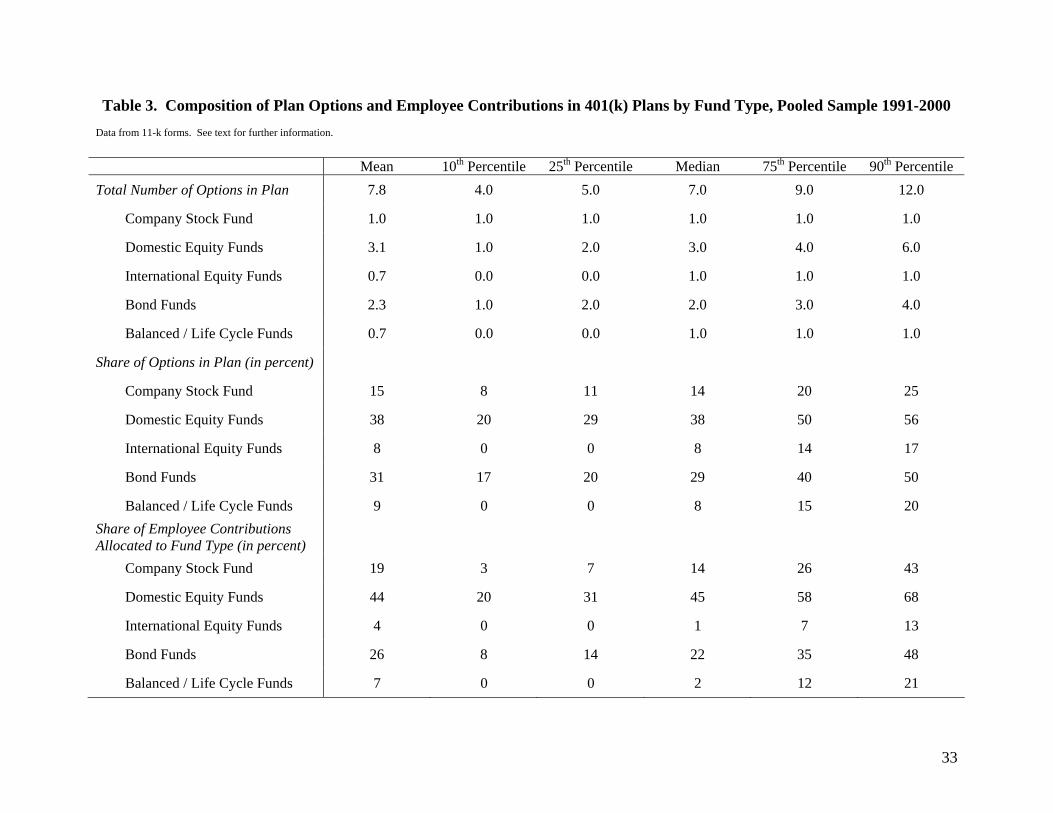
In Table 3, we report the composition of plan options and employee contributions in 401(k)
plans by the type of fund (i.e., company stock, domestic equity, international equity, bond, and
balanced) across our pooled data 1991-2000. The average firm (across plans and years) provides
7.8 investment options, and the median offering has 7 funds. Over 80 percent of the firm-year
observations offer between 4 and 12 options, inclusive.
Table 3 also shows substantial heterogeneity in the type of funds offered and contributions
to the various asset classes. While domestic equity funds constitute only 29% or less of plan
options at one quarter of the firm-year observations, they constitute at least half of the options at
another quarter of the observations. The interquartile range for the share of bond funds in the
401(k) plan also spans 20 percentage points (the 25th percentile is 20% of fund options while the
75th percentile is 40% of fund options). International funds and balanced funds are a small share
of offerings for the majority of firms.
There are also striking differences across firms in the investment decisions made by
participants in their 401(k) plans. While only 31% or less of employee contributions are
allocated to domestic equities at one quarter of the firm-year observations, they constitute at least
13
58% of the allocations made at another quarter of the observations. There are also substantial
differences in the investments in company stock and bond funds across firms.
Of course, if employees are not unduly influenced by the mix of options, for example by
following an optimal portfolio strategy or by allocating according to a fixed allocation rule (e.g.,
a 60/40 equity/bond mix), then increasing the proportion of equity fund options should not have
a large effect on the individual’s overall equity exposure. In contrast, if the mix of options does
influence behavior, as would be the case if participants follow a naïve 1/n diversification
heuristic (or alternatively “randomly” concentrate their contributions in a small group of funds),
then we would expect to see higher equity allocations when there are more equity funds
available.
4. How the Number and Mix of Investment Options Influence Portfolio Decisions
4.1 Composition of Investment Options and Investment Choices by Number of Funds
Figure 1 enables us to examine, over the pooled sample 1991-2000, how the share of
options in a particular asset class changes as the total number of options in the plan increases.
We find that as firms increase the number of options available to employees, that the increase is
predominantly concentrated in equity funds. For example, an increase in total options in the
401(k) plan from 4 to 12 is associated with an increase in the share of domestic equity funds in
the plan from just over one quarter of options to almost half of options (at the same time, the
share of both the bond funds and the company stock fund in the plan fall by roughly 15
percentage points each).
Figure 1 also reports how the share of funds matches up with the share of contributions to
those funds (numbers are reported in percentage points). Across all asset types, there is a
14
striking relation between the share of fund options available in each asset class and the share of
contributions made to funds in that asset class. Mirroring the pattern with the share of options,
the share of contributions made to company stock and bond funds fall as the total number of
options in the 401(k) plan increase, while the share of contributions to domestic equity funds
rises dramatically as the number of options in the plan increases. For example, as we move from
a total of four fund options to a total of twelve, the fraction of contributions made to equity funds
rises from 30 percent to 56 percent (mirroring the increase in the fraction of equity funds from 28
to 47 percent). Though increasing, allocations to international funds seem to be lagging behind
their increased prominence in 401(k) plans as the number of options expands.
Thus, Figure 1 provides initial evidence that employees may be influenced in their overall
portfolio allocation behavior by the mix of investment choices provided to them. Specifically, as
employers provide more options, they appear to be doing so primarily by adding additional
domestic equity funds (and to a lesser extent international funds). Correspondingly, participants
appear to be placing a higher fraction of their portfolio in equities as the fraction of equity
options rises. However, clearly other factors, such as asset returns, also affect allocation
decisions within the plan. Further, the correlation between the share of options and the share of
contributions need not be causal, as it could simply reflect firms with risk-averse workers do not
invest in equities and thus demand fewer equity funds in their 401(k) plans. To address these
concerns, we turn to a regression framework.
4.2 Regression Framework
We begin by estimating pooled cross-sectional regressions in which the dependent
variable is the share of contributions allocated to each of our five investment categories. On the
right hand side, our primary variable of interest is the fraction of investment options that are in
15
this category. Thus, when testing for employer stock, we regress the share of contributions to
company stock against 1/n, which represents the share of total investment options that are
comprised by the employer stock fund. For domestic equity funds, we regress the share of
contributions against e/n, where e is the number of domestic equity funds and n is the total
number of investment options. We follow a similar approach for international equity funds,
bond funds, and balanced funds.
If the coefficient on the share of fund options is zero, it indicates that individual portfolio
allocations are not influenced by the mix of investment choices available. At the other extreme,
a coefficient of one suggests that individuals, on average, follow a “1/n” strategy, implying that
the mix of investment options translates nearly one-for-one into changes in portfolio allocations.
Significant intermediate results would indicate that the mix of investment choice clearly matters,
though not to the full extent predicted by a strict 1/n hypothesis.
There are at least two possible explanations that are consistent with there being a positive
relation between contribution shares and the share of options. The first possibility is that all
workers naively diversify across multiple options and thus an increase in the number of options
would reduce all workers’ allocations to company stock. A second possibility is that workers
randomly put their entire 401(k) portfolio in one option, with different workers concentrating
their purchases in different options, in which case an increase in the number of options would
reduce the fraction of workers that concentrate all of their holdings in company stock. Benartzi
and Thaler (2001) provide evidence of the former and Huberman and Jiang (2006), Agnew
(2006), and Holden and VanDerhei (2001) provide evidence for the latter, suggesting that both
types of investors may exist. With plan-level rather than worker-level data, it is not possible for
us to distinguish which of these two stories is driving the result.
16
Besides the composition of options in the 401(k) plan, we also control for several other
firm/plan characteristics as well as year effects in our regressions. To do this, we merge our
sample of 11-k filings with Center of Research in Security Prices (CRSP) and Compustat data.
Motivated by Benartzi (2001), we include in our regressions a binary variable for whether the
firm restricts its employer match to company stock. We also control for past five-year returns on
the employer’s stock (taken from CRSP), the company’s stock price volatility (measured as the
standard deviation of total returns over the past 24 months), market-to-book ratio, log of plan
assets, whether the firm has a defined benefit plan, whether the firm’s bonds are investment
grade as a proxy for bankruptcy risk, and year effects.
Including year effects are important for two reasons. First, given the unbalanced nature
of our panel, as discussed in Table 1, it is important to ensure that the “naïve diversification”
results are not being driven by differences in market returns. For example, if firms increase the
number of options over time, in our sample this corresponds with a period of rising equity
markets. Thus it is important to ensure that the results are not being driven by individuals
placing more money into equity funds in response to rising equity markets (this effect will be
absorbed in the year effects in our regression). Second, it is likely that the increase in the
number of investment alternatives over time was due in large part to the proliferation of different
types of mutual funds offered over the past decade. For example, the ICI reports that the total
number of mutual funds rose from 3,403 in 1991 to 8,155 in 2000 (Investment Company
Institute, 2005), with the vast majority of these funds being equity funds. Year effects will pick
up this potential “demand” for equities as manifested by greater fund offerings.
4.3 Cross-Sectional Regression Results
Table 4 displays the results of the pooled cross-sectional regressions of the share of
17
employee contributions in a particular asset class against the share of fund options in this same
class using our sample of 401(k) plans over the period 1991-2000. Regressions are estimated
separately for each assert class and are only estimated over firm-year observations that offered at
least one option of that particular type in their 401(k) plan. For all five asset classes, we find
positive and significant relations between the share of contributions and the share of options in
the plan, confirming that the patterns displayed in Figure 1 also hold in the presence of firm-
specific characteristics and year controls. For domestic equity funds, the coefficient on the share
of equity options in the plan is 0.70. To assist in the literal interpretation of this coefficient,
imagine a firm has five investment options available, three of which are equity funds and two of
which are fixed income funds. If the firm added another equity option, the share of equity
choices changes from 3/5 to 4/6, or an increase of 6.7 percentage points. Multiplying by the 0.70
coefficient implies that participants would be expected, on average, to increase their allocation to
equities by 4.7 percentage points. For company stock investments, we cannot reject the “1/n”
hypothesis (i.e., cannot reject a coefficient of one on the share of options). This would suggest,
at first glance, that the trend of adding more options to 401(k) plans has contributed considerably
to a reduction in contributions to company stock over the past decade. The coefficient on the
share of options in the plan is the smallest for bond funds, but still highly significant. The
smaller sensitivity for bond funds is not surprising given that fixed income funds are often
chosen as the “default” investment for participants who do not make an active alternative
selection.
Our results on the other variables are generally consistent with previous findings.
Consistent with Benartzi (2001) and Brown, Liang, & Weisbenner (2006), we find that
employees at firms where the employer match is restricted to company stock direct, on average,
18
7.0 percentage points more of their own contributions to company stock. Only about one-third
of this 7.0 percentage point increase comes out of allocations to other equity funds, while 44%
comes out of fixed income investments. Prior research (e.g., Benartzi 2001, Huberman &
Sengmueller 2004, Choi, Laibson, Madrian, & Metrick 2004b, and Agnew 2006) suggests that
individuals are more likely to invest in their employer’s stock if it has performed well in recent
years. We also find that holdings of own employer stock are positively related to past 5 year
returns on that stock, while the share of contributions directed toward other equity investments is
significantly negatively related to own company stock performance. The company stock
purchase rate is higher at less volatile firms, larger firms, and firms with higher market-to-book
ratios (a proxy for growth opportunities). The presence of a defined benefit plan or an
investment grade bond rating has little effect on participant investment decisions.
4.4 Panel Regression Results
A potential concern with any cross-sectional regression is that there is tremendous
heterogeneity across firms (and the workers across firms), and thus one might be concerned
about spurious correlation, such as differences in risk tolerance across workers in different firms.
To address this, we add firm fixed effects to our regression specification. The inclusion of these
891 firm-specific fixed effects absorb all of the variation in the allocation of contributions that
can be attributed to time-invariant differences in the characteristics of firms and their employees.
In other words, with firm fixed effects in place, the coefficient on the share of options in an asset
class is identifying the relationship of interest from within-firm changes over time in the number
of investment options offered.
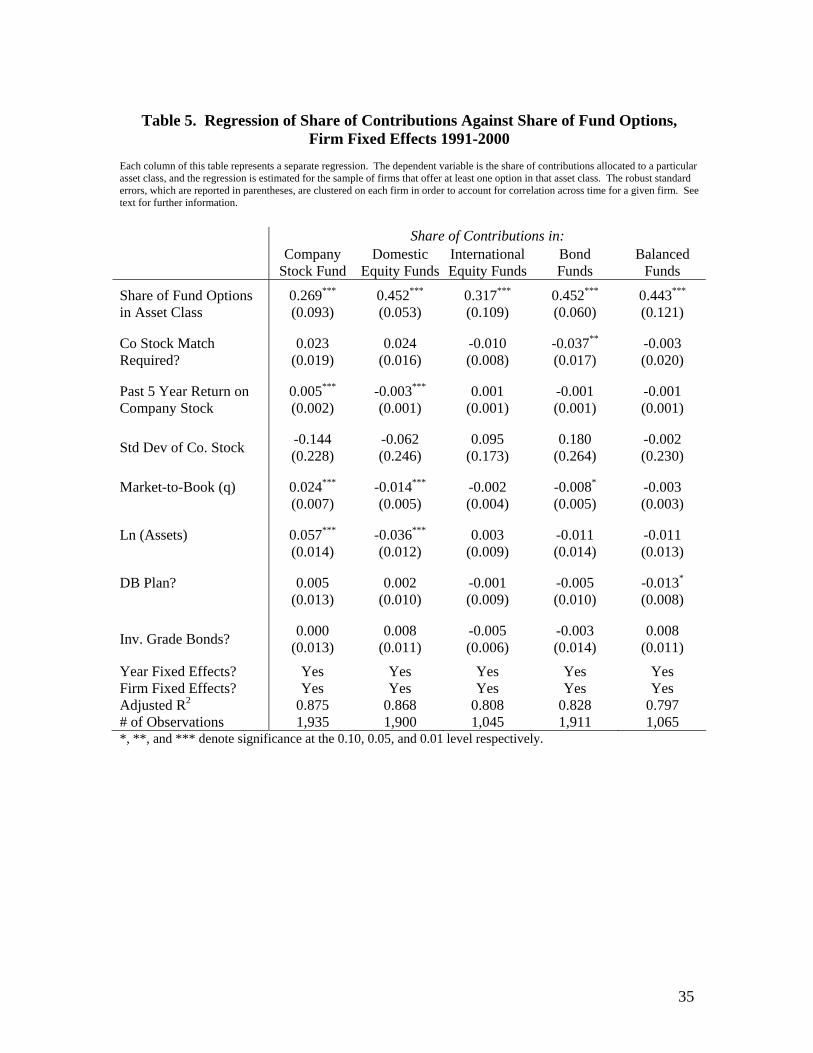
The results of these fixed effects regressions are displayed in Table 5. By comparing the
results with those obtained in the cross-sectional regressions presented in Table 4, two
19
conclusions emerge. First, in general, pension plan parameters remain important determinants of
investor behavior after controlling for firm-level fixed effects. Importantly, the influence of the
number and mix of investment options on portfolio choice is still quite strong for equity funds.
For example, controlling for firm-level fixed effects, the coefficient on the share of equity funds
is a highly significant 0.45 (compared to 0.70 in the cross-sectional regression). To put this
coefficient into perspective, imagine a firm that began with three equity funds and two bond
funds adds a fourth equity fund. Applying the 0.452 coefficient indicates that this change would
be expected to increase the allocation of contributions to equity by 3.0 percentage points, which
represents a nontrivial change in the risk/return profile of participant portfolios. The coefficients
on the share of options for international funds, bond funds, and balanced funds are of similar
magnitude.
Second, firm-level heterogeneity is also an important determinant of how 401(k) assets
are allocated, particularly in the context of company stock. While one cannot reject that there is
a one-for-one relation between the fraction of contributions allocated to an employer’s company
stock and the fraction of options in the plan that are company stock (since company stock is one
option, this fraction is simply 1 / total plan options) in the cross section, the magnitude of this
relation drops by over two-thirds once firm-specific fixed effects are included in the regression.
This suggests that while in the cross section, firms with more options in their 401(k) plan
contributed less to company stock, this in large part likely represents firm-level heterogeneity in
the desirability of company stock investments (which manifests itself both in employee
contributions to company stock as well as how many non-company stock options are present in
the 401(k) plan) as opposed to a “1/n” behavioral response. This conclusion is supported by
20

Brown, Liang, and Weisbenner (2006) who find that firms that provide employer-matching
contributions in company stock tend to offer fewer options in the 401(k) plan as well.
Benartzi (2001) finds evidence of an “endorsement” effect, that is, workers in firms
where the employer provides a match in company stock tend to invest substantially more of their
own contributions in company stock (and attributes this to the workers viewing a firm match in
company stock as implicit investment advice). While we also found such a relation in the cross
section, the relation between match policy and employee contributions disappears once we
control for firm-level fixed effects (the coefficient falls over 2/3 in magnitude and is no longer
statistically significant).8 Thus, investments in company stock in the pension plan appear to be
driven in no small part by firm or worker-specific characteristics outside of the pension plan.
These results provide clear evidence that the number and mix of investment options
matter in determining the equity/bond mix in retirement plans. An important policy implication
of this finding is that the choice of investment options to make available in an individual
accounts program is likely to have a first-order effect on the portfolio allocations that individuals
make. This finding is not based on cross-sectional correlations, but rather is obtained from a
panel data set, enabling us to control for heterogeneity in the investment preferences of workers
across firms and across time.
4.5 Robustness Checks of Panel Regression Results
The regression results in Table 5 were obtained in a firm-fixed effects framework. Thus,
the coefficient on the share of options in an asset class is identifying the relationship of interest
from within-firm changes over time in the number of investment options offered. We attribute
the resulting correlation between the share of contributions and the share of options to a
8 Forty-two firms change match policy over the sample, enabling us to identify the match policy or “endorsement” effect in a firm-fixed effects regression.
21
behavioral motivation (i.e., the “1/n” hypothesis or more generally that the mix of options
“matters”). However, there are rational, alternative explanations for this result that we address in
Table 6.
First, it may be the case that until the firm offers a broad-based equity index fund,
additional equity options may actually expand the return-risk frontier for the participants (thus
leading to greater contributions to equity funds). Once an index fund is in the plan, though,
additional equity options should not “matter” for the participant, thus weakening the relation
between the share of equity contributions and the share of equity options. Column (2) in Table 6
demonstrates that this is not the case, having an index option in the plan does not reduce the
sensitivity of contributions to equity funds to the number of equity options in the plan (the
interaction term with the share of equity options is insignificant).9 Similarly, if the firm has only
one equity option, then adding a second equity option might provide some sort of diversification
that expands the return-risk frontier for the participants and thus leads to increased equity
allocations. However, the addition of a fourth of fifth equity option is likely to provide no
diversification benefit, and thus the relation between share of contributions and share of options
should weaken with the number of equity options in the plan. Again, column (3) demonstrates
that this is not the case, as the relation between the share of contributions and the share of
options does not change with the number of equity options in the plan.
Another alternative explanation is that a change in equity options within a plan happens
as a result of increased demand for equity that is just starting to surface in employee
contributions within the plan. In other words, as demand for equities in the 401(k) plan grows,
this leads to increased contributions to equity funds in aggregate, as well as the firm adding some
9 For ease of comparison, the first column of Table 6 replicates the fixed-effect coefficient on the share of equity options from Table 5.
22
additional equity funds. Thus, there is an omitted variable, the change in past equity demand,
that really drives the (spurious) relation we observe between the share of equity options and the
share of equity contributions. To control for this “demand” story, we also include the past
change in the fraction of contributions to equity funds in the regression. Its inclusion has no
effect on the coefficient of interest, that on the share of equity options, while the coefficient on
the change in past contributions to equity funds is itself small in magnitude and insignificant (see
column (4)).
Finally, up to this point, we have lumped both actively-managed funds and index funds
together. Columns (5) and (6) present regression results examining these types of equity funds
separately. We find that for both types of equity funds, the share of funds of their type in the
plan affects investment decisions. For example, suppose a firm has one equity index fund, one
bond fund, and company stock as investment options. If that firm adds four actively-managed
equity funds to the mix, allocations to the index fund will be predicted to fall by 7.9 percentage
points (coefficient of 0.416 multiplied by (0.33 – 0.14)).
After having established a robust relation between the mix of options in 401(k) plans and
investment decisions we next consider how trends in the mutual fund industry have affected
pension plans. In particular, we consider whether the increased number of actively-managed
equity funds over the past 10 years has trickled down to 401(k) plans, and how it has affected the
expenses and performance of participants in their retirement plans.
5. Index versus Actively Managed Funds
As referenced earlier, the number of mutual funds available to investors in the U.S. has
growth dramatically, driven by the surge in equity funds (particularly actively-managed) over the
23
past decade. The mutual fund literature (e.g., Jensen (1968), Malkiel (1995), Gruber (1996),
Carhart (1997), and Daniel, et al (1997)) finds that actively managed funds charge substantially
higher annual fees than do index funds (such as S&P 500 funds), without earning higher after-
expense returns on average (and perhaps perform no better before expenses). Do trends in
401(k) plan fund offerings mirror the aggregate trends in the mutual fund industry? If so, this
raises the concern that change in the composition of investment options offered in 401(k) plans
could result in more money being allocated to high-cost funds that will on average result in lower
net returns.
To address these questions, we augment our 11-k data set described in Section 3. In
particular, we follow the firms that had 11-k data during 1998 in the original sample over the
next four years (1999-2002). This enables us to better assess trends in 401(k) plans over a longer
time series. One disadvantage of the later data is that we are restricted to looking at the
allocation of asset balances rather than the flow of contributions, but this will not be an issue for
the analyses we conduct below.10
In Figure 2, we see that the average number of options in 401(k) plans has increased from
just below 6 options in 1993 to 14 options in 2002. Over that period, the average number of
actively-managed equity funds in the plan has dramatically increased from 1.6 in 1993 to 6.4 in
2002, while the number of index funds offered in 401(k) plans only increased slightly over the
period and still remains very small (averaging no more than one option in the plan over every
year in the sample).
Figure 3 confirms that the vast majority of new funds (two-thirds) added to 401(k) plans
over 1998-2002 are actively-managed equity funds (mirroring the broader trends in the mutual
10 The reason for the difference between the pre-1999 and the 1999 – 2002 data is that the SEC changes the reporting requirements on the 11-k.
24

fund industry), while a mere 8% of the new options represent an index fund (typically
introducing an S&P fund for the first time or adding a small-cap index fund to a S&P 500 fund
already in place). Coupled with our earlier findings in Section 4, this trend in new fund offerings
has strong implications for the relation between the investment performance of these retirement
plans and the number of fund options provided.
Of course, investors interested in low cost index funds really only need one broad market
index, and thus it is possible that the majority of allocations flow to this low-cost option (as
opposed to the higher-cost actively managed alternatives). Our previous regression results in
Tables 4, 5, and 6 suggest this is unlikely to be the case, and Table 7 confirms this. In Table 7,
we demonstrate that the share of equity options in the plan comprised of actively-managed funds
increases with an increase in the total number of equity funds in the plan, as does the fraction of
equity assets held in actively-managed funds. Regression analysis (not reported) confirms that
the share of assets in actively-managed funds (index funds) increases (decreases) substantially
with the number of total equity funds in the plan. This result is consistent with the notion that
the burgeoning number of actively-managed funds makes it harder for investors to find the
lower-cost index fund in the plan (with less money flowing to this option as a result).
Of interest is the “quality” of the actively-managed equity funds offered in the 401(k)
plans relative to the index funds offered. To provide an initial sense of the “quality” of the
actively-managed relative to the index funds (at least as measured by their past long-term
performance and annual costs) we present in Table 8 differences in the following variables: past
five-year returns before expenses, expenses, past five-year returns after expenses, and percentile
ranking of the fund based on its past five-year returns (after expenses) within its investment
25
objective (such as small-cap growth) as determined by Morningstar.11 Table 8 demonstrates that
while the actively managed and index equity funds offered in our sample of 401(k) plans have
similar performance before accounting for expenses (index funds actually slightly outperformed,
but the difference is not significant), they differ significantly in their reported annual expenses
(on the order of 50 basis points per year), which leads to worse performance after accounting for
expenses (both in terms of returns and percentile rankings within its investment objective).
Table 9 conducts a similar analysis at the firm level. For each firm-year observation, we
calculate the average expenses across all the domestic equity options in the plan as well as the
average Morningstar percentile rankings for performance over the next year. We relate these
variables to the fraction of domestic equity funds in the 401(k) plan that is actively managed,
controlling for both firm-specific and year fixed effects. The results suggest that switching from
all index equity funds to all actively-managed equity funds increases the firm-level average
expenses for equity funds by 36 to 47 basis points per year, and thus reduces the firm-level
average performance ranking of its equity funds over the next year by 15 percentage points in the
Morningstar Percentile Rankings.
Given historically that actively-managed funds do not outperform index funds (perhaps
even before expenses), these investment patterns (coupled with the composition of the new funds
offered) could result in a nontrivial reduction in resources available for retirement. For
example, consider a worker who starts at age 22 earning $30,000 per year and experiences 4%
nominal annual earnings growth until they retire at age 62. Suppose this worker saves 6% of
salary per year in a 401(k) and receives a matching contribution equal to 3% of salary. If this
individual earns an 8% nominal net return on their investments, she would have $1.142 million
11 These variables are provided by merging our sample of 401(k) fund offerings with the CRSP and Morningstar mutual fund databases. Morningstar percentile rankings are scaled from 0 to 100 where 0 is the worst performer and 100 is the best performer.
26
at retirement. If, instead, this individual received nominal annual net returns that were 35 basis
points lower than this, or 7.65%, she would have only $1.065 million at retirement. In short, due
to the power of compounding, a 0.35% per year difference in annual returns accumulates to a
nontrivial 7.5% difference in terminal wealth at retirement. The fact that individual investors
may not be fully considering the important role that expenses play in reducing their retirement
wealth is consistent with the findings of Choi, Laibson, and Madrian (2006) who show that
highly educated subjects (Harvard undergrads and Wharton MBAs) are surprisingly
unresponsive to differences in expense ratios when selecting a mutual fund, even when the
underlying investment is otherwise nearly identical.
6. Conclusions
A key policy issue in the design and implementation of any defined contribution pension
system, whether publicly or privately provided, is how to structure the investment options that
will be made available to participants. While it is well understood that the structure of
investment options can have an important effect on the level of administrative expenses of an
individual accounts program, we show that the number and mix of investment options can also
have a first order effect on the risk and return profile of average portfolios. Even after
controlling for individual firm and year fixed effects, we find a strong positive relationship
between the share of investment options provided to employees in a particular asset class and the
share of their portfolios invested in that asset class. This strongly suggests that average
participants are not optimally allocating their portfolios according to standard finance theory
predictions, but instead are following naïve strategies that subject them to “manipulation” by
non-binding changes in the number and mix of investment options. A key policy implication is
27
that the number and mix of investment options will have an important effect on overall asset
allocation in the individual accounts. In short, it appears to be possible to influence the portfolio
allocation of individual participants by altering the mix of equity and bond funds, even if the
overall investment opportunity set remains unchanged.
By exploiting panel data on 401(k) plans, we find that both plan parameters and firm-
level heterogeneity are important in explaining investment decisions. Investments in company
stock, in particular, seem to be driven more by differences in workers across firms (or
unobserved differences in the firms themselves) than by cross-sectional differences in pension
plan characteristics (such as whether the match is in company stock or the number of non-
company stock options in the retirement plan). This highlights the importance of exploiting
panel data in identifying behavioral responses to pension plan characteristics.
Finally, the proliferation of actively-managed equity funds in general (which has trickled
down to offerings in 401(k) plans as well), has resulted in the vast majority of money in
retirement plans flowing into higher-cost actively managed equity funds as opposed to lower-
cost equity index funds (such as S&P 500 funds). This results in plan participants paying higher
fees, which will depress overall portfolio performance, and thus, in the long-term, depress
retirement wealth.
28
References
Agnew, Julie, 2006, Do behavioral biases vary across individuals: evidence from individual level data, Journal of Financial and Quantitative Analysis, forthcoming.
Agnew, Julie, Pierluigi Balduzzi, and Annika Sunden, 2003, Portfolio choice and trading in a
large 401(k) plan, American Economic Review 93-1, 193-215. Agnew, Julie and Lisa R. Szykman, 2005, Asset allocation and information overload: The
influence of information display, asset choice, and investor experience, Journal of Behavioral Finance, 6-2, 57-70.
Ameriks, John and Stephen Zeldes, 2001, How do household portfolio shares vary with age?
Working paper, Columbia University, December. Benartzi, Shlomo, 2001, Excessive extrapolation and the allocation of 401(k) accounts to
company stock, Journal of Finance 56, 1747-64. Benartzi, Shlomo and Richard H. Thaler, 2001, Naïve diversification strategies in retirement
savings plans, American Economic Review 91-1, 79-98. Brown, Jeffrey, Nellie Liang and Scott Weisbenner, 2006, 401(k) Matching Contributions in
company stock: costs and benefits for firms and workers, Journal of Public Economics, 90, 1315-1346.
Carhart, Mark M., 1997, On persistence in mutual fund performance, Journal of Finance, 52, 57-
82. Choi, James, David Laibson and Brigitte Madrian, Why does the law of one price fail? An
experiment on index mutual funds, working paper, March 30, 2006. Choi, James, David Laibson, Brigitte Madrian, and Andrew Metrick, 2004a, For better or for
worse: Default effects and 401(K) savings behavior, in David Wise, editor, Perspectives in the Economics of Aging, Chicago: University of Chicago Press, 81-121.
Choi, James, David Laibson, Brigitte Madrian, and Andrew Metrick, 2004b, Employee’s
investment decisions about company stock, in Olivia S. Mitchell and Stephen P. Utkus, editors, Pension Design and Structure: New Lessons from Behavioral Finance, Oxford: Oxford University Press, 121-136.
Congressional Budget Office, “Social Security Privatization: Experiences Abroad.” January
1999. Daniel, Kent, Mark Grinblatt, Sheridan Titman, and Russ Wermers, 1997, Measuring mutual
fund performance with characteristic-based benchmarks, Journal of Finance, 52, 1035-1058.
29
Government Accountability Office, “Social Security Reform: Other Countries’ Experiences Provide Lessons for the United States.” GAO-06-126, October 2005.
Gruber, Martin J., 1996, Another puzzle: the growth in actively managed mutual funds, Journal
of Finance, 51, 783-810. Holden, Sarah and VanDerhei, Jack, 2001, The impact of employer-selected investment options
on 401(k) plan participants’ asset allocations: Preliminary findings, Working Paper, Investment Company Institute and Temple University.
Huberman, Gur, Sheena Iyengar, and Wei Jiang, 2007, Defined contribution pension plans:
determinants of participation and contribution rates, Journal of Financial Services Research, forthcoming.
Huberman, Gur and Wei Jiang, 2006, Offerings vs. choices in 401(k) plans: Equity exposure
and number of funds, Journal of Finance, 61-2, 763-801. Huberman, Gur and Paul Sengmueller, 2004, Performance and employer stock in 401(k) plans,
Review of Finance, 8-3, 403-443. Investment Company Institute, 2005, Mutual Fund Handbook, 45th edition, Washington, DC. Jensen, Michael C., 1968, The performance of mutual funds in the period 1945-1964, Journal of
Finance, 23, 389-416. Karlsson, Anders, Massimo Massa, and Andrei Simonov, Portfolio choice and menu exposure,
Working Paper, August, 2006. Madrian, Brigitte, and Dennis Shea, 2001, The power of suggestion: Inertia in 401(k)
participation and savings behavior, The Quarterly Journal of Economics 116, 1149-1525. Malkiel, Burton G., 1995, Returns from investing in equity mutual funds from 1971 to 1991,
Journal of Finance, 50, 549-572. Palme, Marten, Annika Sunden, and Paul Soderlind, Investment choice in the swedish premium
pension plan, Working Paper, December 21, 2004. Samuelson, William and Richard Zeckhauser, 1988, Status quo bias in decision making, Journal
of Risk and Uncertainty 1 (March), 7-59.
30
31
Table 1: Sample Composition
Data collected for all U.S. companies listed in Compustat any year from 1993 to 1999 that filed an 11-k at least once during 1994-2001, and for which complete fund classification was possible. See text for further details.
Year Number of observations
Number of years in sample
Number of firms
Number of observations
1991 29 1 211 211
1992 128 2 194 388
1993 240 3 166 498
1994 314 4 107 428
1995 398 5 86 430
1996 487 6 72 432
1997 537 7 40 280
1998 566 8 13 104
1999 65 9 1 9
2000 26 10 1 10
TOTAL 2,790 TOTAL 891 2,790
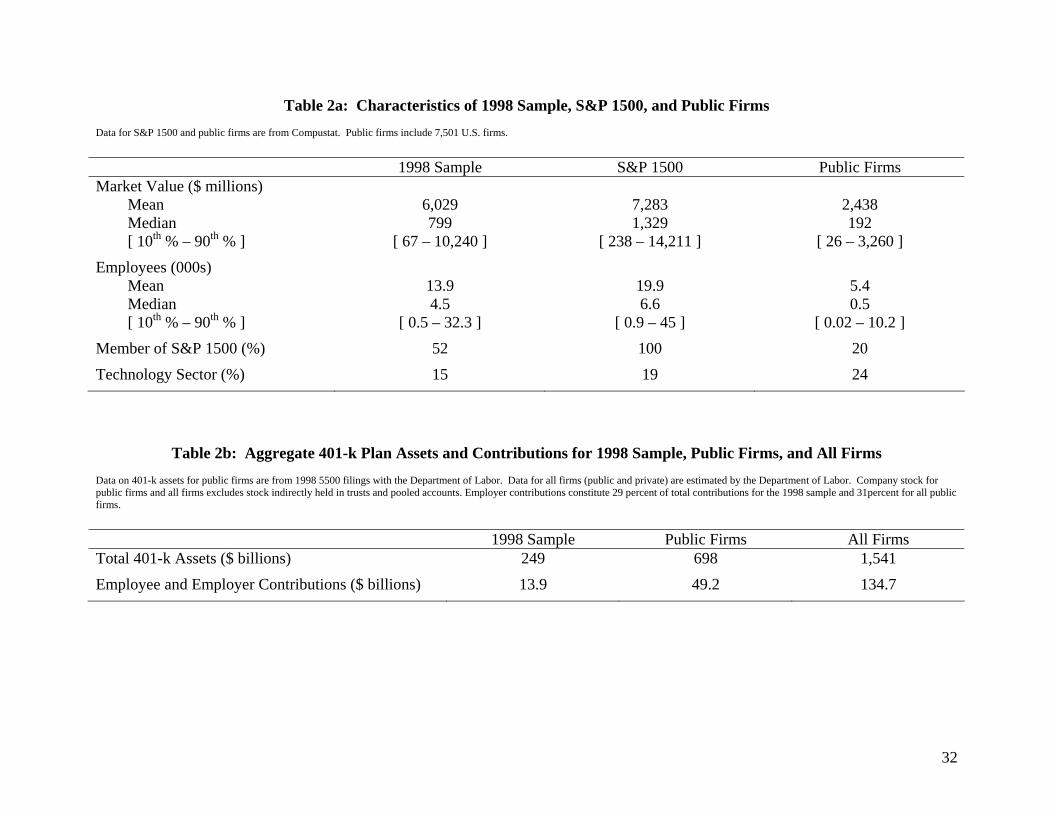
Table 2a: Characteristics of 1998 Sample, S&P 1500, and Public Firms Data for S&P 1500 and public firms are from Compustat. Public firms include 7,501 U.S. firms.
1998 Sample S&P 1500 Public Firms Market Value ($ millions) Mean Median [ 10th % – 90th % ]
6,029 799
[ 67 – 10,240 ]
7,283 1,329
[ 238 – 14,211 ]
2,438 192
[ 26 – 3,260 ] Employees (000s) Mean Median [ 10th % – 90th % ]
13.9 4.5
[ 0.5 – 32.3 ]
19.9 6.6
[ 0.9 – 45 ]
5.4 0.5
[ 0.02 – 10.2 ] Member of S&P 1500 (%)
52 100 20 Technology Sector (%)
15 19 24
Table 2b: Aggregate 401-k Plan Assets and Contributions for 1998 Sample, Public Firms, and All Firms Data on 401-k assets for public firms are from 1998 5500 filings with the Department of Labor. Data for all firms (public and private) are estimated by the Department of Labor. Company stock for public firms and all firms excludes stock indirectly held in trusts and pooled accounts. Employer contributions constitute 29 percent of total contributions for the 1998 sample and 31percent for all public firms.
1998 Sample Public Firms All Firms Total 401-k Assets ($ billions)
249 698 1,541 Employee and Employer Contributions ($ billions)
13.9 49.2 134.7
32
33
Table 3. Composition of Plan Options and Employee Contributions in 401(k) Plans by Fund Type, Pooled Sample 1991-2000 Data from 11-k forms. See text for further information.
Mean 10th Percentile 25th Percentile Median 75th Percentile 90th Percentile Total Number of Options in Plan 7.8 4.0 5.0 7.0 9.0 12.0
Company Stock Fund 1.0 1.0 1.0 1.0 1.0 1.0
Domestic Equity Funds 3.1 1.0 2.0 3.0 4.0 6.0
International Equity Funds 0.7 0.0 0.0 1.0 1.0 1.0
Bond Funds 2.3 1.0 2.0 2.0 3.0 4.0
Balanced / Life Cycle Funds 0.7 0.0 0.0 1.0 1.0 1.0
Share of Options in Plan (in percent)
Company Stock Fund 15 8 11 14 20 25
Domestic Equity Funds 38 20 29 38 50 56
International Equity Funds 8 0 0 8 14 17
Bond Funds 31 17 20 29 40 50
Balanced / Life Cycle Funds 9 0 0 8 15 20 Share of Employee Contributions Allocated to Fund Type (in percent)
Company Stock Fund 19 3 7 14 26 43
Domestic Equity Funds 44 20 31 45 58 68
International Equity Funds 4 0 0 1 7 13
Bond Funds 26 8 14 22 35 48
Balanced / Life Cycle Funds 7 0 0 2 12 21
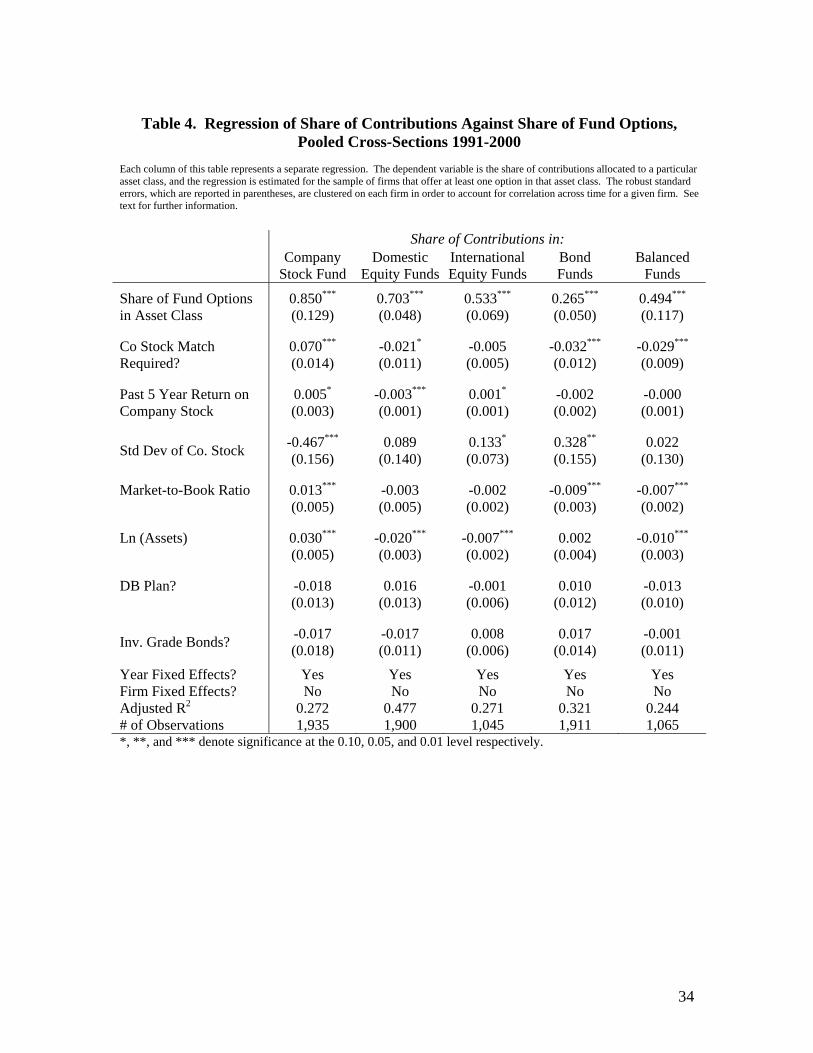
Table 4. Regression of Share of Contributions Against Share of Fund Options,
Pooled Cross-Sections 1991-2000 Each column of this table represents a separate regression. The dependent variable is the share of contributions allocated to a particular asset class, and the regression is estimated for the sample of firms that offer at least one option in that asset class. The robust standard errors, which are reported in parentheses, are clustered on each firm in order to account for correlation across time for a given firm. See text for further information.
Share of Contributions in:
Company Stock Fund
Domestic Equity Funds
InternationalEquity Funds
Bond Funds
Balanced Funds
Share of Fund Options in Asset Class
0.850***
(0.129) 0.703***
(0.048) 0.533***
(0.069) 0.265***
(0.050) 0.494***
(0.117)
Co Stock Match Required?
0.070***
(0.014) -0.021*
(0.011) -0.005 (0.005)
-0.032***
(0.012) -0.029***
(0.009)
Past 5 Year Return on Company Stock
0.005*
(0.003) -0.003***
(0.001) 0.001*
(0.001) -0.002 (0.002)
-0.000 (0.001)
Std Dev of Co. Stock -0.467***
(0.156) 0.089
(0.140) 0.133*
(0.073) 0.328**
(0.155) 0.022
(0.130)
Market-to-Book Ratio
0.013***
(0.005) -0.003 (0.005)
-0.002 (0.002)
-0.009***
(0.003) -0.007***
(0.002)
Ln (Assets)
0.030***
(0.005) -0.020***
(0.003) -0.007***
(0.002) 0.002
(0.004) -0.010***
(0.003)
DB Plan?
-0.018 (0.013)
0.016 (0.013)
-0.001 (0.006)
0.010 (0.012)
-0.013 (0.010)
Inv. Grade Bonds? -0.017 (0.018)
-0.017 (0.011)
0.008 (0.006)
0.017 (0.014)
-0.001 (0.011)
Year Fixed Effects? Yes Yes Yes Yes Yes Firm Fixed Effects? No No No No No Adjusted R2 0.272 0.477 0.271 0.321 0.244 # of Observations 1,935 1,900 1,045 1,911 1,065 *, **, and *** denote significance at the 0.10, 0.05, and 0.01 level respectively.
34
35
Table 5. Regression of Share of Contributions Against Share of Fund Options,
Firm Fixed Effects 1991-2000 Each column of this table represents a separate regression. The dependent variable is the share of contributions allocated to a particular asset class, and the regression is estimated for the sample of firms that offer at least one option in that asset class. The robust standard errors, which are reported in parentheses, are clustered on each firm in order to account for correlation across time for a given firm. See text for further information.
Share of Contributions in:
Company Stock Fund
Domestic Equity Funds
InternationalEquity Funds
Bond Funds
Balanced Funds
Share of Fund Options in Asset Class
0.269***
(0.093) 0.452***
(0.053) 0.317***
(0.109) 0.452***
(0.060) 0.443***
(0.121)
Co Stock Match Required?
0.023 (0.019)
0.024 (0.016)
-0.010 (0.008)
-0.037**
(0.017) -0.003 (0.020)
Past 5 Year Return on Company Stock
0.005***
(0.002) -0.003***
(0.001) 0.001
(0.001) -0.001 (0.001)
-0.001 (0.001)
Std Dev of Co. Stock -0.144 (0.228)
-0.062 (0.246)
0.095 (0.173)
0.180 (0.264)
-0.002 (0.230)
Market-to-Book (q)
0.024***
(0.007) -0.014***
(0.005) -0.002 (0.004)
-0.008*
(0.005) -0.003 (0.003)
Ln (Assets)
0.057***
(0.014) -0.036***
(0.012) 0.003
(0.009) -0.011 (0.014)
-0.011 (0.013)
DB Plan?
0.005 (0.013)
0.002 (0.010)
-0.001 (0.009)
-0.005 (0.010)
-0.013*
(0.008)
Inv. Grade Bonds? 0.000 (0.013)
0.008 (0.011)
-0.005 (0.006)
-0.003 (0.014)
0.008 (0.011)
Year Fixed Effects? Yes Yes Yes Yes Yes Firm Fixed Effects? Yes Yes Yes Yes Yes Adjusted R2 0.875 0.868 0.808 0.828 0.797 # of Observations 1,935 1,900 1,045 1,911 1,065 *, **, and *** denote significance at the 0.10, 0.05, and 0.01 level respectively.
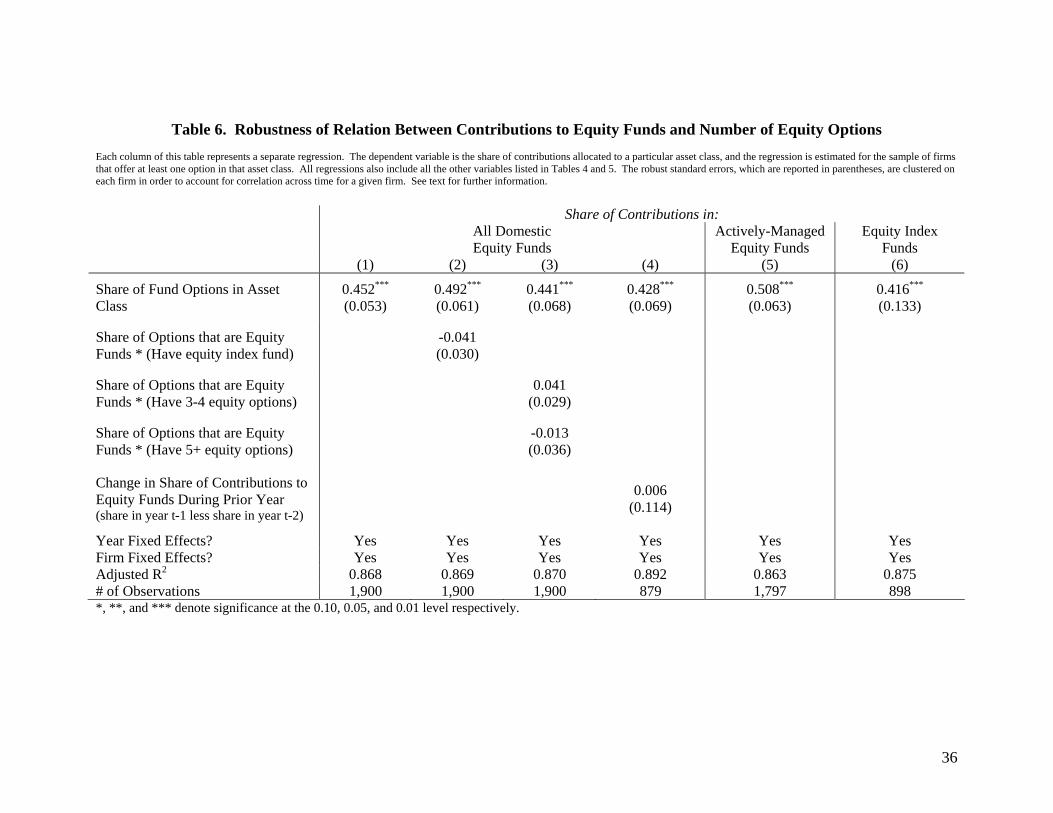
Table 6. Robustness of Relation Between Contributions to Equity Funds and Number of Equity Options Each column of this table represents a separate regression. The dependent variable is the share of contributions allocated to a particular asset class, and the regression is estimated for the sample of firms that offer at least one option in that asset class. All regressions also include all the other variables listed in Tables 4 and 5. The robust standard errors, which are reported in parentheses, are clustered on each firm in order to account for correlation across time for a given firm. See text for further information.
Share of Contributions in:
All Domestic Equity Funds
Actively-Managed Equity Funds
Equity Index Funds
(1) (2) (3) (4) (5) (6)
Share of Fund Options in Asset Class
0.452***
(0.053) 0.492***
(0.061) 0.441***
(0.068) 0.428***
(0.069) 0.508***
(0.063) 0.416***
(0.133)
Share of Options that are Equity Funds * (Have equity index fund) -0.041
(0.030)
Share of Options that are Equity Funds * (Have 3-4 equity options) 0.041
(0.029)
Share of Options that are Equity Funds * (Have 5+ equity options) -0.013
(0.036)
Change in Share of Contributions to Equity Funds During Prior Year (share in year t-1 less share in year t-2)
0.006 (0.114)
Year Fixed Effects? Yes Yes Yes Yes Yes Yes Firm Fixed Effects? Yes Yes Yes Yes Yes Yes Adjusted R2 0.868 0.869 0.870 0.892 0.863 0.875 # of Observations 1,900 1,900 1,900 879 1,797 898 *, **, and *** denote significance at the 0.10, 0.05, and 0.01 level respectively.
36
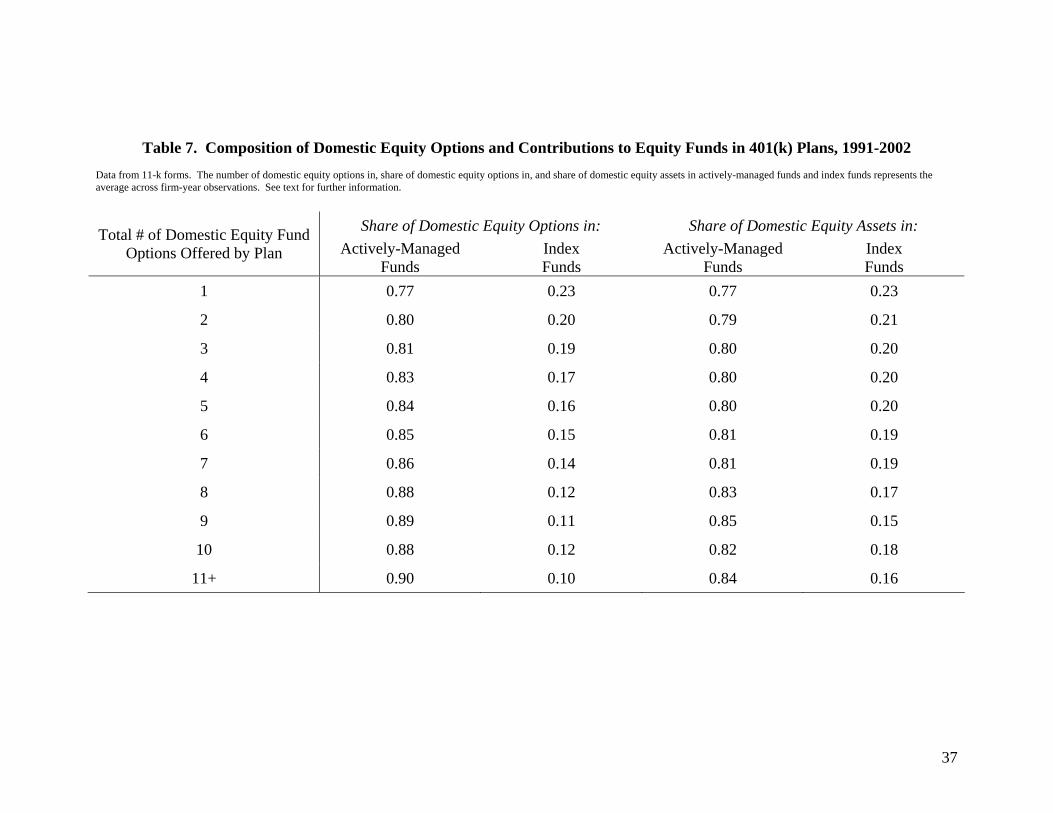
Table 7. Composition of Domestic Equity Options and Contributions to Equity Funds in 401(k) Plans, 1991-2002
Data from 11-k forms. The number of domestic equity options in, share of domestic equity options in, and share of domestic equity assets in actively-managed funds and index funds represents the average across firm-year observations. See text for further information.
Share of Domestic Equity Options in: Share of Domestic Equity Assets in: Total # of Domestic Equity Fund
Options Offered by Plan Actively-Managed Funds
Index Funds
Actively-Managed Funds
Index Funds
1 0.77 0.23 0.77 0.23
2 0.80 0.20 0.79 0.21
3 0.81 0.19 0.80 0.20
4 0.83 0.17 0.80 0.20
5 0.84 0.16 0.80 0.20
6 0.85 0.15 0.81 0.19
7 0.86 0.14 0.81 0.19
8 0.88 0.12 0.83 0.17
9 0.89 0.11 0.85 0.15
10 0.88 0.12 0.82 0.18
11+ 0.90 0.10 0.84 0.16
37
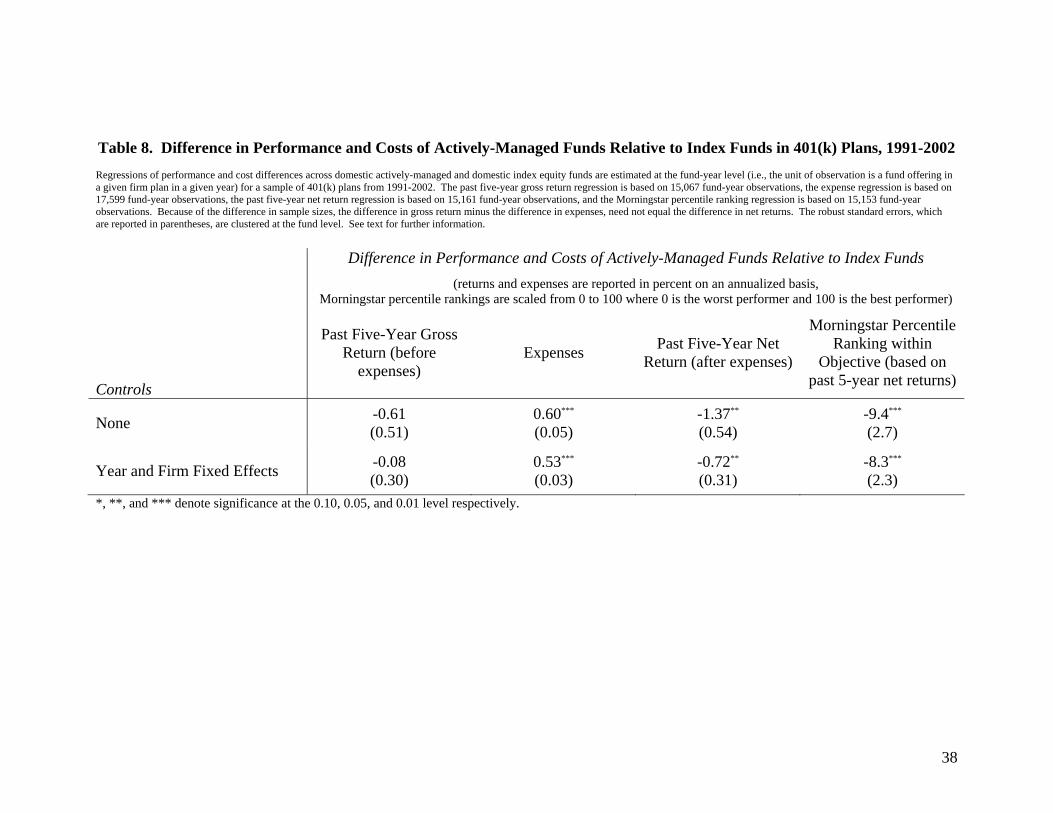
Table 8. Difference in Performance and Costs of Actively-Managed Funds Relative to Index Funds in 401(k) Plans, 1991-2002 Regressions of performance and cost differences across domestic actively-managed and domestic index equity funds are estimated at the fund-year level (i.e., the unit of observation is a fund offering in a given firm plan in a given year) for a sample of 401(k) plans from 1991-2002. The past five-year gross return regression is based on 15,067 fund-year observations, the expense regression is based on 17,599 fund-year observations, the past five-year net return regression is based on 15,161 fund-year observations, and the Morningstar percentile ranking regression is based on 15,153 fund-year observations. Because of the difference in sample sizes, the difference in gross return minus the difference in expenses, need not equal the difference in net returns. The robust standard errors, which are reported in parentheses, are clustered at the fund level. See text for further information.
Difference in Performance and Costs of Actively-Managed Funds Relative to Index Funds
(returns and expenses are reported in percent on an annualized basis, Morningstar percentile rankings are scaled from 0 to 100 where 0 is the worst performer and 100 is the best performer)
Controls
Past Five-Year Gross Return (before
expenses) Expenses Past Five-Year Net
Return (after expenses)
Morningstar Percentile Ranking within
Objective (based on past 5-year net returns)
None -0.61 (0.51)
0.60***
(0.05) -1.37**
(0.54) -9.4***
(2.7)
Year and Firm Fixed Effects -0.08 (0.30)
0.53***
(0.03) -0.72**
(0.31) -8.3***
(2.3) *, **, and *** denote significance at the 0.10, 0.05, and 0.01 level respectively.
38
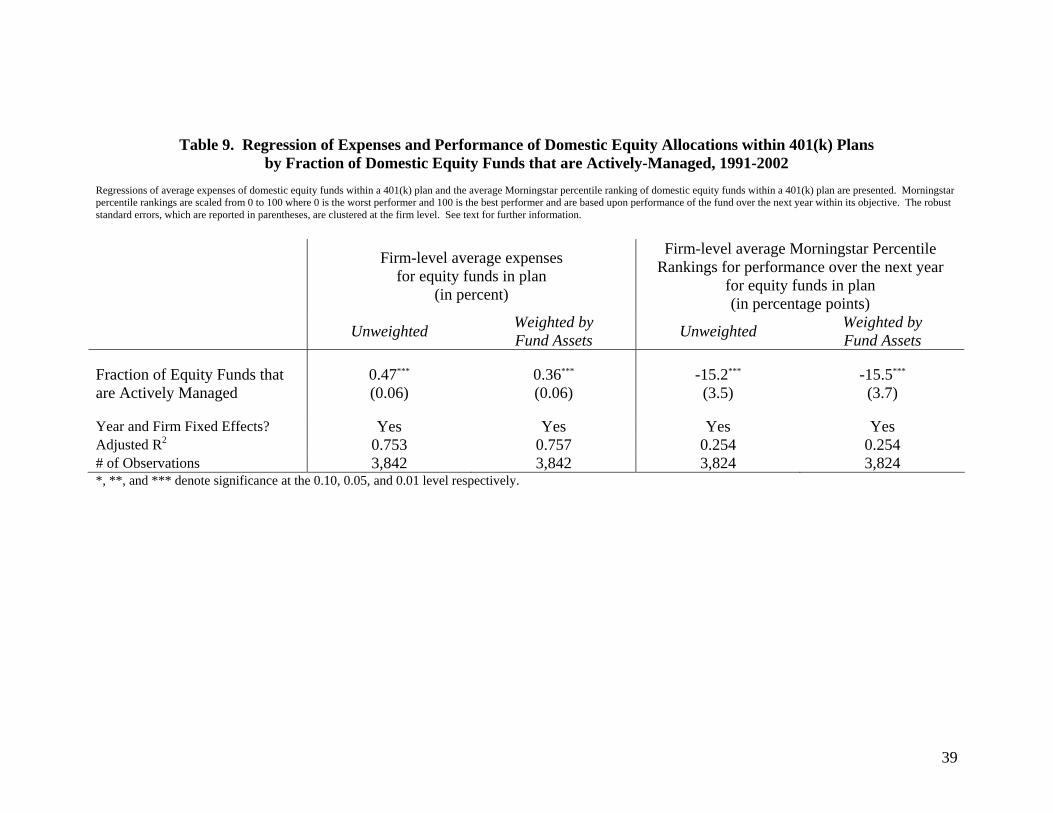
Table 9. Regression of Expenses and Performance of Domestic Equity Allocations within 401(k) Plans
by Fraction of Domestic Equity Funds that are Actively-Managed, 1991-2002 Regressions of average expenses of domestic equity funds within a 401(k) plan and the average Morningstar percentile ranking of domestic equity funds within a 401(k) plan are presented. Morningstar percentile rankings are scaled from 0 to 100 where 0 is the worst performer and 100 is the best performer and are based upon performance of the fund over the next year within its objective. The robust standard errors, which are reported in parentheses, are clustered at the firm level. See text for further information.
Firm-level average expenses for equity funds in plan
(in percent)
Firm-level average Morningstar Percentile Rankings for performance over the next year
for equity funds in plan (in percentage points)
Unweighted Weighted by Fund Assets Unweighted Weighted by
Fund Assets
Fraction of Equity Funds that are Actively Managed
0.47***
(0.06) 0.36***
(0.06) -15.2***
(3.5) -15.5***
(3.7)
Year and Firm Fixed Effects? Yes Yes Yes Yes Adjusted R2 0.753 0.757 0.254 0.254 # of Observations 3,842 3,842 3,824 3,824 *, **, and *** denote significance at the 0.10, 0.05, and 0.01 level respectively.
39
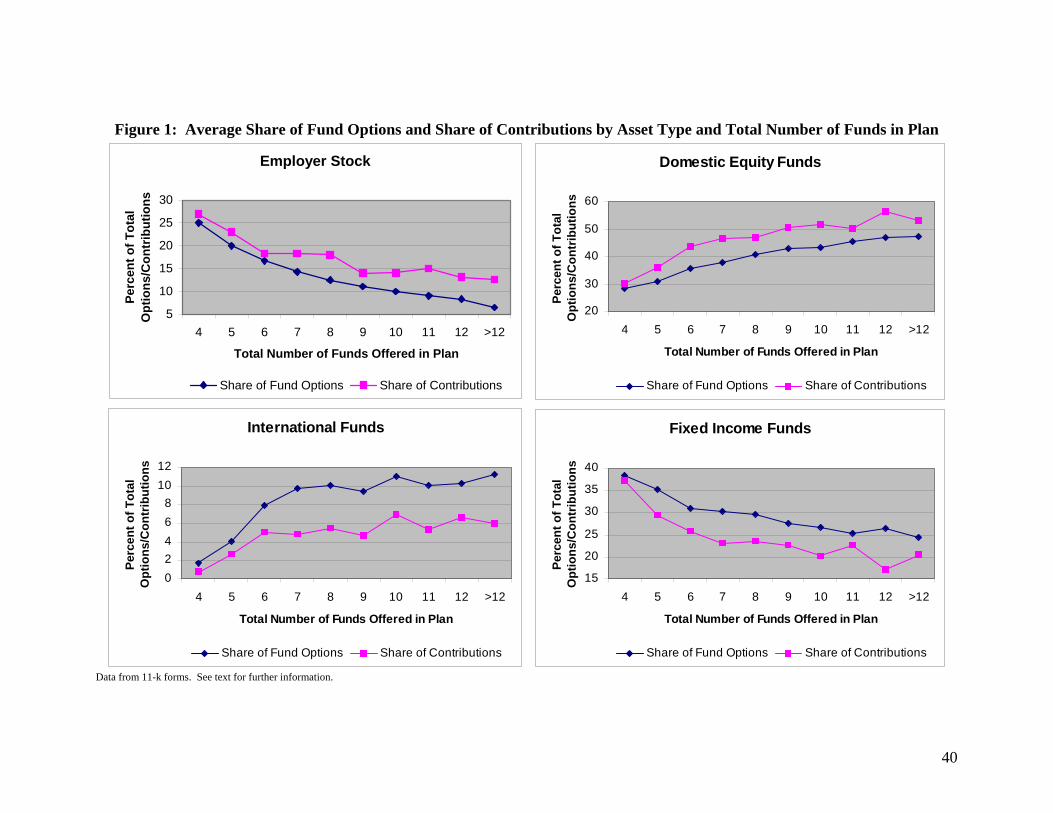
Figure 1: Average Share of Fund Options and Share of Contributions by Asset Type and Total Number of Funds in Plan
Employer Stock
5
10
15
20
25
30
4 5 6 7 8 9 10 11 12 >12
Total Number of Funds Offered in Plan
Perc
ent o
f Tot
al
Opt
ions
/Con
trib
utio
ns
Share of Fund Options Share of Contributions
Domestic Equity Funds
20
30
40
50
60
4 5 6 7 8 9 10 11 12 >12
Total Number of Funds Offered in Plan
Perc
ent o
f Tot
al
Opt
ions
/Con
trib
utio
ns
Share of Fund Options Share of Contributions
International Funds
02468
1012
4 5 6 7 8 9 10 11 12 >12
Total Number of Funds Offered in Plan
Perc
ent o
f Tot
al
Opt
ions
/Con
trib
utio
ns
Share of Fund Options Share of Contributions
Fixed Income Funds
15
20
25
30
35
40
4 5 6 7 8 9 10 11 12 >12
Total Number of Funds Offered in Plan
Perc
ent o
f Tot
al
Opt
ions
/Con
trib
utio
ns
Share of Fund Options Share of Contributions
Data from 11-k forms. See text for further information.
40
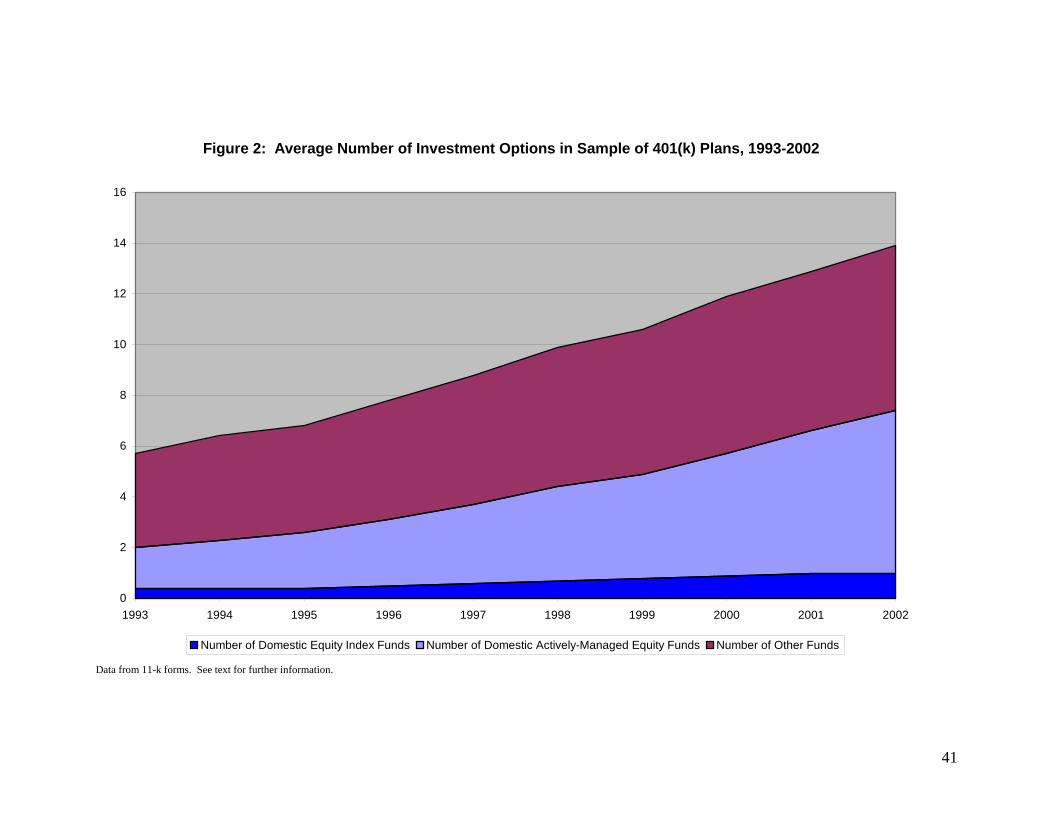
Figure 2: Average Number of Investment Options in Sample of 401(k) Plans, 1993-2002
0
2
4
6
8
10
12
14
16
1993 1994 1995 1996 1997 1998 1999 2000 2001 2002
Number of Domestic Equity Index Funds Number of Domestic Actively-Managed Equity Funds Number of Other Funds
Data from 11-k forms. See text for further information.
41
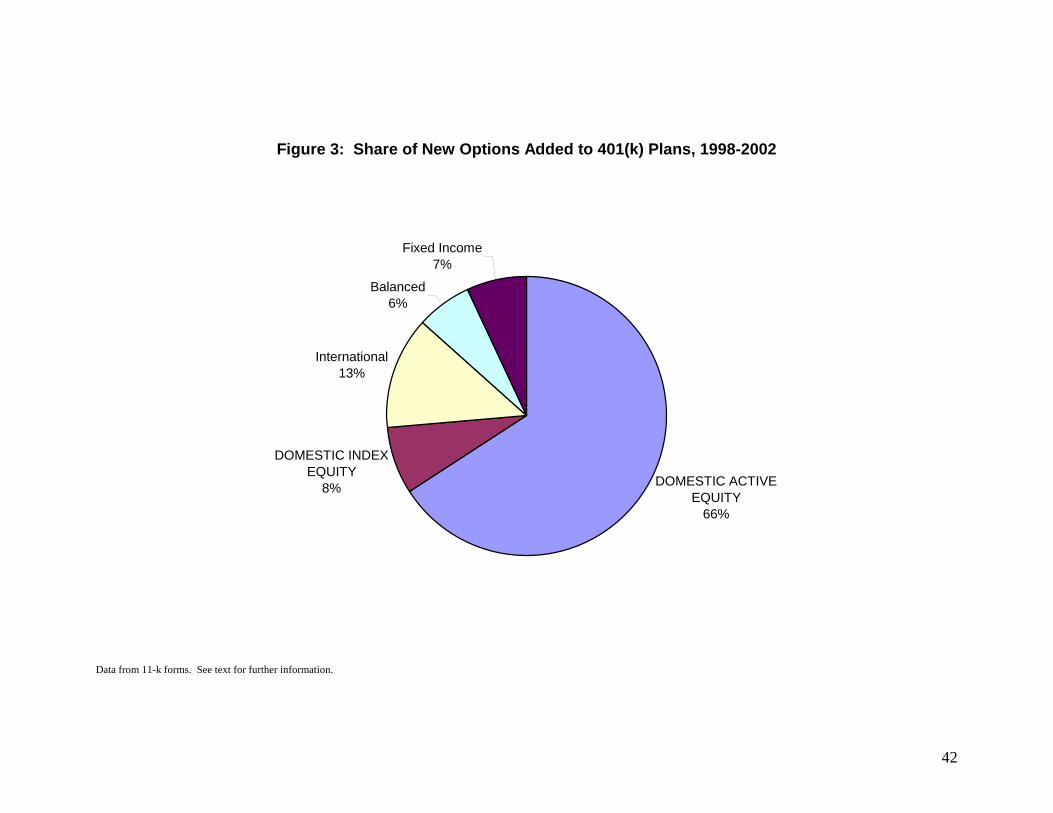
Figure 3: Share of New Options Added to 401(k) Plans, 1998-2002
DOMESTIC ACTIVE EQUITY
66%
DOMESTIC INDEX EQUITY
8%
International13%
Balanced6%
Fixed Income7%
Data from 11-k forms. See text for further information.
42