person factors affecting student persistence in college
TRANSCRIPT

Walden UniversityScholarWorks
Walden Dissertations and Doctoral Studies Walden Dissertations and Doctoral StudiesCollection
2019
Person Factors Affecting Student Persistence inCollege Reading and Writing RemediationLoretta J. Morris BarrWalden University
Follow this and additional works at: https://scholarworks.waldenu.edu/dissertations
Part of the Educational Administration and Supervision Commons, Educational PsychologyCommons, and the Psychology Commons
This Dissertation is brought to you for free and open access by the Walden Dissertations and Doctoral Studies Collection at ScholarWorks. It has beenaccepted for inclusion in Walden Dissertations and Doctoral Studies by an authorized administrator of ScholarWorks. For more information, pleasecontact [email protected].

Walden University
College of Social and Behavioral Sciences
This is to certify that the doctoral dissertation by
Loretta J. Morris Barr
has been found to be complete and satisfactory in all respects, and that any and all revisions required by the review committee have been made.
Review Committee
Dr. Donna Heretick, Committee Chairperson, Psychology Faculty Dr. Reba Glidewell, Committee Member, Psychology Faculty Dr. Stephen Hampe, University Reviewer, Psychology Faculty
Chief Academic Officer Eric Riedel, Ph.D.
Walden University 2019

Abstract
Person Factors Affecting Student Persistence
in College Reading and Writing Remediation
by
Loretta J. Morris Barr
MA, University of Akron, 2006
BA, Ashland University, 2000
Dissertation Submitted in Partial Fulfillment
of the Requirements for the Degree of
Doctor of Philosophy
Psychology
Walden University
May 2019

Abstract
The United States has the highest college attrition rate among industrialized nations.
Community college students face a much higher risk, particularly those who lack
requisite reading/writing skills. Using the theory of planned behavior and self-
determination theory, this study explored the relationship between persistence in college
for students in traditional or corequisite remediation. Person factors under study were
frustration discomfort, academic motivation, and self-reported symptoms of adult
attention-deficit hyperactivity disorder (ADHD). After 7 semesters, 72 adult student
volunteers from the 2 remediation programs were recruited from 2 community colleges.
They completed an online survey, which included a demographics questionnaire, the
Frustration Discomfort Scale, the Academic Motivation Scale, and the Adult ADHD
Self-Report Scale Symptom Checklist (ASRS-V1.1). Based on the results of Chi square,
t-test, and MANOVA analyses (as appropriate per research question), type of remediation
indicated a slight, albeit statistically nonsignificant effect on persistence. Persisters and
nonpersisters did not differ on frustration discomfort nor academic motivation. However,
persisters demonstrated significantly lower levels of adult self-reported ADHD symptoms
than those who did not persist. The positive social change implications of this study
include using the findings to promote early testing and diagnosis of ADHD, active
monitoring of students in remediation, and proactive (i.e., intrusive) advising for students
with this disability, in order to facilitate the best outcomes for their academic pursuits.

Person Factors Affecting Student Persistence
in College Reading and Writing Remediation
by
Loretta J. Morris Barr
MA, University of Akron, 2006
BA, Ashland University, 2000
Dissertation Submitted in Partial Fulfillment
of the Requirements for the Degree of
Doctor of Philosophy
Psychology
Walden University
May 2019

Dedication
This dissertation is dedicated to my amazing husband, Michael, for his love,
friendship, and absolute joy he brings to my life; to our children, Kara, Brady, Trent, and
Matthew, for their love, inspiration, encouragement, and friendship; and to my parents,
Arthur and Rilla Morris, who instilled in us a love of learning, the courage to question,
and the determination to pursue our dreams.
And to our beautiful grandchildren, in whose arms lie all our fondest hopes and
dreams for the future.

Acknowledgments
There have been many who have supported me in this journey. In addition to my
family, I would like to express my deepest gratitude and appreciation to my dissertation
chair, Dr. Donna Heretick, my mentor, guide, and role model, and whose constant
encouragement, support, and guidance helped this study reach completion; to my
dissertation committee members, Dr. Reba Glidewell and Dr. Stephen Hampe (URR),
who provided invaluable guidance; and to my classmates, for their constant
encouragement.
i
Table of Contents
List of Tables .......................................................................................................................v
List of Figures .................................................................................................................... vi
Chapter 1: Introduction to the Study ....................................................................................1
Introduction ....................................................................................................................1
Background of the Study ...............................................................................................3
Problem Statement .........................................................................................................5
Gap in the Literature ......................................................................................................8
Purpose of the Study ......................................................................................................9
Research Questions and Hypotheses .............................................................................9
Theoretical and Conceptual Framework for the Study ................................................12
Theoretical Foundation ......................................................................................... 12
Conceptual Framework ......................................................................................... 12
Definitions....................................................................................................................14
Assumptions .................................................................................................................16
Scope and Delimitations ..............................................................................................16
Limitations ...................................................................................................................18
Significance..................................................................................................................19
Summary ......................................................................................................................20
Chapter 2: Literature Review .............................................................................................22
Introduction ..................................................................................................................22
Literature Search Strategy............................................................................................24

ii
Search Terminology .............................................................................................. 25
Scope of Literature Reviewed ............................................................................... 25
Theoretical Foundation ................................................................................................26
Conceptual Framework ......................................................................................... 30
Key Statements and Definitions...................................................................................32
Literature Review Related to Key Variables and Concepts .........................................33
College Persistence and Attrition .......................................................................... 33
Remedial Education and Attrition ........................................................................ 36
Frustration Discomfort and Learning.................................................................... 46
Attention-Deficit Hyperactivity Disorder ............................................................. 52
Summary and Conclusions ..........................................................................................61
Chapter 3: Research Methods ............................................................................................63
Introduction ..................................................................................................................63
Purpose .........................................................................................................................64
Research Design and Rationale ...................................................................................65
Methodology ................................................................................................................67
Population ............................................................................................................. 67
Sampling and Sampling Procedures ..................................................................... 68
Procedures for Recruitment, Participation, and Data Collection .......................... 69
Informed consent .................................................................................................. 70
Population and Sample ......................................................................................... 70
Instrumentation and Operationalization of Constructs ......................................... 72

iii
Operationalization ................................................................................................. 77
Data Analysis Plan ................................................................................................ 79
Data Cleaning and Screening Procedures ....................................................................79
Research Questions ............................................................................................... 80
Analysis Plan ........................................................................................................ 83
Threats to Validity .......................................................................................................84
External Validity ................................................................................................... 84
Internal Validity .................................................................................................... 84
Ethical Procedures .......................................................................................................85
IRB Approval ........................................................................................................ 85
Treatment of Human Participants ......................................................................... 85
Summary ......................................................................................................................88
Chapter 4: Results ..............................................................................................................90
Introduction ..................................................................................................................90
Data Collection ............................................................................................................91
Participant Demographics ............................................................................................92
Results ..........................................................................................................................94
Assessments of Internal Reliability of Research Measure .................................... 94
Evaluating Assumptions for Analysis ..........................................................................96
Assumption of Normality ..................................................................................... 98
Assumption of Homogeneity of Variance ............................................................ 99
Hypotheses Testing ......................................................................................................99

iv
Research Question 1 ............................................................................................. 99
Research Question 2 ........................................................................................... 100
Research Question 3 ........................................................................................... 101
Research Question 4 ........................................................................................... 103
Research Question 5 ........................................................................................... 104
Summary ....................................................................................................................106
Chapter 5: Discussion, Conclusions, and Recommendations ..........................................107
Introduction ................................................................................................................107
Interpretation of the Findings.....................................................................................107
Type of Remediation........................................................................................... 108
Frustration Discomfort and Intolerance .............................................................. 108
Academic Motivation.......................................................................................... 108
ADHD ................................................................................................................. 109
Limitations of the Study.............................................................................................109
Recommendations ......................................................................................................111
Implications for Positive Social Change ....................................................................111
Conclusion .................................................................................................................113
References ........................................................................................................................115
Appendix A: Histogram of Amotivation Subscale ..........................................................130

v
List of Tables
Table 1. Participant Demographics ....................................................................................93
Table 2. Internal Reliability for Research Scales ...............................................................95
Table 3. Descriptive Statistics for Research Variables ......................................................97
Table 4. Frequency of Persistence Among Students in the Two Remediation Groups ...100
Table 5. Differences Between Persisters and Nonpersisters on Frustration Discomfort .101
Table 6. Differences Between Persisters and Nonpersisters on Academic Motivation ...102
Table 7. Frequency of Persistence Among Students in the Two Remediation Groups ...103
Table 8. Differences Between Persisters and Nonpersisters on Adult ADHD Self-Report
Symptoms ............................................................................................................104
Table 9. Mean Scores for Person Variables Among Persisters and Nonpersisters in the
Two Remediation Groups ....................................................................................105
Table 10. Results of 2 X 2 MANOVA for Overall Scores on the Person Variables .......106
vi
List of Figures
Figure 1. Research design model .......................................................................................66
Figure 2. Frustration Discomfort Scale excerpt .................................................................72
Figure 3. Academic Motivation Scale excerpt ...................................................................74
Figure 4. ASRS-V1.1 excerpt ............................................................................................76

1
Chapter 1: Introduction to the Study
Introduction
While the benefits of college education are many, the United States has the
highest college attrition rate among industrialized nations, creating cause for concern for
not only the individuals involved, but for society as a whole (Symonds, Schwartz, &
Ferguson, 2011, p. 18). For students in community colleges, the risk of attrition is much
higher, particularly among those who lack requisite skills for reading and writing at the
expected college level (Pruett & Absher, 2015). Students who test into
developmental/remedial education courses typically demonstrate significantly higher
attrition rates (Complete College America, 2012). Due to their inherent nature (i.e.,
guaranteed acceptance, certification and retraining programs, etc.), community colleges
tend to attract much higher numbers of students with skills deficits who are subsequently
enrolled in developmental/remedial education (i.e., courses intended to help students
reach college-level skills). National data from the 2013 Community College Survey of
Student Engagement (CCSSE) determined that 60% of the 400,000 students included in
the survey were classified as remedial/developmental students (Pruett & Absher, 2015, p.
34). Students enrolled in remedial reading and writing classes were 23.3% and 15.1% less
likely, respectively, to continue in college (Pruett & Absher, 2015, p. 37). While a
number of factors can influence student persistence, it is crucial to discover why students
in remedial reading and writing courses in particular are demonstrating such poor rates of
persistence and success in their attempts at college-level work. For the United States to
remain competitive in the world, it is critically important to examine and understand

2
these rates of attrition to ensure that students have the best opportunity for success with
their educational goals.
In this research, I explored potential factors influencing college student
persistence and success or attrition in developmental/remedial and corequisite reading
and writing courses in community colleges. The positive impact of college in the life of
individuals, and thereby, society as a whole, has been highly documented (Pascarella &
Terenzini, 2005). However, according to Bahr (2012), researchers have yet to determine
why students fail to develop the appropriate skills, particularly those most at risk –
students at the lower end of the skills spectrum – who tend to languish in remedial
courses and achieve the lowest rates of success (p. 661). While researchers have proposed
many reasons for the state of college attrition rates (Bean & Eaton, 2000; Roberts, 2012;
Tinto, 1993), they fail to completely ascertain the factors that influence attrition,
particularly among remedial reading and writing students who have the highest rates of
attrition (Bahr, 2012; Pruett & Absher, 2015). With this analysis, I sought to discover (a)
if frustration discomfort and intolerance affects college student persistence in remedial
reading and writing courses in the community college setting, (b) if motivation toward
such courses impacts student persistence in college, and (c) if learning disabilities such as
attention-deficit hyperactivity disorder (ADHD) could potentially affect
attrition/persistence decisions. Understanding factors that can affect persistence among
students with reading/writing deficits may inform ways to create more effective
interventions and outcomes for these students.

3
In this study, I considered of three key variables that may affect
persistence/attrition among community college students in remedial reading and writing
courses: diagnosed or undiagnosed adult ADHD, frustration discomfort and intolerance,
and types of motivation toward college in general. The results of this study are significant
in that while many different classroom contexts and possible outcomes have been
extensively studied, as well as various causes of college attrition (Pruett & Absher, 2015),
these factors that have not yet been addressed. Through better understanding of the
possible role of these factors, college faculty, advisors, counselors, administrators, and
other stakeholders may investigate avenues to address such frustration and attitudes to
prevent and/or intervene in attrition from college.
In this chapter, I provide background information and purpose for the analysis,
and describe and outline the study. Further, basic definitions, concepts, theoretical
framework, and variables are provided. The section concludes with discussions of the
scope and limitations of the analysis, and a transition to Chapter 2.
Background of the Study
The benefits of college education have long been established, including higher
income over the course of an individual’s career, higher occupational status related to the
degree or certification, and conferral of benefits on future generations of those who
complete college, all of which have obvious further implications for society in general
(Pascarella & Terenzini, 2005). In addition to career skills, students gain verbal,
quantitative, as well as cognitive and intellectual skills, including critical thinking and
decision-making skills, with long-term effects of college demonstrating 20%–40%

4
socioeconomic gains over the course of the lifetime (Pascarella & Terenzini, 2005). Yet,
despite expectations of achieving a college education in the United States, only 4% of
students in the United States complete associate degrees within the expected timeframe at
2-year/community colleges (Complete College America, 2015b). Once the duration
extends beyond the standard timeframe, attrition increases drastically, with over 70% of
community college students failing to complete their programs in 3 years (U.S.
Department of Education, 2015). Many of these students are among the 60–75% of
students who test into remedial (i.e., non-credit) courses (Hodara, 2015, Pruett & Absher,
2015). Once students enter remedial/developmental reading and/or writing courses,
completion rates drop 23.3% and 15%, respectively, which has prompted many to
question the perception of languishing in these courses (Pruett & Absher, 2015).
Furthermore, studies have long connected the potential for reading and writing
difficulties among those with ADHD (Willcutt & Pennington, 2000). Bilkey, Surman,
and Weintraub (2014) reported that only 1 in 10 individuals who are suffering with
ADHD are actually diagnosed, while less than half of those diagnosed receive no
accommodations for the disability (Oguntoyinbo, 2012). Those with ADHD typically
suffer from lack of emotional self-regulation, including frustration intolerance (Burns &
Martin, 2014). While frustration discomfort and intolerance have been investigated
related to grade point average (GPA; Wilde, 2012)], these factors have not been
addressed as potential mediators in college attrition among those in
remedial/developmental education and corequisite remedial reading and writing courses
at community colleges in the United States. The purpose of this study was to investigate

5
this potential connection through the administration of self-report surveys to remedial
reading and writing and corequisite remediation students at community colleges in an
attempt to determine if undiagnosed ADHD, frustration intolerance, and type of
motivation play a role in persistence or attrition. This connection could provide
accommodations to students who may otherwise walk away from the benefits of a college
education, in part due to a disability that is protected under the Individuals with
Disabilities Education Improvement Act (IDEA; 2006).
Problem Statement
As previously stated, the benefits of a college education are numerous; however,
the college attrition rate in the United States is the highest among industrialized nations
(Symonds, et al., 2011, p. 18). The implications of this phenomenon are obvious, creating
social and economic repercussions for all concerned. While multiple factors have been
examined, no researcher has yet investigated frustration discomfort and intolerance,
motivation, and potential ADHD as mediating factors for success in and completion of
college programs among individuals in developmental/remedial reading and writing
courses as well as those in corequisite remediation.
In a comprehensive analysis from the CCSSE, Pruett and Absher (2015) reported
that approximately 60% of community college students are classified as college-level
skills deficient (i.e., developmental/remedial), requiring enrollment in one or more
classes intended to increase requisite skills. Hodara (2015) found much higher levels of
remediation at 75%. Additionally, Hern (2012) demonstrated that of 57 community
colleges surveyed, more than 90% of students who demonstrated below-college skill

6
levels were eliminated while still in remediation, after developing a sense of hopelessness
about their academic abilities while noticeably languishing in remedial courses.
McMahon (2015) suggested focusing on remedial/developmental courses to increase
persistence and success, while Bahr (2012) opined that reducing or eliminating the time
spent in remediation was “a structural barrier to college-level skills attainment” (p. 663).
These findings from the literature clearly demonstrate the need for further investigation
as to why courses that are intended to increase college skills and success potential are
actually a barrier that increases attrition. Corequisite courses (i.e., college level courses
with tutoring or required labs included) have been introduced as an attempt to alleviate
this barrier (Adams, 2017). I included for comparative purposes in this study.
The first person aspect examined in this analysis was that of potential frustration
discomfort and intolerance among students in remedial/development courses. Frustration
discomfort has been widely demonstrated to impact achievement and goals attainment,
including academic functions and pursuits. Wilde (2012) found that frustration
intolerance and needs frustration (both of which are aspects of frustration discomfort)
contributed significantly to in mediating GPA, demonstrating that GPA drops as
frustration discomfort factors increase. Sierpinska, Bobos, and Knipping (2007) indicated
that over 40% of students in remedial math sequences are negatively impacted by
frustration in their learning experiences. In online courses, Capdeferro and Romero
(2012) analyzed learning and the collaborative process, where 60% of their participants
indicated frustration negatively affected their perception of the experience. These results

7
provided further impetus for studying this factor in persistence among community college
student in remedial reading and writing courses.
Also central to persistence and development is the type of motivation that prompts
individuals to set and pursue goals, as in the pursuit of college programs (Deci & Ryan,
2008). With this in mind, I also examined academic motivation to determine if the
predominant type of motivation, (i.e., intrinsic/extrinsic/amotivation) plays any role in
persistence or attrition from college during remedial reading or writing courses.
According to Maurer, Allen, Gatch, Shankar, and Sturges (2013), motivation is part of a
continuum, with intrinsic motivational factors being the most inherently motivating,
extrinsic factors more central, and the absence or lack of motivation – amotivation – as
the opposing end of the continuum. Lee, Pate, and Cozart (2015) described college
student motivation as a critical factor related to persistence/attrition decisions. Further,
Martin, Galentino, and Townsend (2014) state that student motivation is a clear indicator
of success among community college students (measured in terms of persistence).
Including this factor in this study allowed me to examine another important factor for
student persistence in remedial/developmental or corequisite reading and writing courses.
The final factor I examined for this study which could provide further insight into
remedial/developmental success or attrition was that of ADHD. This disorder is
characterized by inattention, poor impulse control, difficulty in concentrating, and high
levels of distractibility over a period of time (Zimbardo, Johnson, & McCann, 2014).
Nearly 25% of students with disabilities did not return after their first year in college,
while nearly 51% did not return after their second year, with ADHD comprising 17.3% of
8
disability diagnoses (Mamiseishvili & Koch, 2011). An estimated 50% or fewer of
students with diagnosed learning disabilities actually report the disability and/or utilize
any available resources, while many students with ADHD diagnoses do not receive (or
take advantage of) accommodations and support provided by colleges, despite learning
disabilities nearly doubling from 2001-2009 (Oguntoyinbo, 2012; U.S. Government
Accountability Office, 2009). According to Alao (2015), few studies have analyzed adult
ADHD and its implications among college students, leading to questions as to how this
potentially relates to attrition. Characteristics of ADHD include lack of impulse control
and emotional regulation, generally influencing the individual’s ability to adapt to
changing situations and challenges, which is potentially associated with frustration as
well as motivation in college completion (Burns & Martin, 2014; Kearns & Ruebel,
2011). Further, Stamp, Banerjee, and Brown (2014) reported that 75% of students with
diagnosed ADHD had difficulties meeting the demands of college, feeling inadequate in
accomplishing their work and unable to ask for help, providing additional potential
mediating factors in college success and completion in remedial/developmental courses.
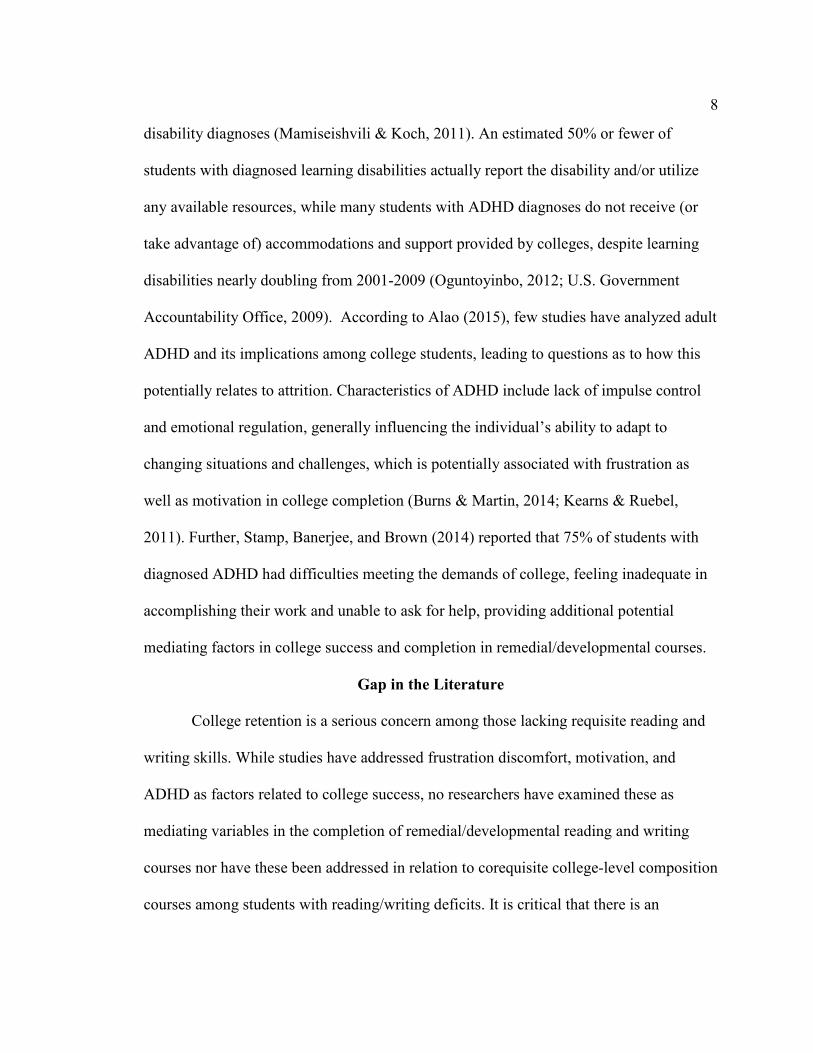
Gap in the Literature
College retention is a serious concern among those lacking requisite reading and
writing skills. While studies have addressed frustration discomfort, motivation, and
ADHD as factors related to college success, no researchers have examined these as
mediating variables in the completion of remedial/developmental reading and writing
courses nor have these been addressed in relation to corequisite college-level composition
courses among students with reading/writing deficits. It is critical that there is an

9
understanding of these factors, to better ensure student success in college and offer an
improved future for these individuals, their families, and society as a whole.
Purpose of the Study
As stated, according to Pruett and Absher (2015) and Complete College America
(2012), student persistence in remediation is a significant problem in the United States. In
this quantitative study, I investigated the type of remediation, frustration discomfort,
motivation, and ADHD as factors that are potentially related to outcomes (i.e,
persistence/attrition) in remedial/developmental reading and writing courses in
community colleges. I utilized self-report survey methodology and a cross-sectional
strategy to assess frustration discomfort, motivation, and ADHD as mediating variables
for the prediction of academic persistence or attrition among students attending one of
two types of remediation for college reading/writing skills deficiencies.
Research Questions and Hypotheses
The final research questions and hypotheses (modified due to changes in
statistical analyses related to smaller sample sizes; see Chapter 4) addressed by this study
were:
Research Question 1: Does type of intervention for reading/writing skill deficits
predict the likelihood of persistence and/or retention among college students
receiving the intervention?
H01: Type of intervention for reading/writing skill deficits does not predict
the likelihood of persistence and/or retention among college students
receiving the intervention.

10
H11: Type of intervention for reading/writing skill deficits significantly
predicts the likelihood of persistence and/or retention among college
students receiving the intervention.
Research Question 2: Do persisters and nonpersisters among college students receiving
an intervention for reading/writing skill deficits differ in frustration discomfort, as
measured by the Frustration Discomfort Scale (Harrington, 2005)?
H02: Persisters and nonpersisters among college students receiving an
intervention for reading/writing skill deficits do not differ in frustration
discomfort, as measured by the Frustration Discomfort Scale (Harrington,
2005).
H12: Persisters and nonpersisters among college students receiving an
intervention for reading/writing skill deficits differ significantly in
frustration discomfort, as measured by the Frustration Discomfort Scale
(Harrington, 2005).
Research Question 3: Do persisters and nonpersisters among college students receiving
an intervention for reading/writing skills deficits differ in motivation, as measured
by the Academic Motivation Scale (Vallerand et al., 1992)?
H03: Persisters and nonpersisters among college students receiving an
intervention for reading/writing skills deficits do not differ in motivation,
as measured by the Academic Motivation Scale (Vallerand et al., 1992).

11
H13: Persisters and nonpersisters among college students receiving an
intervention for reading/writing skills deficits differ significantly in
motivation, as measured by the Academic Motivation Scale (Vallerand et
al., 1992).
Research Question 4: Do persisters and nonpersisters among college students
receiving an intervention for reading/writing skill deficits differ in adult self-
reported ADHD as measured by the Adult ADHD Self-Report Scale Symptom
Checklist (Kessler et al., 2005)?
H04: Persisters and nonpersisters among college students receiving an
intervention for reading/writing skill deficits do not differ in self-reported
adult ADHD as measured by the Adult ADHD Self-Report Scale
Symptom Checklist (Kessler et al., 2005).
H14: Persisters and nonpersisters among college students receiving an
intervention for reading/writing skill deficits differ significantly in self-
reported adult ADHD as measured by the Adult ADHD Self-Report Scale
Symptom Checklist (Kessler et al., 2005).
Research Question 5: Do persisters and nonpersisters in the two remediation
programs differ on person variables?
H05: Persisters and nonpersisters in the two remediation programs do not
differ on person variables.
H15: Persisters and nonpersisters in the two remediation programs differ
significantly on person variables.

12
Theoretical and Conceptual Framework for the Study
Theoretical Foundation
Ajzen’s (1991) theory of planned behavior, built on the foundation of Fishbein
and Ajzen’s (1975) theory of reasoned action, relates attitudes with behavior to predict
individual behavior. In college, individuals may have varying expectations of outcomes
that will affect their motivation of effort toward goals and potential outcomes, such as
course or program completion (Wheeless, Witt, Maresh, Bryand, & Schrodt, 2011). Self-
determination theory further grounded this study by being used to address internal
motivation within individuals that focuses them toward goals and achievements in their
lives, as in furthering education, providing a better future for themselves, etc. (Deci &
Ryan, 2000). These theories provided me with a logical foundation in this study by
addressing factors that initiate and prompt continuation of behaviors toward goals, such
as college education, and providing me with an opportunity to understand factors that
might impede progress toward such goals, as with college persistence or attrition
decisions. These theories will be described in greater detail in Chapter 2.
Conceptual Framework
Despite many obvious benefits, the United States has the highest college attrition
rate among developed nations of the world, particularly in community colleges (Symonds
et al., 2011). In an attempt to understand the college attrition phenomenon, Tinto (1975)
developed a sociological model of departure from college, which continues to be used
widely among researchers (Bergman, Gross, Berry, & Shuck, 2014; Shepler & Woosley,
2012). Adding psychological factors, Bean and Eaton (2000) offered a psychological

13
model of attrition in an attempt to more fully address psychological factors that students
face when determining whether to persist or to leave; their model has been used in
research such as Johnson, Wasserman, Yildirim, and Yonai (2014). In order to give a full
picture of the factors that affect student attrition from college, Roberts (2012) integrated
both Tinto’s sociological model with Bean and Eaton’s psychological models to develop
a comprehensive model of college student attrition, that addressed factors that influence
persistence/attrition decisions in college. This framework provided me with an
appropriate basis for this study because I developed this study and its research questions
directly investigate the complex factors related to student success in college
remedial/developmental courses. This framework will be described in detail in Chapter 2.
Nature of the Study
In this study, I used a one-time, self-reported online survey of community college
students who tested into remediation in reading and writing. Students were recruited early
in the semester via e-mail as well as in course classrooms. Survey methodology was both
appropriate and consistent with other studies that investigated the same or similar factors
in education as well as among college students. Similar studies using survey
methodology include Wilde’s (2012) analysis of frustration discomfort and GPA using
Harrington’s (2005) Frustration Discomfort Scale; Koludrović and Ercegovac’s (2015)
study of academic motivation among education majors, using Vallerand et al.’s (1992)
Academic Motivation Scale; as well as Kessler et al.’s (2005) Adult ADHD Self-Report
Scale Symptom Checklist, which has been used by the World Health Organization and
other healthcare professionals. For my study, I anticipated using binary logistic

14
regression, consistent with mediating variables in predictive analyses, as with Bahr
(2012); Bremer et al. (2013); DeNicco, Harrington, and Fogg (2015); Pruett and Absher
(2015); etc. However, due to small sample size, this plan was altered with the permission
of my dissertation committee. Analysis was conducted through SPSS, in accordance with
the standard of data analysis in the social sciences.
Definitions
In this study, key terms include:
Academic motivation: Students’ motivation for coursework and to achieve overall
educational goals, affecting the quantity and quality of effort expended toward the goal
(Koludrović & Ercegovac, 2015).
Attention-deficit/hyperactivity disorder (ADHD): A psychoneurological
behavioral disorder that is characterized by inattention, poor impulse control, difficulty in
concentrating, and high levels of distractibility over a period of time (American
Psychiatric Association, 2013). ADHD is notably problematic for individuals in
completing educational goals, whether in elementary, secondary, or postsecondary (i.e.,
college) education (Boyd & Bee, 2012; Zimbardo et al., 2014).
Attrition: The active or passive decision individuals makes to leave, withdraw, or
fail in some way to complete their educational goals (Pruett & Absher, 2015, p. 32).
Attrition is a critical concern not only due to the fact that college offers so many benefits
for individuals and society as a whole, but also because the United States has the highest
college attrition rate among developed countries (Pascarella & Terenzini, 2005; Symonds
et al., 2011).

15
Frustration: An emotional response to opposition, as with a perceived obstacle to
or inability to achieve a goal (Harrington, 2005).
Frustration discomfort: The degree of distress or intolerance for opposition or
perceived obstacles (Harrington, 2005).
Learning disabilities: A group of disorders that are potentially complicating
factors in educational goal attainment and demonstrated by difficulties in speaking,
listening, reasoning, reading, writing, or mathematical capabilities and the organization of
information, creating difficulties in the learning process if taught using conventional
methods (Boyd & Bee, 2012; Gormley et al., 2015; Hammill, Leigh, McNutt, & Larsen,
1989; Santrock, 2011).
Persistence: The determination to remain with a course of action despite
complications or impediments to goal achievement, which in the case of this study,
involved completion of remedial/developmental courses toward conclusion of an
individual’s educational goals, such as college program or degree (Pruett & Absher,
2015). In higher education, students who continue in their programs and receive
certification or degrees will not only increase their opportunities for success personally
and professionally, but ultimately for their families and society as a whole (Tinto, 2004).
Relatedly, this success increases retention levels for their respective educational
institutions, a critical factor for the higher education industry (Pruett & Absher, 2015;
Tinto, 2004).

16
Reading/writing skills deficits: Lacking requisite skills deemed necessary to
successfully complete college courses as determined by standard college entrance testing
or prior educational achievement (Bahr, 2012; Pruett & Absher, 2015).
Remediation: Any course-based strategy designed to assist students in acquiring
requisite college-level skills, focused in this research on reading and writing (Complete
College America, 2012; Pruett & Absher, 2015).
Assumptions
Inherent in any study are associated assumptions. For this study, I assumed that
participants would provide truthful, accurate data that would inform the research
questions and provide insight into attrition so that identified factors could be addressed.
No socially sensitive questions were asked; however, I did ask questions about person
factors related to frustration discomfort and ADHD that could have made some low self-
disclosure participants uncomfortable and aware of the perceived stigma attached to
ADHD. To help avoid this, participants were given minimal information, without
deception, to begin the survey and were fully debriefed following the survey. As any
study can face similar potential factors, these were considered minimal and normal in the
implementation of self-report survey instrumentation.
Scope and Delimitations
Scope and delimitations are the boundaries for the study, set to provide reasonable
structure and controls over the extent and objectives of the study (Simon & Goes, 2013).
It is well established that college attrition is a serious concern for the United States
(Complete College America, 2015; Pruett & Absher, 2015; Symonds et al., 2011). I

17
formulated this study to analyze the person factors of frustration discomfort, motivation,
and potential ADHD among community college students who tested below requisite
skills and were placed into reading, writing, and corequisite English courses for skills
development. Attrition from these courses is significant and problematic for not only the
students, but for colleges and society as a whole, so it was logical to attempt to address
these factors (Complete College America, 2015; Pascarella & Terenzini, 2005). Student
frustration in courses has been expressed in a variety of settings and demonstrated to
affect success and completion, yet not in remediation (Wilde, 2012). Motivation has long
been known to determine the degree of effort expended toward goal attainment, which
justifies its inclusion in this study (see Deci & Ryan, 2000; Koludrović & Ercegovac,
2015). Additionally, ADHD is recognized to generate further difficulties in the learning
process, including increased frustration, inattention, and reduced motivation toward
goals; yet no studies have addressed this as a confounding factor affecting remedial
course completion (Zimbardo et al., 2014).
I included adults only in the study due to analysis of adult ADHD among
participants, as well as ethical concerns regarding research including children.
Additionally, since the majority of skills-deficit students enroll in 2-year community
colleges for skills remediation, this was the appropriate place to conduct the study
(Complete College America, 2014; Pruett & Absher, 2015). Two, small, Midwestern
community colleges participated in the study. All students in remediation in reading and
writing comprised the participant pool, whether in traditional or corequisite courses.

18
Generalizability of results is contingent upon several factors. First, both
participant colleges were located in small Midwestern communities that serve relatively
rural populations. The population of Community A was slightly under 50,000, and
comprised of 87.6% non-Hispanic White, 9.5% Black, 1.7% Hispanic, and less than 1%
each of other races; the median household income was $42,042, with 15.9% of the
population in poverty (U.S. Census Bureau, 2015a). Community B was comprised of
slightly less than 70,000 individuals, of which 91% were non-Hispanic White, 6.4%
Black, 2.4% Hispanic, and other races comprised less than 1% each; median income was
listed at $42,904, with a poverty rate of 21.3% (U.S. Census Bureau, 2015b).
Comparatively, the United States average is 77.4% Non-Hispanic White, 13.2% Black,
17.4% Hispanic, 5% Asian, 1.2% American Indian/Alaskan Native, with other races less
than 1% each; median income is $53,482 (U.S. Census Bureau, 2016). While similar in
demographic information, these colleges provided data that may not be generalizable to
the United States as a whole; however, they provided significant information for these
colleges as well as a basis for further study.
Limitations
The limitations of the study include comparative demographic differences
between the Midwest and the United States in general, as I previously discussed.
Additionally, the small/limited sample sizes used in this study may not express the true
diversity of the colleges, another factor in generalizability. Furthermore, while I
attempted to include all students in reading/writing remediation, whether traditional
remedial courses or in corequisite courses, I employed convenience sampling, which may

19
not be generalizable to the population as a whole. Ultimately, the final group of
participants was quite small (N = 72), which implies further research for replication of
results. However, the results of this study still provided useable data for participating
colleges and can serve as a basis study for replication with larger, more diverse
populations. Moreover, since participants were tracked for persistence, those who failed
to persist in courses may have done so for a variety of complex factors related to attrition,
such as economic factors, family or job considerations, etc., all of which may be
unknowable or unmeasurable. Nonetheless, the factors examined could provide valuable
information as to the nature of the attrition. For example, many students persist through
difficult and trying circumstances, but others may leave for comparatively minor reasons;
all of these circumstances may well be related to the factors being examined, still
providing valuable data for consideration.
Significance
Potential contributions of this study include a wide array of benefits. First, the
results of this study will assist in addressing factors related to college persistence and
completion. As I previously discussed, college attrition in the United States is an
epidemic, with many studies conducted on the issues, yet few answers to the problem.
With information from this study, colleges can improve course instruction to address
student person factors of frustration and motivation, helping streamline course processes
and eliminating factors that can raise frustration levels and reduce motivation. The data
from this study can also be used to mentor students in understanding and better
addressing these factors in themselves, potentially raising persistence rates. Furthermore,

20
because ADHD be identified as a factor in attrition, individuals and institutions can be
better prepared to diagnose and accommodate this disability as guaranteed by the United
States Individuals with Disabilities Education Act of 2004 (U.S. Department of
Education, 2004).
The findings of this study will also help address additional factors related to
remedial education attrition. This will help better provide for the benefits of a college
education for individuals and their families, including self-esteem and satisfaction as well
as socioeconomic benefits over the course of the lifetime. These benefits extend to
society as a whole, with higher incomes and better standards of living for all concerned.
The factors addressed in this study provide obvious implications for social
change, first by offering better opportunities for success among individuals with
disabilities through better diagnosis and accommodations for such disabilities. Using the
results of this study, individuals with ADHD can be appropriately supported so that they
can complete their educational goals, while educators can remove the barriers that
impede their progress. Removing such barriers and improving success rates among these
students can change not only the course of their lives, but that of their families, their
communities, and the nation as a whole. College completion is in crisis in the United
States, and there is a critical moral and ethical imperative to confront this crisis, which I
address with the current study.
Summary
In this chapter, I provided background information and the purpose for the study,
as well as described and outlined the study. Basic definitions, concepts, theoretical

21
framework, and variables were provided. The section concluded with discussions of the
scope and limitations of the analysis and implications for social change. Chapter 2
follows, in which I will provide an extensive review of literature that provides the
theoretical foundation and conceptual framework for this study, and extensive discussion
of terms and concepts that were part of the analysis.

22
Chapter 2: Literature Review
Introduction
The United States has the highest college attrition rate among industrialized
nations (Symonds et al., 2011, p. 18). For students in community colleges, the risk or
attrition is much higher (Pruett & Absher, 2015). Students who test into
developmental/remedial education courses typically demonstrate low completion rates
(Complete College America, 2012). Community colleges tend to have much higher rates
of students with skills deficits who are enrolled in developmental/remedial education
(courses intended to help students reach college-level skills). National data from the 2013
CCSSE determined that 60% of the 400,000 students included in the survey were
classified as remedial or developmental students (Pruett & Absher, 2015, p. 34). Students
enrolled in remedial reading and writing classes were 23.3% and 15.1% less likely,
respectively, to continue in college (p. 37). While a number of factors can influence
student persistence, and for the United States to remain competitive in the world, it is
crucial to continue to examine college attrition rates and discover why students in
remedial reading and writing courses in particular are demonstrating such poor rates of
persistence in their attempts at college-level work. This will help ensure that students
have the best opportunity for success with their educational goals.
In this study, I explored potential factors influencing college student persistence
and success or attrition in developmental/remedial reading and writing courses in
community college in order to provide better opportunities for skill development and

23
ultimately, success in students’ college-related goals. The positive impact of college in
the life of individuals, and thereby, society as a whole, is highly documented (Pascarella
& Terenzini, 2005). However, according to Bahr (2012), researchers have yet to
determine why students fail to develop the appropriate skills, particularly students at the
lower end of the skills spectrum, those who are most at risk and tend to languish in
remedial courses and achieve the lowest rates of success (p. 661). While researchers have
proposed many reasons for college attrition (Bean & Eaton, 2000; Roberts, 2012; Tinto,
1993), they fail to ascertain the person factors that influence attrition, particularly among
remedial reading and writing students who have the highest rates of attrition (Bahr, 2012;
Pruett & Absher, 2015). In this study, I sought to discover (a) if frustration discomfort
and intolerance affects college student attitudes toward remedial reading and writing
courses in the community college setting, (b) if attitude orientation toward such courses
impacts student motivation to persist in college, and (c) if diagnosed learning disabilities
such as ADHD (American Psychological Association, 2013) could potentially mitigate
attrition/persistence decisions. Traditional remediation has been demonstrated to decrease
persistence and corequisite remediation has increased persistence (Adams, 2017). This
factor was included as part of this study to determine if this was a significant factor in
persistence for these participants, or if other factors affected persistence.
In this study, I considered three key variables that could moderate attrition/
persistence among community college students in remedial reading and writing courses.
First, diagnosed and undiagnosed learning disabilities (i.e., ADHD), as I previously
discussed, can impose significant barriers to success in college. Additionally, frustration

24
discomfort and intolerance can hinder progress through the perception of roadblocks in
the path toward college completion. Finally, academic motivation can determine attitude
orientation toward remedial courses among students. Once determined, these factors can
be addressed, and in particular, if undiagnosed or unaccommodated learning disabilities
are implicated for students, further assistance can be offered, based in United States law
(Individuals with Disabilities Education Improvement Act, 2006).
Many different classroom contexts and possible outcomes have been extensively
studied, as well as various causes of college attrition (Pruett & Absher, 2015). This study
is significant in that the factors of frustration discomfort and intolerance and academic
motivation toward developmental/remedial reading and writing courses as potential
contributors to higher attrition among students involved in these courses over their math
counterparts have not yet been addressed. Through better understanding of the possible
role of these factors, college faculty, advisors, counselors, and other stakeholders may be
able to develop avenues to address these issues in order to intervene and potentially
prevent attrition from college. In this chapter, I will present the strategies used and scope
of this review of the literature, the theoretical foundation and conceptual framework for
the study, and a chapter summary, with a transition to Chapter 3.
Literature Search Strategy
As is customary, I undertook a comprehensive review of literature on the topic
preceding research for this study. Databases accessed included Academic Search
Complete, Communication & Mass Media Complete, Education Research Complete,
ERIC, Primary Search, PsycARTICLES, PsycBOOKS, PsycEXTRA, PsycINFO,

25
Psychology and Behavioral Sciences Collection, SocINDEX with Full Text, Sociological
Collection, Teacher Reference Center, PsycTESTS, and ProQuest Central. Resources
were accessed through search engines, databases, and literature repositories including the
American Psychological Association, Google Scholar, The Ohio State University system,
OhioLINK, and Walden University.
Search Terminology
The search terminology, in various combinations and configurations consistent
with the scope of this investigation, included developmental education, remedial
education, persistence, attrition, course withdrawal, college departure, emotion, self-
regulation, frustration, academic motivation, and attention-deficit hyperactivity disorder
(ADHD). Additional search terminology that I used related to college, community
college/s, college students, classes, courses, remedial education courses/classes, and
developmental education courses/classes, also in various combinations and
configurations. These concepts and terms were consistent with the literature and practice
in the field of higher education and provided a comprehensive analysis of the topic.
Scope of Literature Reviewed
The literature I reviewed for this analysis includes seminal work on planned
behavior (Ajzen, 1980) and self-determination (Deci & Ryan, 2000; Ryan & Deci, 2000),
as well as landmark analyses on college student attrition, beginning with Tinto’s (1975)
sociological factors implicated in student departure from college education. Years
searched include seminal works beginning in 1975 through the present, focusing
primarily on material published in the past 5 years and important studies that provide

26
insight and frame this study. The literature reviewed emphasizes college attrition and
persistence, primarily in remedial/developmental education, frustration, motivation, and
their implications for the college education process. Further findings included
information on attitudes and motivation as related to developmental/ remedial courses
and their effects on persistence or attrition. Additional work encompassed current
research on learning disabilities and their effects on the learning process. All literature
reviewed was from peer-reviewed journals and studies, as well as professional and edited
works. While there is a great deal of extant literature related to persistence and attrition in
college as well as the problem of attrition related to developmental/remedial/corequisite
courses, I found no research that investigated frustration discomfort, academic
motivation, or ADHD as factors for attrition in developmental/remedial/corequisite
courses, which were the bases for my study.
Theoretical Foundation
Ajzen’s (1980) theory of planned behavior was the theoretical foundation for this
study. This theory was built on the foundation of Fishbein and Ajzen’s (1975) theory of
reasoned action, and describes the relationship between attitudes and behavior to predict
individual behavior based in existing attitudes and intentions (Ajzen, 1980). According to
the theory, an individual’s decision to engage or continue in any particular behavior is
based on the expected outcome of the behavior (Ajzen, 1980). In the case of college
education, individuals may have varying expectations of outcomes, from low or
ambiguous to high expectations of educational, career, or personal success. Coupled with
various attitudes, ranging from fear and anxiety to confidence, these factors combine to

27
explain motivation and degree of effort expended toward potential outcomes. For college
students, this applies in relation to their motivation to register for college and the various
courses required as well as their expectations for their futures, from degree or program
certification to career and personal success in life. This theory has been used to describe
intent and motivation in a variety of situations such as business-related decisions, health
behaviors, consumption behaviors, buying behaviors, etc., and notably, has been used to
describe and predict persistence/attrition behaviors among college students, as in
Wheeless et al.’s 2011 study. In their study, the researchers noted connections between
various instructor characteristics and student persistence, providing evidence that this
theory provides a solid foundation for understanding factors that influence students’
choice of goals as well as those factors that could impede their progress and their
continuing motivation toward intended outcomes.
Self-determination theory further grounded this study by being used to address
individuals’ innate tendencies toward growth and fulfillment and the psychological needs
that explain various motivation and personality factors (see Deci & Ryan, 2000; Ryan &
Deci, 2000). Self-determination theory suggests that motivation ranges from controlled
regulation (i.e., necessity of action for specific purposes, as in extrinsic motivation) to
autonomous motivation (i.e., action based in the reward of the action itself, as with
intrinsic motivation; Deci & Ryan, 2000; Ryan & Deci, 2000). This theory explains
inherent motivations within individuals that focus on that which drive them toward goals
and achievements in their lives, purely from an internal perspective, sans external
influences and interference (Deci & Ryan, 2000; Ryan & Deci, 2000). For example, Lee,

28
Pate, and Cozart (2015) described student motivation related to persistence/attrition
decisions based in this theory, further grounding the current study of potentially
mitigating factors that could impede individual progress toward achievement of college
and career goals. Also consistent with my use of this theory in this study was Simon,
Aulls, Dedic, Hubbard, and Hall (2015), who grounded their analysis of student
persistence in science, technology, engineering, and math programs in self-determination
theory, describing various factors that influence students’ motivation to continue in their
programs, and demonstrating that this theory is appropriate and consistent with research
concerned with student persistence and decisions to persist or depart from college or
educational programs.
Inextricably tied to self-determination theory is the factor of motivation in
determining degree of success (or lack thereof) in college. Motivation research focuses
“… on the conditions and processes that facilitate persistence, performance, healthy
development, and vitality in our human endeavors (Deci & Ryan, 2008, p. 14). As stated
by Maurer et al., (2013), motivation is represented along a continuum, with intrinsic
motivational factors being the most motivating and self-determined, extrinsic factors
falling near the center; and amotivation, the absence of intention and motivation, falling
opposite of intrinsic motivation (p. 77-78). Since motivation is vital for college success,
not only the degree of motivation, but also the type of motivation provides insight into
success or attrition. Students can be motivated by the intrinsic enjoyment and satisfaction
of learning; the extrinsic rewards, both immediate (good grades) and long-term (desired
career); or lack of punishment (poor grades or failure). Using the Academic Motivation

29
Scale, researchers determined that motivation affects all types of classes taken by
students; however, the type of course (e.g., a foundational course) may influence the type
of motivation that students experienced, with intrinsic and extrinsic motivation providing
positive course results (i.e., grades) with amotivation providing more negative results
(Vallerand et al., 1992). Additionally, Moore (2006) discussed students’ motivations as
related to their success in introductory biology courses, and found that, when comparing
students’ perception of their performances with their actual performances, students’
intent, compared with their actual performances varied widely, with the common factor
determined to be academic motivation. In a different study, Moore (2007) again
examined similar patterns among developmental students and which factors could
enhance success in these courses. Those students who were most motivated participated
in success-building opportunities related to their courses, while others, who would
presumably be similarly motivated due to their academic probation status, did not
participate in these activities despite being least successful, based in lack of academic
motivation (Moore, 2007). Furthermore, Martin et al. (2014) stated that motivation is a
clear indication of success among community college students (measured in terms of
persistence). In their qualitative analysis, the researchers examined success-related
factors for 2-year community college students, the greatest factor was a strong sense of
motivation, which was a point of interest for the current study. Moreover, Miller and
Sundre (2008) investigated academic motivation through attitudes in a comparison
between students’ academic major courses and general education courses required by the
institution. Using self-report survey data, these researchers evaluated types of motivation
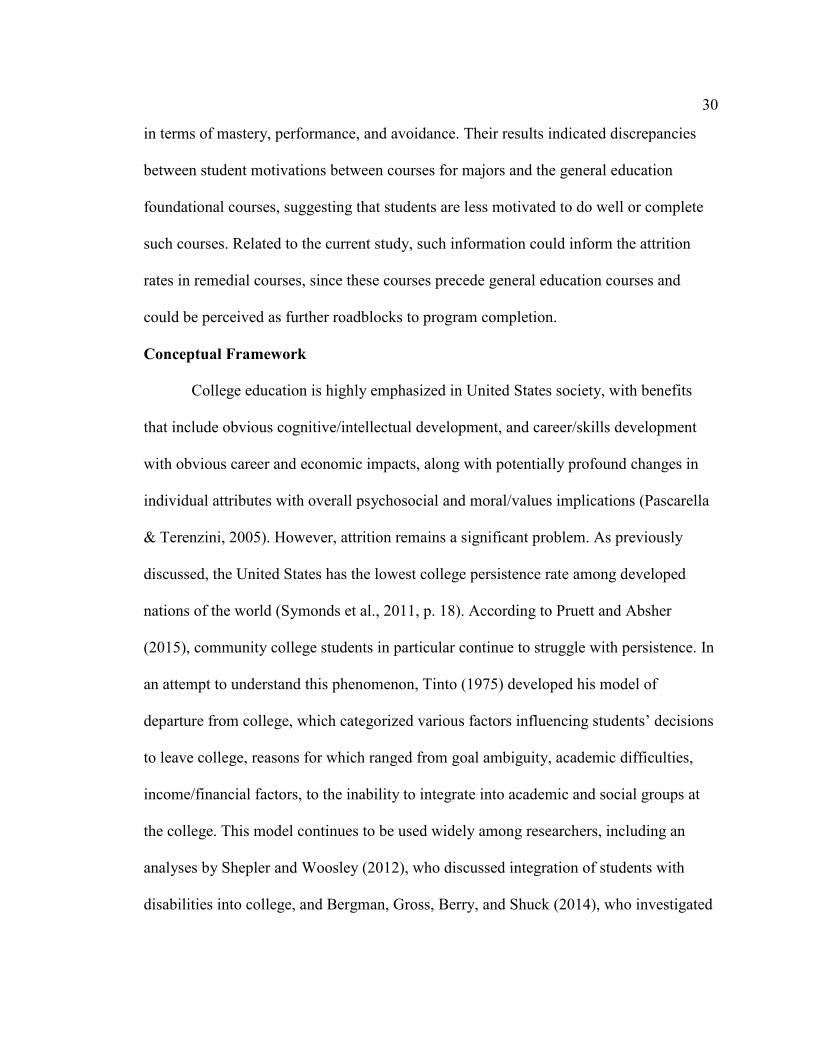
30
in terms of mastery, performance, and avoidance. Their results indicated discrepancies
between student motivations between courses for majors and the general education
foundational courses, suggesting that students are less motivated to do well or complete
such courses. Related to the current study, such information could inform the attrition
rates in remedial courses, since these courses precede general education courses and
could be perceived as further roadblocks to program completion.
Conceptual Framework
College education is highly emphasized in United States society, with benefits
that include obvious cognitive/intellectual development, and career/skills development
with obvious career and economic impacts, along with potentially profound changes in
individual attributes with overall psychosocial and moral/values implications (Pascarella
& Terenzini, 2005). However, attrition remains a significant problem. As previously
discussed, the United States has the lowest college persistence rate among developed
nations of the world (Symonds et al., 2011, p. 18). According to Pruett and Absher
(2015), community college students in particular continue to struggle with persistence. In
an attempt to understand this phenomenon, Tinto (1975) developed his model of
departure from college, which categorized various factors influencing students’ decisions
to leave college, reasons for which ranged from goal ambiguity, academic difficulties,
income/financial factors, to the inability to integrate into academic and social groups at
the college. This model continues to be used widely among researchers, including an
analyses by Shepler and Woosley (2012), who discussed integration of students with
disabilities into college, and Bergman, Gross, Berry, and Shuck (2014), who investigated

31
factors related to adult persistence and attrition, both of which are relevant to my
analysis.
Tinto’s (1975, 1993) models are not without controversy, though, due to the fact
that Tinto provided only sociological factors influencing student attrition. In response to
these concerns, Bean and Eaton (2000) offered their psychological model of attrition in
an attempt to address psychological factors that students face when determining whether
to persist or to leave. This model also continues to be used in research such as Johnson et
al. (2014), who addressed issues of stress and student perception of campus climate in
student decisions to persist or depart.
Both of these models contribute valuable factors in the analysis of student
attrition; however, neither give a full picture of the factors that affect student attrition
from college. For this, Roberts (2012) integrated both Tinto’s (1975) sociological model
with Bean and Eaton’s (2000) psychological models to develop a general model of
college student attrition that addresses both types of factors that influence the critical
decisions to persist in college, or to leave, including passive or inactive attrition. This
model provides the theoretical basis for my research due to its comprehensive nature,
extensively addressing the many complex issues that can influence college persistence or
attrition.
Also pertinent to my study, I investigated factors that influence attrition
frustration intolerance and discomfort, as posed by Harrington (2010) in the frustration
discomfort scale. For this factor, Juutinen and Saariluoma’s (2010) pride-frustration
model expanded on the concept of frustration as it influences behavior, relating student

32
tolerance levels for frustration to their persistence in remedial/developmental courses.
According to Vansteenkiste and Ryan (2013), self-determination theory balances need
frustration with need satisfaction as dialectical components of human behavior, with
satisfaction of basic psychological needs considered crucial to appropriate psychological
functioning (p. 264). While low need satisfaction can actually impede growth and
wellbeing, need frustration can be detrimental, even harmful, to the individual. As the
authors state, need frustration can result in stress, depression, or decidedly worse effects,
dependent upon the overall resilience of the individual. While low need satisfaction is not
as detrimental overall, frustrated needs may be more strongly related to psychological
distress. This is a clearly relevant factor for my study because when students fail to
achieve satisfactory progress in remedial courses, this could create low needs satisfaction.
With some students, languishing in successive remedial sequences can create needs
frustration, resulting in attrition. This question and concept are included as part of my
study.
Key Statements and Definitions
Key terms relevant to my study include persistence, or the determination to
continue with a course of action despite difficulties or obstacles to achieving one’s goal,
applied in this case to completing courses and educational goals (Pruett & Absher, 2015).
In higher education, students who continue in their educational programs increase
retention levels for their respective educational institutions, a critical factor for the
industry and the focus of this analysis (p. 32). In contrast, attrition refers to the decision,
active or passive, to leave, withdraw, or fail in some way to complete educational goals

33
(p. 32). Intervening factors for my study begin with motivation, the desire or willingness
to do something, as well as the reasons for particular behaviors, which for the analysis
factors for my study both relate to students and coursework related to educational goals
(Deci & Ryan, 2000). Another key aspect in my study is the concept of frustration, an
emotional response to opposition, such as in a perceived obstacle to or inability to
achieve a goal (American Psychological Association, 2015). The next factor for this
study is that of learning disabilities, which are potentially complicating factors in
educational goal attainment, refers to a group of disorders demonstrated by difficulties in
speaking, listening, reasoning, reading, writing, or mathematical capabilities and the
organization of information, creating difficulties in the learning process if taught using
conventional methods (Hammill et al., 1988; Learning Disabilities Association of
America, 2012). These terms and concepts are discussed and defined in greater detail in
Chapter 1.
Literature Review Related to Key Variables and Concepts
College Persistence and Attrition
As previously stated, college attrition in the United States is a significant,
disturbing problem that impacts not only the individuals concerned and their futures, but
the future of their families, communities, and the country as a whole. In their landmark
30-year (and ongoing) series of studies, Pascarella and Terenzini (2005) clearly stated the
positive impact of college completion, including higher income, occupational status, and
conferral of benefits upon subsequent generations of those who complete college.
Synthesizing information gained from literature published over the previous decade, the

34
authors determined that students gain competence in the areas studied, gaining
significantly in verbal and quantitative skills, along with cognitive and intellectual
abilities. As students gain skills, they develop greater senses of identity and raise their
individual senses of self-esteem. They gain greater senses of morality and moral
principles, along with awareness of others’ life situations, leading to expanded social
consciousness. Long-term effects of college include much publicized improvements in
job and socioeconomic status, reporting gains of between 20% and 40% over the course
of the lifetime. The significance of these findings, gathered by Pascarella and Terenzini
over the course of 30 years, are clear indications of the value placed on attending college
in society, making higher education the rule rather than the exception in United States
society.
Despite expectations of achieving a college education in the United States,
according to Complete College America (2015a), only 4% of students complete associate
degrees within the expected two years at 2-year/community colleges, while only 19%
complete degrees at four-year colleges in the expected time frame. Once the duration
extends beyond the standard time frame, attrition increases drastically (Complete College
America, 2015a). This is further supported by the U.S. Department of Education (2015)
that states that 41% of students at 4-year institutions do not complete their programs
within 6 years, while 29% of 2-year college students do not complete their programs
within 3 years (2015). Tinto, whose longitudinal studies on attrition help frame my study,
discusses the implications of momentum in attrition (Tinto, 2013). Citing Newton’s 1687
First Law of Motion, Tinto explains that once students begin to successfully complete

35
courses and accumulate credits, they gain a sense of momentum that propels them to
continue in the process toward their goals (p. 1-2). As the preceding statistics
demonstrate, students are largely unable to complete college in the standard time frames
(2 or 4 years), which could be perceived as stalled momentum. As Tinto (2013) states, as
long as momentum continues, students will persist, despite outside forces or confounding
factors that could compel them to stop. If they falter or stall at some point, momentum is
lost and students must reframe such setbacks and situations to regain momentum or they
will be more likely to leave college. As previously stated, remedial education is
notoriously problematic for impeding perceived progress since many of these courses are
noncredit (pass/fail, satisfactory/unsatisfactory, etc.), with only approximately one–third
of remedial students in community colleges completing remedial sequences. Tinto cites
several examples of community colleges which have implemented accelerated
remediation or corequisite remediation, along with cohort-based learning communities to
provide social support for remedial students. For my study, this supports the premise that
remedial education could be perceived as a frustration–creating roadblock to goal
achievement.
Corroborating these findings, Abu, Adera, Kamsani, and Ametepee (2012) cited
similar statistics in their review of current literature, noting that these rates rise
dramatically for first-generation college students. Researchers stated that effective
academic engagement and social interaction could assist in increasing retention. As one
might expect, engaging with the course material increases GPA as well as potential for
course completion (Pruett & Absher, 2015). As course completions continue, momentum

36
increases, along with persistence and eventually graduation rates, as previously discussed
in Tinto (2013). This provides obvious implications for the potential of frustration
development when students languish in remedial sequences, as suggested by factors
examined in my study.
Remedial Education and Attrition
In a comprehensive analysis of data from CCSSE, Pruett and Absher (2015)
reported that of approximately 400,000 students 60% were classified as
developmental/remedial, indicating that they enrolled in one or more class intended to
increase skills to college-level. Researchers analyzed the type of remedial course
(reading, writing, math), academic engagement (hours spent engaged in educationally
purposeful activities such as studying), number of developmental courses, class
preparation, extracurricular college activities, and use of academic advising services,
tutoring, tuition payment sources, parent educational level. Using binary logistic
regression of a 10% random sample of student self-reported CCSSE data (n = 23,665),
findings indicated that academic engagement was statistically significant in retention as
well as academic preparation (p < .001), while type of remedial course provided mixed
data, with remedial reading and writing courses (the focus of my analysis) were less
likely to be retained than non-developmental students (23.3% and 15.1%, respectively),
while interestingly, developmental math demonstrated a 23% higher rate of retention.
The number of developmental courses taken, however, did not reach significance,
although GPA did (p <.001), with success rates increasing by 34.7% for each unit of
increase in GPA, which is a factor also under further consideration in relation to ADHD,

37
as posed by Gormley et al. (2015). This study provides important information for my
study regarding the impact of remedial reading and writing courses, focusing research on
remedial reading and writing courses and retention factors in particular. Additionally,
according to Fitzhugh (2011), college instructors surveyed by the Chronicle of Higher
Education noted dropping levels of college-level skills, particularly in reading and
writing. Of those surveyed, 91% of instructors indicated students were ill-prepared in
writing, 89% were under-prepared in reading, and 91% felt that students had little or no
research skills (p. 413). This places more and more students in remediation or at-risk for
writing skills, which further illustrates the critical importance to understand the complex
factors influencing student success and attrition from college, particularly from reading
and writing developmental education.
Like Pruett and Absher (2015), Bremer et al. (2013) also discussed the effects of
remedial courses on community college student retention. Using secondary data gathered
for further analysis on retention, researchers examined GPAs in relation to enrollment in
developmental English, reading, and writing (DERW) and developmental math (DM).
Unlike Pruett and Absher’s (2015) findings, Bremer et al.’s (2013) results of logistic
regression indicated higher persistence among those who enrolled in DERW the first term
courses (p = .021; n = 7,898) than those who did not enroll in such courses. Students who
enrolled in DM courses were also more likely to be retained to the second semester (p <
.001), while reading ability demonstrated borderline significance (p = .052). Results
differed for second term persistence, however, if students enrolled in both DERW and
DM courses simultaneously, negating persistence rates, consistent with Pruett and Absher
38
(2015). In relation to my analysis, these factors are significant in demonstrating that the
longer students remain in remediation, momentum is lost and students face the proverbial
“bridge to nowhere” (Tinto, 2013; Complete College America, 2012). When feeling
trapped in such situations, frustration may tend to increase, potentially influencing
intention to persist toward students’ educational goals, which is the focus for my study.
Again, corequisite remediation has demonstrated success with supporting students
through college composition courses (Adams, 2017); however, in addition to this, my
study also focuses on person factors that further affect persistence in an attempt to
increase our understanding of persistence or attrition in these courses.
Despite the demonstrated benefits of college education, Hern (2012) stated that in
a multistate study of 57 community colleges, more than 90% of students who
demonstrated lower skill levels were weeded out even before they even began college-
skill level work (p. 60). In a secondary analysis of recent studies, Hern supported the idea
that length of time in developmental sequences leads to higher attrition rates, and argued
for accelerated remediation even for low-skill students in order to limit their time in the
process. Problematic, however, is the still less than 50% pass rate for students in these
accelerated or corequisite remediation courses (p. 64). Critical to my study, Hern
suggested that students who languish in remediation develop a sense of hopelessness
about their chances of success not only in the course but in their overall educational goals
(p. 64). This sense of hopelessness, among those who have low tolerance for frustration,
could be the mitigating factor that stops students from completing their educational goals.

39
While Hern’s analysis is not a study in itself, it considers recent studies and succinctly
stated a serious problem facing remedial students in community colleges.
In a report prepared under the auspices of the National Center for Education
Evaluation and Regional Assistance, for the Institute of Education Sciences by Regional
Educational Laboratory Northwest, Hodara (2015) found much higher remediation levels
– 75% – among recent high school graduates at community colleges in Oregon (n =
101,812). The author was particularly interested in potential connections between
experiences in high school and college remediation among recent graduates. As
previously mentioned, students who entered college with lower skill levels were less
likely to persist to program completion than those who entered with higher skill levels. In
Hodara’s (2015) analysis, student enrollment in dual-credit programs (credit for both high
school and college courses) was tracked to determine if students were later placed in
remedial courses when enrolling in college. Using regression analysis, demographic
factors, Individualized Education Program (IEP) status, dual-credit status, grade
repetition, and absenteeism were analyzed in an attempt to determine what, if any, factors
were predictors for remediation. While general enrollment statistics showed that
approximately 75% of students did not demonstrate college-level skills and required
remedial courses, students who took dual-credit courses in high school were less likely to
require remedial education. As expected, students who required remediation in high
school due to achievement test results were more likely to require remediation in college.
These students typically enrolled in 2-year colleges after college; those who started at
lower reading skill levels in particular spent more time in college and were less likely to

40
complete their educational programs, demonstrating a 26% completion rate. This data
further reinforces the need to understand why these students are less likely to persist in
their programs and further justifies the factors for analysis of my study.
As mentioned, persistence rates among remedial students have generated
countless studies to determine the causes of attrition. In a review of current literature,
Bettinger, Boatman, and Long (2005) examined lack of college-level skills incoming
students, stating that remediation is the “point of entry for 80% of four-year students and
virtually all two year students” (p. 94). Researchers state that this makes
developmental/remedial courses one of the most-used and critical sources of scaffolding
used to develop skills among those who wish to attend college, with 51.7% of students
who enter community college requiring some form of remediation (Complete College
America, 2015). Bettinger et al. (2005) further stated that remedial course outcomes and
attrition can be a conundrum, maintaining that it becomes difficult to determine if it
results from lack of preparedness or if caused by the remediation process itself. This
underscores the fact that if students do not persist through these courses, both the college
and the student have failed in their educational goals, emphasizing the need to examine
the success rates for students in reading and writing remediation.
Also discussing college attrition rates, McMahon (2015) suggested various areas
of focus for increasing retention, including developmental (remedial) courses. Citing data
from numerous current studies, McMahon pointed to developmental education as an area
of concern, albeit success for students who persist. The author stated that students who
enrolled in developmental courses were more likely to persist than those who did not

41
enroll in these courses. Further, students who enrolled in developmental courses and did
not complete these courses still had an overall higher retention rate than those who did
not. In other words, enrolling in a developmental course and not completing it but then
moving to the next course in the requisite sequence without credit for the remedial course
carried a higher chance of persistence for these students (p. 3). This questions, as with
many studies, the necessity of full-term, stand-alone remedial courses where students
could receive corequisite remediation or other alternative forms of skills development
that would take less time and provide the same results. Alternate forms of remediation
could clearly avoid developing hopelessness, frustration, and the potential for attrition, as
investigated by factors included in my study.
Alternatively, DeNicco et al. (2015) stated that there is no clear benefit for
enrolling in developmental education, stating that such courses have actually
demonstrated negative effects on those who enrolled in them. Researchers followed a
cohort of 1,800 students, beginning in high school and following them through a public
state college system, to determine what factors influenced attrition/persistence. Analyzing
various factors including demographics, skills levels, attendance rates, high school
dropout rates, etc., the authors stated that overall progress toward students’ educational
goals, particularly in their first/freshman year, is most significant in predicting
persistence. Using logistic regression, freshman GPA and earned credits were each
significant at p < 0.1%. This is particularly interesting from the standpoint that students
as face a variety of obstacles during the enrollment process and throughout their first
year, the significant factor influencing persistence is GPA and credits successfully

42
accumulated. This indicates that students are most concerned about performance in their
classes (as expected), which, if unsuccessful or delayed through repetitive remedial
sequences, could affect frustration levels and decisions to persist, which is the object of
investigation for the analysis factors included in my study.
In a further analysis, Scott-Clayton and Rodriguez (2012) also found that
traditional remedial education does little to address skills deficits for students who test
into them. Using regression discontinuity methodology (McCrary tests) on data from six
community colleges gathered over the course of 8 years, researchers found that of a
sample size of 100,250 students, 90,342 of them required remediation. However, the
authors claimed students gained few benefits from remedial courses, which had no
positive effects on any college outcome; they called remedial courses “diversionary” at
best, particularly because students do not develop skills and additionally, students earn no
credits toward completion of their degrees or programs. They further stated that the
anticipation of remediation in no way discourages student enrollment, providing
implications for the process rather than the need for building skills. Researchers
examined pre–enrollment factors and found that 17% of students who take placement
tests never enroll in college, potentially due to remedial placement, while 64% had
dropped out after three years, 24% were still enrolled after 3 years (in a 2-year
community college system), and only 12% had either completed their programs or
transferred to a 4-year school. Focusing on reading/writing remediation (as in the factors
for investigation in my study), the authors found no evidence of diversionary effect of
placement in remediation; albeit there is no evidence of a “discouragement effect” as

43
posed by Martorell and McFarlin (2011); however, those who enroll in remediation are
less likely to persist to program completion (p = .1; Scott-Clayton & Rodriguez, 2012, p.
22). Again, supported by these conflicting analyses, the fact remains that students in
remediation may experience difficulty in completing their educational goals, further
emphasizing the critical need to examine remedial procedures and their benefit or
detriment to the educational processes.
In a key analysis for my study, Bahr (2012) addressed remediation and attrition in
terms of types of attrition, duration of enrollment, and student skill levels for students in
remedial reading and writing sequences. Types of attrition include skill-specific (lack of
persistence to complete remediation), nonspecific, and course-specific (particularly
difficult courses in the remediation sequence). Duration of enrollment is key because
according to Bahr, the longer students spend in remediation, attrition rates increase
significantly, becoming, as the author states, “a structural barrier to college-level skills
attainment” (p. 663). Impacting both of these is the level of skills that students bring to
their educational goals as well as factors related to enrollment. The researcher analyzed
patterns of enrollment, operationalized as absolute delays (temporarily “stop out” from
college/courses) or relative delays (failed to enroll in subsequent remedial course/s
despite continuing enrollment). Further, persistence was determined based on passing
grades in remedial courses, e.g., successful completion demonstrated standard letter grade
of A, B, C, or Credit/Pass for the course. Using logistic regression, data indicated that
while likelihood of attaining college-level skills varies with length of enrollment,
achievement gaps continue to exist despite extended duration of enrollment periods for

44
some students. As in other studies, there is significant evidence that non-passing grades
greatly decrease the chance of persistence particularly in point-of-entry courses; however,
the type of attrition tended to indicate nonspecific attrition (not skill-related). This
indicates that there are additional factors to consider when analyzing attrition/success
rates, including potentially mitigating factors. Due to the fact that such failure to progress
could play a role in development of frustration, this supports analysis of frustration as a
factor in attrition, which is one of the areas of focus for my study.
The potential for long-term, negative implications of remedial education are
further demonstrated by Crisp and Delgado (2014). Using existing data from the
Beginning Postsecondary Students Longitudinal Study, the authors analyzed
demographic characteristics of 23,090 students who were placed in developmental
courses (n = 2,780), finding that community college students who enrolled in remedial
courses tended to differ from those who did not in terms of first-generation college
student status, gender, ethnicity, academic preparation/high school experiences, and delay
of entry into college. Using hierarchical generalized linear modeling, researchers found a
significant negative relationship “between enrolling in English developmental courses
and the odds that a student would transfer to a 4-year institution even after minimizing
selection bias and controlling for variables previously shown to be related to community
college student success” (p < .05; p. 110-111). This analysis provided information about
characteristics of the typical developmental student, who tends to be a racial minority and
first-generation college student, leading to questions beyond the scope of this study, such
as at-risk status early in the elementary or secondary school process, lack of social

45
support or emphasis on the benefits of college, or simply financial support through the
process. This study does not address such unobservable factors such as nonspecific
attrition, as discussed by Bahr (2012). Interestingly, this study found that students who
enroll in remedial courses are slightly more likely to persist compared to non-remedial
students (79% to 77%), contrary to numerous other studies (e.g., Complete College
America, 2014; Pruett & Absher, 2015). Despite these inconsistencies, the difficulties
faced by remedial students is reinforced through data about success rates in transferring
to 4-year institutions. This underscores the necessity for further analysis on the multiple
factors which could affect student success to determine the best course of action to
improve student persistence.
Contrary to Crisp and Delgado (2014), and consistent with other studies, Stewart,
Lim, and Kim (2015) found that students who were placed in remedial courses were less
likely to persist than those who held college-level skills prior to enrollment in college (n
= 23,090). These researchers investigated further connections between persistence and
factors such as ethnicity, financial aid, GPA and family income. Using multiple
regression, the authors found that high school GPA was a significant predictor of success
in college, while those with lower GPAs were less likely to persist (p < .01), again
suggesting that students who lack skills in college may have struggled earlier in the
educational process. Further, using ANOVA, remediation did not achieve significance in
supporting persistence in college (p = .083), supporting findings of other studies. The
authors suggest that support services such as tutoring, mentoring, and early intervention
would improve academic skills deficiencies and increase persistence; however, in data

46
from the CCSSE as analyzed by Pruett and Absher (2015), tutoring in particular was not
found to be a predictor of success, which leads to questions about using corequisite
remediation models that emphasize tutoring-type sections taken alongside college-level
courses. These findings further support the obligation to determine what factors that
impede success and at what point in the educational process these factors become
relevant and influence the direction of the student’s future.
Frustration Discomfort and Learning
When examining persistence and attrition in college, particularly in remedial
courses, it is critical to develop an understanding of potentially mitigating factors that
may influence students’ decisions to persist or abandon their educational endeavors.
Frustration is considered a negative emotion which can appear when one encounters
perceived or real obstacles in the path of completing a task or attaining a goal or
expectation (Handa, 2003). When perceived needs are seen as blocked, low needs
satisfaction or needs frustration occurs, which can result in negative and/or maladaptive
behaviors among some (Vansteenkiste & Ryan, 2013). While no studies directly analyze
frustration among students in remedial courses (as per my study), frustration has been
analyzed in other education-related pursuits, which are addressed here. Academic
progress, as discussed, is traditionally measured in terms of credit earned, GPA, and
progress toward goal completion.
According to Wilde (2012), psychological factors such as academic self-efficacy
may also comprise up to 14% of the variance in GPAs. Wilde’s analysis examined the
relationship between various factors to attempt to predict academic persistence. Among

47
105 undergraduate students, academic self-efficacy, or students’ sense of confidence in
their abilities to successfully accomplish academic tasks at the appropriate level, based in
outcome expectations and performance goals, was determined to be significant in
predicting persistence (p. 1). Additionally, individuals who tolerated delay of
gratification were demonstrated to score better on college entrance exams, resulting in
ability to predict success. Further, student engagement (also termed “academic
engagement”), or the amount of time students spend studying or practicing a subject, was
determined to be a better overall predictor of student persistence and success, with
multiple factors overlapping at times when considering their effects on persistence.
Frustration intolerance is the “inability or unwillingness to persist in an activity due to
unpleasant feelings associated with the task” (p. 3). Frustration intolerance can increase
procrastination and problem avoidance, reduce student engagement and study time
(leading to lower grades), and increase fear of failure. In Wilde’s analysis, frustration
intolerance was measured in relation to GPA among 105 undergraduate students in an
attempt to predict academic success, measured in terms of persistence toward graduation.
Wilde administered Harrington’s (2005) Frustration Discomfort Scale to full- and part-
time education students along a full range of academic levels (freshman through graduate
students). Using multiple linear regressions, results determined that frustration
intolerance accounted for 23% of the variance in predicting GPA and persistence among
all levels of students surveyed. The Frustration Discomfort subscale Achievement
Frustration was the best single predictor of GPA (p = .000), the second best predictor was
Emotional Intolerance (p = .005), while the third subscale, Entitlement, was also

48
statistically significant (p = .021). The remaining subscale, Discomfort Intolerance, did
not reach significance among those participating. Despite relatively low participant levels
(n = 105) and even smaller number of first-year students (13), findings present an
analysis worth replicating, as in the investigated factors for my study, due to the
connection of frustration to typical features of ADHD (see Scine & Norvilitis, 2006).
Further, conducting a similar analysis when applied to students in remedial courses could
provide significant information as to attrition, providing an understanding of why
students walk away from the potential benefits of a college education. This knowledge
could lead to methods of assisting students who test high in frustration intolerance to be
able to work through such frustration as well as for educators to help students avoid some
of the frustration-causing aspects of remedial courses.
An additional illustration of the impact of frustration in the learning environment,
Khanlarian and Singh (2014) explored various mitigating factors in online learning. In an
analysis of n = 368 students, researchers surveyed students about perceptions, feelings,
and beliefs of the web-based learning environment, particularly concerning homework.
The authors noted that academic achievement goals are significantly tied to student focus
on learning, based in performance and/or mastery goals, self-efficacy, locus of control, as
well as outcome expectations. The authors cited four reasons for termination of goals: (a)
aspiration achievement (goal attained), (b) satisficing (close to goal), (c) impatience
(tolerance level had been met or exceeded, and (d) discouragement (tried and failed to
achieve goal) (p. 138, 142). The last two reasons were connected to lack of success,
associated significantly with frustration among participants. In a longitudinal design,

49
multivariate analysis and structural equation modeling showed that user frustration, or
frustration with technology, and/or experiencing technical difficulties that impeded
student progress, demonstrated a significant effect on student performance, thereby
success, causing students to stop short of goal attainment (p < .001). This provides crucial
information as to the critical effect of frustration on goal impediment in the college
setting. This study analyzed participant experiences in a large, 4-year institution, whereas
the my study suggests analyzing similar factors among remedial students at two-year
colleges; however, this study further validates the connection between frustration and
student goal attainment, providing additional basis for the current study.
Also researching frustration among learners in the college setting, Sierpinska et
al. (2007) looked not at discomfort or intolerance for frustration within students (as
investigated in my study), but sought to identify sources of frustration in the remedial
math sequence at a large, four-year institution in an attempt to alleviate and remove some
of these inhibiting factors. Conceptualizing frustration as an emotion that accompanies
disappointment (Handa, 2003), this mixed methods analysis researched sources of
frustration among n = 96 students, such as being required to take remedial courses, the
pace of the courses, inefficient learning strategies, differing patterns of thinking/learning,
logic/reasoning difficulties with math, insufficient academic support, and poor
achievement. Sierpinska et al., (2007) indicated that over 40% of students in remedial
math sequences are negatively impacted by such sources of frustration in their learning
experiences, although cautioning that these results may not be generalizable. This
contradicts findings of Pruett and Absher (2015), who found that students in remedial

50
math sequences increase their odds of success by 23% compared to students who did not
take such courses, indicating that such frustrations do not overwhelmingly impede
success. However, Sierpinska et al.’s (2007) analysis identifies several aspects of college
remedial courses that are worth consideration when focusing on remedial reading and
writing, which are the focus of investigation by my study.
While not addressing remedial courses, Lewis and Dodson (2013) clearly
demonstrated the different expectations between high school and college writing,
particularly between creative writing typically taught in high school and early college and
the expectations of scientific-based research writing. In an analysis of recent studies and
literature, the authors discussed the gaps students experience as they attempt to learn the
requirements for research papers – succinct, factual statements supported by
documentation – while students are typically taught the creative writing process, which
includes elaborative, inventive sequences that are highly developed and imaginative. This
creates considerable frustration for students, where research-based papers are considered
as obstacles in their learning process rather than building blocks in their skills
development. While students in remedial writing sequences are taught basics of creative
writing, the authors clearly demonstrate an important aspect in the differing expectations
and processes of college-level writing and the frustration students can experience with
writing. Such frustration is the focus of my study, which will examine frustration
discomfort/intolerance among students in college remedial reading and writing courses.
Further demonstrating the critical factor of frustration and learning, Capdeferro
and Romero (2012), analyzed online learning and the collaborative process. To meet the

51
demands of the e-learning environment, best practices suggest incorporating group
support through collaborative learning that may be missing in the online learning
situation. Group processes can present difficulties in any collaborative environment,
including education, workplace, etc., where issues such as unclear goals, unclear
communication, varying levels of skills and competences, uneven workloads, and other
factors confound the group experience. These can become magnified when coupled with
online learning, which adds its own set of differences from face-to-face experiences. For
this particular analysis, researchers developed and administrated the Online Collaborative
Learning Experiences Frustration Questionnaire, which utilizes a series of closed- and
open-ended questions about student situations, their prior experiences with online and
collaborative learning/teamwork, levels and perceptions of frustrations as to each
student’s intended goals. Using multiple regression analyses, findings indicated learners
felt they were most impacted by unrealistic expectations, unclear guidance, and
uncertainties with interdependence (n = 40). Of most interest to the current study was the
section dealing with how frustration affected perception of participating in the learning
experience. While some participants indicated no frustration, 60% indicated frustration
that affected their perception of the experience. Further, across all variables, all
participants experienced frustration to some extent which affected their learning
experience, although not all factors relate to my study. Despite the low number of
participants (n = 40), this study clearly demonstrates the impact of frustration on the
learning experience and student outcomes, as well as the significant concerns about
frustration as a factor that can seriously affect the college learning experience. Since

52
more and more classes are being offered online – including remedial courses – these
findings hold serious implications for attempting to offer remedial or corequisite reading
and writing courses online, an important implication to consider as factors for my study
and future studies.
Attention-Deficit Hyperactivity Disorder
It is impossible to discuss learning and frustration tolerance without examining
potentially mitigating factors such as learning disabilities, of primary interest among
which is ADHD. According to Zimbardo et al. (2014), ADHD is characterized by
inattention, poor impulse control, difficulty in concentrating, and high levels of
distractibility over a period of time. The disorder is found in approximately 3-7% of
school-age children in the United States, with symptoms among approximately 50% of
individuals spontaneously disappearing as the individuals approach and enter adulthood
(Santrock, 2011; Zimbardo et al., 2014). According to Boyd and Bee (2012), symptoms
are divided into two subtypes, including ADHD/hyperactive/impulsive type,
ADHD/inattentive type, with some children diagnosed with symptoms of both
(ADHD/combined type). Further, according to Santrock (2011) individuals with ADHD
have difficulty focusing on one task for any period of time, and may either become
distracted or inattentive, with difficulty sustaining attention the most common type of
attention problems displayed. Additionally, frustration becomes a greater factor in those
with ADHD, as discussed by Scine and Norvilitis (2006). Children diagnosed with
ADHD and those without were presented with a math task of increasing levels of
difficulty. While those with ADHD demonstrated similar levels of accuracy, fewer

53
problems were completed, with participants quitting the task sooner and reporting higher
levels of frustration with the task than those who did were not diagnosed with the
disorder. This directly informs my study from the perspective that those with ADHD
displayed higher levels of frustration and less persistence in prolonged tasks, as students
with ADHD, whether diagnosed or undiagnosed, may be less likely to persist in college
remedial courses due less emotional regulation and higher levels of perceived frustration.
Further, according to Willcutt and Pennington (2000), students with ADHD were more
likely to present with reading disabilities, giving support for analyzing student attrition in
remedial reading and writing courses, as investigated in my study. Mamiseishvili and
Koch (2011) stated that nearly 25% of students with disabilities did not return after their
first year in college, while nearly 51% did not return after their second year. Included
among these, ADHD comprised 17.3% of the diagnoses. Oguntoyinbo (2012) stated that
an estimated 50% or fewer of students who have diagnosed learning disabilities actually
report the disability and/or utilize any available resources, largely due to associated
stigma with the disability. However, this is a disability that is recognized under IDEA
(2006), affording accommodations and support for those with the diagnosis. This
underscores the critical importance of first, diagnosis of the disorder, and second,
providing appropriate support for these students in order to guarantee their success. As an
additional basis for understanding ADHD, Berger (2011) described three primary
symptoms, including inattention, impulsiveness, and hyperactivity, which, as described
above, can vary from individual to individual. The latter two have been combined into
effects of the same symptom, impairing self-regulation in those who have the disorder,

54
even from early life. Reports of irritability, negative emotionality, and conduct problems
have been noted as early as 3 to 4 months of age, and later, lower academic achievements
tend to plague those with the diagnosis. Throughout adolescence and into adulthood,
these symptoms were expressed in hyperactivity, impulsiveness, and disorganization,
resulting in poor academic and employment success and retention, resultant from lower
levels of inhibition regulation and control. As discussed by Quinn (2013), many students
with ADHD diagnoses do not receive, or take advantage of, accommodations and support
provided by colleges, despite learning disabilities nearly doubling from 2001-2009 (U.S.
Government, 2009).
Typically a concern faced in childhood, more emphasis is being placed on those
with ADHD and their challenges faced in college, as researched in my investigation, and
throughout life, however, as observed by Alao (2015), a “surprising lack” of studies have
analyzed the implications of adult ADHD among college students, leading one to
question if the lack of diagnosis and treatment could be one of the causes of college
attrition, which will be addressed in the current study. In a qualitative analysis, Meaux,
Green and Broussard (2009) conducted semi–structured open-ended interviews with adult
college students with ADHD to determine their perceptions, challenges, and adaptations
as they entered college (n = 15). For these interviews, students were asked to list
information that helped or hindered their adaptation to college. Significant to the current
study, students listed self-regulation factors such as accountability, attaching
consequences to actions, removing distractions, and detailed scheduling as factors which
assisted in the transition. This reinforces the factor of self-regulation for those struggling

55
with ADHD. Despite the small sample size, this analysis is important due to the fact that
students who implemented such strategies tended to be more successful in completing
their programs, despite difficulties in the process as these lessons were learned. More
significant is the self-reported information related to the struggles with self-regulation
that such students faced, which connects to my study as correlates of frustration-inducing
phenomena that can impede progress toward educational program completion.
Additionally, students with ADHD who anticipate college may not accurately or
adequately assess their readiness and coping abilities. According to Stamp et al. (2014),
students with ADHD had difficulties accessing sources of support and meeting demands
of college students in general. In a qualitative analysis of 12 students with ADHD, using
semi-structured interviews, students were positively impacted by their perceived passion,
energy, and likeability in social settings; however, 50% also experienced high levels of
anxiety and feelings of being overwhelmed by the situations. Furthermore, 75% stated
that they did not cope well with educational settings, feeling different, ashamed, and
inadequate in various forms in accomplishing their work, and unable to ask for help.
Despite the small sample size, this qualitative analysis provided for deeper understanding
of the connection between ADHD and emotion and coping, and further underscores the
importance of diagnosis of ADHD, understanding the disorder, and receiving proper
assistance in order for success in reaching educational goals.
In addition to self-regulation issues, further characteristics of ADHD is lack of
impulse control and emotional regulation, generally influencing the individual’s ability to
adapt to changing situations and challenges (Burns & Martin, 2014). In an analysis of

56
current research, the authors state that those with ADHD have substantial difficulty
regulating thoughts, emotions, and behaviors related to tasks, and typically lack
behavioral inhibition and self-regulation, which significantly impacts management,
completion, and outcome of that task. Further, the authors incorporated the concept of
adaptability with ADHD. Adaptability is the capacity for cognitive, emotional, and
behavioral modifications as needed, and making appropriate responses to new, changing,
or uncertain situations (p. 228). Typically, individuals with ADHD are low in ability to
regulate behavior, making them less likely to plan and respond appropriately, essentially
impeding their ability for cognitive regulation necessary for successfully navigating and
adapting to various situations (p. 230). This can lead to temporal discounting of future
rewards and/or emotional hyper-responsiveness, which, in academic settings, can lead
“…students with ADHD [to] express frustration, irritability, and hostility more easily
than their non-ADHD peers” (p. 231). After administering the Adaptability Scale
(Martin, Nejad, Colmar, & Liem, 2012), Burns and Martin (2014) found that while
perceived control is a critical component of adaptability, individuals with ADHD lacked
this emotional and cognitive regulative function, which may place them at an operational
disadvantage when faced with situations such as college, where adaptability to novel,
changing, or uncertain situations. This supports findings by Semrud-Clikeman,
Walkowiak, Wilkinson, and Butcher (2010), who found that executive function, which
modifies behavior to adapt to and focus attention on dynamic situations by regulating
attentional resources. This provides obvious implications for students with ADHD as they

57
enter college, and even deeper implications when they are placed in remedial (non–
credit) courses that prove difficult or take longer than anticipated.
Additionally, Bitsakou, Antrop, Wiersema, and Sonuga-Barke (2006)
demonstrated that among 49 adults with ADHD, delay frustration, a measure of delay
intolerance, was significantly higher than in those without the diagnosis, increasing
significantly with the degree of diagnosis. Using univariate analysis of the covariate,
researchers determined that frustration increased significantly with time delay (p < .05),
providing important implications of frustration in achievement in the educational process.
Despite the small sample size, this clearly illustrates the importance of diagnosis and
strategy implementation to increase the potential for success in those with this disorder.
As discussed, impulsiveness and lack of self-regulation can seriously impact the
success of students with ADHD, as with frustration intolerance. As discussed by Field,
Parker, Sawilowsky, and Rolands (2013), if ADHD is diagnosed, students can be coached
on improving self-regulation for learning and study strategies for higher levels of
retention and success in college. In a study of 160 students, those who had been
diagnosed with ADHD were divided into two teams, one based in coaching and a control
group that received no coaching. Those receiving the coaching program received
strategies for success which incorporated weekly phone calls to discuss implementation
of strategies for learning and self-regulation programs. Using MANCOVA, results
indicated that students who were coached in success strategies dramatically increased
their success rates than those who did not. This provides solid evidence that once
diagnosed, these individuals can receive strategies that improved success overall (p <

58
.05), indicating that diagnosis, counseling and coaching, combined with appropriate
accommodations, are critical support mechanisms that facilitate the success of students
with ADHD. This is a serious implication for social change for my study that suggests
students should be encouraged to be tested and, if diagnosed with ADHD, provided with
appropriate scaffolding for success to improve retention and reduce frustration-inducing
problems which such students face when entering college.
Furthermore, in a study of college students between 18 and 23 years of age,
Weyandt et al. (2013) analyzed 24 with ADHD and 26 without were analyzed in terms of
psychopathology, academic performance, organizational skills, and social relationships.
Of significance for my study were emotional regulation factors, where 2 X 2 ANOVA
results indicated ADHD students rated significantly higher in levels of emotional liability
(p = .014), supporting investigation of frustration as a factor in success. Different from
other studies, students expressed no difference in positive/negative affect, where other
studies have found higher levels of negative affect. Also using 2 X 2 ANOVA, academic
performance revealed significant effect for students with ADHD, reporting significantly
lower grades on course assignments than non-ADHD students (p = .016) and
organizational skills (p < .001), implicating success factors among ADHD students which
could impede achievement.
Additional implications of ADHD are discussed by Bilkey et al. (2014) who
stated that only 1 in 10 individuals who are afflicted with ADHD actually receive the
diagnosis, which amounts to over ten times the number of diagnosed individuals who
struggle with the symptoms and related consequences of the disorder. As adults, these

59
individuals struggle with academic and professional success, strained relationships, and
diminished overall well-being. Following a case study of an individual diagnosed as an
adult, the authors suggest further testing, using the ASRS-V1.1 (Kessler et al., 2005) –
utilized widely by the World Health Organization and many others – and related medical
and behavioral treatment as needed for overall life improvement. The Bilkey et al. (2014)
study further supports the implications of untreated ADHD and the use of the ASRS-V1.1
(Kessler et al., 2005), as used in my study. In order to facilitate success for individuals
with ADHD, they must first be diagnosed, then provided with the necessary support for
success. As in the analysis factors for my study, Pazol and Griggins (2012) proposed
comprehensive ADHD assessment in college. They stated that the disorder, once
diagnosed in childhood and thought to be outgrown, often continues well beyond
adolescence into adulthood, affecting every aspect of individuals’ lives. However, the
authors stated that with number of students reporting disabilities increasing each year,
diagnosis becomes increasingly complex due to self-report assessment along with
potential comorbidity of symptoms. However, the authors stated that self-report
assessment is recommended as a starting point for further comprehensive assessment,
leading to appropriate treatment and, if needed, approved educational accommodations
based in the learning situations.
In an additional analysis of 237 college students from India, Jhambh, Arun and
Garg (2014) diagnosed ADHD using the ASRS-V1.1 (Kessler et al., 2005), as
investigated among the analysis factors for my study, resulting in 56 students (23.6%)
receiving the diagnosis. Researchers further administered the Wender Utah Rating Scale

60
(Ward, Wender, & Reimherr, 1993) which examines retrospective information from
childhood to clarify and refine ADHD diagnoses, resulting in 13 students (5.48%) being
diagnosed with ADHD. These individuals had significantly lower levels of self-esteem (p
< .01) and emotional instability (p < .01). This provides further indications for testing
students for frustration discomfort, however, suggests strongly that students who test
positive for ADHD should receive additional testing for refinement of the diagnosis.
Also researching negative emotion among students with ADHD, Kearns and
Ruebel (2011) analyzed 64 college students with ADHD and 109 without. Individuals
with ADHD typically exhibit poor emotional regulation as previously mentioned, and in
this analysis, 3 X 2 ANOVA (emotion type x gender – emotive/anxiety/depressive)
results indicated that students with ADHD reported significantly higher levels of negative
emotion compared to those without, across both ADHD types (inattentive type/combined
type) (p < .05). Additionally, females reported higher levels of negative emotion than
males (p < .05). This study utilized the Attention-Deficit Scales for Adults (Santo &
Murphy) which rates similarly with Wender Utah Rating Scale (Ward et al., 1993),
according to McCann & Roy-Byrne (2004), who also suggest further evaluation to
confirm diagnoses of ADHD. However, findings of Kearns and Ruebel (2011) further
support the inclusion of frustration as a negative emotion among college students when
analyzing factors that influence success or attrition in college.
The implications of ADHD are extant not only in the educational context, but
throughout the life of the individuals involved. Citing several studies, Küpper et al.
(2012) investigated the life-long impact on the occupational health among individuals

61
diagnosed with this disorder. Individuals with ADHD face considerable economic impact
due to higher levels of unemployment and reduced productivity and absenteeism, higher
incident of accidents and injuries, and behavioral impacts due to higher levels of
irritability and low frustration tolerance. This again demonstrates the critical importance
of diagnosis and providing strategies for appropriate functioning throughout life for those
with this disorder. Knowledge of this diagnosis and the related issues are important for
individuals who may be struggling with the disorder in order to understand and utilize
basic strategies for appropriate functioning in society. Determining these factors for
college students can have lifelong implications that impact not only these individuals but
their families, coworkers, and the larger society as a whole, an important consideration
and basis for my study.
Summary and Conclusions
In summary, the benefits of college education have long been established,
including higher income, occupational status, and conferral of benefits on future
generations of those who complete college. In addition to career skills, students gain
verbal, quantitative, cognitive and intellectual skills. Long-term effects of college include
20-40% socioeconomic gains over the course of the lifetime. Yet, despite expectations of
achieving a college education in the United States, only 4% of students in the complete
associate degrees within the expected time frame at 2-year/community colleges. Once the
duration extends beyond the standard time frame, attrition increases drastically, with over
70% of community college students failing to complete their programs in 3 years (U.S.
Department of Education, 2015). Many of these students are among the 60-75% of

62
students who test into remedial (non–credit) courses (Hodara, 2015; Pruett & Absher,
2015). Once students enter remedial reading and/or writing courses, completion rates
were 23.3% and 15% lower, respectively, which has led to many analyses of the effect of
the perception of languishing in these courses. Studies have long connected the potential
for reading and writing difficulties among those with ADHD (Willcutt & Pennington,
2000). Bilkey et al. (2014) reported that only 1 in 10 individuals who are afflicted with
ADHD actually receive the diagnosis, while less than 50% of those diagnosed receive no
assistance or accommodations for this disability (Oguntoyinbo, 2012). Those with ADHD
typically suffer from difficulties with emotional self-regulation, among them, frustration
intolerance (Burns & Martin, 2014). While frustration discomfort and intolerance has
been investigated among education majors as related to their GPAs (Wilde, 2012), it has
not been addressed as a potential factor in college attrition among those in remedial
education reading and writing courses at community colleges in the United States. It was
the purpose of this analysis to investigate this potential connection through the
administration of self-report surveys to remedial reading and writing students at
community colleges in attempt to determine if undiagnosed ADHD and frustration
intolerance play a role in attrition. This connection will provide assistance to students
who may otherwise walk away from the benefits of college due to a disability that is
protected under IDEA (2006). Details of analysis and methodology follow in Chapter 3.

63
Chapter 3: Research Methods
Introduction
College education provides many benefits, not only for individuals, but also their
families and society as a whole. The general expectation in the United States is that most
individuals will pursue and achieve a college degree. As I previously discussed, only 4%
of students in the United States complete associate degrees within the expected timeframe
at 2-year/community colleges, with only approximately 30% achieving this goal within
nearly double the expected timeframe in community college settings (U.S. Department of
Education, 2015). Remedial students fare much worse, with completion rates in remedial
reading and writing courses that are 23.3% and 15% lower, respectively; this has led to
many analyses of the effect of the perception of languishing in these courses (Pruett &
Absher, 2015). The connection between ADHD and reading/writing difficulties has long
been established, with approximately 10% of those afflicted with ADHD receiving a
formal diagnosis, and fewer than 50% of these individuals actually receiving assistance
for the disability (Bilkey et al., 2014; Oguntoyinbo, 2012; Willcutt & Pennington, 2000).
Additionally, frustration discomfort/intolerance is a typical feature of ADHD (Scime &
Norvilitis, 2006); however, this factor has yet to be investigated as a potential component
in remedial reading and writing courses at the community college level where many at-
risk students begin their college pursuits. Furthermore, the types of motivating factors can
greatly affect students’ desire to participate and persist in courses, which can additionally
influence completion of courses as well as degree programs (Koludrović & Ercegovac,
2015).

64
In this chapter, I detail the methodology used to investigate these factors in
college attrition for community college students, beginning with an overview of the
research design for the study. This is followed by a discussion of methodology for the
analysis, including population, sample and sampling procedures, recruitment of sample
and data collection, and description of variables. The chapter concludes with a
description of threats to the validity of the analysis, including internal and external
validity; ethical concerns, including Institutional Review Board (IRB) approvals; data
protections; and potential conflicts of interest; as well as dissemination of information.
Purpose
In this study, I employed self-report survey methodology with a cross-sectional
strategy to assess student frustration discomfort/intolerance and ADHD as mediating
variables for the prediction of academic attrition or persistence for students attending one
of two types of remediation for students with reading/writing deficiencies. I developed
the following research questions to guide this study:
Research Question 1: Does type of intervention for reading/writing skill deficits
predict the likelihood of persistence and/or retention among college students
receiving the intervention?
Research Question 2: Does frustration discomfort predict the likelihood of
persistence and/or retention among college students receiving an intervention for
reading/writing skill deficits?

65
Research Question 3: Does student motivation predict the likelihood of
persistence and/or retention among college students receiving an intervention for
reading/writing skill deficits?
Research Question 4: Does ADHD predict the likelihood of persistence and/or
retention among college students receiving an intervention for reading/writing
skill deficits?
Research Question 5: In addition to type of intervention received, do person
factors (i.e., frustration discomfort, motivation, and ADHD) increase the
predictability of the likelihood of persistence and/or retention among college
students receiving an intervention for reading/writing skill deficits?
Research Design and Rationale
I undertook this quantitative research to determine if the type of remediation (i.e.,
independent variable) can be mediated by students’ frustration discomfort/intolerance,
type of motivation, and ADHD (i.e., mediating variables), which in turn can affect
persistence or attrition (i.e., dependent variables) of community college students from
either the course sequence or the college program. Since one participating college had
begun using corequisite remediation (i.e., where students receive tutor support while
enrolled in standard composition courses despite testing into remedial courses), these
students were invited to participate as part of the comparative analysis. The type of
motivation for completing courses was considered a mediating variable, due to the fact
that those who are highly intrinsically motivated may tend to persist through remedial

66
courses despite frustration discomfort or intolerance. Figure 1 illustrates the research
model for this analysis.
Figure 1. Research design model.
In this research, I used a cross-sectional, self-report survey methodology of adult
students 18 years of age or older. Because cross-sectional methodology analyzes data
gathered at a particular point in time, it was appropriate for my study because such
methodology provides information that allowed me to determine the relationship of
variables among enrolled remedial students during a given semester, while allowing me
the ability to track persistence to the next semester through enrollment in the next course
in the sequence or other additional courses at the respective college. This design is
consistent with Wilde (2012), who analyzed frustration discomfort among education
majors, and with studies conducted to identify academic motivation in a single academic
term, such as Çetin (2015). The between-group method of analysis was additionally

67
incorporated by Sierpinska, Bobos and Knipping (2007), where interactions of sources of
frustration, types of frustration, and types of learners were explored in prerequisite
mathematics courses. Additionally, self-report surveys have been commonly used to
evaluate frustration discomfort/tolerance (Harrington, 2005; Wilde, 2012), motivation
(Koludrović & Ercegovac, 2015; Martin et al., 2014; Vallerand et al., 1992), and ADHD
symptomology (Bilkey et al., 2014; Kessler et al., 2005).
Methodology
Population
The population for this analysis included students who tested into below an
acceptable level in reading and writing courses through standard placement testing,
including ACT, COMPASS, and/or ACCUPLACER (see National Assessment
Governing Board, 2011). I recruited participants for this analysis at two, small,
Midwestern, 2-year community colleges with a total combined enrollment of
approximately 5,000-6,000 students, based on semester, according to the colleges’
websites. The websites also show that the student bodies are comprised of a relatively
even split of traditional, 18-to-20-year-old students, coming directly from high school,
and nontraditional students (i.e., older/ returning students), approximately two-thirds of
whom are part-time. All students enrolled in reading and writing remediation at both
colleges were invited to participate in this analysis. Each year, approximately 300
students participate in remediation, whether as traditional, standalone courses or those
approached as corequisite remediation, which provides tutoring or intensive labs
alongside the college-level course. This aspect provided comparative data between the

68
two types of remediation. A segment of students for each college is comprised of high
school students dually enrolled or pursuing early college opportunities, however, this
group was not included in the study due to factors related to minors participating in
research and obtaining parental consent.
Sampling and Sampling Procedures
With the approval of Walden’s IRB and the IRB of both colleges involved, I
invited all remedial reading and writing students at the two colleges to participate in self-
report surveys. The IRBs and administrators of the participating schools were encouraged
to recognize this analysis as an opportunity to gain valuable insight into factors related to
persistence or attrition in remedial reading and writing. This helped me recruit sufficient
participants for the study and thereby, the opportunity for a greater amount of data for the
analysis, as well as giving the participating colleges assistance with future course
planning. Once approval was granted, I invited all remedial reading and writing students
to participate in the study. No incentives were provided to participating students. Students
under the age of 18 were excluded from the participant pool due, as previously stated, to
ethical issues related to a protected group (i.e., minor children).
Power. Logistic regression is typically used to find predictive relationships
between variables and outcomes (Meyers, Gamst, & Guarino, 2006). Approximately 300
community college students test into reading and writing remediation per year at the
participating colleges, varying based upon given semester. I conducted a power analysis
using G*Power (see Faul, Erdfelder, Buchner, & Lang, 2009) to determine minimum
sample size to meet the following parameters:

69
Effect size (r): 0.2
∝ error prob: 0.05
Power (1-� prob): 0.80
Minimum sample size: 300 participants
Effect size. Effect size is the size of the association expected to be present in the
sample, providing a meaningful difference between the groups in the study and to
eliminate a potential chance effect (Meyers et al., 2006). In this case, an effect size of 0.2
is standard and provided me with a minimal benchmark for potential effect. Similar
studies have found varying effect sizes; for example, Wilde (2012) found r2 = .231, Field
(2013) found d = 1.02, and Miller and Sundre (2008) found d = 0.86 and 0.63 on separate
tests.
Alpha level. To control for possible Type 1 errors, the standard alpha level is � =
.05, which I used for this study. This is consistent with Wilde’s (2012) analysis of
frustration discomfort as related to GPA, using Harrington’s (2005) Frustration
Discomfort Scale; Koludrović and Ercegovac’s (2015) analysis of academic motivation
in teacher training, using Vallerand et al.’s (1992) Academic Motivation Scale; and the
ASRS-V1.1 (Kessler et al., 2005), commonly used by the World Health Organization and
many other health professionals (Bilkey et al., 2014).
Procedures for Recruitment, Participation, and Data Collection
Participants for this study were community college students who tested below
college-level reading standards and/or below the standard for inclusion in college-level

70
English courses, potentially placing them in remediation, whether standard or corequisite.
I recruited participants through a series of e-mails using the college e-mail system as well
as through the standard course dashboard software. Demographic information collected
included age (to determine ability to participate); race/ethnicity broken into categories of
Black, White, Hispanic, Native American, etc.; and gender, allowing for further analysis
of information based upon such demographics.
Informed consent
I provided participants with informed consent through a description of the study;
the nature of the research project, explaining the reason for their candidacy as a
participant; the risks and benefits associated with the research; and what rights
participants have as research subjects, including the right to withdraw from the study at
any time. The confidential nature of the study was explained in the study description, as
well as how data would be used.
Population and Sample
The survey instruments implemented for this analysis were:
• Frustration Discomfort Scale (Harrington, 2005);
• Adult ADHD Self-Report Scale Symptom Checklist (Kessler et al., 2005);
and
• Academic Motivation Scale (Vallerand et al., 1992).
Timing of the study. I administered surveys during spring, summer, and fall
semesters over the course of a 2-year period. I provided e-mail notifications for
participation during the first week of classes, and I encouraged instructors, with the

71
support of administration officials, to explain the survey as part of the first 2 weeks’
activities for class. Additionally, I visited relevant classrooms to explain the research and
answer related questions for potential participants. The participant pool received
reminders at 2 and 4 weeks into the semester in order to further encourage participation.
Design consistency. My choice of self-report survey methodology is consistent
with all aspects of the investigation, which is regularly used to sample various data at a
single point in time. This is consistent with collecting data for attitudes, as with
frustration discomfort and academic motivation. Studies using the same or similar
instruments and methodology include Wilde (2012) and Maurer et al. (2013).
Practitioners, including educators, medical professionals, The National Institute of
Health, and the World Health Organization, also use self-report data collection to assess
symptoms of ADHD, using Kessler et al.’s (2005) Adult ADHD Self-report Scale
Symptom Checklist.
Exiting the study. I informed potential participants of the study procedure prior
to beginning the online survey. I made every effort to guarantee anonymity and protect
individual participant information, and participants were informed of their right to exit
the survey at any time. By selecting “I agree,” students provided consent to continue the
survey. By selecting “I do not agree,” they automatically exited the survey. Because no
experimental methods were used, no participant harm was experienced, nor were any
questions anticipated to cause mental distress or disturbance. No follow up or debriefing
procedures were used due to the one-time, online survey nature of the study. Participants

72
were able to exit the study by selecting “submit” at the completion of the survey, or by
simply leaving the survey at any time during the process.
Instrumentation and Operationalization of Constructs
Frustration discomfort. Frustration discomfort is considered “the inability or
unwillingness to persist in an activity due to the unpleasant feelings associated with the
task” (Wilde, 2012, p. 3). To assess frustration discomfort and intolerance, I used
Harrington’s (2005) Frustration Discomfort Scale (see Appendix A). According to
Harrington, the scores for each subscale is tallied; the higher the score for each subscale,
the higher the degree of frustration intolerance (Harrington, 2005). These are discrete
variables coded numerically for the purpose of analysis. An excerpt from the scale is
shown in Figure 2.
RATING SCALE: absent = 1 mild = 2 moderate = 3 strong = 4 very strong = 5
1. I need the easiest way around a problem; I can’t stand making a hard time of it.
1 2 3 4 5
Harrington (2005, p. 2)
Figure 2. Frustration Discomfort Scale excerpt.
This scale consists of four 7-item subscales: a) discomfort intolerance, b)
entitlement, c) emotional intolerance, and d) achievement frustration. “This measure
comprises 28 items, each rated on a five-point Likert scale with the following anchors:
(1) absent, (2) mild, (3) moderate, (4) strong, (5) very strong” (Harrington, 2005, p. 1).

73
The components of this self-report survey instrument provide data effective for
identification of frustration intolerance in general and enable the researcher to identify
cognitions potentially related to specific problems, providing avenues for development of
techniques that could reduce or eliminate frustration in remedial courses. I obtained
permission to use the scale from the developer, Neil Harrington, on 7/27/2015, a copy of
which is included in Appendix A, along with the scale.
The scale is comprised of four factors: emotional intolerance, entitlement,
discomfort intolerance, and achievement. Other factors were initially included by
Harrington; however, they were eliminated based on low reliability through pilot tests.
Each component was correlated with the Rosenberg (1965) Self-Esteem Scale, a widely
respected existing measure. Using test-retest method, reliability for subscales was
determined as emotional intolerance � = 0.91, entitlement � = 0.88, discomfort
intolerance � = 0.90, and achievement � = 0.95, giving me assurance that the instrument
provides reliable data. The instrument has been successfully used with a wide range of
populations, such as adults in clinical settings (N = 254; Harrington, 2005), youthful
populations (N = 242; Chih-Hung, Ju-Yu, Cheng-Fang, Chung-Sheng, & Shing-Yaw,
2008), across international populations (N = 171; Ozer, Demir, & Harrington, 2012), and,
as with the focus of the current analysis, among college students (N = 105; Wilde, 2012).
Academic Motivation. Motivation is the process that initiates, guides, and
sustains goal-oriented behaviors (Vallerand et al., 1992). To measure academic
motivation, I used the Academic Motivation Scale (Vallerand et al., 1992; see Appendix
B). Motivation affects individuals’ academic achievement, contributes to a self-concept,

74
self-efficacy, and psychological well-being, and contributes to overall satisfaction with
life and experiences. (Koludrović, & Ercegovac, 2015). I included this factor as part of
this study due to the fact that motivation intensely affects persistence, as with completion
of courses. The Academic Motivation Scale (Vallerand, et al., 1992) is currently and
consistently used for this purpose, which influenced its inclusion as part of this study.
According to the authors, the scale assesses seven types of constructs: “…intrinsic
motivation toward knowledge, accomplishments, and stimulation, as well as external,
introjected, and identified regulations, and finally, amotivation. It contains 28 items (4
items per subscale) assessed on a 7-point scale” (p. 2). The items “…are each rated on a
7-point scale ranging from 1 = ‘Does not correspond at all’ to 7 = ‘Corresponds exactly’”
(p. 1). The higher the score for the item, the greater the significance of the item to the
participant. These are discrete variables for the purpose of this analysis, coded
numerically for SPSS. An excerpt from the scale is shown in Figure 3.
Does not correspond Corresponds Corresponds Corresponds Corresponds
at all a little moderately a lot exactly 1 2 3 4 5 6 7
WHY DO YOU GO TO COLLEGE? 1. Because with only a high-school degree I would not find a high-paying job later on.
1 2 3 4 5 6 7
Vallerand, et al., 1992, p. 2.
Figure 3. Academic Motivation Scale excerpt.

75
My inclusion of this self-report survey instrument is necessary to determine
participants’ incentive for taking classes in order to establish a potential relationship
between motives and the potential existence of frustration, followed by the type and
degree of frustration. Permission to use the instrument is included via communication
with Robert Vallerand, primary author, on March 30, 2016 (see Appendix C).
The scale consists of four subscales comprising a 16-item scale. Using test-retest
methodology, Senécal et al. (1995) reported internal reliabilities for its four subscales as:
intrinsic, � = .89, identified regulation, � = .61, external regulation, � = .80, and
amotivation, � = .84. By its design, this scale analyzes motivation in college. The
instrument has been successfully utilized in analyses of students at 2-year community
colleges (N = 498; Senécal et al., 1995), undergraduate education majors (N = 166; Çetin,
2015), international students (N = 566; Koludrović & Ercegovac, 2015), college students
from small versus large high schools (N = 266; Horyna & Bonds-Raacke, 2012), as well
as online motivational influences of college students (N = 105; Aubry, 2013). These
studies clearly indicate the reliability and validity of the scale, as well as its ongoing
importance and utilization in the research community.
Adult ADHD. The ASRS-V1.1 (Kessler et al., 2005; see Appendix C) was used
to measure students’ levels of ADHD symptomology. According to the National Institute
of Health (2016), “Attention-deficit/hyperactivity disorder is a brain disorder marked by
an ongoing pattern of inattention and/or hyperactivity-impulsivity that interferes with
functioning or development” (para. 1). Permission to use the scale is included with scale

76
documentation (Kessler et al., 2005) via communication with Ronald Kessler, primary
author, on March 21, 2016 (see Appendix C).
The ASRS-V1.1, an eighteen-item, self-report questionnaire measures this
variable. Each question asks how often a particular symptom has occurred over the past 6
months with responses of never (0), rarely (1), sometimes (2), often (3), and very often
(4). Four or more responses of “sometimes,” “often,” and “very often” on Scale A of the
instrument, “may be consistent with adult ADHD” (p. 3). Additional information for
health care providers is located in Scale B to assist with further diagnosis of the disorder.
This instrument is currently and consistently used as a screening device for ADHD
among health care providers and agencies, including the U.S. National Institute of Health
and the World Health Organization. Participants in my study were further instructed to
consult with a healthcare professional for additional questions or concerns. These are also
discrete variables for the purpose of analysis, coded numerically for SPSS. An excerpt of
the instrument is included in Figure 4.
Never Rarely Sometimes Often Very Often
1. How often do you have trouble wrapping up the final details of a project, once the
challenging parts have been done? 0 1 2 3 4
Kessler et al., 2005, p. 3.
Figure 4. ASRS-V1.1 excerpt.

77
According to Kessler et al. (2007), the internal reliability of the six question self-
report instrument ASRS-V1.1 was in the range of 0.63–0.72 and test-retest reliability in
the range of 0.58–0.77 (Pearson correlations) for the various factors. This instrument is
widely used by professionals, educators, and practitioners, and is supported by The
World Health organization as a screening device for referral for diagnosis. This scale has
been used across numerous studies with a wide age range of adults (both male and
female), as well as international participants, and in a variety of clinical settings for those
under psychiatric and psychological care, among United States and international
participants (N = 170, Sanchez-Garcia et al., 2015; N = 880, Bolton, Hughes, & Kessler,
2008; N = 1031 / N = 3298; Yeh, Gau, Kessler, & Wu, 2008).
Operationalization
Demographic data. Students provided basic demographic information including
gender (M/F string variable), age (discrete variable for screening of individuals under 18
as well as analysis of age as a factor), and race (Asian/Black/Hispanic/Native American,
etc., string variables) for simple categorization data. They were also tracked using a
classification number to for persistence/attrition, in this case, their college identification
numbers, consistent with similar studies. Colleges participating in the analysis were
assigned institutional tracking information as dichotomous variables (R/M), coded as
string variables for SPSS.
Remedial courses/remediation. Students who test below college-level skills in
reading and or writing are either placed in remedial courses or corequisite remediation
courses where skills development scaffolding and support is provided throughout a
78
standard course. According to the National Assessment Governing Board (2011), the
standard cut scores for reading comprehension placement into remediation include ACT
score of 17 or below, COMPASS score of 73 or below, or ACCUPLACER score of 79 or
below. The standards for writing placement into remediation include ACT English score
of 21 or below, COMPASS score of 74 or below, or ACCUPLACER score of 87 or
below for writing skills on entrance placement tests. This is consistent with current
standards in college placement testing (National Assessment Governing Board, 2011).
For my research, remediation is divided into two categories: standard remedial
courses and corequisite remediation (dichotomous variables coded as string variables for
SPSS). Standard remedial courses are courses which focus specifically on improving
students’ skills to those levels considered college level. Corequisite remedial courses are
college-level courses made up of a mixture of those possessing adequate and those with
inadequate skills. Those with inadequate skills are provided assistance throughout the
course in order to advance their abilities to that required for the course.
College persistence/success. Persistence or success in college is considered the
process of continuing to completion of the degree or program (Bahr, 2012). For this
research, students are considered successful/persistent if they compete the
remedial/corequisite reading or writing course, and sign up for further courses at their
respective college, consistent with Bahr (2012, p. 664). These are also dichotomous
variables, coded as string variables for SPSS.

79
Data Analysis Plan
For this analysis, I used IBM Statistical Package for the Social Sciences-25
(SPSS; IBM, 2017), the standard software for processing data in the social sciences. This
provided information related to predictive potential to determine if students who test high
in frustration discomfort (Wilde, 2012) and/or ADHD (Bilkey et al, 2014) are likely to
persist in remedial or corequisite reading/writing courses. Similarly, the type and degree
of motivation can also be used for predictive potential related to persistence in college
(Koludrović & Ercegovac, 2015).
Data Cleaning and Screening Procedures
For my analysis, no one under the age of 18 was permitted to participate due to
ethical issues concerning a protected group as well as issues related to obtaining parental
permission. Individuals indicating they were 17 or younger were removed from the study.
Data cleaning continued with removal of duplicate via SPSS. Using descriptive tests, I
examined initial data values to see if they fell within the expected range and if data
corresponded appropriately to the research questions and fell within the expected range
for each question. I encode variables appropriately to type, including 0/1 for nominal
(dichotomous) variables (corequisite/standard remediation) and persistence/attrition. For
continuous variables, 1-5 correspond to the Frustration Discomfort Scale (Harrington,
2005), 0-4 correspond to the ASRS-V1.1 (Kessler, et al., 2005), and 1-7 correspond to the
Academic Motivation Scale (Vallerand, et al, 1992).
Next, I checked data for completion. Incomplete surveys were potentially used if
full sections of independent survey components were completed as appropriate. For

80
example, a fully completed Frustration Discomfort Scale (Harrington, 2005) could still be
tracked even if the other instruments were not completed. Additionally, a single subscale
of the Frustration Discomfort Scale could still be used even if the full scale was not
completed. Incomplete survey information will be coded appropriately using standard
SPSS coding for missing data, such as information missing at random, testing
fatigue/drop out, not applicable, system error, etc.
Research Questions
As the outcome variables (persistence, retention) for this research were
operationalized using discrete, binary classifications, I anticipated using binary logistic
regression methods to test the research hypotheses related to each of the research
questions. The research questions represented logical steps to evaluate (1) the
relationship between type of intervention and outcome probability; (2) the relationship of
each of the potentially mediating person variables and outcome probability; and, (3) the
overall model which includes all four predictors.
Research Question 1: Does type of intervention for reading/writing skill deficits
predict the likelihood of persistence and/or retention among college students
receiving the intervention?
H01: Type of intervention for reading/writing skill deficits does not predict
the likelihood of persistence/retention (as measured by completion of the
course), among college students receiving the intervention.

81
H11: Type of intervention for reading/writing skill deficits significantly
predicts the likelihood persistence/retention (as measured by completion
of the course), among college students receiving the intervention.
Research Question 2: Does frustration discomfort predict the likelihood of
persistence and/or retention among college students receiving an intervention for
reading/writing skill deficits?
H02: Frustration discomfort (as measured by the Frustration Discomfort
Scale; Harrington, 2005) does not predict the likelihood of
persistence/retention (as measured by completion of the course) among
college students receiving the intervention for reading/writing skill
deficits.
H12: Frustration discomfort (as measured by the Frustration Discomfort
Scale; Harrington, 2005) significantly predicts the likelihood of
persistence/retention (as measured by completion of the course), among
college students receiving the intervention for reading/writing skill
deficits.
Research Question 3: Does student motivation predict the likelihood of
persistence and/or retention among college students receiving an intervention for
reading/writing skill deficits?
H03: Student motivation (as measured by the Academic Motivation Scale;
Vallerand et al., 1992) does not predict the likelihood of
persistence/retention (as measured by completion of the course), among

82
college students receiving the intervention for reading/writing skill
deficits.
H13: Student motivation (as measured by the Academic Motivation Scale;
Vallerand et al., 1992) significantly predicts the likelihood
persistence/retention (as measured by completion of the course), among
college students receiving the intervention for reading/writing skill
deficits.
Research Question 4: Does ADHD predict the likelihood of persistence and/or
retention among college students receiving an intervention for reading/writing
skill deficits?
H04: ADHD, as measured by the ASRS-V1.1 (Kessler et al., 2005), does
not predict the likelihood persistence/retention, as measured by
completion of the course, among college students receiving the
intervention for reading/writing skill deficits.
H14: ADHD, as measured by the ASRS-V1.1 (Kessler et al., 2005) does
not predict the likelihood of persistence/retention, as measured by
completion of the course, among college students receiving the
intervention for reading/writing skill deficits.
Research Question 5: In addition to type of intervention received, do person
factors of frustration discomfort, motivation, and ADHD increase the
predictability of the likelihood of persistence and/or retention among college
students receiving an intervention for reading/writing skill deficits?

83
H05: Person factors of frustration discomfort, motivation, and ADHD do
not increase the predictability of the likelihood of persistence and/or
retention among college students receiving an intervention for
reading/writing skill deficits.
H15: Person factors of frustration discomfort, motivation, and ADHD
serve as mediators between intervention and outcome. The model, which
includes consideration of person factors, will increase the predictability of
the likelihood of persistence and/or retention among college students
receiving an intervention for reading/writing skill deficits.
Analysis Plan
As previously stated, I anticipated using binary logistic regression via SPSS.
Logistic regressions are appropriate for predictive relationships between variables as the
dependent variables (persistence and attrition) are binary, ordinal variables (Meyers et al.,
2006. Analyses 1-4 evaluated the relationship between each of the variables (type of
intervention, frustration discomfort, motivation, and ADHD) and each of the dependent
variables. In the final analyses, all variables were entered into the equation to test the
model for each outcome variable. I expected that the relationships between type of
intervention and outcomes would be mediated by the frustration discomfort, motivation,
and ADHD. In particular, students with higher frustration discomfort, lower motivation,
and higher ADHD symptomology were expected to show less positive outcomes across
types of intervention. However, due to the small sample size, with the permission of my
dissertation committee, I analyzed the hypotheses for the study utilizing chi square, t

84
tests, and MANOVA as appropriate for each research question. These tests determine the
relationships between the means and variances between expected and observed values,
also valid methods for this type of research, as discussed by Gravetter and Wallnau
(2009).
Threats to Validity
External Validity
Threats to validity are those factors which could alter the results of the analysis,
both within the test and from without, such as with anything that could change responses
or behaviors. In the social sciences, this is generally seen as anything that could influence
participants to change their responses or behavior due to their participation. For my
analysis, minimal information as to the nature of the study was provided in initial
information for the survey to avoid the potential of influencing participants to higher
expressions of frustration, altered expression of motivation, and/or altered responses to
questions about ADHD. For example, participants could become more easily frustrated at
completing survey items if primed to display or expect frustration. Furthermore,
questions referring to ADHD, such as problems completing tasks, etc., could be
influenced by frustration as well as the disinclination to complete the survey instrument.
Internal Validity
The Frustration Discomfort Scale (Harrington, 2005) was validated using test-
retest methodology among various populations as well as at various times. Furthermore,
it was tested against know scales such as the Rosenberg Self-Esteem Scale (Rosenberg,
1965) to distinguish between self-worth and task frustration. The Academic Motivation
85
Scale (Vallerand et al., 1992) was also validated using similar test-retest methodology.
Finally, the ASRS-V1.1 (Kessler et al., 2005) was twice validated using test-retest
methods across a large convenience sample of health plan subscribers, and subsequently
by clinical professionals, demonstrating strong reliability with clinical diagnoses.
Ethical Procedures
IRB Approval
Institutional Review Board applications to participating institutions were
submitted and agreements are attached (see Appendices F and G). The Walden
University IRB approval number is 11-03-16-0157729. One extension to collect
additional data was approved.
Treatment of Human Participants
I used every precaution to maintain ethical treatment of all participants. First, I
made every effort to design a study that followed all appropriate guidelines and ethical
considerations. Next, I provided participating institutions detailed descriptions and
considerations of the study. IRB approval from both institutions were granted, and
Walden’s IRB further examined the study and provided approval, adding additional
security and safeguards to protect participants.
Ethical concerns related to recruitment. In order to avoid ethical concerns
about social pressure to participate, students were recruited both inside and outside the
classroom, with surveys completed at the student’s leisure. Students were recruited via e-
mail and in remedial or corequisite reading/writing courses. I approached this as an
opportunity for students to assist course design and the learning process based on their

86
learning styles. While I initially considered offering an incentive to participate, I opted to
not so as to add a further level of ethical protection. As participants began the survey,
they were informed that they could exit the study at any time; continuing with the study
was considered informed consent.
As previously described, no one under 18 was included in the study due to ethical
concerns about including protected groups (children) in analyses, as well as having to
obtain parental permissions. Participants were asked to enter their birthdates in the
demographic data in order to screen for age and exclude those under age 18, as well as to
gather data related to age in relation to the content of the surveys (frustration discomfort,
motivation, and adult ADHD).
Next, I minimally informed participants about the nature of the study in order to
avoid priming that could affect the outcome of the questions, as previously described.
They were provided an opening statement:
Your participation will provide important information to your college and
researchers that will help in improving course content, structure, and
implementation, as well as providing improved assistance for students. The
information gathered here will remain confidential and secure, and will be used
anonymously for data gathering purposes only. While you are free to exit the
study at any time, you are strongly encouraged to complete the survey.
Upon completion of the survey, students were provided this further statement:
Thank you for your participation in this important study. Information gathered
about student approaches to the learning situation, as well as information that

87
could potentially affect the learning condition. This information will help us in
improving course content, structure, and implementation, as well as providing
improved assistance for students. Questions are for data-gathering purposes only
and not intended to diagnose, treat, or accommodate any conditions or disorders.
If you have questions or concerns, please consult your school’s student services
office or your health care provider.
Partially incomplete surveys could still be used depending as long as at least one
full component of a survey has been completed. For example, independent subscales of
Harrington’s (2005) Frustration Discomfort Scale (entitlement, gratification,
achievement, etc.) could still provide information for the particular subscale; however,
this information was used in the overall results. Further, completion of a single survey
instrument of the three (Academic Motivation, Vallerand et al., 1992; ASRS-V1.1,
Kessler et al., 2005; Frustration Discomfort, Harrington, 2005) could be used for
comparative analysis with data in that particular scale. No experiments or interventions
were part of the study, so no further ethical concerns were anticipated in that regard.
Treatment of data. All gathered data will be protected to the highest degree of
security possible. Participants were tracked for registration in the next course in the
sequence or for the next semester as indication of success/persistence. Data were stored
on secure servers and password protected. Access to the data is limited to me, as the
researcher, and to those assisting with the study, for analytical purposes only. Data are
being disseminated as part of this dissertation, as well as potentially to professional
journals for publication purposes. No participant is identified in disseminating the

88
information. Participating colleges are being provided with compiled results as part of the
participation agreement, and publication of results will use only terms such as “small 2-
year colleges in the Midwest.” Information will be maintained for seven years in
compliance with the colleges’ secure data requirement and then destroyed. Course
completion information is stored as part of permanent student records; however, when
data from my study are removed, any connection to the student will be deleted as well.
I gathered information from students at my places of employment; however, the
survey was completed online and was not individually administered, under direct
supervision of, or in any way influenced by me as the researcher. I informed study
participants of their right to participate or exit the study at any time, and I offered no
incentives for completion of surveys so as to additionally ensure ethical participation and
data gathering.
Summary
In conclusion, the importance of completing college programs is well-established.
Skills necessary for college include most importantly reading and writing skills, yet
students who enter college with a deficit in these areas are much less likely to persist
(Pruett & Absher, 2015). As stated, I expected to use logistic regression to attempt to
predict connections between frustration discomfort, academic motivation, and potential
ADHD among students at two small Midwestern community colleges. Due to sample
size, and with the permission of my dissertation committee, students were surveyed to
determine possible connections between these factors and completion of
remedial/corequisite reading and writing courses using more appropriate methodology of

89
chi square, t tests, and MANOVA as appropriate. My analysis of gathered data is
described in detail in Chapter 4.

90
Chapter 4: Results
Introduction
The purpose of this study was to explore relationships of types of remediation and
person factors to persistence or attrition among students who test below college level in
the basic skills of reading and writing as they enter college. As previously stated, the
general expectation in the United States is that most individuals will pursue and achieve a
college degree. Remedial reading and writing students typically fare poorly in this
pursuit, with completion rates in these courses 23.3% and 15% lower, respectively, which
has led many to question the actual benefits these courses (Pruett & Absher, 2015).
Colleges have recently shifted their emphasis to corequisite remediation as a preferred
alternative, which has demonstrated improved persistence overall (Adams, 2017).
Because the two types of remediation were in use at the community colleges participating
in this study, I included this factor as part of this study of persistence factors. Of further
interest for the study was frustration discomfort and general academic motivation, both of
which may influence persistence. Finally, adult ADHD was of primary concern due to the
long-established connection between reading/writing difficulties, and frustration and lack
of persistence associated with the disorder (see Bilkey et al., 2014; Oguntoyinbo, 2012;
Willcutt & Pennington, 2000).
This chapter begins with a description of data collected for the analysis, including
participant demographics. It continues with detailed results of the testing, evaluation
of assumptions, and hypotheses testing. The chapter concludes with a transition to
Chapter 5.

91
Data Collection
For this study, I recruited participants were between August 2016 and December
2018, corresponding to semester schedules at the participating colleges. After seven
semesters, 104 participants were recruited, whereupon data collection ended. Of these, 72
participants provided sufficient survey responses to be included in the analysis.
I recruited participants were recruited from two, small, Midwestern 2-year
community colleges. Each of these institutions granted me permission to recruit
participants from students who tested below standard levels for college reading and
writing through typical college placement testing, including COMPASS,
ACCUPLACER, and/or the ACT and SAT. The participant pool included those who
were enrolled in standard or corequisite remediation for reading and writing. Recruitment
occurred initially via e-mail invitations at the start of each semester as well as visits to
these classrooms to explain the study and e-mail reminders sent later in the semester.
During recruitment, I informed potential participants as to the nature of the study and
described it as an analysis of individual learning styles. Terms such as frustration,
motivation, impatience, intolerance, attention deficit, etc., were intentionally not used so
as to avoid influencing survey responses and the outcomes of the analysis.
As I previously mentioned, surveys were offered online (through
freeonlinesurveys.com) provided via an e-mail link and were completed by students on
their own time and at their own discretion. In the survey, participants were given a brief
description of the study and the option to continue or exit the survey, making
participation purely voluntary. No incentives were provided to recruit participants,

92
avoiding the potential of undue influence to participate. I ensured minimal risk to
participants by protecting privacy and confidentiality at each step of the research. Only
each college’s institutional research department, and me, as the researcher, had
knowledge of and use of collected information so as to be able to connect survey
information to student persistence data, a method approved by each college’s IRB as well
as that of Walden University. This is considered standard for research that must connect
student information to course completion and persistence data. The online survey service
used for this study further protected volunteers’ privacy by not identifying individual
devices used in the completion of surveys.
Participant Demographics
I collected basic demographic information from each participant via the survey.
Ages of participants ranged from 18-57 years of age, with age data gathered in order to
exclude children from the analysis; the mean age was 25.5 years old. Females comprised
61.1% of participants and males, 38.9%. The two community colleges involved in the
analysis were predominantly White, with this characteristic represented among
participants. Among them, 5.6% identified as African American/Black, 2.8% as Asian,
4.2% as White Hispanic, 1.4% as non-White Hispanic, and the remaining 86.1% of
participants identified as White. As I previously stated, 104 participants qualified for the
analysis; however, 32 were excluded due to not providing sufficiently completed survey
information to be included in the study, leaving 72 participants (approximately 70% of
the total qualified participants) for the analysis. While 300 participants were identified to
test the hypotheses using binary logistic regression, with the approval of my dissertation

93
committee, I determined that analysis could be completed using alternative methodology
due to the small sample size.
Table 1
Participant Demographics
Frequency Percent
Age
18–19 28 38.9
20–29 29 40.5
30–39 8 11.2
40–49 2 2.8
50+ 5 7.0
Sex
Female 44 61.1
Male 28 38.9
Race
African American/Black 4 5.6
Asian 2 2.8
Hispanic (White Hispanic) 3 4.2
Hispanic (non–White) 1 1.4
White (non–Hispanic) 62 86.1
ADHD diagnosis
Yes 10 13.9
No 58 80.6
Don’t know 4 5.6
Note. N = 72

94
Results
To collect participant data, I used an online survey provider (i.e.,
freeonlinesurveys.com). Numerical data collected from the site were then transferred to
an Excel spreadsheet and organized. I then loaded the data file into an SPSS Version 25
data file, where categorical information was encoded, variables were labeled, and data
cleaned and explored for missing values.
Missing Data
As previously stated, 32 surveys (over 32% of possible responses) had significant
missing information and were eliminated from the analysis. For those participants with
occasional missing data, I performed Little’s Missing Completely at Random (Little’s
MCAR) analysis and found that the missing data were within acceptable parameters (p >
.05). Using SPSS, missing values were then imputed using mean values, consistent with
guidelines suggested by Meyers et al. (2006).
Assessments of Internal Reliability of Research Measure
All scales used in this study were selected because of previous reports of
acceptable internal reliabilities using Cronbach’s alpha (> .70) for the general population.
Before computing the scale scores for research variables used in this study, I conducted
an analysis of internal reliability for the sample to ensure that reliability was within
acceptable parameters. Overall, each of the three measures’ subscales used in this study
demonstrated acceptable to high internal reliability. The internal reliability results are
summarized in Table 2.

95
Table 2
Internal Reliabilities for Research Scales
Scale tested Cronbach’s Number
alpha of items
Frustration Discomfort Scale .922 28
Discomfort Intolerance (FD_DI) .815 7
Entitlement (FD_EN) .815 7
Emotional Intolerance (FD_EI) .815 7
Achievement (FD_AC) .790 7
Academic Motivation Scale .915 28
Intrinsic Motivation – to Know (AM_IN_KN) .788 4
Intrinsic Motivation – toward Accomplishment (AM_IN_AC) .858 4
Intrinsic Motivation – to Experience Stimulation (AM_IN_ES) .848 4
Extrinsic Motivation – Identified (AM_EX_ID) .750 4
Extrinsic Motivation – Introjected (AM_EX_IN) .885 4
Extrinsic Motivation – External Regulation (AM_EX_ER) .842 4
Amotivation (AM_AM_OV) .778 4
Adult Self-Report ADHD Questionnaire .868 18
ADHD-A .768 6
ADHD-B .868 12
Note. N = 72

96
Evaluating Assumptions for Analysis
In this study, I examined type of remediation and person factors as related to
persistence among remedial students in community colleges. There were two types of
remediation to compare: traditional remediation, where students take a full course
preceding entrance into college-level courses, and corequisite remediation, where
students are enrolled in lab-type support sections concurrently with college-level courses.
Person factor variables were frustration discomfort, academic motivation, and self-
reported indicators of adult ADHD. I anticipated using binary logistic regressions, with
persistence group as the dependent variable, to test Research Questions 2–4; however,
due to the smaller than planned sample sizes, binary logistic regressions were not
possible. Instead, and with the permission of my dissertation committee,
t tests were employed to compare remediation groups on means for person variable
scores. The research questions/hypotheses were revised to reflect these changes in
analyses for Research Questions 2–4. I used 2 (persistence) X 2 (remediation)
MANOVA, with person variables as the dependent measures, used to evaluate Research
Question 5.
The mean ratings were computed for each of the subscales on all four measures. I
used the SPSS “explore” function to evaluate the distributions of scale scores for outliers
and normality by examining computed values for skewness and kurtosis as well as
histograms, q-q plots, and box plots.
My examination of box plots indicated outliers for two subscales. First, the
Frustration Discomfort Scale subscale, Amotivation, contained several outliers which

97
will described below. Furthermore, the ASRS-V1.1 Subscale B scores as a continuous
measure indicated one outlier (< 1%) above the mean, which was corrected using
the maximum normed residual test (see Barnett & Lewis, 1998) whereby the value of the
outlier value is changed to that of the next observed value that is closer to the mean and
not an outlier. Table 3 presents the descriptive statistics for all of the scale scores.
Table 3
Descriptive Statistics for Research Variables
Research variable M SD Skewness Kurtosis
Frustration Discomfort Scale
Discomfort intolerance 2.06 .77 .55 -.39
Entitlement 2.49 .88 .33 -.61
Emotional intolerance 2.41 .87 .24 -.97
Achievement 3.07 .87 -.16 -.23
Academic Motivation Scale
Intrinsic motivation – to know 4.95 1.30 -.35 -.65
Intrinsic motivation –
toward accomplishment 4.18 1.50 .04 -.28
Intrinsic motivation –
to experience stimulation 3.20 1.52 .43 -.44
Extrinsic motivation – identified 5.73 1.12 -.75 -.15
Extrinsic motivation – introjected 4.89 1.64 -.55 -.73
(table continues)

98
Research variable M SD Skewness Kurtosis
Extrinsic motivation –
external regulation 5.16 1.55 -.82 .16
Amotivation 1.56 1.01 2.41 6.63
Adult ADHD Self-Report Scale Symptom Checklist
Subscale A 2.71 .80 -.02 -.69
Subscale B – Adjusted 2.57 .73 .06 -.21
Note. N = 72
Assumption of Normality
Before conducting parametric statistical tests, it was necessary to evaluate the
characteristics of the continuous variables that would be used as the dependent variables
for the between-group analyses. As may be seen in Table 3, skewness and kurtosis for the
Academic Motivation subscale, Amotivation, were initial indicators of problems with
normality for this subscale (see Appendix A). Inspection of the histogram supported this
observation. Because of this, I converted the subscale to a discrete variable using a
median split to classify students as either low or high amotivation. After examination of
other distributions, all other subscales were assumed to approximate normality
sufficiently to allow for use of parametric statistics.

99
Assumption of Homogeneity of Variance
The Levene’s test was used to evaluate homogeneity of variance for all parametric
tests. I had planned to use the related statistical t test outcome where homogeneity could
not be assumed. This was necessary only for one t test: Amotivation.
Hypotheses Testing
As previously discussed, I anticipated using binary logistic regression for my
analyses. However, due to the small sample size, this analysis was not possible. With
approval from my dissertation committee, I used chi square analysis where both variables
were discrete, and t tests and a MANOVA where the dependent variables were
continuous.
This meant that a chi square test was used for Research Question 1, to evaluate
the association between type of remediation and persistence, and for the association
between amotivation and persistence. For Research Questions 2-4, I used t tests to
compare groups of students who did or did not show persistence, and a MANOVA was
employed to evaluate between-group differences on persistence with consideration both
the situational variable (type of remediation) as a second independent variable, and all
person variables (except amotivation) as dependent variables. My research questions
have been reworded to reflect change in the types of analyses.
Research Question 1
Does type of intervention for reading/writing skill deficits predict the
likelihood of persistence and/or retention among college students receiving the
intervention?

100
Table 4 presents a 2 X 2 crosstabulation of the frequency of students falling into
each persistence classification (no, yes) with frequency of students in each of the
remediation groups. Results suggested a trend, but not a statistically significant difference
in persistence for the two remediation groups, χ2(1, N = 72) = 3.707, p < .054. Phi = .227.
Thus, the null hypothesis was not rejected.
Table 4
Frequency of Persistence Among Students in the Two Remediation Groups
Remediation group /
persistence Did not persist Persisted
Standard remediation 12 35
Corequisite remediation 12 13
Note. N = 72
Research Question 2
Do persisters and nonpersisters among college students receiving an
intervention for reading/writing skill deficits differ in frustration discomfort, as
measured by the Frustration Discomfort Scale (Harrington, 2005)?
Means, standard deviations, and results of the t tests for the subscales for
frustration discomfort are summarized in Table 5. As may be seen, there were no
significant differences between persisters and nonpersisters on frustration discomfort.
The null hypothesis was not rejected.

101
Table 5
Differences Between Persisters and Nonpersisters on Frustration Discomfort
Persistence group
Subscale Yes No t value df Sig.
Discomfort Intolerance 1.94 (.73)a 2.30 (.19) - 191 70 n.s.
Entitlement 2.45 (.85) 2.58 (.95) - .57 70 n.s.
Emotional Intolerance 2.39 (.87) 2.44 (.90) -.26 70 n.s.
Achievement 3.15 (.88) 2.90 (.89) 1.13 70 n.s.
Note. a Mean (SD), N = 72; p < .05 (2-tailed)
Research Question 3
Do persisters and nonpersisters among college students receiving an
intervention for reading/writing skills deficits differ in motivation, as measured by
the Academic Motivation Scale (Vallerand et al., 1992)?
Means, standard deviations, and results of the t tests for the subscales for
academic motivation are summarized in Table 6. Table 7 presents the chi square results
for testing the association between persistence group and amotivation level. As may be
seen, there were no significant differences between persisters and nonpersisters on
subscales for academic motivation. The null hypothesis was not rejected.

102
Table 6
Differences Between Persisters and Nonpersisters on Academic Motivation
Persistence group
Subscale Yes No t value df Sig.
Intrinsic - to Know 5.11 (1.32)a 4.65 (1.26) 1.42 70 n.s.
Intrinsic – toward Accomplishment 4.40 (1.62) 3.75 (1.14) 1.77 70 n.s.
Intrinsic – to Experience Stimulation 3.34 (1.60) 2.89 (1.34) -1.2 70 n.s.
Extrinsic – External Regulation 5.12 (1.51) 5.24 (1.17) -.306 70 n.s.
Extrinsic – Identified 5.62 (1.23) 5.96 (.86) -1.23 70 n.s.
Extrinsic – Introjected 5.07 (1.62) 4.54 (1.64) 1.30 70 n.s.
Note. a Mean (SD), N = 72; p < .05 (2-tailed)
As previously stated, due to skew and kurtosis factors, the Amotivation subscale
was converted to discrete variables with designated categories of low and high
motivation.
Table 7 presents a 2 X 2 crosstabulation of the frequency of persistence for
students in each of the Amotivation groups. Results suggested no statistically significant
difference in persistence for the two amotivation groups, χ2(1, N = 72) = 1.54, p < .695.
Phi = -.046. Thus, the null hypothesis was not rejected.

103
Table 7
Frequency of Persistence Among Students in the Two Remediation Groups
Amotivation group /
persistence Did not persist Persisted
Low amotivation 19 36
High amotivation 5 12
Notes. N = 72, χ2(1, N = 72) = 1.54, p < .695. Phi = -.046
Research Question 4
Do persisters and nonpersisters among college students receiving an
intervention for reading/writing skill deficits differ in self-reported adult ADHD as
measured by the ASRS-V1.1 (Kessler et al., 2005)?
Means, standard deviations, and results of the t tests for the subscales for self-
reported Adult ADHD symptoms are summarized in Table 8. As may be seen, there was
a statistically significant difference between persisters and nonpersisters on overall scores
for ADHD, t(70) = -2.76, p = .007, and for each of the subscales: ADHD-A, t(70) = -
3.34, p = .001, ADHD-B, t(70) = -2.18, p = .033. Therefore, the null hypothesis was
rejected.

104
Table 8
Differences Between Persisters and Nonpersisters on Adult ADHD Self-Report Symptoms
Persistence group
Subscale Yes No t value df Sig.
ADHD-A 2.50 (.74)a 3.13 (.76) -3.34 70 .001
ADHD-B 2.44 (.76) 2.82 (.60) -2.18 70 .033
ADHD-Full Scale 2.46 (.72) 2.92 (.59) -2.76 70 .007
Note. a Mean (SD), N = 72; p < .05 (2-tailed)
Research Question 5
Do persisters and nonpersisters in the two remediation programs differ on
person variables?
Group means on overall person variable measures are summarized in Table 9. A
2 (persistence group) X 2 (type of remediation program) MANOVA was conducted on
overall scores for the three person variables, frustration discomfort, academic motivation,
and self-reported adult ADHD symptoms. Overall scores, rather than subscales scores,
were evaluated due to challenges for statistical power with the sample sizes.
Results of the Box’s M test indicated the observed covariance matrices of the
dependent variables were equal across groups. Group means and results of the
MANOVA are summarized in Tables 9 and 10. Using Pillai’s trace (see Table 9), there
was no relationship between type of remediation and person factors, nor interaction

105
between type of remediation and persistence group. On the other hand, there was a
statistically significant relationship between persistence and person factors, Pillai’s trace
= .115, F(3, 72) = 2.87, p < .05, partial η2 = .115, but this outcome is unreliable due to the
low effect size and power of the analysis.
Table 9
Mean Scores for Person Variables Among Persisters and Nonpersisters in the Two
Remediation Groups
Remediation group
Persistence group Standard Corequisite
Frustration Discomfort
Persister 2.49 (.67, 35)a 2.46 (.69, 13)
Nonpersister 2.22 (.67, 12) 2.89 (.74, 12)
Academic Motivation
Persister 4.27 (1.07, 35) 4.44 (1.02, 13)
Nonpersister 3.81 (.63, 12) 4.35 (.64, 12)
Self-Report Adult ADHD
Persister 2.44 (.73, 35) 2.53 (.59, 13)
Nonpersister 3.06 (.65, 12) 2.89 (.60, 12)
Note. a Mean (SD), N = 72; p < .05 (2-tailed)

106
Table 10
Results of 2 X 2 MANOVA for Overall Scores on the Person Variables
Factor Pillai’s trace F df1 df2 Sig. ηp2
Persistence group .12 1.03 3 66 .043 .66
Type of remediation .07 2.87 3 66 .214 .39
Type of remediation X
persistence group .06 1.42 3 66 .244 .36
________________________________________________________________________
Notes. a Mean (SD), N = 72; p < .05 (2-tailed)
Summary
Overall, the results of this analysis indicated that the type of remediation was not
related to students’ persistence. Further, self-reported adult ADHD was the only person
factor that was significantly related to persistence among this group of participants.
Frustration discomfort and academic motivation did not appear to be relevant to
persistence in college among these participants. A discussion of results and findings
follow in Chapter 5, along with a discussion of limitations of the study, how these results
relate to current research, and implications for future research.

107
Chapter 5: Discussion, Conclusions, and Recommendations
Introduction
The purpose for this quantitative study was to determine if 2-year college student
persistence in remedial reading and writing courses is based on person factors of
frustration discomfort, academic motivation, and adult ADHD and/or on type of
remediation (i. e., standard remedial courses or corequisite remediation). In this chapter, I
discuss the findings as related to the literature on persistence in college and implications
for use by education professionals to assist in college persistence among adults in 2-year
college programs. The chapter concludes with a discussion on the limitations of the
study, implications for further research, and a brief summary. Of the factors studied, I
found that self-reported ADHD symptomology was the only factor that significantly
predicted persistence in reading and writing remediation.
Interpretation of the Findings
Two-year community colleges typically admit significant numbers of students
requiring remedial support in reading, writing, and math (Pruett & Absher, 2015).
Traditional, stand-alone remediation courses have been the customary method for
building skills necessary to proceed into college-level courses; however, reading and
writing remedial courses have been associated with strikingly high attrition rates,
particularly if students are required to repeat the course over successive terms prior to
being able to begin foundational or majors-related courses (Complete College America,
2012). Searching for solutions, educators began to institute corequisite remedial support
sections, taken concurrently with foundational courses, as a strategy to encourage student

108
progression and avoid attrition, demonstrating striking success reported in some instances
(Adams, 2017).
Type of Remediation
Adams (2017) discussed persistence improvement upon adoption of corequisite
remediation. Unlike this report, I found that the persistence rate was not significantly
different between those who persisted (n = 48) and those who did not (n = 24). The
limitations of my results due to small sample size will be discussed in subsequent
sections of this chapter.
Frustration Discomfort and Intolerance
Additionally, I investigated frustration discomfort as a potential persistence
factor, particularly because those who experience high frustration discomfort and
intolerance have been demonstrated to be less likely to persist in activities when need
frustration fails to balance with need satisfaction (Vansteenkiste & Ryan, 2013);
therefore, students who become frustrated with perceived delays in their educational
programs through the remedial process may be less likely to persist, leading to attrition
from college. Again, this factor did not achieve statistical significance. The findings will
be discussed in greater depth in the subsequent section on the limitations of the study.
Academic Motivation
The third factor that was examined as a potential factor influencing attrition was
that of academic motivation. Motivation is decidedly tied to performance (i.e., GPA) and
persistence in the educational process (Wheeless et al., 2011). Academic performance can
be delayed or limited when students base their educational pursuits on motivations that

109
are less enduring, such as extrinsic needs for immediate gratification; extrinsic motivation
promoted by significant influencers such as parents or society in general, or by simply
lacking motivation for college. However, for the participants in my study, motivation was
not related to persistence.
ADHD
The final and central aspect of this study was self-reported adult ADHD
symptoms, a disability that can result in lack of emotional self-regulation, increased
levels of frustration, and decreased levels of perseverance in pursuits (see Burns &
Martin, 2014). Of the elements investigated in this study, this is the only person factor
that demonstrated significance as a predictor of persistence in college. Therefore, my
findings for this factor were consistent with previous theory and research into ADHD as a
risk factor for academic performance and achievement (see Bilkey et al., 2014 and
Oguntoyinbo, 2012). This one finding highlights the importance of identifying and
offering remedial support that may be even more tailored to individuals with ADHD
symptoms. Only 1 in 10 individuals who are suffering with ADHD are actually diagnosed
(Bilkey et al., 2014), while less than half of those diagnosed receive no accommodations
for the disability (Oguntoyinbo, 2012).
Limitations of the Study
After conducting this analysis, I identified several factors that limit
generalizability. First and foremost was the limited response rate and resulting small
sample size. Over the course of seven semesters, with a participant pool of approximately
1,000 subjects recruited, only 104 chose to begin the study. Of these, after reviewing the

110
survey information provided, 32 participants failed to provide sufficient information to be
included in the analyses. According to the chief strategy officer at one of the colleges
under study, low participation rates may not be atypical for survey response at these
community colleges. Low response rates have been related to disinterest in completing
the survey; limited time for participation due to life demands; or, interestingly, symptoms
of ADHD, which proved a significant factor in persistence among students who actually
did complete the survey, warranting potential further study.
The small sample size further limited power of the analysis such that the
originally planned analyses (i.e., binary logistical regressions) could not be performed.
Instead I used chi square, t tests, and MANOVA as replacements to explore relationships
among the mean variables, but these were not directly reflective of the prediction model
that was conceptualized for the originally framed research questions.
I also cannot be sure of how representative my sample was of students who
participated in these two remediation groups. For example, I am uncertain if my findings
from those who did complete the survey are generalizable to those who did not
participate at all by even looking at the survey, or those who looked at the survey but did
continue, or those who provided limited numbers of responses without completing the
survey. Furthermore, some of the person factors that are known to limit academic
motivation and performance (i.e., frustration, motivation, and ADHD) may also impede
initial willingness to participate in and/or complete this kind of survey. These potentially
confounding factors warrant further exploration and consideration of methods of research
in this area.

111
Recommendations
My experience during this study has highlighted the challenges to research in this
area with students who may be less likely to participate in written surveys. My first
recommendation for ongoing research is to consider some type of incentive for
participation. After the first term when I noted low response rates, I considered adding an
incentive, such as a $5 gift card, for participation. However, this was not viable, and
because the first contingent were not offered incentives, I felt it inappropriate to do so. I
also believe that if there had been minimal course credit (i.e., extra credit) allotted for
participation, this may have improved participation.
The community colleges with whom I worked as community partners were
helpful in disseminating recruitment materials and providing information on the students’
persistence activities. In the future, perhaps researchers and educators can join forces to
assess needs and risk factors, such as self-reported ADHD, among students who enter
into remediation activities. Then, educators, working with institutional offices of
disability support services may be able to develop and evaluate additional ways to offer
more personalized support for such needs during the remediation experience.
Implications for Positive Social Change
In this study, I analyzed the type of remediation along with person factors that
could relate to persistence or attrition among 2-year community college remedial reading
and writing students. Contrary to previous literature demonstrating dramatically higher
rates of persistence in relation to type of remediation, I did not find this to be true.
112
However, due to the small sample size and reduced statistical power in my study,
previous findings could potentially be further verified with a larger group of participants.
A significant factor for this analysis was that self-reported adult ADHD
symptoms, a disability recognized by the APA (2013), significantly predicted persistence
in remedial reading and writing courses. Therefore, positive a social change implication
of this study would be to encourage early testing for this factor as a disability protected
under IDEA (2006). If students are at higher risk of attrition due to a protected disability,
it is unconscionable that they should be denied the benefits of post-secondary education
because of a disability. Pending further investigation utilizing a larger sample size, this is
a factor that can and should be addressed more closely across all institutions of higher
learning.
Most, if not all, institutions of higher learning house offices of disability services
that are designed to support such students. Early diagnosis of adult ADHD using the 18-
question survey used in this analysis, or the six-question abbreviated version (i.e., Adult
Self-Report Scale – V1.1 Screener; Kessler, et al., 2005) could easily be encouraged and
implemented, providing important indications of how to best support and accommodate
these students. Additionally, active monitoring of student progress in remediation is
further indicated, which will offer insight into at what point progress may begin to
decelerate, giving students the opportunity to utilize indicated accommodations, such as
additional support through tutoring, etc. Proactive (i.e., intrusive) advising models would
be appropriate and highly recommended for these at-risk students so that institutions can
remain abreast of progress and threats to persistence. Combining these recommendations

113
with supportive, caring campus communities could help provide students with the
opportunity for higher rates of persistence and success in their post-secondary academic
pursuits. While not all factors involved in educational persistence/attrition decisions can
be accounted for, early diagnosis of adult ADHD can relatively quickly be determined,
providing potentially better outcome opportunities for all students and addressing a
disadvantage that students with this disability face. Again, further analysis using a larger
sample size is recommended to determine if subsequent research supports the findings of
this study.
Conclusion
Contrary to previous findings regarding persistence/attrition in remedial
reading/writing courses, the type of remediation did not significantly impact participants’
persistence in college in this study. Adams (2017) reported that students’ persistence
dramatically improved with the establishment of corequisite remediation, while
participants in my study did not demonstrate significantly higher levels of persistence due
to type of remediation. Further analysis with a larger participant group is highly
recommended for this factor.
However, self-reported adult ADHD emerged as the single most important
predictor of persistence among the students who participated in my study. This outcome
echoes the voices of others who have tried to advocate for specialized support of these
students. For example, Willcutt and Pennington (2000) noted that students with ADHD
were more likely to present with reading disabilities (and relatedly, writing difficulties), a
related predictor of lower persistence. Mamiseishvili and Koch (2011) stated that nearly

114
one-fourth of students with disabilities (adult ADHD among these) did not return after
their first year in college, while over half did not return after their second year. These
statistics potentially parallel attrition rates for remedial students, which leads to questions
regarding whether remediation type is truly the issue with attrition or if it is more
basically the presence of adult ADHD. Alao (2015) reported a lack of studies that have
analyzed the implications of adult ADHD among college students, which suggests further
analysis, and minimally, increased recommendations for testing and utilization of support
provisions for these at-risk students as part of IDEA (2006). However limited in scope,
the findings from this study underscore the need for diagnosis and appropriate support for
these students.

115
References
Abu, S., Adera, B., Kamsani, S. R., & Ametepee, L. (2012). Addressing the increasing
college student attrition rate by creating effective classroom interaction. Review of
Higher Education and Self-Learning, 5(16), 16-25.
Adams, P. (2017). Corequisite support case study: Community College of Baltimore
County. Complete College America. Retrieved from
https://completecollege.org/article/corequisite-support-case-study-community-
college-of-baltimore-county/
Ajzen, I. (1991). The theory of planned behavior. Organizational Behavior and Human
Decision Processes, 50(2), 179-211.
Alao, A. (2015). Educational accommodations for college students with ADHD. Brown
University Child & Adolescent Behavior Letter, 31(3), 1-7.
American Psychiatric Association. (2013). Diagnostic and statistical manual of mental
disorders (5th ed.). Washington, DC: Author.
American Psychological Association. (2015). Glossary of psychological terms. Retrieved
November 28, 2015, from http://apa.org/research/action/glossary.aspx?tab=6
Bahr, P. R. (2012). Deconstructing remediation in community colleges: Exploring
associations between course-taking patterns, course outcomes, and attrition from
the remedial math and remedial writing sequences. Research in Higher
Education, 53(6), 661-693.
Barnett, V, & Lewis, T. (1998). Outliers in statistical data (3rd ed.). New York, NY: John
Wiley & Sons.

116
Bean, J. P., & Eaton, S. (2000). A psychological model of college student retention. In J.
M. Braxton (Ed.), Reworking the departure puzzle: New theory and research on
college student retention (pp. 48-61). Nashville, TN: University of Vanderbilt
Press.
Berger, A. (2011). Illustrating a developmental pathology of self-regulation: The case of
ADHD. In Self-regulation: Brain, cognition, and development (pp. 105-132).
Washington, DC: American Psychological Association. doi:10.1037/12327-006
Bergman, M., Gross, J. K., Berry, M., & Shuck, B. (2014). If life happened but a degree
didn’t: Examining factors that impact adult student persistence. Journal of
Continuing Higher Education, 62(2), 90-101.
Bettinger, E. P., & Long, B. T. (2005). Remediation at the community college: Student
participation and outcomes. New Directions for Community Colleges, 2005(129),
17-26.
Bilkey, T., Surman, C., & Weintraub, K. (2014). ADHD grows up. Scientific American
Mind, 25(1), 64-69.
Bitsakou, P., Antrop, I., Wiersema, J. R., & Sonuga-Barke, E. (2006). Probing the limits
of delay intolerance: Preliminary young adult data from the Delay Frustration
Task (DeFT). Journal of Neuroscience Methods, 151, 38-44.
Bolton, J. M., Hughes, J. L., & Kessler, E. D. (2008). Comparing the psychological and
physical health of ADHD and Non-ADHD female college students. Psi Chi
Journal of Undergraduate Research, 13(1), 14-19.

117
Boyd, D., & Bee, H. (2012). The developing child (13th ed.). 377-381. Boston, MA:
Pearson.
Bremer, C. D., Center, B. A., Opsal, C. L., Medhanie, A., Jang, Y. J., & Geise, A. C.
(2013). Outcome trajectories of developmental students in community colleges.
Community College Review, 41(2).
Burns, E., & Martin, A. J. (2014). ADHD and adaptability: The roles of cognitive,
behavioral, and emotional regulation. Australian Journal of Guidance &
Counselling, 24(2), 227-242. doi:10.1017/jgc.2014.17.
Capdeferro, N., & Romero, M. (2012). Are online learners frustrated with collaborative
learning experiences? International Review of Research in Open & Distance
Learning, 13(2), 26-44.
Carter, M. J. (2013). Advancing identity theory: Examining the relationship between
activated identities and behavior in different social contexts. Social Psychology
Quarterly, 76(3), 203-223. doi:10.1177/0190272513493095
Çetin, B. (2015). Predicting academic success from academic motivation and learning
approaches in classroom teaching students. Contemporary Issues in Education
Research, 8(3), 171-180.
Chih-Hung, K., Ju-Yu, Y., Cheng-Fang, Y., Chung-Sheng, C., & Shing-Yaw, W. (2008).
The association between Internet addiction and belief of frustration intolerance:
The gender difference. Cyberpsychology & Behavior, 11(3), 273-278.
doi:10.1089/cpb.2007.0095

118
Complete College America. (2012, April). Remediation: higher education’s bridges to
nowhere. Washington, DC: Complete College America.
Complete College America. (2014). Graduation rates. Retrieved March 6, 2015, from
http://completecollege.org/the-game-changers/
Complete College America. (2015a, December). College completion data. Retrieved
December 16, 2015, from http://completecollege.org/college-completion-data/.
Complete College America. (2015b, December). Corequisite remediation. Retrieved
December 16, 2015, from http://completecollege.org/the-game-changers/.
Crisp, G., & Delgado, C. (2014). The impact of developmental education on community
college persistence and vertical transfer. Community College Review, 42(2), 99-
117.
Deci, E. L., & Ryan, R. M. (2000). The ‘what’ and ‘why’ of goal pursuits: Human needs
and the self-determination of behavior. Psychological Inquiry, 11(4), 227-268.
doi:10.1207/S15327965PLI1104_01
Deci, E. L., & Ryan, R. M. (2008). Facilitating optimal motivation and psychological
well-being across life’s domains. Canadian Psychology, 49(1), 14-23.
DeCoster, J., Gallucci, M., & Iselin, A. (2011). Best practices for using median splits,
artificial categorization, and their continuous alternatives. Journal of Experimental
Psychopathology, 2(2), 197-209.
DeNicco, J., Harrington, P., & Fogg, N. (2015). Factors of one-year college retention in a
public state college system. Research in Higher Education Journal, 27(January),
1-13.

119
Diagnostic and Statistical Manual of Mental Disorders, 5th Edition. (2013). American
Psychiatric Publishing: Washington, DC.
Faul, F., Erdfelder, E., Buchner, A., & Lang, A.G. (2009). Statistical power analyses
using G*Power 3.1: Tests for correlation and regression analyses. Behavior
Research Methods, 41, 1149-1160.
Field, S., Parker, D. R., Sawilowsky, S., & Rolands, L. (2013). Assessing the impact of
ADHD coaching services on university students' learning skills, self-regulation,
and well-being. Journal of Postsecondary Education & Disability, 26(1), 67-81.
Fishbein, M., & Ajzen, I. (1975). Belief, attitude, intention, and behavior: An
introduction to theory and research. Reading, MA: Addison-Wesley.
Fitzhugh, W. (2011). High school flight from reading and writing. Academic Questions,
24(4), 412-418. doi:10.1007/s12129-011-9251-x.
Gormley, M., Pinho, T., Pollack, B., Laracy, S. D., Busch, C., Franklin, M., ... Dupaul,
G. J. (2015). First-year GPA for college students with and without ADHD: a
moderated mediation model. Journal of Attention Disorders (July), 334-348.
doi:10.1037/e555332014-001
Gravetter, F., & Wallnau, L. (2009). Statistics for the behavioral sciences (8th ed.).
Belmont, CA: Cengage.
Hammill, D. D., Leigh, J. E., McNutt, G., & Larsen, S. C. (1988). A new definition of
learning disabilities. Learning Disability Quarterly, 11(3), 217-223.

120
Handa, Y. (2003). A phenomenological exploration of mathematical engagement:
Approaching an old metaphor anew. For the Learning of Mathematics, 23(1), 22-
29.
Harrington, N. (2005). The frustration discomfort scale: Development and psychometric
properties. Clinical Psychology and Psychotherapy, 12 (2005). 374-387. doi:
10.1002/ccp.465
Hern, K. (2012). Acceleration across California: Shorter pathways in developmental
English and math. Change, 44(3), 60-68. doi:10.1080/00091383.2012.672917
Hodara, M. (2015). What predicts participation in developmental education among
recent high school graduates at community college? Lessons from Oregon (REL
2015–081). Washington, DC: U.S. Department of Education, Institute of
Education Sciences, National Center for Education Evaluation and Regional
Assistance, Regional Educational Laboratory Northwest. Retrieved from
http://ies.ed.gov/ncee/edlabs
Horyna, B. & Bonds-Raacke, J.M. (2012). Differences in students' motivation to attend
college: Large versus small high schools. Education, 132(4), 708-724.
Individuals with Disabilities Education Act, U.S.C. 20 § 1400 et seq. (2006).
Jhambh, I., Arun, P., & Garg, J. (2014). Cross-sectional study of self-reported ADHD
symptoms and psychological comorbidity among college students in Chandigarh,
India. Industrial Psychiatry Journal, 23(2), 111-116. doi:10.4103/0972-
6748.151679

121
Johnson, D. R., Wasserman, T. R., Yildirim, N., & Yonai, B. A. (2014). Examining the
effects of stress and campus climate on the persistence of students of color and
White students: An application of Bean and Eaton’s psychological model of
retention. Research in Higher Education, 55. 75-100.
Juutinen, S., & Saariluoma, P. (2010). Emotional obstacles for e-learning: A user
psychological analysis. European Journal of Open, Distance and E-Learning, 1.
Kearns, T. B., & Ruebel, J. B. (2011). Relationship between negative emotion and
ADHD among college males and females. Journal of Postsecondary Education
and Disability, 24(1), 31-42.
Kessler, R. C., Adler, L., Ames, M., Demler, O., Faraone, S., Hiripi, E., … Walters, E. E.
(2005). Adult ADHD self-report scale symptom checklist. Psychological
Medicine, 35, 245-256.
Kessler, R. C., Adler, L. A., Gruber, M. J., Sarawate, C. A., Spencer, T., & Van Brunt, D.
L. (2007). Validity of the World Health Organization Adult ADHD Self-Report
Scale (ASRS) Screener in a representative sample of health plan
members. International Journal of Methods in Psychiatric Research, 16(2), 52-
65. doi:10.1002/mpr.208
Khanlarian, C. J., & Singh, R. (2014). An exploratory study of the online learning
environment. Issues in Accounting Education, 29(1), 117-147. doi:10.2308/iace-
50614

122
Koludrović, M., & Ercegovac, I. R. (2015). Academic motivation in the context of self-
determination theory in initial teacher education. Croatian Journal Educational /
Hrvatski Casopis za Odgoj i Obrazovanje, 1725-36. doi:10.15516/cje.v17i0.1488
Küpper, T., Haavik, J., Drexler, H., Ramos-Quiroga, J. A., Wermelskirchen, D., Prutz,
C., & Schauble, B. (2012). The negative impact of attention-deficit/hyperactivity
disorder on occupational health in adults and adolescents. International Archives
of Occupational and Environmental Health, 85(8), 837-847. doi:10.1007/s00420-
012-0794-0
Learning Disabilities Association of America (2012). What are learning disabilities?
Retrieved April 13, 2019, from https://ldaamerica.org/advocacy/lda-position-
papers/what-are-learning-disabilities/
Lee, E., Pate, J., & Cozart, D. (2015). Autonomy support for online students. Techtrends:
Linking Research & Practice to Improve Learning, 59(4), 54-61.
doi:10.1007/s11528-015-0871-9
Lewis, W. L., & Dodson, M. V. (2013). The frustrations of learning how to write a
scientific paper. NACTA Journal, 57(4), 79-80.
Mamiseishvili, K., & Koch, L. C. (2011). First-to-second-year persistence of students
with disabilities in postsecondary institutions in the United States. Rehabilitation
Counseling Bulletin, 54(2), 93-105. doi: 10.1177/0034355210382580
Martin, A. (2014). Academic buoyancy and academic outcomes: Towards a further
understanding of students with attention-deficit/hyperactivity disorder (ADHD),

123
students without ADHD, and academic buoyancy itself. British Journal of
Educational Psychology, 84, 86-107.
Martin, A.J., Nejad, H.G., Colmar, S., & Liem, G.A.D. (2012). Adaptability: conceptual
and empirical perspectives on responses to change, novelty, and uncertainty.
Australian Journal of Guidance and Counselling, 22, 58-81.
Martin, K., Galentino, R., & Townsend, L. (2014). Community college student success:
The role of motivation and self-empowerment. Community College Review, 42(3),
221-241. doi:10.1177/0091552114528972
Martorell, P., & McFarlin, I. (2011). Help or hindrance? The effects of college
remediation on academic and labor market outcomes. The Review of Economics
and Statistics, 93(2), 436-454.
Maurer, T. W., Allen, D., Gatch, D. B., Shankar, P., & Sturges, D. (2013). A comparison
of student academic motivations across three course disciplines. Journal of the
Scholarship of Teaching & Learning, 13(5), 77-89.
McCann, B. S., & Roy-Byrne, P. (2004). Screening and diagnostic utility of self-report
attention deficit hyperactivity disorder scales in adults. Comparative Psychiatry,
45(3), 175-183.
McMahon, M. (2015). Student retention. Student Retention - Research Starters
Education, 1-8.
Meaux, J., Green, A., & Broussard, L. (2009). ADHD in the college student: A block in
the road. Journal of Psychiatric & Mental Health Nursing, 16(3), 248-256.
doi:10.1111/j.1365-2850.2008.01349.x

124
Meyers, L., Gamst, G., & Guarino, A. (2006). Applied multivariate research: Design and
interpretation. Thousand Oaks, CA: Sage.
Miller, B. J., & Sundre, D. L. (2008). Achievement goal orientation toward general
education versus overall coursework. JGE: The Journal of General Education,
57(3), 152-169.
Moore, R. (2006). What uncouples students’ goals from students' outcomes in
introductory biology courses? Science Education Review, 5(1), 16.1-16.7.
Moore, R. (2007). Academic motivation and performance of developmental education
biology students. Journal of Developmental Education, 31(1), 24-34.
Nario-Redmond, M. R., Biernat, M., Eidelman, S., & Palenske, D. J. (2004). The Social
and Personal Identities scale: A measure of the differential importance ascribed to
social and personal self-categorizations. Self and Identity, 3(2), 143-175.
doi:10.1080/13576500342000103.
National Assessment Governing Board. (2011). Tests and cut scores used for student
placement in postsecondary education: Fall 2011. Retrieved from
https://www.nagb.org/content/nagb/assets/documents/commission/researchandres
ources/test-and-cut-scores-used-for-student-placement-in-postsecondary-
education-fall-2011.pdf
National Institute of Health. (2016). Attention-deficit/hyperactivity disorder. National
Institute of Mental Health. Retrieved from
http://www.nimh.nih.gov/health/topics/attention-deficit-hyperactivity-disorder-
adhd/index.shtml

125
Oguntoyinbo, L. (2012). A helping hand: Few schools offer extra services to those with
learning disabilities. Diverse: Issues in Higher Education, 29(19), 12-13.
Pascarella, E.T., & Terenzini, P. T. (2005). How college affects students: a third decade
of research (Vol. 2). San Francisco, CA: Wiley.
Pazol, R. B., & Griggins, C. (2012). Making the case for a comprehensive ADHD
assessment model on a college campus. Journal of College Student
Psychotherapy, 26(1), 5-21.
Pruett, P. S., & Absher, B. (2015). Factors influencing retention of developmental
education students in community colleges. Delta Kappa Gamma Bulletin, 81(4),
32-40.
Quinn, P. O. (2013). Ensuring college success for students with ADHD. Contemporary
Pediatrics, 30(8), 14-20 7p.
Roberts, D. (2012). Modelling withdrawal and persistence for early teacher training:
Revising Tinto’s longitudinal model of departure. British Educational Research
Journal, 38(6), 953-975.
Rosenberg, M. (1965). Rosenberg Self-Esteem Scale. PsycTESTS, doi: 10.1037/t01038-
000
Ryan, R. M., & Deci, E. L. (2000). Self-determination theory and the facilitation of
intrinsic motivation, social development, and well-being. American Psychologist,
55(1), 68-78. doi:10.1037/0003-066X.55.1.68
Santrock, J. W. (2011). Educational psychology (5th Ed.). 184-189. New York, NY:
McGraw-Hill.
126
Scime, M., & Norvilitis, J. M. (2006). Task performance and response to frustration in
children with attention deficit hyperactivity disorder. Psychology in the Schools,
43(3), 377-386. doi:10.1002/pits.20151
Scott-Clayton, J., & Rodriguez, O. (2012). Detour, diversion, or discouragement? New
evidence on the effects of college remediation. (NBER Working Paper No.
18328). Cambridge, MA: National Bureau of Economic Research. Retrieved from
http://www.nber.org/papers/w18328.
Semrud-Clikeman, M., Walkowiak, J., Wilkinson, A., & Butcher, B. (2010). Executive
functioning in children with Asperger syndrome, ADHD-combined type, ADHD-
predominately inattentive type, and controls. Journal of Autism & Developmental
Disorders, 40(8), 1017-1027. doi:10.1007/s10803-010-0951-9
Senécal, C., Koestner, R., & Vallerand, R. J. (1995). Self-regulation and academic
procrastination. The Journal of Social Psychology, 135(5), 607-619.
doi:10.1080/00224545.1995.9712234
Shepler, D. K., & Woosley, S. A. (2012). Understanding the early integration experiences
of college students with disabilities. Journal of Postsecondary Education and
Disability, 25(1), 37-50.
Sierpinska, A., Bobos, G., & Knipping, C. (2007). Sources of students’ frustration in pre-
university level, prerequisite mathematic courses. Instructional Science, 36. 289–
320. doi: 10.1007/s11251-007-9033-6
Simon, M., & Goes, J. (2013). Dissertation and scholarly research: Recipes for success.
Seattle, WA: Dissertation Success.

127
Simon, R. A., Aulls, M. W., Dedic, H., Hubbard, K., & Hall, N. C. (2015). Exploring
student persistence in STEM programs: A motivational model. Canadian Journal
of Education, 38(1).
Stamp, L., Banerjee, M., & Brown, F. C. (2014). Self-advocacy and perceptions of
college readiness among students with ADHD. Journal of Postsecondary
Education & Disability, 27(2), 139-160.
Stewart, S., Lim, D. H., & Kim, J. (2015). Factors influencing college persistence for
first-time students. Journal of Developmental Education, 38(3), 12-20.
Symonds, W.C., Schwartz, R., & Ferguson, R.F. (2011). Pathways to prosperity: Meeting
the challenge of preparing young Americans for the 21st century. Cambridge,
MA: Pathways to Prosperity, Harvard University Graduate School of Education.
Retrieved from
http://dash.harvard.edu/bitstream/handle/1/4740480/Pathways_to_Prosperity_Feb
2011-1.pdf?sequence=1.
Taylor, S., Zvolensky, M. J., Cox, B. J., Deacon, B., Heimberg, R. G., Ledley, D. R., ...
Cardenas, S. J. (2007). Robust dimensions of anxiety sensitivity: Development
and initial validation of the anxiety sensitivity index-3. Psychological Assessment,
19(2), 176-188.
Tinto, V. (1975). Dropout from higher education: A theoretical synthesis of recent
research. Review of Educational Research, 45(1), 89-125.
Tinto, V. (1993). Leaving college: Rethinking the causes and cures of student attrition
(2nd ed.). Chicago, IL: University of Chicago Press.

128
Tinto, V. (2004). Student retention and graduation: Facing the truth, living with the
consequences. Washington, DC: The Pell Institute.
Tinto, V. (2013). Isaac Newton and college student completion. Journal of College
Student Retention, 15(1). 1-7.
U.S. Department of Education. (2004). Individuals with Disabilities Education Act.
Retrieved from http://idea.ed.gov/
U.S. Department of Education, National Center for Education Statistics.
(2015). Institutional retention and graduation rates for undergraduate students.
The condition of education 2015 (NCES 2015-144). Retrieved from
https://nces.ed.gov/programs/coe/indicator_cva.asp.
U.S. Government Accountability Office. (2009). Higher education and disability:
Education needs a coordinated approach to improve its assistance to schools in
supporting students. 1-45.
Vallerand, R. J., Pelletier, L. G., Blais, M. R., Brière, N. M., Senécal, C. B., & Vallières,
É. F. (1992). Academic motivation scale. doi: http://dx.doi.org/10.1037/t25718-
000.
Vansteenkiste, M., & Ryan, R. M. (2013). On psychological growth and vulnerability:
Basic psychological need satisfaction and need frustration as a unifying principle.
Journal of Psychotherapy Integration, 23(3), 263-280. doi:10.1037/a0032359
Ward, M. F., Wender, P. H., Reimherr, F. W. (1993). The Wender Utah Rating Scale: An
aid in the retrospective diagnosis of childhood attention deficit hyperactivity
disorder. American Journal of Psychiatry, 150. 885‑890.
129
Weyandt, L., DuPaul, G. J., Verdi, G., Rossi, J. S., Swentosky, A. J., Vilardo, B. S., ...
Carson, K. S. (2013). The performance of college students with and without
ADHD: Neuropsychological, academic, and psychosocial functioning. Journal of
Psychopathology & Behavioral Assessment, 35(4), 421-435. doi:10.1007/s10862-
013-9351-8.
Wheeless, V. E., Witt, P. L., Maresh, M., Bryand, M. C., & Schrodt, P. (2011). Instructor
credibility as a mediator of instructor communication and students' intent to
persist in college. Communication Education, 60(3), 314-339.
doi:10.1080/03634523.2011.555917
Wilde, J. (2012). The relationship between frustration intolerance and academic
achievement in college. International Journal of Higher Education, 1(2). 1-8. doi:
10.5430/ijhe.v1n2p1.
Willcutt, E. G., & Pennington, B. F. (2000). Comorbidity of reading disability and
attention-deficit/hyperactivity disorder: Differences by gender and subtype.
Journal of Learning Disabilities, 33(2), 179-191.
doi:10.1177/002221940003300206
Yeh, C., Gau, S., Kessler, R. C., & Wu, Y. (2008). Psychometric properties of the
Chinese version of the adult ADHD Self-Report Scale. International Journal of
Methods in Psychiatric Research, 17(1), 45-54. doi:10.1002/mpr.241
Zimbardo, P., Johnson, R., & McCann, V. (2014). Psychology: core concepts (7th ed.).
294-295, 542. New York, NY: Pearson.
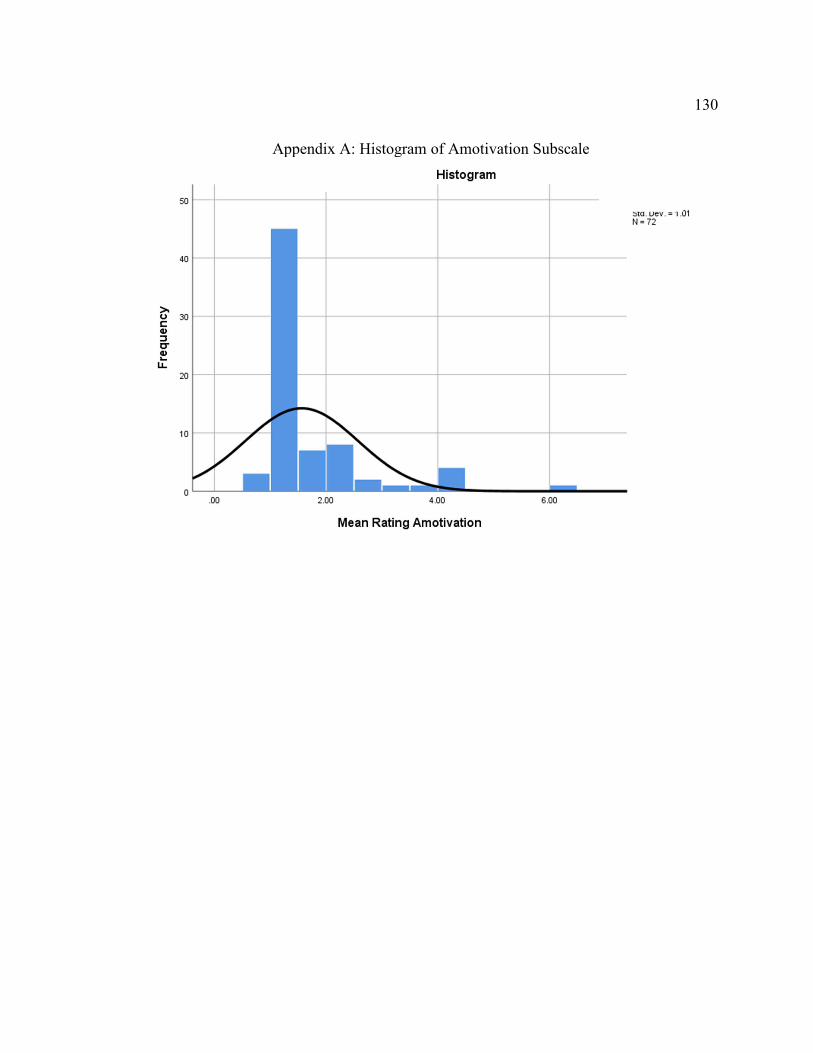
130
Appendix A: Histogram of Amotivation Subscale