persistent systems ltd - images.moneycontrol.com
TRANSCRIPT

September 14, 2021 8
Valuation (Consolidated) Rs cr
Particulars FY21 FY22E FY23E FY24E
Revenue 4,187.9 5,402.6 6,428.2 7,436.8
OPM (%) 16.3 16.6 18.5 18.7
Adjusted PAT 450.7 649.2 879.3 993.0
% YoY growth 32.4 44.1 35.4 12.9
Adjusted EPS (Rs.) 59.0 84.9 115.1 129.9
P/E (x) 60.8 42.2 31.2 27.6
P/B (x) 9.8 8.6 7.4 6.3
EV/EBITDA (x) 40.7 30.3 22.4 18.6
RoNW (%) 17.4 21.7 25.4 24.6
RoCE (%) 22.7 28.1 33.1 32.2Source: Company; Sharekhan estimates
IT & ITES Sharekhan code: PERSISTENT Company Update
+ Positive = Neutral - Negative
3R MATRIX + = -
Right Sector (RS) ü
Right Quality (RQ) ü
Right Valuation (RV) ü
Powered by the Sharekhan 3R Research Philosophy
Persistent Systems LtdMultiple levers to drive growth
Our interaction with the management of Persistent Systems Limited (PSL) indicate that the company would sustain its sequential revenue growth momentum (5.6% CQGR over the past six quarters) in the coming quarters because of broad-based demand, robust deal TCVs, healthy deal pipeline and new logo additions. With around 60% revenue contribution from digital engineering and lower legacy drags, we believe PSL is well poised to capture opportunities from the accelerated spend in the digital engineering area.
� Well poised to outgrow its peers in FY2022: Management aspires to achieve annual revenue run-rate of $1 billion+ over next three years from current annual revenue run-rate of $667 million, implies a CAGR of around 22%. The company’s book-to-bill stood at 1.7x in Q1FY2022. The company’s net headcount addition over the past nine months is at 38% of its September 2020 headcount, which implies strong underlying demand environment. Management cited that it is at the final stage of closure of its acquisition in the BFSI/healthcare vertical. We expect PSL to report industry-leading revenue growth of 28% y-o-y in FY2022E, followed by a 15% CAGR revenue growth over FY2022-FY2024E.
� Focus on long tenure deals & market expansion in Europe: PSL’s total ACV to total TCV ratio remains at 0.8x, which indicates about the short tenure of its projects. Management indicated that it focuses on wining longer tenure deals of 3-5 years, which would improve its growth visibility. The company has recently won a few long tenure deals of 3-5 years and has been the beneficiary of vendor consolidation, given its strong capabilities and solid execution. It expects revenue contribution from Europe to reach around 15% in next 3-4 years from 9.5% currently.
� Margins to remain under pressure in Q2FY2022: PSL’s attrition rate increased by 490 bps q-o-q in Q1FY2022, which is the highest among its peers. The roll-out of wage revision (effective from July 1, 2021) is expected to impact margins by around 250-275 bps q-o-q. However, management expects the net impact on margin to be restricted to around 75-100 bps q-o-q on account of strong revenue growth, improving utilisation, lower visa costs, and flattening pyramid. Management expects EBITDA margin to be sustainable at 17% in FY2022.
Our CallValuation – Sustainable growth momentum: PSL is well positioned to capture opportunities in the market place, given its strong capabilities in the product engineering space, strong executions, hiring of senior-level talents, and an effective sales incentive programme. At the CMP, the stock is trading at a valuation of 31x/28x its FY2023E/FY2024E earnings, justified given its strong earnings growth potential, healthy cash conversion, and M&A opportunity for strengthening its capability. We expect USD revenue/earnings to report a CAGR of 20%/30% over FY2021-FY2024E. Hence, we retain our Buy rating on the stock with a revised price target (PT) of Rs. 4,160.
Key RisksAny slowdown in non-Internet of Things (IoT) revenue/delay in product launches/stronger rupee and/or adverse cross-currency movements could affect earnings
Summary
� We retain a Buy on Persistent Systems with a revised PT of Rs. 4,160, on expectations of industry-leading organic revenue growth, healthy cash generation, and M&A activity to enhance capabilities.
� With ~60% of revenues arising from digital engineering, PSL is well-poised to capture opportunities from rising spends on digital engineering, the market for which is likely to click a 16% CAGR over 2020-2025.
� We expect USD revenue/earnings to clock report a CAGR of 20%/30% over FY2021-FY2024E, led by broad-based demand, robust deal TCVs, healthy deal pipeline and steady addition of new logos.
� Wage revisions would affect margins by 250-275 bps q-o-q in Q2FY2022, but the net effect is likely to be restricted to 75-100 bps, given operating leverage and lower visa costs.
Sto
ck U
pd
ate
Company details
Market cap: Rs. 27,409 cr
52-week high/low: Rs. 3,649/1017
NSE volume: (No of shares)
2.2 lakh
BSE code: 533179
NSE code: PERSISTENT
Free float: (No of shares)
5.3 cr
Shareholding (%)
Promoters 31.3
FII 21.0
DII 29.8
Others 18.0
Price performance
(%) 1m 3m 6m 12m
Absolute 15.3 41.5 102.8 210.7
Relative to Sensex
10.6 31.1 87.2 160.4
Sharekhan Research, Bloomberg
Reco/View Change
Reco: Buy CMP: Rs. 3,586
Price Target: Rs. 4,160 á
á Upgrade Maintain â Downgrade
Price chart
What has changed in 3R MATRIX
Old New
RS RQ RV
1,0001,4001,8002,2002,6003,0003,4003,800
Sep-
20
Jan-
21
May
-21
Sep-
21

September 14, 2021 9
Sto
ck U
pd
ate
Powered by the Sharekhan3R Research Philosophy
India IT is well placed to capture opportunities from strong demand and higher outsourcing
The pandemic has accelerated the pace of adoption for digital and cloud technologies as these technologies helped enterprises to re-imagine the operating model, increase business resilience and agility, optimise cost structure, catching up with digitally mature and cloud-native competitors, and personalising experiences for customers and employees.
Industry demand is being driven by two big trends – (1) investment in both front-end and back-end transformation to enhance experience in digital transactions and (2) higher tech spending around cloud migration, application modernisation, and data modernisation for greater resilience and agility within enterprises. In addition, most of the large enterprises have been making a strategic shift towards outsourcing models for saving costs or sharpening focus on core areas. Hence, it has resulted in terminating or postponing their plans to set up/expand their global capabilities centres (GCC) in India. Given new outsourcing opportunities and rising spend on digital and cloud-related technologies, we believe technology spends would remain strong in the next 2-3 years.
According to the latest forecast, Gartner expects worldwide IT spending to rise by 8.6% y-o-y to $4.2 trillion in 2021. Of this, Gartner forecasts IT services spend would grow by 9.8% in FY2021. Further, IT services spending is likely to report an 8.7% CAGR over FY2021-FY2025, led by strong growth in digital technology. Digital technologies (such as cloud hosting, cloud migration, ADM DevOps, consulting, IoT, etc.) would report a 15-20% CAGR over FY2021-FY2025, while next-generation technologies (5G, robotics, and Blockchain) are expected to report a CAGR of 35-45% over the same period.
Global IT services spend (Rs. bn)
Source: Gartner, Sharekhan Research
994 1053 10711177
12771387
15021624
0
2
4
6
8
10
12
0
200
400
600
800
1000
1200
1400
1600
1800
2018 2019 2020 2021E 2022E 2023E 2024E 2025E
%$ bn
Global IT services spends ($bn) Growth (%)
Industry experts revised in IT services spending
Source: Nasscom, Sharekhan Research
3.6
5.0 5.5 5.5 5.4
(2.7)
6.0 6.3
8.3 9.1
(1.8)
9.0
7.3
8.8 9.4
8.4
1.7
9.8 8.5 8.6 8.2 8.2
2020 2021 2022 2023 2024 2025
IT Services growth forecast (Jan 2020) IT Services growth forecast (Jan 2021)
IT Services growth forecast (Apr 2021) IT Services growth forecast (Jul 2021)

September 14, 2021 10
Sto
ck U
pd
ate
Powered by the Sharekhan3R Research Philosophy
Indian IT Industry export growth trajectory
Indian IT industry can reach $300bn-350bn by 2025
Source:Nasscom, Sharekhan Research
Source: Nasscom, Sharekhan Research
8898
108117
126136
147 15013.8%
11.4%
10.1% 8.3%7.7% 7.9% 8.1%
2.0%
0%
2%
4%
6%
8%
10%
12%
14%
16%
0
20
40
60
80
100
120
140
160
FY2014 FY2015 FY2016 FY2017 FY2018 FY2019 FY2020 FY2021
%$ bn
IT Exports ($ bn) Growth (%)
According to NASSCOM, the Indian IT industry reached a size of $194 billion in FY2021, rise of 2.3% y-o-y. Exports from the Indian IT industry grew by 2.0% y-o-y to reach $150 billion in FY2021 and domestic revenue of the IT industry grew by 3.4% y-o-y to ~$45 billion. Growth is driven by increased demand for digital transformation and infrastructure modernisation. Digital revenue accounted for 28-30% of total industry revenue in FY2021, growing at a rapid pace. The Indian IT services industry is expected to touch $300 billion-350 billion in annual revenue in the next five years, led by higher demand in emerging technology areas such as cloud, artificial intelligence (AI), and cyber security.
The global IT services market posted a CAGR of 3.2% over the past 10 years, while Indian IT exports have grown at a higher pace of 9.7% CAGR over the same period. This has resulted in gain in the market share by Indian IT services companies to 14% in 2020 from 7.6% in 2010. Growth of Indian IT services companies in the most recent quarters has been strong. However, the growth gap has been reduced significantly between the global outsourced IT services spending growth and Indian IT services export growth. As projected, growth rates of global IT services spending for 2021-2025E are higher than in previous years. We believe the offshoring growth differential would pick up in CY2021 and beyond.
90-95% 70-72% 40-45%
10-5%
30-28%
55-60%
2015 2020 2025E
$ bi
llion
Traditional Digital
132
190
300-350

September 14, 2021 11
Sto
ck U
pd
ate
Powered by the Sharekhan3R Research Philosophy
Growth gap between global IT spend & Indian IT exports
Indian IT services market share trend
Source: Nasscom, Gartner, Sharekhan Research
Source: Nasscom, Sharekhan Research
9.7
7.2
4.6
2.83.5
0.7 0.4
0
2
4
6
8
10
12
2014 2015 2016 2017 2018 2019 2020
%
Growth gap (%)
7.68.2
8.79.5
10.3
12.513.1 13.5 13.8 14.0 14.0
4
6
8
10
12
14
16
2010 2011 2012 2013 2014 2015 2016 2017 2018 2019 2020
%
Indian IT services market share
Well-poised to benefit from the acceleration in digital engineering spend
The Engineering and R&D Services (ERS) segment will pick up and is expected to grow at the fastest rate within the Indian technology space for the next 3-5 years. Digital technologies such as mobility, IoTs, artificial intelligence (AI), ML, and cloud-based applications are being integrated into consumer contexts, services, and products.
According to Zinnov, the digital engineering market is expected to see a 19%/16% CAGR from $545 billion in 2020 to $911 billion/$1,141 billion by 2023/2025. Digital engineering spends are accelerating across industries, and this is expected to contribute to 47%/53% of the total ERD spending by 2023/2025 as compared to 36% in 2020. The product engineering services market is expected to post an 8.2% CAGR, reaching $1,174 billion by 2023.

September 14, 2021 12
Sto
ck U
pd
ate
Powered by the Sharekhan3R Research Philosophy
Digital engineering spend to post a 19% CAGR over 2019-2023E
Software & hi-tech revenue growth trend (y-o-y)
Source: Zinnov, Sharekhan Research
Source:Company, Sharekhan Research
899 997 959 1,017 1,014
159
469 545
911 1,141
500
700
900
1,100
1,300
1,500
1,700
1,900
2,100
2,300
2013 2019 2020 2023E 2025E
$ m
iillio
n
Digital ERD spend Legacy ERD spend
1,058
1,504
2,155
1,466
1,928
PSL is engaged in helping its customers build next-gen products using digital product engineering. Further, the company works with software clients across every stage of the software product lifecycle to improve engineering velocity, expand ecosystems, accelerate product roadmaps, and speed to market. PSL plans to open Center of Excellence (CoE) in near-shore locations in Mexico and Canada to improve its capabilities in delivering quality services to its customers. With 60% revenue contribution from digital engineering and negligible presence in legacy space, we believe PSL would continue its strong growth momentum in the next 2-3 years due to strong spend on digital product engineering and software products.
(0.5) (0.5)
14.7
23.0
27.8
-5
0
5
10
15
20
25
30
Q1FY21 Q2FY21 Q3FY21 Q4FY21 Q1FY22
%

September 14, 2021 13
Sto
ck U
pd
ate
Powered by the Sharekhan3R Research Philosophy
Healthcare & life sciences revenue growth trend (y-o-y)
Source: Company, Sharekhan Research
PSL reported strong growth (q-o-q) among peers
Source: Company, Sharekhan Research; # Organic
14.2 13.7 14.1
20.9
32.5
0
5
10
15
20
25
30
35
Q1FY21 Q2FY21 Q3FY21 Q4FY21 Q1FY22
%
Mid-tier IT companies continue to outgrow tier-I players; PSL aims to achieve growth leadership
Mid-cap IT companies continued to outperform large-cap companies on the growth front in Q1FY2022. We believe resilient mid-tier IT companies will deliver better revenue growth compared to their large peers in subsequent quarters, given strong competencies in digital technologies and good strategies around partnership ecosystem to participate in customers’ transformation journey, lesser exposure to legacy business, and attracting external talents at senior levels from large organisations. Net new deal TCVs continue to remain strong for most Indian mid-cap companies in Q1FY2022, while digital revenue contribution to total revenue exceeded 50% for most of mid-tier companies. Mid-tier companies have impressed with strong net addition of employees during Q1FY2022, which indicates underlying strength of the demand environment.
9.2
7.77.0
6.05.1 4.9 4.7
4.2 4.1
2.8
0.9
0.0
1.0
2.0
3.0
4.0
5.0
6.0
7.0
8.0
9.0
10.0
PSL
Min
dtre
e
Cofo
rge#
Mph
asis LTI
Wip
ro#
Info
sys
LTTS
Tech
M
TCS
HCL
T
%

September 14, 2021 14
Sto
ck U
pd
ate
Powered by the Sharekhan3R Research Philosophy
Consistent improvement in EBIT margin for PSL
Net staff addition in last 9M as % of Q2FY21 headcount
Source: Company, Sharekhan Research
Source: Company, Sharekhan Research
6848 39
-19
-82
-245
-295-350
-300
-250
-200
-150
-100
-50
0
50
100
LTTS Cyient PSL Mphasis Mindtree Cofogre LTI
%
PSL’s management expects demand to remain strong for the next 2-4 years. The company aims to achieve industry-leading growth in the coming quarters because of broad-based demand, robust deal TCVs, healthy deal pipeline, and new logo additions. The company’s book-to-bill ratio of 1.5x-2.1x during the last three quarters provides strong growth visibility. Further, the number of clients under the $1 million+/$5 million+ category increased by 13 y-o-y (10 on q-o-q) and six y-o-y (four on q-o-q), respectively. Management expects the new logo addition momentum to continue at a steady rate in the coming quarters. PSL’s net headcount addition stood at 4,084 during the past three quarters, of which 73% are lateral hires. Strong addition of employees indicates the anticipation of strong deal wins in the coming quarters and healthy demand environment as well.
84%
38%
25%18% 18%
7%1%
Cofo
rge
PSL
Min
dtre
e
LTI
Mph
asis
LTTS
Cyie
nt

September 14, 2021 15
Sto
ck U
pd
ate
Powered by the Sharekhan3R Research Philosophy
Steady improvement in client metrics to continue
Source: Company, Sharekhan Research
15 16 17 1721
63 63 65 66
76
Q1FY21 Q2FY21 Q3FY21 Q4FY21 Q1FY22
$5 mn + $1 mn +
Expect strong revenue growth momentum to continue; Eyeing M&A opportunities
PSL delivered strongest revenue growth of 12.9% y-o-y in FY2021, among mid-tier peers in a year hit by a pandemic, aided by reinvigorated sales, minimal exposure to legacy business, and focus on high-growth verticals. Further, the company started the fiscal year with industry-leading organic growth of 9.2% q-o-q (up 27.3% y-o-y), led by broad-based growth across verticals. Management remains confident on delivering strong revenue growth in FY2022 even after delivering strong growth in FY2021, led by strong deal wins, a robust deal pipeline, and traction for its service offerings (such as cloud, data, analytics, and digital engineering). The company’s total order book remained at $646 million in the past three quarters, including new ACV of $331 million. Further, the company’s total order book TCVs stood at $793.3 million over the past three quarters, implying total ACV to total TCV ratio of 0.8x, which indicates the short duration of its projects. Management indicated that it focuses on wining a longer tenure deals of 3-5 years, which would improve its growth visibility. Further, the company has been collaborating with potential customers to improve pricing in some of its projects, given rise in attrition rates. Management indicated that the company is close to the final stage of closure of acquisition. We believe the company would make acquisitions to enhance its capabilities in the BFSI and healthcare verticals. We expect PSL to report industry-leading revenue growth of 28% y-o-y in FY2022E and 15% CAGR over FY2022-FY2024E.
Strong growth momentum likely to continue
Source: Company, Sharekhan Research
9.5 8.4
12.9
20.3
27.3
0
5
10
15
20
25
30
Q1FY21 Q2FY21 Q3FY21 Q4FY21 Q1FY22
%
USD revenue growth (yoy)

September 14, 2021 16
Sto
ck U
pd
ate
Powered by the Sharekhan3R Research Philosophy
Service business growth momentum remains strong
Source: Company, Sharekhan Research
108.2 114.0 119.7 130.0
144.9
15.3 17.2 17.3
22.2
33.9
0
5
10
15
20
25
30
35
40
0
20
40
60
80
100
120
140
160
Q1FY21 Q2FY21 Q3FY21 Q4FY21 Q1FY22
%
$ m
n
Services business ($ mn) Growth (% y-o-y)
Focus on strengthening partnership ecosystem
The company would continue to invest in deepening its collaboration with IBM, sales force, hyperscalers, and others to participate in the digital transformation journey of customers. The company’s sales force practice annual revenue run rate is at $120 million-$130 million and is progressing well for the company.
Expect margin to remain under pressure in Q2FY2022
Margin pressure across Indian IT companies during Q1FY2022 was due to increased discretionary costs, a shortage of digital talent, higher attrition, higher costs to backfill attrition, and increased subcontracting costs. During Q1FY2022, PSL’s attrition rate increased by 490 bps q-o-q, which is the highest among its peers. The sharp increase in attrition rate was due to its higher presence in cutting-edge technology compared to its peers, which the demand remains robust across the geographies. Though the company is taking proactive measures such as flexible working hours, higher fresher intake, and upskilling of employees to meet the supply challenge, management believes that the attrition rate would remain elevated in the next 2-3 quarters. Hence, the company works with some of its potential customers where it sees flexibility in increasing pricing, given supply-side challenges in niche areas. Further, management works with its customers to bring Cost of Living Adjustments (COLA) at the right levels during renewals. In case of new projects, the company tries for correct pricing given current market dynamics. The company has rolled out its wage revision from July 1, 2021, which is expected to impact margin by around 250-275 bps q-o-q. However, margin levers such as strong revenue growth, improving utilisation, lower visa costs, and flattening pyramid would mitigate the impact of a wage hike to a large extent. Hence, management expects net impact on margin to be restricted to around 75-100 bps q-o-q. Management expects EBITDA margin would be sustainable at 17% in FY2022 despite investments in building digital capabilities, hiring at senior levels, and higher discretionary spends. The company is likely to benefit from lower amortisation expenses, which would help it to expand its EBIT margin in FY2022.

September 14, 2021 17
Sto
ck U
pd
ate
Powered by the Sharekhan3R Research Philosophy
PSL: sharp increase in attrition rates
Margin to remain under pressure in Q2FY22
Source: Company, Sharekhan Research
Source: Company, Sharekhan Research
490
420
340 330300 290
230190
160 140
PSL
Tech
M
Wip
ro
Zens
ar
Info
sys
LTI
LTTS
HCL
Tec
h
Min
dtre
e
TCS
Increasing attrition rate (bps q-o-q) in Q1
9.8 8.9 8.7
9.2
10.4
12.1 12.7
13.2 13.5
6
8
10
12
14
16
18
Q1FY20 Q2FY20 Q3FY20 Q4FY20 Q1FY21 Q2FY21 Q3FY21 Q4FY21 Q1FY22
%

September 14, 2021 18
Sto
ck U
pd
ate
Powered by the Sharekhan3R Research Philosophy
Source: Company, Sharekhan Research
Geography break-up (%)
Source: Company, Sharekhan Research
EBITDA (Rs. cr) and EBITDA margin (%)
Top account revenue ($ mn) and growth (%)
Source: Company, Sharekhan Research
Financials in charts
Revenue in US$ (mn) and growth (%)
Source: Company, Sharekhan Research
RoE trend (%)
Source: Company, Sharekhan Research
RoCE trend (%)
Source: Company, Sharekhan Research
481 502 566
724 846
966
0%
5%
10%
15%
20%
25%
30%
0
200
400
600
800
1,000
1,200
FY19 FY20 FY21 FY22E FY23E FY24E
$ m
illio
n
Revenue (US$ in mn) Growth (%)
581 493
683
899
1,187 1,391
10%11%12%13%14%15%16%17%18%19%20%
0200400600800
1,0001,2001,4001,600
FY19 FY20 FY21 FY22E FY23E FY24E
Rs. c
rore
EBITDA (Rs. Cr) EBITDA Margin (%)
North America,
78.9%
Europe, 9.5%
India, 9.8%
RoW , 1.8%
23.226.4 27.0 27.4 28.4
-20%
0%
20%
0
5
10
15
20
25
30
Q1FY21 Q2FY21 Q3FY21 Q4FY21 Q1FY22
$ m
n
Revenue q-o-q growth (%)
15.714.4
17.4
21.7
25.4 24.6
10121416182022242628
FY19 FY20 FY21 FY22E FY23E FY24E
%
RoE (%)
21.418.8
22.7
28.1
33.1 32.2
1517192123252729313335
FY19 FY20 FY21 FY22E FY23E FY24E
%
RoCE (%)

September 14, 2021 19
Sto
ck U
pd
ate
Powered by the Sharekhan3R Research Philosophy
One-year forward P/E (x) band
Source: Sharekhan Research
Outlook and Valuation
n Sector view - Expect acceleration in technology spending going forward
The pandemic is estimated to drag the world output by 3.3% in CY2020, with 4.7% contraction in advanced economies. As a result, global technology spend is estimated to decline by 3.2% to $1.4 trillion in 2020. Within that, IT services spending declined by 3.9%, while business process management spends fell by 2.4%. After the initial dislocations led to contractions, the need for business continuity, operational resilience, and the switch to digital transactions have led to strong demand for IT services. Industry analysts such as Gartner estimate that IT services spending would grow by 7-9% over CY2021-CY2024E as compared to the average of 3.6% achieved in CY2010-CY2020. Forecasts indicate higher demand for cloud infrastructure services, potential increase in specialised software, potential investments in transformation projects by clients, and increased online adoption across verticals. WFH efficiencies, efficiency measures, and higher offshoring would help in sustaining margins in the medium term.
n Company outlook - Well positioned to capture opportunities
As PSL is an early identifier of digital trends and has strong product development capabilities, we believe the company is well placed to capture a significant chunk of spends in digital technologies by clients going ahead. Management remains optimistic to deliver strong revenue growth on a q-o-q basis, with quarterly TCV of $200 million-250 million. We believe the company’s leadership position in outsourced product development (OPD), elongated client relationships, and being an end-to-end service provider would help PSL to make the most of the opportunity.
n Valuation - Sustainable growth momentum
PSL is well positioned to capture opportunities in the market place, given its strong capabilities in the product engineering space, strong executions, hiring of senior-level talents, and an effective sales incentive programme. At the CMP, the stock is trading at a valuation of 31x/28x its FY2023E/FY2024E earnings, justified given its strong earnings growth potential, healthy cash conversion, and M&A opportunity for strengthening its capability. We expect USD revenue/earnings to report a CAGR of 20%/30% over FY2021-FY2024E. Hence, we retain our Buy rating on the stock with a revised price target (PT) of Rs. 4,160.
Peer valuation
CompanyCMP (Rs /
Share)
O/S Shares
(Cr)
MCAP (Rs Cr)
P/E (x) EV/EBITDA (x) P/BV (x) RoE (%)
FY22E FY23E FY22E FY23E FY22E FY23E FY22E FY23E
Infosys 1,686 424 7,15,136 32.0 27.1 22.0 19.1 4.8 4.4 27.6 30.2
L&T Infotech 5,578 18 97,719 43.2 36.2 32.3 27.8 10.3 8.0 28.1 30.6
Persistent Systems 3,587 8 27,409 42.2 31.2 30.3 22.4 8.6 7.4 21.7 25.4 Source: Company, Sharekhan Research
0
5
10
15
20
25
30
35
Apr-
11
Feb-
12
Dec-
12
Nov
-13
Sep-
14
Aug-
15
Jun-
16
May
-17
Mar
-18
Jan-
19
Dec-
19
Oct
-20
Sep-
21
P/E
(x)
P/E (x) Avg. P/E (x) Peak P/E (x) Trough P/E (x)
September 14, 2021 20
Sto
ck U
pd
ate
Powered by the Sharekhan3R Research Philosophy
About company
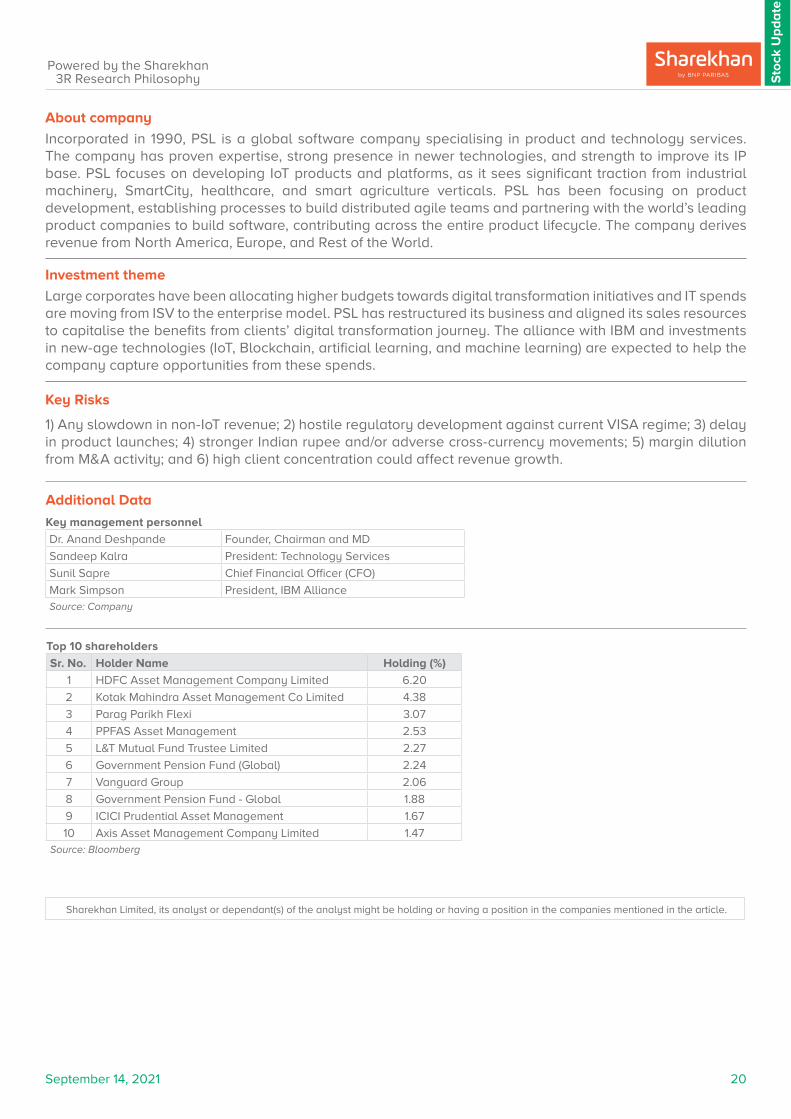
Incorporated in 1990, PSL is a global software company specialising in product and technology services. The company has proven expertise, strong presence in newer technologies, and strength to improve its IP base. PSL focuses on developing IoT products and platforms, as it sees significant traction from industrial machinery, SmartCity, healthcare, and smart agriculture verticals. PSL has been focusing on product development, establishing processes to build distributed agile teams and partnering with the world’s leading product companies to build software, contributing across the entire product lifecycle. The company derives revenue from North America, Europe, and Rest of the World.
Investment theme
Large corporates have been allocating higher budgets towards digital transformation initiatives and IT spends are moving from ISV to the enterprise model. PSL has restructured its business and aligned its sales resources to capitalise the benefits from clients’ digital transformation journey. The alliance with IBM and investments in new-age technologies (IoT, Blockchain, artificial learning, and machine learning) are expected to help the company capture opportunities from these spends. Key Risks
1) Any slowdown in non-IoT revenue; 2) hostile regulatory development against current VISA regime; 3) delay in product launches; 4) stronger Indian rupee and/or adverse cross-currency movements; 5) margin dilution from M&A activity; and 6) high client concentration could affect revenue growth.
Additional Data
Key management personnel
Dr. Anand Deshpande Founder, Chairman and MD
Sandeep Kalra President: Technology Services
Sunil Sapre Chief Financial Officer (CFO)
Mark Simpson President, IBM AllianceSource: Company
Top 10 shareholders
Sr. No. Holder Name Holding (%)
1 HDFC Asset Management Company Limited 6.20
2 Kotak Mahindra Asset Management Co Limited 4.38
3 Parag Parikh Flexi 3.07
4 PPFAS Asset Management 2.53
5 L&T Mutual Fund Trustee Limited 2.27
6 Government Pension Fund (Global) 2.24
7 Vanguard Group 2.06
8 Government Pension Fund - Global 1.88
9 ICICI Prudential Asset Management 1.67
10 Axis Asset Management Company Limited 1.47Source: Bloomberg
Sharekhan Limited, its analyst or dependant(s) of the analyst might be holding or having a position in the companies mentioned in the article.

Understanding the Sharekhan 3R Matrix
Right Sector
Positive Strong industry fundamentals (favorable demand-supply scenario, consistent
industry growth), increasing investments, higher entry barrier, and favorable
government policies
Neutral Stagnancy in the industry growth due to macro factors and lower incremental
investments by Government/private companies
Negative Unable to recover from low in the stable economic environment, adverse
government policies affecting the business fundamentals and global challenges
(currency headwinds and unfavorable policies implemented by global industrial
institutions) and any significant increase in commodity prices affecting profitability.
Right Quality
Positive Sector leader, Strong management bandwidth, Strong financial track-record,
Healthy Balance sheet/cash flows, differentiated product/service portfolio and
Good corporate governance.
Neutral Macro slowdown affecting near term growth profile, Untoward events such as
natural calamities resulting in near term uncertainty, Company specific events
such as factory shutdown, lack of positive triggers/events in near term, raw
material price movement turning unfavourable
Negative Weakening growth trend led by led by external/internal factors, reshuffling of
key management personal, questionable corporate governance, high commodity
prices/weak realisation environment resulting in margin pressure and detoriating
balance sheet
Right Valuation
Positive Strong earnings growth expectation and improving return ratios but valuations
are trading at discount to industry leaders/historical average multiples, Expansion
in valuation multiple due to expected outperformance amongst its peers and
Industry up-cycle with conducive business environment.
Neutral Trading at par to historical valuations and having limited scope of expansion in
valuation multiples.
Negative Trading at premium valuations but earnings outlook are weak; Emergence of
roadblocks such as corporate governance issue, adverse government policies
and bleak global macro environment etc warranting for lower than historical
valuation multiple.Source: Sharekhan Research

Disclaimer: This document has been prepared by Sharekhan Ltd. (SHAREKHAN) and is intended for use only by the person or entity to which it is addressed to. This Document may contain confidential and/or privileged material and is not for any type of circulation and any review, retransmission, or any other use is strictly prohibited. This Document is subject to changes without prior notice. This document does not constitute an offer to sell or solicitation for the purchase or sale of any financial instrument or as an official confirmation of any transaction. Though disseminated to all customers who are due to receive the same, not all customers may receive this report at the same time. SHAREKHAN will not treat recipients as customers by virtue of their receiving this report.
The information contained herein is obtained from publicly available data or other sources believed to be reliable and SHAREKHAN has not independently verified the accuracy and completeness of the said data and hence it should not be relied upon as such. While we would endeavour to update the information herein on reasonable basis, SHAREKHAN, its subsidiaries and associated companies, their directors and employees (“SHAREKHAN and affiliates”) are under no obligation to update or keep the information current. Also, there may be regulatory, compliance, or other reasons that may prevent SHAREKHAN and affiliates from doing so. This document is prepared for assistance only and is not intended to be and must not alone be taken as the basis for an investment decision. Recipients of this report should also be aware that past performance is not necessarily a guide to future performance and value of investments can go down as well. The user assumes the entire risk of any use made of this information. Each recipient of this document should make such investigations as it deems necessary to arrive at an independent evaluation of an investment in the securities of companies referred to in this document (including the merits and risks involved), and should consult its own advisors to determine the merits and risks of such an investment. The investment discussed or views expressed may not be suitable for all investors. We do not undertake to advise you as to any change of our views. Affiliates of Sharekhan may have issued other reports that are inconsistent with and reach different conclusions from the information presented in this report.
This report is not directed or intended for distribution to, or use by, any person or entity who is a citizen or resident of or located in any locality, state, country or other jurisdiction, where such distribution, publication, availability or use would be contrary to law, regulation or which would subject SHAREKHAN and affiliates to any registration or licensing requirement within such jurisdiction. The securities described herein may or may not be eligible for sale in all jurisdictions or to certain category of investors. Persons in whose possession this document may come are required to inform themselves of and to observe such restriction.
The analyst certifies that the analyst has not dealt or traded directly or indirectly in securities of the company and that all of the views expressed in this document accurately reflect his or her personal views about the subject company or companies and its or their securities and do not necessarily reflect those of SHAREKHAN. The analyst and SHAREKHAN further certifies that neither he or his relatives or Sharekhan associates has any direct or indirect financial interest nor have actual or beneficial ownership of 1% or more in the securities of the company at the end of the month immediately preceding the date of publication of the research report nor have any material conflict of interest nor has served as officer, director or employee or engaged in market making activity of the company. Further, the analyst has also not been a part of the team which has managed or co-managed the public offerings of the company and no part of the analyst’s compensation was, is or will be, directly or indirectly related to specific recommendations or views expressed in this document. Sharekhan Limited or its associates or analysts have not received any compensation for investment banking, merchant banking, brokerage services or any compensation or other benefits from the subject company or from third party in the past twelve months in connection with the research report.
Either, SHAREKHAN or its affiliates or its directors or employees / representatives / clients or their relatives may have position(s), make market, act as principal or engage in transactions of purchase or sell of securities, from time to time or may be materially interested in any of the securities or related securities referred to in this report and they may have used the information set forth herein before publication. SHAREKHAN may from time to time solicit from, or perform investment banking, or other services for, any company mentioned herein. Without limiting any of the foregoing, in no event shall SHAREKHAN, any of its affiliates or any third party involved in, or related to, computing or compiling the information have any liability for any damages of any kind.
Compliance Officer: Mr. Joby John Meledan; Tel: 022-61150000; email id: [email protected];
For any queries or grievances kindly email [email protected] or contact: [email protected]
Registered Office: Sharekhan Limited, 10th Floor, Beta Building, Lodha iThink Techno Campus, Off. JVLR, Opp. Kanjurmarg Railway Station, Kanjurmarg (East), Mumbai – 400042, Maharashtra. Tel: 022 - 61150000. Sharekhan Ltd.: SEBI Regn. Nos.: BSE / NSE / MSEI (CASH / F&O / CD) / MCX - Commodity: INZ000171337; DP: NSDL/CDSL-IN-DP-365-2018; PMS: INP000005786; Mutual Fund: ARN 20669; Research Analyst: INH000006183;
Disclaimer: Client should read the Risk Disclosure Document issued by SEBI & relevant exchanges and the T&C on www.sharekhan.com; Investment in securities market are subject to market risks, read all the related documents carefully before investing.
Know more about our products and services
For Private Circulation only