persistence and cyclicity in fda drug approvals author
TRANSCRIPT
Persistency and cyclicity in US drug approvals Author: Daizadeh, I.
Page 1 of 45
Title: United States FDA drug approvals are persistent and polycyclic: Insights into economic cycles,
innovation dynamics, and national policy
Author: Iraj Daizadeh, PhD, Takeda Pharmaceuticals, 40 Landsdowne St. Cambridge, MA, 02139,
Abstract: It is challenging to elucidate the effects of changes in external influences (such as economic or
policy) on the rate of US drug approvals. Here, a novel approach – termed the Chronological Hurst
Exponent (CHE) – is proposed, which hypothesizes that changes in the long-range memory latent within
the dynamics of time series data may be temporally associated with changes in such influences. Using
the monthly number FDA’s Center for Drug Evaluation and Research (CDER) approvals from 1939 to
2019 as the data source, it is demonstrated that the CHE has a distinct S-shaped structure demarcated
by an 8-year (1939-1947) Stagnation Period, a 27-year (1947-1974) Emergent (time-varying Period, and
a 45-year (1974-2019) Saturation Period. Further, dominant periodicities (resolved via wavelet analyses)
are identified during the most recent 45-year CHE Saturation Period at 17, 8 and 4 years; thus, US drug
approvals have been following a Juglar/Kuznet mid-term cycle with Kitchin-like bursts. As discussed, this
work suggests that (1) changes in extrinsic factors (e.g., of economic and/or policy origin ) during the
Emergent Period may have led to persistent growth in US drug approvals enjoyed since 1974, (2) the
CHE may be a valued method to explore influences on time series data, and (3) innovation-related
economic cycles exist (as viewed via the proxy metric of US drug approvals).
Keywords: FDA approvals, drug development, medical product, medicines, economic cycle, Schumpeter

Persistency and cyclicity in US drug approvals Author: Daizadeh, I.
Page 2 of 45
Introduction
Drug discovery and development (DDD) requires investment to maneuver a single putative medicine
from discovery science to market approval for a given condition or disease. The investments cover the
costs associated with acquiring both the hardware (e.g., laboratory materials and space) and software
[explicit (e.g., patents) and tacit (e.g., know-how) knowledge] as well as executing the various DDD
activities [1]. Ultimately, should an investigational candidate survive the attrition process and obtain
marketing authorization (also known as marketing approval) by a health authority, a sponsor then
enjoys economic rents secured from supplying the approval medicine. On the demand side, the patient
receives a trusted medicine associated with a market innovation based on a new chemical and biologic
entity, a cost advantage (generic), or a more efficient delivery of drug product [2].
Since the early 20th century to the present, in terms of drug development, the social, economic, and
political environments have evolved dramatically. For example, the growth in the amount of
governmental investment in research and development (R&D) [3], the number of R&D firms [4, 5], the
volume of intellectual property (e.g., patents, trademarks, as well as peer-reviewed publications) [5, 6],
the number of R&D policy initiatives (see Table 1 and discussion below), and the rise of the R&D cluster
[7] have seemingly grown synchronistically and exponentially. As a case in point, in the US and across
industries, Daizadeh [8,9] showed a statistical significant intercorrelation in the time course of R&D
investment, the number of patent and trademark applications, peer-reviewed and media publications,
and stock price of major indices in the US.
Importantly, the 20th century also gave rise to the modern regulated DDD industry including the
invention of an objective, independent, and external agency (collectively termed the health authority
(HA)). The HA performs a vital function by attesting to a medicine’s quality, safety, and efficacy profile
and to formally authorize a drug for marketing purposes in a given jurisdiction. Since its original
Persistency and cyclicity in US drug approvals Author: Daizadeh, I.
Page 3 of 45
conception, there have been increasing refinement in its scope proportional to changes in the social
environment through amendments in policy. For example, focusing on the US Food and Drug
Administration (FDA), there has been an evolution in the number and variety of policy initiatives focused
on providing oversight to the DDD process due exclusively to important social concerns regarding safety
and efficacy of certain drugs circulating in inter-jurisdictional commerce [38]. The FDA policy
environment has evolved considerably from placing under regulation on specific drugs (e.g., insulin and
penicillin) and describing the basic tenets of the safety sciences in its infancy to building a robust
infrastructure commencing in the 1960s with the Kefauver-Harris amendments to regular updates in the
policy landscape starting in 1977, with the introduction of the Bioresearch Monitoring Program, pushing
the frontiers of regulatory science into the 21th century (see Table 1; [38]).
Concomitantly, economic factors have also greatly influenced the landscape of DDD. Unlike the US (see
21 CFR 310 et seq.; 21 CFR 601 et seq.), in many jurisdictions (e.g., the European Union), HAs consider
cost and/or reimbursement when assessing the merits of granting a marketing application. The ability of
sponsors to obtain the economic rents from supplying quality, safe and efficacious HA-authorized drugs
is a key driver that has sustained the DDD process. Among other factors, expected revenues from
marketing an innovative HA-approved drug product would be proportional to monopolizing power of
the intellectual property [1] as well as the amount of labor required to move the drug from concept to
delivery, thereby requiring a broad assortment of various investments in terms of tangible and
intangible assets. While beyond the scope of this work, cost estimates to secure marketing authorization
vary based on the types of challenges experienced in various phases (e.g. target / modality in discovery;
the number, length and type of clinical trials in development) [41], with significant savings expected with
expediting development [42]. Thus, drug approvals may be thought of an economic outcome within a
given jurisdiction, and should behave as such. One such test would be to investigate the presence of
cycles in the number of approvals similar to that found in other forms of economic output.

Persistency and cyclicity in US drug approvals Author: Daizadeh, I.
Page 4 of 45
Economic cycles, a wavelength between crests of development maxima over stagnation minima, are an
active area of inquiry, not without controversy [10]. Juglar defined this periodicity over three phases:
prosperity, crisis, and subsequent liquidation, and suggested an “approximate length of the cycle with
crisis/liquidation taking 1-2 years, followed by a 6-7 year phase of prosperity [11; pp. 7],” with drivers to
prosperity to crisis transition due to exuberance and thus over-speculation (ibid). Kitchin derived ‘minor’
and ‘major’ inventory cycles with wavelengths of 3.5 years (40 month) and “aggregates usually of two,
and less seldom of three, minor cycles,” respectively [12; pp. 10]. Subsequent to the introduction of
these short and intermediate cycles, Kondratieff introduced the concept of the long-wave 50-60 year
cycles [13]. Concomitantly, Kuznetz extrapolated 15-25 year cycles derived from data from “fluctuations
in rates of population growth and immigrating but, also with investment delays in building, construction,
transport infrastructure, etc… [14; pp. 2].” These authors extrapolated the information from a broad
assortment of macro-economic data from US and Europe including climate, monetary, fiscal,
consumption, among others.
Memory characteristics (also termed persistency) in the dynamics of typical econometrics captured over
time are intimately connected with cycles and thus also to the underlying processes [15]. Technically,
however, these same characteristics such as long-range memory processes are challenging to analyze
and interpret due to (in part) self-similarity and typical non-stationary properties (as they confound
spurious from true signals) [16]. The Hurst constant and wavelet analyses are statistical time series tools
that may be calculated in such as a way as to avoid these challenges [17]. While there are other ways to
define a Hurst constant, a measurement of memory, it is classically defined as H ~ ln(R / S)t / ln(t), where
R and S is the rescaled range and standard deviation, respectively, and t is a time window. An H=0.5, an
H<0.5, and an H>0.5 indicates a random walk, an anti-persistent, and a persistent (trend reinforcing)
time series, respectively [18]. Wavelet analyses is a well-established group of time series methods that
leverages the expansion and contraction of wave functions to resolve time series properties [19].
Persistency and cyclicity in US drug approvals Author: Daizadeh, I.
Page 5 of 45
In this work, and the to the author’s knowledge, this is the first investigation of the existence and
evolution of persistency, and the existence of approval cycles (akin to economic cycles) within US drug
approvals, which is treated as a macro-economic variable and a proxy metric for FDA policy. This work is
exploratory and empirical in nature. As presented in the Materials and Methods section below, the data
source is a time series of monthly values of US drug Approvals from Jan. 1939 through Dec. 2019 from
the Centers of Drug Evaluation and Research (CDER) branch of the Food and Drug Administration (FDA),
which “regulates over-the-counter and prescription drugs, including biological therapeutics and generic
drugs1.” While this is not the only institution that regulates the DDD process within the FDA, it is one
that provides a publicly, reliable and valuable source of longitudinal metrics regarding the DDD process
from the dawn of the review process (1939) to the present time. The methods are standard with the
exception of the Chronological Hurst Exponent to explore the persistency latent in the time series. All
datasets and R Project code are provided in the Electronic Supplementary Materials section for the sake
of transparency and replicability as well as to encourage future researchers in investigate a potentially
very interesting and informative aspect of drug development. This work then discusses the key results of
both the descriptive and inferential statistics followed by a discussion on how the statistical work
positively supports the hypotheses mentioned above (viz., persistency and economic cycles are latent
within US drug approvals), and the ramifications of this work including potential linkages to sociological,
economic, and policy features experienced over the nearly 100 years of data.
Materials and Methodologies
The following summarizes the data sources and the statistical approaches used. This work is applied by
nature and thus differing the mathematical formulae and technical discussion to original sources, as
cited. All data and the R Project code for the statistical analysis are provided in the Electronic
1 https://www.fda.gov/about-fda/fda-organization/center-drug-evaluation-and-research-cder
Persistency and cyclicity in US drug approvals Author: Daizadeh, I.
Page 6 of 45
Supplementary Materials section supporting this article for transparency and reproducibility, as well as
for purposes of future work.
Data Sources and Data Preparation
The data was obtained from the FDA repository accessed at
https://www.accessdata.fda.gov/scripts/cder/daf/ on July 16 and July 17, 2020. The data was culled
from a monthly report and described as follows:
“All Approvals and Tentative Approvals by Month.
Reports include only BLAs/NDAs/ANDAs2 or supplements to those applications approved by the
Center for Drug Evaluation and Research (CDER) and tentative NDA/ANDA approvals in CDER.
The reports do not include applications or supplements approved by the Center for Biologics
Evaluation and Research (CBER).
Approvals of New Drug Applications (NDAs), Biologics License Applications (BLAs), and
Abbreviated New Drug Applications (ANDAs), and supplements to those applications; and
tentative approvals of ANDAs and NDAs.”
Upon entry into the data-repository via the website, the number of approvals from Jan. 1939 to Dec.
2019 was then determined by month. The values were placed in Excel and then exported as a comma
delimited comma-separated values (CSV) file for input into the data analysis routine.
The total dataset comprised 181,157 total approvals from Jan. 1939 until Dec 2019 (for a total of 972
monthly observations). The author notes that submission history for each approval during this roughly
100 year time-period was not found on the US FDA website.
2 BLAs/NDAs/ANDAs: Biologics License Applications, New Drug Applications, Abbreviated New Drug Applications

Persistency and cyclicity in US drug approvals Author: Daizadeh, I.
Page 7 of 45
Statistical Analysis
As mentioned above, as this is an applied paper, reference is made to the various theoretical formulae
in the respective supportive citations. Many of the distribution-inquiring statistical tests selected are
considered ‘standard’ in the sense that they are typically used in the context described and are readily
available and interpretable. All methods presented below followed standard implementation; default
parameters were used (as appropriate) throughout the analyses. While the R code [20] is presented in
the Electronic Supplemental Materials section of this article, the steps to perform the analysis were as
follows:
I. Load US Approvals as a time-series and perform descriptive statistics (including autocorrelation
functions) [21; R package: ‘moments’].
In this step, the data is read as a time series into the R program, and descriptive statistics including
moments and serial and partial correlation functions calculated.
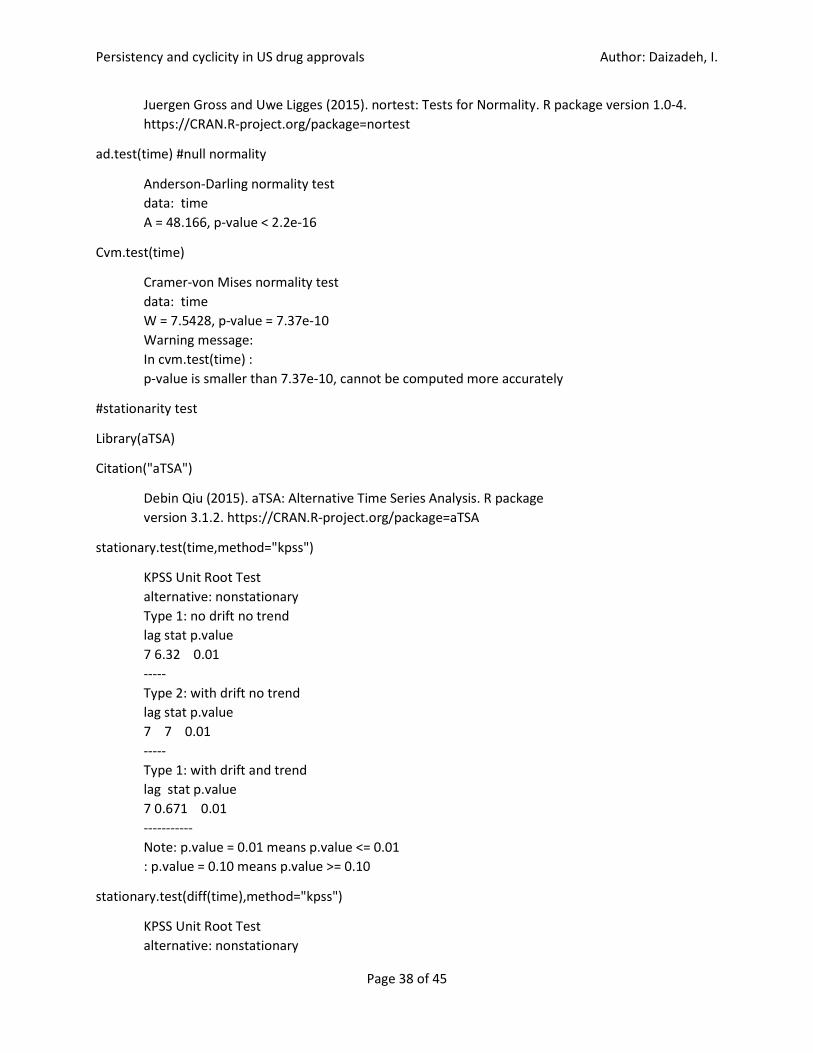
II. Assess attributes of the time series, including:
o Normality [22; R package: ‘nortest’] using the Anderson-Darling and Cramer-von Mises
normality tests
o Stationarity [23; R package: ‘aTSA’] using the Kwiatkowski-Phillips-Schmidt-Shin (KPSS) Unit
Root Test for both the original and single difference
o Long-memory [24; R package: ‘LongMemoryTS’] using the Qu and local Whittle score tests
o Seasonality [25; R package: ‘seastests’] using the WO, QS, Friedman and Welch tests
o Nonlinearity [26; R package: ‘nonlinearTseries’] using the Teraesvirta’s and neural network
tests, and Keenan, McLeod-Li, Tsay, and likelihood ratio tests.
III. Determine the Chronological Hurst Exponent (that is, evaluate if the Hurst exponent over time
evolves):

Persistency and cyclicity in US drug approvals Author: Daizadeh, I.
Page 8 of 45
For a given time-series, the Hurst constant [27; R package: ‘tsfeatures’] is a statistical indicator of the
memory in a time-series process (or processes). In this calculation, the time-varying nature of the H
constant was investigated using time windows from the first datapoint (Jan. 1939) to the end of the
window length, with 1-month increments. The algorithm to calculate the Chronological Hurst Exponent
is as follows:
hurstApprovals=0; end<-length(time)
for (I in 1:end) { hurstApprovals[i] <- hurst (time[1:(1+i*1)]) }
hurstApprovals<-ts(hurstApprovals,start=c(1939,1),end=c(2019,12),frequency=12)
IV. Determine the periodicities within the time series:
Wavelet analyses used to investigate the structure of the periodicities within the time series given its
dynamics (particularly its non-stationarity; see step II). Two wavelet methods were utilized: one with a
smoothing (Loess) approach [28; R package: ‘WaveletComp’] and one [29-31; R Package: ‘dplR’] without.
The average period versus the average power for each method was then calculated to elucidate the
main periodicities. The dominant frequency was then re-checked with spectral analysis [32-33; R
Package: ‘forecast’].
Results
Descriptive statistics: Elementary properties of the chromodynamics of US drug approvals
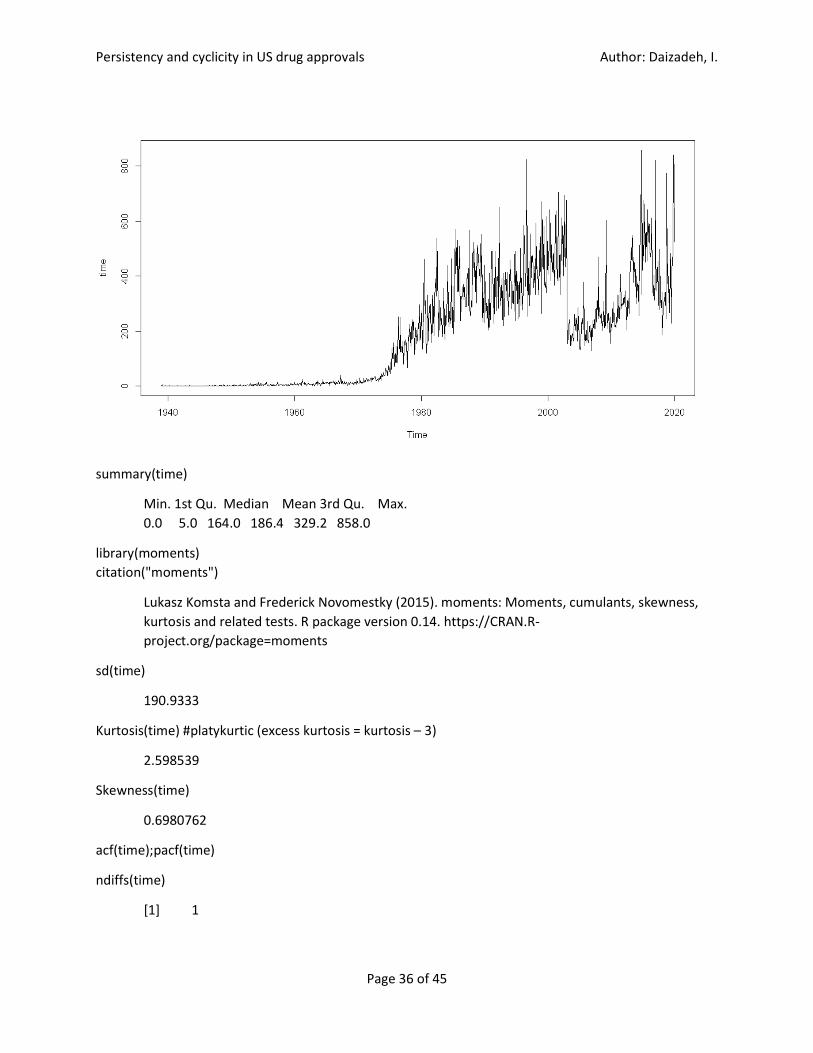
The time series of US drug approvals follows an interesting flow given the dramatic rise starting in the
1970s to 2000 then after a drastic fall with a subsequent re-rise (Figure 1).
< Insert Figure 1 here. Figure 1: Time evolution of total US CDER Approvals >
The US drug approvals time series distribution is non-normal, platykurtic and positively skewed, with an
average of 186 approvals (191 standard deviation) (Table 2 and 3). Importantly, the time series is non-

Persistency and cyclicity in US drug approvals Author: Daizadeh, I.
Page 9 of 45
stationary, non-seasonal, and non-linear, with intrinsic persistent memory (Table 2 and figure 2), which
is removed with single differencing (that is, the time series has an order of integration (number of
differences to attain stationarity) of 1, I(1)). I(1) processes are rather well-represented across a spectrum
of different disciplines and a broad assortment of the economic variables including US drug approvals
[34].
< Insert Table 2 here: Table 2: Descriptive statistics of US approvals (rounded to tenths; units in
months) >
< Insert table 3 here: Table 3: Summary of tests investigating normality, stationarity, seasonality, long-
memory, and non-linearity>
< Insert Figure 2 here: Figure 2: Serial and partial correlation functions: lag is presented in months >
Chronological Hurst Exponent: Existence of economic cycles and latent persistency
Using the Chronological Hurst Exponent approach to investigate the long-term memory processes of the
time-series shows, interestingly, a unique trichotomized structure (Figure 3). Three periods are clearly
shown: Period 1: prior to June 1947, a period of stagnation with H~0.5; Period 2: June 1947 to May
1974, a period of time-varying nature (also herein called emergent), where the H constant fluctuates
rises under a degree of fluctuation; and, Period 3: May 1974 to Dec 2019, a period of saturation in which
the H~1.
< Insert Figure 3 here: Figure 3: The Chronological Hurst Exponent based on US Drug Approvals (Figure
1) from 1939 to 2019>
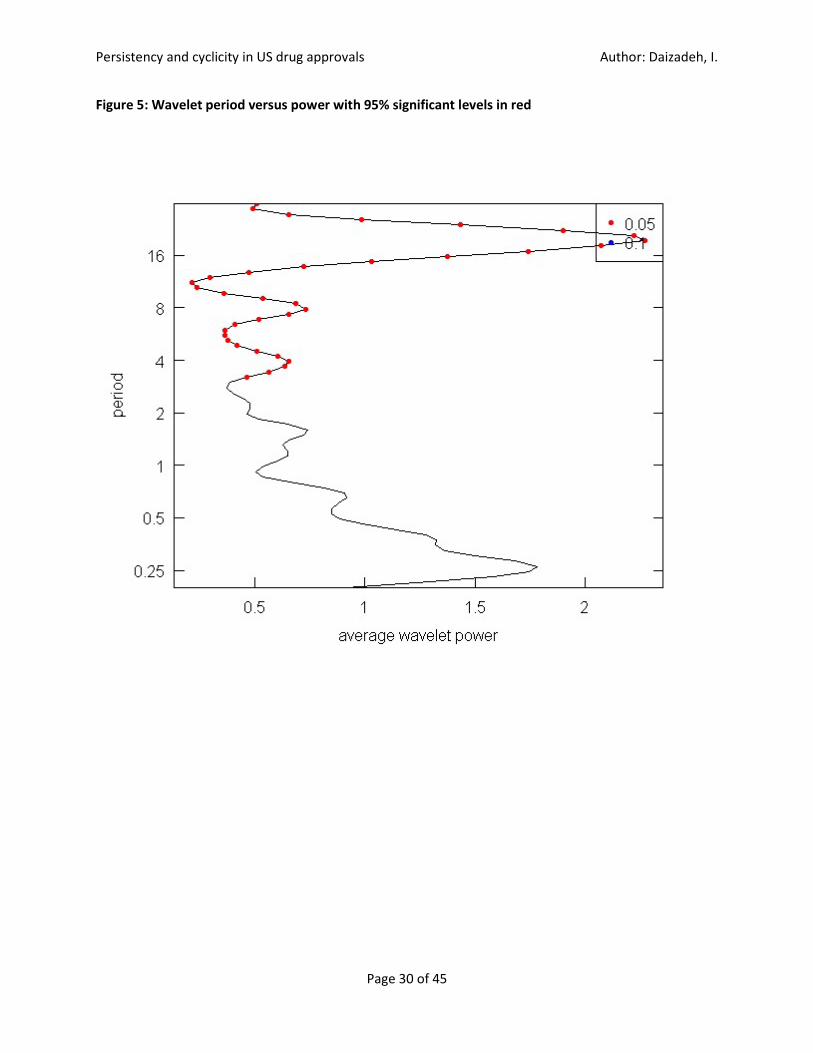
Concordantly, the wavelet periodogram during Period 3 demonstrates that the time series contains
periodicities. Several relatively long-, medium-, and short-range periodicities are observed during this
period: 16-18 years (with a maximum (black ridge) occurring at 17 years), ~4-8 years, and on the

Persistency and cyclicity in US drug approvals Author: Daizadeh, I.
Page 10 of 45
monthly, yearly, or biyearly periodicities presenting intermittently, respectively (Figure 4). The
predominate periodicity is identified to be 17, 8 and 4 years from spectral analysis (Figure 5).
< Insert Figure 4 here. Figure 4: Wavelet periodogram of US approvals: black lines are the wavelet
power ridges and white contour lines to border the area of wavelet power significance of 99% >
< Insert Figure 5 here. Figure 5: Wavelet period versus power with 95% significant levels in red >
Discussion and Conclusion
Using time series analysis, this work finds two conceptually novel aspects of US drug approvals: the
existence and evolution of persistency, and the existence of approval cycles (akin to economic cycles).
Persistency
Formally, persistency may be defined as the “rate at which its autocorrelation function decays to zero,”
or “the extent to which events today have an effect on the whole future history of a stochastic process
[40].” Translating to the context of our concern, it generally means that the value of US drug approvals
at a given month is closely related to its value at the prior month. The Chronological Hurst Exponent
proposed herein is a simple algorithm that reiteratively calculates the Hurst exponent (a measure of
persistency) over an incrementally increased time period. With each iteration, an additional data point
(here the next monthly observation of US approvals) is taken into account until the exponent of the full
data set is calculated. The Chronological Hurst Exponent proposed in this work elucidated a S-shaped
structure reflecting a trichotomized picture of the time evolution of persistency latent within US drug
approvals:
Period 1: An 8-year (1939-1947) stagnation period in which the Hurst exponent remained at or
around 0.5. An Hurst exponent at these values suggest no persistency whatsoever.

Persistency and cyclicity in US drug approvals Author: Daizadeh, I.
Page 11 of 45
Period 2: A 27-year (1947-1974) time-varying (emergent) period in which the Hurst exponent
gradually evolved from 0.5 to 0.9. This range in the Hurst exponent suggests a growing
persistency within the time series data.
Period 3: A 45-year (1974-2019) saturation period in which the Hurst exponent remained at or
around 1. A saturated Hurst exponent implies that the time series has become (for lack of a
better term) inelastic; that is, any further changes in the degree and/or number of exogenous
variables do not affect the persistency course of the time series (as it is already maximized).
Cyclicity
Interpreting US drug approvals as an economic variable – a singular outcome of several complex macro-
(national), meso- (cluster), and micro (firm)-inputs such as national policy and R&D spend (government,
firm), potential of future rents (individual buyer, payor), science and technology innovation (tacit (e.g.,
staff dexterity) and explicit (e.g., patents) knowledge), and resource availability (e.g., chemicals, vials) –
the existence of business cycles were investigated. Several tiered periodicities (17 years, 4-8 years, and
intermittent monthly/yearly) were identified within Periods 2 and 3 of the CHE. Thus, one of the key
findings of this work is that approval cycles, similar to economic cycles, exist. These approval cycles
seem to be the result of explanatory variables that are working in a cumulative manner.
Persistence and Cyclicity Interpreted
During Period 2 (27-years (1947-1974)), it is observed that 1947 was the first year in which there were
one or more approvals during much of the year and had the largest number on an annual basis since the
start of the collection cycle in Jan 1939. After 1947, a general rise in the number of approvals per month
and per annum is observed. It is also a period of commensurate changes to the policy and social
landscape pertaining to DDD, as well as continued investment into R&D. These changes were seemingly
due to end of World War II (1939-1945), the beginning of the so-called ‘Golden Age of Capitalism,’ and
Persistency and cyclicity in US drug approvals Author: Daizadeh, I.
Page 12 of 45
the associated economic progress [35] with a relatively small number of economic disasters (see Figure
3 in [36]). Since the 1938 Food, Drug and Cosmetic act, no significant advances in policy occurred until
the 1962 Drug Amendments (see Table 1), while there were significant milestone activities in terms of
congressional review (the Kefauver Hearings dealt with pricing and market control [37]. One could
therefore speculate that it an overall increased economic activity (and not specific FDA policy changes,
per se) that may have driven the changes in the persistency measurement.
The appearance of Period 3 (45-years (1974-2019)) suggests a uniform pressure onto the time series.
Two general reasons present themselves to foment such a sustained persistent alteration in the fabric of
US drug approvals: some sort of substantive and everlasting change (1) to accounting practices
regarding US drug approvals (that is, how the source data was initially contrived and/or collected); or (2)
in the scientific, social, economic, and/or legislative landscape. The former is unlikely to cause a
persistent shift. To illustrate, FDA data sources state a change in department ownership in and around
that time, as well as issues regarding changes from fiscal to calendar year practices.3 It is unlikely that
either of these reasons would have changed the time series in such a permanent manner. The latter
reason, while likely, however, is ill-defined, but does allow for hypothesis generation.
One hypothesis that could be tested is that of a significant change in the FDA policy landscape (see Table
1) may have caused the formation of Period 3. From an FDA perspective, the 1960s and 1970s were a
transformative vicennial [38]. In 1962, the Kefauver-Harris (KH) amendments to the original Food, Drug
and Cosmetics Act (FD&C) of 1938 introduced (inter alia) broad requirements on drug efficacy (including
key concepts of ‘substantial evidence’ and ‘adequate and well-controlled studies’), drug quality (via good
manufacturing practices), ethical guidelines (patient informed consent), and physician-researcher
supervision of the clinical trials. Subsequently, a review of prior-to-1962 approved drugs were
3 Data record information from https://www.fda.gov/about-fda/histories-product-regulation/summary-nda-approvals-receipts-1938-present (extracted on July 30, 2020).
Persistency and cyclicity in US drug approvals Author: Daizadeh, I.
Page 13 of 45
retrospectively investigated based on the evidentiary standard of the KH amendments, which led to
revocation of “over 1000 ineffective drugs and drug combinations from the marketplace (page 13 of
ibid).” The concepts such as those introduced in the KH amendments (partly listed above) have been
refined and reinforced through ongoing congressional action, directly contributing to the identified
persistency affect and cyclicity. Ongoing policy actions, such as Prescription Drug User Fee Act (PDUFA)
and its subsequent 5-year amendments commencing in 1992, or the introduction of new technologies
may have directly contributed to innovation-based periodicities, leading to significant increases in the
promulgation of guidelines that may have furthered drug approvals [34, 39].
Thinking outside of the drug development process and continuing considering the periodogram (Figure
5) and thinking of the original time series (Figure 2), the complex periodicity profile may have been
motivated by socio-economic factors. Substantive economic pulses that may have affected the overall
approval flow may include: Black Monday Market Crash (October 19, 1987), the Dot-Com bubble burst
(Q3, 2002), and the subprime mortgage crisis (September 17, 2008), among others. Visually, the Dot-
Com bubble burst seemed to coincide with a downsizing of amplitude. However, it is difficult to
ascertain if the other triggers may have affected the time series.
Interestingly, if one considered the US drug approvals strictly as an economic variable, and assuming the
theory of Schumpeter’s economic cycles, the identified periodicities seem to coincide with certain
macro-economic periodicities, with exception as no canonical long-term (> 40 years) periodicities were
identified in this analysis (see Table 4). The periodicities began at different times with different
durations (Figure 4). The dominant periodicity of 17, 8 and 4 years has reoccurred during the longest (45
years), medium (20 years), and short-term (intermittent) durations, respectively (Figure 5). Thus, it
seems that US drug approvals follow a Juglar/Kuznets mid-term cycle with Kitchin bursts. Only time will
tell if a longer-term cycle (Kondratieff) emerges, irrespective of any downside pressures (such as multi-
decade bear cycles). A key difference between the identified approval cycles as compared with

Persistency and cyclicity in US drug approvals Author: Daizadeh, I.
Page 14 of 45
economic cycles may be the degree of importance of the regulatory context. While a potentially coarse
interpretation, without the legal requirement for market approval there would not have been a US drug
approvals time series, whereas for variables such as gross domestic product typically used to consider
economic cycles this is not the case (as the legal regimes do not define (as much as support) the
existence of these more traditional economic variables).
< Insert table 4 here. Table 4: Mapping of broad canonical economic cycles with that of periodicities
associated with US Approvals >
Further Thoughts in Light of Limitations of Current Study
There are extensions and limitations to any statistical analyses, especially when dealing with social-
economic variables. Examples of future investigation may include:
Hypothesis:
One could argue that the number of US drug applications may have been a more insightful
variable, as applications may be either withdrawn (by the Sponsor) or rejected (by the FDA).
Unfortunately, the author could not find this dataset.
The number of initial US drug applications or approvals for new molecular and/or biologic
entities may provide additional insight into the economics of the innovative process. In this
article, the total number of US drug approvals including generics and line extensions (e.g., new
indications or dosage forms) were considered, as reflected “market innovation.” That is, a
sponsor would not have considered seeking an approval without a market driver of some sort.
Data:
Data integrity and completeness: This study relies on a single source dataset from the FDA.
While the author feels comfortable with the data source, there is uncertainty in how the data is

Persistency and cyclicity in US drug approvals Author: Daizadeh, I.
Page 15 of 45
collected, maintained, and presented given the duration of data collection and limited-to-no
ability to cross-reference.
Data transformation: The data was transformed from irregular to a regular time-structure. That
is, FDA drug approvals occurred as a function of day; these data were then aggregated into
monthly values to facilitate the statistical analyses. Thus, some information may have been lost
in terms of structure, as there are limited statistical routines able to manage such data.
In the author’s opinion, these data are an important artifact of R&D expenditures related to the DDD
industry and therefore have interesting utility. Future investigations may consider these data and
analyses to support research questions such as those related to forecasting and long-memory effects of
non-stationary and non-linear data. It will be interesting to revisit these analyses on a yearly basis given
the recent COVID-19 crises and resultant economic challenges, with a hope that the US drug approvals
remain persistent with respect to these significant triggers.
Study Conclusions:
In conclusion, this work introduces the Chronological Hurst Exponent, an algorithm which examines the
time evolution of long-term memory intrinsic to time series data. Using this algorithm, US drug
approvals are examined. The CHE of US drug approvals is found to follow a distinctive S-shaped
(trichotomized) curve, with three periodicities that seem to be correlative with the evolving US drug
development policy landscape, as well as macro-variable changes that may be relevant to drug
development. Further, using wavelet analysis, cyclicity in the frequency of US drug approvals was
observed in the most recent period identified in the CHE analysis. These periodicities adds evidence to
the concept of mid-term economic cycles, assuming US drug approvals data are viewed a proxy metric
of innovative capacity. The empirical findings and statistical approaches outlined in this report promise
an exciting new frontier of further research into the various forces driving drug development.
Persistency and cyclicity in US drug approvals Author: Daizadeh, I.
Page 16 of 45
Acknowledgements
The author extends gratitude N.D., S.L.D., and N.L.D. for their support of the manuscript.
Disclosures
The author is an employee of Takeda Pharmaceuticals; however, this work was completed
independently of his employment. The views expressed in this article may not represent those of Takeda
Pharmaceuticals. As an Associate Editor for Therapeutic Innovation and Regulatory Science, the author
was not involved in the review or decision process for this article. See Electronic Supplementary
Materials for all data and methods to replicate (or extend) the results presented herein.

Persistency and cyclicity in US drug approvals Author: Daizadeh, I.
Page 17 of 45
References:
(1) Daizadeh, I., Miller, D., Glowalla, A. et al. A general approach for determining when to patent,
publish, or protect information as a trade secret. Nat Biotechnol 20, 1053–1054 (2002).
https://doi.org/10.1038/nbt1002-1053
(2) Wouters OJ, McKee M, Luyten J. Estimated Research and Development Investment Needed to Bring
a New Medicine to Market, 2009-2018. JAMA. 2020;323(9):844-853. doi:10.1001/jama.2020.1166
(3) DiMasi, J.A.; Grabowski, H.G. (2012) Chapter 2: R&D costs and returns to new drug development: a
review of the evidence. In The Oxford Handbook of the Economics of the Biopharmaceutical
Industry (edited by Patricia M. Danzon, Sean Nicholson). Oxford University Press.
(4) Munos, B. Lessons from 60 years of pharmaceutical innovation. Nat Rev Drug Discov 8, 959–968
(2009). https://doi.org/10.1038/nrd2961
(5) Parida, D., Mehdiratta, R. & Saberwal, G. How many patents does a biopharmaceutical company
need?. Nat Biotechnol 26, 763–766 (2008). https://doi.org/10.1038/nbt0708-763
(6) Agarwal, P., Searls, D. Can literature analysis identify innovation drivers in drug discovery?. Nat Rev
Drug Discov 8, 865–878 (2009). https://doi.org/10.1038/nrd2973
(7) D’Alise, C.; Giustiniano, L.; Peruffo E. (2014) Innovating through Clusters. International Journal of
Engineering Business Management. https://doi.org/10.5772/59028
(8) Daizadeh, I. (2009) An intellectual property-based corporate strategy: An R&D spend, patent,
trademark, media communication, and market price innovation agenda. Scientometrics 80, 731–
746. https://doi.org/10.1007/s11192-008-2105-9
(9) Daizadeh, I. Issued US patents, patent-related global academic and media publications, and the US
market indices are inter-correlated, with varying growth patterns. Scientometrics 73, 29–36 (2007).
https://doi.org/10.1007/s11192-007-1749-1

Persistency and cyclicity in US drug approvals Author: Daizadeh, I.
Page 18 of 45
(10) Kozlowski, D. (2019). Old series, new signals: The economic cycle in light of wavelet analysis.
Cuadernos Del CIMBAGE, 2(21). Obtained from:
https://ojs.econ.uba.ar/index.php/CIMBAGE/article/view/1587
(11) Besomi, D. (2005) Clément Juglar and the transition from crises to business cycle theories. Paper
prepared for a conference on the occasion of the centenary of the death of Clément Juglar, Paris, 2
December 2005. Obtained from:
https://www.unil.ch/files/live/sites/cwp/files/users/neyguesi/public/D._Besomi_
http://citeseerx.ist.psu.edu/viewdoc/download?doi=10.1.1.693.7740&rep=rep1&type=pdf
(12) Kitchin, J. (1932) Cycles and Trends in Economic Factors. The Review of Economics and Statistics.
5(1): 10-16. https://www.jstor.org/stable/pdf/1927031.pdf
(13) Kondratieff, N.D.; Stolper, W.F. (1935) The long waves of economic life. The Review of Economics
and Statistics 17(6): 105-115. https://www.cannonfinancial.com/uploads/main/Long-Waves-in-
Economic-Life.pdf
(14) Kwasnicki, W. (Date Unknown) Kitchin, Juglar and Kuznetz business cycles revisited. Obtained on 08-
June-2020 from http://kwasnicki.prawo.uni.wroc.pl/todownload/Kwasnicki_cyclesJEBO.pdf
(15) Alvarez-Ramirez, J; Rodriguez,E; Ibarra-Valdez, C (2020) Medium-term cycles in the dynamics of the
Dow Jones Index for the period 1985-2019. Physica A 546 124017
https://doi.org/10.1016/j.physa.2019.124017
(16) Saha, K; Madhavan; V; Chandrashekhar, G (2020). Pitfalls in long memory research. Cogent
Economics and Finance, 8(1), 1733280. https://doi.org/10.1080/23322039.2020.1733280
(17) Chamoli, A; Bansal, AR; Dimri,VP (2007) Wavelet and rescaled range approach for the Hurst
coefficient for short and long time series. Computers & Geosciences 33(1) 83-93
https://doi.org/10.1016/j.cageo.2006.05.008

Persistency and cyclicity in US drug approvals Author: Daizadeh, I.
Page 19 of 45
(18) Mandelbrot, BB; Wallis, JR (1968) Noah, Joseph, and Operational Hydrology, Water Resour. Res.,
4(5), 909-918, doi:10.1029/WR004i005p00909
(19) Walnut, DF (2013) An Introduction to Wavelet Analysis. Germany: Birkhäuser Boston.
(20) R Core Team (2020) R: A language and environment for statistical computing. R Foundation for
Statistical Computing, Vienna, Austria. https://www.R-project.org/.
(21) Komsta, L; Novomestky, F (2015) moments: Moments, cumulants, skewness, kurtosis and related
tests. R package version 0.14 https://CRAN.R-project.org/package=moments
(22) Gross, J; Ligges,U (2015) nortest: Tests for Normality. R package version 1.0-4. https://CRAN.R-
project.org/package=nortest
(23) Qiu,D (2015). aTSA: Alternative Time Series Analysis. R package version 3.1.2. https://CRAN.R-
project.org/package=aTSA
(24) Leschinski,C (2019). LongMemoryTS: Long Memory Time Series. R package version 0.1.0.
https://CRAN.R-project.org/package=LongMemoryTS
(25) Ollech,D (2019). seastests: Seasonality Tests. R package version 0.14.2. https://CRAN.R-
project.org/package=seastests
(26) Garcia,C.A. (2020). nonlinearTseries: Nonlinear Time Series Analysis. R package version 0.2.10.
https://CRAN.R-project.org/package=nonlinearTseries
(27) Hyndman, R; Kang, Y; Montero-Manso, P; Talagala,T; Wang, E.; Yang, Y; O'Hara-Wild,M (2020).
tsfeatures: Time Series Feature Extraction. R package version 1.0.2. https://CRAN.R-
project.org/package=tsfeatures
(28) Roesch,A.; Schmidbauer,H (2018). WaveletComp: Computational Wavelet Analysis. R package
version 1.1. https://CRAN.R-project.org/package=WaveletComp
(29) Bunn, AG (2008). A dendrochronology program library in R (dplR). Dendrochronologia, 26 (2), 115-
124. ISSN 1125-7865, https://doi.org/10.1016/j.dendro.2008.01.002

Persistency and cyclicity in US drug approvals Author: Daizadeh, I.
Page 20 of 45
(30) Bunn, AG (2010). Statistical and visual cross-dating in R using the dplR library. Dendrochronologia,
28(4), 251-258. ISSN 1125-7865, https://doi.org/10.1016/j.dendro.2009.12.001
(31) Bunn, A; Korpela, M; Biondi, F; Campelo, F; Mérian, P; Qeadan,F; Zang, C (2020). dplR:
Dendrochronology Program Library in R. R package version: 1.7.1. https://CRAN.R-
project.org/package=dplR
(32) Hyndman, R; Athanasopoulos, G; Bergmeir, C; Caceres, G; Chhay, L; O'Hara-Wild, M; Petropoulos, F;
Razbash, S; Wang, E; Yasmeen, F (2020). forecast: Forecasting functions for time series and linear
models_. R package version 8.12, http://pkg.robjhyndman.com/forecast
(33) Hyndman, RJ; Khandakar, Y (2008). “Automatic time series forecasting: the forecast package for R.”
Journal of Statistical Software, 26(3), 1-22. http://www.jstatsoft.org/article/view/v027i03
(34) Daizadeh I. Investigating Rates of Food and Drug Administration Approvals and Guidances in Drug
Development: A Structural Breakpoint/Cointegration Timeseries Analysis. Ther Innov Regul Sci.
54(5):1056-1067. doi: 10.1007/s43441-020-00123-5. Epub 2020 Jan 31. PMID: 32006390.
(35) Zakamulin, V; Hunnes, JA (2020) Stock earnings and bond yields in the US 1871–2017: The story of a
changing relationship, The Quarterly Review of Economics and Finance,
https://doi.org/10.1016/j.qref.2020.05.013
(36) Coric, B (2020) Economic disasters: A new data set. Finance Research Letters 101612
https://doi.org/10.1016/j.frl.2020.101612
(37) Greene, JA; Podolsky, SH (2012) Reform, regulation, and pharmaceuticals-The The Kefauver–Harris
Amendments at 50. N. Engl. J. Med. 367:1481-1483 DOI: 10.1056/NEJMp1210007
(38) Junod, S. W. (2020;2008) FDA and Clinical Drug Trials: A Short History, in A Quick Guide to Clinical
Trials, Madhu Davies and Faiz Kerimani, eds. (Washington: Bioplan, Inc.: 2008), pp. 25-55; viewed on
July 30 from the FDA website: https://www.fda.gov/media/110437/download

Persistency and cyclicity in US drug approvals Author: Daizadeh, I.
Page 21 of 45
(39) Daizadeh, I. (2020) Since the Mid-2010s FDA Drug and Biologic Guidelines have been Growing at a
Faster Clip than Prior Years: Is it Time to Analyze Their Effectiveness? Ther Innov Regul Sci.
https://doi.org/10.1007/s43441-020-00233-0
(40) Caporale, Guglielmo Maria and Pittis, Nikitas, Persistence in Macroeconomic Time Series: Is it a
Model Invariant Property?. Revista de Economia del Rosario, Vol. 4, No. 2, pp. 117-142, 2001,
Available at SSRN: https://ssrn.com/abstract=928506
(41) Chorniy, A., Bailey, J., Civan, A. and Maloney, M. (2021), Regulatory review time and pharmaceutical
research and development. Health Economics, 30: 113-128. https://doi.org/10.1002/hec.4180
(42) DiMasi, J.A., Wilkinson, M. The Financial Benefits of Faster Development Times: Integrated
Formulation Development, Real-Time Manufacturing, and Clinical Testing. Ther Innov Regul
Sci 54, 1453–1460 (2020). https://doi.org/10.1007/s43441-020-00172-w
Persistency and cyclicity in US drug approvals Author: Daizadeh, I.
Page 22 of 45
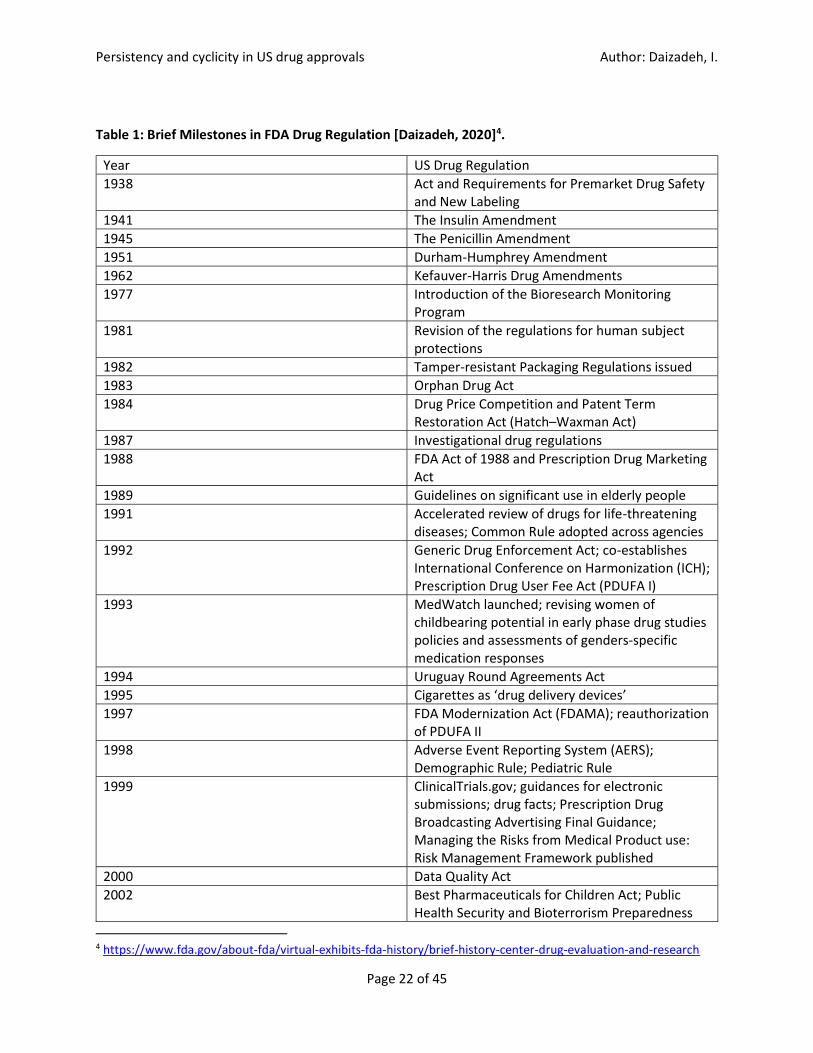
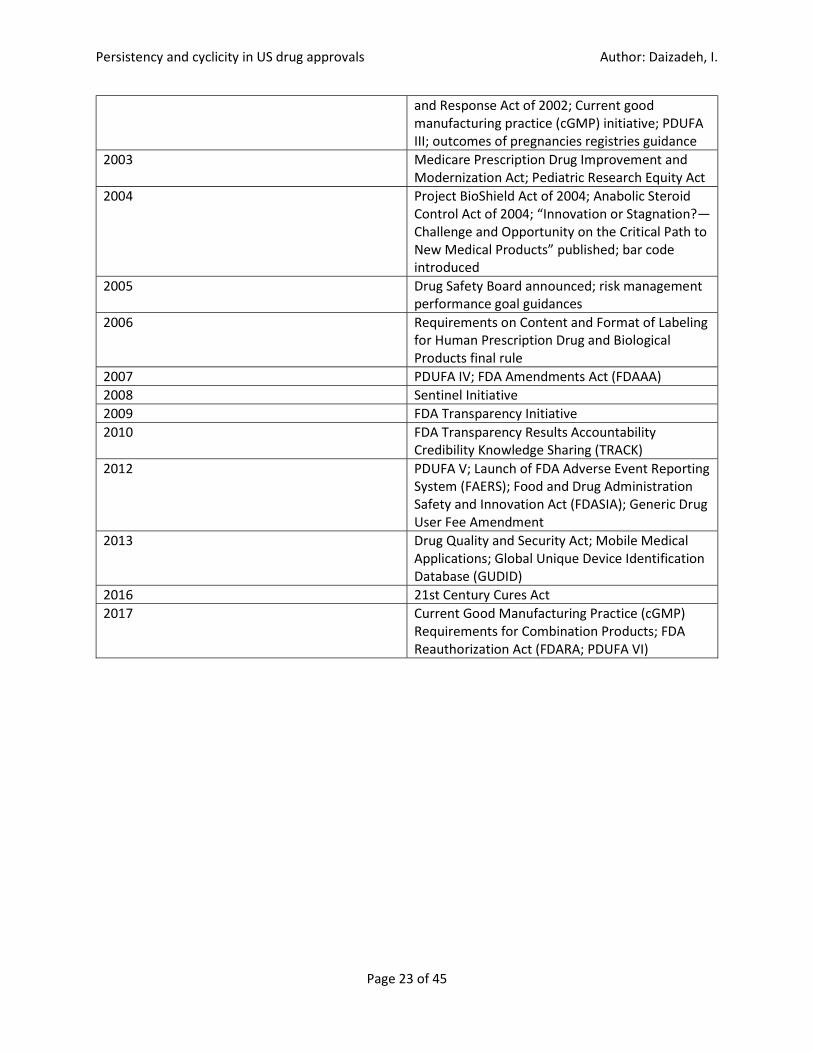
Table 1: Brief Milestones in FDA Drug Regulation [Daizadeh, 2020]4.
Year US Drug Regulation 1938 Act and Requirements for Premarket Drug Safety
and New Labeling 1941 The Insulin Amendment 1945 The Penicillin Amendment 1951 Durham-Humphrey Amendment 1962 Kefauver-Harris Drug Amendments 1977 Introduction of the Bioresearch Monitoring
Program 1981 Revision of the regulations for human subject
protections 1982 Tamper-resistant Packaging Regulations issued 1983 Orphan Drug Act 1984 Drug Price Competition and Patent Term
Restoration Act (Hatch–Waxman Act) 1987 Investigational drug regulations 1988 FDA Act of 1988 and Prescription Drug Marketing
Act 1989 Guidelines on significant use in elderly people 1991 Accelerated review of drugs for life-threatening
diseases; Common Rule adopted across agencies 1992 Generic Drug Enforcement Act; co-establishes
International Conference on Harmonization (ICH); Prescription Drug User Fee Act (PDUFA I)
1993 MedWatch launched; revising women of childbearing potential in early phase drug studies policies and assessments of genders-specific medication responses
1994 Uruguay Round Agreements Act 1995 Cigarettes as ‘drug delivery devices’ 1997 FDA Modernization Act (FDAMA); reauthorization
of PDUFA II 1998 Adverse Event Reporting System (AERS);
Demographic Rule; Pediatric Rule 1999 ClinicalTrials.gov; guidances for electronic
submissions; drug facts; Prescription Drug Broadcasting Advertising Final Guidance; Managing the Risks from Medical Product use: Risk Management Framework published
2000 Data Quality Act 2002 Best Pharmaceuticals for Children Act; Public
Health Security and Bioterrorism Preparedness
4 https://www.fda.gov/about-fda/virtual-exhibits-fda-history/brief-history-center-drug-evaluation-and-research
Persistency and cyclicity in US drug approvals Author: Daizadeh, I.
Page 23 of 45
and Response Act of 2002; Current good manufacturing practice (cGMP) initiative; PDUFA III; outcomes of pregnancies registries guidance
2003 Medicare Prescription Drug Improvement and Modernization Act; Pediatric Research Equity Act
2004 Project BioShield Act of 2004; Anabolic Steroid Control Act of 2004; “Innovation or Stagnation?—Challenge and Opportunity on the Critical Path to New Medical Products” published; bar code introduced
2005 Drug Safety Board announced; risk management performance goal guidances
2006 Requirements on Content and Format of Labeling for Human Prescription Drug and Biological Products final rule
2007 PDUFA IV; FDA Amendments Act (FDAAA) 2008 Sentinel Initiative 2009 FDA Transparency Initiative 2010 FDA Transparency Results Accountability
Credibility Knowledge Sharing (TRACK) 2012 PDUFA V; Launch of FDA Adverse Event Reporting
System (FAERS); Food and Drug Administration Safety and Innovation Act (FDASIA); Generic Drug User Fee Amendment
2013 Drug Quality and Security Act; Mobile Medical Applications; Global Unique Device Identification Database (GUDID)
2016 21st Century Cures Act 2017 Current Good Manufacturing Practice (cGMP)
Requirements for Combination Products; FDA Reauthorization Act (FDARA; PDUFA VI)

Persistency and cyclicity in US drug approvals Author: Daizadeh, I.
Page 24 of 45
Table 2: Descriptive statistics of US approvals (rounded to tenths; units in months)
Minimum 1st Quartile
Median Mean Standard Deviation
3rd Quartile
Maximum Kurtosis Skew
0 5.0 164 186.4 190.9 392.2 858 2.6 0.7
Table 3: Summary of tests investigating normality, stationarity, seasonality, long-memory, and non-linearity
Test Category Test Name Test statistic Outcome against null hypothesis
Normality Anderson-Darling test p-value < 2.2e^16 Normal distribution rejected Cramer-von Mises test p-value < 7.37e-10
Stationarity KPSS unit root test* 0.01 (for no drift/no trend; for drift/no trend; for drift/trend)
Stationarity rejected
Long memory Qu test* 1.033545 versus 1.517 (alpha=0.01;eps=0.02)
Long memory accepted
Multivariate local Whittle Score*
1.668473 versus 1.517 (alpha=0.01)
Seasonality Webel-Ollech test p-value 0.05 “The WO-test does not identify seasonality”
QS test, Friedman, Welch tests
False – seasonality rejected
Linearity Teraesvirta’s neural network test
p-value=0 Linearity in "mean" rejected
White neural network test
p-value=0 Linearity in "mean" rejected
Keenan’s one-degree test
p-value=3.889e^-5 The time series follows some AR process rejected
McLeod-Li test p-value=0 The time series follows some ARIMA process rejected
Tsay’s test p-value=6.45e^-14 Time-series follows some AR process rejected
Likelihood ratio test for threshold non-linearity
p-value=0.0004552571 Time-series follows some TAR process rejected
* Some tests require stationary data. As such, as the number of differences required for a stationary series from the original time-series was 1, the difference was used in the specific test demarcated.

Persistency and cyclicity in US drug approvals Author: Daizadeh, I.
Page 25 of 45
Table 4: Mapping of broad canonical economic cycles with that of periodicities associated with US Approvals
Theory Periodicity US Approvals Kitchin Short-Term Cycle Cycle 3.5 years Months to biannual Juglar Mid-Term Cycle 7-11 years 4-8 years Kuznets Medium-Term Cycle 15-25 years 17 years Kondratieff Long-Term Cycle 40-60 years

Persistency and cyclicity in US drug approvals Author: Daizadeh, I.
Page 26 of 45
Figure 1: The number of monthly US CDER Approvals as a function of year from 1939 to 2019

Persistency and cyclicity in US drug approvals Author: Daizadeh, I.
Page 27 of 45
Figure 2: Serial and partial correlation functions: lag is presented in months

Persistency and cyclicity in US drug approvals Author: Daizadeh, I.
Page 28 of 45
Figure 3: The Chronological Hurst Exponent based on US Drug Approvals (Figure 1) from 1939 to 2019

Persistency and cyclicity in US drug approvals Author: Daizadeh, I.
Page 29 of 45
Figure 4: Wavelet periodogram of US approvals: black lines are the wavelet power ridges and white contour lines to border the area of wavelet power significance of 99%
Persistency and cyclicity in US drug approvals Author: Daizadeh, I.
Page 30 of 45
Figure 5: Wavelet period versus power with 95% significant levels in red
Persistency and cyclicity in US drug approvals Author: Daizadeh, I.
Page 31 of 45
Supplementary Materials
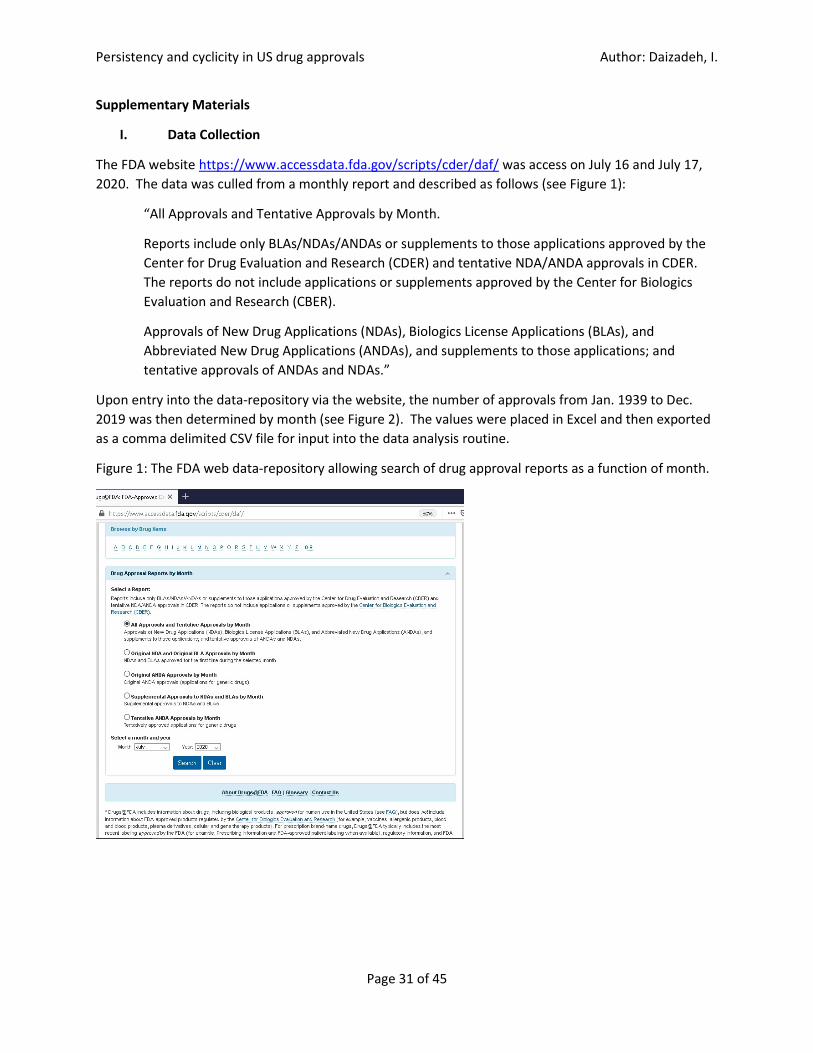
I. Data Collection
The FDA website https://www.accessdata.fda.gov/scripts/cder/daf/ was access on July 16 and July 17, 2020. The data was culled from a monthly report and described as follows (see Figure 1):
“All Approvals and Tentative Approvals by Month.
Reports include only BLAs/NDAs/ANDAs or supplements to those applications approved by the Center for Drug Evaluation and Research (CDER) and tentative NDA/ANDA approvals in CDER. The reports do not include applications or supplements approved by the Center for Biologics Evaluation and Research (CBER).
Approvals of New Drug Applications (NDAs), Biologics License Applications (BLAs), and Abbreviated New Drug Applications (ANDAs), and supplements to those applications; and tentative approvals of ANDAs and NDAs.”
Upon entry into the data-repository via the website, the number of approvals from Jan. 1939 to Dec. 2019 was then determined by month (see Figure 2). The values were placed in Excel and then exported as a comma delimited CSV file for input into the data analysis routine.
Figure 1: The FDA web data-repository allowing search of drug approval reports as a function of month.

Persistency and cyclicity in US drug approvals Author: Daizadeh, I.
Page 32 of 45
II. Statistical Analysis
Install R from: https://cloud.r-project.org/ citation()
R Core Team (2020). R: A language and environment for statistical computing. R Foundation for Statistical Computing, Vienna, Austria. URL https://www.R-project.org/.
version
platform x86_64-w64-mingw32 arch x86_64 os mingw32 system x86_64, mingw32 status major 4 minor 0.2 year 2020 month 06 day 22 svn rev 78730 language R version.string R version 4.0.2 (2020-06-22) nickname Taking Off Again
Persistency and cyclicity in US drug approvals Author: Daizadeh, I.
Page 33 of 45
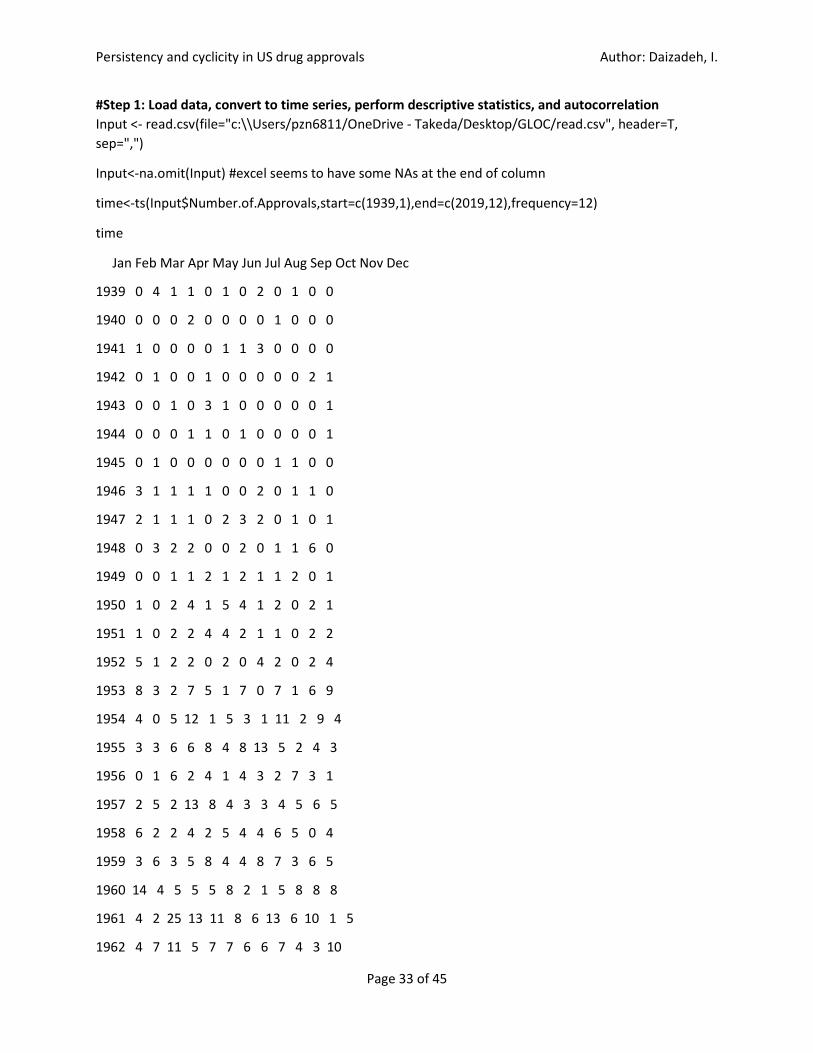
#Step 1: Load data, convert to time series, perform descriptive statistics, and autocorrelation Input <- read.csv(file="c:\\Users/pzn6811/OneDrive - Takeda/Desktop/GLOC/read.csv", header=T, sep=",")
Input<-na.omit(Input) #excel seems to have some NAs at the end of column
time<-ts(Input$Number.of.Approvals,start=c(1939,1),end=c(2019,12),frequency=12)
time
Jan Feb Mar Apr May Jun Jul Aug Sep Oct Nov Dec
1939 0 4 1 1 0 1 0 2 0 1 0 0
1940 0 0 0 2 0 0 0 0 1 0 0 0
1941 1 0 0 0 0 1 1 3 0 0 0 0
1942 0 1 0 0 1 0 0 0 0 0 2 1
1943 0 0 1 0 3 1 0 0 0 0 0 1
1944 0 0 0 1 1 0 1 0 0 0 0 1
1945 0 1 0 0 0 0 0 0 1 1 0 0
1946 3 1 1 1 1 0 0 2 0 1 1 0
1947 2 1 1 1 0 2 3 2 0 1 0 1
1948 0 3 2 2 0 0 2 0 1 1 6 0
1949 0 0 1 1 2 1 2 1 1 2 0 1
1950 1 0 2 4 1 5 4 1 2 0 2 1
1951 1 0 2 2 4 4 2 1 1 0 2 2
1952 5 1 2 2 0 2 0 4 2 0 2 4
1953 8 3 2 7 5 1 7 0 7 1 6 9
1954 4 0 5 12 1 5 3 1 11 2 9 4
1955 3 3 6 6 8 4 8 13 5 2 4 3
1956 0 1 6 2 4 1 4 3 2 7 3 1
1957 2 5 2 13 8 4 3 3 4 5 6 5
1958 6 2 2 4 2 5 4 4 6 5 0 4
1959 3 6 3 5 8 4 4 8 7 3 6 5
1960 14 4 5 5 5 8 2 1 5 8 8 8
1961 4 2 25 13 11 8 6 13 6 10 1 5
1962 4 7 11 5 7 7 6 6 7 4 3 10

Persistency and cyclicity in US drug approvals Author: Daizadeh, I.
Page 34 of 45
1963 7 1 3 6 12 9 20 3 15 14 7 11
1964 7 1 10 8 9 24 9 11 9 9 14 11
1965 14 9 12 10 9 13 3 12 11 17 12 13
1966 15 13 19 8 20 5 13 9 12 9 8 20
1967 9 8 19 41 8 11 17 12 7 8 9 17
1968 9 6 12 9 3 8 10 13 6 7 16 10
1969 10 8 12 7 4 12 16 10 12 7 24 15
1970 10 11 11 30 13 17 11 13 9 13 14 27
1971 16 14 20 23 28 21 17 24 24 18 19 21
1972 26 30 15 30 23 28 29 33 34 34 21 20
1973 23 24 27 17 28 30 35 20 19 44 36 33
1974 48 37 38 40 66 55 50 52 39 43 73 70
1975 62 44 87 61 138 102 140 98 157 72 77 90
1976 145 87 143 87 251 185 149 124 250 124 145 128
1977 121 164 81 139 158 169 150 158 131 120 68 185
1978 164 193 224 170 144 190 242 223 172 230 234 116
1979 145 213 153 203 164 213 208 252 163 295 168 180
1980 254 275 135 179 290 462 293 310 219 191 119 178
1981 331 163 238 292 243 297 158 222 195 329 309 273
1982 183 323 356 391 328 536 449 247 267 180 224 312
1983 261 218 246 201 180 263 356 210 170 176 256 223
1984 274 322 439 247 217 272 226 249 359 463 270 211
1985 362 190 276 498 408 570 438 503 344 530 347 344
1986 509 421 238 303 328 326 353 369 314 354 359 292
1987 289 290 378 408 375 291 565 287 256 271 260 310
1988 290 446 522 459 399 498 344 482 303 360 511 498
1989 463 434 422 379 518 397 551 262 236 341 301 231
1990 441 323 269 303 245 290 203 222 410 214 302 241
1991 363 491 490 404 339 229 294 490 375 274 300 395
1992 399 367 283 649 395 326 294 343 389 241 283 412

Persistency and cyclicity in US drug approvals Author: Daizadeh, I.
Page 35 of 45
1993 221 278 361 413 324 365 413 360 258 335 290 359
1994 458 394 371 282 323 370 325 273 480 327 237 491
1995 349 409 355 246 356 379 252 501 294 392 356 321
1996 277 377 584 512 451 362 456 824 346 401 254 405
1997 452 292 366 554 395 462 473 425 359 391 386 436
1998 334 593 425 435 411 369 332 468 520 476 418 670
1999 265 601 607 426 581 373 361 377 339 385 617 439
2000 406 468 516 642 550 383 513 437 416 485 410 480
2001 366 428 607 638 452 398 383 704 383 475 459 333
2002 479 457 613 555 477 400 693 506 434 569 607 674
2003 255 153 179 214 242 227 147 150 176 192 177 189
2004 164 177 261 232 204 247 232 163 286 226 179 201
2005 136 133 154 227 235 245 205 378 187 146 183 186
2006 160 173 235 172 158 176 216 221 178 204 129 209
2007 181 240 212 240 209 279 207 256 310 311 245 469
2008 257 286 257 248 266 257 202 234 236 308 211 250
2009 217 221 604 278 250 210 264 235 233 156 250 199
2010 224 202 255 307 234 264 216 221 211 243 259 331
2011 235 255 330 246 306 407 282 297 301 292 300 309
2012 331 303 346 301 280 204 302 319 302 265 350 413
2013 417 488 460 549 533 377 468 431 396 425 299 343
2014 400 346 376 361 255 509 514 537 858 334 507 675
2015 456 490 535 662 451 545 560 454 641 524 592 589
2016 556 488 470 496 610 378 350 329 402 313 384 821
2017 449 405 345 411 455 306 280 497 307 299 285 342
2018 186 233 281 303 310 337 341 246 773 374 444 356
2019 342 338 266 441 483 229 419 453 488 840 776 524
plot(time)
Persistency and cyclicity in US drug approvals Author: Daizadeh, I.
Page 36 of 45
summary(time)
Min. 1st Qu. Median Mean 3rd Qu. Max. 0.0 5.0 164.0 186.4 329.2 858.0
library(moments) citation("moments")
Lukasz Komsta and Frederick Novomestky (2015). moments: Moments, cumulants, skewness, kurtosis and related tests. R package version 0.14. https://CRAN.R-project.org/package=moments
sd(time)
190.9333
Kurtosis(time) #platykurtic (excess kurtosis = kurtosis – 3)
2.598539
Skewness(time)
0.6980762
acf(time);pacf(time)
ndiffs(time)
[1] 1

Persistency and cyclicity in US drug approvals Author: Daizadeh, I.
Page 37 of 45
#Step 2: Perform normality, stationarity, seasonality, long-memory, and non-linearity tests
#normality test
library(nortest) #all normality tests rejected hypothesis of normality – presenting two
citation("nortest")
Persistency and cyclicity in US drug approvals Author: Daizadeh, I.
Page 38 of 45
Juergen Gross and Uwe Ligges (2015). nortest: Tests for Normality. R package version 1.0-4. https://CRAN.R-project.org/package=nortest
ad.test(time) #null normality
Anderson-Darling normality test data: time A = 48.166, p-value < 2.2e-16
Cvm.test(time)
Cramer-von Mises normality test data: time W = 7.5428, p-value = 7.37e-10 Warning message: In cvm.test(time) : p-value is smaller than 7.37e-10, cannot be computed more accurately
#stationarity test
Library(aTSA)
Citation("aTSA")
Debin Qiu (2015). aTSA: Alternative Time Series Analysis. R package version 3.1.2. https://CRAN.R-project.org/package=aTSA
stationary.test(time,method="kpss")
KPSS Unit Root Test alternative: nonstationary Type 1: no drift no trend lag stat p.value 7 6.32 0.01 ----- Type 2: with drift no trend lag stat p.value 7 7 0.01 ----- Type 1: with drift and trend lag stat p.value 7 0.671 0.01 ----------- Note: p.value = 0.01 means p.value <= 0.01 : p.value = 0.10 means p.value >= 0.10
stationary.test(diff(time),method="kpss")
KPSS Unit Root Test alternative: nonstationary

Persistency and cyclicity in US drug approvals Author: Daizadeh, I.
Page 39 of 45
Type 1: no drift no trend lag stat p.value 7 0.0776 0.1 ----- Type 2: with drift no trend lag stat p.value 7 0.0281 0.1 ----- Type 1: with drift and trend lag stat p.value 7 0.0162 0.1 ----------- Note: p.value = 0.01 means p.value <= 0.01 : p.value = 0.10 means p.value >= 0.10
#long-memory test
library(LongMemoryTS)
citation("LongMemoryTS")
Christian Leschinski (2019). LongMemoryTS: Long Memory Time Series. R package version 0.1.0. https://CRAN.R-project.org/package=LongMemoryTS
m<-floor(1+500^0.75)
# Qu test
Qu.test(diff(Input$Number.of.Approvals),m) $W.stat [1] 1.033545
$CriticalValues
eps=.02 eps=.05 alpha=.1 1.118 1.022 alpha=.05 1.252 1.155 alpha=.025 1.374 1.277 alpha=.01 1.517 1.426
#Multivariate local Whittle Score
MLWS(diff(Input$Number.of.Approvals), m=m)
$B [,1] [1,] 1
$d [1] 0.9172231

Persistency and cyclicity in US drug approvals Author: Daizadeh, I.
Page 40 of 45
$W.stat [1] 0.9172231
$CriticalValues
alpha=.1 alpha=.05 alpha=.025 alpha=.01 1.11`8 1.252 1.374 1.517
#Seasonality tests
library(seastests)
citation("seastests")
Daniel Ollech (2019). seastests: Seasonality Tests. R package version 0.14.2. https://CRAN.R-project.org/package=seastests
#Webel-Ollech overall seasonality test summary(wo(time))
Test used: WO Test statistic: 0 P-value: 1 1 0.05105411 The WO - test does not identify seasonality
#calculate through variety of tests isSeasonal(time, "qs") #QS test
[1] FALSE
isSeasonal(time, "fried") #Friedman test
[1] FALSE
isSeasonal (time, "welch") #Welch test
[1] FALSE
#Nonlinearity tests
library(nonlinearTseries)
citation("nonlinearTseries")
Constantino A. Garcia (2020). nonlinearTseries: Nonlinear Time Series Analysis. R package version 0.2.10. https://CRAN.R-project.org/package=nonlinearTseries
> nonlinearityTest(time)
** Teraesvirta's neural network test ** Null hypothesis: Linearity in "mean" X-squared = 227.9227 df = 2 p-value = 0

Persistency and cyclicity in US drug approvals Author: Daizadeh, I.
Page 41 of 45
** White neural network test ** Null hypothesis: Linearity in "mean" X-squared = 227.1936 df = 2 p-value = 0
** Keenan's one-degree test for nonlinearity ** Null hypothesis: The time series follows some AR process F-stat = 17.08669 p-value = 3.888728e-05
** McLeod-Li test ** Null hypothesis: The time series follows some ARIMA process Maximum p-value = 0
** Tsay's Test for nonlinearity ** Null hypothesis: The time series follows some AR process F-stat = 2.733688 p-value = 6.342547e-14
** Likelihood ratio test for threshold nonlinearity ** Null hypothesis: The time series follows some AR process Alternative hypothesis: The time series follows some TAR process X-squared = 47.58834 p-value = 0.0004552571
#Step 3: Develop Hurst over time
library(tsfeatures) citation("tsfeatures")
Rob Hyndman, Yanfei Kang, Pablo Montero-Manso, Thiyanga Talagala, Earo Wang, Yangzhuoran Yang and Mitchell O'Hara-Wild (2020). tsfeatures: Time Series Feature Extraction. R package version 1.0.2. https://CRAN.R-project.org/package=tsfeatures
hurstApprovals=0
end<-length(time)
for (i in 1:end) { hurstApprovals[i] <- hurst (time[1:(1+i*1)]) }
hurstApprovals<-ts(hurstApprovals,start=c(1939,1),end=c(2019,12),frequency=12)
plot(hurstApprovals)
Persistency and cyclicity in US drug approvals Author: Daizadeh, I.
Page 42 of 45
#Identify periods
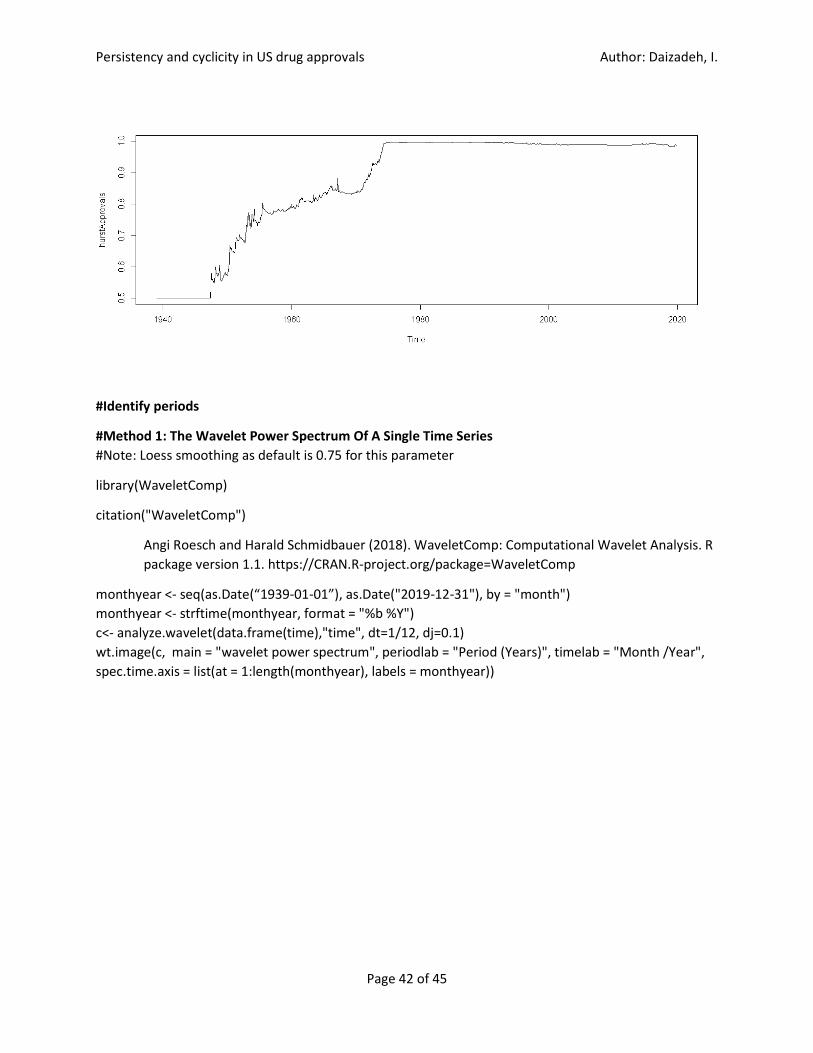
#Method 1: The Wavelet Power Spectrum Of A Single Time Series #Note: Loess smoothing as default is 0.75 for this parameter
library(WaveletComp)
citation("WaveletComp")
Angi Roesch and Harald Schmidbauer (2018). WaveletComp: Computational Wavelet Analysis. R package version 1.1. https://CRAN.R-project.org/package=WaveletComp
monthyear <- seq(as.Date(“1939-01-01”), as.Date("2019-12-31"), by = "month") monthyear <- strftime(monthyear, format = "%b %Y") c<- analyze.wavelet(data.frame(time),"time", dt=1/12, dj=0.1) wt.image(c, main = "wavelet power spectrum", periodlab = "Period (Years)", timelab = "Month /Year", spec.time.axis = list(at = 1:length(monthyear), labels = monthyear))

Persistency and cyclicity in US drug approvals Author: Daizadeh, I.
Page 43 of 45
wt.avg(c)

Persistency and cyclicity in US drug approvals Author: Daizadeh, I.
Page 44 of 45
#Method 2: Continuous Morlet Wavelet Transform
Library(dplR);citation(“dplR”)
Bunn AG (2008). “A dendrochronology program library in R (dplR).”_Dendrochronologia_, *26*(2), 115-124. ISSN 1125-7865, doi:10.1016/j.dendro.2008.01.002 (URL: https://doi.org/10.1016/j.dendro.2008.01.002).
Bunn AG (2010). “Statistical and visual crossdating in R using the dplR library.” _Dendrochronologia_, *28*(4), 251-258. ISSN 1125-7865, doi: 10.1016/j.dendro.2009.12.001 (https://doi.org/10.1016/j.dendro.2009.12.001).
Andy Bunn, Mikko Korpela, Franco Biondi, Filipe Campelo, Pierre Mérian, Fares Qeadan and Christian Zang (2020). dplR: Dendrochronology Program Library in R. R package version 1.7.1. https://CRAN.R-project.org/package=dplR
wave.out <- morlet(time, p2 = 8, dj = 0.1, siglvl = 0.95)

Persistency and cyclicity in US drug approvals Author: Daizadeh, I.
Page 45 of 45
wave.out$period <- wave.out$period/12
wavelet.plot(wave.out)
wave.avg <- data.frame(power = apply(wave.out$Power, 2, mean), period = (wave.out$period))
plot(wave.avg$period, wave.avg$power, type = "l")
#Confirm time series frequency
library(forecast);citation("forecast")
Persistency and cyclicity in US drug approvals Author: Daizadeh, I.
Page 46 of 45
Hyndman R, Athanasopoulos G, Bergmeir C, Caceres G, Chhay L, O'Hara-Wild M, Petropoulos F, Razbash S, Wang E, Yasmeen F (2020). forecast: Forecasting functions for time series and linear models_. R package version 8.12, <URL: http://pkg.robjhyndman.com/forecast>.
Hyndman RJ, Khandakar Y (2008). “Automatic time series forecasting: the forecast package for R.” _Journal of Statistical Software_, *26*(3), 1-22. <URL: http://www.jstatsoft.org/article/view/v027i03>.
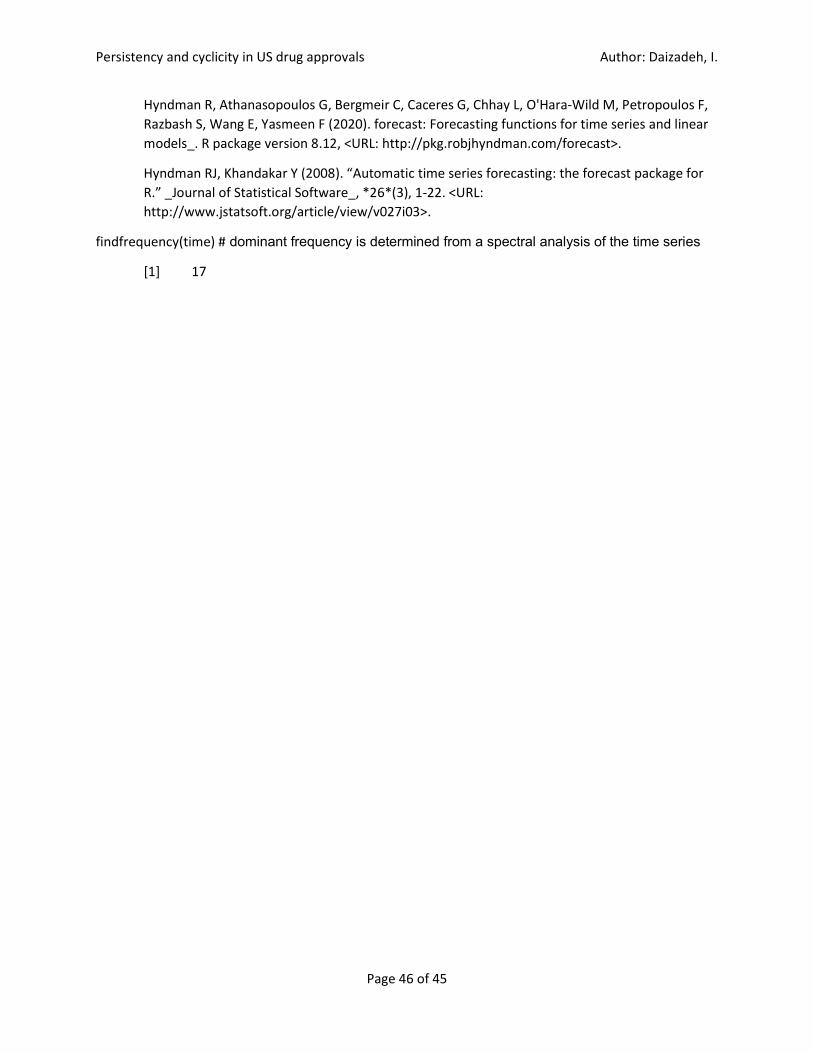
findfrequency(time) # dominant frequency is determined from a spectral analysis of the time series
[1] 17