persicaria perfoliata) using biological …persicaria perfoliata) using biological control and ......
TRANSCRIPT

AN INTEGRATED APPROACH TO THE RESTORATION OF AREAS
INVADED BY MILE-A-MINUTE WEED
(PERSICARIA PERFOLIATA) USING BIOLOGICAL CONTROL AND
HERBACEOUS NATIVE SEEDING
by
Kiri Joy Cutting
A thesis submitted to the Faculty of the University of Delaware in partial fulfillment
of the requirements for the degree of Master of Science in Wildlife Ecology
Summer 2011
Copyright 2011 Kiri Joy Cutting All Rights Reserved

AN INTEGRATED APPROACH TO THE RESTORATION OF AREAS
INVADED BY MILE-A-MINUTE WEED
(PERSICARIA PERFOLIATA) USING BIOLOGICAL CONTROL AND
HERBACEOUS NATIVE SEEDING
by
Kiri Joy Cutting
Approved: __________________________________________________________ Judith Hough-Goldstein, Ph.D. Professor in charge of thesis on behalf of the Advisory Committee Approved: __________________________________________________________ Douglas Tallamy, Ph.D. Chair of the Department of Entomology and Wildlife Ecology Approved: __________________________________________________________ Robin Morgan, Ph.D. Dean of the College of Agriculture and Natural Resources Approved: __________________________________________________________ Charles G. Riordan, Ph.D.
Vice Provost for Graduate and Professional Education

iii
ACKNOWLEDGMENTS
Thanks to my wonderful husband, who dared marry me while in graduate
school and stuck by my side throughout. I’m also grateful to my parents, who
encouraged a love of nature from a young age and helped pave the path to my higher
education. I acknowledge my advisor, who gave sound advice and guidance, providing
an example of a balanced and successful scientist who enjoys her work. I also thank
my other committee members and many collaborators in this work, without whom it
would not have been possible. Also a big thanks to my field technicians, who worked
hard in tough conditions, and my lab mates and fellow graduate students, who
commiserated with me in the pursuit of science. Finally, I thank God for his
masterpiece of a planet, and my privilege of discovering its intricate workings.

iv
TABLE OF CONTENTS
LIST OF TABLES ....................................................................................................... .vi LIST OF FIGURES...................................................................................................... vii ABSTRACT ................................................................................................................ viii Chapter 1 INTRODUCTION.............................................................................................. 1
1.1 Theoretical Background ................................................................... 1 1.2 Study Organisms .............................................................................. 3 1.3 Plant Competition............................................................................. 6
2 MATERIALS AND METHODS ..................................................................... 10
2.1 Field Experiment ............................................................................ 10 2.1.1 Field Experiment Site Preparation .................................. 11 2.1.2 Field Experiment Data Collection................................... 15 2.1.3 Field Experiment Statistical Analyses ............................ 16 2.2 Greenhouse Experiments ............................................................... 18 2.2.1 Greenhouse Main Experiment Preparation ..................... 18 2.2.2 Greenhouse Allelopathy Experiment .............................. 21 2.2.3 Greenhouse Disturbance Experiment.............................. 21 2.2.4 Greenhouse Experiments Data Collection ...................... 22 2.2.5 Greenhouse Experiments Statistical Analyses ................ 23
3 RESULTS........................................................................................................ 25 3.1 Field Experiment ............................................................................ 25 3.1.1 Field Experiment MAM Weed Response ....................... 26 3.1.2 Field Experiment Plant Community Response ............... 29 3.2 Greenhouse Experiments ............................................................... 33

v
3.2.1 Greenhouse Main Experiment Results ............................ 33 3.2.2 Greenhouse Allelopathy Experiment Results ................. 37 3.2.3 Greenhouse Disturbance Experiment Results ................. 38 4 DISCUSSION .................................................................................................. 39 4.1 Field Experiment.............................................................................. 39
4.1.1 Field Experiment MAM Weed Response ....................... 43
4.1.2 Field Experiment Plant Community Response ............... 44
4.2 Greenhouse Experiments ................................................................. 45 4.2.1 Greenhouse Main Experiment......................................... 46 4.2.2 Greenhouse Allelopathy Experiment .............................. 49 4.2.3 Greenhouse Disturbance Experiment.............................. 50 4.3 Conclusion ....................................................................................... 50 Appendix A Neonicotinoid Insecticide Pilot Study....................................................... 52
A.1 Introduction..................................................................................... 52 A.2 Materials and Methods.................................................................... 53 A.3 Results............................................................................................. 55
REFERENCES............................................................................................................. 57

vi
LIST OF TABLES
Table 1. Plant species and ratios used in the native seed mix .................................. 12
Table 2. Number of MAM seedlings per 2m by 2m plot (mean ±SEM), field experiment.......................................................................................... 25
Table 3. Mean plant weights and standard errors for each treatment....................... 55

vii
LIST OF FIGURES
Figure 1 An aerial photograph of the Longwood Gardens field site ........................ 11 Figure 2 Percent cover of P. perfoliata in (A) 2009 and (B) 2010,
field experiment.......................................................................................... 27 Figure 3 Number of immature seed clusters in (A) 2009 and (B) 2010,
field experiment.......................................................................................... 28 Figure 4 Destructive harvest of P. perfoliata biomass, field experiment ................. 29 Figure 5 Species richness in 2010, field experiment. Letters indicate significant
differences within each month (two-way ANOVA, Tukey) ...................... 31 Figure 6 Mean numbers of native and introduced plants in 2010,
field experiment. Letters indicate significant differences within each month and within native (lowercase) and introduced (uppercase) species (two-way ANOVA, Tukey) ........................................................... 32
Figure 7 Percent cover P. perfoliata in (A) 2009 and B (2010), University of
Delaware greenhouse ................................................................................. 34 Figure 8 Number of seed clusters in (A) 2009 and (B) 2010, University
of Delaware greenhouse ............................................................................. 35 Figure 9 P. perfoliata biomass in (A) 2009 and (B) 2010, University
of Delaware greenhouse. Letters indicate significant differences (two-way ANOVA, Tukey) ....................................................................... 36
Figure 10 Native plant biomass grown with and without MAM weed ...................... 37

viii
ABSTRACT
Disturbed areas frequently experience invasion by introduced plant
species and subsequently a drop in species richness and ecosystem services. Research
on the best means of removing these species abounds, but typically does not include
techniques to restore the invaded habitat. Without such restoration the introduced
species often re-occur, or an alternate introduced invasive plant fills the opened niche.
This study investigated an integrated approach to controlling the introduced annual
Persicaria perfoliata [L.] H. Gross (mile-a-minute weed) using the Asian biocontrol
weevil Rhinoncomimus latipes Korotyaev (Coleoptera: Curculionidae) and
establishment of native plants from seed. The native seed mix used was comprised of
five widely adapted plant species, three grasses and two forbs. A fully factorial design
integrated weevils and seeding, using a systemic insecticide as a control. In a field
setting, areas of well-established mile-a-minute weed were sown with natives in early
spring when the weed germinated. A weevil population had been established at the site
one year prior to sowing and was augmented both years of the experiment. By year
two there was significantly lower P. perfoliata mean biomass and percent cover in
plots integrating weevils and native seeds than seed-only or control plots. Further, the
integrated plots had about half the mile-a-minute biomass and percent cover of the
weevil-only treatment. Greenhouse experiments of the same basic design produced
similar results. There was little evidence of native plant establishment during the first
year in the field. Year two resulted in significantly higher native plant species richness

ix
in the integrated weevil and native seed-treated plots. These results indicate that
removal of introduced invasive plant species should be accompanied by re-vegetation
to aid in restoration.

1
Chapter 1
INTRODUCTION
1.1 Theoretical Background
Invasive introduced plants have many deleterious effects in their novel ranges,
including altered fire regimes, nutrient cycling, hydrology, energy budgeting, and
native species survival (Gooden et al. 2009; Gordon 1998; Mack et al. 2000).
Therefore, limiting introduced species via removal or control is beneficial (Morrison
2002; Willis & Birks 2006). If a plant invader is not removed by some means it may
even facilitate growth of other non-indigenous affiliated species (Simberloff & Von
Holle 1999; but also see Simberloff 2006).
Even when invasive introduced plants are removed, the same or another
introduced species will frequently take advantage of the opened niche (Benz et al.
1999; Reeder & Hacker 2004). This dynamic has been especially noted in the
biocontrol field (Butler & Wacker 2010; Stephens et al. 2009; Thomas & Reid 2007;
McEvoy & Coombs 2000) and has been termed the “invasive species treadmill”, in
which removal of the problematic species merely leads to alternative invasion as a

2
result of the habitat disturbance. Because of this, an integrated approach to restoration
of areas invaded by introduced plant species has been suggested as important from the
standpoints of vegetation (Benz et al. 1999), soil and nutrient cycling (e.g Heneghan et
al. 2008) and economics (Lym 2005). In the case of plants, this means replacement of
target weeds with beneficial natives is a better solution than removal without follow-
up (Hough-Goldstein et al. 2008a; Lonsdale & Farrell 1998; Lym 2005).
Hacker and Dethier (2009) expand on the dynamics of community disturbance
through foreign plant invasion by using the alternative stable state theory, a model
originally proposed by Lewinton (1969). They suggest that one of three states will
occur after introduced species removal, “(1) the invasion state in which the invader
dominates the community through positive feedback mechanisms that continue its
expansion and dominance (2) a restored state defined as the replacement of the lost
species assemblage with the original assemblage, and its function, after the invader is
removed, and (3) an alternative state defined as one in which a new species
assemblage colonizes (either native or non-native) and persists; it could include
reinvasion by the original invading species or other non-indigenous species.” Most
sites invaded by mile-a-minute weed (Persicaria perfoliata [L.] H. Gross) resemble
the first state described (Hough-Golstein et al. 2008), and after removal via biocontrol,
the third state (reinvasion by itself or other introduced species) (K. Cutting, University
of DE, personal observation).
Depending on the ecological legacy of the site, i.e. seed bank, mycorrhizal
presence, allelopathic effects, nutrient cycles, etc. (Schaefer 2009), it is rarely possible

3
to restore to the original plant assemblage (Hilderbrand et al. 2005, Zedler 2000). To
attempt the painstaking task of forcing a site to resemble an exact previously
documented single state may not be the most practical route in an era when restoration
of functional ecosystems is in high demand but funding scarce.
The goal of this study was to assess ways to actively and efficiently restore an
area invaded by P. perfoliata so it reaches the third state as described by Hacker and
Dethier, i.e. that of a new species assemblage of persisting natives that are resilient to
reinvasion (the second version of the third state described above). Some of the newly
restored plant species may have originally been present prior to the invasion, and may
still persist nearby ready to re-colonize via propagule pressure. Restoration designs
should consider re-vegetation with locally occurring native species, preferably of
regional ecotype (Hufford & Mazer 2003). Our objective is for the new community to
provide ecosystem services and function with all the stability of a biodiverse native
habitat (Ives & Carpenter 2007; Duffy 2009). If undisturbed, it may remain resistant to
another invasion.
1.2 Study Organisms
Persicaria perfoliata, or mile-a-minute weed (MAM), is an invasive annual
vine accidentally introduced from Asia to York, PA in the 1930s (Moul 1948).
Leaves are alternate and triangular, and a diagnostic feature is the presence of saucer-
shaped ocreae, or fused stipules that surround the stem at each leaf node (Hough-

4
Goldstein et al. 2008a). Seeds germinate in early spring, and vines grow rapidly during
the summer, with small spines on leaves and stems helping the plant to climb up and
over other vegetation. Seed production may occur as early as June, but the majority of
the seeds are produced in the fall (Hough-Goldstein et al. 2008a, b).
This plant inhibits commercial and natural forest regeneration, interferes with
recreational use of natural areas, reduces wildlife habitat, and may lead to native floral
decline (Mountain 1989; McCormick and Hartwig 1995;Wu et al. 2002; Hough-
Goldstein et al. 2008a). Because of this, MAM may be considered both a transformer
species (Dodson & Fiedler 2006) and ecosystem engineer (Jones et al. 1997).
P. perfoliata proliferation after initial introduction is most likely aided by lack
of top-down regulation (i.e. enemy release hypothesis, Williamson 1996) paired with
fast growth and nutrient cycling. Its remarkable ability to dominate disturbed plant
communities may also be promoted through underground interactions such as
allelopathy or mycorrhizal associations. Whatever the means, MAM has spread widely
after invasion, characterizing the community dominant species Gordon (1998)
describes as one capable of changing ecosystem processes. There is urgency in the
need to halt spread of this species (Kumar & Ditommaso 2005).
An approach to limiting the invasion by MAM is development of integrated
control strategies based on ecological knowledge of the plant both in its novel and
native host ranges (Hyatt & Araki 2006). Therefore we seek to address MAM’s pre-
disposition to dependence on disturbance (i.e. open niches) and will attempt to reduce
plant survival and seed production (Hyatt & Araki 2006).

5
Hyatt & Araki (2006) suggested control of MAM through labor-intensive
mechanical plant removal, but this is somewhat unrealistic given the current state of
invasion. McCormick and Hartwig (1995) pose that MAM can and should be
controlled with herbicides. However, this method of control is costly and often
difficult due to lack of accessibility in some environments (Lym 2005). Herbicides can
also cause collateral damage by impacting non-targets (Simmons 2005).
However, without initial control of the target weed by some means, re-
vegetation through native seeding may not succeed (Lym 2005). Hence, a vital part of
the integrated approach presented here is through establishment of the appropriate
biocontrol agent, Rhinoncomimus latipes Korotyaev (Coleoptera: Curculionidae) or
the mile-a-minute weevil. R. latipes feeds only on P. perfoliata in both its native and
introduced ranges, in both the adult and larval stages (Colpetzer et al. 2004a; Ding et
al. 2004; Frye et al. 2010) and was released in the U.S. in 2004.
The small (approx. 2-mm long) adult R. latipes weevils emerge in early spring,
soon after MAM seedlings appear, and chew characteristic small round holes in the
leaves. They lay their eggs on P. perfoliata stems, terminals, and leaves, with
oviposition beginning about 6 days after adult emergence and continuing at a rate of
about 3 eggs per female per day for at least 2 months under laboratory conditions
(Colpetzer et al. 2004b). Larvae bore into the stem at nodes soon after hatching,
complete their development internally, then exit the stem and drop to the soil for
pupation (Hough-Goldstein et al. 2008a). The weevils go through at least three or four
overlapping generations during the growing season in the Mid-Atlantic region, with

6
each generation taking about one month to develop (Lake et al. 2011, in press). Adults
stop producing eggs between late August and late September, and adult weevils
overwinter in the leaf litter or soil.
1.3 Plant Competition
The vacant niche is key in invasions because it represents underutilized
resources (Elton 1958; Mack et al. 2000; Tilman 1999). Strongly competing plants
quickly fill vacant niches because of the nutrients, water and sunlight they offer. An
occupied niche hampers invasion because the resources are taken. This dynamic is
exemplified in the invasive species treadmill concept, and underscores the need for
intentional replacement of native competitive vegetation if disturbance occurs.
Disturbance from a variety of sources initially allows invasion by MAM. After
biocontrol weevils are applied to invaded areas, it appears that weevil-induced
weakening and mortality of MAM weed is in turn a disturbance that creates an open
niche. It is at this point active restoration with native resource competitors will prevent
the invasive treadmill from occurring.
Elton (1958) and Tilman (1999) propose that community species richness
is inversely proportional to invasibility (diversity-invasibility hypothesis). In
greenhouse conditions, Perry & Galatowitsch (2003) showed that a mix of four
perennial and annual native cover crops suppressed growth of annual introduced

7
species. We hypothesized that a mix of hardy annual and perennial native forbs and
warm and cool season grasses would facilitate strong resource competition with MAM
over time and throughout each growing season. Forbs establish quickly after seeding
and create initial competition for light and space. MAM is an early emerger (a trait
typical of successful invaders), so the cool season grass provides competition in
subsequent springs. Lonsdale and Farrell (1998) showed that perennial grasses
competing with an introduced species during germination significantly reduced the
number of introduced seedlings germinating, as well as their final biomass. Warm
season grasses continue to grow rapidly through the summer, competing for water
resources.
Plants proposed for re-vegetation are more than a placeholder or resource
competitor. Plant nativity has important ramifications for wildlife species and diversity
due to the nature of its chemical composition and expression. Native plants have been
shown to support a significantly greater abundance and species richness of native
Lepidoptera due to a shared evolutionary history (Burghardt et al. 2010). It has been
suggested that the same is true of other arthropods (Tallamy 2004). Native insects,
therefore, may be the primary means by which energy is transferred up through the
trophic levels, supporting an array of invertebrates and vertebrates (Burghardt et al.
2009). The ecosystem services provided by the natural world, largely comprised of
native plants, have been estimated at a value of $33 trillion per annum (Costanza et
al.1997). Plants in their native context have evolved interacting with a broad
community, becoming regulated through top-down control and interspecific

8
competition. They therefore should not exhibit domineering qualities when in their
native range.
Interspecific competition is caused by plant neighbors and their impacts
both above and below the soil surface. Murphy & Dudley (2007) have shown that
soybean plants respond to above and below ground competitive cues independently.
This suggests that both light competition and root neighbors may be important to
trigger competitive phenotypic responses in plants (Callaway 2002). A significant
difference in root growth occurs in root neighbors when compared with plants grown
separately but with equal resource access (Gersani et al. 2001). This non-resource
based interaction can trigger heavy use of resources allotted to stem elongation and
root mass growth (Murphy & Dudley 2007). These events could increase a plant’s
immediate competitive strength, but at the cost of negatively influencing processes
such as leaf and seed production (Murphy & Dudley 2007; Gersani et al. 2001). It is
expected that such a competitive reaction would be heightened in the case of MAM’s
weak root system (Mountain 1989) in the presence of native grasses’ strong sod
formation (Benz et al. 1999; Burton et al. 2006). Compromised reproduction has
severe implications in an annual plant such as MAM where seed production is key to
population persistence and propagation over time (Mountain 1989).
Various studies have explored the compromising effects of herbivory on
plants’ abilities to compete with surrounding vegetation, whether intraspecific (Center
et al. 2005) or interspecific (Bacher & Schwab 2000). Bacher & Schwab found that
augmentative biocontrol of Cirsium arvense (L.) Scop. (Canada thistle) combined with

9
herbaceous seeded plant competition reduced problematic thistle populations in
Switzerland by 50%. The perennial plant, Canada thistle, uses substantial root masses
to store nutrients for survival. If the combined pressure of herbivory and seeded plant
competition caused this level of mortality in plants with such robust roots, it is
reasonable to believe that P. perfoliata, with its relatively weak root systems, may
struggle more so under similar treatment.
This additive effect of herbivory and competition is due to the fact that a
plant’s tolerance to herbivory is most likely linked to resource availability (Hawkes &
Sullivan 2001; Sun et al. 2010). It has already been demonstrated that plant
competition in concert with R. latipes feeding causes weakening of P. perfoliata
(Hough-Goldstein et al. 2008b). We hypothesize that resource competition via
surrounding native plants may render P. perfoliata vulnerable to extensive R. latipes
damage. This could initiate a positive feedback cycle, as native plants respond to
continual release from MAM via weevil feeding. Ultimately, we hypothesize that this
integration of weevil feeding and native seeding will transform an introduced species
monoculture to a restored, biodiverse habitat that provides vital wildlife and
ecosystem services.

10
Chapter 2
MATERIALS AND METHODS
2.1 Field Experiment
A field site with a mile-a-minute weed (MAM) infestation of ~118 m2 was
selected in 2008. It was present on Longwood Gardens (LWG) land, a public garden
located in the piedmont in Kennett Square, Lancaster County, PA (39°52'48.44"N
75°40'07.12"W).
The LWG site was a long, narrow patch of MAM situated between a fence
line and a steep bank adjacent to Route 926. The patch was approximately 2.5 meters
wide and 59 meters long. Initially the predominant vegetation within the patch besides
MAM was Dennstaedtia punctilobula (Michx.) T. Moore (eastern hayscented fern),
various Rubus spp., Microstegium vimineum (Trin.) A. Camus (Japanese stiltgrass),
Lonicera japonica Thunb. (Japanese honeysuckle), and Phytolacca americana L.
(American pokeweed). An aerial photograph shows the patch within the surrounding
landscape (Fig. 1).
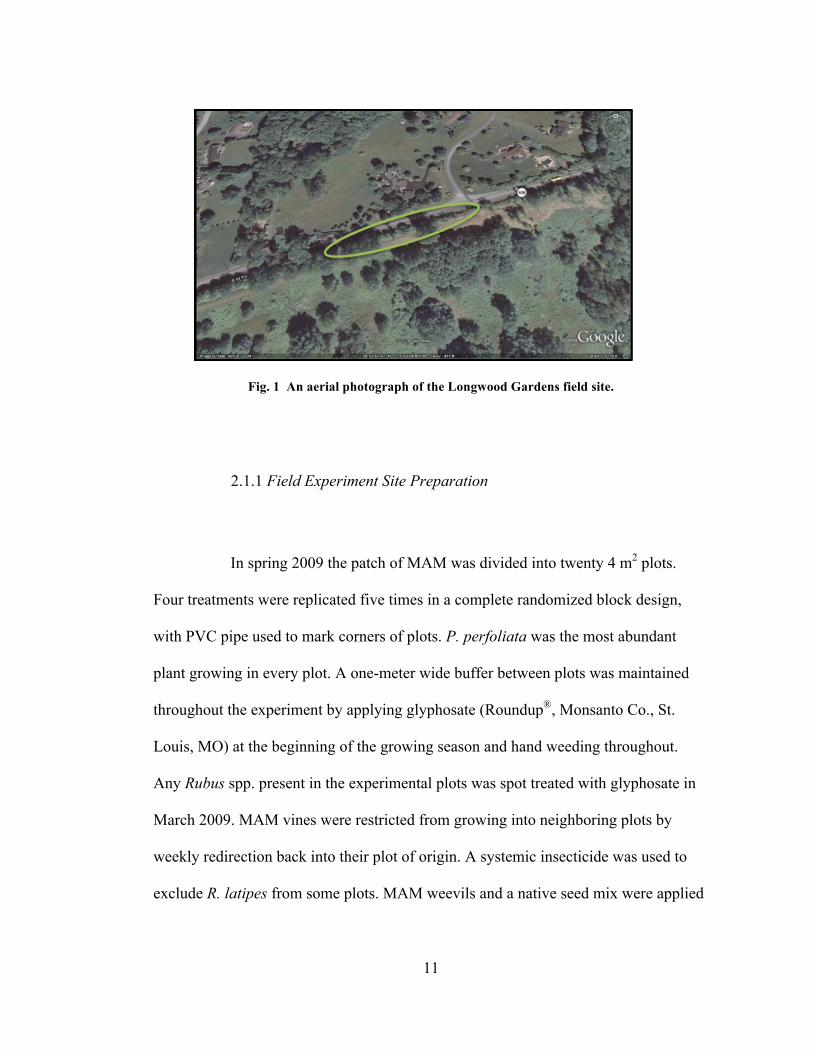
11
Fig. 1 An aerial photograph of the Longwood Gardens field site.
2.1.1 Field Experiment Site Preparation
In spring 2009 the patch of MAM was divided into twenty 4 m2 plots.
Four treatments were replicated five times in a complete randomized block design,
with PVC pipe used to mark corners of plots. P. perfoliata was the most abundant
plant growing in every plot. A one-meter wide buffer between plots was maintained
throughout the experiment by applying glyphosate (Roundup®, Monsanto Co., St.
Louis, MO) at the beginning of the growing season and hand weeding throughout.
Any Rubus spp. present in the experimental plots was spot treated with glyphosate in
March 2009. MAM vines were restricted from growing into neighboring plots by
weekly redirection back into their plot of origin. A systemic insecticide was used to
exclude R. latipes from some plots. MAM weevils and a native seed mix were applied

12
in a fully factorial design. The four combinations (treatments) and their corresponding
abbreviations were: weevils/no seed mix (Wnoseed), no weevils (treated with
dinotefuron)/no seed mix (Dnoseed), weevils/seed mix (Wseed), and no weevils
(treated with dinotefuron)/seed mix (Dseed).
With the diversity-invasibility hypothesis in mind, we chose to re-vegetate
with a variety of native plants. Our five species (Table 1) represent five genera from
two different plant families, varying in life histories, resource needs, rooting behaviors
and statures (Burton et al. 2006). This mix includes widely adapted, hardy annual and
perennial forbs, as well as warm and cool season perennial grasses. Only plant species
native to the U.S. mid-Atlantic region were used in this study.
The mix was purchased from Ernst Conservation Seeds (Meadville, PA)
who recommended a seeding rate of 25 lbs/acre, or ~2.81 g/m2. This custom mix of
five species was of local ecotype and was seeded at a rate of ~ 11.3 g/plot (4 m2) in
April 2009.
Table 1. Plant species and ratios used in the native seed mix.

13
Pine wood flakes were purchased by the bale (Southern States, Newark,
DE) and used as a broadcast medium for the native seed mix. The shavings were
mixed with the seeds and distributed to a depth of ~1 cm. A thatch of dead MAM
vines from previous years’ growth (~3-5 cm thick) was removed to apply the
seed/shavings mixture and then replaced.
Because the growth of natives seeded in 2009 appeared to be minimal in
early 2010, plugs of the same species (Table 1) were planted in the native seed-treated
plots in spring 2010. The plugs were ordered from North Creek Nurseries
(Landenberg, PA) and planted in the same ratios (Table 1) as the seeds in the earlier
mix. The plugs were planted in a random pattern that was the same in all natives-
treated plots. Plugs were marked with plastic in-ground labels to allow for ease of
monitoring. Each week the plugs were located via the markers and assessed as dead or
alive. As with the MAM plants, percent cover of the native plugs was also estimated
each week.
In order to create ‘no weevil’ treatments a systemic insecticide was used.
Dinotefuron is a neonicotinoid compound (Safari 20 SG, Valent U.S.A. Corp.,
Walnut Creek, CA) that is highly water-soluble and fast acting. According to a pilot
study (see Appendix A) it eliminated weevils more quickly than imidacloprid and did
not cause a significant difference in plant biomass compared to untreated plants
without weevils. It was applied as a soil drench at a rate of 51 g per 28.4 liters water
(1.8 oz per 7.5 gal of water) three times in the 2009 season (15 May, 16 July, and 14
August) and two times in the 2010 season (28 April and 8 July). When dinotefuron
was applied to plots to eliminate weevils during the 2010 season, the same amount of

14
water (~7.5 gal), without the chemical, was applied to the plots where weevils were
present.
Weevils were initially released at the site in July 2008 and weevil feeding
damage was assessed as high (extensive damage on most leaves) in October 2008, six
months before the experiment began. Although clearly established by spring 2009, the
R. latipes population at the field site appeared to be sparse so additional weevils were
introduced upon emergence of MAM seedlings in May 2009 at the rate of 100
weevils/plot, totaling 1,000 weevils. The following spring in May 2010, weevils were
again added to the plots, but releases were staggered (two releases, two weeks apart)
and weevils were distributed among plots according to the percent cover of MAM
weed. A total of 1,100 weevils were released in May 2010. In both 2009 and 2010 the
weevils were reared and shipped overnight from the NJ Department of Agriculture
Philip Alampi Beneficial Insects Laboratory (Trenton, NJ).
Additional summer releases of weevils were made. In August 2009, 340
weevils were collected from a separate location and added to the field study
population at the rate of ~0.5 weevils/1% cover of MAM. In June 2010 a total of 1,100
weevils were distributed among the ‘weevil treated’ plots according to the percent
cover of MAM present.
In 2010 supplemental watering occurred on two occasions (6 July and 9
September). Each plot received 38 L of water, except those that were about to be re-
dosed with dinotefuron. Dinotefuron was applied as a drench of 38 L of water and
dissolved insecticide.
Popillia japonica Newman (Japanese beetles) were present at the site and
can sometimes feed heavily on MAM (Hough-Goldstein 2008a). In order to prevent

15
their feeding effects from confounding those of the weevils, Japanese beetle traps
(Spectrum Brands, Alpharetta, GA) were hung ~92 m away on two sides from the
experiment during July and August each year.
2.1.2 Field Experiment Data Collection
MAM seedlings in each plot were counted shortly after germination each
spring (15 -21 May 2009 and 10 -17 April 2010) as soon as clear identification was
possible.
Data for all plots were collected within a single day, at weekly intervals,
and included: number of adult R. latipes, weevil foliar feeding damage, percent cover
MAM, number of immature and mature seed clusters, and native plug percent cover
and mortality. Native seeded plant cover was not measured. During 2010 monthly
plant species richness surveys were conducted and at the conclusion of the 2010
season a final destructive harvest occurred.
Adult weevils were counted via a thorough visual search of all P.
perfoliata within a plot, using a tally clicker. The same investigator measured this
variable both years because search skill and technique differs between observers.
Weevil feeding damage was rated on a scale of 1-4 in 2009: (1) = no
damage, (2) = holes in a few scattered leaves, (3) = holes in many leaves, (4) =
extensive damage on most leaves. In 2010 the scale was expanded to 1-6 to allow for
more descriptive and statistical power, as follows: (1) = no damage, (2) = holes in a
16
few scattered leaves, (3) = holes in half the leaves, (4) = holes in many leaves, (5) =
holes in most leaves, (6) = extensive damage on most leaves.
MAM seed clusters were counted during the entire season using a tally
clicker, with a minimum of three seeds defining a cluster, and immature and mature
seed clusters tallied separately. An immature cluster was defined as one with at least
one fully formed immature seed present, and mature clusters as those with at least
one blue seed present.
The percent cover of MAM was estimated visually for each plot, and
always by the same observer. The remaining plot area consisted of various plants, bare
ground, or detritus.
In 2010 monthly plant surveys were conducted to determine species
biodiversity in each plot. The United States Department of Agriculture
(http://plants.usda.gov/java/) plant database was used for species common names and
assignment of nativity. Between 11and 18 Oct 2010 all MAM was harvested by
cutting the vines at soil level. This vegetation was placed in large brown paper bags in
a drying oven at 95 - 100°C for 11 days, and then weighed.
2.1.3 Field Experiment Statistical Analyses
For all experiments, data were tested for normality using the Shapiro-Wilk
test and for homogeneity of variance residuals using Levene’s test. Where necessary,
data were either log or square root transformed to improve homogeneity or normality.

17
The arcsine-square root transformation was applied to percentages where at least some
were more than 70% or less than 30% (Snedecor and Cochran, 1980). If transformed
data failed to meet assumptions of normality, then data were ranked and statistical
tests were applied to the ranks. Non-transformed data are shown in figures and tables.
The 2009 and 2010 P. perfoliata seedlings counted at germination were compared
using a 2-way analysis of variance (ANOVA) followed by a Tukey’s test for mean
separation.
Data collected weekly were compared by repeated measures ANOVA,
using the REPEATED statement in PROC GLM of the SAS system (Littell et al.
2002). This analysis was applied to data collected during the peak of the season for
each variable, when treatment effects were most likely to be observed (e.g. data
collected for MAM cover was tested over August and September dates, when cover
was at its highest before plant senescence). Data for different variables could not be
tested over identical time frames due to differences in phenology (i.e. time of peak
seed production and peak percent cover are different). Data for the same variable were
tested over roughly the same time frame each year.
For immature seed cluster data the dates tested were late in the season, 28
August - 29 September (2009) and 17 August - 23 September (2010), during the peak
of seed production. Percent cover of MAM was compared for the time periods of 3
August - 10 September (2009) and 4 August - 9 September (2010), before
characteristic plant senescence.

18
Plant species richness and destructively harvested MAM biomass were
analyzed using two-way ANOVAs followed by Tukey’s test for mean separation, to
compare the four treatments independently. They were also analyzed with an ANOVA
for a two-way factorial experiment where factors (or main effects) were weevil vs. no-
weevil and seed vs. no-seed (Littell et al. 2002). For some tests, effects of each factor
were determined using the SLICE option in the LSMEANS statement of SAS to
obtain F-tests for simple effects (Littell et al. 2002). Either the main effects
(differences within weevil treatment or within seed treatment), or the simple effects
(e.g. differences of weevil treatment within seed treatment) are reported for each test,
but never both (Littell et al. 2002).
2.2 Greenhouse Experiments
For the greenhouse experiments, plants were grown in heavy-duty flats
(Kardon Corp., now owned by Buckhorn Inc., http://www.buckhorninc.com/contact/),
35.6 cm wide x 50.8 cm long x 15.3 cm deep (0.18 m2 surface area). Pro-Mix (Premier
Horticultural Inc., Quakertown PA) was used as the growth medium.
2.2.1 Greenhouse Main Experiment Preparation
The MAM seed used in the greenhouse experiment was collected in fall
2008 and again in fall 2009 in sufficient quantities to replicate seed density found in

19
the field. The seed was collected from multiple sites, mixed together, dried for 6
weeks, and refrigerated for 4 weeks before distribution into flats. MAM seed was
distributed into the flats at a rate of 300 seeds/m2, since 300-500 stems/m2 have been
found in severe MAM infestations (Hough-Goldstein et al. 2008a; Hyatt & Araki
2006). In 2008, 1,080 seeds were used (0.18 m2 /flat x 20 flats = 3.6 m2), or 54 MAM
seeds/flat. Seeds were dropped onto the soil surface of each flat and then sprinkled
with additional pro-mix. Flats were placed outdoors to overwinter next to the UD
greenhouse in December of 2008 and 2009.
While the same procedure was applied in year two, several alterations
were made due to poor MAM germination in year one. The seeding rate was increased
to 75/flat, totaling 1,500 seeds. Also the flats were completely encased in a fine mesh
screen to prevent contamination by debris including unwanted seeds during the
overwintering process. The mesh also prevented seed predation by rodents. While the
flats were outside they were watered to prevent seed desiccation and rotated monthly
to avoid bench effects. Immediately after germination the flats were brought into the
greenhouse, which occurred in early May in 2009 and early April in 2010.
Where necessary, MAM seedlings were culled (in 2009 some were
transplanted) to adjust to seven seedlings per flat. Flats were arranged in blocks so that
one of the four treatments was in a randomly selected position within each block.
Treatments were replicated five times.
The same native seed mix composition (Table 1) as used in the field
experiments was planted into the native-seed treated flats as soon as possible after
MAM germinated. The total amount of native seed mix needed for the 10 flats was
~5.06 g [(10 flats x 0.18 m2 = 1.8 m2) x 2.81 g/m2 ~ 5.06 g]. This is ~0.5 g/flat, when

20
seeded at the same rate as in the field. Flats were watered and lightly fertilized (Peters
21-5-20 fertilizer at a rate of 200 ppm nitrogen) weekly.
As soon as possible after native seeding, weevils were introduced to
weevil-treated flats while dinotefuron was applied to no-weevil flats. Dinotefuron was
reapplied in July, 2009. In 2009 five weevils were released on each flat within 2 days
of native seeding. This density (a rate of ~25 weevils/m2 of MAM weed) has been
found capable of suppressing MAM (Hough-Goldstein 2008b). The rate of 5 weevils
per weevil-treated flat resulted in a total of 50 weevils initially released in the
greenhouse. Large thermoregulation fans present in the greenhouse walls apparently
caused weevils to be sucked out periodically during the 2009 season. Due to this
unplanned weevil removal, supplemental weevils were added weekly to ensure that at
least 5 weevils were present on the each weevil-treated flat throughout the experiment.
Despite this attempt to compensate for the fans, weevils had
uncharacteristically low numbers, feeding damage, and overall impact in 2009.
Because of this, the weevil number was increased to 8/flat in 2010 and weevils were
restricted to flats via use of white mesh cages measuring 61x61x61 cm (bug dorms,
BioQuip, Rancho Dominguez, CA) instead of using dinotefuron. To equalize cage
effects, every flat was covered with an individual cage to exclude or include weevils,
depending on the treatment requirements. In 2010, dinotefuron was not needed to
eliminate weevils due to use of cages so treatment nomenclature was changed from a
“D” designating no-weevils to “No Weevil” for that year and experiment alone.
Greenhouse pests infested the experimental flats on several occasions.
Early in 2009 aphids became problematic on flats not treated with dinotefuron.
Ladybugs collected from the field were released on these flats and brought the aphids

21
under control. At the end of both the 2009 and 2010 seasons, mealy bugs infested
senescing plant material and so the destructive harvest occurred immediately. In
spring 2010, slugs infested the R. hirta plants so beer in dishes was used to control
their population. Later in 2010 white flies were controlled by use of yellow sticky
cards.
2.2.2 Greenhouse Allelopathy Experiment
In year two (2010) an additional treatment was added to the greenhouse
experiment to investigate possible allelopathic effects of MAM weed. When native
seeds were planted into flats with germinating MAM in early spring 2010, each block
also included a flat growing just the native seed mix. This was to allow a comparison
of native plant biomass when grown with and without MAM. The flats with MAM
were overwintered to cold-stratify the seeds. The flats that had only native seeds did
not overwinter because those seeds did not require stratification to germinate. The
natives-only treatment was rotated with the other four treatments in each block and
then harvested at the end of the season, dried, and weighed for comparison.
2.2.3 Greenhouse Disturbance Experiment
One further experiment was conducted in the greenhouse to determine
how disturbance might influence the establishment of MAM weed. There were two

22
treatments in this experiment, and the same native seed mix and application rate was
used as was in the previous experiments. In 2009 the seed mix was distributed into ten
flats of pro-mix and was watered and fertilized weekly, allowing the plants to establish
throughout the season without additional manipulation. In late fall 2009, 75 MAM
seeds were dropped into each one of these established-natives flats. Seventy-five
MAM seeds were also placed into each of ten additional flats of plain pro-mix (the
same flats used for the main greenhouse experiment). All twenty flats were then
placed outside in fall 2009 to overwinter (see section 2.2.1). When the MAM began to
germinate in early spring 2010 the twenty flats were brought inside. Of these twenty
flats, ten were exposed to weevils (five from each treatment). Weekly supplements of
weevils kept the populations of weevil-treated flats to a minimum of eight. Cages were
kept on each flat to control weevil movement.
2.2.4 Greenhouse Experiments Data Collection
As in the field experiments, data variables for all plots were collected
within a single day, at weekly intervals. Variables were the same as in the field except
that no native plugs were planted in the greenhouse and MAM seedling survival was
monitored in the disturbance experiment only. Variables were measured using the
same protocol as described in section 2.1.2. The 2010 expanded feeding damage rating
scale was used in year two of the greenhouse experiment. A destructive harvest of all
species grown in the greenhouse experiment occurred 14 September 2009 and 24
September 2010.

23
For the disturbance experiment, the number of MAM seedlings that
germinated in each flat was counted and seedlings were not moved or manipulated as
was done in the other treatments. In the disturbance experiment MAM seedlings were
a dependent (i.e. response) variable of interest, whereas in the rest of the treatments
they were an independent variable.
At the end of each growing season, greenhouse flats were destructively
harvested, air dried, and weighed for biomass, with MAM, native grasses, and native
forbs weighed separately. Harvests occurred on 14 September, 2009 and 24
September, 2010.
The allelopathy experiment only ran one year and hence was harvested
once (2010), and the disturbance experiment did not need to be harvested because all
MAM died before the end of the season. When the flats were harvested native biomass
was divided into grasses and forbs to compare which grew better.
2.2.5 Greenhouse Experiments Statistical Analyses
For all greenhouse experiments, data were analyzed as described in 2.1.3.
For weekly data tested using repeated measures in SAS, immature seed clusters were
compared for 11 August - 14 September (2009) and 16 August - 21 September (2010).
The percent cover of MAM dates tested were 22 June - 28 Jul (2009) and 21 June – 27
July (2010).
Destructively harvested MAM and native biomass were also analyzed
using the methods in 2.1.3. Native biomass was analyzed using a two-way ANOVA to

24
compare total grasses and total forbs for both 2009 and 2010. Total native biomass
was also analyzed by treatment in 2009 to determine if the dinotefuron used that year
had a stimulatory effect on native plant growth.
A two-way ANOVA was used to compare seedling germination numbers
between the two treatments in the Disturbance Experiment.

25
Chapter 3
RESULTS
3.1 Field Experiment
The number of MAM seedlings in spring did not significantly differ
among treatments when tested for either 2009 (F3,12 = 3.24, P = 0.0603) or 2010 (F3,12
= 2.33, P = 0.1265; Table 2). P. perfoliata seedling numbers were more than ten-fold
greater in 2010 than 2009.
Table 2. Number of MAM seedlings per 2m by 2m plot (mean ±SEM), field
experiment.
The number of adult weevils did not increase greatly throughout 2009. In
fact, the average number of weevils (combined Wseed and Wnoseed treatments) per
plot averaged across the season was ~52, with minimal population growth over time.

26
In 2010 numbers grew steadily, and mean number of weevils for a given plot over the
entire season was ~80. There was a steep increase in population at the end of the
season. Weevils were rarely present in the dinotefuron-treated plots. On a few
occasions individuals were found on these plots, usually displaying signs of
insecticide exposure. However, if they were found and continued behaving normally
after a 30 min observation period, dinotefuron was re-applied soon after.
Foliar feeding damage followed a similar trend over 2009 and 2010. In
2009 there was little difference in damage levels between beginning and end. Mean
rated damage throughout the season was a 2.83 (on a 1-4 scale), while the following
year it was 3.65 (on a 1-6 scale). Mirroring weevil abundance, in 2010 there was a
marked increase in feeding damage as the season progressed, and the P. perfoliata
plants displayed clear signs of stress.
3.1.1 Field Experiment MAM Weed Response
The difference in percentage cover of P. perfoliata was marginally
significant in a repeated measures ANOVA for 3 August – 10 September, 2009 (F3,16
= 2.47, P = 0.0991; Fig. 2A ), and was significant over 4 August – 9 September, 2010
(F3,16 = 6.73, P = 0.0038; Fig. 2B). For both years the Wseed treatment had the lowest
mean value for percent cover.

27
Fig. 2 Percent cover of P. perfoliata in (A) 2009 and (B) 2010, field experiment.
The number of immature P. perfoliata seed clusters was not significantly
different for 28 August – 29 September, 2009 (F3,16 = 2.26, P = 0.1204; Fig. 3A), but
was different by treatment for 17 August – 23 September, 2010 (F3,16 = 12.45, P =
0.0002; Fig. 3B). Both years the Wseed treatment produced the fewest seed clusters.

28
Fig. 3 Number of immature seed clusters in (A) 2009 and (B) 2010, field experiment.
MAM biomass for the Wseed treatment was significantly lower than
either dinotefuron treatment (F3, 12 = 7.74, P = 0.0039; Fig. 4). The dinotefuron-treated
plots had four to five times as much MAM biomass as the Wseed plots (Fig. 4).
The factorial ANOVA followed by the slice procedure indicated
significant effects of the seed mix treatment in plots with weevils (F1,16 = 12.67, P =
0.0026) but not if weevils were not present (F1,16 = 2.44, P = 0.1378). This means the
biomass of MAM was lowered due to the native seed mix, but only when the seeds
were in the presence of weevils.

29
Fig. 4 Destructive harvest of P. perfoliata biomass, field experiment.
3.1.2 Field Experiment Plant Community Response
Both percent cover of and surviving numbers of native plugs planted in
spring 2010 dwindled over the season. Of the 25 plugs planted in each plot, a mean of
21 survived in the Wseed treatment and only 17 in the Dseed treatment. Percent cover
change over time was negligible, as both treatments started with a 5% cover measure
and ended with a mean of 6% (Wseed) and 4% (Dseed). By mid-season 2010 it

30
became clear that the native seed mix distributed in 2009 was growing despite earlier
observations to the contrary. Plant species richness surveys from 2010 showed Wseed
plots consistently hosting the most species throughout the season, and the difference
among treatments was significant in May (F3,12 = 7.00, P = 0.0056, Fig. 5) and July
(F3,12 = 4.72, P = 0.0212; Fig. 5). In both months, factorial ANOVAs indicated the
seed treatment main effect was significant (May: F1,16 = 4.72, P = 0.0065, July: F1,16 =
5.81, P = 0.0284) but the weevil treatment main effect was not (May: F1,16 = 0.03, P =
0.8642, July: F1,16 = 0.90, P = 0.3565).

31
Fig. 5 Species richness in 2010, field experiment. Letters indicate significant differences within
each month (two-way ANOVA, Tukey).
When analyzed by plant nativity, the Wseed treatment had significantly
higher numbers of native species than the non-seed treatments every month (Fig. 6).
Factorial ANOVAs showed this was again the effect of the seed treatment (May: F1,16
= 30.39, P < 0.0001, June: F1,16 = 19.64, P = 0.0004, July: F1,16 = 33.56, P < 0.0001,
August: F1,16 = 15.01, P = 0.0013).
The Wseed treatment had the lowest average number of introduced
species all season, significantly lower than the Wnoseed treatment in July (F3,12 =

32
4.80, P = 0.0202, Fig. 6). The factorial ANOVA for July revealed it was that effect of
the seed treatment causing the difference (F1,16 = 7.41, P = 0.0151). The treatments
without native seeding always had the lowest number of native species and highest
number of introduced species (Fig.6).
Fig. 6 Mean numbers of native and introduced plants in 2010, field experiment. Letters indicate
significant differences within each month and within native (lowercase) and introduced
(uppercase) species (two-way ANOVA, Tukey)

33
3.2 Greenhouse Experiments
3.2.1 Greenhouse Main Experiment Results
Number of adult R. latipes in the greenhouse did not increase much over
the 2009 season, probably due to the large thermoregulation fans sucking weevils out
of the greenhouse, as noted earlier. The highest number recorded on a flat was ten, and
the average weevil number per flat over the season (combined weevil treatments) was
only 3.7 (20.5 weevils/m2). This is about half of that found in the field experiment,
which was 39 weevils/m2 over the season. When the cages were used in 2010 the
weevil populations were able to grow more successfully, peaking at 44 on a single flat
on one occasion. The mean number of R. latipes for the entire 2010 season (combined
weevil treatments) was 12.5 (69.5 weevils/m2), more than 3 times higher than in 2009.
Feeding damage was almost non-existent on no-weevil treatments due to
use of dinotefuron and cages. Mean rated damage for weevil-treated flats throughout
the 2009 season was 1.72 (on a 1-4 scale), while the following year it was 3.29 (on a
1-6 scale).
A repeated measures ANOVA showed the percentage cover of P.
perfoliata was significantly different among treatments for 22 June – 28 July, 2009
(F3,16 = 34.02, P < 0.0001, Fig. 7A ), but not for 21 June – 27 July, 2010 (F3,16 = 1.54,
P = 0.2424, Fig. 7B).

34
Fig. 7 Percent cover P. perfoliata in (A) 2009 and B (2010), University of Delaware greenhouse.
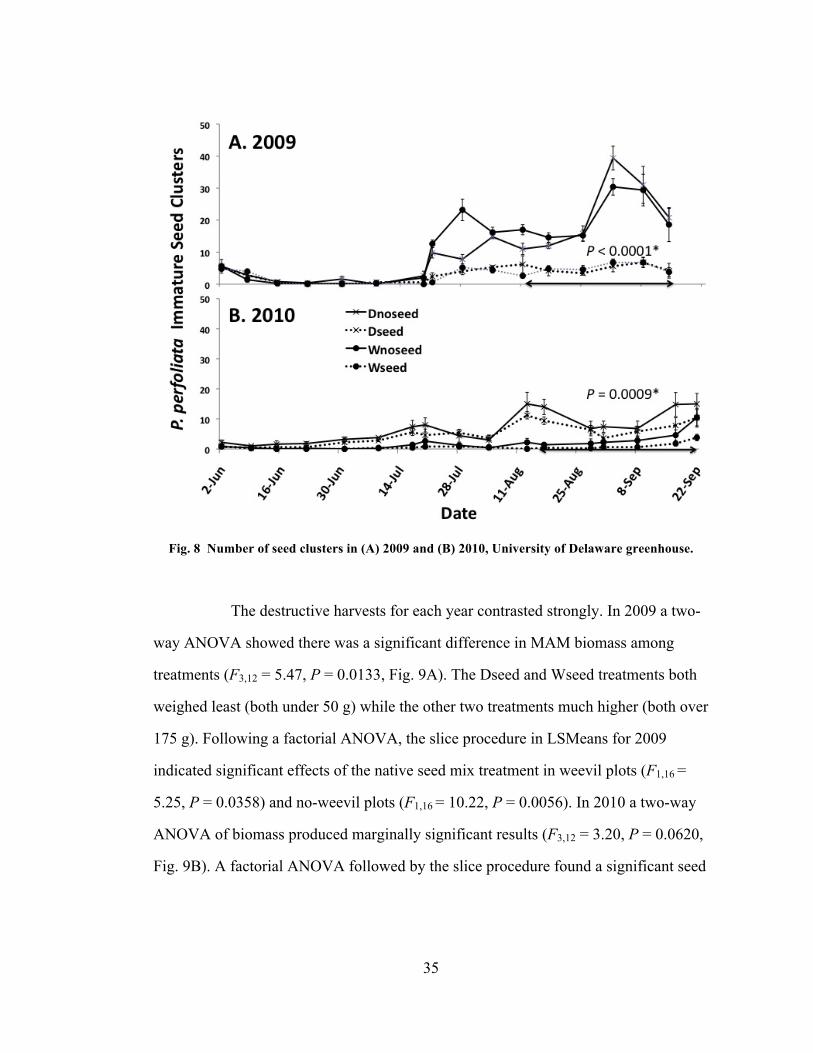
The number of immature P. perfoliata seed clusters was significantly
different among treatments in the repeated measures ANOVA for 11 August – 14
September, 2009 (F3,16 = 43.15, P < 0.0001, Fig. 8A) and 16 August – 21 September,
2010 (F3,16 = 9.14, P = 0.0009, Fig. 8B). Mature seed clusters were also significantly
different both years, 4 August – 8 September, 2009 (F3,16 = 21.82, P < 0.0001) and 16
August – 21 September, 2010 (F3,16 = 13.32, P = 0.0001).
35
Fig. 8 Number of seed clusters in (A) 2009 and (B) 2010, University of Delaware greenhouse.
The destructive harvests for each year contrasted strongly. In 2009 a two-
way ANOVA showed there was a significant difference in MAM biomass among
treatments (F3,12 = 5.47, P = 0.0133, Fig. 9A). The Dseed and Wseed treatments both
weighed least (both under 50 g) while the other two treatments much higher (both over
175 g). Following a factorial ANOVA, the slice procedure in LSMeans for 2009
indicated significant effects of the native seed mix treatment in weevil plots (F1,16 =
5.25, P = 0.0358) and no-weevil plots (F1,16 = 10.22, P = 0.0056). In 2010 a two-way
ANOVA of biomass produced marginally significant results (F3,12 = 3.20, P = 0.0620,
Fig. 9B). A factorial ANOVA followed by the slice procedure found a significant seed

36
effect in this data only when weevils were present (F1,16 = 6.98, P = 0.0177); thus in
2010 the native seed mix only reduced MAM biomass when in the presence of
weevils.
Fig. 9 P. perfoliata biomass in (A) 2009 and (B) 2010, University of Delaware greenhouse. Letters
indicate significant differences (two-way ANOVA, Tukey).
When native biomass was compared via two-way ANOVA, the grasses
had significantly greater mass only in 2009 (F1,4 = 80.21, P = 0.0009). In 2010 the
grasses once again had greater biomass, but not significantly so (F1,4 = 4.93, P =

37
0.0906). Total native biomass compared between Dseed and Wseed treatments was
not significantly different (F1,4 = 0.10, P = 0.7712).
3.2.2 Greenhouse Allelopathy Experiment Results
A two-way ANOVA revealed that natives grown alone had a significantly
greater biomass than those growing with MAM (F1,4 = 35.71, P = 0.0039, Fig. 10).
Their average mass was over twenty times greater than native plants grown with
MAM.
Fig. 10 Native plant biomass grown with and without MAM weed.

38
3.2.3 Greenhouse Disturbance Experiment Results
Undisturbed treatments containing established native plants had a significantly
lower MAM germination rate than disturbed ones (F1,24 = 19.47, P = 0.0002). The
undisturbed flats with established native plants had a mean MAM germination rate of
6.5 seedlings, compared to almost three times as many (18.7) in the disturbed flats.
The percent cover MAM in disturbed flats reached and maintained 100%, while
percent cover of MAM never went above 10% in the undisturbed treatments. By five
weeks into the experiment, all MAM in the undisturbed treatments had died.

39
Chapter 4
DISCUSSION
4.1 Field Experiment
Results from the field experiment showed some interesting variations from
year to year. The large increase in P. perfoliata seedlings from year one to year two is
of note (Table 2). It is plausible that planting plugs in April 2010 disturbed the MAM
seed bank. If this were the case though, there should be greater seedling emergence in
plug-treated plots only, which is not so (Table 2). Instead, we attribute such high
germination to the unusually warm, early spring of 2010. Germination is temperature-
sensitive in respect to stratification (Hough-Goldstein et al. 2008a), so it would not be
surprising if temperatures determined the proportion of the seed bank to germinate.
In 2009 coarse wood shavings were mixed with the native seed mix and
distributed on seed-treated plots. While a seeding/growth medium was needed for
optimal seed distribution and establishment (Dr. S. Barton, University of Delaware,
personal comm. 2008), it has been noted that woody detritus can cause carbon
enrichment of the soil that boosts soil microbe nitrogen uptake and growth (Redente et

40
al. 1992; Hunt et al. 1988). This can result in reduction of available inorganic nitrogen,
ultimately limiting some plant growth (Spielberger et al. 2009), especially annual seral
species (Morghan & Seastedt 1999) such as MAM. It has been suggested that such
species’ nutrient cycling is rapid and soil dynamics such as this should be considered
in restoration attempts (Kulmatiski et al. 2006). In retrospect, this experiment would
have been improved if a finer sawdust medium was used, and on all plots, in order to
control for any effects it may have had. As it is, we assume, based on other
experiments (Morghan & Seasdtedt 1999; Spielberger et al. 2009) that the comparably
small, one-time addition of wood shavings over two years made no major difference in
soil nutrient cycles or the results of our experiment.
Weevils were supplemented in early spring each year because immediate
heavy feeding pressure on seedlings results in altered seed phenology later on,
expressed as lowered seed production and quality (Hough-Goldstein et al. 2008b). A
spring release also allowed the supplemented weevils to reproduce to their full
capacity of three to four generations over the full season (Lake et al. 2011, in press).
Herbivore population growth, and consequently, foliar feeding damage, most
likely differed by year due to weather conditions, as has been found in other studies
(Bacher & Schwab 2000). Spring 2009 was unusually cool and rainy, limiting weevil
metabolism and hence reproduction capacity. In contrast, the 2010 season brought
early heat and later, severe drought, which appeared to favor weevil population
growth. Increased insect population growth and feeding pressure in warm
temperatures is supported by findings of Bacher & Schwab (2000) in augmentative

41
biocontrol work done with Cassida rubiginosa Müller (Coleoptera, Chrysomelidae]
(shield beetles). They found that this biocontrol agent had a significant impact on its
host, creeping thistle (Cirsium arvense [L.] Scop. [Asteraceae]), also known as Canada
thistle, but only in the hotter season, when insect metabolism was fastest. In addtition
to heat, P. perfoliata faced water shortages in 2010, combined with strong herbivory
pressure, which appeared to tax the extent of plant tolerance. This supported our
prediction and was consistent with the conclusions of Sun et al. (2010) after observing
lowered herbivore tolerance under water stress in Alternanthera sessilis (L.) R. Br. ex
DC. (sessile joyweed). Supplemental watering was applied to aid plant survival in
2010 only. The newly planted native plugs also struggled for survival that year, but the
more established seeded natives from 2009 showed good survival and a competitive
advantage. In the case of the seeded grasses this was probably due to established
fibrous root systems.
A dinotefuron drench was our selected means of insect control because of
its systemic nature and long-lived efficacy (two to three months). Dinotefuron ensured
minimal feeding on treated plants. Any stimulatory effects of this insecticide on plant
growth are unlikely, as two separate greenhouse experiments using dinotefuron in a
similar manner failed to show any impacts on growth of MAM or other plants (see end
of section 4.2.2 and Appendix A). If dinotefuron had an effect on plant growth it
would most likely be reflected in plant biomass. However, neither the MAM nor the
total native biomass comparisons between dinotefuron and non-dinotefuron treatments

42
in the greenhouse indicated that there was stimulatory growth effect of the insecticide
since there was no significant difference in biomass.
As the field season progressed it became evident that the insecticide used
to exclude weevils from the no-weevil plots may have been causing a population sink.
We concluded this because dead and dying weevils were found on dinotefuron-treated
MAM each visit. This was not surprising because these weevils are fairly mobile
(Lake et al. 2011, in press) and probably moved among plots to feed, including
herbicide-treated plots. To counteract the population sink, the 2010 summer
supplement of weevils occurred earlier than in 2009 and with more weevils.
In those plots where dinotefuron was applied all plants were affected,
hence becoming invulnerable to feeding by all insect species. Plants other than MAM
were given the opportunity to re-allocate resources away from herbivory defense and
instead to growth and reproduction. This enemy release may have caused MAM’s
plant neighbors to do better than they otherwise would have, competing unusually well
with the MAM. Even so, results show a highly significant greater MAM biomass in
plots free of weevils (Fig. 6). This suggests that P. perfoliata may be a vigorous
competitor even when the whole community lacks top-down regulation by insects.
Plants free of dinotefuron were vulnerable to insect feeding of many types.
Japanese beetles have been noted as sole primary herbivores on MAM since its
introduction (Moul 1948), but another study suggests that other species of generalist
herbivores have been known to feed on MAM (Wheeler & Mengel 1984), though it is
unlikely they cause strong effects on growth or spread (Mountain 1989). Indeed, it

43
appears that MAM is not capable of supporting native generalist Lepidoptera to much
extent when compared with their native hosts (Burghardt et al. 2010). As a result of
these considerations, we were concerned only about Japanese beetles and hung the
traps to reduce any source of herbivory on MAM weed besides that of R. latipes.
4.1.1 Field Experiment MAM Weed Response
Results indicate that the integration of weevils and native seeding
successfully reduced both percent cover (Fig. 2) and immature seed production (Fig.
3) of MAM weed significantly by two years post-treatment. Although mature seed
clusters were counted weekly, those data were not analyzed due to heavy deer browse
(Hough-Goldstein et al. 2008a; K. Cutting, personal observation, 2009). Birds and
rodents are also known as MAM seed dispersers (Mountain 1989; personal
observation, K. Fryberger), suggesting that mature seed counts may be a poor metric
of P. perfoliata reproduction.
The destructive harvest at Longwood supported the percent cover and seed
count data. Dry biomass of MAM from the Wseed treatment was significantly lower
than the plots that had no weevils (Fig. 4). When comparing between seeded
treatments we see that MAM from the Wseed treatment had half the weight of the
Wnoseed treatment (Fig. 4). The slice procedure showed that MAM was reduced in
plots with seed mix only when weevils were present. We conclude from this that

44
weevils are required to suppress the weed, hence opening a niche (Elton 1958), and
exposing the plant to normal competition from neighbors. This in turn could maximize
species richness, returning the community to a new stable state, but of a much higher
caliber than the original state (Hacker & Dethier 2009; Perry & Galatowitsch 2003).
4.1.2 Field Experiment Plant Community Response
Monthly plant species richness surveys allowed for a temporal perspective
on the community through the summer of 2010, a year after the various treatments
were applied. The Wseed treatment consistently hosted the greatest numbers of
species and it is interesting to note that once again, the seed treatment was the main
effect causing significance (Fig. 5). This result is not unlike that of Perry &
Galatowitsch (2003) who found that a mix of four perennial and annual native cover
crops suppressed growth of annual introduced species.
While species richness is important, the main concern is that those new
appearances are native plants (Burghardt et al. 2010). The most diverse treatment, the
Wseed treatment, did in fact host the greatest number of natives all season (Fig. 6).
This was due in part to the fact that this treatment included native species that were
planted. We suspect that additional native species observed were both released from
the seedbank and colonized from nearby. The high number of natives contrasted with
the low numbers of introduced species in this treatment. Comparing the Wseed and

45
Wnoseed treatments exemplifies what can happen if the biocontrol agent is used alone,
depending on what the present competition consists of. In our results, weevil-only
plots are comprised of 50% introduced species, with the lowest overall richness.
These data suggest that plots with weevils, but not seed, were prone to
higher introduced species invasion. It also confirms the hypothesis that the underlying
mechanism is weevil-mediated creation of disturbance, opening a niche, which when
not purposefully re-vegetated, can promote new invasion. In such instances species
richness may increase, but this metric does not necessarily indicate a diverse native
community. In our study, in the presence of weevils introduced plant species numbers
were negatively correlated with native seeding.
4.2 Greenhouse Experiments
The main greenhouse experiment bolstered data from the field by looking
at the same four factorial treatments in more controlled conditions. As with the field
sites, it facilitated observations of plant interactions between the MAM and native
seeds under R. latipes impact. The other greenhouse experiments addressed questions
regarding MAM growth in various circumstances and potential effects on plant
neighbors.

46
4.2.1 Greenhouse Main Experiment
Mature and immature seed cluster numbers in both years of greenhouse
research were significantly lowest in the Wseed treatment (immature seeds shown
only, Fig. 8). Although there was a marked difference in percent cover during 2009,
we see in 2010 that percent cover remained constant between treatments (Fig. 7). It
was only seed production that dropped, and only in association with weevils. It is not
too surprising that a biocontrol agent would alter seed production (Hough-Goldstein et
al. 2008b; Lonsdale & Farrell 1998), but our finding indicates that MAM weed
reproduction may be limited by biocontrol agents before vegetative growth is. This is
potentially contrasting with Mountain (1989), who notes that stress appears to trigger
seed production in P. perfoliata, something the authors have also observed. This
dynamic could be valuable to investigate further, as it points to a plastic response in
MAM reproductive strategy. Is it reduced growth of the vine or lowered seed set that
reduce the overall fitness and lower competition thresholds? Hyatt & Araki (2006)
propose that a 50% reduction of MAM plant survival and 60% reduction of seed
survival in the novel range may be necessary to keep MAM from spreading. They add
the caveat that the best life-stage to combat differs with demographic response to
control efforts and environmental changes. In the end, seed production itself may be
largely irrelevant, as MAM can be a prolific seed-producer (Moul 1948; Hough-
Goldstein et al. 2008b) depending on circumstances (Hyatt & Araki 2006). Other
studies agree with this notion, suggesting that ‘r’ selected introduced species would

47
have to undergo severe seed reduction to impact recruitment (Lonsdale & Farrell
1998). It is probable that many successfully germinated seeds undergo rigorous
intraspecific competition hence limiting the number of seeds reaching final
recruitment to adulthood.
Problems with greenhouse pests and extremely high temperatures
complicated year two of greenhouse work. This is evident in percent cover (Fig. 7) for
2010, which was a very hot year. The greenhouse thermoregulation system was
cooling at its maximal level many days but temperatures were still over 38⁰ C (100⁰
F), leading to even higher temperatures in the cages. The flats were kept on concrete
benches, often hot to the touch, and likely conducting heat into the flats and soil itself.
We surmise that these temperatures caused some mortality in the weevils, as they were
prevented from searching out a cooler haven to retreat to as they might in the field.
Dead weevils were found on occasion.
Pests probably played a role in reducing competition from the native
seeded plants. In the beginning of the season slugs impacted the black eyed susans,
despite attempts to reduce their populations through use of beer-bait dishes, which
attracted and drowned them. Later on white flies and mealy bugs infested plants and
we made attempts to prevent confounding of treatment effects by removing them.
Unlike the natives, MAM appeared to be unaffected by pest infestation. Unfortunately
it is likely these pests hampered native plant competitive ability, giving MAM the
advantage and negating this aspect of the 2010 experiment.

48
Further possible explanation of unexpected 2010 results centers around
delay in weevil application. This occurred ten days after native seeding because cages
were back ordered and arrived later than anticipated. This set-back may have caused
the MAM in the weevil-treated flats to get a better start than it would have, as it was
weevil-free for the first two weeks after germination, unlike in 2009. We believe that
this in combination with heat-induced weevil mortality and pest-suppressed native
competition explains the similarities in percent cover among treatments in 2010.
P. perfoliata biomass in year one of the greenhouse experiment was
remarkably low in the Dseed and Wseed treatments because of the native seed mix
(Fig. 9A). We probably would have seen a greater impact of the weevils in year one if
they had not been unintentionally and artificially removed by greenhouse fans. Most
likely they could have reduced the Wseed treatment to the lowest MAM biomass. In
year two (Fig. 9B) we did see the Wseed treatment hosting lowest MAM biomass, but
due to pests and temperatures, only with marginal significance. The slice procedure
for this year supports the concept that native seeding may only be beneficial when a
biocontrol agent first suppresses the target plant. Other studies have found that
removal of the problematic vegetation is critical to successful establishment of planted
species (Barton et al. 2009).
When comparing biomass of grasses and forbs grown in these flats with
MAM we see that grasses may be the most competitive. This is not surprising, given
the aggressive nature and robust sod masses of the selected grass species. The small
experimental flats used here heightened competition for soil nutrients and water, a

49
disadvantage to the small, short MAM roots. We must also keep in mind that the
grasses comprised 60% of the seed mix, giving them a greater chance of higher
biomass.
In conclusion, the greenhouse biomass results suggest that use of
biocontrol agents to weaken MAM can promote native plant competition, especially
under severe resource limitations. This can ultimately lead to a significant reduction in
MAM growth and reproduction, and increased native plant growth.
4.2.2 Greenhouse Allelopathy Experiment
Based on our preliminary investigations, it is apparent that MAM may be
allelopathic. We observed severe growth retardation in native plants grown with
MAM when compared to those grown alone (Fig. 10). These results are similar to
those found by studies of other invasive introduced species (Grant et al. 2003; Kato-
Noguchi et al. 2010; Wixted & McGraw 2010) and warrant further investigation. A
future step in this direction may be to test the effect of P. perfoliata root exudates on
one of the native species used in this study, with the plants spatially separate (see
Saxena 2000). This could help verify allelopathy and eliminate the possibility of
spatial or nutrient competition as causation. Kulmatiski et al. (2006) suggest that some
introduced plants may boost growth through relationships with beneficial fungi. The
idea that either allelopathy (Perry & Galatowitsch 2003) or mycorrhizae (Schwartz et

50
al. 2006) play roles in introduced plant interactions is nothing new. Regardless of the
exact mechanisms, happenings underground may be an important element to address
in restoration after introduced species invasions (Heneghan et al. 2008), such as those
of MAM weed.
4.2.3 Greenhouse Disturbance Experiment
It is already known that disturbance promotes invasion (Harper 1965;
Mack 1989). This experiment verifies that the habitats where we find MAM operate as
other systems do in regard to this dynamic. Our data emphasize the need to reduce
disturbance in wildland areas where MAM weed could gain a foothold. If disturbance
is unavoidable, prompt re-vegetation with native plants to reduce the opened niche is
paramount (Tilman 1999; Lonsdale & Farrell 1998).
4.3 Conclusion
Results from the Longwood Gardens field experiment support the
approach of integrated management as a successful strategy for combating introduced
plant invasion while restoring native flora. This conclusion is in agreement with
previous work done with similar designs and objectives (Lym 2005; Benz et al. 1999;

51
Davies et al. 2005; Simmons 2005; McEvoy 1993). Use of a biocontrol agent
suppressed the target plant while native seeding promoted plant competition and
significantly increased native plant species richness. The same methods may not work
identically in all habitats or with other introduced plant species invasions (Hilderbrand
et al. 2005). Further research is needed to understand the complexities of restoration in
a variety of systems. There is hope for the future of invaded areas as the discipline of
restoration ecology grows, aimed at re-interpreting the human footprint on nature.

52
Appendix A
NEONICOTINOID INSECTICIDE PILOT STUDY
A.1 Introduction
A greenhouse study was conducted to determine effects of two insecticides
on the weevils Rhinoncomimus latipes Korotyaev (Coleoptera: Curculionidae) and on
their host plant mile-a-minute (Persicaria perfoliata (L.) H. Gross). The focus of the
study was two-fold: first, two neonicotinoid insecticides were applied to determine
which was more effective in eliminating weevil populations on mile-a-minute (MAM).
Second, the study provided an opportunity to observe whether the insecticides
promote plant growth in MAM. Growth stimulated by the insecticide could lead to
incorrect conclusions about weevil versus no-weevil impact.
Imidaclopird, one of the neonicotinoid systematic insecticides tested, is
produced by Bayer Crop Science, known also by the marketing names Gaucho,
Admire, and Condifor. The second neonicotinoid was dinotefuron (also known by
marketing names of Venom and Safari), and is a more recent product of Valent
Biosciences Corporation. Both insecticides are systematic in nature and were applied
as a drench to potted plants in the greenhouse. Imidacloprid is believed to have growth

53
enhancing properties aside from its intended insecticidal purpose (Dr. Casey Sclar,
Longwood Gardens, personal comm. 2008; Hundley 2004; Dr. Brian Kunkel,
University of Delaware, personal comm. 2008). There is less industry experience with
dinotefuron due to its recent appearance on the market, but it may produce the same
growth inducing effect as imidacloprid since it is chemically similar. An advantage of
dinotefuren over imidacloprid is the speed of uptake due to its high solubility (Ali &
Caldwell 2010). Quick uptake is necessary to prevent weevils from impacting plots
early in the season.
A.2 Materials and Methods
Potted MAM plants and weevils were provided by the Phillip Alampi
Beneficial Insects Laboratory (PABIL), Trenton, NJ. The treatments were applied in a
fully factorial design, combining weevils, no weevils, dinotefuron, no dinoteuron, and
imidacloprid, no imidacloprid.
The objectives of this study were to observe how quickly and thoroughly the
insecticides eliminated weevils, and what growth response occurred in the plants.
There were three replicates of each treatment, eighteen pots used in total. The plants
were started as cuttings the week of September 14th, 2008 at PABIL and were grown
there until they were picked up for the study on November 12th, 2008.

54
A weevil density of 5 mating pairs per plant was suggested (Amy Diercks,
PABIL, personal comm. 2008). This number of weevils allowed the effects of the
insecticides to show before the weevils could decimate the weevil-only treatments. All
weevils were collected from PABIL between November 4th, 2008 – November 7th,
2008 (hence they emerged between November 1st – November 7th). The weevils were
immediately introduced to the plants in the University of Delaware greenhouse, where
they were allowed to acclimate for a period of 5 days before application of
insecticides. The light and temperature conditions were controlled so the weevils were
actively feeding and reproducing throughout the experiment. Light was set to a 16
hours light, 8 dark, and the temperature varied between 75°-80°F. The potted plants
were grouped by replicate on three separate tables in the same room. Each plant was
held in a clear ventilated plastic box
The plants were checked every other day to ascertain water needs and to
visually monitor weevil numbers for insecticide-induced mortality. After one month
(11/17/08 – 12/19/08) all replicates were destructively sampled to count dead and
living weevils and rated on feeding damage. The plants were cut at the base and dried
at room temperature in paper bags for 10 days to compare any differences in dry
matter biomass.

55
A.3 Results
Dinotefuron caused 100% weevil mortality in a short time period, whereas
imidacloprid had one weevil remaining unaffected at the end of the trial and generally
took longer to cause mortality . Dinotefuron eliminated weevil populations almost a
week before imidacloprid did. In addition, while imidacloprid caused lethargy and
prolonged death, dinotefuron acted faster once taken up by the weevils.
Table 3 Mean plant weights and standard errors for each treatment.
There was no apparent growth enhancement of the insecticides. No significant
difference in plant biomass was found by block (F2,17 = 0.08, P = 0.922) or treatment
(F5,17 = 0.70, P = 0.6359, Table 1). There was no significant difference between
treatments without weevils (F2,17 = 0.33, P = 0.737).
There was no significant difference in weevil mortality by block (F2,17 = 0.95,
P = 0.418) but there was between treatments (F5,17 = 10.83, P = 0.0009).

56
These results indicate that dinotefuron does not alter plant growth. In addition,
it eliminated weevil populations faster and completely when compared to
imidacloprid.

57
REFERENCES
Ali, A.D. and D. Caldwell. 2010. Royal palm bug Xylastodoris luteolus (Heliptera: Thaumastocoridae) control with soil applied systemics. Florida Entomologist 93:294-297. Bacher, S. and F. Schwab. 2000. Effect of herbivore density, timing of attack and plant community on performance of creeping thistle Cirsium arvense (L.) Scop. (Asteraceae). Biocontrol Science and Technology 10:343-352. Benz, L.J., K.G. Beck, T.D. Whitson and D.W. Koch. 1999. Reclaiming Russian knapweed infested rangeland. Journal of Range Management 52:351-356. Burghardt, K.T., D.W. Tallamy and W.G. Shriver. 2009. Impact of native plants on bird and butterfly biodiversity in suburban landscapes. Blackwell Publishing Inc 23:219-224. Burghardt, K.T., D.W. Tallamy, C. Philips and K.J. Shropshire. 2010. Non-native plants reduce abundance, richness, and host specialization in Lepidopteran communities. Ecosphere 1:5-11. Burton, C.M., P.J. Burton, R. Hebda and N.J. Turner. 2006. Determining the optimal sowing density for a mixture of native plants used to revegetate degraded ecosystems. Restoration Ecology 14:379-390. Butler, J.L. and S.D. Wacker. 2010. Lack of native vegetation recovery following biological control of leafy spurge. Rangeland Ecology and Management 63:553-563. Callaway, R.M. 2002. The detection of neighbors by plants. Trends in Ecology and Evolution. 17:104-105. Center, T. D., T. K. Van, F. A. Dray Jr., S. J. Franks, M. T. Rebelo, P. D. Pratt, and M. B. Rayamajhi. 2005. Herbivory alters competitive interactions between two invasive aquatic plants. Biological Control 33:173-185. Colpetzer, K., W. Fu, J. Ding, and J. Hough-Goldstein. 2004a. Host specificity of the Asian weevil, Rhinoncomimus latipes Korotyaev (Coleoptera: Curculionidae), a potential biological conrol agent of mile-a-minute weed, Polygonum perfoliatum L. (Polygonales: Polygonaceae). Biological Control 30:511-522. Colpetzer, K., J. Hough-Goldstein, K. R. Harkins, and M. T. Smith. 2004b. Feeding and oviposition behavior of Rhinoncomimus latipes Korotyaev (Coleoptera: Curculionidae) and its predicted effectiveness as a biological control agent for Polygonum Perfoliatum L.(Polygonales: Polygonaceae). Environmental Entomology 33:990-996. Costanza, R., R. d’Arge, R. de Groot, S. Farber, and M. Grasso, et al. 1997. The value of the world’s ecosystem services and natural capital. Nature 387:253–60.

58
Davies, J. T., J. E. Ireson, and G. R. Allen. 2005. The impact of gorse thrips, ryegrass competition, and simulated grazing on gorse seedling performance in a controlled environment. Biological Control 32:280-286. Ding, J., W. Fu, R. Reardon, Y. Wu, & G. Zhanga. 2004. Exploratory survey in china for potential insect biocontrol agents of mile-a-minute weed, Polygonum perfoliatum L., in eastern USA. Biological Control 30:487-495. Dodson, E. K., and C. E. Fiedler. 2006. Impacts of restoration treatments on alien plant invasion in Pinus ponderosa forests, Montana, USA. Journal of Applied Ecology 43:887-897. Duffy, J. E. 2009. Why biodiversity is important to the functioning of real-world ecosystems. Frontiers in Ecology and the Environment 7:437-444. Elton, C. S. 1958. The ecology of invasions by animals and plants. Methuen, London, United Kingdom. Frye, M. J., E. C. Lake, and J. Hough-Goldstein. 2010. Field host-specificity of the mile-a-minute weevil, Rhinoncomimus latipes Korotyaev (Coleoptera: Curculionidae). Biological Control 55:234-240. Gersani, M., J. S. Brown, E. E. O'Brien, G. M. Maina, and Z. Abramsky. 2001. Tragedy of the commons as a result of root competition. Journal of Ecology 89:660-669. Gordon, D. R. 1998. Effects of invasive, non-indigenous plant species on ecosystem processes: Lessons from Florida. Ecological Applications 8:975-989. Grant, D. W., D. P. C. Peters, G. K. Beck, and H. D. Fraleigh. 2003. Influence of an exotic species, Acroptilon repens (L.) DC. on seedling emergence and growth of native grasses. Plant Ecology 166:157-166. Gooden, B., K. French, and P. J. Turner. 2009. Invasion and management of a woody plant, Lantana camara L., alters vegetation diversity within wet sclerophyll forest in southeastern Australia. Forest Ecology and Management 257:960-967. Hacker, S. D. and M. N. Dethier. 2009. Differing consequences of removing ecosystem-modifying invaders: significance of impact and community context to restoration potential. Invited chapter for: G. Rilov and J.A. Crooks, eds. Biological Invasions in Marine Ecosystems. Ecological Studies 204, Springer- Verlag, Berlin. Harper, J. L. 1965. Establishment, aggression and cohabitation. Pages 243-265 in H.G. Baker and G. L. Stebbins, editors. The genetics of colonizing species. Academic Press, New York, United States. Hawkes, C. V., and Jon J. Sullivan. 2001. The impact of herbivory on plants in different resource conditions: A meta-analysis. Ecology 82:2045-2058. Heneghan, L., S. P. Miller, S. Baer, M. A. Callaham, J. Montgomery, M. Pavao- Zuckerman, C. C. Rhoades, and S. Richardson. 2008. Integrating soil ecological knowledge into restoration management. Restoration Ecology 16:608-617.

59
Hilderbrand, R. H., A. C. Watts, and A. M. Randle. 2005. The myths of restoration ecology. Ecology and Society 10:19. [online] URL: http://www.ecologyandsociety.org/vol10/iss1/art19/ Hough-Goldstein, J., E. Lake, R. Reardon, and Y. Wu. 2008a. Biology and biological control of mile-a-minute weed. USDA Forest Service, FHTET-2008-10. Hough-Goldstein, J., M. Schiff, E. Lake, and B. Butterworth. 2008. Impact of the biological control agent Rhinoncomimus latipes (Coleoptera: Curculionidae) on mile-a-minute weed, Persicaria perfoliata, in field cages. Biological Control 46:417-423. Hufford, K. M., and S. J. Mazer. 2003. Plant ecotypes: Genetic differentiation in the age of ecological restoration. Trends in Ecology & Evolution 18:147-155. Hundley, L. N. 2004. Physiological assessment of foliar imidacloprid treatments on cotton. Master's Thesis, Texas A&M University. Hunt, H. W., E. R. Ingham, D. C. Coleman, E. T. Elliott, and C. P. P. Reid. 1988. Nitrogen limitation of production and decomposition in prairie, mountain meadow, and pine forest. Ecology 69:1009-1016. Hyatt, L., and S. Araki. 2006. Comparative population dynamics of an invading species in its native and novel ranges. Biological Invasions 8:261-275. Ives, A. R., and S. R. Carpenter. 2007. Stability and diversity of ecosystems. Science 317:58-62. Jones, C. G., J. H. Lawton, and M. Shachak. 1997. Positive and negative effects of organisms as physical ecosystem engineers. Ecology 78:1946-1957. Kato-Noguchi, H., T. Ino, and H. Kujime. 2010. The relation between growth inhibition and secretion level of momilactone B from rice root. Journal of Plant Interactions 5:87-90. Kulmatiski, A., K. H. Beard, and J. M. Stark. 2006. Soil history as a primary control on plant invasion in abandoned agricultural fields. Journal of Applied Ecology 43:868-876. Kumar, V., and A. Ditommaso. 2005. Mile-a-minute (Polygonum perfoliatum): An increasingly problematic invasive species. Weed Technology 19:1071-1077. Lake E. C., J. Hough-Goldstein, K. J. Shropshire, and V. D’Amico. 2011. Establishment and dispersal of the biological control weevil Rhinoncomimus latipes on mile-a-minute weed, Persicaria perfoliata (polygonaceae). Bioloical Control (in press). Lewinton, R. C. 1969. The meaning of stability. Pages 13-24 in Diversity and stability in ecological systems. Brookhaven Symposia in Biology No. 22. Brookhaven National Laboratories, New York, United States. Littell, R. C., W. W. Stroup, and R. J. Freund. 2002. SAS® for linear models, 4th edition. SAS Institute, Inc., Cary North Carolina, United States. Lonsdale, W. M., and G. S. Farrell. 1998. Testing the effects on Mimosa pigra of a biological control agent Neurostrota gunniella (Lepidoptera: Gracillaridae), plant competition and fungi under field conditions. Biocontrol Science and Technology 8:485.

60
Lym, R. G. 2005. Integration of biological control agents with other weed management technologies: Successes from the leafy spurge (Euphorbia esula) IPM program. Biological Control 35:366-375. Mack, R. N. 1989. Temperate grasslands vulnerable to plant invasion: characteristics and consequences. Pages 155-179 in J.A. Drake, H. A. Mooney, F. di Castri, R. H. Groves, F. J. Kruger, M. Rejmanek, and M Williamson, editors. Biological invasions: a global perspective. Wiley, Chichester, United Kingdom. Mack, R. N., D. Simberloff, W. M. Lonsdale, H. Evans, M. Clout, and F. A. Bazzaz. 2000. Biotic invasions: Causes, epidemiology, global consequences, and control. Ecological Applications 10:689-710. McCormick, L. H., and N. L. Hartwig. 1995. Control of the noxious weed mile-a- minute (Polygonum perfoliatum) in reforestation. Northern Journal of Applied Forestry 12:127-132. McEvoy, P. B., N. T. Rudd, C. S. Cox, and M. Huso. 1993. Disturbance, competition, and herbivory effects on ragwort Senecio jacobaea populations. Ecological Monographs 63:55-75. McEvoy, P. B. and E. M. Coombs. 2000. Why things bite back: unintended consequences of biological weed control. Pages 167-194 in Follett, P. A. and J. J. Duan, editors. Nontarget effects of biological control. Kluwer Academic Publishers, Norwell, Massachusetts, United States. Morghan, K. J. R., and T. R. Seastedt. 1999. Effects of soil nitrogen reduction on nonnative plants in restored grasslands. Restoration Ecology 7:51-55. Morrison, J. A. 2002. Wetland vegetation before and after experimental purple loosestrife removal. Wetlands 22:450-457 Mountain, W. L. 1989. Mile-a-minute (Polygonum perfoliatum L.) update – distribution, biology, and control suggestions. Regulatory Horticulture 15:21- 24. Murphy, G. P., and S. A. Dudley. 2007. Above- and below-ground competition cues elicit independent responses. Journal of Ecology 95:261-272. Perry, L. G. and S. M. Galatowitsch. 2003. A test of two annual cover crops for controlling Phalaris arundinacea invasion in restored sedge meadow wetlands. Restoration Ecology 11:297-307. Redente, E. F., J. E. Friedlander, and T. McLendon. 1992. Response of early and late semiarid seral species to nitrogen and phosphorus gradients. Plant and Soil 140:127-135. Reeder, T. G., and S. D. Hacker. 2004. Factors contributing to the removal of a marine grass invader (Spartina anglica) and subsequent potential for habitat restoration. Estuaries 27:244-252. Saxena, M. K. 2000. Aqueous leachate of Lantana camara kills water hyacinth. Journal of Chemical Ecology 26:2435-2447. Schaefer, V. 2009. Alien invasions, ecological restoration in cities and the loss of ecological memory. Restoration Ecology 17:171-176.

61
Schwartz, M. W., J. D. Hoeksema, C. A. Gehring, N. C. Johnson, J. N. Klironomos, L. K. Abbott, and A. Pringle. 2006. The promise and the potential consequences of the global transport of mycorrhizal fungal inoculum. Ecology Letters 9:501-515. Simberloff, D. and B. Von Holle. 1999. Positive interactions of nonindigenous species: invasional meltdown? Biological Invasions 1:12-32. Simberloff, D. 2006. Invasional meltdown 6 years later: important phenomenon, unfortunate metaphor, or both? Ecology Letters 9:912-919. Simmons, M. T. 2005. Bullying the bullies: The selective control of an exotic, invasive annual (Rapistrum rugosum) by oversowing with a competitive native species (Gaillardia pulchella). Restoration Ecology 13:609-615. Snedecor G. W. and W. G. Cochran. 1980. Statistical methods, 7th edition. Iowa State University Press, Ames, United States. Spiegelberger, T., H. Müller-Schärer, D. Matthies, and U. Schaffner. 2009. Sawdust addition reduces the productivity of nitrogen-enriched mountain grasslands. Restoration Ecology 17:865-872. Stephens, A. E. A., P. G. Krannitz, and J. H. Myers. 2009. Plant community changes after the reduction of an invasive rangeland weed, diffuse knapweed, Centaurea diffusa. Biological Control 51:140-146. Sun, Y., J. Ding, and M. J. Frye. 2010. Effects of resource availability on tolerance of herbivory in the invasive Alternanthera philoxeroides and the native Alternanthera sessilis. Weed Research 50:527-536. Tallamy, D. W. 2004. Do alien plants reduce insect biomass? Conservation Biology 18:1689-1692. Thomas, M. B., and A. M. Reid. 2007. Are exotic natural enemies an effective way of controlling invasive plants? Trends in Ecology & Evolution 22:447-453. Tilman, D. 1999. The ecological consequences of changes in biodiversity: A search for general principles. Ecology 80:1455-1474. Wheeler, A. G. and S. A. Mengel. 1984. Phytophagous insect fauna of Polygonum perfoliatum, an Asiatic weed recently introduced to Pennsylvania. Annals of the Entomological Society of America 77:197-202. Williamson, M. 1996. Biological Invasives. Chapman & Hall, London, United Kingdom. Willis, K. J., and H. J. B. Birks. 2006. What is natural? The need for a long-term perspective in biodiversity conservation. Science 314:1261-1265. Wixted, K. L., and J. B. McGraw. 2010. Competitive and allelopathic effects of garlic mustard (Alliaria petiolata) on american ginseng (Panax quinquefolius). Plant Ecology 208:347-357. Wu, Y., R. C. Reardon and J. Ding. 2002. Mile-a-minute weed. In Van Driesche, R., S. Lyon, B. Blossey, M. Hoddle, R. Reardon, editors. Biological control of invasive plants in the eastern United States. USDA Forest Service, FHTET- 2002-04.

62
Zedler, J. B. 2000. Progress in wetland restoration ecology. Trends in Ecology and Evolution 15:402-407.