perseo: personal radiation shielding for interplanetary ... study report/act-rpt-bio-ari-14... ·...
TRANSCRIPT
PERSEO: PErsonal Radiation Shielding for
intErplanetary missiOns
Final Report Authors: Marco Vuolo1,2 ,Giorgio Baiocco1, Martina Giraudo2, Cesare Lobascio2, Tom Gheysens3, Andrea Ottolenghi1 Affiliation: 1. Department of Physics, University of Pavia, Pavia, Italy 2. Thales Alenia Space, Torino, Italy 3. ACT - ESA Date: 29 July 2015 ACT research category: Biomimetics Contacts: Giorgio Baiocco Andrea Ottolenghi Tel: +39 0382 987948 Tel: +39 0382 987982 e-mail: [email protected] e-mail: [email protected] Leopold Summerer (Technical Officer) Tel: +31(0)715654192 Fax: +31(0)715658018 e-mail: [email protected]
Available on the ACT website http://www.esa.int/act
Ariadna ID: 14-920X Ariadna study type: Standard study
Contract Number: 4000111396/14/NL/MV
PERSEO:PErsonal Radiation Shielding for intErplanetary missiOns - Final Report Page : 2/66
PERSEO:PErsonal Radiation Shielding for intErplanetary missiOns - Final Report Page : 3/66
TABLE OF CONTENTS
1. ACRONYM LIST................................................................................................................... 4
2. ABSTRACT .......................................................................................................................... 5
3. THE PERSEO PROJECT ..................................................................................................... 5
3.1 Radiation Space Environment ................................................................................................................. 5
3.2 Solar Particle Events biological damage ................................................................................................ 6
3.3 Passive shielding strategies .................................................................................................................... 6
3.4 Innovation proposed by PERSEO............................................................................................................ 7
4. SOLAR PARTICLE EVENT MODEL CHOICE ..................................................................... 9
4.1 Solar protons energy distribution ........................................................................................................... 9 4.1.1 Solar protons models .............................................................................................................................. 9 4.1.2 Model choice ......................................................................................................................................... 10
5. SIMULATION FRAMEWORK ............................................................................................ 11
6. 1D SIMULATIONS.............................................................................................................. 11
6.1 Geometric models and detectors .......................................................................................................... 11 6.1.1 Detector choice and analysis modules in GRAS/Geant4 ..................................................................... 12
6.2 Materials simulated and Material index ranking .................................................................................. 13
6.3 SIMULATION summary ........................................................................................................................... 15
6.4 Results and comments ........................................................................................................................... 17 6.4.1 Intra Vehicular Activities simulation results ........................................................................................... 17 6.4.2 Comparison of results from different Physics List ................................................................................. 25 6.4.3 GRAS results vs PHITS results ............................................................................................................ 27 6.4.4 Extra Vehicular Activities simulation results ......................................................................................... 27 6.4.5 Materials Ranking ................................................................................................................................. 32
6.5 Conclusions of 1D simulations .............................................................................................................. 33
7. 3D SIMULATIONS.............................................................................................................. 34
7.1 Phantom choice and validation ............................................................................................................. 34
7.2 3D Simulation procedure ........................................................................................................................ 36
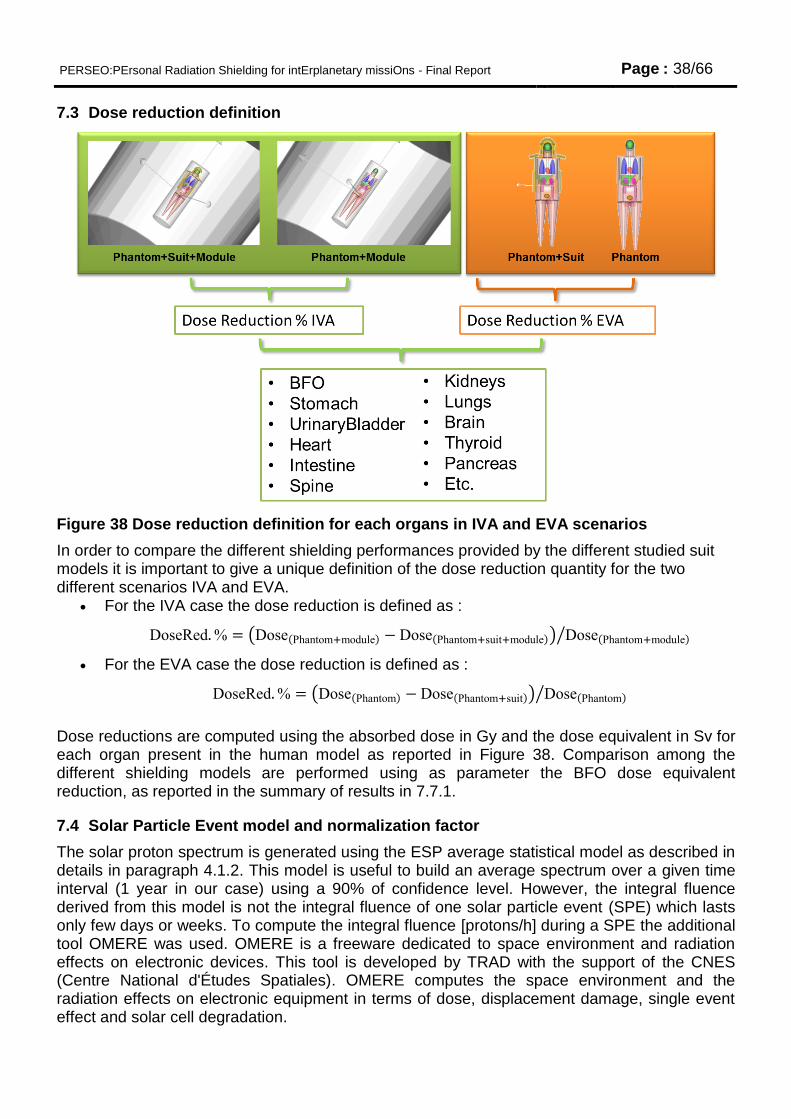
7.3 Dose reduction definition ....................................................................................................................... 38
7.4 Solar Particle Event model and normalization factor .......................................................................... 38
7.5 3D Suit Models ......................................................................................................................................... 39
7.6 Simulations summary ............................................................................................................................. 42
PERSEO:PErsonal Radiation Shielding for intErplanetary missiOns - Final Report Page : 4/66
7.7 Results of the 3D simulations ................................................................................................................ 43
7.7.1 Results Summary and discussion ......................................................................................................... 60
8. “SAFE HOURS” IN SPACE ............................................................................................... 61
9. LEUKEMIA RISK REDUCTION ...................................................................................... 63
10. CONCLUSIONS AND RECOMMENDATIONS ............................................................... 65 REFERENCES………………………..…………………………...……………………………………66
1. ACRONYM LIST
BFO Blood Forming Organs CFRP Carbon Fiber Reinforced Plastic GCR Galactic Cosmic Ray GRAS Geant4 Radiation Analysis for Space HDPE High Density Polyethylene EML1 Earth–Moon L1 EML2 Earth–Moon L2 ERR Excess Relative Risk EVA Extra Vehicular Activity ISS International Space Station IVA Intra Vehicular Activity MC Monte Carlo MDPS Micrometeoroid and debris protection system MLI Multilayer Insulation System NEA Near Earth Asteroid PERSEO PErsonal Radiation Shielding for intErplanetary missiOns PRPS Personal Radiation Protection System SPE Solar Particle Events TAS-I Thales Alenia Space Italia
PERSEO:PErsonal Radiation Shielding for intErplanetary missiOns - Final Report Page : 5/66
2. ABSTRACT
Currently passive space radiation shielding approaches represent the only available technology to permit human exploration deep-space missions. The PERSEO project (PErsonal Radiation Shielding for intErplanetary missiOns) aims at studying a wearable innovative radiation protection system to mitigate the effects of Solar Particle Events (SPE) on astronauts. SPE can be considered as related mainly to deterministic effects of the cosmic radiation, with hazards to man arising for physical doses above 2 Gy, when symptoms of the hematopoietic syndrome appear. In view of future space exploration missions, an increasing duration and level of complexity will be required for Extra Vehicular Activities (EVAs), as in the case of the construction of a permanent outpost on the lunar surface: the occurrence of a SPE in such scenario might not leave enough time for the astronaut to reach a safe shelter, and existing suits do not offer sufficient protection to prevent radiation sickness. Furthermore, even if the shelter can be reached quickly enough, damages and failures of fundamental components of the spacecraft, possibly due to the SPE themselves, might require a direct interventions of the astronauts. Concerning Intra Vehicular Activities (IVA), an adaptable shielding level of the newly conceived suit could make it comfortable enough to be worn on board most of the time while carrying on ordinary activities. An adaptable and selective shielding strategy is required, focusing on the most radiosensitive areas, for meeting the requirements of shielding both in EVA and IVA situations. The goal of the PERSEO project is to demonstrate the validity of this approach and drive the evolution of future spacesuits. To this aim, traditional and innovative materials were reviewed and Monte Carlo simulations were performed using a realistic SPE radiation environment and both a slab geometry and a 3D human phantom placed in an “inside the spacecraft” situation. Different shielding strategies were considered including the use of multilayers with a high density material in the external region (arranged in bars, plaques, fibers, etc.) and a flexible material in the region close to the human body. As it could be concluded with the support from Thales Alenia Space Italia, an inflatable structure might fit very well the desired requirements in terms of shielding, using polymeric material pockets filled with water or organic gels from spacecraft waste. These are the most readily available materials on a spacecraft and they could be easily used to fill the inflatable suit and then reintroduced in the module hydraulic system. The PERSEO project is funded by the European Space Agency (ESA Contract No 4000111396/14/NL/MV).
3. THE PERSEO PROJECT
3.1 Radiation Space Environment
Protecting astronauts from space radiation in one of the main critical issue in space exploration. Currently passive shielding approaches represent the only available technology to permit human exploration deep-space missions. Shielding size and features must be necessarily related to the mission profile which determines the radiation environment surrounding the vehicle and hence impacting on the astronauts. When considering human radiation protection two main components of the interplanetary radiation environment can be identified: Solar Particle Events (SPEs)and Galactic Cosmic Rays (GCRs).
• SPEs originate from high-energy solar phenomena and are capable to increase
significantly the absorbed dose by astronauts during an interplanetary mission producing,
in extreme cases, a lethal dose and acute radiation effects to the crew.
• GCRs are background radiations consisting in high energy heavy ions. The exposure to
such radiation environment does not endanger immediately the astronaut's life but it
PERSEO:PErsonal Radiation Shielding for intErplanetary missiOns - Final Report Page : 6/66
increases the probability of contracting cancer and it may have effects on the central
nervous system and on the cardiovascular system.
3.2 Solar Particle Events biological damage
SPEs can be considered as only related to deterministic effects of the cosmic radiation and not to the stochastic ones. In particular, hazards to man arise when the levels of physical dose are equal to 2Gy, above which symptoms of hematopoietic syndrome appear due to the killing of hematopoietic system cells located in the bone marrow. The physiological consequences are nausea, vomiting, general malaise, fatigue and hair loss. Death can occur within one or two months after exposure. If the individual survives to the physiological symptoms due to the radiation acute exposure, there is a possibility for the bone marrow to regenerate spontaneously. At doses higher than 6 Gy, the destruction of the hematopoietic system is complete, and death follows. SPEs are probabilistic events and an interplanetary space habitat will be required to mitigate this radiation environment offering a protected area where the astronauts can take shelter, or providing a shield that protects the entire habitat; although the first solution is promising because of the reduction of the mass, it is not always feasible. The size of the habitat affects this choice and, in case of very limited volumes, shielding of the entire habitat may be the only solution. Moreover astronauts involved in extra-vehicular activity should have time to take refuge in a safe place (shelter) without absorbing a compromising dose of radiation.
3.3 Passive shielding strategies
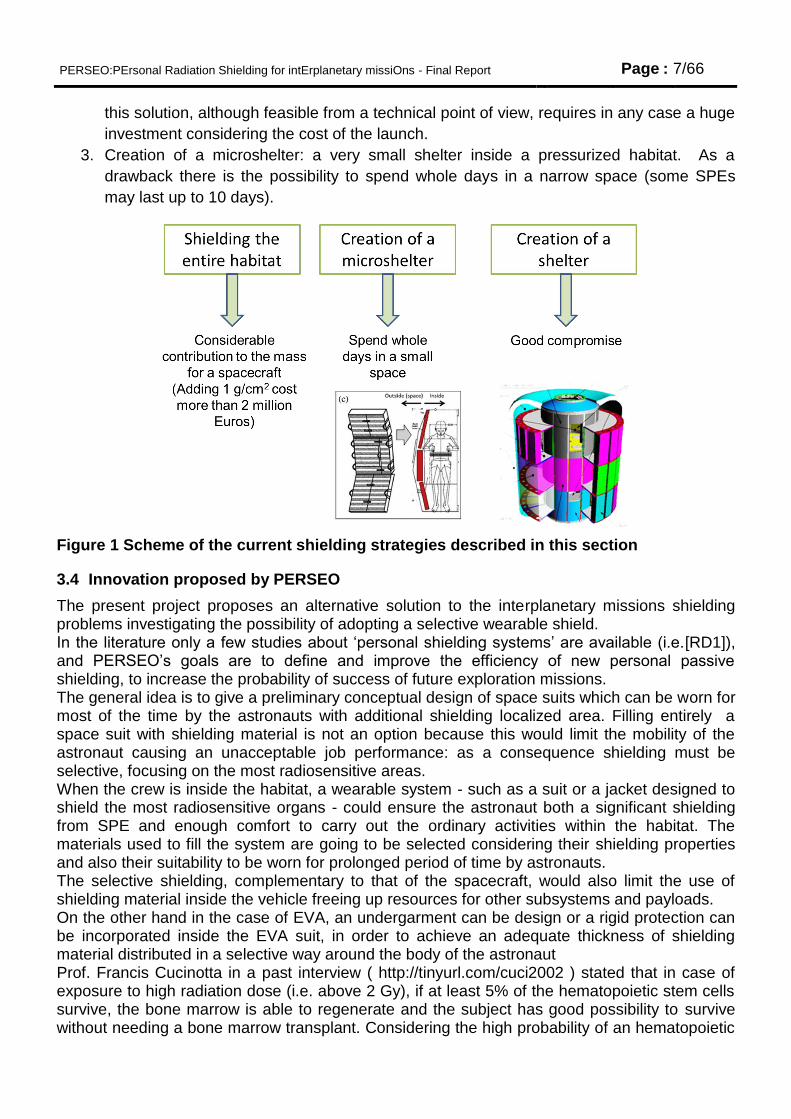
Long duration missions will expose the astronauts to a radiation environment which is not mitigated by the Earth's magnetic field, worsening the effects. Therefore future space infrastructure and transport vehicles will - not only - have to provide adequate shielding against sporadic and intense solar events (SPE - Solar Particle Event) but also to mitigate the effects of the uninterrupted flow of Galactic Cosmic Rays (GCR - Galactic Cosmic Ray) during missions of long duration. When considering future shielding strategies, one has to take into account that the first inhabited structures that will be designed will have stringent mass and volume limits imposed by current or future (today in the design phase) launchers. In first instance we can take advantage of the design competence related to the modules of the International Space Station (ISS), already designed to reduce the development costs for future space crafts. In addition, when considering surface missions, the astronauts needs to be protected from SPE which could happen during Extra Vehicular Activity (EVA) and their EVA suits should give them the time to reach a safe shelter before their absorbed dose of radiation reaches dangerous values. In this perspective various actual shielding strategies may be taken into consideration for a space habitat (see Figure 1):
1. Distributing the masses within the habitat in order to create a safe area (shelter) where
the astronauts can spend a great part of their time (e.g. crew quarter):this could be not
applicable because of the narrowness of the volumes (4 to 5 m of module diameter)
2. Uniformly shielding the entire habitat in order to reach 20 - 25 g/cm2 of shielding
material: the mass constraints make this option impractical for existing launchers and
difficult to achieve even with those in the design phase ( ~ 16 tons in TLI - Trans - Lunar
Injection using the future Falcon X). A solution could be to assemble a vehicle in low
earth orbit (LEO) and then transfer it to EML2 (Earth–Moon L2), to a lunar orbit or to an
appropriate trajectory of transfer for a NEA (Near Earth Asteroid) exploration. Moreover
PERSEO:PErsonal Radiation Shielding for intErplanetary missiOns - Final Report Page : 7/66
this solution, although feasible from a technical point of view, requires in any case a huge
investment considering the cost of the launch.
3. Creation of a microshelter: a very small shelter inside a pressurized habitat. As a
drawback there is the possibility to spend whole days in a narrow space (some SPEs
may last up to 10 days).
Figure 1 Scheme of the current shielding strategies described in this section
3.4 Innovation proposed by PERSEO
The present project proposes an alternative solution to the interplanetary missions shielding problems investigating the possibility of adopting a selective wearable shield. In the literature only a few studies about ‘personal shielding systems’ are available (i.e.[RD1]), and PERSEO’s goals are to define and improve the efficiency of new personal passive shielding, to increase the probability of success of future exploration missions. The general idea is to give a preliminary conceptual design of space suits which can be worn for most of the time by the astronauts with additional shielding localized area. Filling entirely a space suit with shielding material is not an option because this would limit the mobility of the astronaut causing an unacceptable job performance: as a consequence shielding must be selective, focusing on the most radiosensitive areas. When the crew is inside the habitat, a wearable system - such as a suit or a jacket designed to shield the most radiosensitive organs - could ensure the astronaut both a significant shielding from SPE and enough comfort to carry out the ordinary activities within the habitat. The materials used to fill the system are going to be selected considering their shielding properties and also their suitability to be worn for prolonged period of time by astronauts. The selective shielding, complementary to that of the spacecraft, would also limit the use of shielding material inside the vehicle freeing up resources for other subsystems and payloads. On the other hand in the case of EVA, an undergarment can be design or a rigid protection can be incorporated inside the EVA suit, in order to achieve an adequate thickness of shielding material distributed in a selective way around the body of the astronaut Prof. Francis Cucinotta in a past interview ( http://tinyurl.com/cuci2002 ) stated that in case of exposure to high radiation dose (i.e. above 2 Gy), if at least 5% of the hematopoietic stem cells survive, the bone marrow is able to regenerate and the subject has good possibility to survive without needing a bone marrow transplant. Considering the high probability of an hematopoietic
PERSEO:PErsonal Radiation Shielding for intErplanetary missiOns - Final Report Page : 8/66
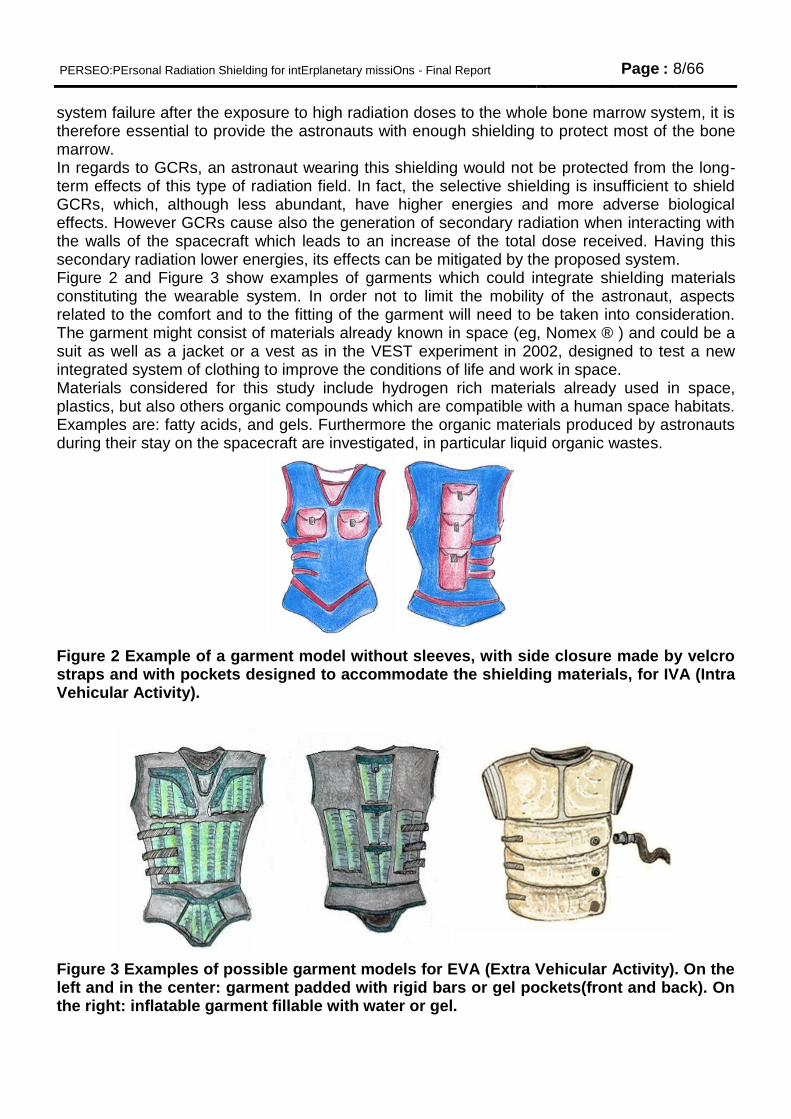
system failure after the exposure to high radiation doses to the whole bone marrow system, it is therefore essential to provide the astronauts with enough shielding to protect most of the bone marrow. In regards to GCRs, an astronaut wearing this shielding would not be protected from the long-term effects of this type of radiation field. In fact, the selective shielding is insufficient to shield GCRs, which, although less abundant, have higher energies and more adverse biological effects. However GCRs cause also the generation of secondary radiation when interacting with the walls of the spacecraft which leads to an increase of the total dose received. Having this secondary radiation lower energies, its effects can be mitigated by the proposed system. Figure 2 and Figure 3 show examples of garments which could integrate shielding materials constituting the wearable system. In order not to limit the mobility of the astronaut, aspects related to the comfort and to the fitting of the garment will need to be taken into consideration. The garment might consist of materials already known in space (eg, Nomex ® ) and could be a suit as well as a jacket or a vest as in the VEST experiment in 2002, designed to test a new integrated system of clothing to improve the conditions of life and work in space. Materials considered for this study include hydrogen rich materials already used in space, plastics, but also others organic compounds which are compatible with a human space habitats. Examples are: fatty acids, and gels. Furthermore the organic materials produced by astronauts during their stay on the spacecraft are investigated, in particular liquid organic wastes.
Figure 2 Example of a garment model without sleeves, with side closure made by velcro straps and with pockets designed to accommodate the shielding materials, for IVA (Intra Vehicular Activity).
Figure 3 Examples of possible garment models for EVA (Extra Vehicular Activity). On the left and in the center: garment padded with rigid bars or gel pockets(front and back). On the right: inflatable garment fillable with water or gel.
PERSEO:PErsonal Radiation Shielding for intErplanetary missiOns - Final Report Page : 9/66
By demonstrating the validity of the above described selective shielding approach, future spacesuits for IVA and EVA will have a radical evolution. These systems will mitigate the radiation exposure of astronauts and will allow to reduce the space module mass, improving the feasibility of complex operations on the surface for the preparation of a permanent human outpost.
4. SOLAR PARTICLE EVENT MODEL CHOICE
4.1 Solar protons energy distribution
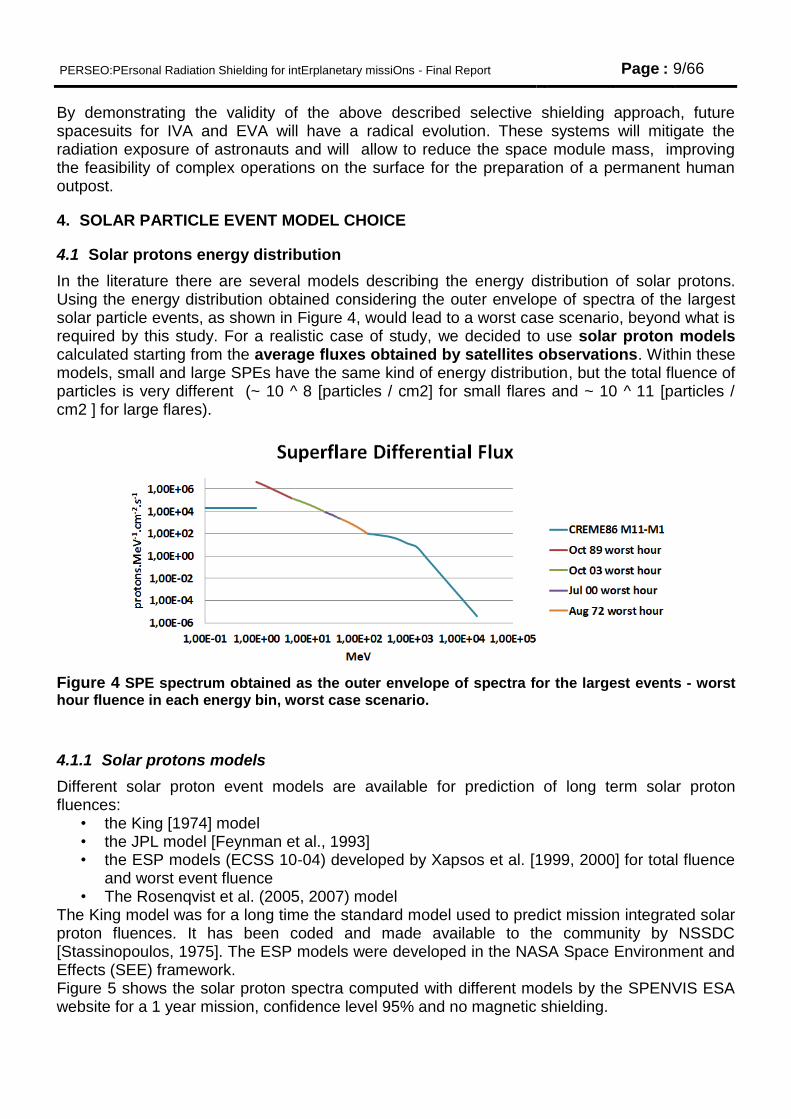
In the literature there are several models describing the energy distribution of solar protons. Using the energy distribution obtained considering the outer envelope of spectra of the largest solar particle events, as shown in Figure 4, would lead to a worst case scenario, beyond what is required by this study. For a realistic case of study, we decided to use solar proton models calculated starting from the average fluxes obtained by satellites observations. Within these models, small and large SPEs have the same kind of energy distribution, but the total fluence of particles is very different (~ 10 ^ 8 [particles / cm2] for small flares and ~ 10 ^ 11 [particles / cm2 ] for large flares).
Figure 4 SPE spectrum obtained as the outer envelope of spectra for the largest events - worst hour fluence in each energy bin, worst case scenario.
4.1.1 Solar protons models
Different solar proton event models are available for prediction of long term solar proton fluences:
• the King [1974] model • the JPL model [Feynman et al., 1993] • the ESP models (ECSS 10-04) developed by Xapsos et al. [1999, 2000] for total fluence
and worst event fluence • The Rosenqvist et al. (2005, 2007) model
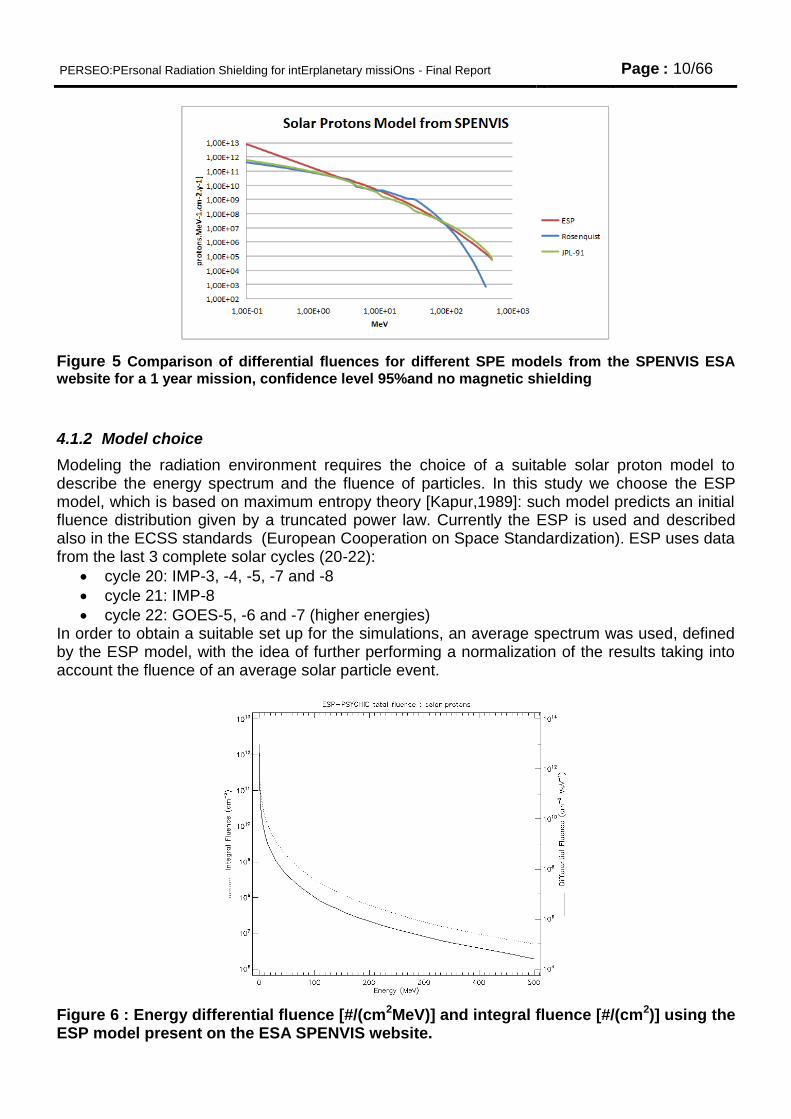
The King model was for a long time the standard model used to predict mission integrated solar proton fluences. It has been coded and made available to the community by NSSDC [Stassinopoulos, 1975]. The ESP models were developed in the NASA Space Environment and Effects (SEE) framework. Figure 5 shows the solar proton spectra computed with different models by the SPENVIS ESA website for a 1 year mission, confidence level 95% and no magnetic shielding.
PERSEO:PErsonal Radiation Shielding for intErplanetary missiOns - Final Report Page : 10/66
Figure 5 Comparison of differential fluences for different SPE models from the SPENVIS ESA website for a 1 year mission, confidence level 95%and no magnetic shielding
4.1.2 Model choice
Modeling the radiation environment requires the choice of a suitable solar proton model to describe the energy spectrum and the fluence of particles. In this study we choose the ESP model, which is based on maximum entropy theory [Kapur,1989]: such model predicts an initial fluence distribution given by a truncated power law. Currently the ESP is used and described also in the ECSS standards (European Cooperation on Space Standardization). ESP uses data from the last 3 complete solar cycles (20-22):
cycle 20: IMP-3, -4, -5, -7 and -8
cycle 21: IMP-8
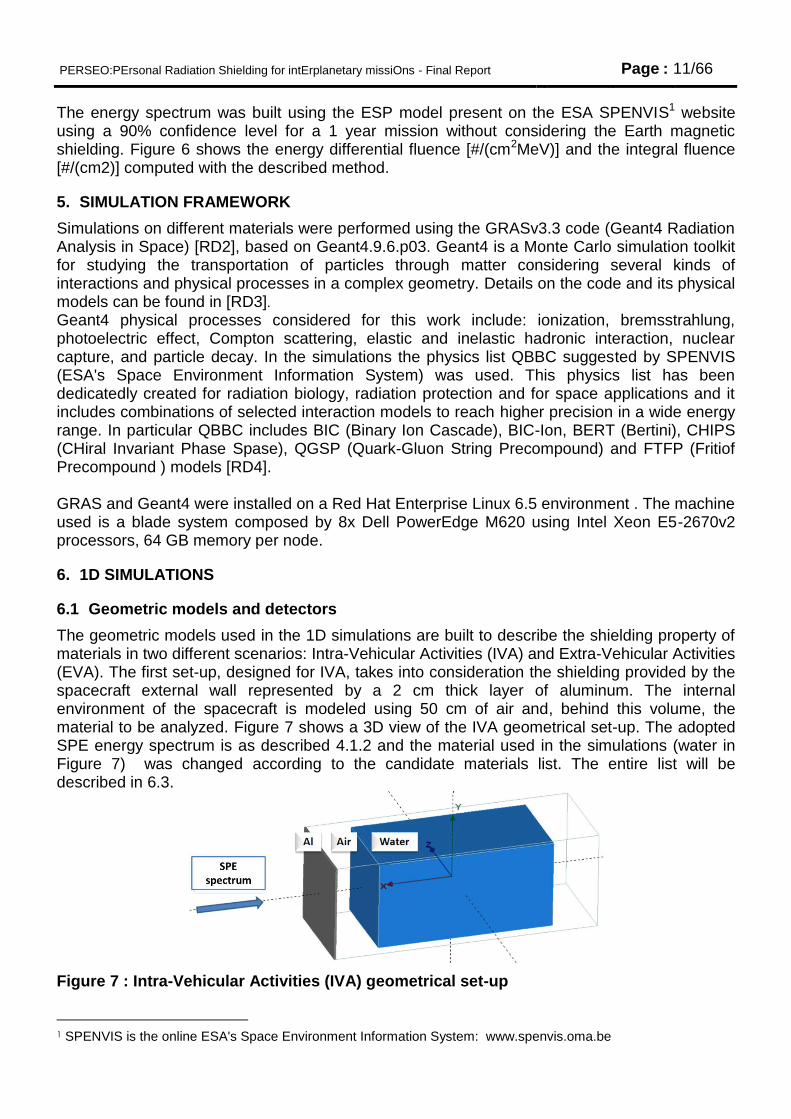
cycle 22: GOES-5, -6 and -7 (higher energies) In order to obtain a suitable set up for the simulations, an average spectrum was used, defined by the ESP model, with the idea of further performing a normalization of the results taking into account the fluence of an average solar particle event.
Figure 6 : Energy differential fluence [#/(cm2MeV)] and integral fluence [#/(cm2)] using the ESP model present on the ESA SPENVIS website.
PERSEO:PErsonal Radiation Shielding for intErplanetary missiOns - Final Report Page : 11/66
The energy spectrum was built using the ESP model present on the ESA SPENVIS1 website using a 90% confidence level for a 1 year mission without considering the Earth magnetic shielding. Figure 6 shows the energy differential fluence [#/(cm2MeV)] and the integral fluence [#/(cm2)] computed with the described method.
5. SIMULATION FRAMEWORK
Simulations on different materials were performed using the GRASv3.3 code (Geant4 Radiation Analysis in Space) [RD2], based on Geant4.9.6.p03. Geant4 is a Monte Carlo simulation toolkit for studying the transportation of particles through matter considering several kinds of interactions and physical processes in a complex geometry. Details on the code and its physical models can be found in [RD3]. Geant4 physical processes considered for this work include: ionization, bremsstrahlung, photoelectric effect, Compton scattering, elastic and inelastic hadronic interaction, nuclear capture, and particle decay. In the simulations the physics list QBBC suggested by SPENVIS (ESA's Space Environment Information System) was used. This physics list has been dedicatedly created for radiation biology, radiation protection and for space applications and it includes combinations of selected interaction models to reach higher precision in a wide energy range. In particular QBBC includes BIC (Binary Ion Cascade), BIC-Ion, BERT (Bertini), CHIPS (CHiral Invariant Phase Spase), QGSP (Quark-Gluon String Precompound) and FTFP (Fritiof Precompound ) models [RD4]. GRAS and Geant4 were installed on a Red Hat Enterprise Linux 6.5 environment . The machine used is a blade system composed by 8x Dell PowerEdge M620 using Intel Xeon E5-2670v2 processors, 64 GB memory per node.
6. 1D SIMULATIONS
6.1 Geometric models and detectors
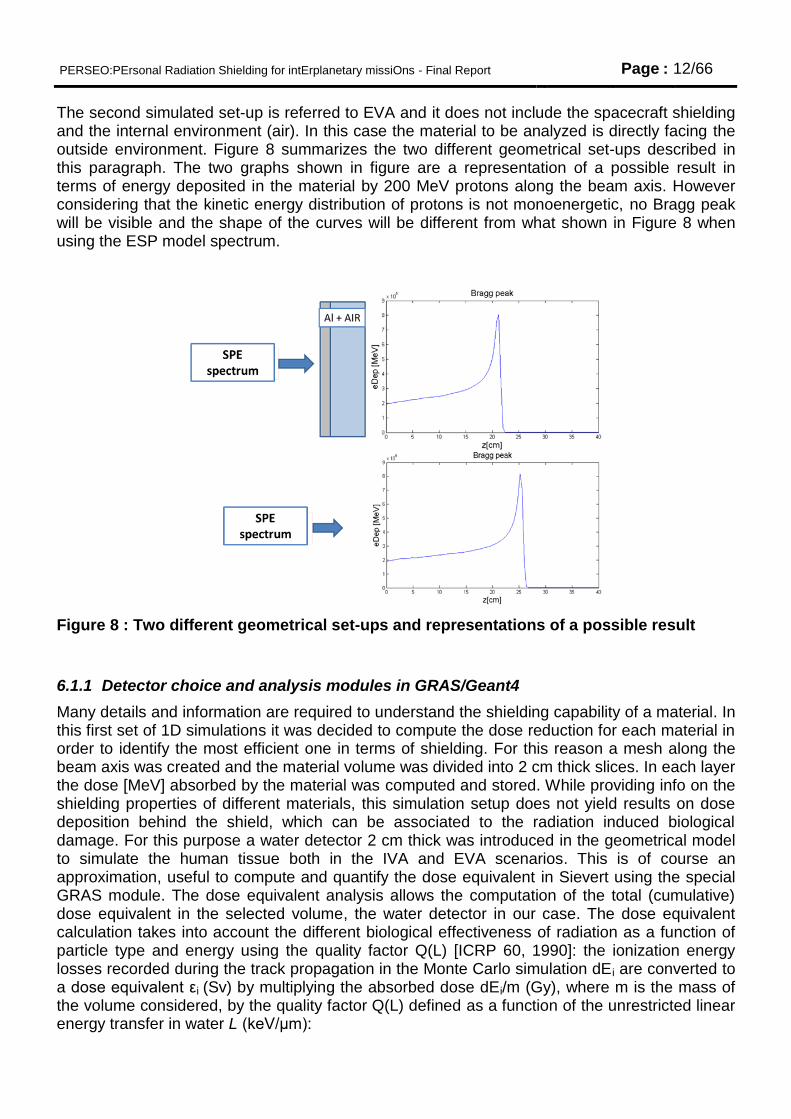
The geometric models used in the 1D simulations are built to describe the shielding property of materials in two different scenarios: Intra-Vehicular Activities (IVA) and Extra-Vehicular Activities (EVA). The first set-up, designed for IVA, takes into consideration the shielding provided by the spacecraft external wall represented by a 2 cm thick layer of aluminum. The internal environment of the spacecraft is modeled using 50 cm of air and, behind this volume, the material to be analyzed. Figure 7 shows a 3D view of the IVA geometrical set-up. The adopted SPE energy spectrum is as described 4.1.2 and the material used in the simulations (water in Figure 7) was changed according to the candidate materials list. The entire list will be described in 6.3.
Figure 7 : Intra-Vehicular Activities (IVA) geometrical set-up
1 SPENVIS is the online ESA's Space Environment Information System: www.spenvis.oma.be
PERSEO:PErsonal Radiation Shielding for intErplanetary missiOns - Final Report Page : 12/66
The second simulated set-up is referred to EVA and it does not include the spacecraft shielding and the internal environment (air). In this case the material to be analyzed is directly facing the outside environment. Figure 8 summarizes the two different geometrical set-ups described in this paragraph. The two graphs shown in figure are a representation of a possible result in terms of energy deposited in the material by 200 MeV protons along the beam axis. However considering that the kinetic energy distribution of protons is not monoenergetic, no Bragg peak will be visible and the shape of the curves will be different from what shown in Figure 8 when using the ESP model spectrum.
Figure 8 : Two different geometrical set-ups and representations of a possible result
6.1.1 Detector choice and analysis modules in GRAS/Geant4
Many details and information are required to understand the shielding capability of a material. In this first set of 1D simulations it was decided to compute the dose reduction for each material in order to identify the most efficient one in terms of shielding. For this reason a mesh along the beam axis was created and the material volume was divided into 2 cm thick slices. In each layer the dose [MeV] absorbed by the material was computed and stored. While providing info on the shielding properties of different materials, this simulation setup does not yield results on dose deposition behind the shield, which can be associated to the radiation induced biological damage. For this purpose a water detector 2 cm thick was introduced in the geometrical model to simulate the human tissue both in the IVA and EVA scenarios. This is of course an approximation, useful to compute and quantify the dose equivalent in Sievert using the special GRAS module. The dose equivalent analysis allows the computation of the total (cumulative) dose equivalent in the selected volume, the water detector in our case. The dose equivalent calculation takes into account the different biological effectiveness of radiation as a function of particle type and energy using the quality factor Q(L) [ICRP 60, 1990]: the ionization energy losses recorded during the track propagation in the Monte Carlo simulation dEi are converted to a dose equivalent εi (Sv) by multiplying the absorbed dose dEi/m (Gy), where m is the mass of the volume considered, by the quality factor Q(L) defined as a function of the unrestricted linear energy transfer in water L (keV/μm):
PERSEO:PErsonal Radiation Shielding for intErplanetary missiOns - Final Report Page : 13/66
1) with
2)
and
for L ≤10
3)
for 10 <L< 100 for L ≥100
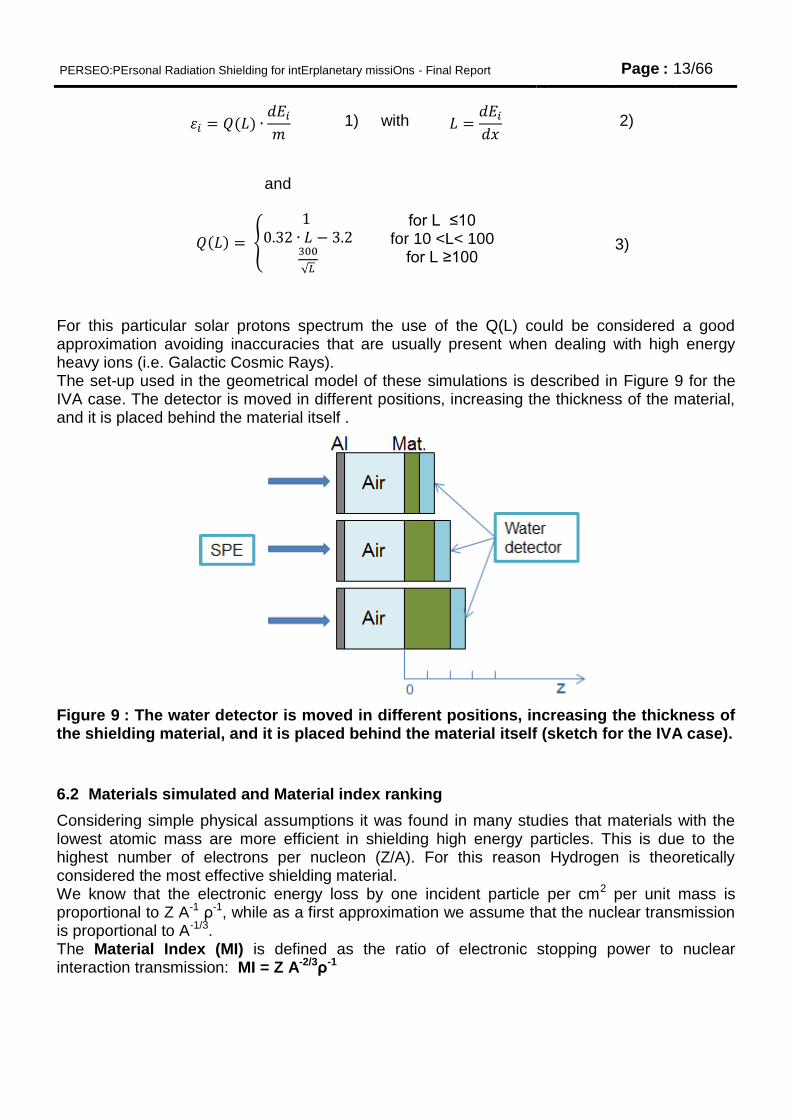
For this particular solar protons spectrum the use of the Q(L) could be considered a good approximation avoiding inaccuracies that are usually present when dealing with high energy heavy ions (i.e. Galactic Cosmic Rays). The set-up used in the geometrical model of these simulations is described in Figure 9 for the IVA case. The detector is moved in different positions, increasing the thickness of the material, and it is placed behind the material itself .
Figure 9 : The water detector is moved in different positions, increasing the thickness of the shielding material, and it is placed behind the material itself (sketch for the IVA case).
6.2 Materials simulated and Material index ranking
Considering simple physical assumptions it was found in many studies that materials with the lowest atomic mass are more efficient in shielding high energy particles. This is due to the highest number of electrons per nucleon (Z/A). For this reason Hydrogen is theoretically considered the most effective shielding material. We know that the electronic energy loss by one incident particle per cm2 per unit mass is proportional to Z A-1 ρ-1, while as a first approximation we assume that the nuclear transmission is proportional to A-1/3. The Material Index (MI) is defined as the ratio of electronic stopping power to nuclear interaction transmission: MI = Z A-2/3ρ-1
PERSEO:PErsonal Radiation Shielding for intErplanetary missiOns - Final Report Page : 14/66
Different materials have been selected for this study. They are placed in a special ranking on the base of their Material Index. These materials have different chemical structures and properties. A possible classification is: Polymers (cellulose, polyethylene , polypropylene, etc.) Organics compounds (urea, fatty acids, etc) Structural Material (Kevlar, Nextel, Nomex, etc) Other materials (water, aluminum, etc)
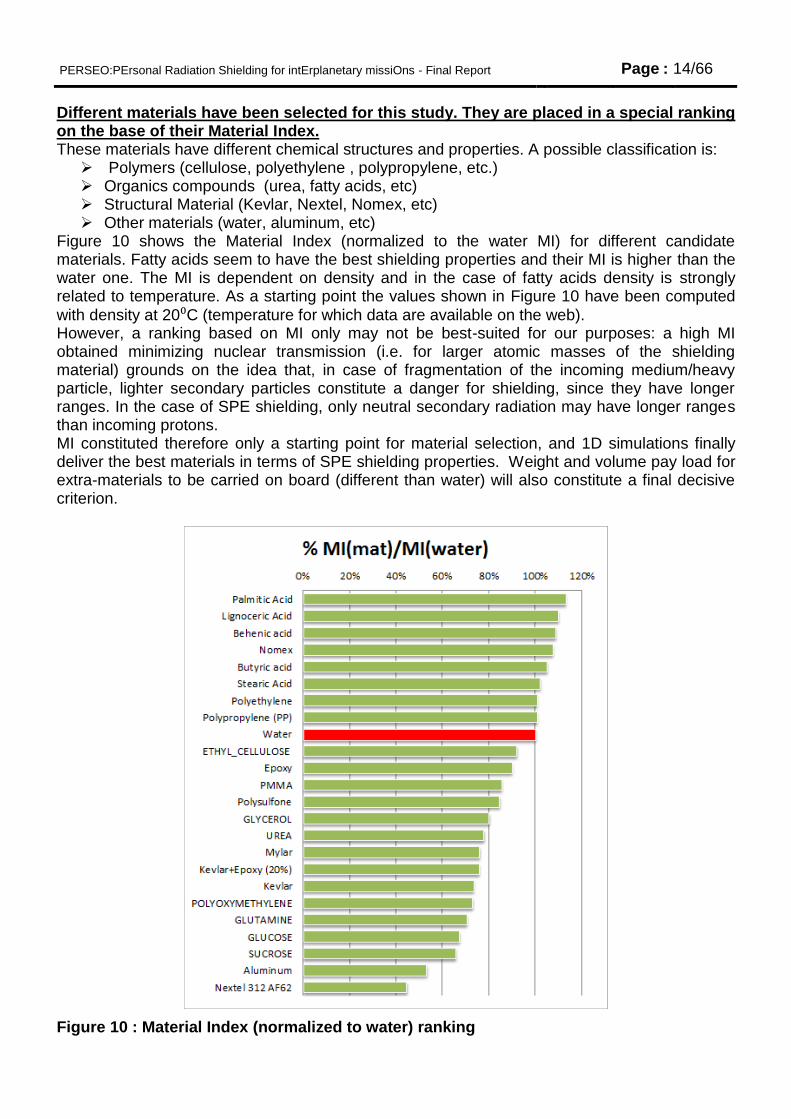
Figure 10 shows the Material Index (normalized to the water MI) for different candidate materials. Fatty acids seem to have the best shielding properties and their MI is higher than the water one. The MI is dependent on density and in the case of fatty acids density is strongly related to temperature. As a starting point the values shown in Figure 10 have been computed
with density at 20⁰C (temperature for which data are available on the web). However, a ranking based on MI only may not be best-suited for our purposes: a high MI obtained minimizing nuclear transmission (i.e. for larger atomic masses of the shielding material) grounds on the idea that, in case of fragmentation of the incoming medium/heavy particle, lighter secondary particles constitute a danger for shielding, since they have longer ranges. In the case of SPE shielding, only neutral secondary radiation may have longer ranges than incoming protons. MI constituted therefore only a starting point for material selection, and 1D simulations finally deliver the best materials in terms of SPE shielding properties. Weight and volume pay load for extra-materials to be carried on board (different than water) will also constitute a final decisive criterion.
Figure 10 : Material Index (normalized to water) ranking
PERSEO:PErsonal Radiation Shielding for intErplanetary missiOns - Final Report Page : 15/66
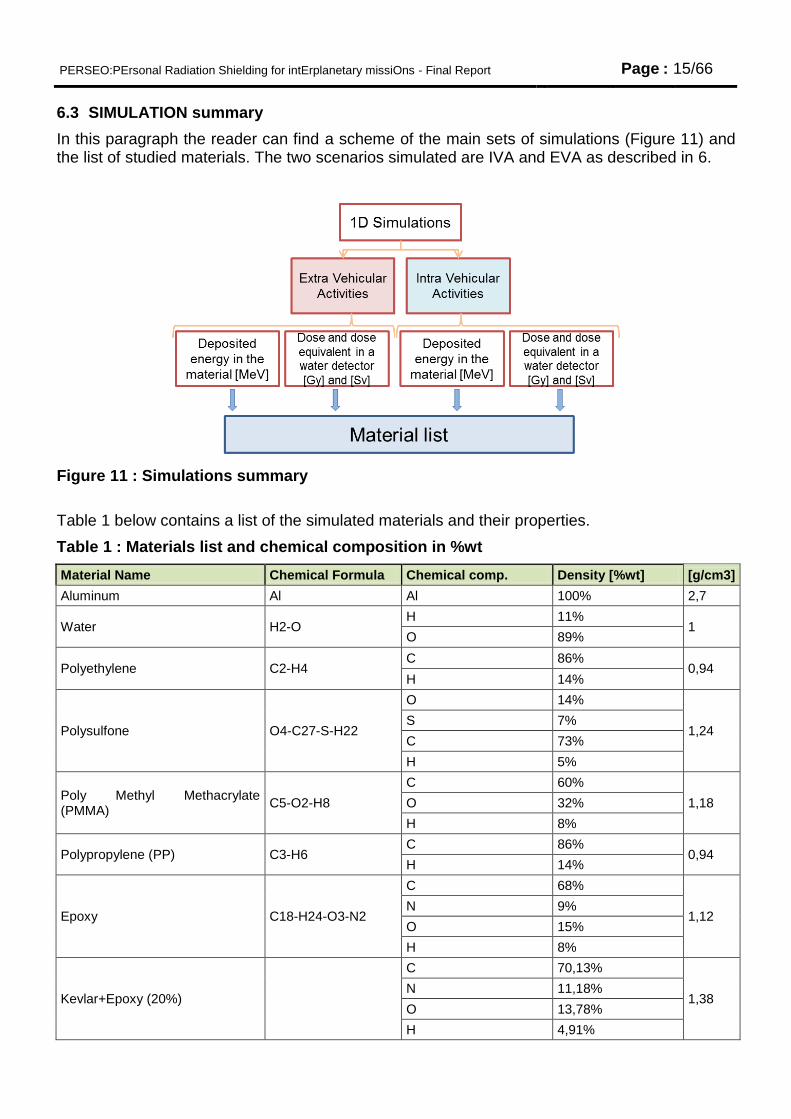
6.3 SIMULATION summary
In this paragraph the reader can find a scheme of the main sets of simulations (Figure 11) and the list of studied materials. The two scenarios simulated are IVA and EVA as described in 6.
Figure 11 : Simulations summary
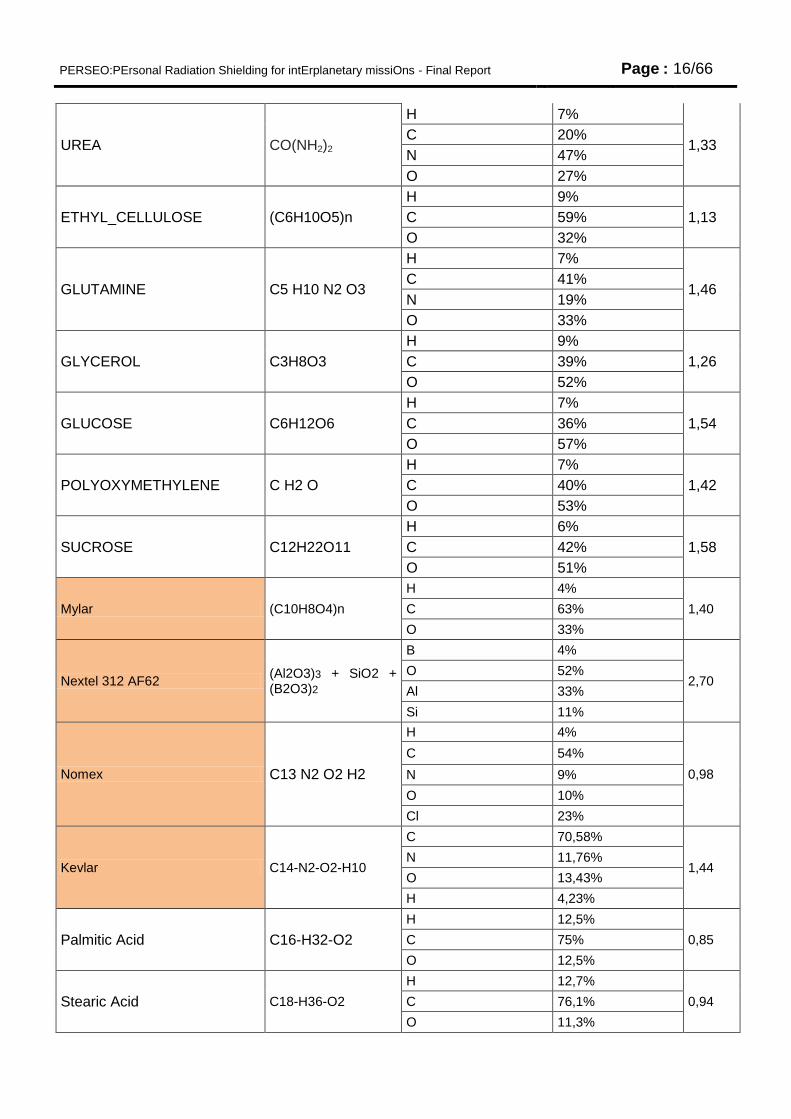
Table 1 below contains a list of the simulated materials and their properties.
Table 1 : Materials list and chemical composition in %wt
Material Name Chemical Formula Chemical comp. Density [%wt] [g/cm3]
Aluminum Al Al 100% 2,7
Water H2-O H 11%
1 O 89%
Polyethylene C2-H4 C 86%
0,94 H 14%
Polysulfone O4-C27-S-H22
O 14%
1,24 S 7%
C 73%
H 5%
Poly Methyl Methacrylate (PMMA)
C5-O2-H8
C 60%
1,18 O 32%
H 8%
Polypropylene (PP) C3-H6 C 86%
0,94 H 14%
Epoxy C18-H24-O3-N2
C 68%
1,12 N 9%
O 15%
H 8%
Kevlar+Epoxy (20%)
C 70,13%
1,38 N 11,18%
O 13,78%
H 4,91%
PERSEO:PErsonal Radiation Shielding for intErplanetary missiOns - Final Report Page : 16/66
UREA CO(NH2)2
H 7%
1,33 C 20%
N 47%
O 27%
ETHYL_CELLULOSE (C6H10O5)n
H 9%
1,13 C 59%
O 32%
GLUTAMINE C5 H10 N2 O3
H 7%
1,46 C 41%
N 19%
O 33%
GLYCEROL C3H8O3
H 9%
1,26 C 39%
O 52%
GLUCOSE C6H12O6
H 7%
1,54 C 36%
O 57%
POLYOXYMETHYLENE C H2 O
H 7%
1,42 C 40%
O 53%
SUCROSE C12H22O11
H 6%
1,58 C 42%
O 51%
Mylar (C10H8O4)n
H 4%
1,40 C 63%
O 33%
Nextel 312 AF62 (Al2O3)3 + SiO2 + (B2O3)2
B 4%
2,70 O 52%
Al 33%
Si 11%
Nomex C13 N2 O2 H2
H 4%
0,98
C 54%
N 9%
O 10%
Cl 23%
Kevlar C14-N2-O2-H10
C 70,58%
1,44 N 11,76%
O 13,43%
H 4,23%
Palmitic Acid C16-H32-O2
H 12,5%
0,85 C 75%
O 12,5%
Stearic Acid C18-H36-O2
H 12,7%
0,94 C 76,1%
O 11,3%
PERSEO:PErsonal Radiation Shielding for intErplanetary missiOns - Final Report Page : 17/66
Lignoceric Acid C24-H48-O2
H 13,0%
0,87 C 78,3%
O 8,7%
Butyric acid C4-H8-O2
H 9,1%
0,95 C 54,5%
O 36,4%
Behenic acid C22-H44-O2
H 12,9%
0,88 C 78%
O 9,4%
6.4 Results and comments
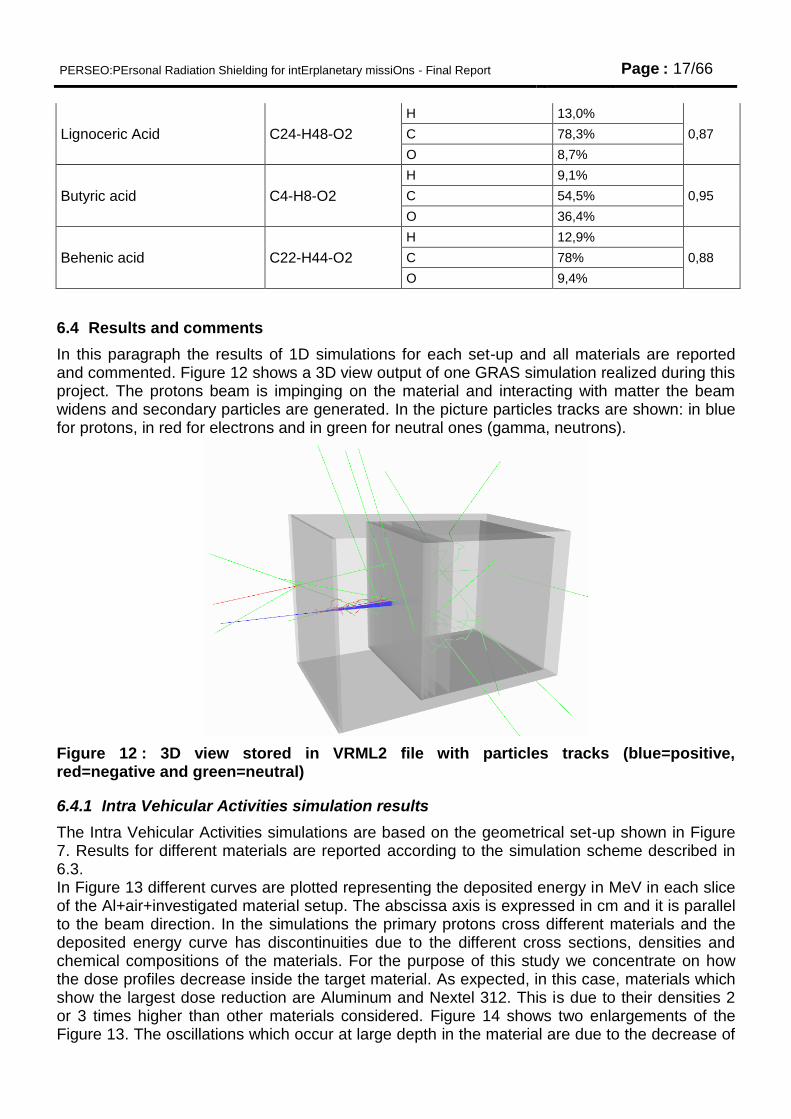
In this paragraph the results of 1D simulations for each set-up and all materials are reported and commented. Figure 12 shows a 3D view output of one GRAS simulation realized during this project. The protons beam is impinging on the material and interacting with matter the beam widens and secondary particles are generated. In the picture particles tracks are shown: in blue for protons, in red for electrons and in green for neutral ones (gamma, neutrons).
Figure 12 : 3D view stored in VRML2 file with particles tracks (blue=positive, red=negative and green=neutral)
6.4.1 Intra Vehicular Activities simulation results
The Intra Vehicular Activities simulations are based on the geometrical set-up shown in Figure 7. Results for different materials are reported according to the simulation scheme described in 6.3. In Figure 13 different curves are plotted representing the deposited energy in MeV in each slice of the Al+air+investigated material setup. The abscissa axis is expressed in cm and it is parallel to the beam direction. In the simulations the primary protons cross different materials and the deposited energy curve has discontinuities due to the different cross sections, densities and chemical compositions of the materials. For the purpose of this study we concentrate on how the dose profiles decrease inside the target material. As expected, in this case, materials which show the largest dose reduction are Aluminum and Nextel 312. This is due to their densities 2 or 3 times higher than other materials considered. Figure 14 shows two enlargements of the Figure 13. The oscillations which occur at large depth in the material are due to the decrease of
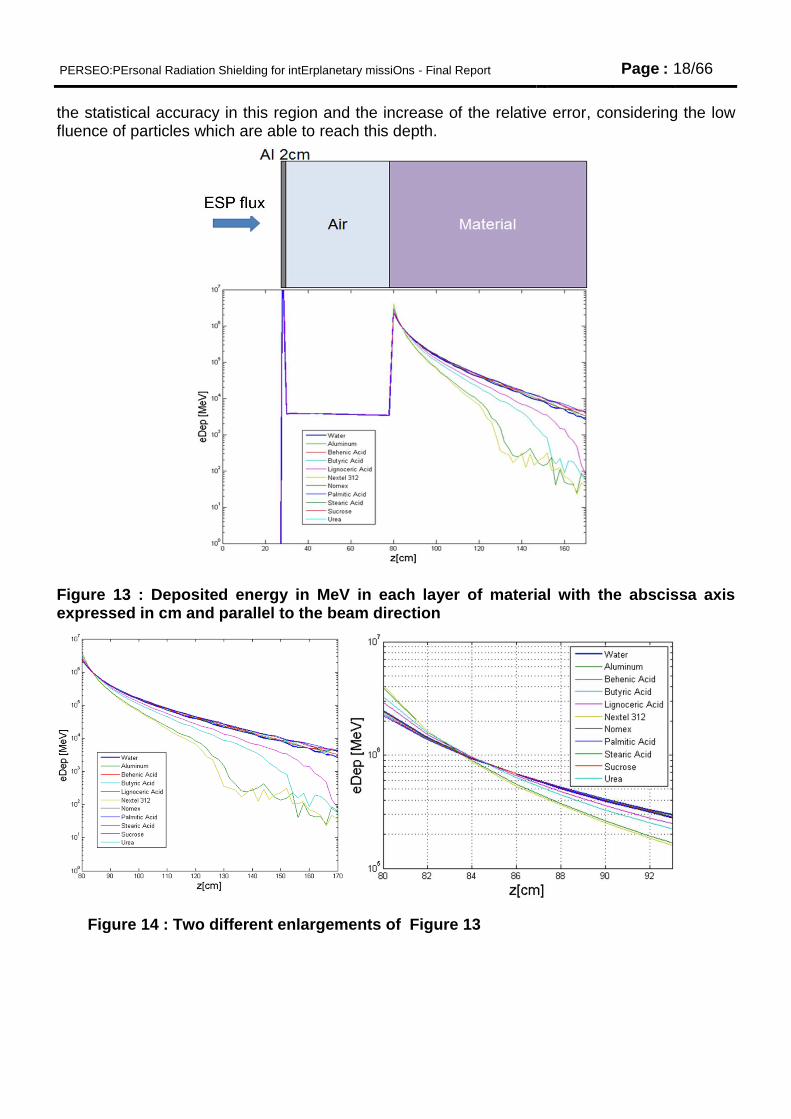
PERSEO:PErsonal Radiation Shielding for intErplanetary missiOns - Final Report Page : 18/66
the statistical accuracy in this region and the increase of the relative error, considering the low fluence of particles which are able to reach this depth.
Figure 13 : Deposited energy in MeV in each layer of material with the abscissa axis expressed in cm and parallel to the beam direction
Figure 14 : Two different enlargements of Figure 13
PERSEO:PErsonal Radiation Shielding for intErplanetary missiOns - Final Report Page : 19/66
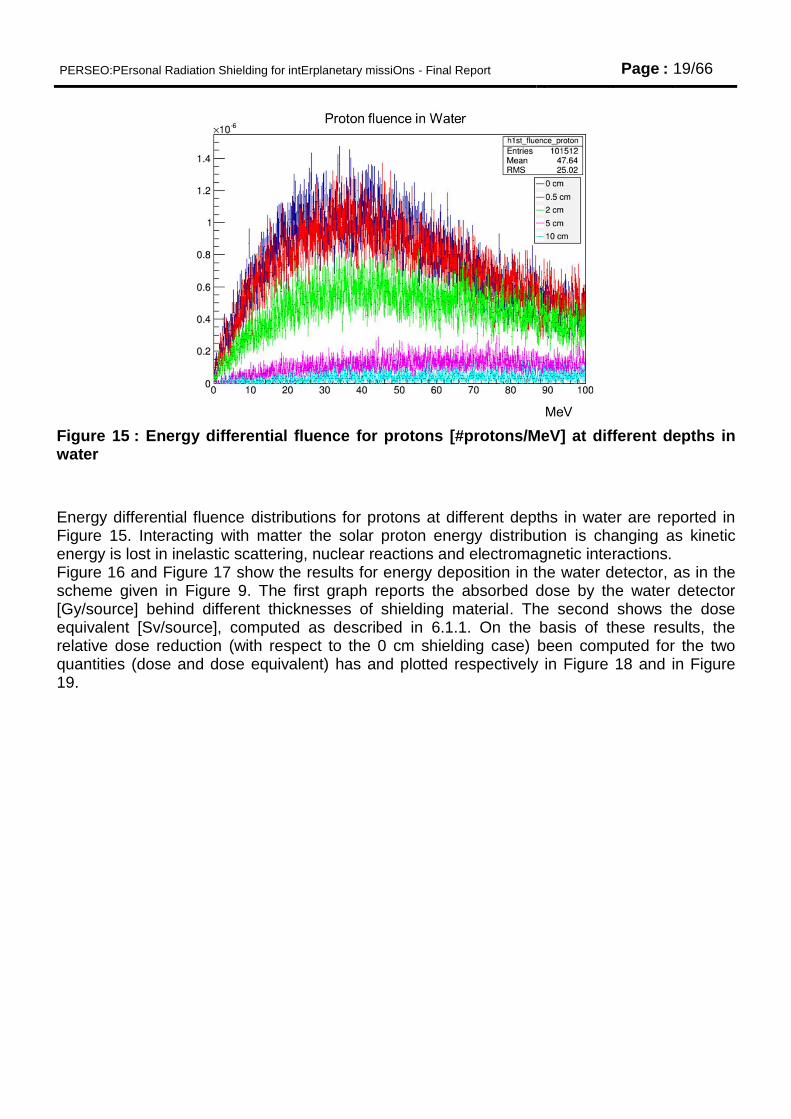
Figure 15 : Energy differential fluence for protons [#protons/MeV] at different depths in water
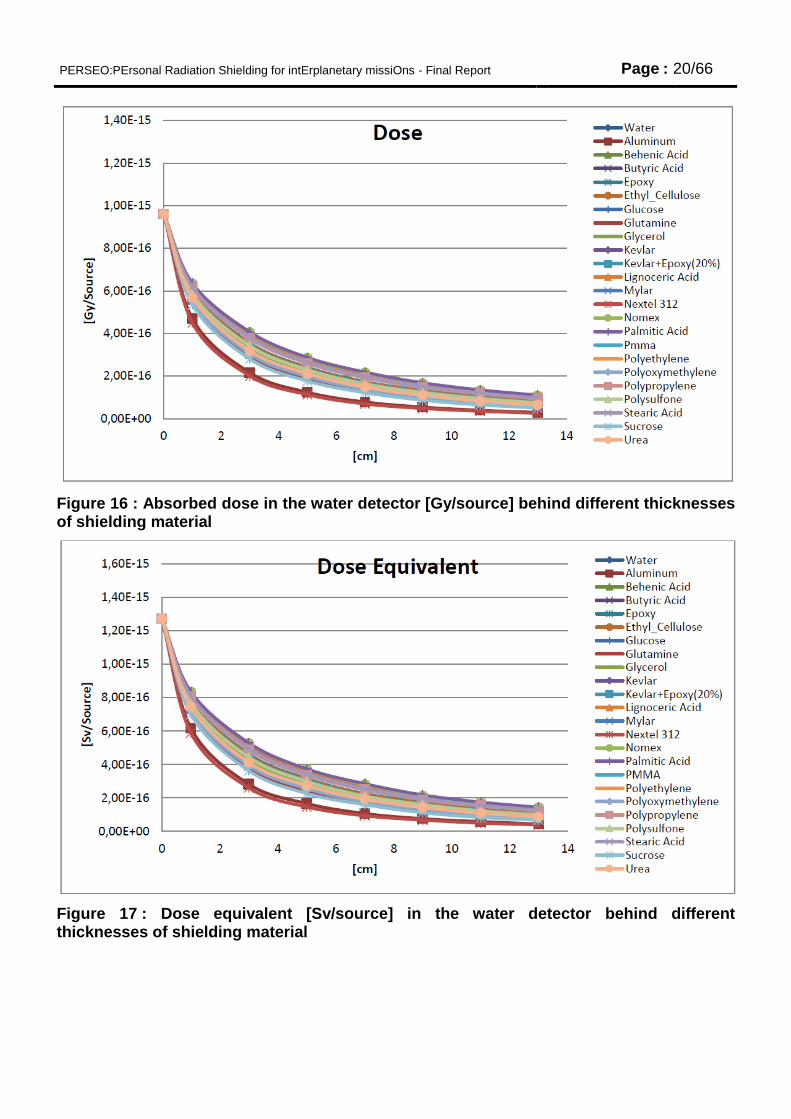
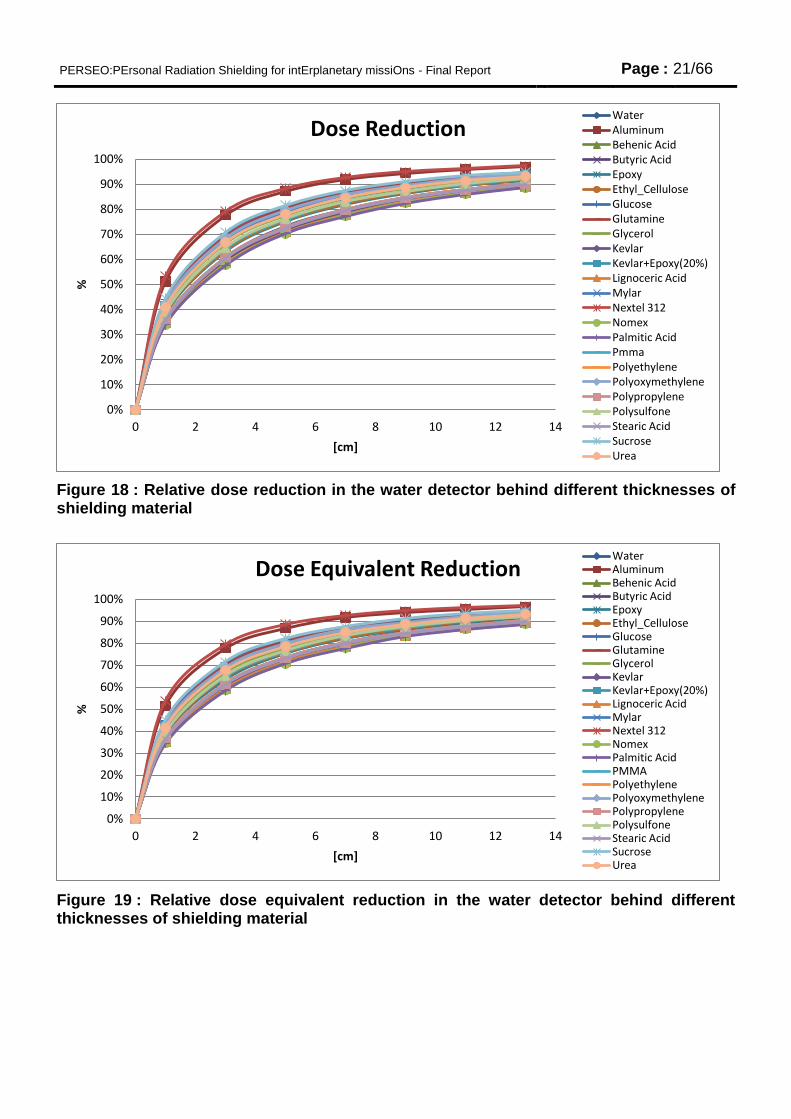
Energy differential fluence distributions for protons at different depths in water are reported in Figure 15. Interacting with matter the solar proton energy distribution is changing as kinetic energy is lost in inelastic scattering, nuclear reactions and electromagnetic interactions. Figure 16 and Figure 17 show the results for energy deposition in the water detector, as in the scheme given in Figure 9. The first graph reports the absorbed dose by the water detector [Gy/source] behind different thicknesses of shielding material. The second shows the dose equivalent [Sv/source], computed as described in 6.1.1. On the basis of these results, the relative dose reduction (with respect to the 0 cm shielding case) been computed for the two quantities (dose and dose equivalent) has and plotted respectively in Figure 18 and in Figure 19.
PERSEO:PErsonal Radiation Shielding for intErplanetary missiOns - Final Report Page : 20/66
Figure 16 : Absorbed dose in the water detector [Gy/source] behind different thicknesses of shielding material
Figure 17 : Dose equivalent [Sv/source] in the water detector behind different thicknesses of shielding material
PERSEO:PErsonal Radiation Shielding for intErplanetary missiOns - Final Report Page : 21/66
Figure 18 : Relative dose reduction in the water detector behind different thicknesses of shielding material
Figure 19 : Relative dose equivalent reduction in the water detector behind different thicknesses of shielding material
0%
10%
20%
30%
40%
50%
60%
70%
80%
90%
100%
0 2 4 6 8 10 12 14
%
[cm]
Dose Reduction Water Aluminum Behenic Acid Butyric Acid Epoxy Ethyl_Cellulose Glucose Glutamine Glycerol Kevlar Kevlar+Epoxy(20%) Lignoceric Acid Mylar Nextel 312 Nomex Palmitic Acid Pmma Polyethylene Polyoxymethylene Polypropylene Polysulfone Stearic Acid Sucrose Urea
0%
10%
20%
30%
40%
50%
60%
70%
80%
90%
100%
0 2 4 6 8 10 12 14
%
[cm]
Dose Equivalent Reduction Water Aluminum Behenic Acid Butyric Acid Epoxy Ethyl_Cellulose Glucose Glutamine Glycerol Kevlar Kevlar+Epoxy(20%) Lignoceric Acid Mylar Nextel 312 Nomex Palmitic Acid PMMA Polyethylene Polyoxymethylene Polypropylene Polysulfone Stearic Acid Sucrose Urea
PERSEO:PErsonal Radiation Shielding for intErplanetary missiOns - Final Report Page : 22/66
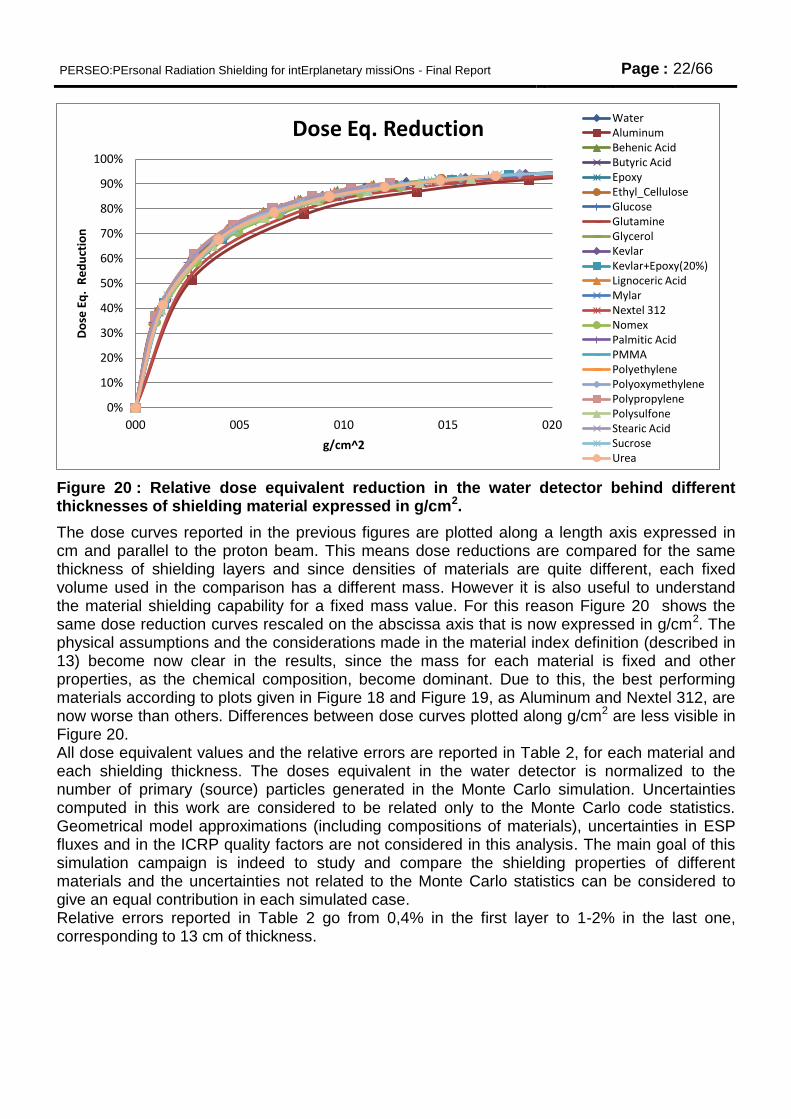
Figure 20 : Relative dose equivalent reduction in the water detector behind different thicknesses of shielding material expressed in g/cm2.
The dose curves reported in the previous figures are plotted along a length axis expressed in cm and parallel to the proton beam. This means dose reductions are compared for the same thickness of shielding layers and since densities of materials are quite different, each fixed volume used in the comparison has a different mass. However it is also useful to understand the material shielding capability for a fixed mass value. For this reason Figure 20 shows the same dose reduction curves rescaled on the abscissa axis that is now expressed in g/cm2. The physical assumptions and the considerations made in the material index definition (described in 13) become now clear in the results, since the mass for each material is fixed and other properties, as the chemical composition, become dominant. Due to this, the best performing materials according to plots given in Figure 18 and Figure 19, as Aluminum and Nextel 312, are now worse than others. Differences between dose curves plotted along g/cm2 are less visible in Figure 20. All dose equivalent values and the relative errors are reported in Table 2, for each material and each shielding thickness. The doses equivalent in the water detector is normalized to the number of primary (source) particles generated in the Monte Carlo simulation. Uncertainties computed in this work are considered to be related only to the Monte Carlo code statistics. Geometrical model approximations (including compositions of materials), uncertainties in ESP fluxes and in the ICRP quality factors are not considered in this analysis. The main goal of this simulation campaign is indeed to study and compare the shielding properties of different materials and the uncertainties not related to the Monte Carlo statistics can be considered to give an equal contribution in each simulated case. Relative errors reported in Table 2 go from 0,4% in the first layer to 1-2% in the last one, corresponding to 13 cm of thickness.
0%
10%
20%
30%
40%
50%
60%
70%
80%
90%
100%
000 005 010 015 020
Do
se E
q.
Re
du
ctio
n
g/cm^2
Dose Eq. Reduction Water Aluminum Behenic Acid Butyric Acid Epoxy Ethyl_Cellulose Glucose Glutamine Glycerol Kevlar Kevlar+Epoxy(20%) Lignoceric Acid Mylar Nextel 312 Nomex Palmitic Acid PMMA Polyethylene Polyoxymethylene Polypropylene Polysulfone Stearic Acid Sucrose Urea
PERSEO:PErsonal Radiation Shielding for intErplanetary missiOns - Final Report Page : 23/66
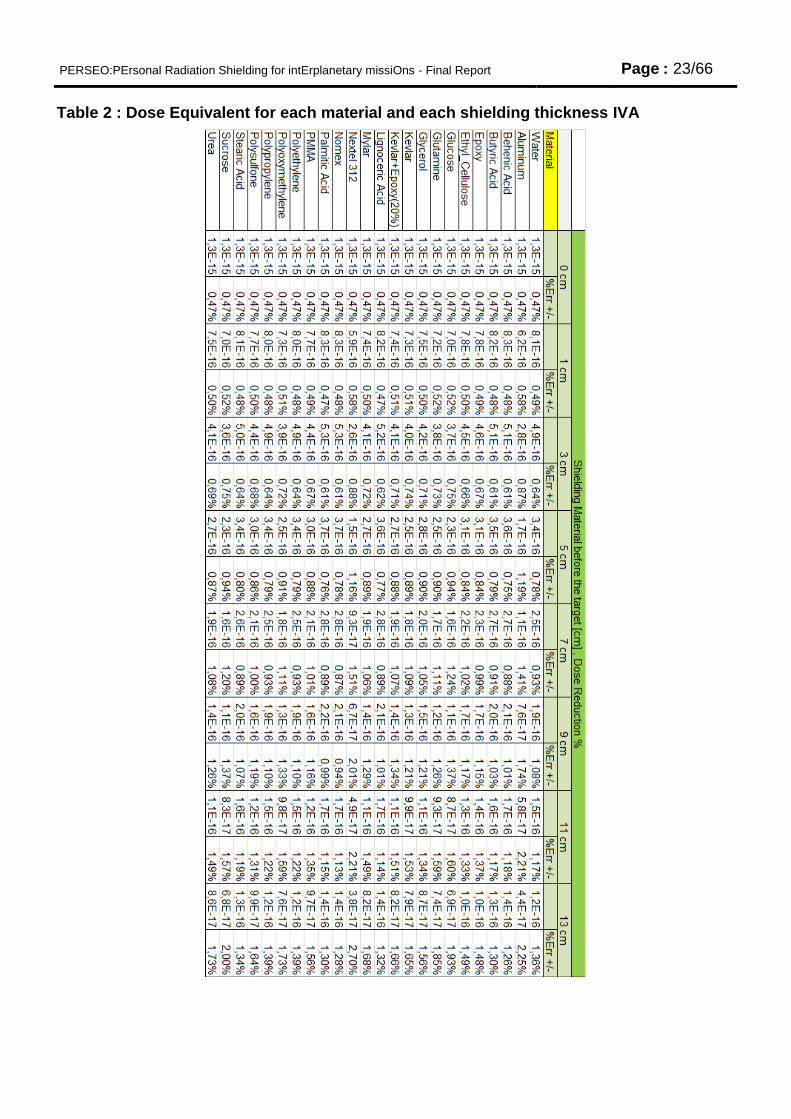
Table 2 : Dose Equivalent for each material and each shielding thickness IVA
PERSEO:PErsonal Radiation Shielding for intErplanetary missiOns - Final Report Page : 24/66
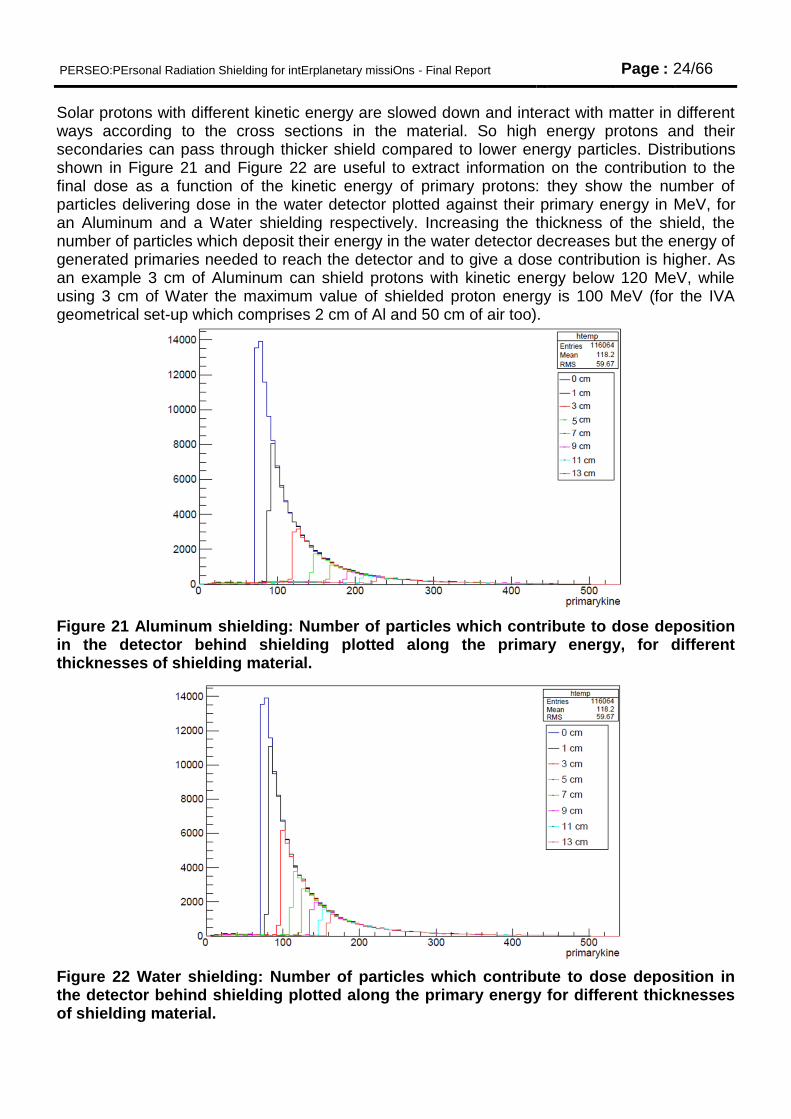
Solar protons with different kinetic energy are slowed down and interact with matter in different ways according to the cross sections in the material. So high energy protons and their secondaries can pass through thicker shield compared to lower energy particles. Distributions shown in Figure 21 and Figure 22 are useful to extract information on the contribution to the final dose as a function of the kinetic energy of primary protons: they show the number of particles delivering dose in the water detector plotted against their primary energy in MeV, for an Aluminum and a Water shielding respectively. Increasing the thickness of the shield, the number of particles which deposit their energy in the water detector decreases but the energy of generated primaries needed to reach the detector and to give a dose contribution is higher. As an example 3 cm of Aluminum can shield protons with kinetic energy below 120 MeV, while using 3 cm of Water the maximum value of shielded proton energy is 100 MeV (for the IVA geometrical set-up which comprises 2 cm of Al and 50 cm of air too).
Figure 21 Aluminum shielding: Number of particles which contribute to dose deposition in the detector behind shielding plotted along the primary energy, for different thicknesses of shielding material.
Figure 22 Water shielding: Number of particles which contribute to dose deposition in the detector behind shielding plotted along the primary energy for different thicknesses of shielding material.
PERSEO:PErsonal Radiation Shielding for intErplanetary missiOns - Final Report Page : 25/66
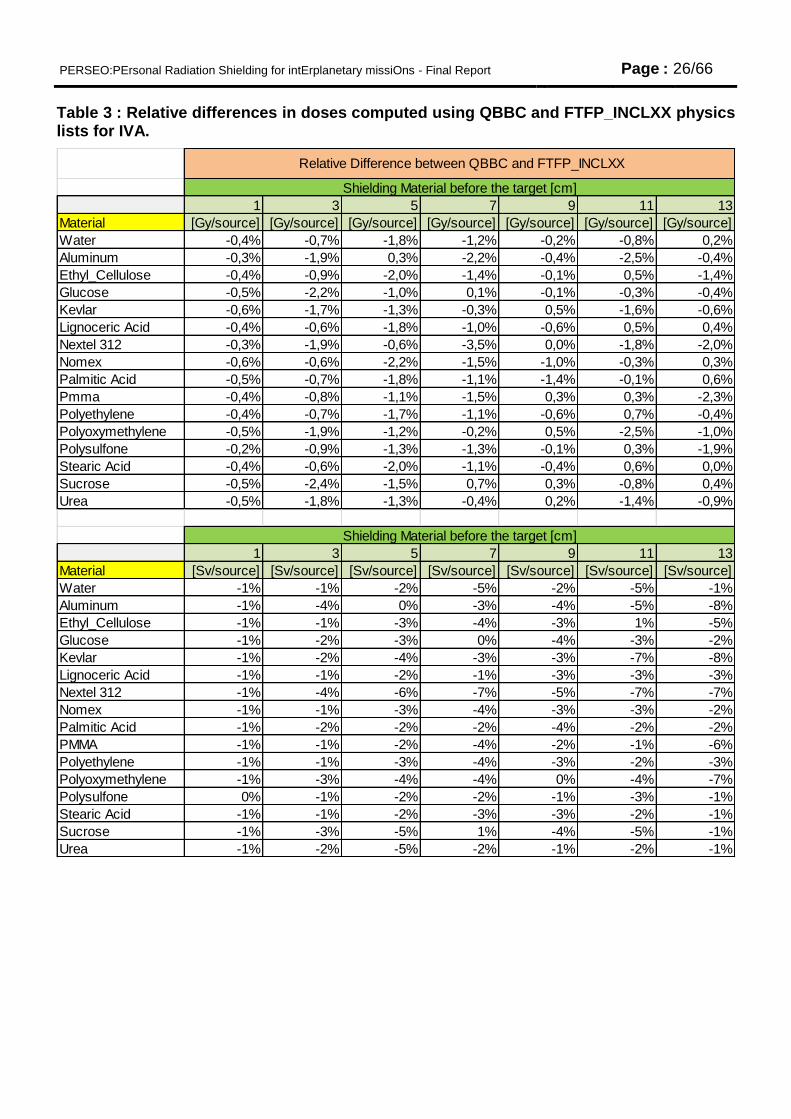
6.4.2 Comparison of results from different Physics List
As described in 11 the simulations uses different physical processes and models. The adopted physics list was the QBBC used by SPENVIS (the online ESA's Space Environment Information System). Generally Physics Lists are subject to updates and improvements as the physical models are refined and modified on the basis of experimental data. However, there are different models used to describe the same phenomena in different fields of application and often their use is linked to the particle energy range. The QBBC Physics list includes BIC (Binary Ion Cascade), BIC-Ion, BERT (Bertini), CHIPS (CHiral Invariant Phase Spase), QGSP (Quark-Gluon String Precompound) and FTFP (Fritiof Precompound ) models [RD3]. The release 10.1 of Geant4 includes a new version of the INCL++ which is the C++ version of the Liege Intranuclear Cascade model and can be used as an alternative to the Binary Ion Cascade. A set of simulations was repeated with the FTFP_INCLXX Physics List to investigate eventual differences between the physical models. The same geometrical set-up and the same parameters were used in these simulations. Results are reported below in Table 3. Results shows that for this particular case and for the range of investigated energies, the adoption of the two different physics lists (QBBC and FTFP_INCLXX) leads to the same conclusions and fluctuations in the results are present but not relevant. Relative difference of QBBC with respect to the FTFP_INCLXX is negative in almost all the points studied. This means that doses obtained with the INCLXX model are slightly higher than the QBBC case. These results show that for the purposes of this project, the choice of physics list has a slight impact on the results, due to the defined solar proton kinetic energy distribution.
PERSEO:PErsonal Radiation Shielding for intErplanetary missiOns - Final Report Page : 26/66
Table 3 : Relative differences in doses computed using QBBC and FTFP_INCLXX physics lists for IVA.
1 3 5 7 9 11 13
Material [Gy/source] [Gy/source] [Gy/source] [Gy/source] [Gy/source] [Gy/source] [Gy/source]
Water -0,4% -0,7% -1,8% -1,2% -0,2% -0,8% 0,2%
Aluminum -0,3% -1,9% 0,3% -2,2% -0,4% -2,5% -0,4%
Ethyl_Cellulose -0,4% -0,9% -2,0% -1,4% -0,1% 0,5% -1,4%
Glucose -0,5% -2,2% -1,0% 0,1% -0,1% -0,3% -0,4%
Kevlar -0,6% -1,7% -1,3% -0,3% 0,5% -1,6% -0,6%
Lignoceric Acid -0,4% -0,6% -1,8% -1,0% -0,6% 0,5% 0,4%
Nextel 312 -0,3% -1,9% -0,6% -3,5% 0,0% -1,8% -2,0%
Nomex -0,6% -0,6% -2,2% -1,5% -1,0% -0,3% 0,3%
Palmitic Acid -0,5% -0,7% -1,8% -1,1% -1,4% -0,1% 0,6%
Pmma -0,4% -0,8% -1,1% -1,5% 0,3% 0,3% -2,3%
Polyethylene -0,4% -0,7% -1,7% -1,1% -0,6% 0,7% -0,4%
Polyoxymethylene -0,5% -1,9% -1,2% -0,2% 0,5% -2,5% -1,0%
Polysulfone -0,2% -0,9% -1,3% -1,3% -0,1% 0,3% -1,9%
Stearic Acid -0,4% -0,6% -2,0% -1,1% -0,4% 0,6% 0,0%
Sucrose -0,5% -2,4% -1,5% 0,7% 0,3% -0,8% 0,4%
Urea -0,5% -1,8% -1,3% -0,4% 0,2% -1,4% -0,9%
1 3 5 7 9 11 13
Material [Sv/source] [Sv/source] [Sv/source] [Sv/source] [Sv/source] [Sv/source] [Sv/source]
Water -1% -1% -2% -5% -2% -5% -1%
Aluminum -1% -4% 0% -3% -4% -5% -8%
Ethyl_Cellulose -1% -1% -3% -4% -3% 1% -5%
Glucose -1% -2% -3% 0% -4% -3% -2%
Kevlar -1% -2% -4% -3% -3% -7% -8%
Lignoceric Acid -1% -1% -2% -1% -3% -3% -3%
Nextel 312 -1% -4% -6% -7% -5% -7% -7%
Nomex -1% -1% -3% -4% -3% -3% -2%
Palmitic Acid -1% -2% -2% -2% -4% -2% -2%
PMMA -1% -1% -2% -4% -2% -1% -6%
Polyethylene -1% -1% -3% -4% -3% -2% -3%
Polyoxymethylene -1% -3% -4% -4% 0% -4% -7%
Polysulfone 0% -1% -2% -2% -1% -3% -1%
Stearic Acid -1% -1% -2% -3% -3% -2% -1%
Sucrose -1% -3% -5% 1% -4% -5% -1%
Urea -1% -2% -5% -2% -1% -2% -1%
Shielding Material before the target [cm]
Relative Difference between QBBC and FTFP_INCLXX
Shielding Material before the target [cm]
PERSEO:PErsonal Radiation Shielding for intErplanetary missiOns - Final Report Page : 27/66
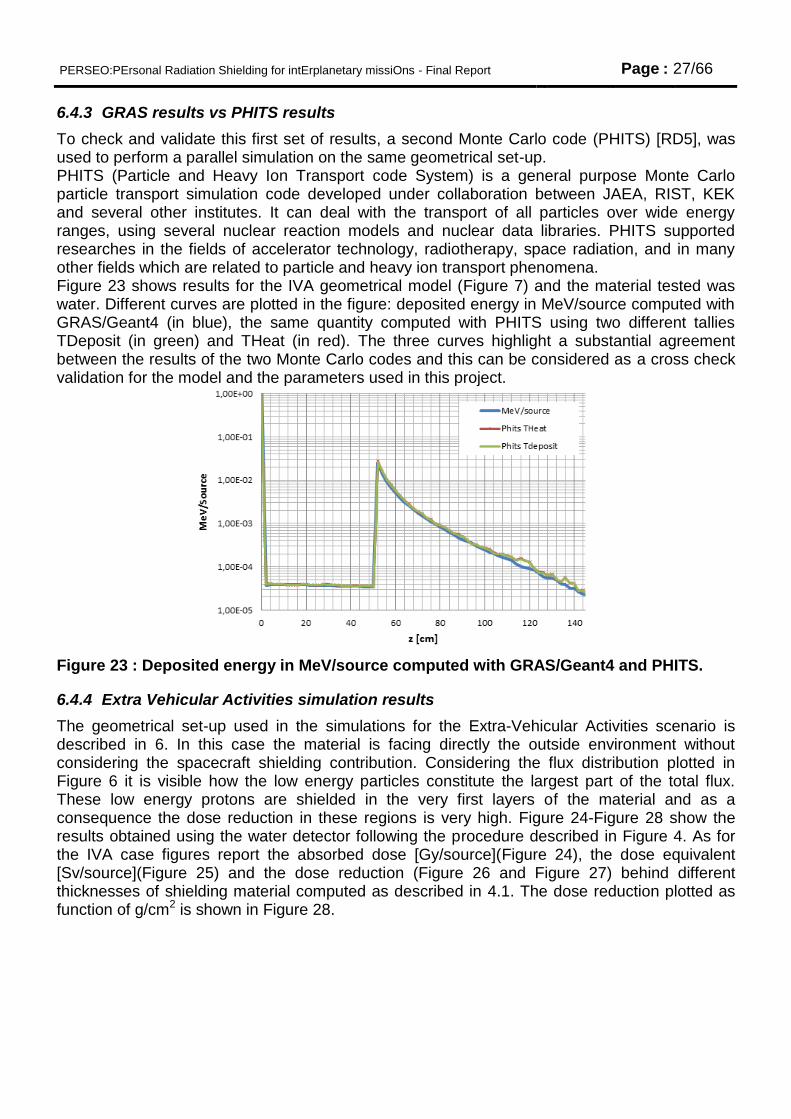
6.4.3 GRAS results vs PHITS results
To check and validate this first set of results, a second Monte Carlo code (PHITS) [RD5], was used to perform a parallel simulation on the same geometrical set-up. PHITS (Particle and Heavy Ion Transport code System) is a general purpose Monte Carlo particle transport simulation code developed under collaboration between JAEA, RIST, KEK and several other institutes. It can deal with the transport of all particles over wide energy ranges, using several nuclear reaction models and nuclear data libraries. PHITS supported researches in the fields of accelerator technology, radiotherapy, space radiation, and in many other fields which are related to particle and heavy ion transport phenomena. Figure 23 shows results for the IVA geometrical model (Figure 7) and the material tested was water. Different curves are plotted in the figure: deposited energy in MeV/source computed with GRAS/Geant4 (in blue), the same quantity computed with PHITS using two different tallies TDeposit (in green) and THeat (in red). The three curves highlight a substantial agreement between the results of the two Monte Carlo codes and this can be considered as a cross check validation for the model and the parameters used in this project.
Figure 23 : Deposited energy in MeV/source computed with GRAS/Geant4 and PHITS.
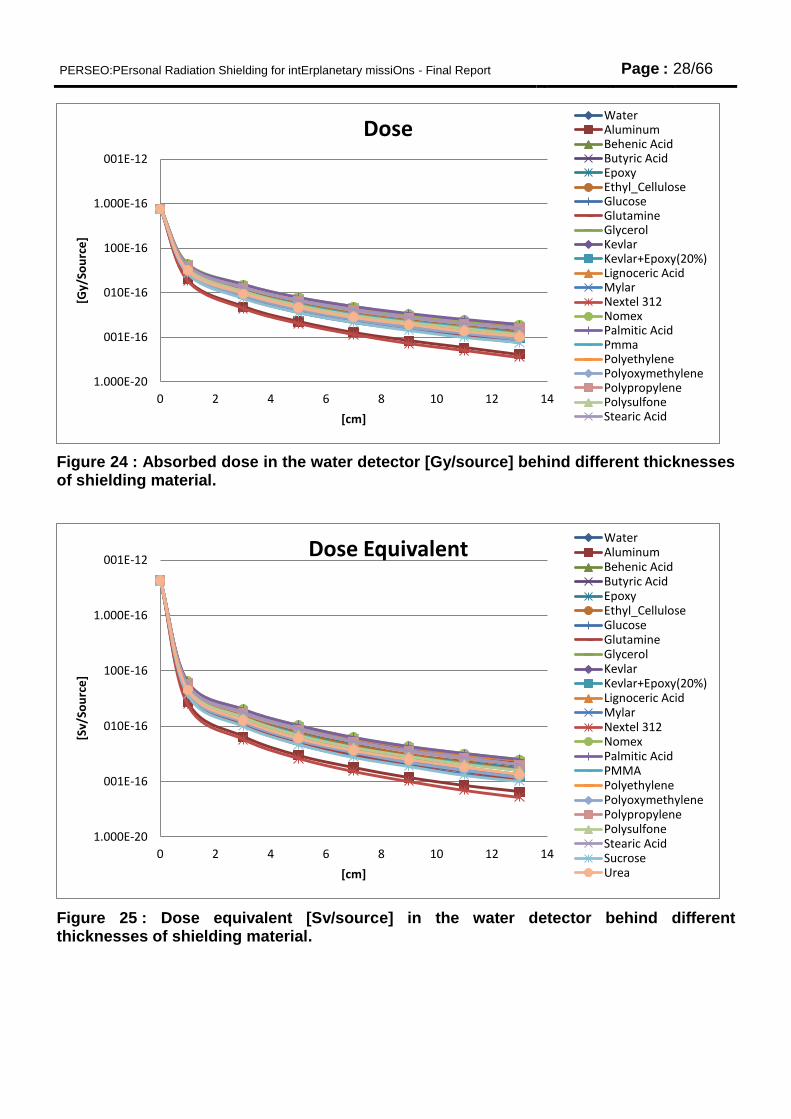
6.4.4 Extra Vehicular Activities simulation results
The geometrical set-up used in the simulations for the Extra-Vehicular Activities scenario is described in 6. In this case the material is facing directly the outside environment without considering the spacecraft shielding contribution. Considering the flux distribution plotted in Figure 6 it is visible how the low energy particles constitute the largest part of the total flux. These low energy protons are shielded in the very first layers of the material and as a consequence the dose reduction in these regions is very high. Figure 24-Figure 28 show the results obtained using the water detector following the procedure described in Figure 4. As for the IVA case figures report the absorbed dose [Gy/source](Figure 24), the dose equivalent [Sv/source](Figure 25) and the dose reduction (Figure 26 and Figure 27) behind different thicknesses of shielding material computed as described in 4.1. The dose reduction plotted as function of g/cm2 is shown in Figure 28.
PERSEO:PErsonal Radiation Shielding for intErplanetary missiOns - Final Report Page : 28/66
Figure 24 : Absorbed dose in the water detector [Gy/source] behind different thicknesses of shielding material.
Figure 25 : Dose equivalent [Sv/source] in the water detector behind different thicknesses of shielding material.
1.000E-20
001E-16
010E-16
100E-16
1.000E-16
001E-12
0 2 4 6 8 10 12 14
[Gy/
Sou
rce
]
[cm]
Dose Water Aluminum Behenic Acid Butyric Acid Epoxy Ethyl_Cellulose Glucose Glutamine Glycerol Kevlar Kevlar+Epoxy(20%) Lignoceric Acid Mylar Nextel 312 Nomex Palmitic Acid Pmma Polyethylene Polyoxymethylene Polypropylene Polysulfone Stearic Acid
1.000E-20
001E-16
010E-16
100E-16
1.000E-16
001E-12
0 2 4 6 8 10 12 14
[Sv/
Sou
rce
]
[cm]
Dose Equivalent Water Aluminum Behenic Acid Butyric Acid Epoxy Ethyl_Cellulose Glucose Glutamine Glycerol Kevlar Kevlar+Epoxy(20%) Lignoceric Acid Mylar Nextel 312 Nomex Palmitic Acid PMMA Polyethylene Polyoxymethylene Polypropylene Polysulfone Stearic Acid Sucrose Urea
PERSEO:PErsonal Radiation Shielding for intErplanetary missiOns - Final Report Page : 29/66
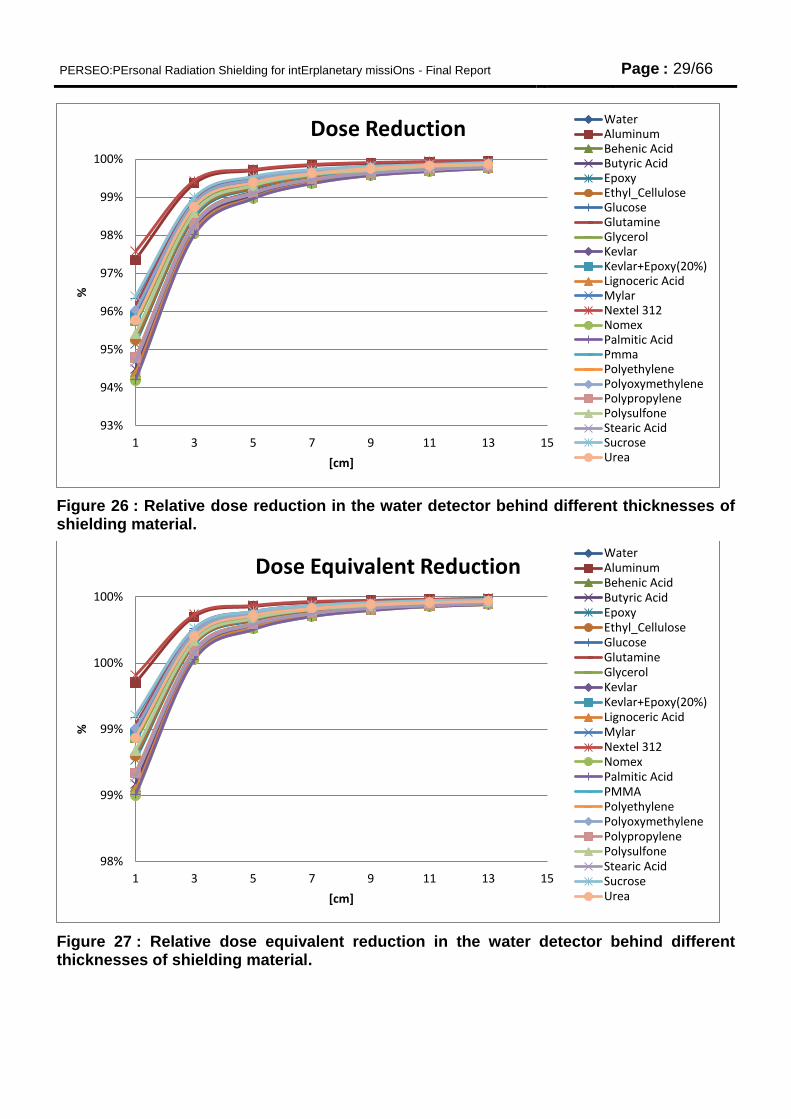
Figure 26 : Relative dose reduction in the water detector behind different thicknesses of shielding material.
Figure 27 : Relative dose equivalent reduction in the water detector behind different thicknesses of shielding material.
93%
94%
95%
96%
97%
98%
99%
100%
1 3 5 7 9 11 13 15
%
[cm]
Dose Reduction Water Aluminum Behenic Acid Butyric Acid Epoxy Ethyl_Cellulose Glucose Glutamine Glycerol Kevlar Kevlar+Epoxy(20%) Lignoceric Acid Mylar Nextel 312 Nomex Palmitic Acid Pmma Polyethylene Polyoxymethylene Polypropylene Polysulfone Stearic Acid Sucrose Urea
98%
99%
99%
100%
100%
1 3 5 7 9 11 13 15
%
[cm]
Dose Equivalent Reduction Water Aluminum Behenic Acid Butyric Acid Epoxy Ethyl_Cellulose Glucose Glutamine Glycerol Kevlar Kevlar+Epoxy(20%) Lignoceric Acid Mylar Nextel 312 Nomex Palmitic Acid PMMA Polyethylene Polyoxymethylene Polypropylene Polysulfone Stearic Acid Sucrose Urea
PERSEO:PErsonal Radiation Shielding for intErplanetary missiOns - Final Report Page : 30/66
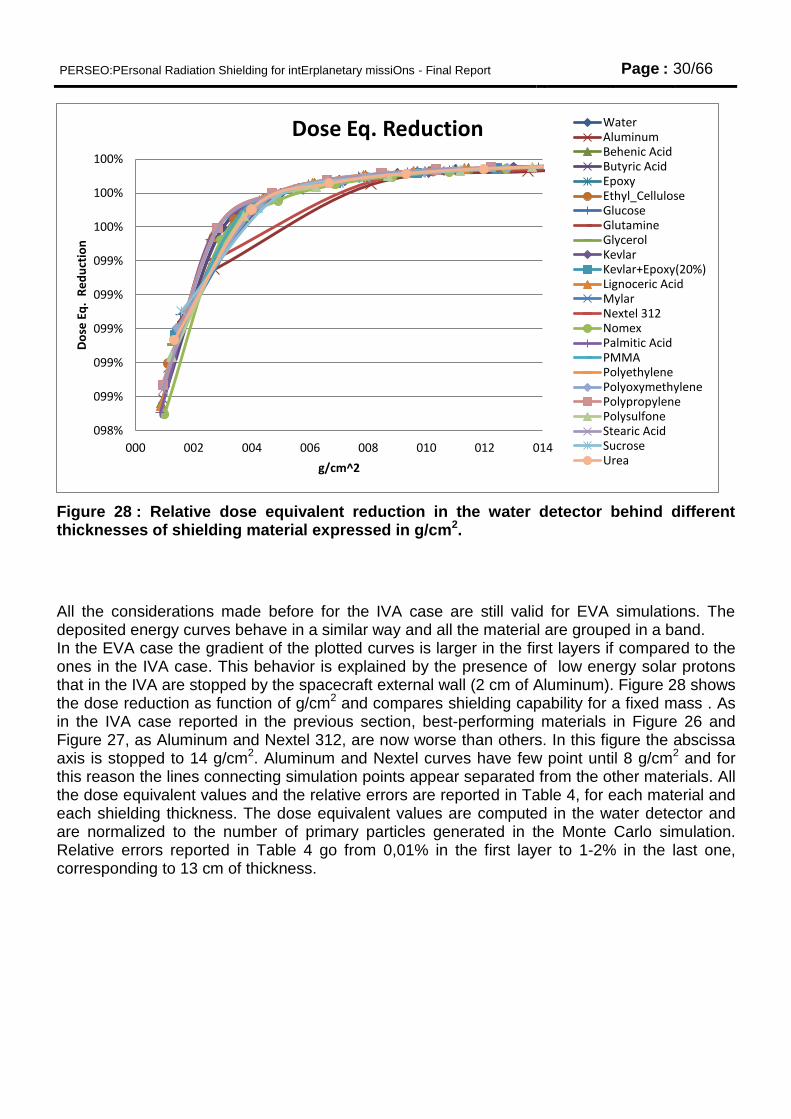
Figure 28 : Relative dose equivalent reduction in the water detector behind different thicknesses of shielding material expressed in g/cm2.
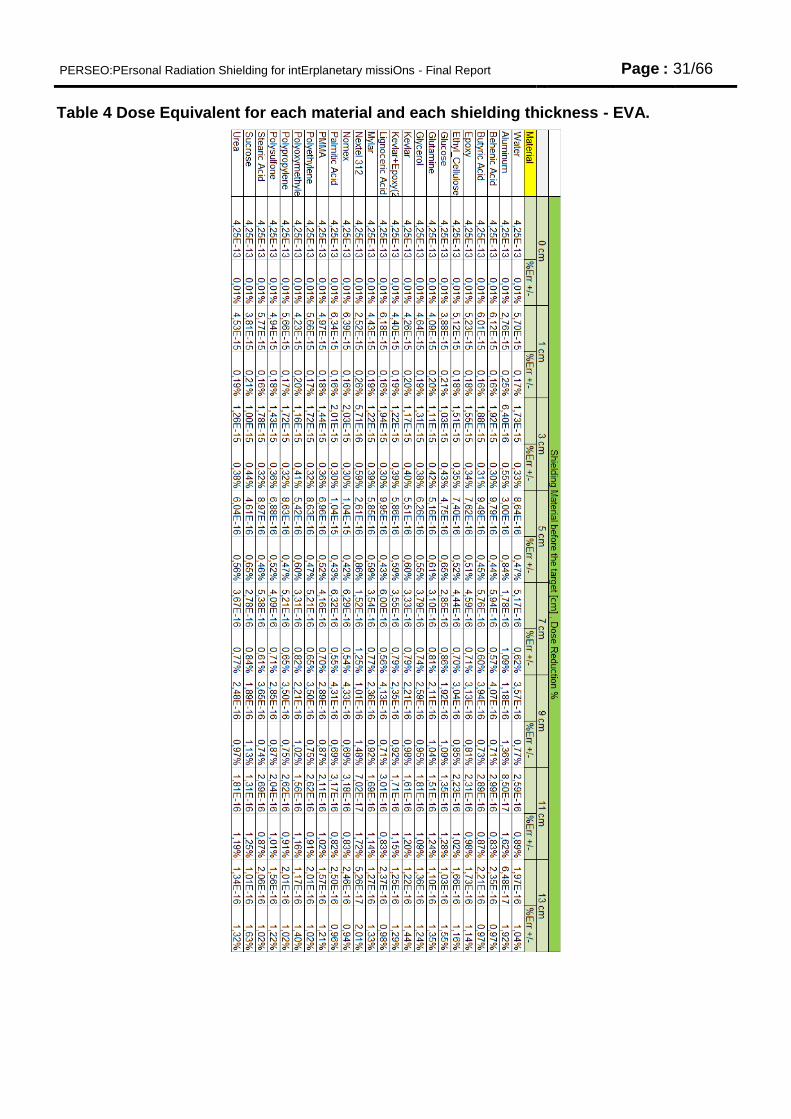
All the considerations made before for the IVA case are still valid for EVA simulations. The deposited energy curves behave in a similar way and all the material are grouped in a band. In the EVA case the gradient of the plotted curves is larger in the first layers if compared to the ones in the IVA case. This behavior is explained by the presence of low energy solar protons that in the IVA are stopped by the spacecraft external wall (2 cm of Aluminum). Figure 28 shows the dose reduction as function of g/cm2 and compares shielding capability for a fixed mass . As in the IVA case reported in the previous section, best-performing materials in Figure 26 and Figure 27, as Aluminum and Nextel 312, are now worse than others. In this figure the abscissa axis is stopped to 14 g/cm2. Aluminum and Nextel curves have few point until 8 g/cm2 and for this reason the lines connecting simulation points appear separated from the other materials. All the dose equivalent values and the relative errors are reported in Table 4, for each material and each shielding thickness. The dose equivalent values are computed in the water detector and are normalized to the number of primary particles generated in the Monte Carlo simulation. Relative errors reported in Table 4 go from 0,01% in the first layer to 1-2% in the last one, corresponding to 13 cm of thickness.
098%
099%
099%
099%
099%
099%
100%
100%
100%
000 002 004 006 008 010 012 014
Do
se E
q.
Re
du
ctio
n
g/cm^2
Dose Eq. Reduction Water Aluminum Behenic Acid Butyric Acid Epoxy Ethyl_Cellulose Glucose Glutamine Glycerol Kevlar Kevlar+Epoxy(20%) Lignoceric Acid Mylar Nextel 312 Nomex Palmitic Acid PMMA Polyethylene Polyoxymethylene Polypropylene Polysulfone Stearic Acid Sucrose Urea
PERSEO:PErsonal Radiation Shielding for intErplanetary missiOns - Final Report Page : 31/66
Table 4 Dose Equivalent for each material and each shielding thickness - EVA.
PERSEO:PErsonal Radiation Shielding for intErplanetary missiOns - Final Report Page : 32/66
6.4.5 Materials Ranking
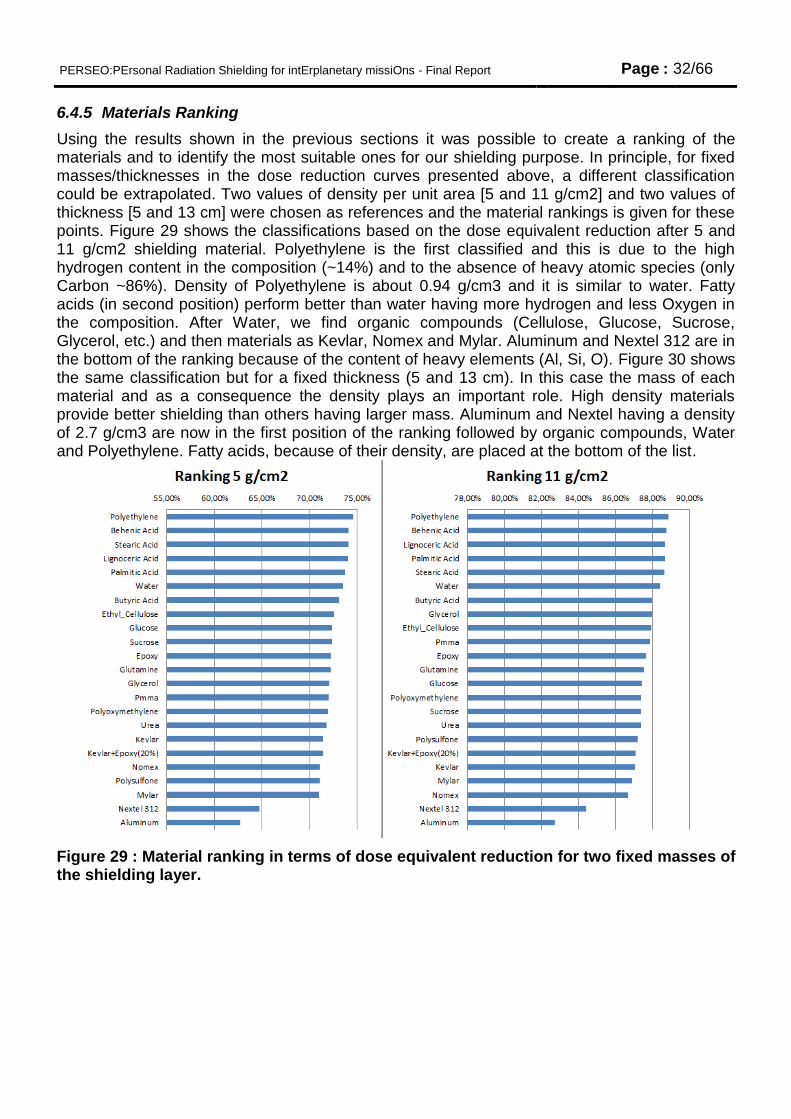
Using the results shown in the previous sections it was possible to create a ranking of the materials and to identify the most suitable ones for our shielding purpose. In principle, for fixed masses/thicknesses in the dose reduction curves presented above, a different classification could be extrapolated. Two values of density per unit area [5 and 11 g/cm2] and two values of thickness [5 and 13 cm] were chosen as references and the material rankings is given for these points. Figure 29 shows the classifications based on the dose equivalent reduction after 5 and 11 g/cm2 shielding material. Polyethylene is the first classified and this is due to the high hydrogen content in the composition (~14%) and to the absence of heavy atomic species (only Carbon ~86%). Density of Polyethylene is about 0.94 g/cm3 and it is similar to water. Fatty acids (in second position) perform better than water having more hydrogen and less Oxygen in the composition. After Water, we find organic compounds (Cellulose, Glucose, Sucrose, Glycerol, etc.) and then materials as Kevlar, Nomex and Mylar. Aluminum and Nextel 312 are in the bottom of the ranking because of the content of heavy elements (Al, Si, O). Figure 30 shows the same classification but for a fixed thickness (5 and 13 cm). In this case the mass of each material and as a consequence the density plays an important role. High density materials provide better shielding than others having larger mass. Aluminum and Nextel having a density of 2.7 g/cm3 are now in the first position of the ranking followed by organic compounds, Water and Polyethylene. Fatty acids, because of their density, are placed at the bottom of the list.
Figure 29 : Material ranking in terms of dose equivalent reduction for two fixed masses of the shielding layer.
PERSEO:PErsonal Radiation Shielding for intErplanetary missiOns - Final Report Page : 33/66
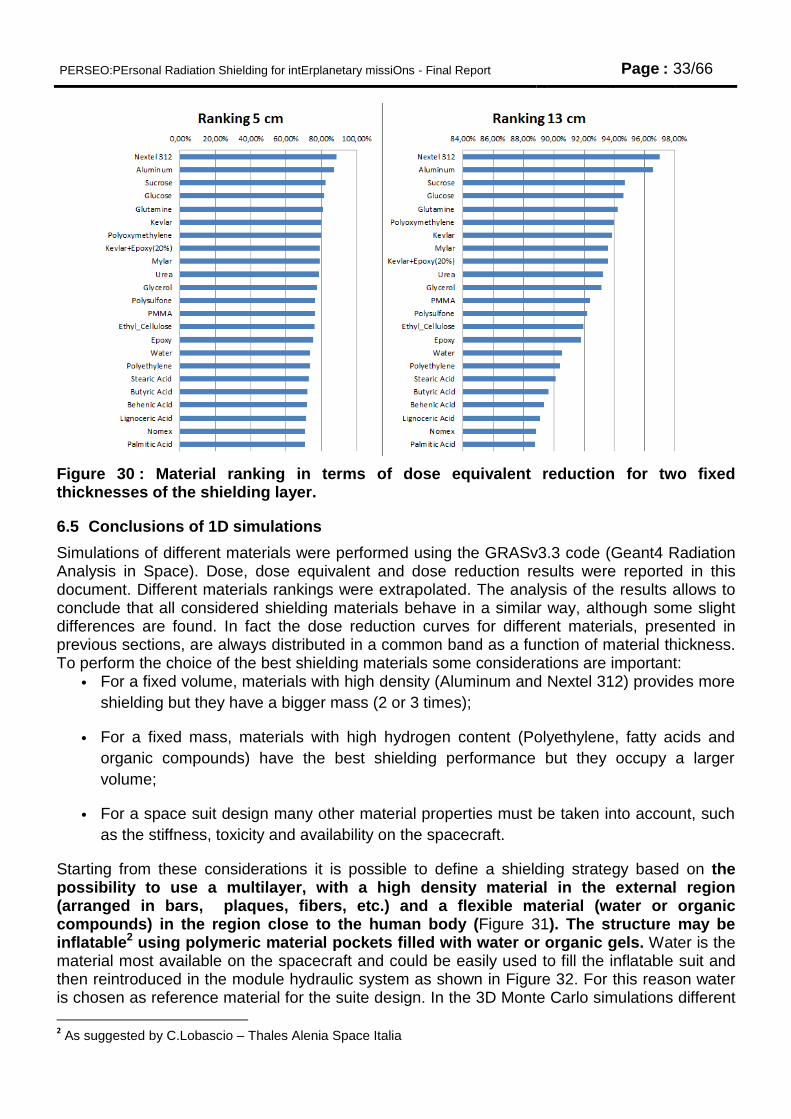
Figure 30 : Material ranking in terms of dose equivalent reduction for two fixed thicknesses of the shielding layer.
6.5 Conclusions of 1D simulations
Simulations of different materials were performed using the GRASv3.3 code (Geant4 Radiation Analysis in Space). Dose, dose equivalent and dose reduction results were reported in this document. Different materials rankings were extrapolated. The analysis of the results allows to conclude that all considered shielding materials behave in a similar way, although some slight differences are found. In fact the dose reduction curves for different materials, presented in previous sections, are always distributed in a common band as a function of material thickness. To perform the choice of the best shielding materials some considerations are important:
• For a fixed volume, materials with high density (Aluminum and Nextel 312) provides more
shielding but they have a bigger mass (2 or 3 times);
• For a fixed mass, materials with high hydrogen content (Polyethylene, fatty acids and
organic compounds) have the best shielding performance but they occupy a larger
volume;
• For a space suit design many other material properties must be taken into account, such
as the stiffness, toxicity and availability on the spacecraft.
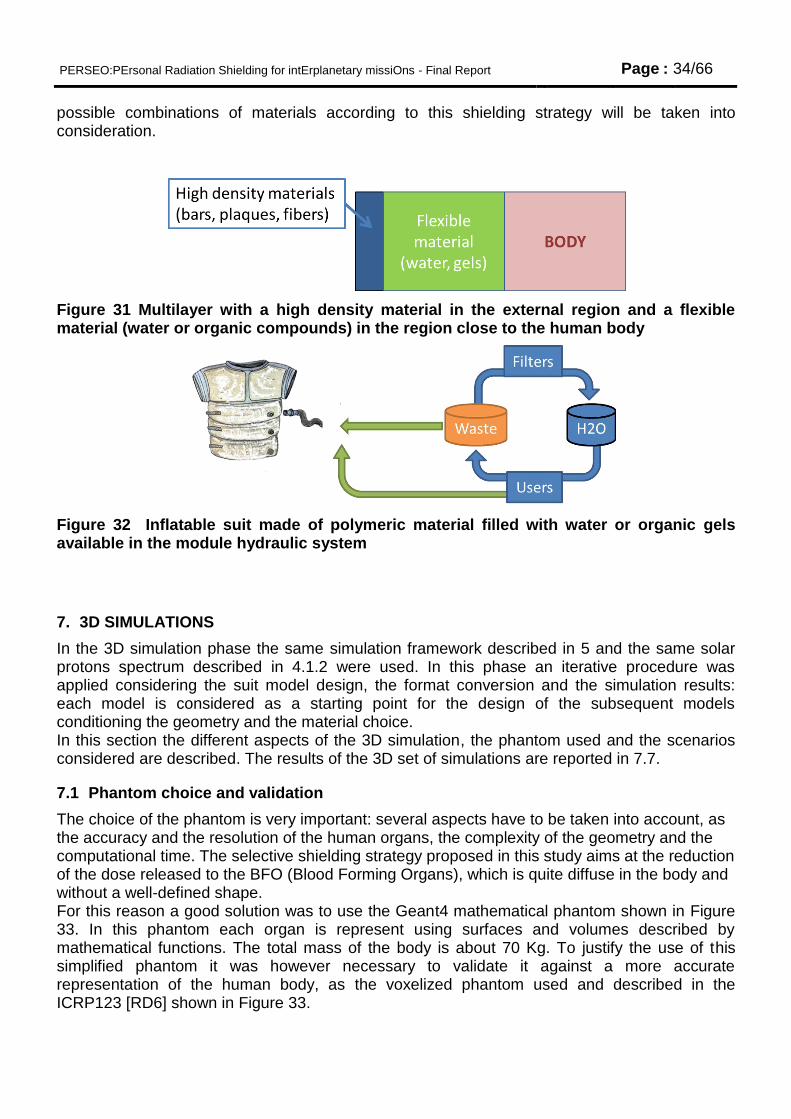
Starting from these considerations it is possible to define a shielding strategy based on the possibility to use a multilayer, with a high density material in the external region (arranged in bars, plaques, fibers, etc.) and a flexible material (water or organic compounds) in the region close to the human body (Figure 31). The structure may be inflatable2 using polymeric material pockets filled with water or organic gels. Water is the material most available on the spacecraft and could be easily used to fill the inflatable suit and then reintroduced in the module hydraulic system as shown in Figure 32. For this reason water is chosen as reference material for the suite design. In the 3D Monte Carlo simulations different
2 As suggested by C.Lobascio – Thales Alenia Space Italia
PERSEO:PErsonal Radiation Shielding for intErplanetary missiOns - Final Report Page : 34/66
possible combinations of materials according to this shielding strategy will be taken into consideration.
Figure 31 Multilayer with a high density material in the external region and a flexible material (water or organic compounds) in the region close to the human body
Figure 32 Inflatable suit made of polymeric material filled with water or organic gels available in the module hydraulic system
7. 3D SIMULATIONS
In the 3D simulation phase the same simulation framework described in 5 and the same solar protons spectrum described in 4.1.2 were used. In this phase an iterative procedure was applied considering the suit model design, the format conversion and the simulation results: each model is considered as a starting point for the design of the subsequent models conditioning the geometry and the material choice. In this section the different aspects of the 3D simulation, the phantom used and the scenarios considered are described. The results of the 3D set of simulations are reported in 7.7.
7.1 Phantom choice and validation
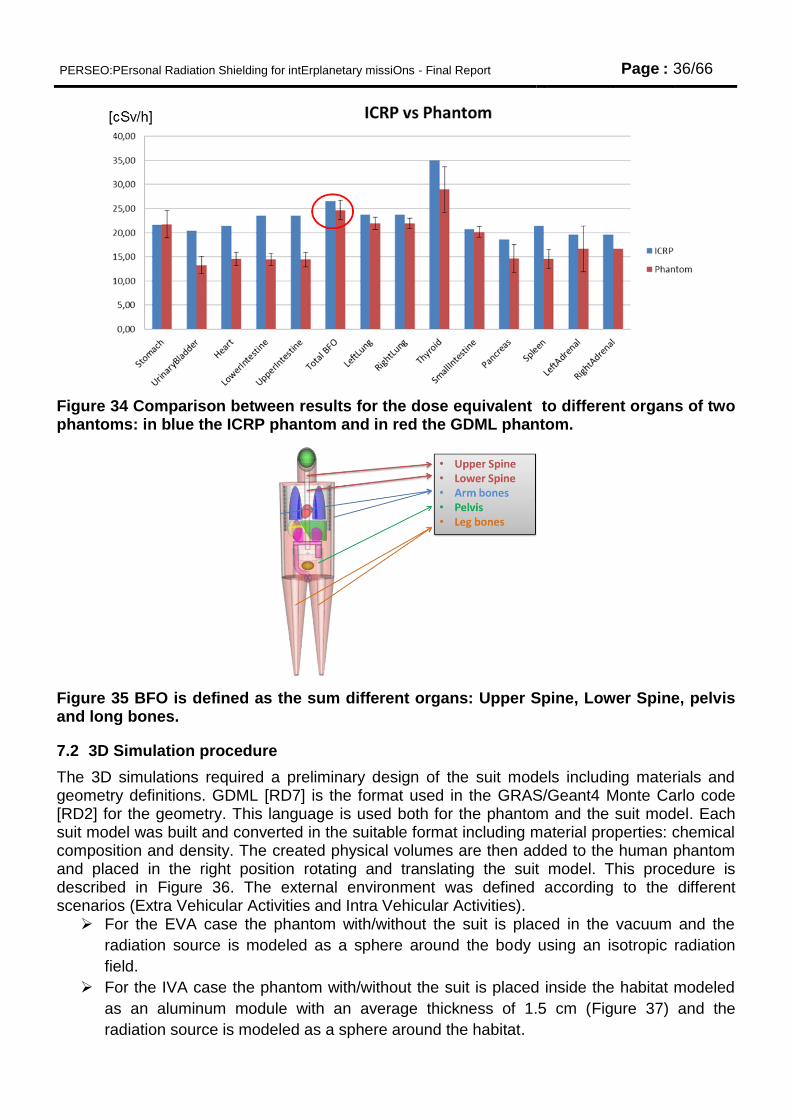
The choice of the phantom is very important: several aspects have to be taken into account, as the accuracy and the resolution of the human organs, the complexity of the geometry and the computational time. The selective shielding strategy proposed in this study aims at the reduction of the dose released to the BFO (Blood Forming Organs), which is quite diffuse in the body and without a well-defined shape. For this reason a good solution was to use the Geant4 mathematical phantom shown in Figure 33. In this phantom each organ is represent using surfaces and volumes described by mathematical functions. The total mass of the body is about 70 Kg. To justify the use of this simplified phantom it was however necessary to validate it against a more accurate representation of the human body, as the voxelized phantom used and described in the ICRP123 [RD6] shown in Figure 33.

PERSEO:PErsonal Radiation Shielding for intErplanetary missiOns - Final Report Page : 35/66
Figure 33 Geant4 GDML mathematical phantom on the left, ICRP123 voxelized phantom on the right.
The comparison between the two different models is shown in Figure 34, where we report the results of dose equivalent for each organ. The agreement of the two models is fulfilled except for some particular organs, whose representation in the mathematical phantom is not accurate enough (e.g. intestine, urinary bladder, etc.). As said, the specific target of this study is the BFO, and we can conclude from Figure 33 that the agreement between the two models is fully achieved in this case. For this reason the choice of using the mathematical phantom can be considered appropriate to estimate the physical quantities of interest with a good approximation, without increasing the computational cost (i.e. time and memory usage). The mathematical phantom in the original version do not explicitly include Blood Forming Organs as a category, and doses to different organs were added to get this information: Upper Spine, Lower Spine, Pelvis, Arms and Legs bones as shown in Figure 35. The dose [J/Kg] at BFO is estimated as the sum of the energy [J] released in these organs or tissues divided by the sum of their masses [Kg]. The same procedure is adopted for the computation of both dose and dose equivalent.
PERSEO:PErsonal Radiation Shielding for intErplanetary missiOns - Final Report Page : 36/66
Figure 34 Comparison between results for the dose equivalent to different organs of two phantoms: in blue the ICRP phantom and in red the GDML phantom.
Figure 35 BFO is defined as the sum different organs: Upper Spine, Lower Spine, pelvis and long bones.
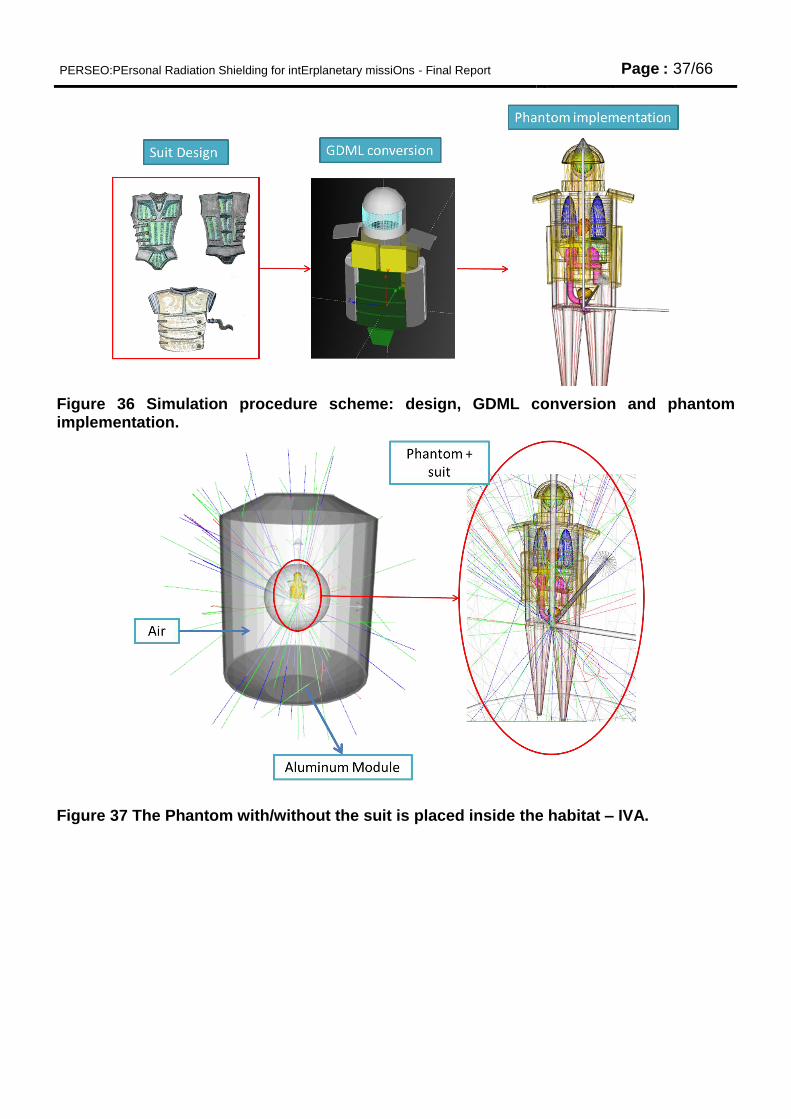
7.2 3D Simulation procedure
The 3D simulations required a preliminary design of the suit models including materials and geometry definitions. GDML [RD7] is the format used in the GRAS/Geant4 Monte Carlo code [RD2] for the geometry. This language is used both for the phantom and the suit model. Each suit model was built and converted in the suitable format including material properties: chemical composition and density. The created physical volumes are then added to the human phantom and placed in the right position rotating and translating the suit model. This procedure is described in Figure 36. The external environment was defined according to the different scenarios (Extra Vehicular Activities and Intra Vehicular Activities). For the EVA case the phantom with/without the suit is placed in the vacuum and the
radiation source is modeled as a sphere around the body using an isotropic radiation
field.
For the IVA case the phantom with/without the suit is placed inside the habitat modeled
as an aluminum module with an average thickness of 1.5 cm (Figure 37) and the
radiation source is modeled as a sphere around the habitat.
PERSEO:PErsonal Radiation Shielding for intErplanetary missiOns - Final Report Page : 37/66
Figure 36 Simulation procedure scheme: design, GDML conversion and phantom implementation.
Figure 37 The Phantom with/without the suit is placed inside the habitat – IVA.
PERSEO:PErsonal Radiation Shielding for intErplanetary missiOns - Final Report Page : 38/66
7.3 Dose reduction definition
Figure 38 Dose reduction definition for each organs in IVA and EVA scenarios
In order to compare the different shielding performances provided by the different studied suit models it is important to give a unique definition of the dose reduction quantity for the two different scenarios IVA and EVA.
For the IVA case the dose reduction is defined as :
For the EVA case the dose reduction is defined as :
Dose reductions are computed using the absorbed dose in Gy and the dose equivalent in Sv for each organ present in the human model as reported in Figure 38. Comparison among the different shielding models are performed using as parameter the BFO dose equivalent reduction, as reported in the summary of results in 7.7.1.
7.4 Solar Particle Event model and normalization factor
The solar proton spectrum is generated using the ESP average statistical model as described in details in paragraph 4.1.2. This model is useful to build an average spectrum over a given time interval (1 year in our case) using a 90% of confidence level. However, the integral fluence derived from this model is not the integral fluence of one solar particle event (SPE) which lasts only few days or weeks. To compute the integral fluence [protons/h] during a SPE the additional tool OMERE was used. OMERE is a freeware dedicated to space environment and radiation effects on electronic devices. This tool is developed by TRAD with the support of the CNES (Centre National d'Études Spatiales). OMERE computes the space environment and the radiation effects on electronic equipment in terms of dose, displacement damage, single event effect and solar cell degradation.
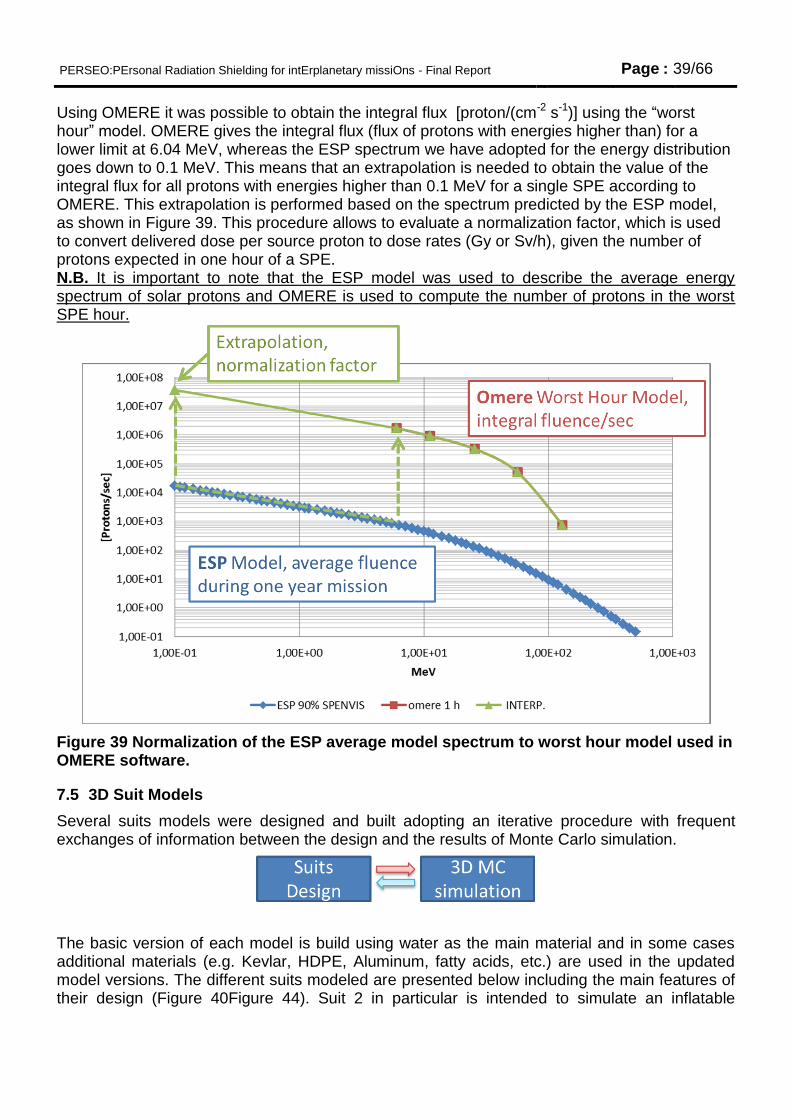
PERSEO:PErsonal Radiation Shielding for intErplanetary missiOns - Final Report Page : 39/66
Using OMERE it was possible to obtain the integral flux [proton/(cm-2 s-1)] using the “worst hour” model. OMERE gives the integral flux (flux of protons with energies higher than) for a lower limit at 6.04 MeV, whereas the ESP spectrum we have adopted for the energy distribution goes down to 0.1 MeV. This means that an extrapolation is needed to obtain the value of the integral flux for all protons with energies higher than 0.1 MeV for a single SPE according to OMERE. This extrapolation is performed based on the spectrum predicted by the ESP model, as shown in Figure 39. This procedure allows to evaluate a normalization factor, which is used to convert delivered dose per source proton to dose rates (Gy or Sv/h), given the number of protons expected in one hour of a SPE. N.B. It is important to note that the ESP model was used to describe the average energy spectrum of solar protons and OMERE is used to compute the number of protons in the worst SPE hour.
Figure 39 Normalization of the ESP average model spectrum to worst hour model used in OMERE software.
7.5 3D Suit Models
Several suits models were designed and built adopting an iterative procedure with frequent exchanges of information between the design and the results of Monte Carlo simulation.
The basic version of each model is build using water as the main material and in some cases additional materials (e.g. Kevlar, HDPE, Aluminum, fatty acids, etc.) are used in the updated model versions. The different suits modeled are presented below including the main features of their design (Figure 40Figure 44). Suit 2 in particular is intended to simulate an inflatable

PERSEO:PErsonal Radiation Shielding for intErplanetary missiOns - Final Report Page : 40/66
structure made of water filled tubes or pockets. Suit 1 models can also thought to be composed of inflatable elements with high density layers containing low density materials.
The Suit 1 model is made of water.
The total mass is 19 Kg.
The design includes a helmet, a half
cylinder placed on the spine, some
horizontal bars (pockets or bags) on
the back and on the abdomen, two
square pockets on the chest and
some lateral protections (Figure 40).
Figure 40 Suit 1 Model
The suit 1 version B model is made of
water.
The total mass is 35 Kg.
The design is based on Suit 1 but
several changes have been applied:
the helmet was removed, horizontal
bars have been increased in number
on the back and modified in
dimensions on the front, and
additional protections for the legs and
the arms were added, the cylinder on
the spine was extended (Figure 41).
Figure 41 Suit 1 version B model
PERSEO:PErsonal Radiation Shielding for intErplanetary missiOns - Final Report Page : 41/66
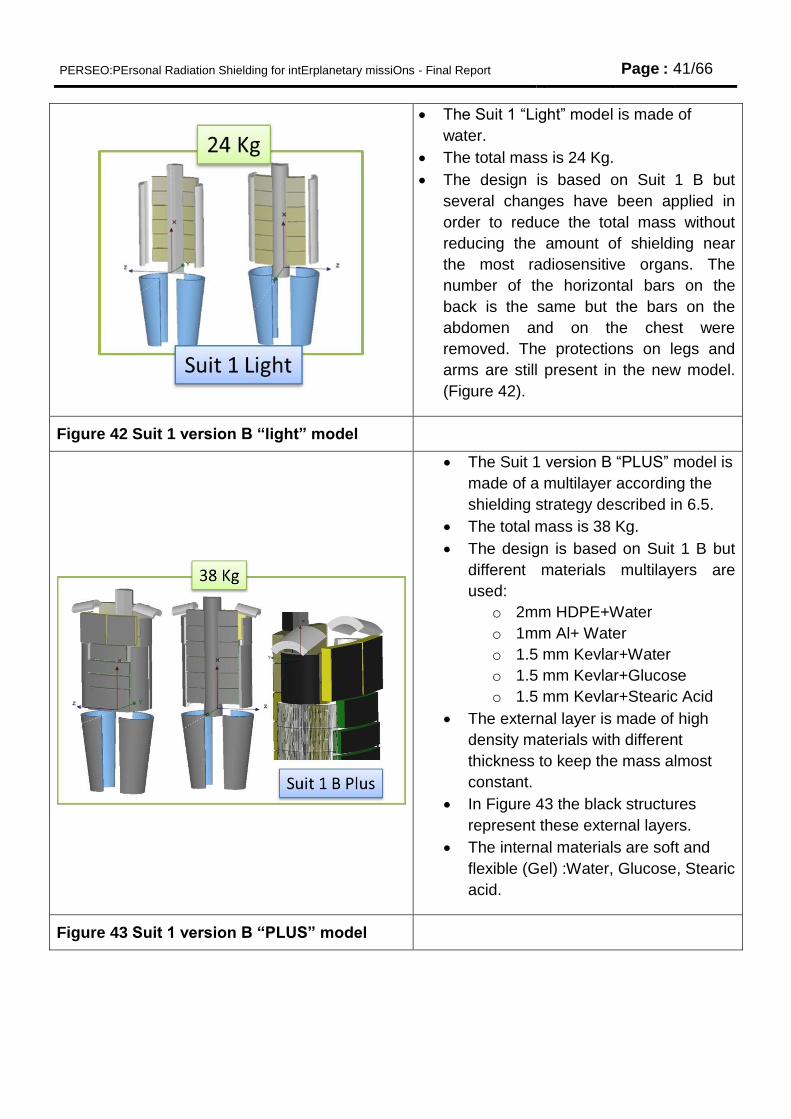
The Suit 1 “Light” model is made of
water.
The total mass is 24 Kg.
The design is based on Suit 1 B but
several changes have been applied in
order to reduce the total mass without
reducing the amount of shielding near
the most radiosensitive organs. The
number of the horizontal bars on the
back is the same but the bars on the
abdomen and on the chest were
removed. The protections on legs and
arms are still present in the new model.
(Figure 42).
Figure 42 Suit 1 version B “light” model
The Suit 1 version B “PLUS” model is
made of a multilayer according the
shielding strategy described in 6.5.
The total mass is 38 Kg.
The design is based on Suit 1 B but
different materials multilayers are
used:
o 2mm HDPE+Water
o 1mm Al+ Water
o 1.5 mm Kevlar+Water
o 1.5 mm Kevlar+Glucose
o 1.5 mm Kevlar+Stearic Acid
The external layer is made of high
density materials with different
thickness to keep the mass almost
constant.
In Figure 43 the black structures
represent these external layers.
The internal materials are soft and
flexible (Gel) :Water, Glucose, Stearic
acid.
Figure 43 Suit 1 version B “PLUS” model
PERSEO:PErsonal Radiation Shielding for intErplanetary missiOns - Final Report Page : 42/66
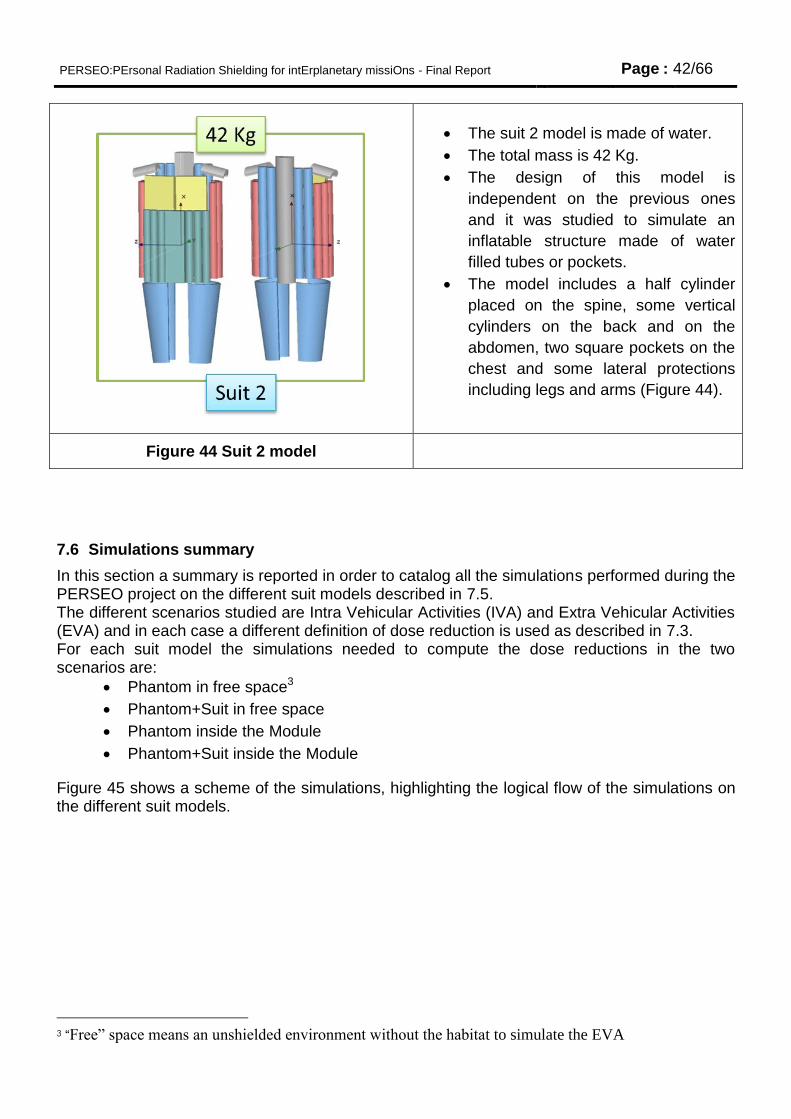
The suit 2 model is made of water.
The total mass is 42 Kg.
The design of this model is
independent on the previous ones
and it was studied to simulate an
inflatable structure made of water
filled tubes or pockets.
The model includes a half cylinder
placed on the spine, some vertical
cylinders on the back and on the
abdomen, two square pockets on the
chest and some lateral protections
including legs and arms (Figure 44).
Figure 44 Suit 2 model
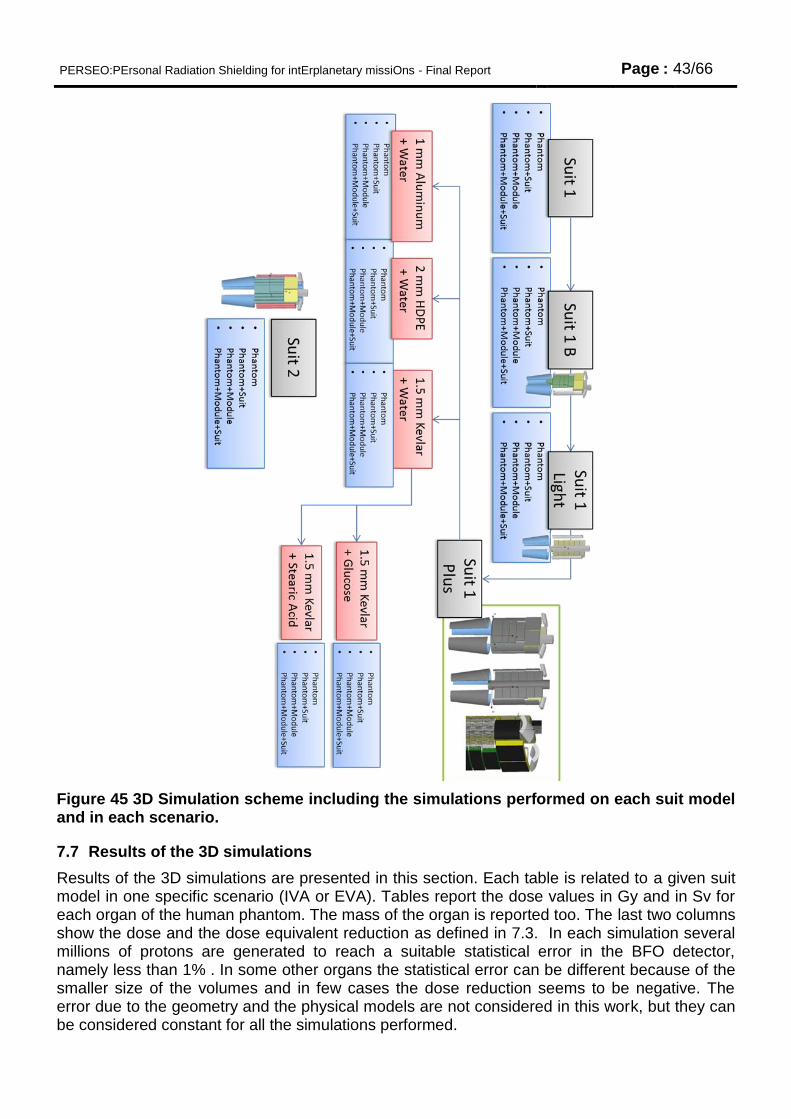
7.6 Simulations summary
In this section a summary is reported in order to catalog all the simulations performed during the PERSEO project on the different suit models described in 7.5. The different scenarios studied are Intra Vehicular Activities (IVA) and Extra Vehicular Activities (EVA) and in each case a different definition of dose reduction is used as described in 7.3. For each suit model the simulations needed to compute the dose reductions in the two scenarios are:
Phantom in free space3
Phantom+Suit in free space
Phantom inside the Module
Phantom+Suit inside the Module
Figure 45 shows a scheme of the simulations, highlighting the logical flow of the simulations on the different suit models.
3 “Fr ” p c v r w b t to simulate the EVA
PERSEO:PErsonal Radiation Shielding for intErplanetary missiOns - Final Report Page : 43/66
Figure 45 3D Simulation scheme including the simulations performed on each suit model and in each scenario.
7.7 Results of the 3D simulations
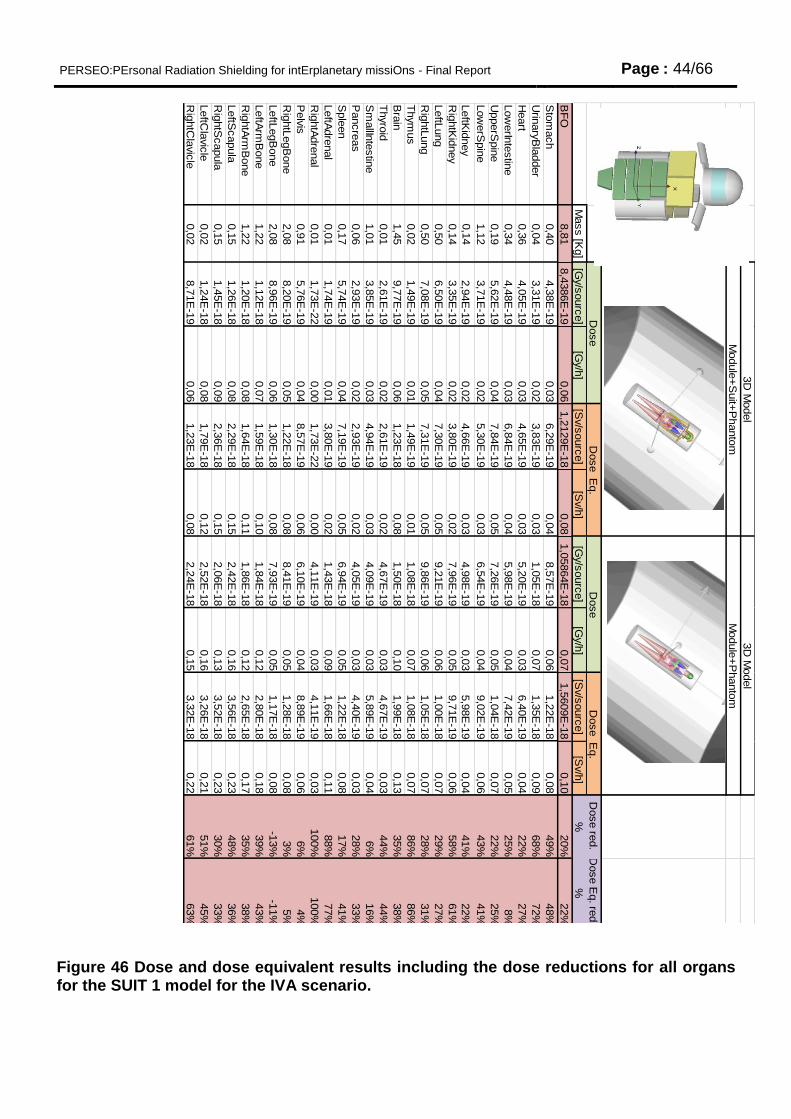
Results of the 3D simulations are presented in this section. Each table is related to a given suit model in one specific scenario (IVA or EVA). Tables report the dose values in Gy and in Sv for each organ of the human phantom. The mass of the organ is reported too. The last two columns show the dose and the dose equivalent reduction as defined in 7.3. In each simulation several millions of protons are generated to reach a suitable statistical error in the BFO detector, namely less than 1% . In some other organs the statistical error can be different because of the smaller size of the volumes and in few cases the dose reduction seems to be negative. The error due to the geometry and the physical models are not considered in this work, but they can be considered constant for all the simulations performed.
PERSEO:PErsonal Radiation Shielding for intErplanetary missiOns - Final Report Page : 44/66
Figure 46 Dose and dose equivalent results including the dose reductions for all organs for the SUIT 1 model for the IVA scenario.
SU
IT 1
Dose re
d.
Dose E
q. re
d.
Mass [K
g]
[Gy/s
ourc
e]
[Gy/h
][S
v/s
ourc
e]
[Sv/h
] [G
y/s
ourc
e]
[Gy/h
][S
v/s
ourc
e]
[Sv/h
]%
%
BF
O8,8
18,4
386E
-19
0,0
61,2
129E
-18
0,0
81,0
5864E
-18
0,0
71,5
609E
-18
0,1
020%
22%
Sto
mach
0,4
04,3
8E
-19
0,0
36,2
9E
-19
0,0
48,5
7E
-19
0,0
61,2
2E
-18
0,0
849%
48%
Urin
ary
Bla
dder
0,0
43,3
1E
-19
0,0
23,8
3E
-19
0,0
31,0
5E
-18
0,0
71,3
5E
-18
0,0
968%
72%
Heart
0,3
64,0
5E
-19
0,0
34,6
5E
-19
0,0
35,2
0E
-19
0,0
36,4
0E
-19
0,0
422%
27%
Low
erIn
testin
e0,3
44,4
8E
-19
0,0
36,8
4E
-19
0,0
45,9
8E
-19
0,0
47,4
2E
-19
0,0
525%
8%
UpperS
pin
e0,1
95,6
2E
-19
0,0
47,8
4E
-19
0,0
57,2
6E
-19
0,0
51,0
4E
-18
0,0
722%
25%
Low
erS
pin
e1,1
23,7
1E
-19
0,0
25,3
0E
-19
0,0
36,5
4E
-19
0,0
49,0
2E
-19
0,0
643%
41%
LeftK
idney
0,1
42,9
4E
-19
0,0
24,6
6E
-19
0,0
34,9
8E
-19
0,0
35,9
8E
-19
0,0
441%
22%
Rig
htK
idney
0,1
43,3
5E
-19
0,0
23,8
0E
-19
0,0
27,9
6E
-19
0,0
59,7
1E
-19
0,0
658%
61%
LeftL
ung
0,5
06,5
0E
-19
0,0
47,3
0E
-19
0,0
59,2
1E
-19
0,0
61,0
0E
-18
0,0
729%
27%
Rig
htL
ung
0,5
07,0
8E
-19
0,0
57,3
1E
-19
0,0
59,8
6E
-19
0,0
61,0
5E
-18
0,0
728%
31%
Thym
us
0,0
21,4
9E
-19
0,0
11,4
9E
-19
0,0
11,0
8E
-18
0,0
71,0
8E
-18
0,0
786%
86%
Bra
in1,4
59,7
7E
-19
0,0
61,2
3E
-18
0,0
81,5
0E
-18
0,1
01,9
9E
-18
0,1
335%
38%
Thyro
id0,0
12,6
1E
-19
0,0
22,6
1E
-19
0,0
24,6
7E
-19
0,0
34,6
7E
-19
0,0
344%
44%
Sm
allIn
testin
e1,0
13,8
5E
-19
0,0
34,9
4E
-19
0,0
34,0
9E
-19
0,0
35,8
9E
-19
0,0
46%
16%
Pancre
as
0,0
62,9
3E
-19
0,0
22,9
3E
-19
0,0
24,0
5E
-19
0,0
34,4
0E
-19
0,0
328%
33%
Sple
en
0,1
75,7
4E
-19
0,0
47,1
9E
-19
0,0
56,9
4E
-19
0,0
51,2
2E
-18
0,0
817%
41%
LeftA
dre
nal
0,0
11,7
4E
-19
0,0
13,8
0E
-19
0,0
21,4
3E
-18
0,0
91,6
6E
-18
0,1
188%
77%
Rig
htA
dre
nal
0,0
11,7
3E
-22
0,0
01,7
3E
-22
0,0
04,1
1E
-19
0,0
34,1
1E
-19
0,0
3100%
100%
Pelv
is0,9
15,7
6E
-19
0,0
48,5
7E
-19
0,0
66,1
0E
-19
0,0
48,8
9E
-19
0,0
66%
4%
Rig
htL
egB
one
2,0
88,2
0E
-19
0,0
51,2
2E
-18
0,0
88,4
1E
-19
0,0
51,2
8E
-18
0,0
83%
5%
LeftL
egB
one
2,0
88,9
6E
-19
0,0
61,3
0E
-18
0,0
87,9
3E
-19
0,0
51,1
7E
-18
0,0
8-1
3%
-11%
LeftA
rmB
one
1,2
21,1
2E
-18
0,0
71,5
9E
-18
0,1
01,8
4E
-18
0,1
22,8
0E
-18
0,1
839%
43%
Rig
htA
rmB
one
1,2
21,2
0E
-18
0,0
81,6
4E
-18
0,1
11,8
6E
-18
0,1
22,6
5E
-18
0,1
735%
38%
LeftS
capula
0,1
51,2
6E
-18
0,0
82,2
9E
-18
0,1
52,4
2E
-18
0,1
63,5
6E
-18
0,2
348%
36%
Rig
htS
capula
0,1
51,4
5E
-18
0,0
92,3
6E
-18
0,1
52,0
6E
-18
0,1
33,5
2E
-18
0,2
330%
33%
LeftC
lavic
le0,0
21,2
4E
-18
0,0
81,7
9E
-18
0,1
22,5
2E
-18
0,1
63,2
6E
-18
0,2
151%
45%
Rig
htC
lavic
le0,0
28,7
1E
-19
0,0
61,2
3E
-18
0,0
82,2
4E
-18
0,1
53,3
2E
-18
0,2
261%
63%
Module
+P
hanto
m
Dose
Dose E
q.
3D
Model
3D
Model
Dose
Dose E
q.
Module
+S
uit+
Phanto
m
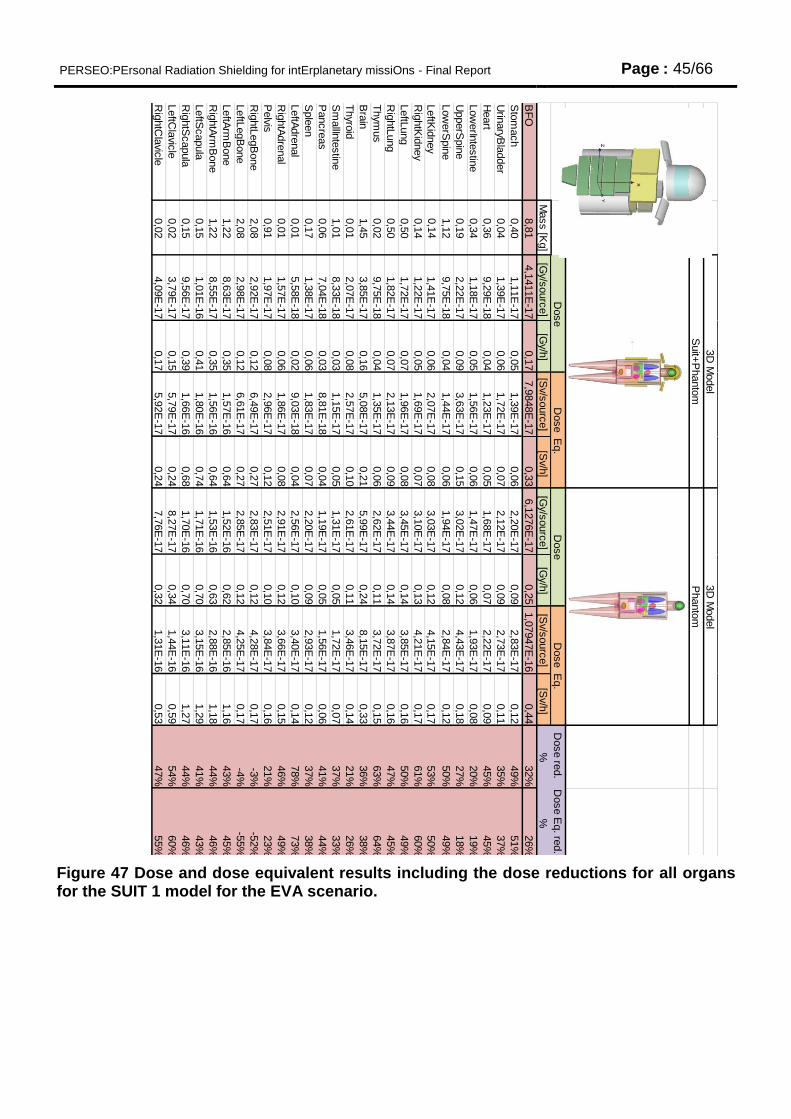
PERSEO:PErsonal Radiation Shielding for intErplanetary missiOns - Final Report Page : 45/66
Figure 47 Dose and dose equivalent results including the dose reductions for all organs for the SUIT 1 model for the EVA scenario.
SU
IT 1
Dose re
d.
Dose E
q. re
d.
Mass [K
g]
[Gy/s
ourc
e]
[Gy/h
][S
v/sourc
e]
[Sv/h
] [G
y/sourc
e]
[Gy/h
][S
v/sourc
e]
[Sv/h
]%
%
BF
O8,8
14,1
411E
-17
0,1
77,9
848E
-17
0,3
36,1
276E
-17
0,2
51,0
7947E
-16
0,4
432%
26%
Sto
mach
0,4
01,1
1E
-17
0,0
51,3
9E
-17
0,0
62,2
0E
-17
0,0
92,8
3E
-17
0,1
249%
51%
Urin
aryB
ladder
0,0
41,3
9E
-17
0,0
61,7
2E
-17
0,0
72,1
2E
-17
0,0
92,7
3E
-17
0,1
135%
37%
Heart
0,3
69,2
9E
-18
0,0
41,2
3E
-17
0,0
51,6
8E
-17
0,0
72,2
2E
-17
0,0
945%
45%
Low
erIn
testin
e0,3
41,1
8E
-17
0,0
51,5
6E
-17
0,0
61,4
7E
-17
0,0
61,9
3E
-17
0,0
820%
19%
UpperS
pin
e0,1
92,2
2E
-17
0,0
93,6
3E
-17
0,1
53,0
2E
-17
0,1
24,4
3E
-17
0,1
827%
18%
Low
erS
pin
e1,1
29,7
5E
-18
0,0
41,4
4E
-17
0,0
61,9
4E
-17
0,0
82,8
4E
-17
0,1
250%
49%
LeftK
idney
0,1
41,4
1E
-17
0,0
62,0
7E
-17
0,0
83,0
3E
-17
0,1
24,1
5E
-17
0,1
753%
50%
Rig
htK
idney
0,1
41,2
2E
-17
0,0
51,6
9E
-17
0,0
73,1
0E
-17
0,1
34,2
1E
-17
0,1
761%
60%
LeftL
ung
0,5
01,7
2E
-17
0,0
71,9
6E
-17
0,0
83,4
5E
-17
0,1
43,8
5E
-17
0,1
650%
49%
Rig
htL
ung
0,5
01,8
2E
-17
0,0
72,1
3E
-17
0,0
93,4
4E
-17
0,1
43,8
7E
-17
0,1
647%
45%
Thym
us
0,0
29,7
5E
-18
0,0
41,3
5E
-17
0,0
62,6
2E
-17
0,1
13,7
2E
-17
0,1
563%
64%
Bra
in1,4
53,8
5E
-17
0,1
65,0
8E
-17
0,2
15,9
9E
-17
0,2
48,1
5E
-17
0,3
336%
38%
Thyro
id0,0
12,0
7E
-17
0,0
82,5
7E
-17
0,1
02,6
1E
-17
0,1
13,4
6E
-17
0,1
421%
26%
Sm
allIn
testin
e1,0
18,3
3E
-18
0,0
31,1
5E
-17
0,0
51,3
1E
-17
0,0
51,7
2E
-17
0,0
737%
33%
Pancre
as
0,0
67,0
4E
-18
0,0
38,8
1E
-18
0,0
41,1
9E
-17
0,0
51,5
6E
-17
0,0
641%
44%
Sple
en
0,1
71,3
8E
-17
0,0
61,8
3E
-17
0,0
72,2
0E
-17
0,0
92,9
3E
-17
0,1
237%
38%
LeftA
dre
nal
0,0
15,5
8E
-18
0,0
29,0
3E
-18
0,0
42,5
6E
-17
0,1
03,4
0E
-17
0,1
478%
73%
Rig
htA
dre
nal
0,0
11,5
7E
-17
0,0
61,8
6E
-17
0,0
82,9
1E
-17
0,1
23,6
6E
-17
0,1
546%
49%
Pelvis
0,9
11,9
7E
-17
0,0
82,9
6E
-17
0,1
22,5
1E
-17
0,1
03,8
4E
-17
0,1
621%
23%
Rig
htL
egB
one
2,0
82,9
2E
-17
0,1
26,4
9E
-17
0,2
72,8
3E
-17
0,1
24,2
8E
-17
0,1
7-3
%-5
2%
LeftL
egB
one
2,0
82,9
8E
-17
0,1
26,6
1E
-17
0,2
72,8
5E
-17
0,1
24,2
5E
-17
0,1
7-4
%-5
5%
LeftA
rmB
one
1,2
28,6
3E
-17
0,3
51,5
7E
-16
0,6
41,5
2E
-16
0,6
22,8
5E
-16
1,1
643%
45%
Rig
htA
rmB
one
1,2
28,5
5E
-17
0,3
51,5
6E
-16
0,6
41,5
3E
-16
0,6
32,8
8E
-16
1,1
844%
46%
LeftS
capula
0,1
51,0
1E
-16
0,4
11,8
0E
-16
0,7
41,7
1E
-16
0,7
03,1
5E
-16
1,2
941%
43%
Rig
htS
capula
0,1
59,5
6E
-17
0,3
91,6
6E
-16
0,6
81,7
0E
-16
0,7
03,1
1E
-16
1,2
744%
46%
LeftC
lavic
le0,0
23,7
9E
-17
0,1
55,7
9E
-17
0,2
48,2
7E
-17
0,3
41,4
4E
-16
0,5
954%
60%
Rig
htC
lavic
le0,0
24,0
9E
-17
0,1
75,9
2E
-17
0,2
47,7
6E
-17
0,3
21,3
1E
-16
0,5
347%
55%
Dose
Suit+
Phanto
mP
hanto
m
Dose
Dose E
q.
Dose E
q.
3D
Model
3D
Model
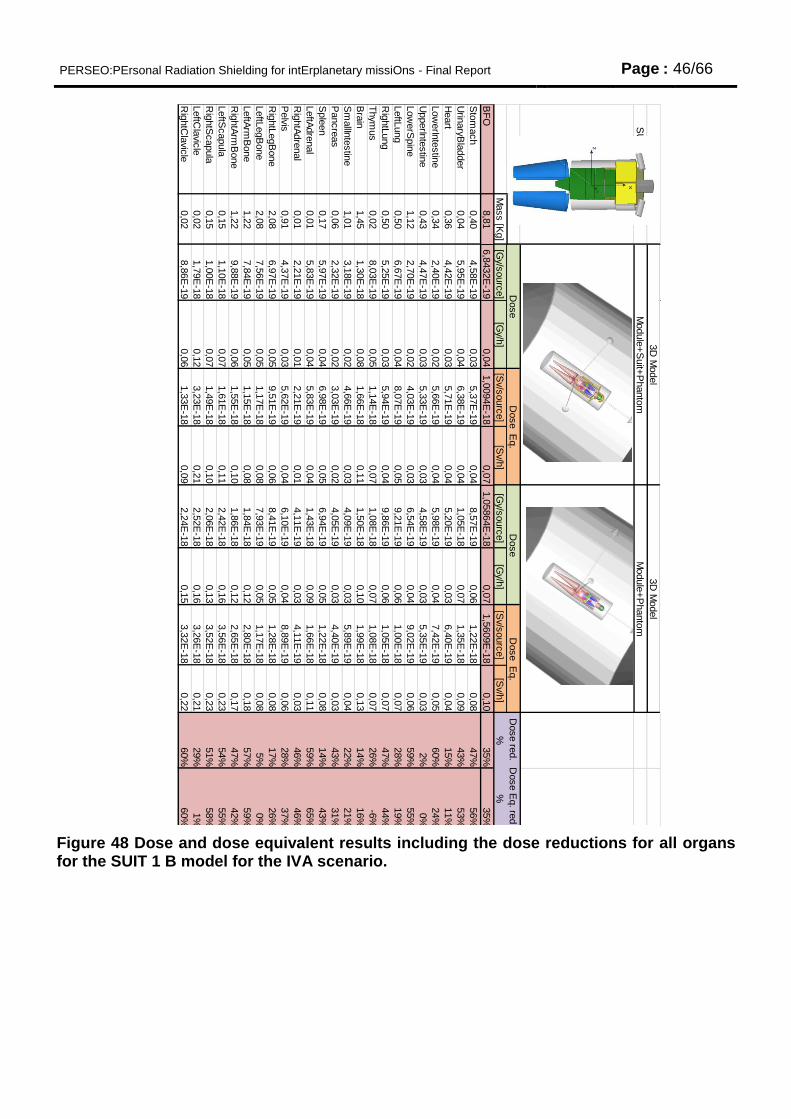
PERSEO:PErsonal Radiation Shielding for intErplanetary missiOns - Final Report Page : 46/66
Figure 48 Dose and dose equivalent results including the dose reductions for all organs for the SUIT 1 B model for the IVA scenario.
SU
IT 1
MV
Dose re
d.
Dose E
q. re
d.
Mass [K
g]
[Gy/s
ourc
e]
[Gy/h
][S
v/sourc
e]
[Sv/h
] [G
y/sourc
e]
[Gy/h
][S
v/sourc
e]
[Sv/h
]%
%
BF
O8,8
16,8
432E
-19
0,0
41,0
094E
-18
0,0
71,0
5864E
-18
0,0
71,5
609E
-18
0,1
035%
35%
Sto
mach
0,4
04,5
8E
-19
0,0
35,3
7E
-19
0,0
48,5
7E
-19
0,0
61,2
2E
-18
0,0
847%
56%
Urin
aryB
ladder
0,0
45,9
5E
-19
0,0
46,3
8E
-19
0,0
41,0
5E
-18
0,0
71,3
5E
-18
0,0
943%
53%
Heart
0,3
64,4
2E
-19
0,0
35,7
1E
-19
0,0
45,2
0E
-19
0,0
36,4
0E
-19
0,0
415%
11%
Low
erIn
testin
e0,3
42,4
0E
-19
0,0
25,6
6E
-19
0,0
45,9
8E
-19
0,0
47,4
2E
-19
0,0
560%
24%
UpperIn
testin
e0,4
34,4
7E
-19
0,0
35,3
3E
-19
0,0
34,5
8E
-19
0,0
35,3
5E
-19
0,0
32%
0%
Low
erS
pin
e1,1
22,7
0E
-19
0,0
24,0
3E
-19
0,0
36,5
4E
-19
0,0
49,0
2E
-19
0,0
659%
55%
LeftL
ung
0,5
06,6
7E
-19
0,0
48,0
7E
-19
0,0
59,2
1E
-19
0,0
61,0
0E
-18
0,0
728%
19%
Rig
htL
ung
0,5
05,2
5E
-19
0,0
35,9
4E
-19
0,0
49,8
6E
-19
0,0
61,0
5E
-18
0,0
747%
44%
Thym
us
0,0
28,0
3E
-19
0,0
51,1
4E
-18
0,0
71,0
8E
-18
0,0
71,0
8E
-18
0,0
726%
-6%
Bra
in1,4
51,3
0E
-18
0,0
81,6
6E
-18
0,1
11,5
0E
-18
0,1
01,9
9E
-18
0,1
314%
16%
Sm
allIn
testin
e1,0
13,1
8E
-19
0,0
24,6
6E
-19
0,0
34,0
9E
-19
0,0
35,8
9E
-19
0,0
422%
21%
Pancre
as
0,0
62,3
2E
-19
0,0
23,0
3E
-19
0,0
24,0
5E
-19
0,0
34,4
0E
-19
0,0
343%
31%
Sple
en
0,1
75,9
7E
-19
0,0
46,9
8E
-19
0,0
56,9
4E
-19
0,0
51,2
2E
-18
0,0
814%
43%
LeftA
dre
nal
0,0
15,8
3E
-19
0,0
45,8
3E
-19
0,0
41,4
3E
-18
0,0
91,6
6E
-18
0,1
159%
65%
Rig
htA
dre
nal
0,0
12,2
1E
-19
0,0
12,2
1E
-19
0,0
14,1
1E
-19
0,0
34,1
1E
-19
0,0
346%
46%
Pelvis
0,9
14,3
7E
-19
0,0
35,6
2E
-19
0,0
46,1
0E
-19
0,0
48,8
9E
-19
0,0
628%
37%
Rig
htL
egB
one
2,0
86,9
7E
-19
0,0
59,5
1E
-19
0,0
68,4
1E
-19
0,0
51,2
8E
-18
0,0
817%
26%
LeftL
egB
one
2,0
87,5
6E
-19
0,0
51,1
7E
-18
0,0
87,9
3E
-19
0,0
51,1
7E
-18
0,0
85%
0%
LeftA
rmB
one
1,2
27,8
4E
-19
0,0
51,1
5E
-18
0,0
81,8
4E
-18
0,1
22,8
0E
-18
0,1
857%
59%
Rig
htA
rmB
one
1,2
29,8
8E
-19
0,0
61,5
5E
-18
0,1
01,8
6E
-18
0,1
22,6
5E
-18
0,1
747%
42%
LeftS
capula
0,1
51,1
0E
-18
0,0
71,6
1E
-18
0,1
12,4
2E
-18
0,1
63,5
6E
-18
0,2
354%
55%
Rig
htS
capula
0,1
51,0
0E
-18
0,0
71,4
9E
-18
0,1
02,0
6E
-18
0,1
33,5
2E
-18
0,2
351%
58%
LeftC
lavic
le0,0
21,7
9E
-18
0,1
23,2
3E
-18
0,2
12,5
2E
-18
0,1
63,2
6E
-18
0,2
129%
1%
Rig
htC
lavic
le0,0
28,8
6E
-19
0,0
61,3
3E
-18
0,0
92,2
4E
-18
0,1
53,3
2E
-18
0,2
260%
60%
Dose
Dose
Dose E
q.
Module
+S
uit+
Phanto
mM
odule
+P
hanto
m
Dose E
q.
3D
Model
3D
Model
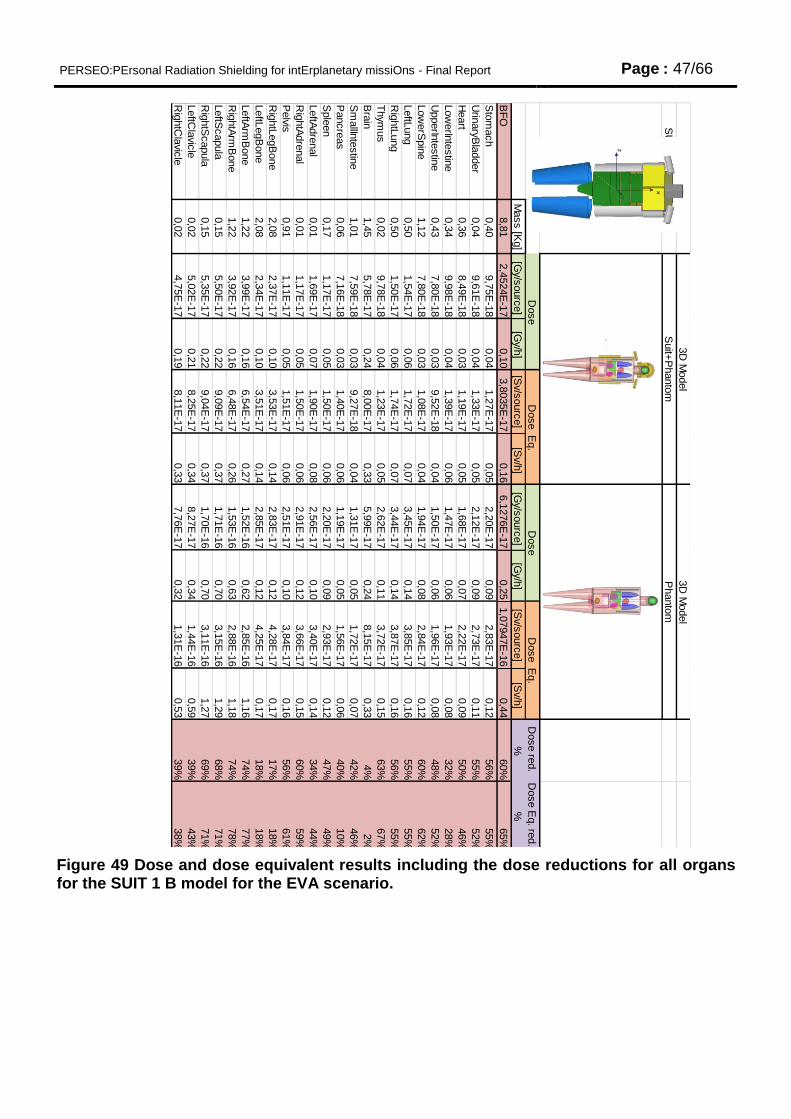
PERSEO:PErsonal Radiation Shielding for intErplanetary missiOns - Final Report Page : 47/66
Figure 49 Dose and dose equivalent results including the dose reductions for all organs for the SUIT 1 B model for the EVA scenario.
SU
IT 1
MV
Dose re
d.
Dose E
q. re
d.
Mass [K
g]
[Gy/s
ourc
e]
[Gy/h
][S
v/sourc
e]
[Sv/h
] [G
y/sourc
e]
[Gy/h
][S
v/sourc
e]
[Sv/h
]%
%
BF
O8,8
12,4
524E
-17
0,1
03,8
035E
-17
0,1
66,1
276E
-17
0,2
51,0
7947E
-16
0,4
460%
65%
Sto
mach
0,4
09,7
5E
-18
0,0
41,2
7E
-17
0,0
52,2
0E
-17
0,0
92,8
3E
-17
0,1
256%
55%
Urin
aryB
ladder
0,0
49,6
1E
-18
0,0
41,3
3E
-17
0,0
52,1
2E
-17
0,0
92,7
3E
-17
0,1
155%
52%
Heart
0,3
68,4
9E
-18
0,0
31,1
9E
-17
0,0
51,6
8E
-17
0,0
72,2
2E
-17
0,0
950%
46%
Low
erIn
testin
e0,3
49,9
8E
-18
0,0
41,3
9E
-17
0,0
61,4
7E
-17
0,0
61,9
3E
-17
0,0
832%
28%
UpperIn
testin
e0,4
37,8
0E
-18
0,0
39,5
2E
-18
0,0
41,5
0E
-17
0,0
61,9
6E
-17
0,0
848%
52%
Low
erS
pin
e1,1
27,8
0E
-18
0,0
31,0
8E
-17
0,0
41,9
4E
-17
0,0
82,8
4E
-17
0,1
260%
62%
LeftL
ung
0,5
01,5
4E
-17
0,0
61,7
2E
-17
0,0
73,4
5E
-17
0,1
43,8
5E
-17
0,1
655%
55%
Rig
htL
ung
0,5
01,5
0E
-17
0,0
61,7
4E
-17
0,0
73,4
4E
-17
0,1
43,8
7E
-17
0,1
656%
55%
Thym
us
0,0
29,7
8E
-18
0,0
41,2
3E
-17
0,0
52,6
2E
-17
0,1
13,7
2E
-17
0,1
563%
67%
Bra
in1,4
55,7
8E
-17
0,2
48,0
0E
-17
0,3
35,9
9E
-17
0,2
48,1
5E
-17
0,3
34%
2%
Sm
allIn
testin
e1,0
17,5
9E
-18
0,0
39,2
7E
-18
0,0
41,3
1E
-17
0,0
51,7
2E
-17
0,0
742%
46%
Pancre
as
0,0
67,1
6E
-18
0,0
31,4
0E
-17
0,0
61,1
9E
-17
0,0
51,5
6E
-17
0,0
640%
10%
Sple
en
0,1
71,1
7E
-17
0,0
51,5
0E
-17
0,0
62,2
0E
-17
0,0
92,9
3E
-17
0,1
247%
49%
LeftA
dre
nal
0,0
11,6
9E
-17
0,0
71,9
0E
-17
0,0
82,5
6E
-17
0,1
03,4
0E
-17
0,1
434%
44%
Rig
htA
dre
nal
0,0
11,1
7E
-17
0,0
51,5
0E
-17
0,0
62,9
1E
-17
0,1
23,6
6E
-17
0,1
560%
59%
Pelvis
0,9
11,1
1E
-17
0,0
51,5
1E
-17
0,0
62,5
1E
-17
0,1
03,8
4E
-17
0,1
656%
61%
Rig
htL
egB
one
2,0
82,3
7E
-17
0,1
03,5
3E
-17
0,1
42,8
3E
-17
0,1
24,2
8E
-17
0,1
717%
18%
LeftL
egB
one
2,0
82,3
4E
-17
0,1
03,5
1E
-17
0,1
42,8
5E
-17
0,1
24,2
5E
-17
0,1
718%
18%
LeftA
rmB
one
1,2
23,9
9E
-17
0,1
66,5
4E
-17
0,2
71,5
2E
-16
0,6
22,8
5E
-16
1,1
674%
77%
Rig
htA
rmB
one
1,2
23,9
2E
-17
0,1
66,4
8E
-17
0,2
61,5
3E
-16
0,6
32,8
8E
-16
1,1
874%
78%
LeftS
capula
0,1
55,5
0E
-17
0,2
29,0
9E
-17
0,3
71,7
1E
-16
0,7
03,1
5E
-16
1,2
968%
71%
Rig
htS
capula
0,1
55,3
5E
-17
0,2
29,0
4E
-17
0,3
71,7
0E
-16
0,7
03,1
1E
-16
1,2
769%
71%
LeftC
lavic
le0,0
25,0
2E
-17
0,2
18,2
5E
-17
0,3
48,2
7E
-17
0,3
41,4
4E
-16
0,5
939%
43%
Rig
htC
lavic
le0,0
24,7
5E
-17
0,1
98,1
1E
-17
0,3
37,7
6E
-17
0,3
21,3
1E
-16
0,5
339%
38%
3D
Model
Dose
Dose E
q.
3D
Model
Suit+
Phanto
mP
hanto
m
Dose
Dose E
q.
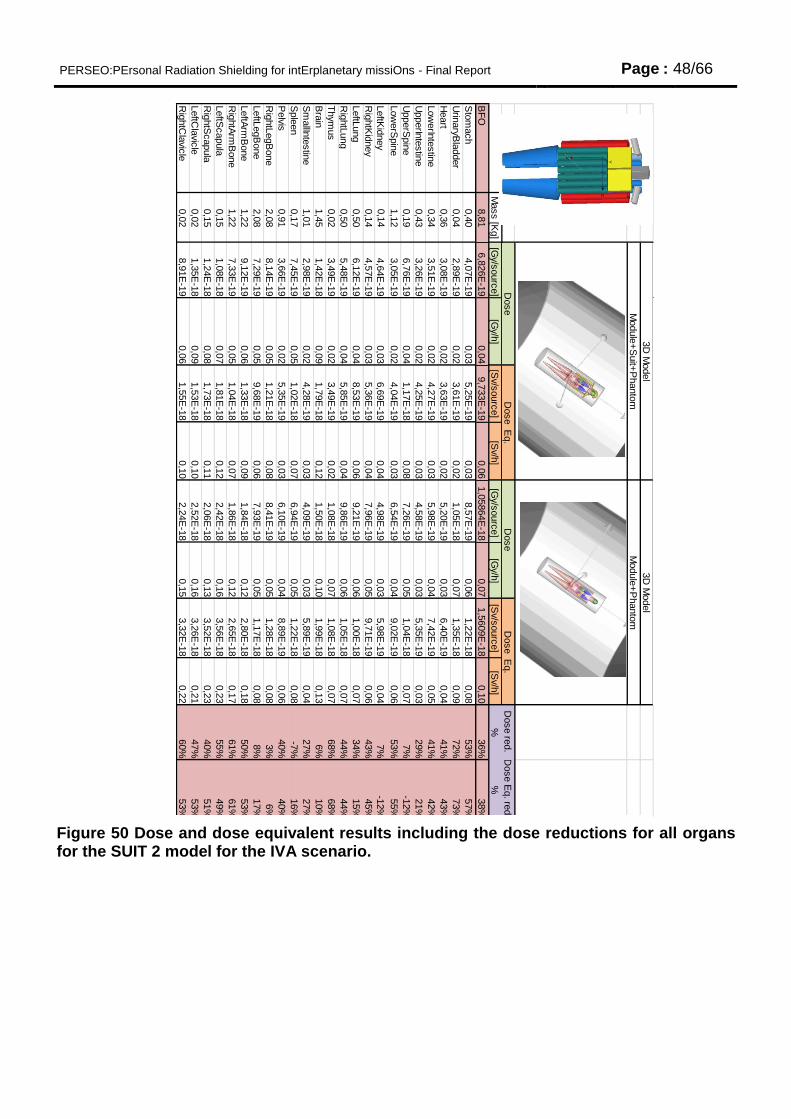
PERSEO:PErsonal Radiation Shielding for intErplanetary missiOns - Final Report Page : 48/66
Figure 50 Dose and dose equivalent results including the dose reductions for all organs for the SUIT 2 model for the IVA scenario.
SU
IT 2
Dose re
d.
Dose E
q. re
d.
Mass [K
g]
[Gy/s
ourc
e]
[Gy/h
][S
v/sourc
e]
[Sv/h
] [G
y/sourc
e]
[Gy/h
][S
v/sourc
e]
[Sv/h
]%
%
BF
O8,8
16,8
26E
-19
0,0
49,7
33E
-19
0,0
61,0
5864E
-18
0,0
71,5
609E
-18
0,1
036%
38%
Sto
mach
0,4
04,0
7E
-19
0,0
35,2
5E
-19
0,0
38,5
7E
-19
0,0
61,2
2E
-18
0,0
853%
57%
Urin
aryB
ladder
0,0
42,8
9E
-19
0,0
23,6
1E
-19
0,0
21,0
5E
-18
0,0
71,3
5E
-18
0,0
972%
73%
Heart
0,3
63,0
8E
-19
0,0
23,6
3E
-19
0,0
25,2
0E
-19
0,0
36,4
0E
-19
0,0
441%
43%
Low
erIn
testin
e0,3
43,5
1E
-19
0,0
24,2
7E
-19
0,0
35,9
8E
-19
0,0
47,4
2E
-19
0,0
541%
42%
UpperIn
testin
e0,4
33,2
6E
-19
0,0
24,2
5E
-19
0,0
34,5
8E
-19
0,0
35,3
5E
-19
0,0
329%
21%
UpperS
pin
e0,1
96,7
6E
-19
0,0
41,1
7E
-18
0,0
87,2
6E
-19
0,0
51,0
4E
-18
0,0
77%
-12%
Low
erS
pin
e1,1
23,0
5E
-19
0,0
24,0
4E
-19
0,0
36,5
4E
-19
0,0
49,0
2E
-19
0,0
653%
55%
LeftK
idney
0,1
44,6
4E
-19
0,0
36,6
9E
-19
0,0
44,9
8E
-19
0,0
35,9
8E
-19
0,0
47%
-12%
Rig
htK
idney
0,1
44,5
7E
-19
0,0
35,3
6E
-19
0,0
47,9
6E
-19
0,0
59,7
1E
-19
0,0
643%
45%
LeftL
ung
0,5
06,1
2E
-19
0,0
48,5
3E
-19
0,0
69,2
1E
-19
0,0
61,0
0E
-18
0,0
734%
15%
Rig
htL
ung
0,5
05,4
8E
-19
0,0
45,8
5E
-19
0,0
49,8
6E
-19
0,0
61,0
5E
-18
0,0
744%
44%
Thym
us
0,0
23,4
9E
-19
0,0
23,4
9E
-19
0,0
21,0
8E
-18
0,0
71,0
8E
-18
0,0
768%
68%
Bra
in1,4
51,4
2E
-18
0,0
91,7
9E
-18
0,1
21,5
0E
-18
0,1
01,9
9E
-18
0,1
36%
10%
Sm
allIn
testin
e1,0
12,9
8E
-19
0,0
24,2
8E
-19
0,0
34,0
9E
-19
0,0
35,8
9E
-19
0,0
427%
27%
Sple
en
0,1
77,4
5E
-19
0,0
51,0
2E
-18
0,0
76,9
4E
-19
0,0
51,2
2E
-18
0,0
8-7
%16%
Pelvis
0,9
13,6
6E
-19
0,0
25,3
5E
-19
0,0
36,1
0E
-19
0,0
48,8
9E
-19
0,0
640%
40%
Rig
htL
egB
one
2,0
88,1
4E
-19
0,0
51,2
1E
-18
0,0
88,4
1E
-19
0,0
51,2
8E
-18
0,0
83%
6%
LeftL
egB
one
2,0
87,2
9E
-19
0,0
59,6
8E
-19
0,0
67,9
3E
-19
0,0
51,1
7E
-18
0,0
88%
17%
LeftA
rmB
one
1,2
29,1
2E
-19
0,0
61,3
3E
-18
0,0
91,8
4E
-18
0,1
22,8
0E
-18
0,1
850%
53%
Rig
htA
rmB
one
1,2
27,3
3E
-19
0,0
51,0
4E
-18
0,0
71,8
6E
-18
0,1
22,6
5E
-18
0,1
761%
61%
LeftS
capula
0,1
51,0
8E
-18
0,0
71,8
1E
-18
0,1
22,4
2E
-18
0,1
63,5
6E
-18
0,2
355%
49%
Rig
htS
capula
0,1
51,2
4E
-18
0,0
81,7
3E
-18
0,1
12,0
6E
-18
0,1
33,5
2E
-18
0,2
340%
51%
LeftC
lavic
le0,0
21,3
5E
-18
0,0
91,5
3E
-18
0,1
02,5
2E
-18
0,1
63,2
6E
-18
0,2
147%
53%
Rig
htC
lavic
le0,0
28,9
1E
-19
0,0
61,5
5E
-18
0,1
02,2
4E
-18
0,1
53,3
2E
-18
0,2
260%
53%
Dose
Dose
Dose E
q.
Module
+S
uit+
Phanto
mM
odule
+P
hanto
m
Dose E
q.
3D
Model
3D
Model
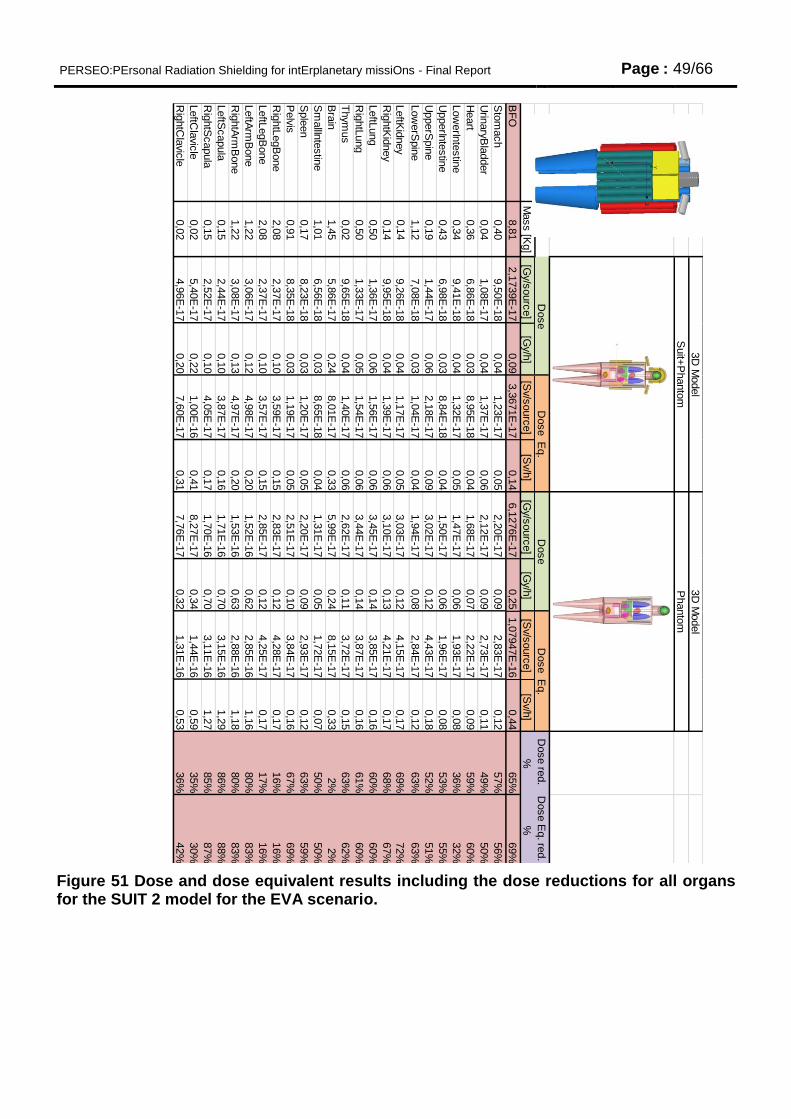
PERSEO:PErsonal Radiation Shielding for intErplanetary missiOns - Final Report Page : 49/66
Figure 51 Dose and dose equivalent results including the dose reductions for all organs for the SUIT 2 model for the EVA scenario.
SU
IT 2
Dose re
d.
Dose E
q. re
d.
Mass [K
g]
[Gy/s
ourc
e]
[Gy/h
][S
v/sourc
e]
[Sv/h
] [G
y/sourc
e]
[Gy/h
][S
v/sourc
e]
[Sv/h
]%
%
BF
O8,8
12,1
739E
-17
0,0
93,3
671E
-17
0,1
46,1
276E
-17
0,2
51,0
7947E
-16
0,4
465%
69%
Sto
mach
0,4
09,5
0E
-18
0,0
41,2
3E
-17
0,0
52,2
0E
-17
0,0
92,8
3E
-17
0,1
257%
56%
Urin
aryB
ladder
0,0
41,0
8E
-17
0,0
41,3
7E
-17
0,0
62,1
2E
-17
0,0
92,7
3E
-17
0,1
149%
50%
Heart
0,3
66,8
6E
-18
0,0
38,9
5E
-18
0,0
41,6
8E
-17
0,0
72,2
2E
-17
0,0
959%
60%
Low
erIn
testin
e0,3
49,4
1E
-18
0,0
41,3
2E
-17
0,0
51,4
7E
-17
0,0
61,9
3E
-17
0,0
836%
32%
UpperIn
testin
e0,4
36,9
8E
-18
0,0
38,8
4E
-18
0,0
41,5
0E
-17
0,0
61,9
6E
-17
0,0
853%
55%
UpperS
pin
e0,1
91,4
4E
-17
0,0
62,1
8E
-17
0,0
93,0
2E
-17
0,1
24,4
3E
-17
0,1
852%
51%
Low
erS
pin
e1,1
27,0
8E
-18
0,0
31,0
4E
-17
0,0
41,9
4E
-17
0,0
82,8
4E
-17
0,1
263%
63%
LeftK
idney
0,1
49,2
6E
-18
0,0
41,1
7E
-17
0,0
53,0
3E
-17
0,1
24,1
5E
-17
0,1
769%
72%
Rig
htK
idney
0,1
49,9
5E
-18
0,0
41,3
9E
-17
0,0
63,1
0E
-17
0,1
34,2
1E
-17
0,1
768%
67%
LeftL
ung
0,5
01,3
6E
-17
0,0
61,5
6E
-17
0,0
63,4
5E
-17
0,1
43,8
5E
-17
0,1
660%
60%
Rig
htL
ung
0,5
01,3
3E
-17
0,0
51,5
4E
-17
0,0
63,4
4E
-17
0,1
43,8
7E
-17
0,1
661%
60%
Thym
us
0,0
29,6
5E
-18
0,0
41,4
0E
-17
0,0
62,6
2E
-17
0,1
13,7
2E
-17
0,1
563%
62%
Bra
in1,4
55,8
6E
-17
0,2
48,0
1E
-17
0,3
35,9
9E
-17
0,2
48,1
5E
-17
0,3
32%
2%
Sm
allIn
testin
e1,0
16,5
6E
-18
0,0
38,6
5E
-18
0,0
41,3
1E
-17
0,0
51,7
2E
-17
0,0
750%
50%
Sple
en
0,1
78,2
3E
-18
0,0
31,2
0E
-17
0,0
52,2
0E
-17
0,0
92,9
3E
-17
0,1
263%
59%
Pelvis
0,9
18,3
5E
-18
0,0
31,1
9E
-17
0,0
52,5
1E
-17
0,1
03,8
4E
-17
0,1
667%
69%
Rig
htL
egB
one
2,0
82,3
7E
-17
0,1
03,5
9E
-17
0,1
52,8
3E
-17
0,1
24,2
8E
-17
0,1
716%
16%
LeftL
egB
one
2,0
82,3
7E
-17
0,1
03,5
7E
-17
0,1
52,8
5E
-17
0,1
24,2
5E
-17
0,1
717%
16%
LeftA
rmB
one
1,2
23,0
6E
-17
0,1
24,9
8E
-17
0,2
01,5
2E
-16
0,6
22,8
5E
-16
1,1
680%
83%
Rig
htA
rmB
one
1,2
23,0
8E
-17
0,1
34,9
7E
-17
0,2
01,5
3E
-16
0,6
32,8
8E
-16
1,1
880%
83%
LeftS
capula
0,1
52,4
4E
-17
0,1
03,8
7E
-17
0,1
61,7
1E
-16
0,7
03,1
5E
-16
1,2
986%
88%
Rig
htS
capula
0,1
52,5
2E
-17
0,1
04,0
5E
-17
0,1
71,7
0E
-16
0,7
03,1
1E
-16
1,2
785%
87%
LeftC
lavic
le0,0
25,4
0E
-17
0,2
21,0
0E
-16
0,4
18,2
7E
-17
0,3
41,4
4E
-16
0,5
935%
30%
Rig
htC
lavic
le0,0
24,9
6E
-17
0,2
07,6
0E
-17
0,3
17,7
6E
-17
0,3
21,3
1E
-16
0,5
336%
42%
3D
Model
Dose
Dose E
q.
3D
Model
Suit+
Phanto
mP
hanto
m
Dose
Dose E
q.
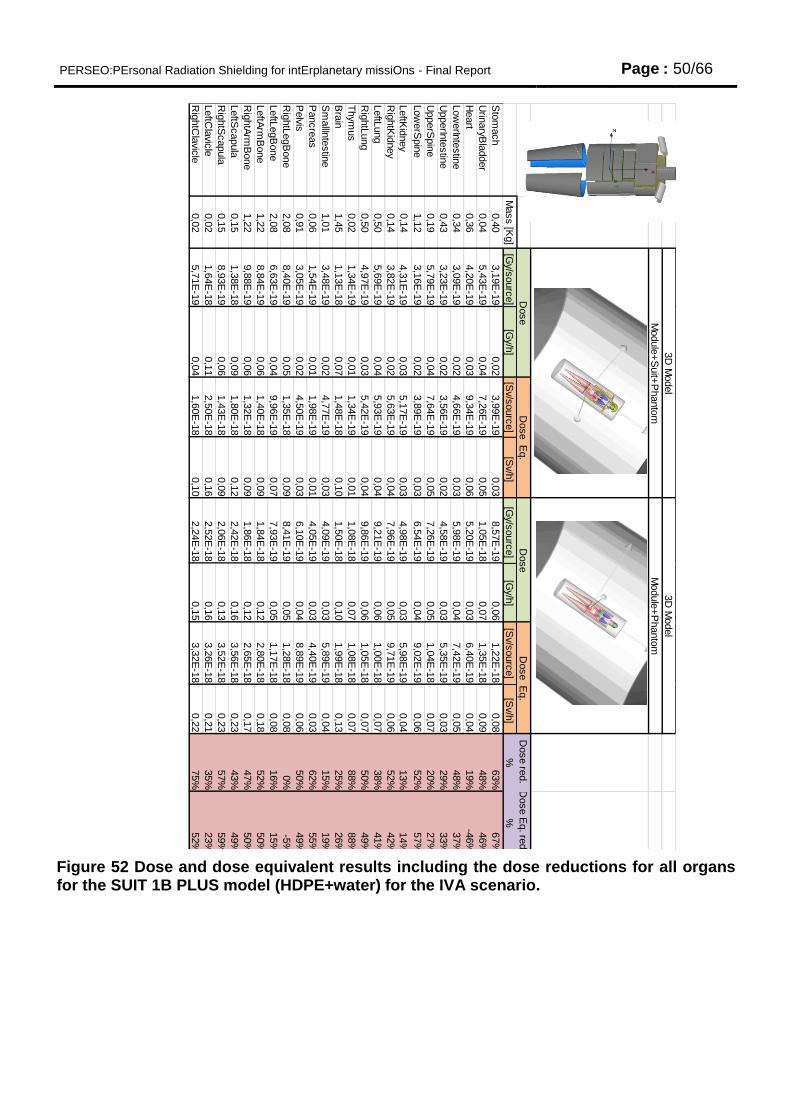
PERSEO:PErsonal Radiation Shielding for intErplanetary missiOns - Final Report Page : 50/66
Figure 52 Dose and dose equivalent results including the dose reductions for all organs for the SUIT 1B PLUS model (HDPE+water) for the IVA scenario.
SU
IT 1
MV
Dose re
d.
Dose E
q. re
d.
Mass [K
g]
[Gy/s
ourc
e]
[Gy/h
][S
v/sourc
e]
[Sv/h
] [G
y/sourc
e]
[Gy/h
][S
v/sourc
e]
[Sv/h
]%
%
Sto
mach
0,4
03,1
9E
-19
0,0
23,9
9E
-19
0,0
38,5
7E
-19
0,0
61,2
2E
-18
0,0
863%
67%
Urin
aryB
ladder
0,0
45,4
3E
-19
0,0
47,2
6E
-19
0,0
51,0
5E
-18
0,0
71,3
5E
-18
0,0
948%
46%
Heart
0,3
64,2
0E
-19
0,0
39,3
4E
-19
0,0
65,2
0E
-19
0,0
36,4
0E
-19
0,0
419%
-46%
Low
erIn
testin
e0,3
43,0
9E
-19
0,0
24,6
6E
-19
0,0
35,9
8E
-19
0,0
47,4
2E
-19
0,0
548%
37%
UpperIn
testin
e0,4
33,2
3E
-19
0,0
23,5
6E
-19
0,0
24,5
8E
-19
0,0
35,3
5E
-19
0,0
329%
33%
UpperS
pin
e0,1
95,7
9E
-19
0,0
47,6
4E
-19
0,0
57,2
6E
-19
0,0
51,0
4E
-18
0,0
720%
27%
Low
erS
pin
e1,1
23,1
6E
-19
0,0
23,8
9E
-19
0,0
36,5
4E
-19
0,0
49,0
2E
-19
0,0
652%
57%
LeftK
idney
0,1
44,3
1E
-19
0,0
35,1
7E
-19
0,0
34,9
8E
-19
0,0
35,9
8E
-19
0,0
413%
14%
Rig
htK
idney
0,1
43,8
2E
-19
0,0
25,6
3E
-19
0,0
47,9
6E
-19
0,0
59,7
1E
-19
0,0
652%
42%
LeftL
ung
0,5
05,6
9E
-19
0,0
45,9
3E
-19
0,0
49,2
1E
-19
0,0
61,0
0E
-18
0,0
738%
41%
Rig
htL
ung
0,5
04,9
7E
-19
0,0
35,4
2E
-19
0,0
49,8
6E
-19
0,0
61,0
5E
-18
0,0
750%
49%
Thym
us
0,0
21,3
4E
-19
0,0
11,3
4E
-19
0,0
11,0
8E
-18
0,0
71,0
8E
-18
0,0
788%
88%
Bra
in1,4
51,1
3E
-18
0,0
71,4
8E
-18
0,1
01,5
0E
-18
0,1
01,9
9E
-18
0,1
325%
26%
Sm
allIn
testin
e1,0
13,4
8E
-19
0,0
24,7
7E
-19
0,0
34,0
9E
-19
0,0
35,8
9E
-19
0,0
415%
19%
Pancre
as
0,0
61,5
4E
-19
0,0
11,9
8E
-19
0,0
14,0
5E
-19
0,0
34,4
0E
-19
0,0
362%
55%
Pelvis
0,9
13,0
5E
-19
0,0
24,5
0E
-19
0,0
36,1
0E
-19
0,0
48,8
9E
-19
0,0
650%
49%
Rig
htL
egB
one
2,0
88,4
0E
-19
0,0
51,3
5E
-18
0,0
98,4
1E
-19
0,0
51,2
8E
-18
0,0
80%
-5%
LeftL
egB
one
2,0
86,6
3E
-19
0,0
49,9
6E
-19
0,0
77,9
3E
-19
0,0
51,1
7E
-18
0,0
816%
15%
LeftA
rmB
one
1,2
28,8
4E
-19
0,0
61,4
0E
-18
0,0
91,8
4E
-18
0,1
22,8
0E
-18
0,1
852%
50%
Rig
htA
rmB
one
1,2
29,8
8E
-19
0,0
61,3
2E
-18
0,0
91,8
6E
-18
0,1
22,6
5E
-18
0,1
747%
50%
LeftS
capula
0,1
51,3
8E
-18
0,0
91,8
0E
-18
0,1
22,4
2E
-18
0,1
63,5
6E
-18
0,2
343%
49%
Rig
htS
capula
0,1
58,9
3E
-19
0,0
61,4
3E
-18
0,0
92,0
6E
-18
0,1
33,5
2E
-18
0,2
357%
59%
LeftC
lavic
le0,0
21,6
4E
-18
0,1
12,5
0E
-18
0,1
62,5
2E
-18
0,1
63,2
6E
-18
0,2
135%
23%
Rig
htC
lavic
le0,0
25,7
1E
-19
0,0
41,6
0E
-18
0,1
02,2
4E
-18
0,1
53,3
2E
-18
0,2
275%
52%
Dose
Dose
Dose E
q.
Module
+S
uit+
Phanto
mM
odule
+P
hanto
m
Dose E
q.
3D
Model
3D
Model
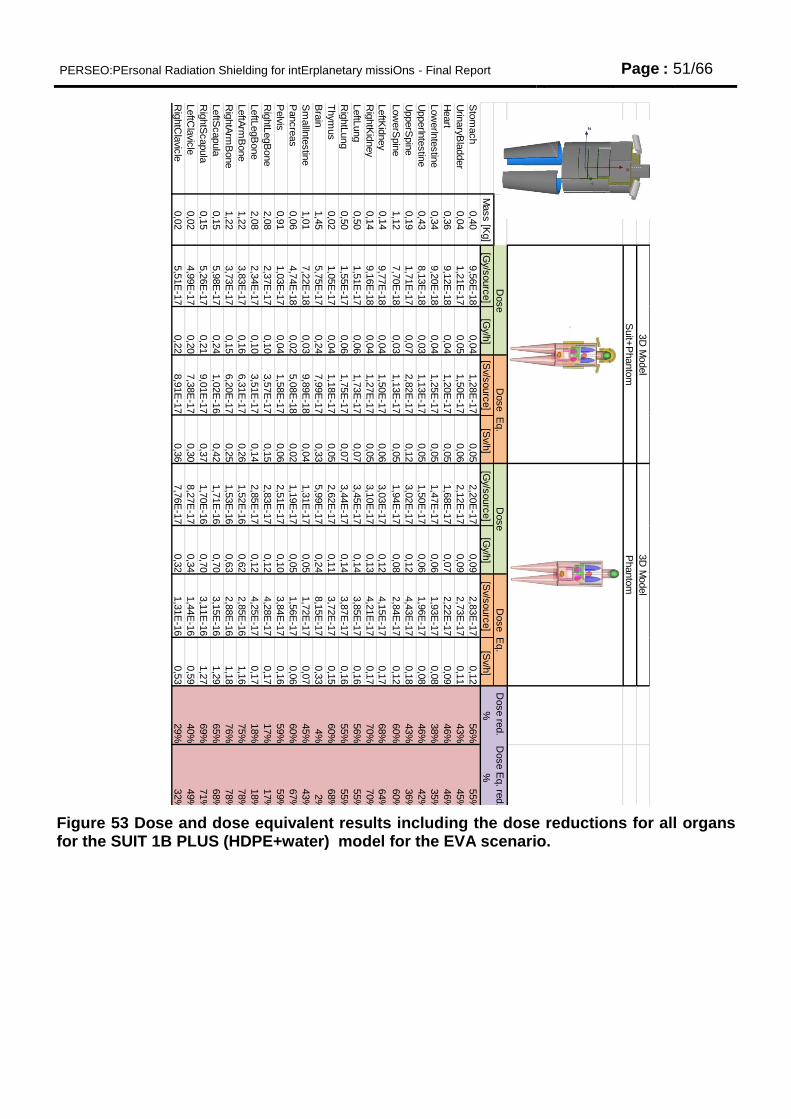
PERSEO:PErsonal Radiation Shielding for intErplanetary missiOns - Final Report Page : 51/66
Figure 53 Dose and dose equivalent results including the dose reductions for all organs for the SUIT 1B PLUS (HDPE+water) model for the EVA scenario.
SU
IT 1
MV
Dose re
d.
Dose E
q. re
d.
Mass [K
g]
[Gy/s
ourc
e]
[Gy/h
][S
v/sourc
e]
[Sv/h
] [G
y/sourc
e]
[Gy/h
][S
v/sourc
e]
[Sv/h
]%
%
Sto
mach
0,4
09,5
6E
-18
0,0
41,2
8E
-17
0,0
52,2
0E
-17
0,0
92,8
3E
-17
0,1
256%
55%
Urin
aryB
ladder
0,0
41,2
1E
-17
0,0
51,5
0E
-17
0,0
62,1
2E
-17
0,0
92,7
3E
-17
0,1
143%
45%
Heart
0,3
69,1
2E
-18
0,0
41,2
0E
-17
0,0
51,6
8E
-17
0,0
72,2
2E
-17
0,0
946%
46%
Low
erIn
testin
e0,3
49,2
0E
-18
0,0
41,2
5E
-17
0,0
51,4
7E
-17
0,0
61,9
3E
-17
0,0
838%
35%
UpperIn
testin
e0,4
38,1
3E
-18
0,0
31,1
3E
-17
0,0
51,5
0E
-17
0,0
61,9
6E
-17
0,0
846%
42%
UpperS
pin
e0,1
91,7
1E
-17
0,0
72,8
2E
-17
0,1
23,0
2E
-17
0,1
24,4
3E
-17
0,1
843%
36%
Low
erS
pin
e1,1
27,7
0E
-18
0,0
31,1
3E
-17
0,0
51,9
4E
-17
0,0
82,8
4E
-17
0,1
260%
60%
LeftK
idney
0,1
49,7
7E
-18
0,0
41,5
0E
-17
0,0
63,0
3E
-17
0,1
24,1
5E
-17
0,1
768%
64%
Rig
htK
idney
0,1
49,1
6E
-18
0,0
41,2
7E
-17
0,0
53,1
0E
-17
0,1
34,2
1E
-17
0,1
770%
70%
LeftL
ung
0,5
01,5
1E
-17
0,0
61,7
3E
-17
0,0
73,4
5E
-17
0,1
43,8
5E
-17
0,1
656%
55%
Rig
htL
ung
0,5
01,5
5E
-17
0,0
61,7
5E
-17
0,0
73,4
4E
-17
0,1
43,8
7E
-17
0,1
655%
55%
Thym
us
0,0
21,0
5E
-17
0,0
41,1
8E
-17
0,0
52,6
2E
-17
0,1
13,7
2E
-17
0,1
560%
68%
Bra
in1,4
55,7
5E
-17
0,2
47,9
9E
-17
0,3
35,9
9E
-17
0,2
48,1
5E
-17
0,3
34%
2%
Sm
allIn
testin
e1,0
17,2
2E
-18
0,0
39,8
9E
-18
0,0
41,3
1E
-17
0,0
51,7
2E
-17
0,0
745%
43%
Pancre
as
0,0
64,7
4E
-18
0,0
25,0
8E
-18
0,0
21,1
9E
-17
0,0
51,5
6E
-17
0,0
660%
67%
Pelvis
0,9
11,0
3E
-17
0,0
41,5
8E
-17
0,0
62,5
1E
-17
0,1
03,8
4E
-17
0,1
659%
59%
Rig
htL
egB
one
2,0
82,3
7E
-17
0,1
03,5
7E
-17
0,1
52,8
3E
-17
0,1
24,2
8E
-17
0,1
717%
17%
LeftL
egB
one
2,0
82,3
4E
-17
0,1
03,5
1E
-17
0,1
42,8
5E
-17
0,1
24,2
5E
-17
0,1
718%
18%
LeftA
rmB
one
1,2
23,8
3E
-17
0,1
66,3
1E
-17
0,2
61,5
2E
-16
0,6
22,8
5E
-16
1,1
675%
78%
Rig
htA
rmB
one
1,2
23,7
3E
-17
0,1
56,2
0E
-17
0,2
51,5
3E
-16
0,6
32,8
8E
-16
1,1
876%
78%
LeftS
capula
0,1
55,9
8E
-17
0,2
41,0
2E
-16
0,4
21,7
1E
-16
0,7
03,1
5E
-16
1,2
965%
68%
Rig
htS
capula
0,1
55,2
6E
-17
0,2
19,0
1E
-17
0,3
71,7
0E
-16
0,7
03,1
1E
-16
1,2
769%
71%
LeftC
lavic
le0,0
24,9
9E
-17
0,2
07,3
8E
-17
0,3
08,2
7E
-17
0,3
41,4
4E
-16
0,5
940%
49%
Rig
htC
lavic
le0,0
25,5
1E
-17
0,2
28,9
1E
-17
0,3
67,7
6E
-17
0,3
21,3
1E
-16
0,5
329%
32%
3D
Model
Dose
Dose E
q.
3D
Model
Suit+
Phanto
mP
hanto
m
Dose
Dose E
q.
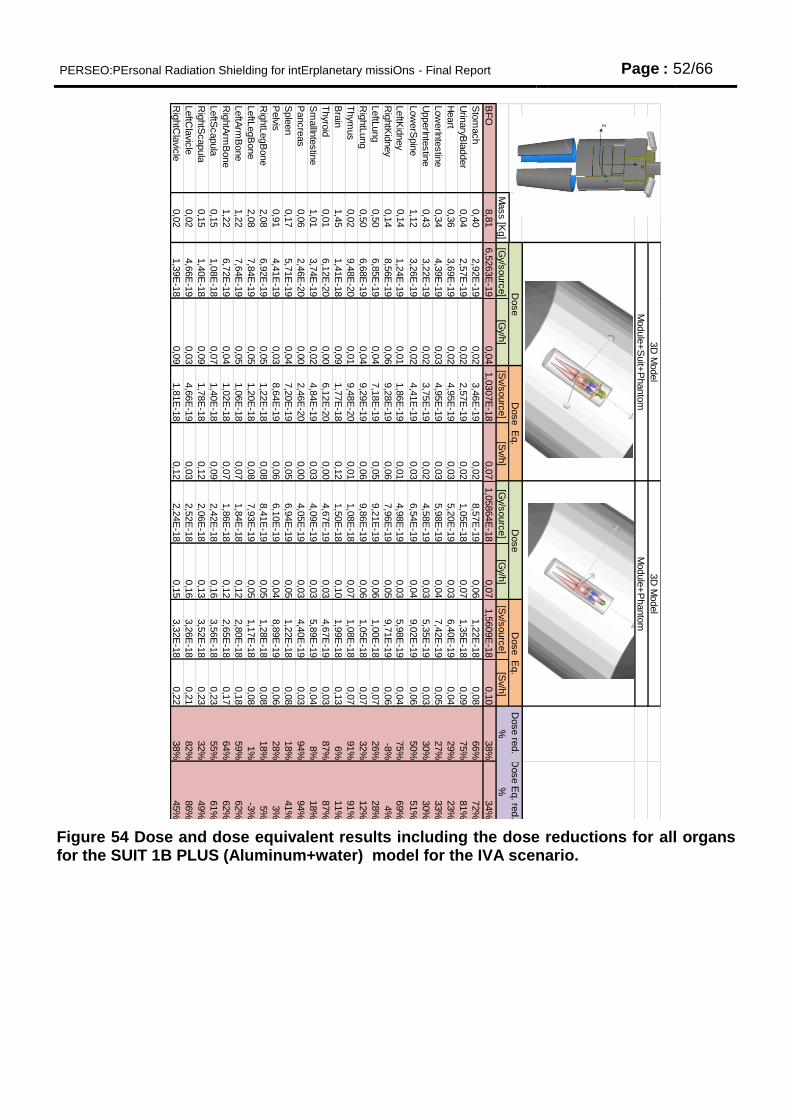
PERSEO:PErsonal Radiation Shielding for intErplanetary missiOns - Final Report Page : 52/66
Figure 54 Dose and dose equivalent results including the dose reductions for all organs for the SUIT 1B PLUS (Aluminum+water) model for the IVA scenario.
SU
IT 1
Dose re
d.
Dose E
q. re
d.
Mass [K
g]
[Gy/s
ourc
e]
[Gy/h
][S
v/sourc
e]
[Sv/h
] [G
y/sourc
e]
[Gy/h
][S
v/sourc
e]
[Sv/h
]%
%
BF
O8,8
16,5
263E
-19
0,0
41,0
307E
-18
0,0
71,0
5864E
-18
0,0
71,5
609E
-18
0,1
038%
34%
Sto
mach
0,4
02,9
2E
-19
0,0
23,4
6E
-19
0,0
28,5
7E
-19
0,0
61,2
2E
-18
0,0
866%
72%
Urin
aryB
ladder
0,0
42,5
7E
-19
0,0
22,5
7E
-19
0,0
21,0
5E
-18
0,0
71,3
5E
-18
0,0
975%
81%
Heart
0,3
63,6
9E
-19
0,0
24,9
5E
-19
0,0
35,2
0E
-19
0,0
36,4
0E
-19
0,0
429%
23%
Low
erIn
testin
e0,3
44,3
9E
-19
0,0
34,9
5E
-19
0,0
35,9
8E
-19
0,0
47,4
2E
-19
0,0
527%
33%
UpperIn
testin
e0,4
33,2
2E
-19
0,0
23,7
5E
-19
0,0
24,5
8E
-19
0,0
35,3
5E
-19
0,0
330%
30%
Low
erS
pin
e1,1
23,2
6E
-19
0,0
24,4
1E
-19
0,0
36,5
4E
-19
0,0
49,0
2E
-19
0,0
650%
51%
LeftK
idney
0,1
41,2
4E
-19
0,0
11,8
6E
-19
0,0
14,9
8E
-19
0,0
35,9
8E
-19
0,0
475%
69%
Rig
htK
idney
0,1
48,5
6E
-19
0,0
69,2
8E
-19
0,0
67,9
6E
-19
0,0
59,7
1E
-19
0,0
6-8
%4%
LeftL
ung
0,5
06,8
5E
-19
0,0
47,1
8E
-19
0,0
59,2
1E
-19
0,0
61,0
0E
-18
0,0
726%
28%
Rig
htL
ung
0,5
06,6
8E
-19
0,0
49,2
9E
-19
0,0
69,8
6E
-19
0,0
61,0
5E
-18
0,0
732%
12%
Thym
us
0,0
29,4
8E
-20
0,0
19,4
8E
-20
0,0
11,0
8E
-18
0,0
71,0
8E
-18
0,0
791%
91%
Bra
in1,4
51,4
1E
-18
0,0
91,7
7E
-18
0,1
21,5
0E
-18
0,1
01,9
9E
-18
0,1
36%
11%
Thyro
id0,0
16,1
2E
-20
0,0
06,1
2E
-20
0,0
04,6
7E
-19
0,0
34,6
7E
-19
0,0
387%
87%
Sm
allIn
testin
e1,0
13,7
4E
-19
0,0
24,8
4E
-19
0,0
34,0
9E
-19
0,0
35,8
9E
-19
0,0
48%
18%
Pancre
as
0,0
62,4
6E
-20
0,0
02,4
6E
-20
0,0
04,0
5E
-19
0,0
34,4
0E
-19
0,0
394%
94%
Sple
en
0,1
75,7
1E
-19
0,0
47,2
0E
-19
0,0
56,9
4E
-19
0,0
51,2
2E
-18
0,0
818%
41%
Pelvis
0,9
14,4
1E
-19
0,0
38,6
4E
-19
0,0
66,1
0E
-19
0,0
48,8
9E
-19
0,0
628%
3%
Rig
htL
egB
one
2,0
86,9
2E
-19
0,0
51,2
2E
-18
0,0
88,4
1E
-19
0,0
51,2
8E
-18
0,0
818%
5%
LeftL
egB
one
2,0
87,8
4E
-19
0,0
51,2
0E
-18
0,0
87,9
3E
-19
0,0
51,1
7E
-18
0,0
81%
-3%
LeftA
rmB
one
1,2
27,6
4E
-19
0,0
51,0
6E
-18
0,0
71,8
4E
-18
0,1
22,8
0E
-18
0,1
859%
62%
Rig
htA
rmB
one
1,2
26,7
2E
-19
0,0
41,0
2E
-18
0,0
71,8
6E
-18
0,1
22,6
5E
-18
0,1
764%
62%
LeftS
capula
0,1
51,0
8E
-18
0,0
71,4
0E
-18
0,0
92,4
2E
-18
0,1
63,5
6E
-18
0,2
355%
61%
Rig
htS
capula
0,1
51,4
0E
-18
0,0
91,7
8E
-18
0,1
22,0
6E
-18
0,1
33,5
2E
-18
0,2
332%
49%
LeftC
lavic
le0,0
24,6
6E
-19
0,0
34,6
6E
-19
0,0
32,5
2E
-18
0,1
63,2
6E
-18
0,2
182%
86%
Rig
htC
lavic
le0,0
21,3
9E
-18
0,0
91,8
1E
-18
0,1
22,2
4E
-18
0,1
53,3
2E
-18
0,2
238%
45%
Dose
Dose
Dose E
q.
Module
+S
uit+
Phanto
mM
odule
+P
hanto
m
Dose E
q.
3D
Model
3D
Model
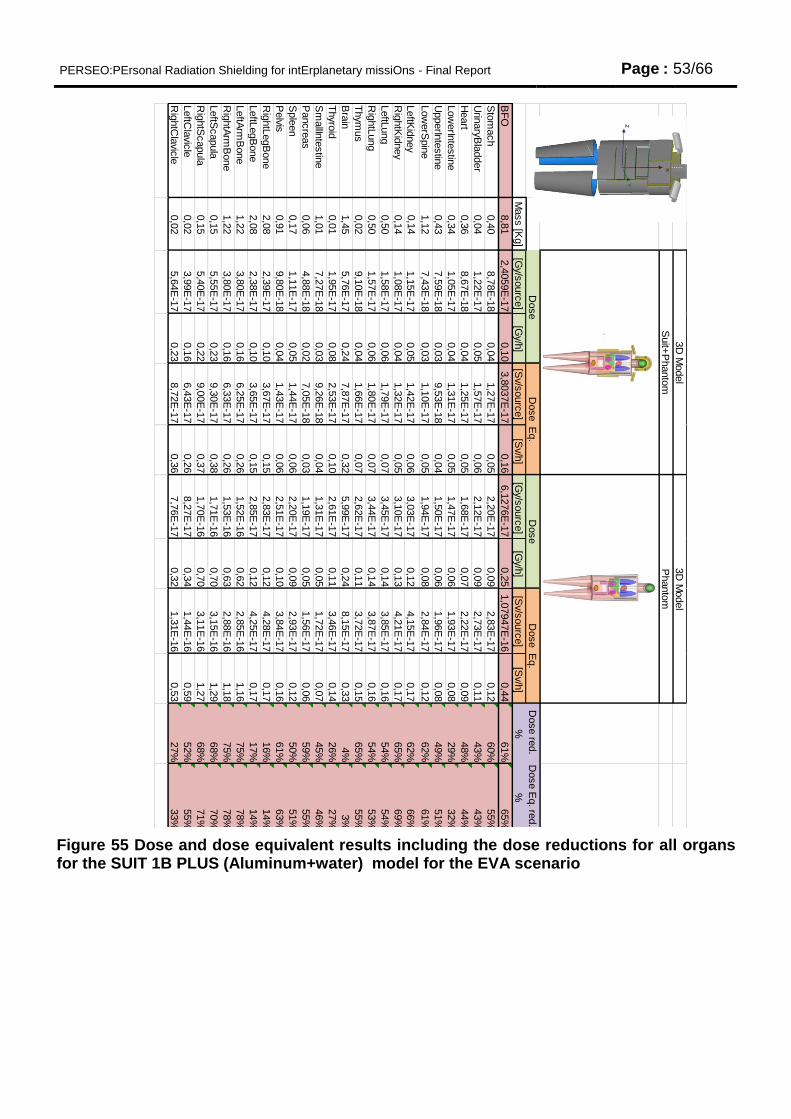
PERSEO:PErsonal Radiation Shielding for intErplanetary missiOns - Final Report Page : 53/66
Figure 55 Dose and dose equivalent results including the dose reductions for all organs for the SUIT 1B PLUS (Aluminum+water) model for the EVA scenario
SU
IT 1
Dose re
d.
Dose E
q. re
d.
Mass [K
g]
[Gy/s
ourc
e]
[Gy/h
][S
v/sourc
e]
[Sv/h
] [G
y/sourc
e]
[Gy/h
][S
v/sourc
e]
[Sv/h
]%
%
BF
O8,8
12,4
059E
-17
0,1
03,8
037E
-17
0,1
66,1
276E
-17
0,2
51,0
7947E
-16
0,4
461%
65%
Sto
mach
0,4
08,7
8E
-18
0,0
41,2
7E
-17
0,0
52,2
0E
-17
0,0
92,8
3E
-17
0,1
260%
55%
Urin
aryB
ladder
0,0
41,2
2E
-17
0,0
51,5
7E
-17
0,0
62,1
2E
-17
0,0
92,7
3E
-17
0,1
143%
43%
Heart
0,3
68,6
7E
-18
0,0
41,2
5E
-17
0,0
51,6
8E
-17
0,0
72,2
2E
-17
0,0
948%
44%
Low
erIn
testin
e0,3
41,0
5E
-17
0,0
41,3
1E
-17
0,0
51,4
7E
-17
0,0
61,9
3E
-17
0,0
829%
32%
UpperIn
testin
e0,4
37,5
9E
-18
0,0
39,5
3E
-18
0,0
41,5
0E
-17
0,0
61,9
6E
-17
0,0
849%
51%
Low
erS
pin
e1,1
27,4
3E
-18
0,0
31,1
0E
-17
0,0
51,9
4E
-17
0,0
82,8
4E
-17
0,1
262%
61%
LeftK
idney
0,1
41,1
5E
-17
0,0
51,4
2E
-17
0,0
63,0
3E
-17
0,1
24,1
5E
-17
0,1
762%
66%
Rig
htK
idney
0,1
41,0
8E
-17
0,0
41,3
2E
-17
0,0
53,1
0E
-17
0,1
34,2
1E
-17
0,1
765%
69%
LeftL
ung
0,5
01,5
8E
-17
0,0
61,7
9E
-17
0,0
73,4
5E
-17
0,1
43,8
5E
-17
0,1
654%
54%
Rig
htL
ung
0,5
01,5
7E
-17
0,0
61,8
0E
-17
0,0
73,4
4E
-17
0,1
43,8
7E
-17
0,1
654%
53%
Thym
us
0,0
29,1
0E
-18
0,0
41,6
6E
-17
0,0
72,6
2E
-17
0,1
13,7
2E
-17
0,1
565%
55%
Bra
in1,4
55,7
6E
-17
0,2
47,8
7E
-17
0,3
25,9
9E
-17
0,2
48,1
5E
-17
0,3
34%
3%
Thyro
id0,0
11,9
5E
-17
0,0
82,5
3E
-17
0,1
02,6
1E
-17
0,1
13,4
6E
-17
0,1
426%
27%
Sm
allIn
testin
e1,0
17,2
7E
-18
0,0
39,2
6E
-18
0,0
41,3
1E
-17
0,0
51,7
2E
-17
0,0
745%
46%
Pancre
as
0,0
64,8
8E
-18
0,0
27,0
5E
-18
0,0
31,1
9E
-17
0,0
51,5
6E
-17
0,0
659%
55%
Sple
en
0,1
71,1
1E
-17
0,0
51,4
4E
-17
0,0
62,2
0E
-17
0,0
92,9
3E
-17
0,1
250%
51%
Pelvis
0,9
19,8
0E
-18
0,0
41,4
3E
-17
0,0
62,5
1E
-17
0,1
03,8
4E
-17
0,1
661%
63%
Rig
htL
egB
one
2,0
82,3
9E
-17
0,1
03,6
7E
-17
0,1
52,8
3E
-17
0,1
24,2
8E
-17
0,1
716%
14%
LeftL
egB
one
2,0
82,3
8E
-17
0,1
03,6
5E
-17
0,1
52,8
5E
-17
0,1
24,2
5E
-17
0,1
717%
14%
LeftA
rmB
one
1,2
23,8
0E
-17
0,1
66,2
5E
-17
0,2
61,5
2E
-16
0,6
22,8
5E
-16
1,1
675%
78%
Rig
htA
rmB
one
1,2
23,8
0E
-17
0,1
66,3
3E
-17
0,2
61,5
3E
-16
0,6
32,8
8E
-16
1,1
875%
78%
LeftS
capula
0,1
55,5
5E
-17
0,2
39,3
0E
-17
0,3
81,7
1E
-16
0,7
03,1
5E
-16
1,2
968%
70%
Rig
htS
capula
0,1
55,4
0E
-17
0,2
29,0
0E
-17
0,3
71,7
0E
-16
0,7
03,1
1E
-16
1,2
768%
71%
LeftC
lavic
le0,0
23,9
9E
-17
0,1
66,4
3E
-17
0,2
68,2
7E
-17
0,3
41,4
4E
-16
0,5
952%
55%
Rig
htC
lavic
le0,0
25,6
4E
-17
0,2
38,7
2E
-17
0,3
67,7
6E
-17
0,3
21,3
1E
-16
0,5
327%
33%
3D
Model
Dose
Dose E
q.
3D
Model
Suit+
Phanto
mP
hanto
m
Dose
Dose E
q.
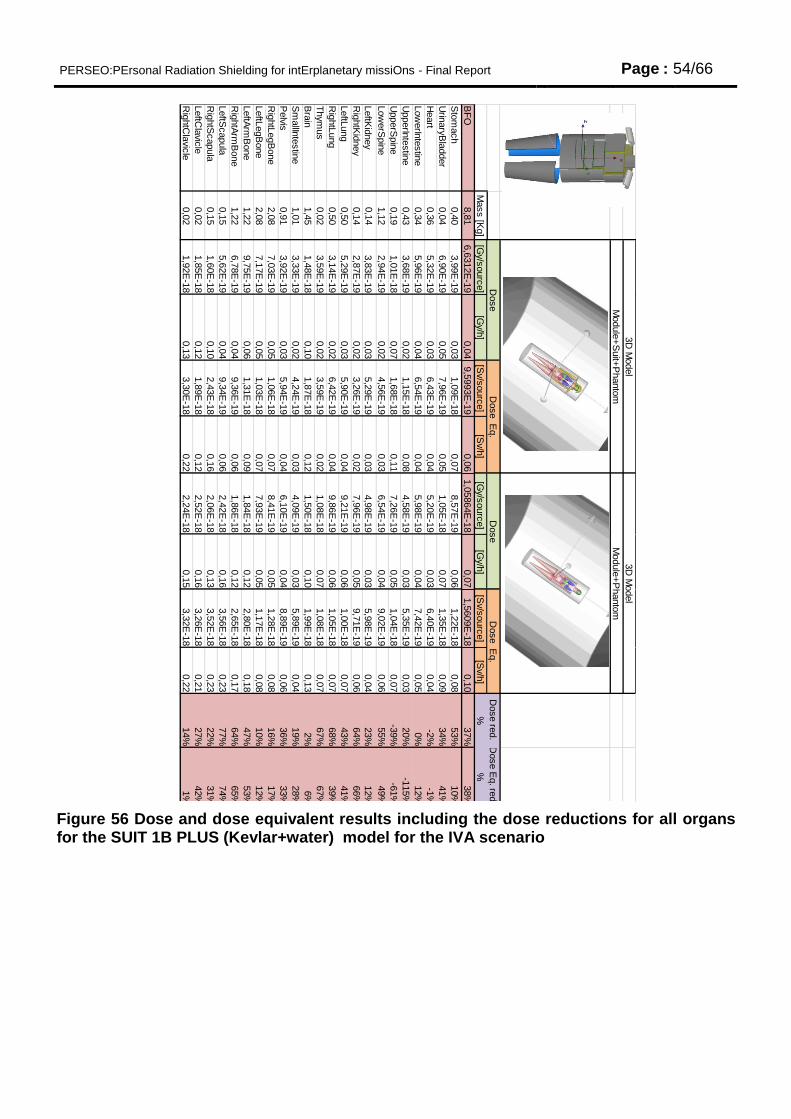
PERSEO:PErsonal Radiation Shielding for intErplanetary missiOns - Final Report Page : 54/66
Figure 56 Dose and dose equivalent results including the dose reductions for all organs for the SUIT 1B PLUS (Kevlar+water) model for the IVA scenario
SU
IT 1
Dose re
d.
Dose E
q. re
d.
Mass [K
g]
[Gy/s
ourc
e]
[Gy/h
][S
v/sourc
e]
[Sv/h
] [G
y/sourc
e]
[Gy/h
][S
v/sourc
e]
[Sv/h
]%
%
BF
O8,8
16,6
312E
-19
0,0
49,5
993E
-19
0,0
61,0
5864E
-18
0,0
71,5
609E
-18
0,1
037%
38%
Sto
mach
0,4
03,9
9E
-19
0,0
31,0
9E
-18
0,0
78,5
7E
-19
0,0
61,2
2E
-18
0,0
853%
10%
Urin
aryB
ladder
0,0
46,9
0E
-19
0,0
57,9
6E
-19
0,0
51,0
5E
-18
0,0
71,3
5E
-18
0,0
934%
41%
Heart
0,3
65,3
2E
-19
0,0
36,4
3E
-19
0,0
45,2
0E
-19
0,0
36,4
0E
-19
0,0
4-2
%-1
%
Low
erIn
testin
e0,3
45,9
6E
-19
0,0
46,5
4E
-19
0,0
45,9
8E
-19
0,0
47,4
2E
-19
0,0
50%
12%
UpperIn
testin
e0,4
33,6
8E
-19
0,0
21,1
5E
-18
0,0
84,5
8E
-19
0,0
35,3
5E
-19
0,0
320%
-115%
UpperS
pin
e0,1
91,0
1E
-18
0,0
71,6
8E
-18
0,1
17,2
6E
-19
0,0
51,0
4E
-18
0,0
7-3
9%
-61%
Low
erS
pin
e1,1
22,9
4E
-19
0,0
24,5
6E
-19
0,0
36,5
4E
-19
0,0
49,0
2E
-19
0,0
655%
49%
LeftK
idney
0,1
43,8
3E
-19
0,0
35,2
9E
-19
0,0
34,9
8E
-19
0,0
35,9
8E
-19
0,0
423%
12%
Rig
htK
idney
0,1
42,8
7E
-19
0,0
23,2
6E
-19
0,0
27,9
6E
-19
0,0
59,7
1E
-19
0,0
664%
66%
LeftL
ung
0,5
05,2
9E
-19
0,0
35,9
0E
-19
0,0
49,2
1E
-19
0,0
61,0
0E
-18
0,0
743%
41%
Rig
htL
ung
0,5
03,1
4E
-19
0,0
26,4
2E
-19
0,0
49,8
6E
-19
0,0
61,0
5E
-18
0,0
768%
39%
Thym
us
0,0
23,5
9E
-19
0,0
23,5
9E
-19
0,0
21,0
8E
-18
0,0
71,0
8E
-18
0,0
767%
67%
Bra
in1,4
51,4
8E
-18
0,1
01,8
7E
-18
0,1
21,5
0E
-18
0,1
01,9
9E
-18
0,1
32%
6%
Sm
allIn
testin
e1,0
13,3
3E
-19
0,0
24,2
4E
-19
0,0
34,0
9E
-19
0,0
35,8
9E
-19
0,0
419%
28%
Pelvis
0,9
13,9
2E
-19
0,0
35,9
4E
-19
0,0
46,1
0E
-19
0,0
48,8
9E
-19
0,0
636%
33%
Rig
htL
egB
one
2,0
87,0
3E
-19
0,0
51,0
6E
-18
0,0
78,4
1E
-19
0,0
51,2
8E
-18
0,0
816%
17%
LeftL
egB
one
2,0
87,1
7E
-19
0,0
51,0
3E
-18
0,0
77,9
3E
-19
0,0
51,1
7E
-18
0,0
810%
12%
LeftA
rmB
one
1,2
29,7
5E
-19
0,0
61,3
1E
-18
0,0
91,8
4E
-18
0,1
22,8
0E
-18
0,1
847%
53%
Rig
htA
rmB
one
1,2
26,7
8E
-19
0,0
49,3
6E
-19
0,0
61,8
6E
-18
0,1
22,6
5E
-18
0,1
764%
65%
LeftS
capula
0,1
55,6
2E
-19
0,0
49,3
4E
-19
0,0
62,4
2E
-18
0,1
63,5
6E
-18
0,2
377%
74%
Rig
htS
capula
0,1
51,6
0E
-18
0,1
02,4
3E
-18
0,1
62,0
6E
-18
0,1
33,5
2E
-18
0,2
322%
31%
LeftC
lavic
le0,0
21,8
5E
-18
0,1
21,8
9E
-18
0,1
22,5
2E
-18
0,1
63,2
6E
-18
0,2
127%
42%
Rig
htC
lavic
le0,0
21,9
2E
-18
0,1
33,3
0E
-18
0,2
22,2
4E
-18
0,1
53,3
2E
-18
0,2
214%
1%
Dose
Dose
Dose E
q.
Module
+S
uit+
Phanto
mM
odule
+P
hanto
m
Dose E
q.
3D
Model
3D
Model
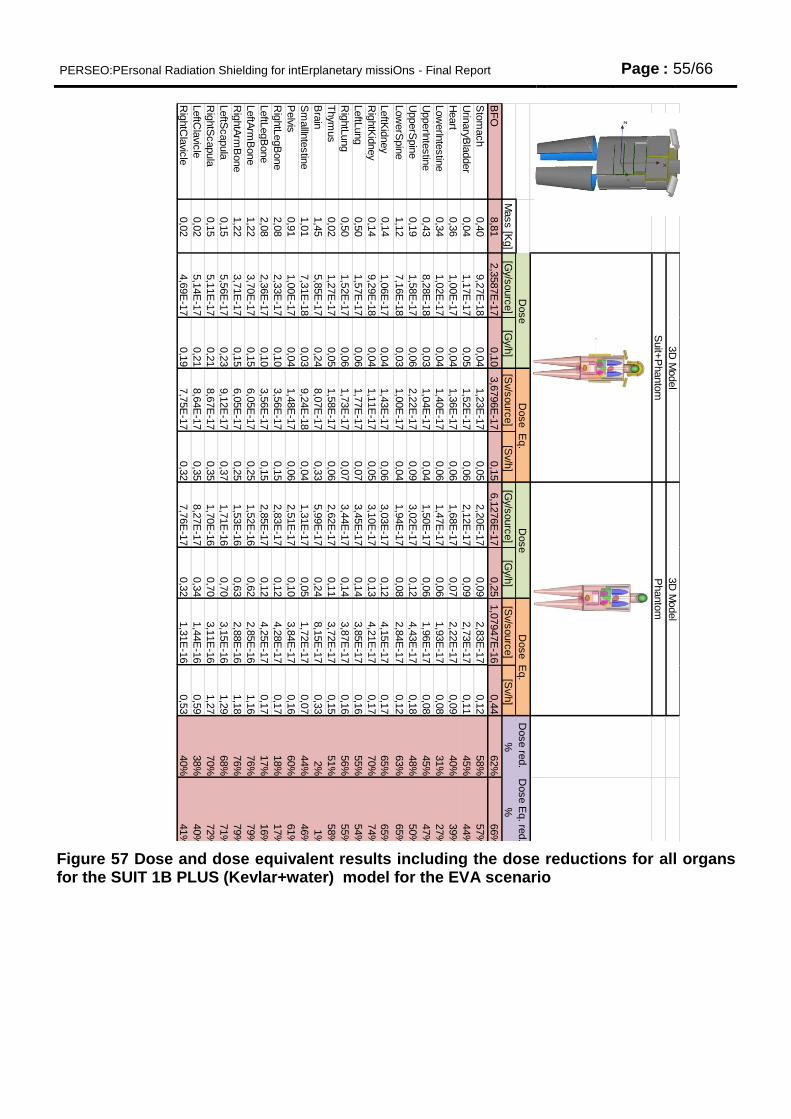
PERSEO:PErsonal Radiation Shielding for intErplanetary missiOns - Final Report Page : 55/66
Figure 57 Dose and dose equivalent results including the dose reductions for all organs for the SUIT 1B PLUS (Kevlar+water) model for the EVA scenario
SU
IT 1
Dose re
d.
Dose E
q. re
d.
Mass [K
g]
[Gy/s
ourc
e]
[Gy/h
][S
v/sourc
e]
[Sv/h
] [G
y/sourc
e]
[Gy/h
][S
v/sourc
e]
[Sv/h
]%
%
BF
O8,8
12,3
587E
-17
0,1
03,6
796E
-17
0,1
56,1
276E
-17
0,2
51,0
7947E
-16
0,4
462%
66%
Sto
mach
0,4
09,2
7E
-18
0,0
41,2
3E
-17
0,0
52,2
0E
-17
0,0
92,8
3E
-17
0,1
258%
57%
Urin
aryB
ladder
0,0
41,1
7E
-17
0,0
51,5
2E
-17
0,0
62,1
2E
-17
0,0
92,7
3E
-17
0,1
145%
44%
Heart
0,3
61,0
0E
-17
0,0
41,3
6E
-17
0,0
61,6
8E
-17
0,0
72,2
2E
-17
0,0
940%
39%
Low
erIn
testin
e0,3
41,0
2E
-17
0,0
41,4
0E
-17
0,0
61,4
7E
-17
0,0
61,9
3E
-17
0,0
831%
27%
UpperIn
testin
e0,4
38,2
8E
-18
0,0
31,0
4E
-17
0,0
41,5
0E
-17
0,0
61,9
6E
-17
0,0
845%
47%
UpperS
pin
e0,1
91,5
8E
-17
0,0
62,2
2E
-17
0,0
93,0
2E
-17
0,1
24,4
3E
-17
0,1
848%
50%
Low
erS
pin
e1,1
27,1
6E
-18
0,0
31,0
0E
-17
0,0
41,9
4E
-17
0,0
82,8
4E
-17
0,1
263%
65%
LeftK
idney
0,1
41,0
6E
-17
0,0
41,4
3E
-17
0,0
63,0
3E
-17
0,1
24,1
5E
-17
0,1
765%
65%
Rig
htK
idney
0,1
49,2
9E
-18
0,0
41,1
1E
-17
0,0
53,1
0E
-17
0,1
34,2
1E
-17
0,1
770%
74%
LeftL
ung
0,5
01,5
7E
-17
0,0
61,7
7E
-17
0,0
73,4
5E
-17
0,1
43,8
5E
-17
0,1
655%
54%
Rig
htL
ung
0,5
01,5
2E
-17
0,0
61,7
3E
-17
0,0
73,4
4E
-17
0,1
43,8
7E
-17
0,1
656%
55%
Thym
us
0,0
21,2
7E
-17
0,0
51,5
8E
-17
0,0
62,6
2E
-17
0,1
13,7
2E
-17
0,1
551%
58%
Bra
in1,4
55,8
5E
-17
0,2
48,0
7E
-17
0,3
35,9
9E
-17
0,2
48,1
5E
-17
0,3
32%
1%
Sm
allIn
testin
e1,0
17,3
1E
-18
0,0
39,2
4E
-18
0,0
41,3
1E
-17
0,0
51,7
2E
-17
0,0
744%
46%
Pelvis
0,9
11,0
0E
-17
0,0
41,4
8E
-17
0,0
62,5
1E
-17
0,1
03,8
4E
-17
0,1
660%
61%
Rig
htL
egB
one
2,0
82,3
3E
-17
0,1
03,5
6E
-17
0,1
52,8
3E
-17
0,1
24,2
8E
-17
0,1
718%
17%
LeftL
egB
one
2,0
82,3
6E
-17
0,1
03,5
6E
-17
0,1
52,8
5E
-17
0,1
24,2
5E
-17
0,1
717%
16%
LeftA
rmB
one
1,2
23,7
0E
-17
0,1
56,0
5E
-17
0,2
51,5
2E
-16
0,6
22,8
5E
-16
1,1
676%
79%
Rig
htA
rmB
one
1,2
23,7
1E
-17
0,1
56,0
5E
-17
0,2
51,5
3E
-16
0,6
32,8
8E
-16
1,1
876%
79%
LeftS
capula
0,1
55,5
6E
-17
0,2
39,1
2E
-17
0,3
71,7
1E
-16
0,7
03,1
5E
-16
1,2
968%
71%
Rig
htS
capula
0,1
55,1
1E
-17
0,2
18,6
7E
-17
0,3
51,7
0E
-16
0,7
03,1
1E
-16
1,2
770%
72%
LeftC
lavic
le0,0
25,1
4E
-17
0,2
18,6
4E
-17
0,3
58,2
7E
-17
0,3
41,4
4E
-16
0,5
938%
40%
Rig
htC
lavic
le0,0
24,6
9E
-17
0,1
97,7
5E
-17
0,3
27,7
6E
-17
0,3
21,3
1E
-16
0,5
340%
41%
3D
Model
Dose
Dose E
q.
3D
Model
Suit+
Phanto
mP
hanto
m
Dose
Dose E
q.
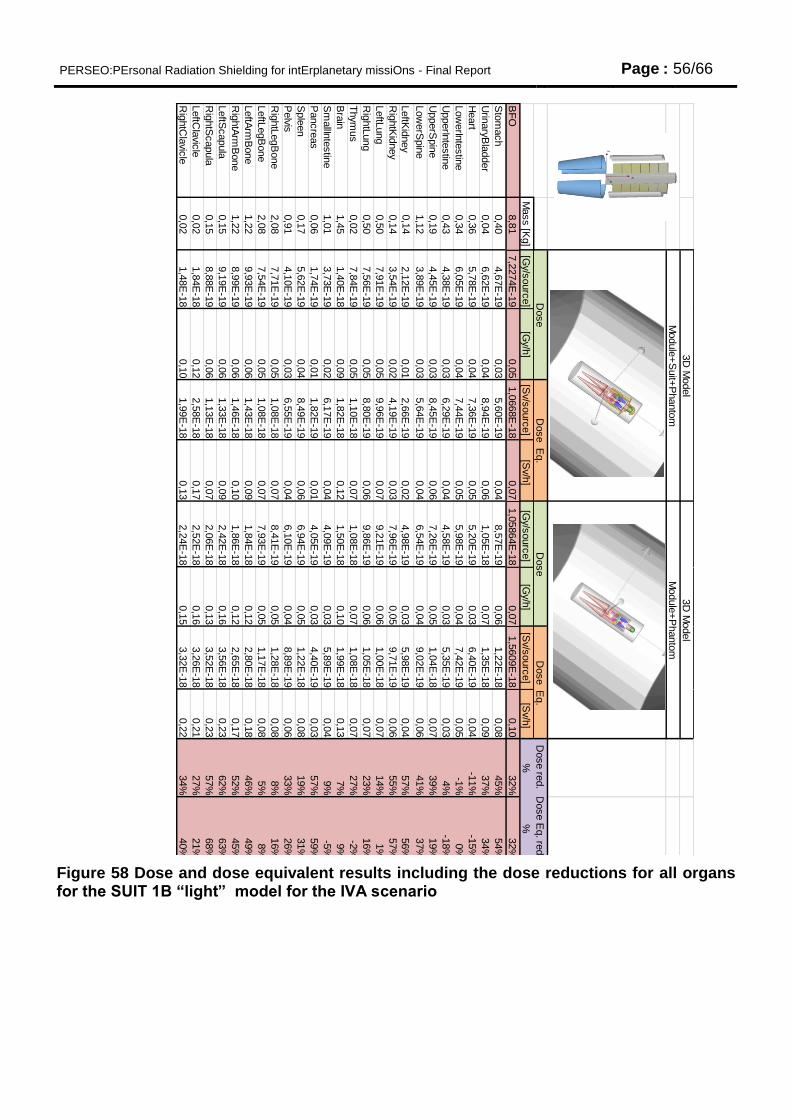
PERSEO:PErsonal Radiation Shielding for intErplanetary missiOns - Final Report Page : 56/66
Figure 58 Dose and dose equivalent results including the dose reductions for all organs for the SUIT 1B “light” model for the IVA scenario
SU
IT 1
Dose re
d.
Dose E
q. re
d.
Mass [K
g]
[Gy/s
ourc
e]
[Gy/h
][S
v/sourc
e]
[Sv/h
] [G
y/sourc
e]
[Gy/h
][S
v/sourc
e]
[Sv/h
]%
%
BF
O8,8
17,2
274E
-19
0,0
51,0
668E
-18
0,0
71,0
5864E
-18
0,0
71,5
609E
-18
0,1
032%
32%
Sto
mach
0,4
04,6
7E
-19
0,0
35,6
0E
-19
0,0
48,5
7E
-19
0,0
61,2
2E
-18
0,0
845%
54%
Urin
aryB
ladder
0,0
46,6
2E
-19
0,0
48,9
4E
-19
0,0
61,0
5E
-18
0,0
71,3
5E
-18
0,0
937%
34%
Heart
0,3
65,7
8E
-19
0,0
47,3
6E
-19
0,0
55,2
0E
-19
0,0
36,4
0E
-19
0,0
4-1
1%
-15%
Low
erIn
testin
e0,3
46,0
5E
-19
0,0
47,4
4E
-19
0,0
55,9
8E
-19
0,0
47,4
2E
-19
0,0
5-1
%0%
UpperIn
testin
e0,4
34,3
8E
-19
0,0
36,2
9E
-19
0,0
44,5
8E
-19
0,0
35,3
5E
-19
0,0
34%
-18%
UpperS
pin
e0,1
94,4
5E
-19
0,0
38,4
5E
-19
0,0
67,2
6E
-19
0,0
51,0
4E
-18
0,0
739%
19%
Low
erS
pin
e1,1
23,8
9E
-19
0,0
35,6
4E
-19
0,0
46,5
4E
-19
0,0
49,0
2E
-19
0,0
641%
37%
LeftK
idney
0,1
42,1
2E
-19
0,0
12,6
6E
-19
0,0
24,9
8E
-19
0,0
35,9
8E
-19
0,0
457%
56%
Rig
htK
idney
0,1
43,5
4E
-19
0,0
24,1
9E
-19
0,0
37,9
6E
-19
0,0
59,7
1E
-19
0,0
655%
57%
LeftL
ung
0,5
07,9
1E
-19
0,0
59,9
6E
-19
0,0
79,2
1E
-19
0,0
61,0
0E
-18
0,0
714%
1%
Rig
htL
ung
0,5
07,5
6E
-19
0,0
58,8
0E
-19
0,0
69,8
6E
-19
0,0
61,0
5E
-18
0,0
723%
16%
Thym
us
0,0
27,8
4E
-19
0,0
51,1
0E
-18
0,0
71,0
8E
-18
0,0
71,0
8E
-18
0,0
727%
-2%
Bra
in1,4
51,4
0E
-18
0,0
91,8
2E
-18
0,1
21,5
0E
-18
0,1
01,9
9E
-18
0,1
37%
9%
Sm
allIn
testin
e1,0
13,7
3E
-19
0,0
26,1
7E
-19
0,0
44,0
9E
-19
0,0
35,8
9E
-19
0,0
49%
-5%
Pancre
as
0,0
61,7
4E
-19
0,0
11,8
2E
-19
0,0
14,0
5E
-19
0,0
34,4
0E
-19
0,0
357%
59%
Sple
en
0,1
75,6
2E
-19
0,0
48,4
9E
-19
0,0
66,9
4E
-19
0,0
51,2
2E
-18
0,0
819%
31%
Pelvis
0,9
14,1
0E
-19
0,0
36,5
5E
-19
0,0
46,1
0E
-19
0,0
48,8
9E
-19
0,0
633%
26%
Rig
htL
egB
one
2,0
87,7
1E
-19
0,0
51,0
8E
-18
0,0
78,4
1E
-19
0,0
51,2
8E
-18
0,0
88%
16%
LeftL
egB
one
2,0
87,5
4E
-19
0,0
51,0
8E
-18
0,0
77,9
3E
-19
0,0
51,1
7E
-18
0,0
85%
8%
LeftA
rmB
one
1,2
29,9
3E
-19
0,0
61,4
3E
-18
0,0
91,8
4E
-18
0,1
22,8
0E
-18
0,1
846%
49%
Rig
htA
rmB
one
1,2
28,9
9E
-19
0,0
61,4
6E
-18
0,1
01,8
6E
-18
0,1
22,6
5E
-18
0,1
752%
45%
LeftS
capula
0,1
59,1
9E
-19
0,0
61,3
3E
-18
0,0
92,4
2E
-18
0,1
63,5
6E
-18
0,2
362%
63%
Rig
htS
capula
0,1
58,8
8E
-19
0,0
61,1
3E
-18
0,0
72,0
6E
-18
0,1
33,5
2E
-18
0,2
357%
68%
LeftC
lavic
le0,0
21,8
4E
-18
0,1
22,5
8E
-18
0,1
72,5
2E
-18
0,1
63,2
6E
-18
0,2
127%
21%
Rig
htC
lavic
le0,0
21,4
8E
-18
0,1
01,9
9E
-18
0,1
32,2
4E
-18
0,1
53,3
2E
-18
0,2
234%
40%
Module
+P
hanto
m
3D
Model
3D
Model
Dose
Dose E
q.
Module
+S
uit+
Phanto
m
Dose
Dose E
q.
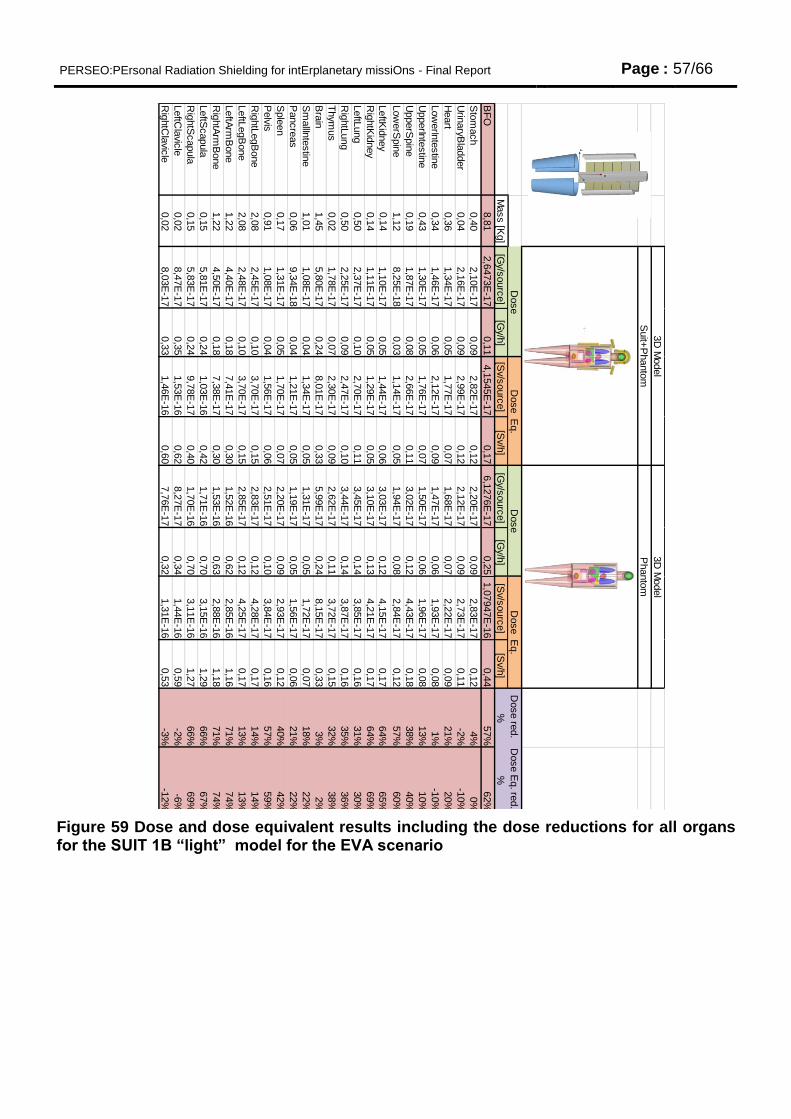
PERSEO:PErsonal Radiation Shielding for intErplanetary missiOns - Final Report Page : 57/66
Figure 59 Dose and dose equivalent results including the dose reductions for all organs for the SUIT 1B “light” model for the EVA scenario
SU
IT 1
Dose re
d.
Dose E
q. re
d.
Mass [K
g]
[Gy/s
ourc
e]
[Gy/h
][S
v/sourc
e]
[Sv/h
] [G
y/sourc
e]
[Gy/h
][S
v/sourc
e]
[Sv/h
]%
%
BF
O8,8
12,6
473E
-17
0,1
14,1
545E
-17
0,1
76,1
276E
-17
0,2
51,0
7947E
-16
0,4
457%
62%
Sto
mach
0,4
02,1
0E
-17
0,0
92,8
2E
-17
0,1
22,2
0E
-17
0,0
92,8
3E
-17
0,1
24%
0%
Urin
aryB
ladder
0,0
42,1
6E
-17
0,0
92,9
9E
-17
0,1
22,1
2E
-17
0,0
92,7
3E
-17
0,1
1-2
%-1
0%
Heart
0,3
61,3
4E
-17
0,0
51,7
7E
-17
0,0
71,6
8E
-17
0,0
72,2
2E
-17
0,0
921%
20%
Low
erIn
testin
e0,3
41,4
6E
-17
0,0
62,1
2E
-17
0,0
91,4
7E
-17
0,0
61,9
3E
-17
0,0
81%
-10%
UpperIn
testin
e0,4
31,3
0E
-17
0,0
51,7
6E
-17
0,0
71,5
0E
-17
0,0
61,9
6E
-17
0,0
813%
10%
UpperS
pin
e0,1
91,8
7E
-17
0,0
82,6
6E
-17
0,1
13,0
2E
-17
0,1
24,4
3E
-17
0,1
838%
40%
Low
erS
pin
e1,1
28,2
5E
-18
0,0
31,1
4E
-17
0,0
51,9
4E
-17
0,0
82,8
4E
-17
0,1
257%
60%
LeftK
idney
0,1
41,1
0E
-17
0,0
51,4
4E
-17
0,0
63,0
3E
-17
0,1
24,1
5E
-17
0,1
764%
65%
Rig
htK
idney
0,1
41,1
1E
-17
0,0
51,2
9E
-17
0,0
53,1
0E
-17
0,1
34,2
1E
-17
0,1
764%
69%
LeftL
ung
0,5
02,3
7E
-17
0,1
02,7
0E
-17
0,1
13,4
5E
-17
0,1
43,8
5E
-17
0,1
631%
30%
Rig
htL
ung
0,5
02,2
5E
-17
0,0
92,4
7E
-17
0,1
03,4
4E
-17
0,1
43,8
7E
-17
0,1
635%
36%
Thym
us
0,0
21,7
8E
-17
0,0
72,3
0E
-17
0,0
92,6
2E
-17
0,1
13,7
2E
-17
0,1
532%
38%
Bra
in1,4
55,8
0E
-17
0,2
48,0
1E
-17
0,3
35,9
9E
-17
0,2
48,1
5E
-17
0,3
33%
2%
Sm
allIn
testin
e1,0
11,0
8E
-17
0,0
41,3
4E
-17
0,0
51,3
1E
-17
0,0
51,7
2E
-17
0,0
718%
22%
Pancre
as
0,0
69,3
4E
-18
0,0
41,2
1E
-17
0,0
51,1
9E
-17
0,0
51,5
6E
-17
0,0
621%
22%
Sple
en
0,1
71,3
1E
-17
0,0
51,7
0E
-17
0,0
72,2
0E
-17
0,0
92,9
3E
-17
0,1
240%
42%
Pelvis
0,9
11,0
8E
-17
0,0
41,5
6E
-17
0,0
62,5
1E
-17
0,1
03,8
4E
-17
0,1
657%
59%
Rig
htL
egB
one
2,0
82,4
5E
-17
0,1
03,7
0E
-17
0,1
52,8
3E
-17
0,1
24,2
8E
-17
0,1
714%
14%
LeftL
egB
one
2,0
82,4
8E
-17
0,1
03,7
0E
-17
0,1
52,8
5E
-17
0,1
24,2
5E
-17
0,1
713%
13%
LeftA
rmB
one
1,2
24,4
0E
-17
0,1
87,4
1E
-17
0,3
01,5
2E
-16
0,6
22,8
5E
-16
1,1
671%
74%
Rig
htA
rmB
one
1,2
24,5
0E
-17
0,1
87,3
8E
-17
0,3
01,5
3E
-16
0,6
32,8
8E
-16
1,1
871%
74%
LeftS
capula
0,1
55,8
1E
-17
0,2
41,0
3E
-16
0,4
21,7
1E
-16
0,7
03,1
5E
-16
1,2
966%
67%
Rig
htS
capula
0,1
55,8
3E
-17
0,2
49,7
8E
-17
0,4
01,7
0E
-16
0,7
03,1
1E
-16
1,2
766%
69%
LeftC
lavic
le0,0
28,4
7E
-17
0,3
51,5
3E
-16
0,6
28,2
7E
-17
0,3
41,4
4E
-16
0,5
9-2
%-6
%
Rig
htC
lavic
le0,0
28,0
3E
-17
0,3
31,4
6E
-16
0,6
07,7
6E
-17
0,3
21,3
1E
-16
0,5
3-3
%-1
2%
Dose
3D
Model
3D
Model
Dose E
q.
Suit+
Phanto
mP
hanto
m
Dose
Dose E
q.
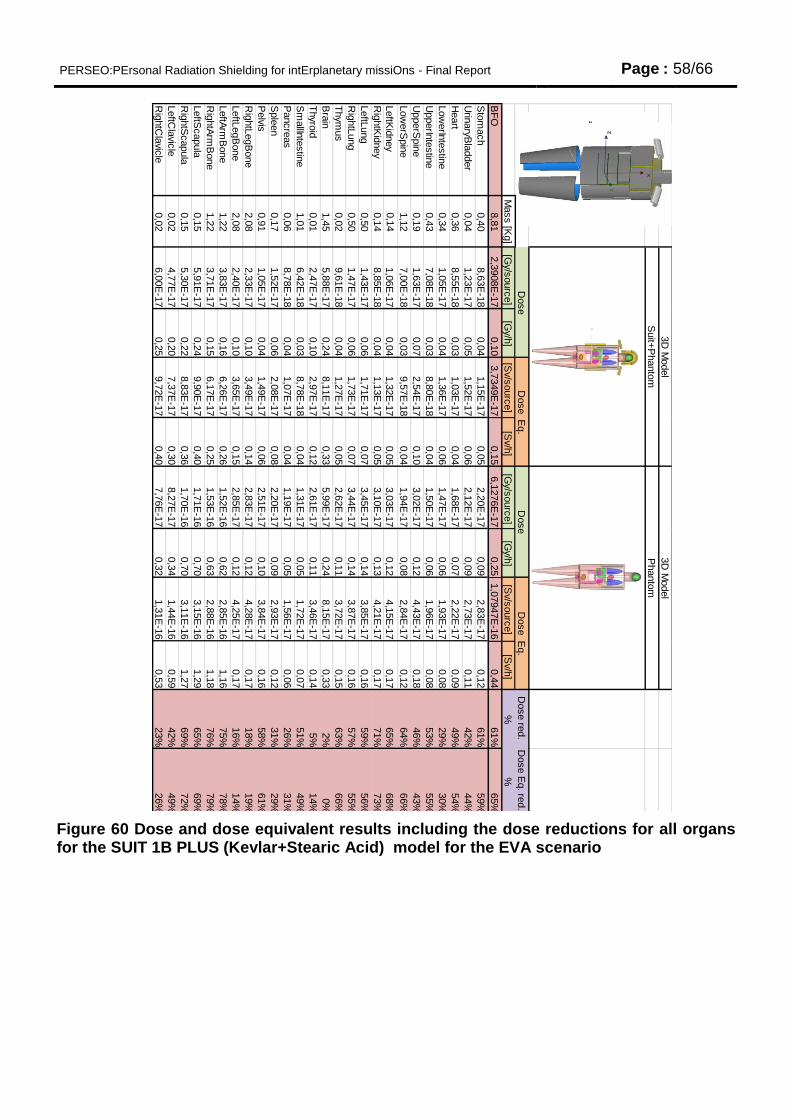
PERSEO:PErsonal Radiation Shielding for intErplanetary missiOns - Final Report Page : 58/66
Figure 60 Dose and dose equivalent results including the dose reductions for all organs for the SUIT 1B PLUS (Kevlar+Stearic Acid) model for the EVA scenario
SU
IT 1
MV
Dose re
d.
Dose E
q. re
d.
Mass [K
g]
[Gy/s
ourc
e]
[Gy/h
][S
v/sourc
e]
[Sv/h
] [G
y/sourc
e]
[Gy/h
][S
v/sourc
e]
[Sv/h
]%
%
BF
O8,8
12,3
908E
-17
0,1
03,7
349E
-17
0,1
56,1
276E
-17
0,2
51,0
7947E
-16
0,4
461%
65%
Sto
mach
0,4
08,6
3E
-18
0,0
41,1
5E
-17
0,0
52,2
0E
-17
0,0
92,8
3E
-17
0,1
261%
59%
Urin
aryB
ladder
0,0
41,2
3E
-17
0,0
51,5
2E
-17
0,0
62,1
2E
-17
0,0
92,7
3E
-17
0,1
142%
44%
Heart
0,3
68,5
5E
-18
0,0
31,0
3E
-17
0,0
41,6
8E
-17
0,0
72,2
2E
-17
0,0
949%
54%
Low
erIn
testin
e0,3
41,0
5E
-17
0,0
41,3
6E
-17
0,0
61,4
7E
-17
0,0
61,9
3E
-17
0,0
829%
30%
UpperIn
testin
e0,4
37,0
8E
-18
0,0
38,8
0E
-18
0,0
41,5
0E
-17
0,0
61,9
6E
-17
0,0
853%
55%
UpperS
pin
e0,1
91,6
3E
-17
0,0
72,5
4E
-17
0,1
03,0
2E
-17
0,1
24,4
3E
-17
0,1
846%
43%
Low
erS
pin
e1,1
27,0
0E
-18
0,0
39,5
7E
-18
0,0
41,9
4E
-17
0,0
82,8
4E
-17
0,1
264%
66%
LeftK
idney
0,1
41,0
6E
-17
0,0
41,3
2E
-17
0,0
53,0
3E
-17
0,1
24,1
5E
-17
0,1
765%
68%
Rig
htK
idney
0,1
48,8
5E
-18
0,0
41,1
3E
-17
0,0
53,1
0E
-17
0,1
34,2
1E
-17
0,1
771%
73%
LeftL
ung
0,5
01,4
3E
-17
0,0
61,7
1E
-17
0,0
73,4
5E
-17
0,1
43,8
5E
-17
0,1
659%
56%
Rig
htL
ung
0,5
01,4
7E
-17
0,0
61,7
3E
-17
0,0
73,4
4E
-17
0,1
43,8
7E
-17
0,1
657%
55%
Thym
us
0,0
29,6
1E
-18
0,0
41,2
7E
-17
0,0
52,6
2E
-17
0,1
13,7
2E
-17
0,1
563%
66%
Bra
in1,4
55,8
8E
-17
0,2
48,1
1E
-17
0,3
35,9
9E
-17
0,2
48,1
5E
-17
0,3
32%
0%
Thyro
id0,0
12,4
7E
-17
0,1
02,9
7E
-17
0,1
22,6
1E
-17
0,1
13,4
6E
-17
0,1
45%
14%
Sm
allIn
testin
e1,0
16,4
2E
-18
0,0
38,7
8E
-18
0,0
41,3
1E
-17
0,0
51,7
2E
-17
0,0
751%
49%
Pancre
as
0,0
68,7
8E
-18
0,0
41,0
7E
-17
0,0
41,1
9E
-17
0,0
51,5
6E
-17
0,0
626%
31%
Sple
en
0,1
71,5
2E
-17
0,0
62,0
8E
-17
0,0
82,2
0E
-17
0,0
92,9
3E
-17
0,1
231%
29%
Pelvis
0,9
11,0
5E
-17
0,0
41,4
9E
-17
0,0
62,5
1E
-17
0,1
03,8
4E
-17
0,1
658%
61%
Rig
htL
egB
one
2,0
82,3
3E
-17
0,1
03,4
9E
-17
0,1
42,8
3E
-17
0,1
24,2
8E
-17
0,1
718%
19%
LeftL
egB
one
2,0
82,4
0E
-17
0,1
03,6
5E
-17
0,1
52,8
5E
-17
0,1
24,2
5E
-17
0,1
716%
14%
LeftA
rmB
one
1,2
23,8
3E
-17
0,1
66,2
6E
-17
0,2
61,5
2E
-16
0,6
22,8
5E
-16
1,1
675%
78%
Rig
htA
rmB
one
1,2
23,7
1E
-17
0,1
56,1
7E
-17
0,2
51,5
3E
-16
0,6
32,8
8E
-16
1,1
876%
79%
LeftS
capula
0,1
55,9
1E
-17
0,2
49,9
0E
-17
0,4
01,7
1E
-16
0,7
03,1
5E
-16
1,2
965%
69%
Rig
htS
capula
0,1
55,3
0E
-17
0,2
28,8
3E
-17
0,3
61,7
0E
-16
0,7
03,1
1E
-16
1,2
769%
72%
LeftC
lavic
le0,0
24,7
7E
-17
0,2
07,3
7E
-17
0,3
08,2
7E
-17
0,3
41,4
4E
-16
0,5
942%
49%
Rig
htC
lavic
le0,0
26,0
0E
-17
0,2
59,7
2E
-17
0,4
07,7
6E
-17
0,3
21,3
1E
-16
0,5
323%
26%
Dose
Dose E
q.
3D
Model
3D
Model
Suit+
Phanto
mP
hanto
m
Dose
Dose E
q.
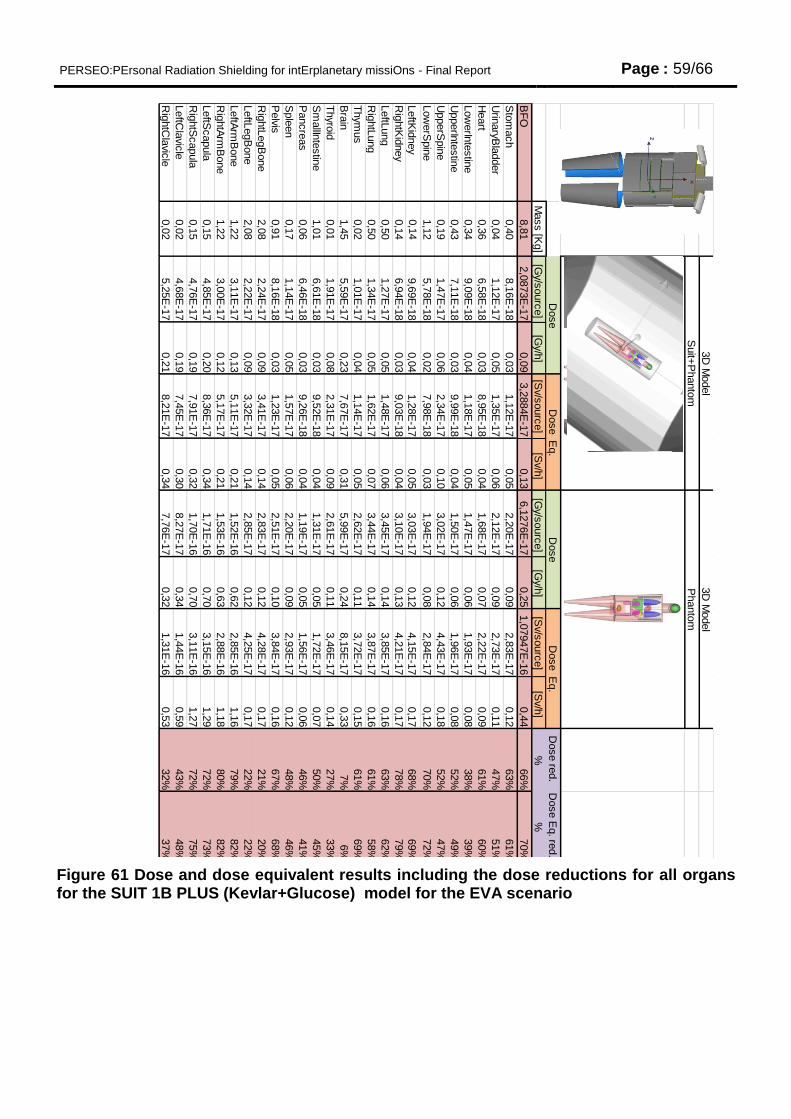
PERSEO:PErsonal Radiation Shielding for intErplanetary missiOns - Final Report Page : 59/66
Figure 61 Dose and dose equivalent results including the dose reductions for all organs for the SUIT 1B PLUS (Kevlar+Glucose) model for the EVA scenario
SU
IT 2
Dose re
d.
Dose E
q. re
d.
Mass [K
g]
[Gy/s
ourc
e]
[Gy/h
][S
v/sourc
e]
[Sv/h
] [G
y/sourc
e]
[Gy/h
][S
v/sourc
e]
[Sv/h
]%
%
BF
O8,8
12,0
873E
-17
0,0
93,2
884E
-17
0,1
36,1
276E
-17
0,2
51,0
7947E
-16
0,4
466%
70%
Sto
mach
0,4
08,1
6E
-18
0,0
31,1
2E
-17
0,0
52,2
0E
-17
0,0
92,8
3E
-17
0,1
263%
61%
Urin
aryB
ladder
0,0
41,1
2E
-17
0,0
51,3
5E
-17
0,0
62,1
2E
-17
0,0
92,7
3E
-17
0,1
147%
51%
Heart
0,3
66,5
8E
-18
0,0
38,9
5E
-18
0,0
41,6
8E
-17
0,0
72,2
2E
-17
0,0
961%
60%
Low
erIn
testin
e0,3
49,0
9E
-18
0,0
41,1
8E
-17
0,0
51,4
7E
-17
0,0
61,9
3E
-17
0,0
838%
39%
UpperIn
testin
e0,4
37,1
1E
-18
0,0
39,9
9E
-18
0,0
41,5
0E
-17
0,0
61,9
6E
-17
0,0
852%
49%
UpperS
pin
e0,1
91,4
7E
-17
0,0
62,3
4E
-17
0,1
03,0
2E
-17
0,1
24,4
3E
-17
0,1
852%
47%
Low
erS
pin
e1,1
25,7
8E
-18
0,0
27,9
8E
-18
0,0
31,9
4E
-17
0,0
82,8
4E
-17
0,1
270%
72%
LeftK
idney
0,1
49,6
9E
-18
0,0
41,2
8E
-17
0,0
53,0
3E
-17
0,1
24,1
5E
-17
0,1
768%
69%
Rig
htK
idney
0,1
46,9
4E
-18
0,0
39,0
3E
-18
0,0
43,1
0E
-17
0,1
34,2
1E
-17
0,1
778%
79%
LeftL
ung
0,5
01,2
7E
-17
0,0
51,4
8E
-17
0,0
63,4
5E
-17
0,1
43,8
5E
-17
0,1
663%
62%
Rig
htL
ung
0,5
01,3
4E
-17
0,0
51,6
2E
-17
0,0
73,4
4E
-17
0,1
43,8
7E
-17
0,1
661%
58%
Thym
us
0,0
21,0
1E
-17
0,0
41,1
4E
-17
0,0
52,6
2E
-17
0,1
13,7
2E
-17
0,1
561%
69%
Bra
in1,4
55,5
9E
-17
0,2
37,6
7E
-17
0,3
15,9
9E
-17
0,2
48,1
5E
-17
0,3
37%
6%
Thyro
id0,0
11,9
1E
-17
0,0
82,3
1E
-17
0,0
92,6
1E
-17
0,1
13,4
6E
-17
0,1
427%
33%
Sm
allIn
testin
e1,0
16,6
1E
-18
0,0
39,5
2E
-18
0,0
41,3
1E
-17
0,0
51,7
2E
-17
0,0
750%
45%
Pancre
as
0,0
66,4
6E
-18
0,0
39,2
6E
-18
0,0
41,1
9E
-17
0,0
51,5
6E
-17
0,0
646%
41%
Sple
en
0,1
71,1
4E
-17
0,0
51,5
7E
-17
0,0
62,2
0E
-17
0,0
92,9
3E
-17
0,1
248%
46%
Pelvis
0,9
18,1
6E
-18
0,0
31,2
3E
-17
0,0
52,5
1E
-17
0,1
03,8
4E
-17
0,1
667%
68%
Rig
htL
egB
one
2,0
82,2
4E
-17
0,0
93,4
1E
-17
0,1
42,8
3E
-17
0,1
24,2
8E
-17
0,1
721%
20%
LeftL
egB
one
2,0
82,2
2E
-17
0,0
93,3
2E
-17
0,1
42,8
5E
-17
0,1
24,2
5E
-17
0,1
722%
22%
LeftA
rmB
one
1,2
23,1
1E
-17
0,1
35,1
1E
-17
0,2
11,5
2E
-16
0,6
22,8
5E
-16
1,1
679%
82%
Rig
htA
rmB
one
1,2
23,0
0E
-17
0,1
25,1
7E
-17
0,2
11,5
3E
-16
0,6
32,8
8E
-16
1,1
880%
82%
LeftS
capula
0,1
54,8
5E
-17
0,2
08,3
6E
-17
0,3
41,7
1E
-16
0,7
03,1
5E
-16
1,2
972%
73%
Rig
htS
capula
0,1
54,7
6E
-17
0,1
97,9
1E
-17
0,3
21,7
0E
-16
0,7
03,1
1E
-16
1,2
772%
75%
LeftC
lavic
le0,0
24,6
8E
-17
0,1
97,4
5E
-17
0,3
08,2
7E
-17
0,3
41,4
4E
-16
0,5
943%
48%
Rig
htC
lavic
le0,0
25,2
5E
-17
0,2
18,2
1E
-17
0,3
47,7
6E
-17
0,3
21,3
1E
-16
0,5
332%
37%
Dose
Dose E
q.
3D
Model
3D
Model
Suit+
Phanto
mP
hanto
m
Dose
Dose E
q.
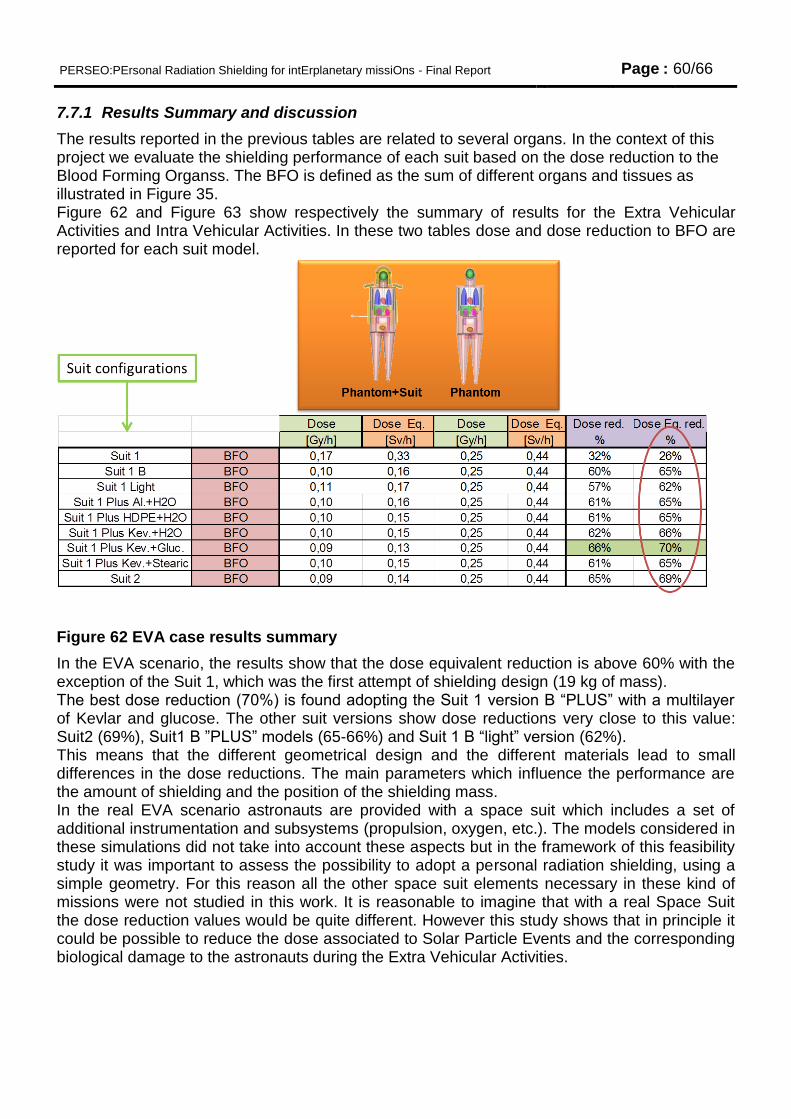
PERSEO:PErsonal Radiation Shielding for intErplanetary missiOns - Final Report Page : 60/66
7.7.1 Results Summary and discussion
The results reported in the previous tables are related to several organs. In the context of this project we evaluate the shielding performance of each suit based on the dose reduction to the Blood Forming Organss. The BFO is defined as the sum of different organs and tissues as illustrated in Figure 35. Figure 62 and Figure 63 show respectively the summary of results for the Extra Vehicular Activities and Intra Vehicular Activities. In these two tables dose and dose reduction to BFO are reported for each suit model.
Figure 62 EVA case results summary
In the EVA scenario, the results show that the dose equivalent reduction is above 60% with the exception of the Suit 1, which was the first attempt of shielding design (19 kg of mass). The best dose reduction (70%) is found adopting the Suit 1 version B “PLUS” with a multilayer of Kevlar and glucose. The other suit versions show dose reductions very close to this value: Suit2 (69%), Suit1 B ”PLUS” models (65-66%) and Suit 1 B “light” version (62%). This means that the different geometrical design and the different materials lead to small differences in the dose reductions. The main parameters which influence the performance are the amount of shielding and the position of the shielding mass. In the real EVA scenario astronauts are provided with a space suit which includes a set of additional instrumentation and subsystems (propulsion, oxygen, etc.). The models considered in these simulations did not take into account these aspects but in the framework of this feasibility study it was important to assess the possibility to adopt a personal radiation shielding, using a simple geometry. For this reason all the other space suit elements necessary in these kind of missions were not studied in this work. It is reasonable to imagine that with a real Space Suit the dose reduction values would be quite different. However this study shows that in principle it could be possible to reduce the dose associated to Solar Particle Events and the corresponding biological damage to the astronauts during the Extra Vehicular Activities.
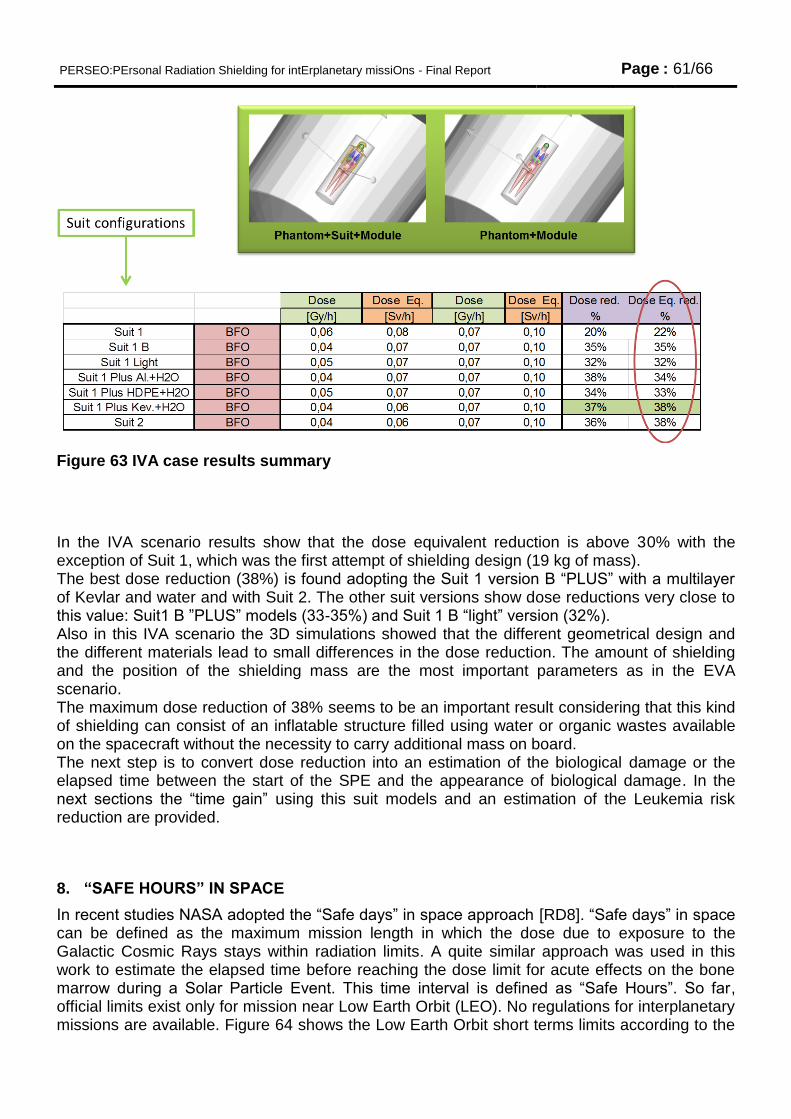
PERSEO:PErsonal Radiation Shielding for intErplanetary missiOns - Final Report Page : 61/66
Figure 63 IVA case results summary
In the IVA scenario results show that the dose equivalent reduction is above 30% with the exception of Suit 1, which was the first attempt of shielding design (19 kg of mass). The best dose reduction (38%) is found adopting the Suit 1 version B “PLUS” with a multilayer of Kevlar and water and with Suit 2. The other suit versions show dose reductions very close to this value: Suit1 B ”PLUS” models (33-35%) and Suit 1 B “light” version (32%). Also in this IVA scenario the 3D simulations showed that the different geometrical design and the different materials lead to small differences in the dose reduction. The amount of shielding and the position of the shielding mass are the most important parameters as in the EVA scenario. The maximum dose reduction of 38% seems to be an important result considering that this kind of shielding can consist of an inflatable structure filled using water or organic wastes available on the spacecraft without the necessity to carry additional mass on board. The next step is to convert dose reduction into an estimation of the biological damage or the elapsed time between the start of the SPE and the appearance of biological damage. In the next sections the “time gain” using this suit models and an estimation of the Leukemia risk reduction are provided.
8. “SAFE HOURS” IN SPACE
In recent studies NASA adopted the “Safe days” in space approach [RD8]. “Safe days” in space can be defined as the maximum mission length in which the dose due to exposure to the Galactic Cosmic Rays stays within radiation limits. A quite similar approach was used in this work to estimate the elapsed time before reaching the dose limit for acute effects on the bone marrow during a Solar Particle Event. This time interval is defined as “Safe Hours”. So far, official limits exist only for mission near Low Earth Orbit (LEO). No regulations for interplanetary missions are available. Figure 64 shows the Low Earth Orbit short terms limits according to the
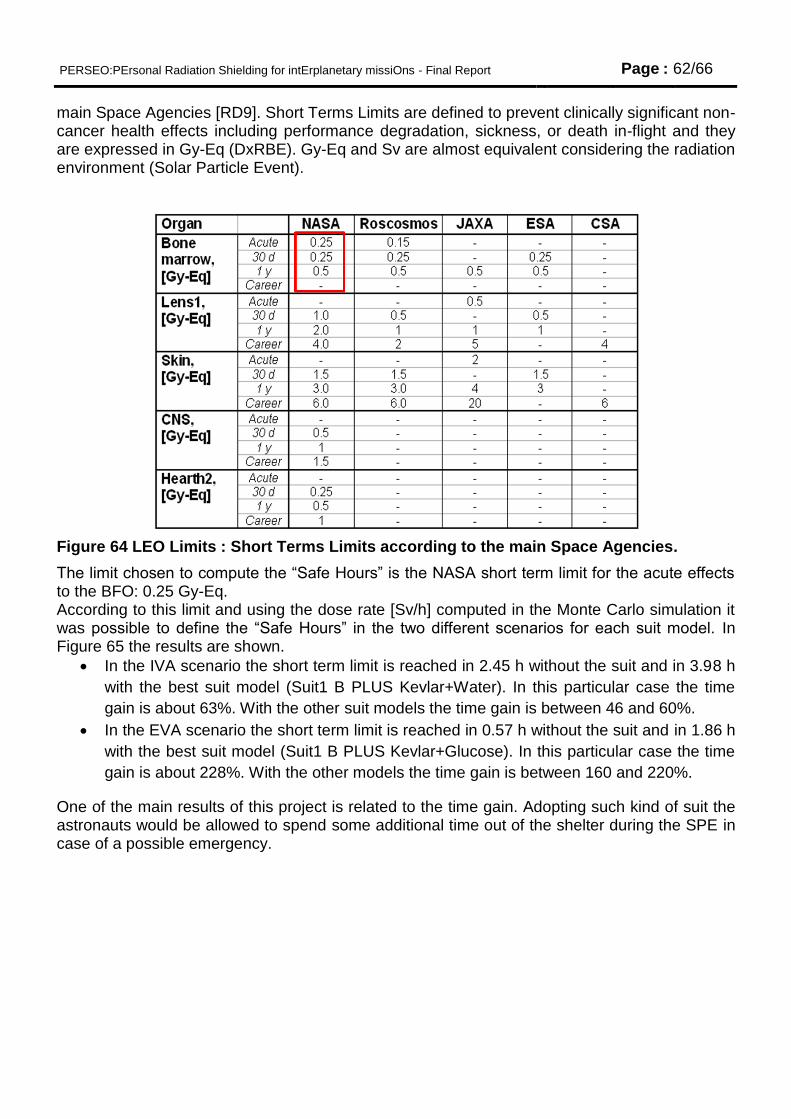
PERSEO:PErsonal Radiation Shielding for intErplanetary missiOns - Final Report Page : 62/66
main Space Agencies [RD9]. Short Terms Limits are defined to prevent clinically significant non-cancer health effects including performance degradation, sickness, or death in-flight and they are expressed in Gy-Eq (DxRBE). Gy-Eq and Sv are almost equivalent considering the radiation environment (Solar Particle Event).
Figure 64 LEO Limits : Short Terms Limits according to the main Space Agencies.
The limit chosen to compute the “Safe Hours” is the NASA short term limit for the acute effects to the BFO: 0.25 Gy-Eq. According to this limit and using the dose rate [Sv/h] computed in the Monte Carlo simulation it was possible to define the “Safe Hours” in the two different scenarios for each suit model. In Figure 65 the results are shown.
In the IVA scenario the short term limit is reached in 2.45 h without the suit and in 3.98 h
with the best suit model (Suit1 B PLUS Kevlar+Water). In this particular case the time
gain is about 63%. With the other suit models the time gain is between 46 and 60%.
In the EVA scenario the short term limit is reached in 0.57 h without the suit and in 1.86 h
with the best suit model (Suit1 B PLUS Kevlar+Glucose). In this particular case the time
gain is about 228%. With the other models the time gain is between 160 and 220%.
One of the main results of this project is related to the time gain. Adopting such kind of suit the astronauts would be allowed to spend some additional time out of the shelter during the SPE in case of a possible emergency.
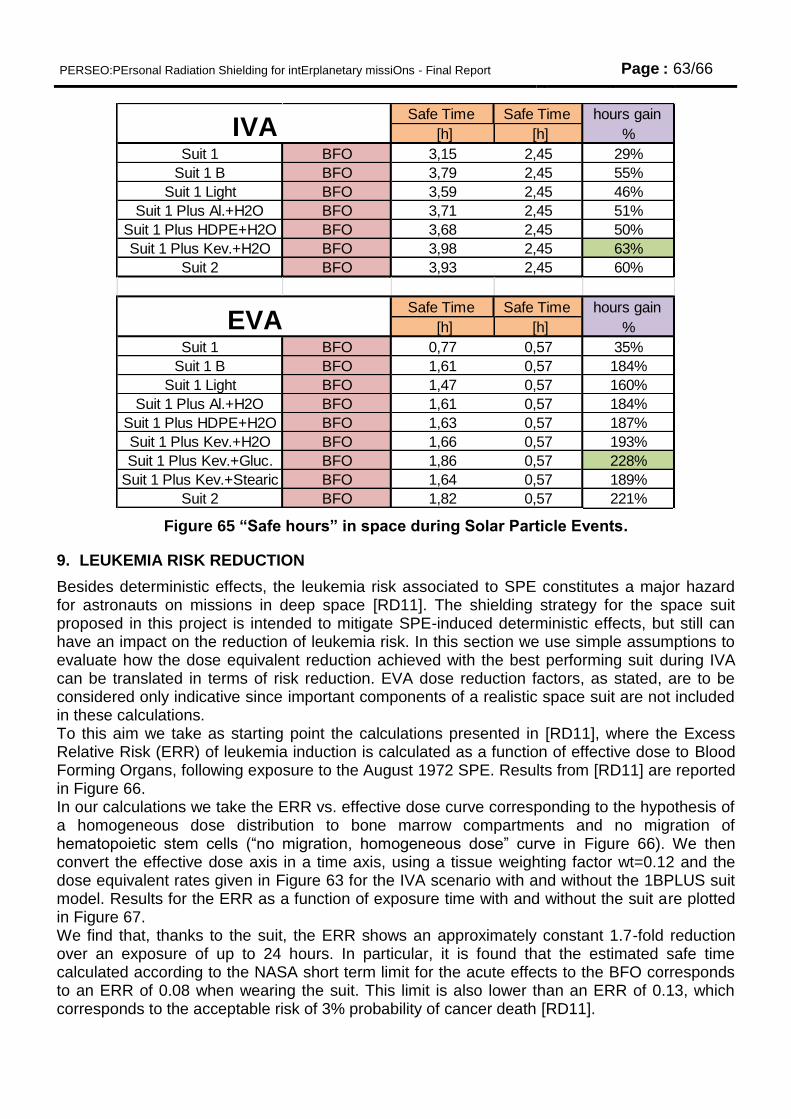
PERSEO:PErsonal Radiation Shielding for intErplanetary missiOns - Final Report Page : 63/66
Figure 65 “Safe hours” in space during Solar Particle Events.
9. LEUKEMIA RISK REDUCTION
Besides deterministic effects, the leukemia risk associated to SPE constitutes a major hazard for astronauts on missions in deep space [RD11]. The shielding strategy for the space suit proposed in this project is intended to mitigate SPE-induced deterministic effects, but still can have an impact on the reduction of leukemia risk. In this section we use simple assumptions to evaluate how the dose equivalent reduction achieved with the best performing suit during IVA can be translated in terms of risk reduction. EVA dose reduction factors, as stated, are to be considered only indicative since important components of a realistic space suit are not included in these calculations. To this aim we take as starting point the calculations presented in [RD11], where the Excess Relative Risk (ERR) of leukemia induction is calculated as a function of effective dose to Blood Forming Organs, following exposure to the August 1972 SPE. Results from [RD11] are reported in Figure 66. In our calculations we take the ERR vs. effective dose curve corresponding to the hypothesis of a homogeneous dose distribution to bone marrow compartments and no migration of hematopoietic stem cells (“no migration, homogeneous dose” curve in Figure 66). We then convert the effective dose axis in a time axis, using a tissue weighting factor wt=0.12 and the dose equivalent rates given in Figure 63 for the IVA scenario with and without the 1BPLUS suit model. Results for the ERR as a function of exposure time with and without the suit are plotted in Figure 67. We find that, thanks to the suit, the ERR shows an approximately constant 1.7-fold reduction over an exposure of up to 24 hours. In particular, it is found that the estimated safe time calculated according to the NASA short term limit for the acute effects to the BFO corresponds to an ERR of 0.08 when wearing the suit. This limit is also lower than an ERR of 0.13, which corresponds to the acceptable risk of 3% probability of cancer death [RD11].
hours gain
[h] [h] %
Suit 1 BFO 3,15 2,45 29%
Suit 1 B BFO 3,79 2,45 55%
Suit 1 Light BFO 3,59 2,45 46%
Suit 1 Plus Al.+H2O BFO 3,71 2,45 51%
Suit 1 Plus HDPE+H2O BFO 3,68 2,45 50%
Suit 1 Plus Kev.+H2O BFO 3,98 2,45 63%
Suit 2 BFO 3,93 2,45 60%
hours gain
[h] [h] %
Suit 1 BFO 0,77 0,57 35%
Suit 1 B BFO 1,61 0,57 184%
Suit 1 Light BFO 1,47 0,57 160%
Suit 1 Plus Al.+H2O BFO 1,61 0,57 184%
Suit 1 Plus HDPE+H2O BFO 1,63 0,57 187%
Suit 1 Plus Kev.+H2O BFO 1,66 0,57 193%
Suit 1 Plus Kev.+Gluc. BFO 1,86 0,57 228%
Suit 1 Plus Kev.+Stearic BFO 1,64 0,57 189%
Suit 2 BFO 1,82 0,57 221%
Safe Time Safe Time
IVA
EVA
Safe Time Safe Time
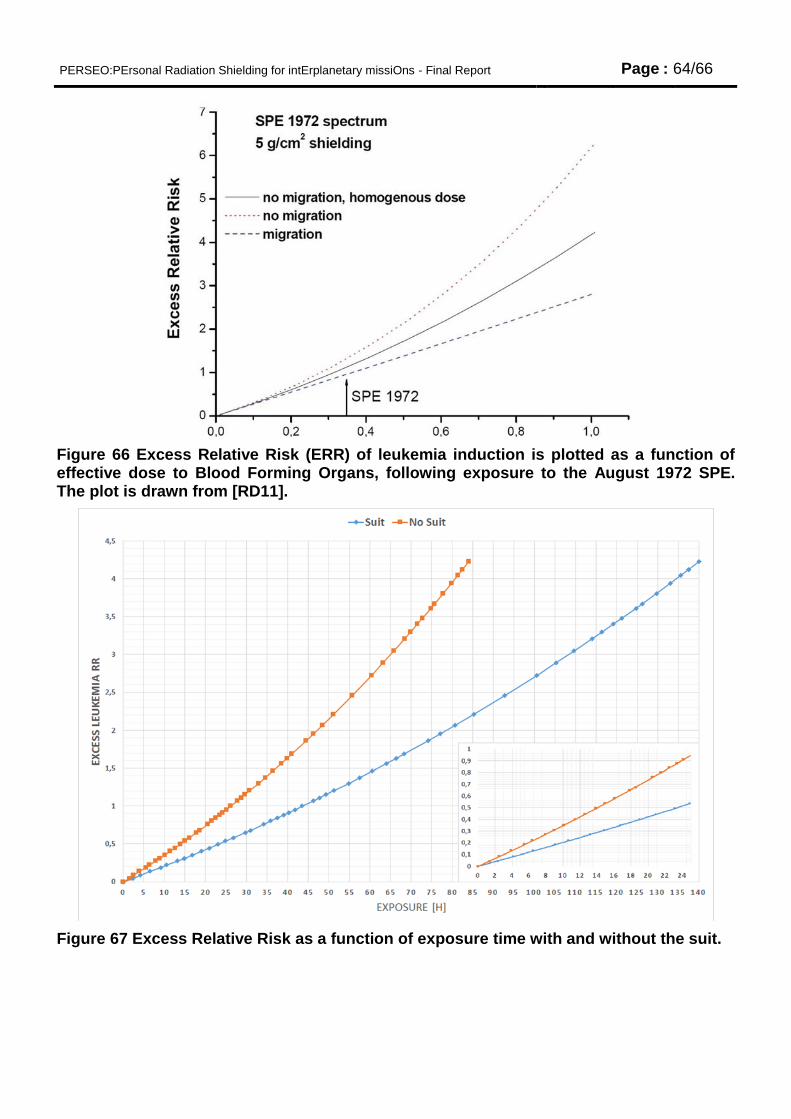
PERSEO:PErsonal Radiation Shielding for intErplanetary missiOns - Final Report Page : 64/66
Figure 66 Excess Relative Risk (ERR) of leukemia induction is plotted as a function of effective dose to Blood Forming Organs, following exposure to the August 1972 SPE. The plot is drawn from [RD11].
Figure 67 Excess Relative Risk as a function of exposure time with and without the suit.
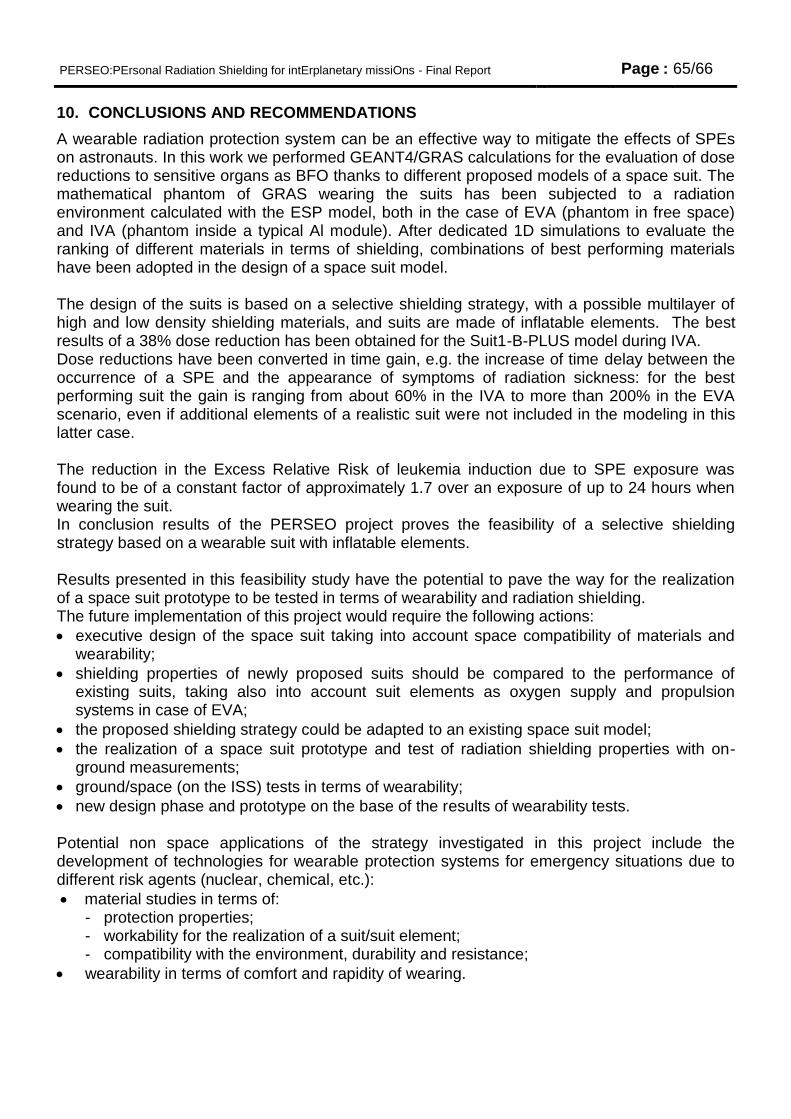
PERSEO:PErsonal Radiation Shielding for intErplanetary missiOns - Final Report Page : 65/66
10. CONCLUSIONS AND RECOMMENDATIONS
A wearable radiation protection system can be an effective way to mitigate the effects of SPEs on astronauts. In this work we performed GEANT4/GRAS calculations for the evaluation of dose reductions to sensitive organs as BFO thanks to different proposed models of a space suit. The mathematical phantom of GRAS wearing the suits has been subjected to a radiation environment calculated with the ESP model, both in the case of EVA (phantom in free space) and IVA (phantom inside a typical Al module). After dedicated 1D simulations to evaluate the ranking of different materials in terms of shielding, combinations of best performing materials have been adopted in the design of a space suit model. The design of the suits is based on a selective shielding strategy, with a possible multilayer of high and low density shielding materials, and suits are made of inflatable elements. The best results of a 38% dose reduction has been obtained for the Suit1-B-PLUS model during IVA. Dose reductions have been converted in time gain, e.g. the increase of time delay between the occurrence of a SPE and the appearance of symptoms of radiation sickness: for the best performing suit the gain is ranging from about 60% in the IVA to more than 200% in the EVA scenario, even if additional elements of a realistic suit were not included in the modeling in this latter case. The reduction in the Excess Relative Risk of leukemia induction due to SPE exposure was found to be of a constant factor of approximately 1.7 over an exposure of up to 24 hours when wearing the suit. In conclusion results of the PERSEO project proves the feasibility of a selective shielding strategy based on a wearable suit with inflatable elements. Results presented in this feasibility study have the potential to pave the way for the realization of a space suit prototype to be tested in terms of wearability and radiation shielding. The future implementation of this project would require the following actions:
executive design of the space suit taking into account space compatibility of materials and wearability;
shielding properties of newly proposed suits should be compared to the performance of existing suits, taking also into account suit elements as oxygen supply and propulsion systems in case of EVA;
the proposed shielding strategy could be adapted to an existing space suit model;
the realization of a space suit prototype and test of radiation shielding properties with on-ground measurements;
ground/space (on the ISS) tests in terms of wearability;
new design phase and prototype on the base of the results of wearability tests. Potential non space applications of the strategy investigated in this project include the development of technologies for wearable protection systems for emergency situations due to different risk agents (nuclear, chemical, etc.):
material studies in terms of: - protection properties; - workability for the realization of a suit/suit element; - compatibility with the environment, durability and resistance;
wearability in terms of comfort and rapidity of wearing.
PERSEO:PErsonal Radiation Shielding for intErplanetary missiOns - Final Report Page : 66/66
REFERENCES [RD1] Wilson, J., Anderson, B., Cucinotta, F., Ware, J. et al., "Spacesuit Radiation Shield
Design Methods," SAE Technical Paper 2006-01-2110, 2006, doi:10.4271/2006-01-2110. [RD2] G. Santin et al, “GRAS: A general-purpose 3-D modular simulation tool for space
environment effects analysis”, IEEE Trans. Nucl. Sc., Vol 52, No 6, 2294-2299, 2005. [RD3] Agostinelli et al., 2003, S. Agostinelli, J. Alison, K. Amako, et al. ”Geant4 – a simulation
toolkit” Nucl. Instrum. Methods A, 506 (2003), pp. 250–303 [RD4] A. V. Ivantchenko, V. N. Ivanchenko, J.-M. Q. Molina and S. L. Incerti,” Geant4 hadronic
physics for space radiation environment”, Int. J. Radiat. Biol., 88(1-2), 171–175, 2012 [RD5] T. Sato, K. Niita, N. Matsuda, S. Hashimoto, Y. Iwamoto, S. Noda, T. Ogawa, H. Iwase,
H. Nakashima, T. Fukahori, K. Okumura, T. Kai, S. Chiba, T. Furuta and L. Sihver, Particle and Heavy Ion Transport Code System PHITS, Version 2.52, J. Nucl. Sci. Technol. 50:9, 913-923 (2013)
[RD6] G. Dietze,"Assessment of Radiation Exposure of Astronauts in Space", ICRP Publication
123, Ann. ICRP 42(4), 2013
[RD7] R. Chytracek, J. McCormick, W. Pokorski, G. Santin, “Geometry Description Markup
Language for Physics Simulation and Analysis Applications”, IEEE Trans. Nucl. Sci., Vol. 53,
Issue: 5, Part 2, 2892-2896
[RD8] Francis A. Cucinotta, Murat Alp, Blake Rowedder, Myung-Hee Y. Kim, Safe days in
space with acceptable uncertainty from space radiation exposure, Life Sciences in Space
Research, Volume 5, April 2015, Pages 31-38, ISSN 2214-5524
[RD9] Francis A. Cucinotta , Myung-Hee Y. Kim and Lori J. Chappell, “Space Radiation Cancer
Risk Projections and Uncertainties – 2012” NASA/TP-2013-217375 - JSC Technical Report
[RD10] "FAA Semi-Annual Launch Report: Second Half of 2009" (PDF). Federal Aviation
Administration - Office of Commercial Space Transportation. pp. end of document. Retrieved
August 18, 2011
[RD11] Th. Elsässer, M.Y. Kim, F. Cucinotta “Effect of cell migration on space radiation
leukemia risk” GSI Scientific Report 2008, Radiation-Biophysics-23
END OF DOCUMENT