perpustakaan dewan bahasa dan pustaka brunei cataloguing ... documents library/dos/bdki/bdki...
TRANSCRIPT

Perpustakaan Dewan Bahasa dan Pustaka BruneiCataloguing-in-publication
BRUNEI Darussalam key indicators 2015 : release 1 : half year. --Bandar Seri Begawan : Department of Statistics, Department of Economic Planning and Development Prime Minister’s Office, 2015. 68p. cm. ISBN 978-99917-944-2-6 (kulit lembut) 1. Economic indicators--Brunei Darussalam--Statistics--Periodicals. 2. Brunei Darussalam--Economic conditions--Statistics--Periodicals. 330.905955 BRU (DDC22)

BRUNEI DARUSSALAMKEY INDICATORS 2015RELEASE 1 : HALF YEAR
JABATAN PERANGKAANJABATAN PERANCANGAN DAN KEMAJUAN EKONOMI (JPKE)
JABATAN PERDANA MENTERINEGARA BRUNEI DARUSSALAM
DEPARTMENT OF STATISTICSDEPARTMENT OF ECONOMIC PLANNING AND DEVELOPMENT (DEPD)
PRIME MINISTER’S OFFICEBRUNEI DARUSSALAM

WAWASAN 2035
WAWASAN BRUNEI 2035By 2035, Brunei Darussalam aims to be recognised for:- The accomplishments of its well-educated and highly skilled people
- Its population living with high quality of life- A sustainable and dynamic economy
We will need to develop and implement an integrated andwell-coordinated national strategy comprisingof the following key elements:
SECURITYSTRATEGY
EDUCATIONSTRATEGY
LOCAL BUSINESSDEVELOPMENTSTRATEGY
SOCIALSECURITYSTRATEGY
INFRASTRUCTUREDEVELOPMENT
STRATEGY
ENVIRONMENTALSTRATEGY
INSTITUTIONALDEVELOPMENT
STRATEGY
ECONOMICSTRATEGY
BDKI 2015 Release:1

BDKI 2015 Release:1
VISION AND MISSION
Department of Economic Planning & Development
Vision
Progressive and Sustainable Economic Growth to Achieve Wawasan Brunei 2035
Mission
Visionary Economic Planning, Innovative Implementation and High Quality Statistics

TABLE OF CONTENTS
CONTENTS PAGES
POPULATION
LABOUR FORCE
VITAL STATISTICS
GROSS DOMESTIC PRODUCTS
INTERNATIONAL MERCHANDISE TRADE STATISTICS
CONSUMER PRICE INDEX
OIL AND GAS
BANKING AND FINANCE
EXCHANGE RATE
GOVERNMENT FINANCE
EDUCATION
1 - 4
5 - 6
7 - 10
11 - 20
21 - 28
29 - 30
31 - 32
33 - 36
37 - 38
39 - 40
41 - 44
BDKI 2015 Release:1

TABLE OF CONTENTS
CONTENTS PAGES
HEALTH
TRANSPORT
COMMUNICATION
UTILITIES
AGRICULTURE
FORESTRY
FISHERY
MISCELLANEOUS
NOTES
LIST OF SOURCES
ENQUIRIES
45 - 46
47 - 50
51 - 52
53 - 54
55 - 58
59
60
61 - 64
65 - 66
67 - 69
70
BDKI 2015 Release:1

BDKI 2015 Release:11
Total 399,800 406,200 411,900
Male 206,700 210,300 213,500
Female 193,100 195,900 198,400
Annual Rate of Increase 1.6 1.6 1.4
Population by Residential Status
Brunei Citizens 286,500 291,800 296,500
Permanent Residents 27,200 28,100 28,900
Temporary Residents 86,100 86,300 86,500
Area: 5,765 Square Km
Population Density 69.3 70.5 71.4
(Persons per Square Km)
POPULATION 2012 2013 2014

2BDKI 2015 Release:1
Population by Racial Group
Malays 262,800 267,200 271,100
Chinese 41,000 41,600 41,900
Others 96,000 97,400 98,900
Population by District
Brunei Muara 285,300 290,500 295,300
Belait 61,500 62,500 63,400
Tutong 44,100 44,300 44,300
Temburong 8,900 8,900 8,900
POPULATION
2012 2013 2014

BDKI 2015 Release:13
Population Median Age (Years) 28.0 28.5 29.0
Population by Age Group
0-4 31,100 32,000 32,400
5-9 33,000 31,900 31,500
10-14 35,500 35,600 35,400
15-19 35,000 35,100 35,200
20-24 37,400 36,400 35,600
25-29 39,300 39,700 39,400
30-34 37,800 38,300 38,800
35-39 34,100 34,700 35,100
40-44 31,200 32,000 32,900
45-49 25,400 26,300 27,700
50-54 20,800 22,200 22,600
55-59 15,000 16,100 17,100
60-64 9,500 10,400 11,500
65 and Over 14,700 15,500 16,700
POPULATION 2012 2013 2014
2012 2013 2014

4BDKI 2015 Release:1
POPULATION

LABOUR FORCE (1)
BDKI 2015 Release:15
1991 2001 2011
(%)
Working Age Population Between 15-64 Years
Labour Force 110,583 156,893 201,474
Male 73,858 91,953 116,517
Female 36,725 64,940 84,957
Employed 105,397 145,554 182,659
Male 71,130 85,219 107,709
Female 34,267 60,335 74,950
Unemployed 5,186 11,339 18,815
Male 2,728 6,734 8,808
Female 2,458 4,605 10,007
Labour Force Participation Rate 67.6 70.5 71.9
Male 84.3 82.0 80.3
Female 48.3 58.8 62.9
Unemploymet Rate (%) 4.7 7.2 9.3
Male 3.7 7.3 7.6
Female 6.7 7.1 11.8
(%)
(Based on International Definition)

LABOUR FORCE
BDKI 2015 Release:1 6
2011
Working Age Population Between 18-59 Years
Labour Force 198,515
Male 114,595
Female 83,920
Employed 180,704
Male 106,315
Female 74,389
Unemployed 17,811
Male 8,280
Female 9,531
Labour Force Participation Rate 79.2
Male 88.0
Female 69.7
Unemploymet Rate (%) 9.0
Male 7.2
Female 11.4
(%)
(Based on National Definition)

VITAL STATISTICS
2012 2013 2014
BDKI 2015 Release:17
Registered Live Births 6,909 6,680 6,891
Male 3,611 3,467 3,585
Female 3,298 3,213 3,306
Birth Rate per 1,000 Population 17.3 16.4 16.7
Birth Ratio (Male per 100 Female) 109.5 107.9 107.9
Total Fertility Rate 1.9 1.9 1.9
Brunei Citizens 2.4 2.3 2.3
Permanent Residents 2.1 2.1 1.9
Temporary Residents 1.0 1.0 1.3
2011

VITAL STATISTICS
2012 2013 2014
8BDKI 2015 Release:1
Life Expectancy at Birth (Years) 78.1 77.1 77.4
Male 76.3 75.7 75.9
Female 79.9 78.4 78.8
Registered Deaths 1,216 1,398 1,470
Male 696 778 832
Female 520 620 638
Death Rate per 1,000 Population 3.0 3.4 3.6
Infant Mortality Rate per 1,000 Live Births
9.3 7.6 7.4
Under 5 Mortality Rate per 1,000 Live Births
10.4 9.7 8.7

BDKI 2015 Release:19
VITAL STATISTICS
2012 2013 2014
Total Marriages 2,671 2,741 2,992
Marriages by Type:
Muslim 2,389 2,502 2,693
Civil 184 129 138
Customary and Others 98 110 161
Marriages by District
Brunei Muara 1,824 1,905 1,988
Belait 343 358 419
Tutong 318 317 358
Temburong 62 74 85
Outside Brunei 124 87 141
10BDKI 2015 Release:1
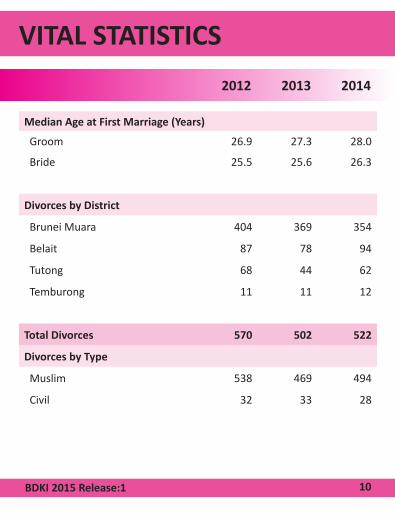
VITAL STATISTICS
2012 2013 2014
Median Age at First Marriage (Years)
Groom 26.9 27.3 28.0
Bride 25.5 25.6 26.3
Divorces by District
Brunei Muara 404 369 354
Belait 87 78 94
Tutong 68 44 62
Temburong 11 11 12
Total Divorces 570 502 522
Divorces by Type
Muslim 538 469 494
Civil 32 33 28

GROSS DOMESTIC PRODUCT
BDKI 2015 Release:111
H1/2014 H2/2014 H1/2015
By Sector at Current Prices (BND Million)
Oil and Gas Sector 7,525.1 6,405.1 5,436.6
Non Oil and Gas Sector 3,906.6 4,170.3 3,855.8
Government Sector 1,434.3 1,672.7 1,344.1
Private Sector 2,472.3 2,497.6 2,511.7
Gross Value Added 11,431.8 10,575.4 9,292.5
Taxes less Subsidies on Products (215.3) (120.1) (178.2)
Gross Domestic Product 11,216.4 10,455.2 9,114.3
By Sector at Current Prices (% Share)
Oil and Gas Sector 67.1 61.3 59.6
Non Oil and Gas Sector 34.8 39.9 42.3
Government Sector 12.8 16.0 14.7
Private Sector 22.0 23.9 27.6
Gross Value Added 101.9 101.1 102.0

GROSS DOMESTIC PRODUCT
12BDKI 2015 Release:1
H1/2014 H2/2014 H1/2015
By Sector at Constant Prices (BND Million)
Oil and Gas Sector 5,683.0 5,316.5 5,491.2
Non Oil and Gas Sector 3,935.2 4,120.9 3,866.5
Government Sector 1,431.6 1,665.4 1,344.0
Private Sector 2,503.6 2,455.5 2,522.5
Gross Value Added 9,618.2 9,437.4 9,357.7
Taxes Less Subsidies on Products (178.4) (175.0) (173.6)
Gross Domestic Product 9,439.8 9,262.3 9,184.2
Growth Rate (%) at Constant Prices
Oil and Gas Sector (5.7) (1.6) (3.4)
Non Oil and Gas Sector (2.8) 2.0 (1.7)
Government Sector 2.0 5.7 (6.1)
Private Sector (5.3) (0.3) 0.8
Gross Value Added (4.5) (0.0) (2.7)
Taxes Less Subsidies on Products (4.5) (0.0) (2.7)
Gross Domestic Product (4.5) (0.0) (2.7)

GROSS DOMESTIC PRODUCT
BDKI 2015 Release:113
H1/2014 H2/2014 H1/2015
By Kind of Economic Activity at Current Prices (BND Million)
Agriculture, Forestry and Fishery 97.6 89.3 100.3
Industrial Sector 7,871.7 6,827.5 5,801.5
Mining 5,748.6 4,886.1 4,126.8
Manufacturing 1,874.3 1,620.2 1,410.3
Construction 182.5 243.0 202.5
Electricity and Water 66.4 78.1 61.9
Services Sector 3,462.4 3,658.6 3,390.7
Wholesale and Retail Trade 501.9 414.0 494.4
Transport and Storage 157.2 213.6 142.8
Information and Communication 138.2 142.3 132.7
Financial and Insurance Activities 448.7 486.8 457.3
Real Estate and Ownership of Dwellings
333.6 334.8 371.1
Education 272.4 295.4 258.2
Health 116.8 147.4 111.5
Business Services 355.8 318.6 343.5
Other Private Services 84.9 86.1 85.7
Public Administration 1,052.8 1,219.7 993.4

GROSS DOMESTIC PRODUCT
14BDKI 2015 Release:1
H1/2014 H2/2014 H1/2015
Gross Value Added 11,431.8 10,575.4 9,292.5
Taxes Less Subsidies on Products (215.3) (120.1) (178.2)
Gross Domestic Product 11,216.4 10,455.2 9,114.3

GROSS DOMESTIC PRODUCT
BDKI 2015 Release:115
H1/2014 H2/2014 H1/2015
By Kind of Economic Activity at Constant Prices (BND Million)
Agriculture, Forestry and Fishery 75.6 73.7 80.1
Industrial Sector 6,043.1 5,746.9 5,874.4
Mining 4,378.5 4,158.7 4,221.3
Manufacturing 1,407.8 1,263.2 1,373.7
Construction 184.2 249.8 211.8
Electricity and Water 72.5 75.2 67.7
Services Sector 3,499.4 3,616.7 3,403.3
Wholesale and Retail Trade 502.5 414.5 506.1
Transport and Storage 165.3 215.7 154.2
Information and Communication 138.2 137.9 128.7
Financial and Insurance Activities 481.1 454.4 476.3
Real Estate and Ownership of Dwellings
337.8 341.2 350.7
Education 270.0 294.9 260.0
Health 117.1 146.4 109.4
Business Services 354.2 315.5 340.6
Other Private Services 83.2 83.9 83.9
Public Administration 1,050.1 1,212.4 993.4

GROSS DOMESTIC PRODUCT
16BDKI 2015 Release:1
Gross Value Added 9,618.2 9,437.4 9,357.7
Taxes Less Subsidies on Products (178.4) (175.0) (173.6)
Gross Domestic Product 9,439.8 9,262.3 9,184.2
H1/2014 H2/2014 H1/2015

GROSS DOMESTIC PRODUCT
H1/2014 H2/2014 H1/2015
BDKI 2015 Release:117
GDP by Type of Expenditureat Current Prices (BND Million)
11,592.6 9,768.9 8,156.8
Household Final Consumption Expenditure
1,574.5 1,805.3 1,716.9
Government Final Consumption Expenditure
2,330.2 2,355.4 2,132.5
Gross Capital Formation 2,378.9 3,566.0 2,349.1
Gross Fixed Capital Formation 2,361.9 3,547.6 2,332.1
Construction 1,116.3 1,279.4 1,063.8
Machinery 1,245.6 2,268.1 1,268.3
Change in Inventories 17.0 18.5 17.0
Exports of Goods and Services 8,379.0 6,390.6 5,051.5
Less: Imports of Goods & Services 3,070.0 4,348.5 3,093.1
Statistical Discrepancy (376.2) 686.4 945.6
GROSS DOMESTIC PRODUCT
H1/2014 H2/2014 H1/2015
18BDKI 2015 Release:1
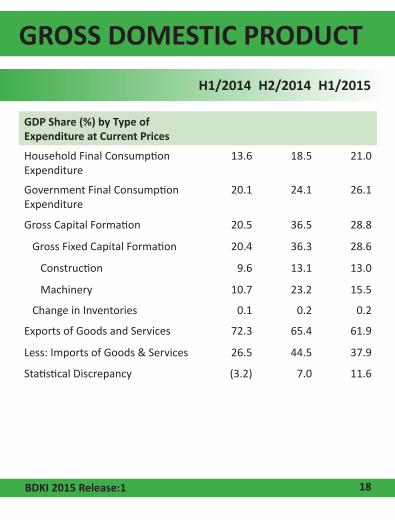
GDP Share (%) by Type of Expenditure at Current Prices
Household Final Consumption Expenditure
13.6 18.5 21.0
Government Final Consumption Expenditure
20.1 24.1 26.1
Gross Capital Formation 20.5 36.5 28.8
Gross Fixed Capital Formation 20.4 36.3 28.6
Construction 9.6 13.1 13.0
Machinery 10.7 23.2 15.5
Change in Inventories 0.1 0.2 0.2
Exports of Goods and Services 72.3 65.4 61.9
Less: Imports of Goods & Services 26.5 44.5 37.9
Statistical Discrepancy (3.2) 7.0 11.6

GROSS DOMESTIC PRODUCT
H1/2014 H2/2014 H1/2015
BDKI 2015 Release:119
GDP by Type of Expenditureat Constant Prices (BND Million)
Household Final Consumption Expenditure
1,519.7 1,718.9 1,725.9
Government Final Consumption Expenditure
2,324.6 2,341.2 2,131.4
Gross Capital Formation 2,398.0 3,443.4 2,426.4
Gross Fixed Capital Formation 2,380.9 3,424.8 2,409.1
Construction 1,128.2 1,315.1 1,119.2
Machinery 1,252.7 2,109.7 1,289.9
Change in Inventories 17.1 18.7 17.3
Exports of Goods and Services 6,274.4 5,380.8 5,152.3
Less: Imports of Goods & Services 3,077.4 4,366.9 3,129.8
Statistical Discrepancy 0.6 745.0 885.8

GROSS DOMESTIC PRODUCT
H1/2014 H2/2014 H1/2015
20BDKI 2015 Release:1
GDP Growth Rate (%) by Type of Expenditure at Constant Prices
(2.9) (4.4) (12.0)
Household Final Consumption Expenditure
(8.4) 2.3 13.6
Government Final Consumption Expenditure
1.4 4.3 (8.3)
Gross Capital Formation (46.4) (19.4) 1.2
Gross Fixed Capital Formation (46.6) (19.6) 1.2
Construction (29.6) (8.6) (0.8)
Machinery (56.2) (25.1) 3.0
Change in Inventories 18.9 15.2 1.2
Exports of Goods and Services (3.6) 4.3 (17.9)
Less: Imports of Goods & Services (40.9) (1.7) 1.7

IMTS
INTERNATIONAL MERCHANDISE TRADE STATISTICS (BND Million)
Exports f.o.b. 7,226.6 6,171.6 4,838.7
Imports c.i.f. 1,832.4 2,723.7 2,083.0
Total Trade 9,059.0 8,895.3 6,921.7
Balance of Trade 5,394.2 3,447.9 2,755.7
BDKI 2015 Release:121
H1/2014 H2/2014 H1/2015

IMTS
22BDKI 2015 Release:1
Exports by Commodity Section (BND Million)
Foods 23.9 15.5 3.4
Beverages and Tobacco 10.0 2.7 1.5
Crude Materials Inedible 7.4 10.4 7.1
Mineral Fuels 6,898.4 5,500.3 4,521.2
Animal and Vegetable Oils and Fats
0.0 0.0 0.0
Chemicals 148.3 453.4 83.3
Manufactured Goods 30.4 37.4 39.8
Machinery & Transport Equipments
74.6 107.7 138.6
Miscellaneous Manufactured Articles
25.4 33.8 38.9
Miscellaneous Transactions 8.2 10.4 4.9
Total: 7,226.6 6,171.6 4,838.7
H1/2014 H2/2014 H1/2015

IMTS
H1/2014 H2/2014 H1/2015
Exports by Country of Destination (BND Million)
ASEAN 1,740.5 906.4 975.1
Indonesia 714.4 97.8 39.8
Cambodia 0.1 0.0 0.0
Laos 0.0 0.0 -
Malaysia 402.8 69.4 295.1
Myanmar 0.1 0.0 0.0
Philippines 91.3 6.0 4.4
Singapore 172.5 264.2 195.3
Thailand 351.3 346.9 386.6
Viet Nam 8.0 122.0 53.9
European Union 9.5 14.8 13.6
Denmark 0.2 0.1 0.0
France 0.3 0.2 0.1
Germany 2.0 3.4 1.6
Italy 1.0 0.6 0.0
Netherlands 2.5 5.1 2.3
United Kingdom 3.5 5.3 9.1
BDKI 2015 Release:123

H1/2014 H2/2014 H1/2015
Exports by Country of Destination (BND Million)
Others 5,473.3 5,245.6 3,847.0
Australia 474.6 539.6 206.7
China 23.8 97.8 15.9
Hong Kong 2.9 5.1 5.3
Japan 2,774.0 2,568.2 1,813.7
Republic of Korea 1,050.8 418.1 643.4
Taiwan 228.7 510.8 356.1
U.S.A 13.1 12.1 63.8
Other Countries 3.3 4.8 3.1
Total: 7,226.6 6,171.6 4,838.7
24BDKI 2015 Release:1
IMTS

IMTS
H1/2014 H2/2014 H1/2015
Major Domestic Exports by Country of Destination (Crude Petroleum)(BND Million)
Australia 473.5 536.4 203.6
India 614.3 596.9 452.5
Indonesia 705.5 90.0 38.2
Japan 155.7 49.6 37.1
Republic of Korea 429.7 286.2 191.5
New Zealand 280.0 178.7 283.6
Singapore 86.3 143.9 78.8
Thailand 332.9 336.6 381.1
Viet Nam - 116.5 51.1
Total: 3,247.8 2,334.7 1,844.0
Major Domestic Exports by Country of Destination (Natural Gas) (BND Million)
Japan 2,599.2 2,488.7 1,774.8
Republic of Korea 599.8 116.3 447.4
Malaysia 241.9 - 108.5
Taiwan 209.3 493.8 346.4
Total: 3,650.2 3,165.4 2,677.1
BDKI 2015 Release:125
IMTS
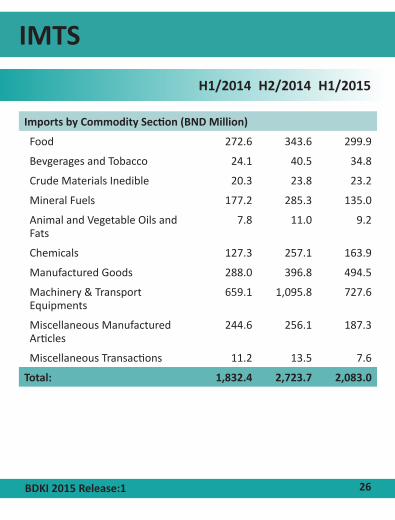
Imports by Commodity Section (BND Million)
Food 272.6 343.6 299.9
Bevgerages and Tobacco 24.1 40.5 34.8
Crude Materials Inedible 20.3 23.8 23.2
Mineral Fuels 177.2 285.3 135.0
Animal and Vegetable Oils and Fats
7.8 11.0 9.2
Chemicals 127.3 257.1 163.9
Manufactured Goods 288.0 396.8 494.5
Machinery & Transport Equipments
659.1 1,095.8 727.6
Miscellaneous Manufactured Articles
244.6 256.1 187.3
Miscellaneous Transactions 11.2 13.5 7.6
Total: 1,832.4 2,723.7 2,083.0
H1/2014 H2/2014 H1/2015
26BDKI 2015 Release:1

IMTS
H1/2014 H2/2014 H1/2015
Imports by Country of Origin (BND Million)
ASEAN 899.7 1,335.9 941.2
Indonesia 60.5 71.7 66.4
Cambodia 1.4 2.1 0.0
Laos 0.0 0.0 0.0
Malaysia 366.2 571.9 483.4
Myanmar 0.7 0.2 0.1
Philippines 4.0 7.8 6.0
Singapore 373.3 558.2 284.5
Thailand 88.1 116.8 86.4
Viet Nam 5.5 7.3 14.4
European Union 229.8 287.4 249.9
Denmark 2.1 3.3 1.4
France 9.1 18.5 13.2
Germany 118.8 77.7 78.1
Italy 17.5 55.1 66.1
Netherlands 21.2 55.5 19.7
United Kingdom 49.4 59.7 51.6
BDKI 2015 Release:127

H1/2014 H2/2014 H1/2015
Imports by Country of Origin (BND Million)
Others 674.9 1,056.2 861.1
Australia 22.2 40.3 34.3
China 178.4 274.6 274.8
Hong Kong 17.4 18.8 17.8
Japan 82.9 100.7 209.5
Republic of Korea 66.2 329.9 72.6
Taiwan 18.2 26.9 17.0
U.S.A 212.3 198.8 184.1
Other Countries 28.0 44.1 30.7
Total: 1,832.4 2,723.7 2,083.0
28BDKI 2015 Release:1
IMTS

CONSUMER PRICE INDEXConsumer Price Index (Jan 2010=100)
Major Groups Weights
Food and Non-Alcoholic Beverages 1,911
Clothing and Footwear 424
Housing, Water, Electricity, Gas and Other Fuels
1,114
Furnishings, Household Equipment and Routine Household Maintenance
1,101
Health 132
Transport 1,883
Communication 601
Recreation and Culture 913
Education 390
Restaurants and Hotels 885
Miscellaneous Goods and Services 646
Total: 10,000
BDKI 2015 Release:129
CONSUMER PRICE INDEX
30BDKI 2015 Release:1
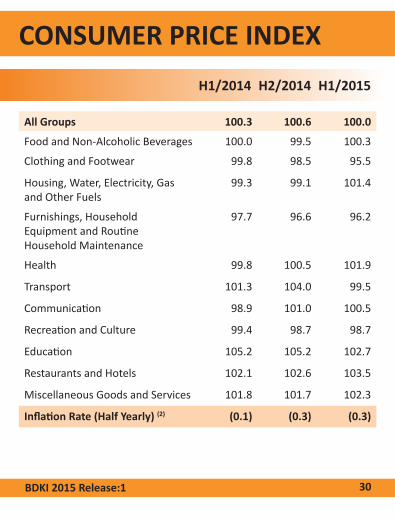
H1/2014 H2/2014 H1/2015
All Groups 100.3 100.6 100.0
Food and Non-Alcoholic Beverages 100.0 99.5 100.3
Clothing and Footwear 99.8 98.5 95.5
Housing, Water, Electricity, Gas and Other Fuels
99.3 99.1 101.4
Furnishings, Household Equipment and Routine Household Maintenance
97.7 96.6 96.2
Health 99.8 100.5 101.9
Transport 101.3 104.0 99.5
Communication 98.9 101.0 100.5
Recreation and Culture 99.4 98.7 98.7
Education 105.2 105.2 102.7
Restaurants and Hotels 102.1 102.6 103.5
Miscellaneous Goods and Services 101.8 101.7 102.3
Inflation Rate (Half Yearly) (2) (0.1) (0.3) (0.3)

OIL AND GAS
BDKI 2015 Release:131
Average Production
Oil (Thousand Barrels/Day) 134.54 118.49 130.08
Gas (KBOE/Day) 242.08 221.51 244.78
Average Exports
Oil (Thousand Barrels/Day) 126.83 108.46 126.30
LNG (MMBtu/Day) 952,262.54 821,557.07 944,233.66
Average Price of Exports
Oil (US Dollars/Barrel) 113.74 93.78 59.78
LNG (US Dollars/MMBtu) 16.820 16.370 11.609
H1/2014 H2/2014 H1/2015

OIL AND GAS
BDKI 2015 Release:1
Domestic Consumption (Thousand m3)
Motor Gasoline (Mogas)
Premium RON 97 151.49 153.58 156.88
Super RON 92 3.54 3.05 2.35
Regular RON 85 22.17 21.81 21.91
Diesel 156.98 154.78 160.81
Kerosene/Jet A-1 48.17 46.09 49.09
LPG 15.62 16.13 16.18
Gas 850,059 793,516 824,923
H1/2014 H2/2014 H1/2015
32

BANKING AND FINANCE
BDKI 2015 Release:133
H1/2014 H2/2014 H1/2015
End of Period:
Money Supply and Quasi Money (BND Million)
Money Supply 4,532 4,396 4,675
Quasi Money 10,778 10,227 9,975
Total 15,310 14,623 14,650
Currency in Circulation (BND Million)
Gross Circulation 1,202 1,272 1,235
Active Circulation 1,000 998 988
BANKING AND FINANCE
34BDKI 2015 Release:1
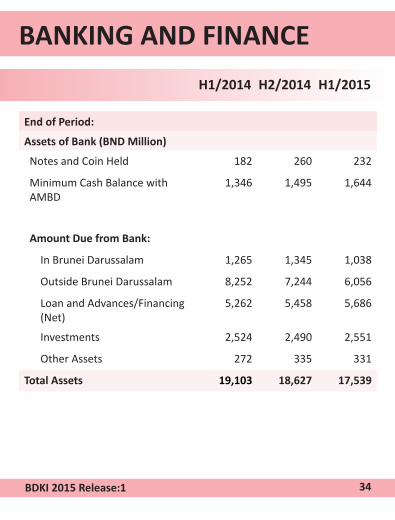
H1/2014 H2/2014 H1/2015
End of Period:
Assets of Bank (BND Million)
Notes and Coin Held 182 260 232
Minimum Cash Balance with AMBD
1,346 1,495 1,644
Amount Due from Bank:
In Brunei Darussalam 1,265 1,345 1,038
Outside Brunei Darussalam 8,252 7,244 6,056
Loan and Advances/Financing (Net)
5,262 5,458 5,686
Investments 2,524 2,490 2,551
Other Assets 272 335 331
Total Assets 19,103 18,627 17,539

BANKING AND FINANCE
H1/2014 H2/2014 H1/2015
BDKI 2015 Release:135
End of Period:
Liabilities of Bank (BND Million)
Deposits (Non-bank Customers):
Demand 4,307 3,975 4,681
Time 7,620 7,257 5,621
Savings 4,144 4,264 4,193
Others 111 123 117
Amount Due to Banks:
In Brunei Darussalam 332 351 265
Outside Brunei Darussalam 241 153 157
Other (Capital Funds and Other Liabilities)
2,349 2,505 2,505
Total Liabilities 19,103 18,627 17,539

BANKING AND FINANCE
36BDKI 2015 Release:1

EXCHANGE RATES
H1/2014 H2/2014 H1/2015
BDKI 2015 Release:137
EXCHANGE RATES
Brunei Dollars to 1 unit:
US Dollars:
Period Average 1.26 1.28 1.35
End of Period 1.25 1.33 1.35
Brunei Dollars to 1 unit:
End of Period:
Australian Dollars 1.18 1.08 1.04
Sterling Pound 2.13 2.06 2.12
Euro 1.71 1.60 1.50

EXCHANGE RATES
H1/2014 H2/2014 H1/2015
38BDKI 2015 Release:1
Brunei Dollars to 100 units:
End of Period:
Hongkong Dollars 16.09 17.08 17.38
Indonesian Rupiah 0.01 0.01 0.01
Japanese Yen 1.23 1.11 1.10
Philippines Peso 2.86 2.96 2.99
Saudi Riyals 33.23 35.27 35.93
Swiss Francs 140.55 133.28 144.03
Thai Baht 3.84 4.03 3.99

GOVERNMENT FINANCE (3)
H1/2014 H2/2014 H1/2015
BDKI 2015 Release:139
Total Government Revenue (BND Million)
4,976.1 3,091.7 2,156.6
Oil and Gas Revenue 4,480.7 2,709.3 1,759.6
Revenues from Governments Operations
464.7 370.2 393.0
Taxes 254.7 151.3 200.7
Fees, Charges and Rent 185.9 207.2 175.9
Others 24.1 11.6 16.5
Returns from Investments and Savings
30.8 12.3 4.0

GOVERNMENT FINANCE
H1/2014 H2/2014 H1/2015
40BDKI 2015 Release:1
Total Government Expenditure (BND Million)
3,897.7 3,378.3 3,385.4
Charged Expenditure 777.4 651.8 605.4
Ordinary Expenditure 2,521.2 2,187.9 2,317.2
Personnel Emoluments 914.3 1,025.9 897.5
Other Charges Annually Recurrent
1,133.7 882.1 1,024.8
Other Charges Special Expenditures
473.2 279.9 394.9
Development Expenditure 599.2 538.6 462.9
Balance Budget 1,078.4 (286.6) (1,228.9)

BDKI 2015 Release:141
EDUCATION
2012 2013 2014
Educational Institutions (Number) (4) 258 256 258
Government School 175 177 178
Pre-School/Kindergarten/ Primary/Preparatory
123 125 125
Secondary/Sixth Form (Pre- University)
38 38 39
Technical/Vocational 9 9 9
Tertiary 5 5 5
Private Schools 83 79 80
Kindergarten/Primary/ Secondary/ Six Form (Pre-University)
79 74 75
Technical/Vocational 2 3 3
Tertiary 2 2 2

42BDKI 2015 Release:1
EDUCATION
2012 2013 2014
Teachers (Persons) 10,902 10,852 10,922
Government Schools 8,583 8,499 8,598
Pre-School/Kindergarten 247 205 259
Primary/Preparatory 3,008 2,955 2,905
Secondary/Sixth Form (Pre- University)
4,136 4,157 4,176
Technical/Vocational 535 539 566
Tertiary 657 643 692
Private Schools 2,319 2,353 2,324
Pre-School/Kindergarten 716 482 527
Primary/Preparatory 1,030 1,135 1,099
Secondary/Sixth Form (Pre-University)
463 585 526
Technical/Vocational 58 79 91
Tertiary 52 72 81

BDKI 2015 Release:143
EDUCATION
2012 2013 2014
Students (Persons) 117,286 116,255 116,163
Government Schools 82,331 81,092 79,070
Pre-School/Kindergarten 3,285 2,961 3,052
Primary/Preparatory 26,819 26,005 24,962
Secondary 34,303 32,654 31,937
Sixth Form (Pre-University) 6,025 6,102 5,165
Technical/Vocational 4,311 4,900 3,667
Tertiary 7,588 8,470 10,287
Private Schools 34,955 35,163 37,093
Pre-School/Kindergarten 9,810 10,073 10,324
Primary/Preparatory 15,934 16,085 16,116
Secondary 5,722 5,675 5,832
Sixth Form (Pre-University) 382 446 453
Technical/Vocational 1,653 1,793 1,955
Tertiary 1,454 1,091 2,413

44BDKI 2015 Release:1
EDUCATION
2012 2013 2014
Male Student per 100 Female Student
Pre-School/Kindergarten 105 103 106
Primary 107 106 106
Secondary 114 112 112
Sixth Form (Pre-University) 70 68 72
Technical/Vocational 102 113 127
Tertiary 63 59 66
Literacy Rate (%) Aged 10 and Above
Total 96.8 97.2 97.6
Male 97.8 98.1 98.3
Female 95.8 96.3 96.9

BDKI 2015 Release:145
HEALTH
2012 2013 2014
Medical Institutions (Number)
Hospital 6 6 7
Medical Centre 8 8 8
Health Centre 17 17 17
Health Clinic 22 20 20
Beds in Hospital 1,098 1,143 1,330
Medical Personnels (Persons)
Physician 596 656 700
Dentist 94 105 104
Nurse 2,585 2,596 2,538
Pharmacist 51 62 62
Midwife 473 450 314
Population per Doctor 671 619 588
(5)

46BDKI 2015 Release:1
HEALTH
2012 2013 2014
Major Causes of Death 1,216 1,398 1,470
Cancer 280 295 300
Heart Diseases (Including Acute Rheumatic Fever)
152 183 227
Diabetes Mellitus 123 131 141
Cerebrovascular Diseases 70 82 104
Hypertensive Diseases 45 71 64
Bronchitis, Chronic and Unspecified Emphysema and Asthma
39 54 63
Influenza and Pneumonia 41 48 48
Septicaemia 27 35 42
Transport Accidents 45 30 28
Other Diseases 394 469 453

TRANSPORT
BDKI 2015 Release:147
2012 2013 2014
Administrative Classification
Roads under Supervision by PWD 2,908.9 2,935.8 2,976.1
Roads under Supervision by District Office
110.7 138.2 120.6
Roads under Supervision by ABDB
103.0 92.9 94.4
Length of Road (Kilometre) 3,122.7 3,166.9 3,191.2
Land Transport
Number of Newly Registered Vehicles
8,942 9,271 8,056
Private Cars 8,550 8,902 7,675
Goods Vehicles 164 152 184
Motorcycles/Scooters 181 153 125
Others 47 64 72
H1/2014 H2/2014 H1/2015

TRANSPORT
48BDKI 2015 Release:1
2012 2013 2014
Air Transport
Aircraft Movements (Number)
Schedule 13,038 13,124 12,989
Non-Schedule 772 954 861
Military 8,856 11,380 10,830
Passengers (Thousand)
Inward 715.0 739.5 717.1
Outward 705.1 735.8 716.9
Transit 260.8 239.2 212.9
Freight (Thousand Kilogramme)
Inward 15,123.4 10,401.7 11,955.1
Outward 8,740.2 5,805.8 8,350.2
TRANSPORT
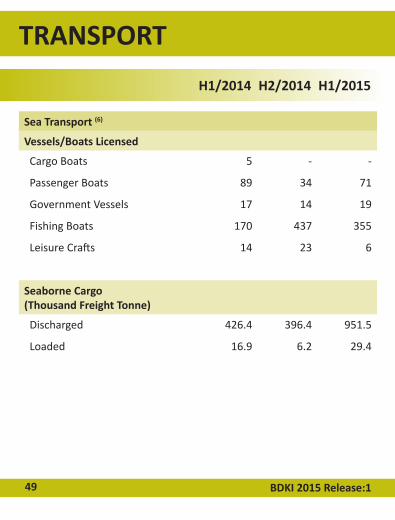
H1/2014 H2/2014 H1/2015
BDKI 2015 Release:149
Sea Transport (6)
Vessels/Boats Licensed
Cargo Boats 5 - -
Passenger Boats 89 34 71
Government Vessels 17 14 19
Fishing Boats 170 437 355
Leisure Crafts 14 23 6
Seaborne Cargo (Thousand Freight Tonne)
Discharged 426.4 396.4 951.5
Loaded 16.9 6.2 29.4

TRANSPORT
50BDKI 2015 Release:1

COMMUNICATION
H1/2014 H2/2014 H1/2015
Fixed Lines
Number of Direct Exchange Line (Thousand)
50.7 48.2 42.3
Direct Exchange Line Per 100 Population
12.4 11.7 10.3
Mobile Subcribers (Cumulative) 466,043 465,767 489,509
Postpaid 74,591 77,111 75,183
Prepaid 391,452 388,656 414,326
Mobile Penetration Rate (%) 113.9 113.1 118.8
BDKI 2015 Release:151

COMMUNICATION
H1/2014 H2/2014 H1/2015
Internet Subscribers (Number) 52,327 52,757 57,727
Fixed & Mobile Broadband 52,275 52,737 57,709
Fixed Broadband 24,933 26,270 32,207
Mobile Broadband 27,342 26,467 25,502
Dial-Up 52 20 18
Internet Penetration Rate % 12.8 12.8 14.0
Postal
Post Office (Number) 25 26 26
Postal Services
Letter Mail 3,663,511 3,617,731 3,570,623
Printed Matter 155,330 209,845 171,584
Postcards 12,569 11,755 16,393
Registered Articles 80,957 85,169 91,300
Parcels, Small Packets & Other 133,980 170,978 149,913
52BDKI 2015 Release:1

UTILITIES
BDKI 2015 Release:153
H1/2014 H2/2014 H1/2015
Electricity
Generation Capacity (MW)
777.7 777.0 777.7
Production (KWh) 1,992,595,592 2,062,007,350 2,071,799,000
Consumption (KWh) 1,829,681,695 1,935,842,246 1,894,734,592
Coverage in Electricity Supply (%)
99.9 99.9 99.9
Water
Production (Thousand m3 )
85,961.1 80,168.2 75,902.3
Consumption (Thousand m3 )
45,587.9 44,754.7 44,922.6
Coverage in Water Supply (%)
99.9 99.9 99.9

UTILITIES
54BDKI 2015 Release:1

AGRICULTURE
Main Crop Production (Metric Tonne)
Rice 802.1 579.6 1,231.2
Vegetable 6,023.6 6,684.5 6,510.1
Fruit 1,608.7 4,225.7 2,254.5
Local Livestock Production
Buffaloes
Slaughtered (Number) 158 170 153
Slaughtered Weight (Metric Tonne)
27.7 29.8 26.8
Cattles
Slaughtered (Number) 45 67 45
Slaughtered Weight (Metric Tonne)
5.6 8.4 5.6
BDKI 2015 Release:155
H1/2014 H2/2014 H1/2015

AGRICULTURE
Goats
Slaughtered (Number) 364 457 414
Slaughtered Weight (Metric Tonne)
4.1 5.1 4.7
Local Poultry Production
Broiler Chickens
Number (Thousand) 8,583.4 8,375.1 8,358.8
Slaughtered (Thousand) 7,819.6 8,135.1 7,268.6
Slaughtered Weight (Metric Tonne)
11,729.4 12,202.6 10,902.9
Layer Chickens
Chicken Eggs (Million) 66.9 64.8 63.7
H1/2014 H2/2014 H1/2015
BDKI 2015 Release:1 56

AGRICULTURE
Import Livestock Production
Buffaloes
Slaughtered (Number) 535 1,842 703
Slaughtered Weight (Metric Tonne)
111.3 383.2 146.2
Chilled & Frozen (Metric Tonne) 1,437.8 644.0 1,191.0
Cattles
Slaughtered (Number) 2,729 2,804 2,788
Slaughtered Weight (Metric Tonne)
622.2 639.3 635.7
Chilled & Frozen (Metric Tonne) 528.5 364.6 565.4
Goats
Slaughtered (Number) 263 289 63
Slaughtered Weight (Metric Tonne)
5.2 5.8 1.3
BDKI 2015 Release:157
H1/2014 H2/2014 H1/2015
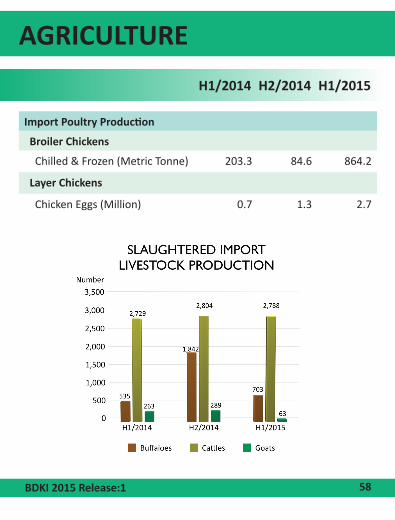
AGRICULTURE
Import Poultry Production
Broiler Chickens
Chilled & Frozen (Metric Tonne) 203.3 84.6 864.2
Layer Chickens
Chicken Eggs (Million) 0.7 1.3 2.7
58BDKI 2015 Release:1
H1/2014 H2/2014 H1/2015

FORESTRY
H1/2014 H2/2014 H1/2015
BDKI 2015 Release:159
Forestry
Production
Round Timber (Thousand m3 ) 54.8 49.7 36.7
Sawn Timber (Thousand m3 ) 23.2 20.9 16.0
Bakau Poles (Thousand Pieces) 80.5 45.9 51.4
Charcoal (Thousand Kilogramme) 2.1 3.4 12.2

FISHERY
60BDKI 2015 Release:1
H1/2014 H2/2014 H1/2015
Fishery
Local Production (Metric Tonne)
Capture Industry 7,853.8 7,246.7 9,524.8
Commercial Scale 6,295.8 5,578.5 7,510.7
Small Scale 1,558.0 1,668.2 2,014.1
Aquaculture Industry 321.9 439.5 440.9
Fish in Cages 71.4 91.4 75.5
Farm Prawn 247.8 343.5 360.4
Fresh Water Fish 2.7 4.6 5.1
Crab 0.0 0.0 0.0
Processing Industry 1,982.2 2,086.6 2,324.8

MISCELLANEOUS
BDKI 2015 Release:161
H1/2014 H2/2014 H1/2015
Road Casualties (Number)
Person Injured 215 218 236
Accident 1,637 1,729 1,687
Death 10 14 7
Crime (Number) (7)
Total Cases 5,889 6,441 6,824
Against
Person 607 600 545
Property 3,152 3,545 3,854
Penal Code 1,142 1,189 1,263
Misuse of Drug 283 360 381
Other Enacment 705 747 781
Crime Rate per 1,000 Population 15 16 17
2012 2013 2014

MISCELLANEOUS
62BDKI 2015 Release:1
H1/2014 H2/2014 H1/2015
Climate
Temperature (Degree Celcius)
Maximum (Mean) 32.9 32.5 33.0
Minimum (Mean) 23.1 23.9 24.2
Relative Humidity (%)
Maximum (Mean) 99 99 98
Minimum (Mean) 60 62 61
Total Rainfall (Millimetre) 1,652.9 1,520.6 1,203.0
Pensions
Persons Receiving Old Age Pension by District
26,706 27,496 28,415
Brunei Muara 16,462 17,006 17,640
Belait 5,468 5,600 5,767
Tutong 3,867 3,959 4,074
Temburong 909 931 934

BDKI 2015 Release:163
MISCELLANEOUS
2012 2013 2014
Arrivals by Purpose of Entry
Tourist 82,996 86,599 78,436
Business 43,916 47,592 43,818
Relatives 23,271 24,199 24,845
Transit 32,680 26,609 19,470
Exhibition 1,302 1,317 1,152
Government 6,678 13,581 7,204
Others 18,265 25,007 26,064
Total: 209,108 224,904 200,989

MISCELLANEOUS
64BDKI 2015 Release:1

NOTES
BDKI 2015 Release:165
(1) Labour Force data are based from the population and Housing Census 1991, 2001 and 2011.
(2) - Inflation rate is taken as the percentage change between the half year index of the reference year and that of the previous year.
(3) - Calendar Year.
(4) - Including schools under The Ministry of Religious Affairs, The Ministry of Defence, The ministry of Culture, Youth and Sports, Prime Minister’s Office and Private Schools.
(5) - Not including nurses with midwifery qualification.
(6) - Based on number of licenses issued annually by MarineDepartment.
(7) - Crime cases reported to the Royal Brunei Police Force.

NOTES
( H1 ) - January - June
( H2 ) - July - December
f.o.b - free on board
c.i.f - cost, insurance and freight
( e ) - Estimate
( r ) - Revised
( p ) - Provisional
( USD ) - U.S. Dollars
( BND ) - Brunei Dollars
( KWh ) - Kilo Watt hour
( KBOE ) - Thousand Barrel of Oil Equivalent
( MMBtu ) - Million British thermal unit
( MMscf ) - Million standard cubic feet
( MW ) - Mega Watt
( - ) - Nil
Total inside the tables may not tally due to rounding
66BDKI 2015 Release:1

LIST OF SOURCES
MINISTRY DEPARTMENTS
PRIME MINISTER’S OFFICE
ATTORNEY GENERAL’S CHAMBERS
LEGAL DEPARTMENT
INFORMATION DEPARTMENT
PUBLIC SERVICE DEPARTMENT
ELECTRICAL SERVICES DEPARTMENT
ROYAL BRUNEI POLICE FORCE
ENERGY DEPARTMENT
MINISTRY OF FINANCE
TREASURY DEPARTMENT
MINISTRY OF HOMEAFFAIRS
DEPARTMENT OF IMMIGRATION
AND NATIONAL REGISTRATION
DISTRICT OFFICES
BDKI 2015 Release:167

LIST OF SOURCES
MINISTRY DEPARTMENTS
MINISTRY OF HEALTH DEPARTMENT OF PLANNING, RESEARCH & DEVELOPMENT
MINISTRY OF DEVELOPMENT
PUBLIC WORKS DEPARTMENT
- DEPARTMENT OF WATER SERVICES (DWS)
MINISTRY OF EDUCATION
DEPARTMENT OF PLANNING, RESEARCH & DEVELOPMENT
MINISTRY OF INDUSTRY & PRIMARY RESOURCES
DEPARTMENT OF AGRICULTURE AND AGRIFOOD
FORESTRY DEPARTMENT
FISHERIES DEPARTMENT
TOURISM DEVELOPMENT DEPARTMENT
68BDKI 2015 Release:1

LIST OF SOURCES
BDKI 2015 Release:169
MINISTRY DEPARTMENTS
MINISTRY OFCOMMUNICATION
MARINE DEPARTMENT
PORTS DEPARTMENT
CIVIL AVIATION DEPARTMENT
DEPARTMENT OF LAND TRANSPORT
POSTAL SERVICE DEPARTMENT
MINISTRY OF CULTURE, YOUTH & SPORTS
COMMUNITY DEVELOPMENTDEPARTMENT
OTHER AGENCIES AUTORITI MONETARI BRUNEIDARUSSALAM (AMDB)
AUTHORITY FOR INFO-COMMUNICATIONSTECHNOLOGY INDUSTRY OF BRUNEIDARUSSALAM (AITI)
BRUNEI SHELL MARKETING SDN BHD (BSM)
BRUNEI SHELL PETROLEUM SDN BHD (BSP)
TELEKOM BRUNEI BERHAD (TELBRU)
MINISTRY DEPARTMENTS
MINISTRY OF HEALTH DEPARTMENT OF PLANNING, RESEARCH & DEVELOPMENT
MINISTRY OF DEVELOPMENT
PUBLIC WORKS DEPARTMENT
- DEPARTMENT OF WATER SERVICES (DWS)
MINISTRY OF EDUCATION
DEPARTMENT OF PLANNING, RESEARCH & DEVELOPMENT
MINISTRY OF INDUSTRY & PRIMARY RESOURCES
DEPARTMENT OF AGRICULTURE AND AGRIFOOD
FORESTRY DEPARTMENT
FISHERIES DEPARTMENT
TOURISM DEVELOPMENT DEPARTMENT

ENQUIRIES
Department of StatisticsDepartment of Economic Planning and Development (JPKE)Prime Minister’s OfficeBrunei Darussalam
Telephone : 673 2233344E-mail : [email protected] : http://www.depd.gov.bn
70BDKI 2015 Release:1