permit, port and fishery revenue exposure analysis
TRANSCRIPT

Permit, Port and Fishery Revenue Exposure
AnalysisUpdated NY Bight Wind Areas
Intergovernmental Renewable Energy Task Force Meeting
New York, New York
November 28, 2018

Contact
Kathryn ConnellyEconomistNEFSC/[email protected]
Benjamin GaluardiStatisticianGARFOGloucester, [email protected]
The information presented is a collaborative effort of the Regional Wind Team from GARFO/NEFSC

Analyses
VMS Effort
Combines Primary and Secondary Recommended Areas
Displayed graphics:
Scallop, Surfclam, and Ocean Quahog effort
Other important species effort
Permit exposure in the two areas
VTR Modeled (DePiper 2014)
Primary separate from Secondary
Displayed graphs:
Total revenue, all species
Scallop, Surfclam, and Ocean Quahog revenue
Other important species revenue
Impacted ports, all species
Permit dependence on the two areas

VMS Vessel monitoring system (VMS) data was used to
identify hotspots and permit exposure
Polling time is variable between fisheries, but is at least once per hour
Zero to five knots is the fishing speed filter
Data is binned in 5 nautical mile squares
Grid cells with less than three unique permits are masked.

VTR Data and Model The model compares single, self-reported VTR point locations, with
more detailed haul-by-haul position data on the subset of VTR trips that were observed (DePiper 2014).
Trip attributes (e.g. revenue, days absent, etc.) can be distributed in concentric rings around the VTR point, proportional to the modeled probability of fishing. The sizes of the rings vary with trip characteristics such as gear type and number of days absent.
The landed values associated with particular trips were estimated using average monthly prices for the species from the dealer database, and all values are adjusted to January 2014 dollars for comparability across years.
Clam logbook data include the revenue from each trip and these values were used directly instead of estimating value from average monthly prices.

Data Caveats Limited haul-by-haul location data to develop a reliable distribution model
Spatial imprecision of VTR points can lead to the assignment of revenue in unlikely locations.
Some types of fishing are known to occur within a particular depth range, and fishing often occurs along depth contours, so modelling a circular distribution of fishing effort around a VTR point can attribute fishing to unlikely locations.
Only a portion of the lobster fishery is captured in the VTR data, and VTR data underrepresent lobster revenue/effort.
VTR data do not explain the dynamic factors that influence landings and revenue. It would be incorrect to assume from the data that low catch means a low abundance of species.
Redistribution of effort into other locations may result in other effects, but alternative fishing choices are difficult to predict.
The primary focus here is on landings and ex-vessel revenues, the information provided should be considered a partial analysis; optimally, broader societal impacts would need to be determined.
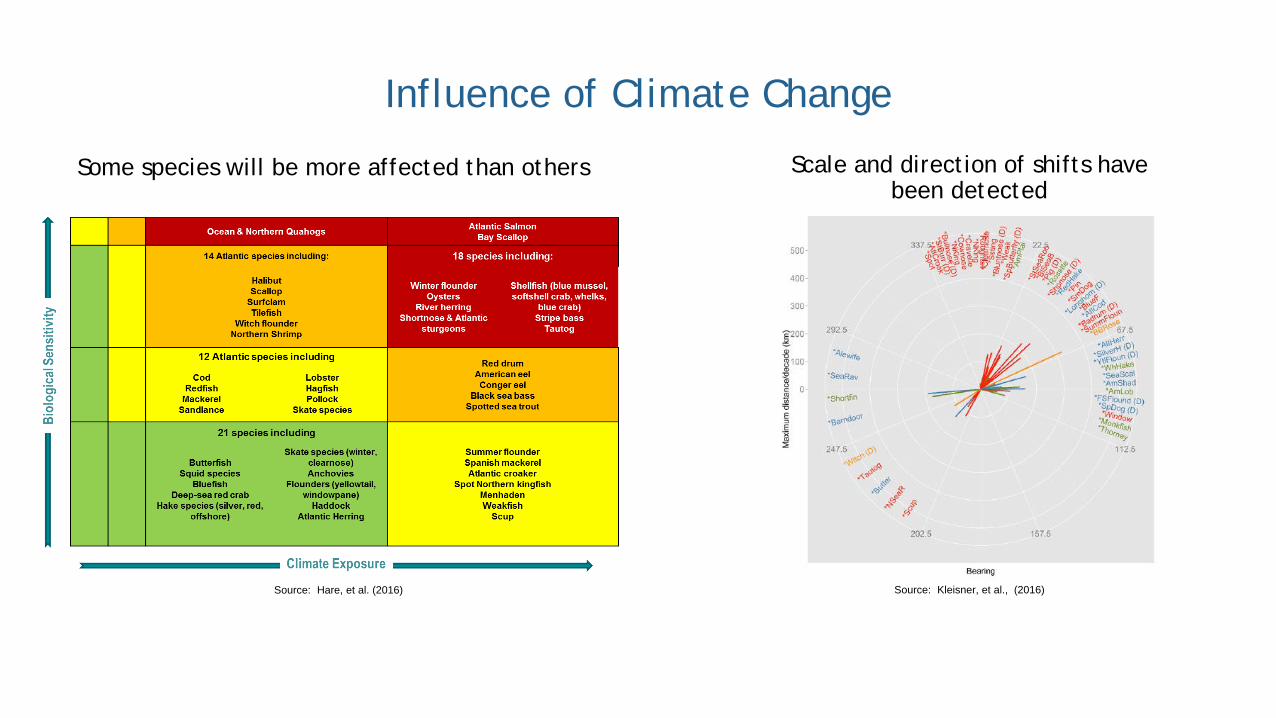
Influence of Climate Change
Some species will be more affected than others
Source: Hare, et al. (2016)
Scale and direction of shifts have been detected
Source: Kleisner, et al., (2016)

Data Usage
We believe this type of information is suitable for planning level applications, instead of for an authoritative assessment of potential fisheries impacts.
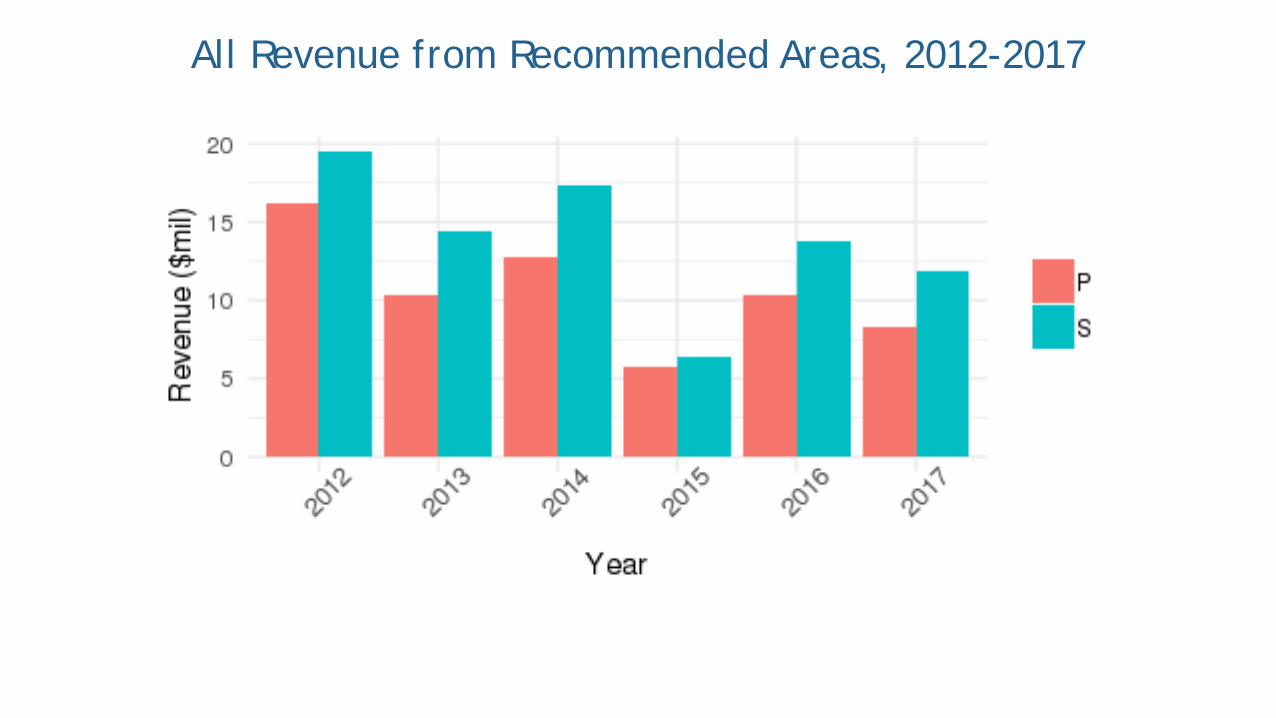
All Revenue from Recommended Areas, 2012-2017

Scallop Revenue from Recommended Areas, 2012-2017
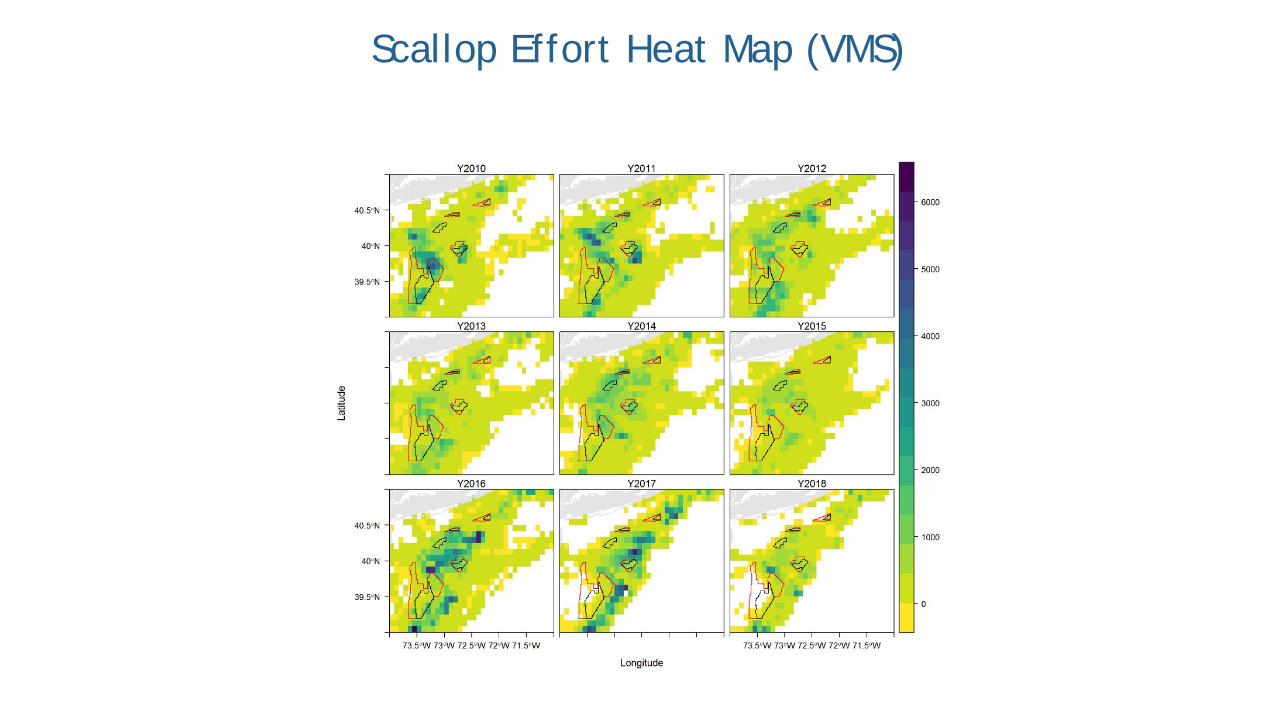
Scallop Effort Heat Map (VMS)
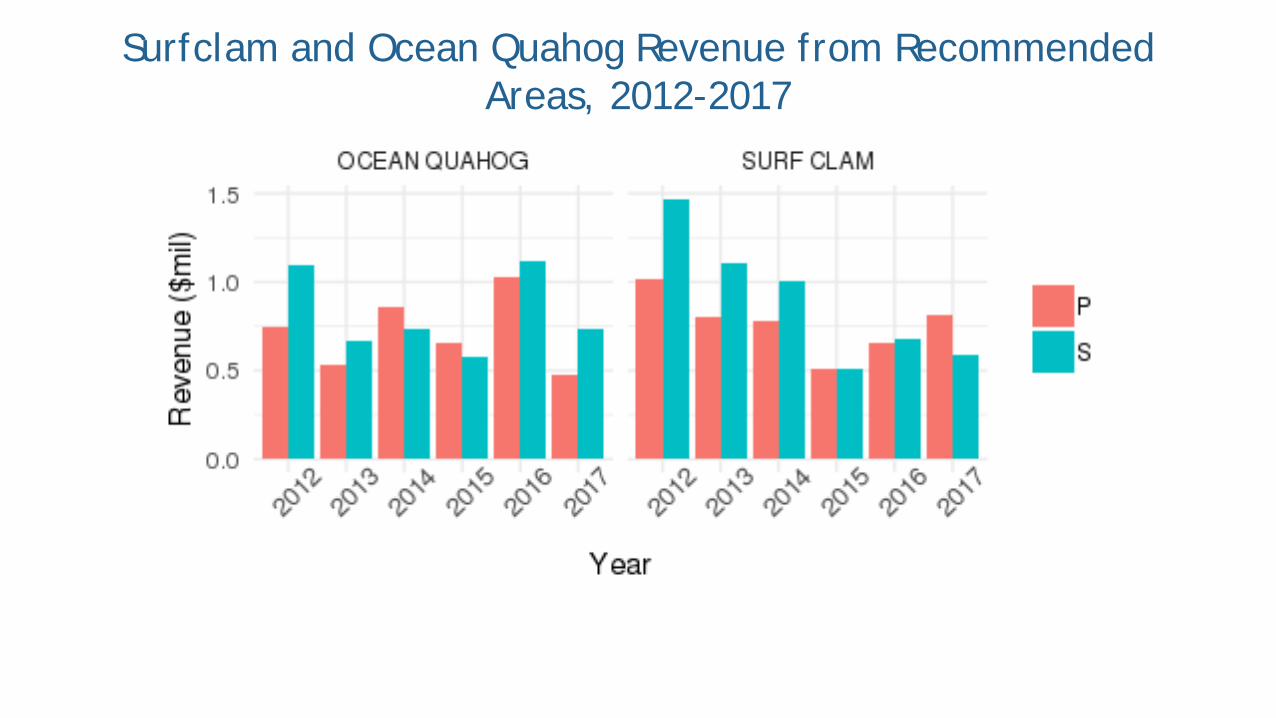
Surfclam and Ocean Quahog Revenue from Recommended Areas, 2012-2017

Surfclam/Ocean Quahog Effort Heat Map (VMS)

Other Top Species Revenue, 2012-2017

Declared out of Fishery (DOF) Effort Heat Map (VMS)

Squid, Mackerel, and Butterfish Effort Heat Map (VMS)

Groundfish (Northeast Multispecies) Effort Heat Map (VMS)

Highly Migratory Species Effort Heat Map (VMS)

Top Ports by Landed Revenue from Recommended Areas, 2012-2017

Other Ports by Landed Revenue from Recommended Areas, 2012-2017

Total Permits Exposed within Primary &Secondary Areas (VMS)
Scallop Surfclam/Ocean Quahog DOF Squid/Mack/Butterfish Herring Groundfish Highly
Migratory
2010 261 22 120 18 12 <3 <3
2011 243 24 111 18 11 <3 3
2012 212 26 95 13 10 <3 <3
2013 174 25 83 25 7 <3 <3
2014 264 23 99 33 4 <3 <3
2015 190 23 94 23 4 3 <3
2016 277 23 119 39 10 4 <3
2017 278 31 80 28 5 <3 <3
2018 146 29 44 20 11 <3 <3

Effort (%) in Primary and Secondary Areas Relative to Total Fishery (VMS)
Scallop Surfclam/Ocean Quahog DOF Squid/Mack/Butterfish Herring Groundfish Highly
Migratory
2010 7.54 4.77 3.87 0.14 0 0 0
2011 2.59 7.20 1.53 0.03 0.06 0 0
2012 4.22 7.30 1.69 0.07 0.06 0 0
2013 4.02 6.95 1.30 0.11 0.25 0 0
2014 5.59 7.59 1.77 0.13 0 0 0
2015 2.47 4.73 1.24 0.21 0 0 0
2016 2.90 5.11 0.40 0.10 0.93 0 0
2017 1.80 6.51 0.41 0.17 0 0 0
2018 1.06 10.53 0.16 0.07 0.50 0 0
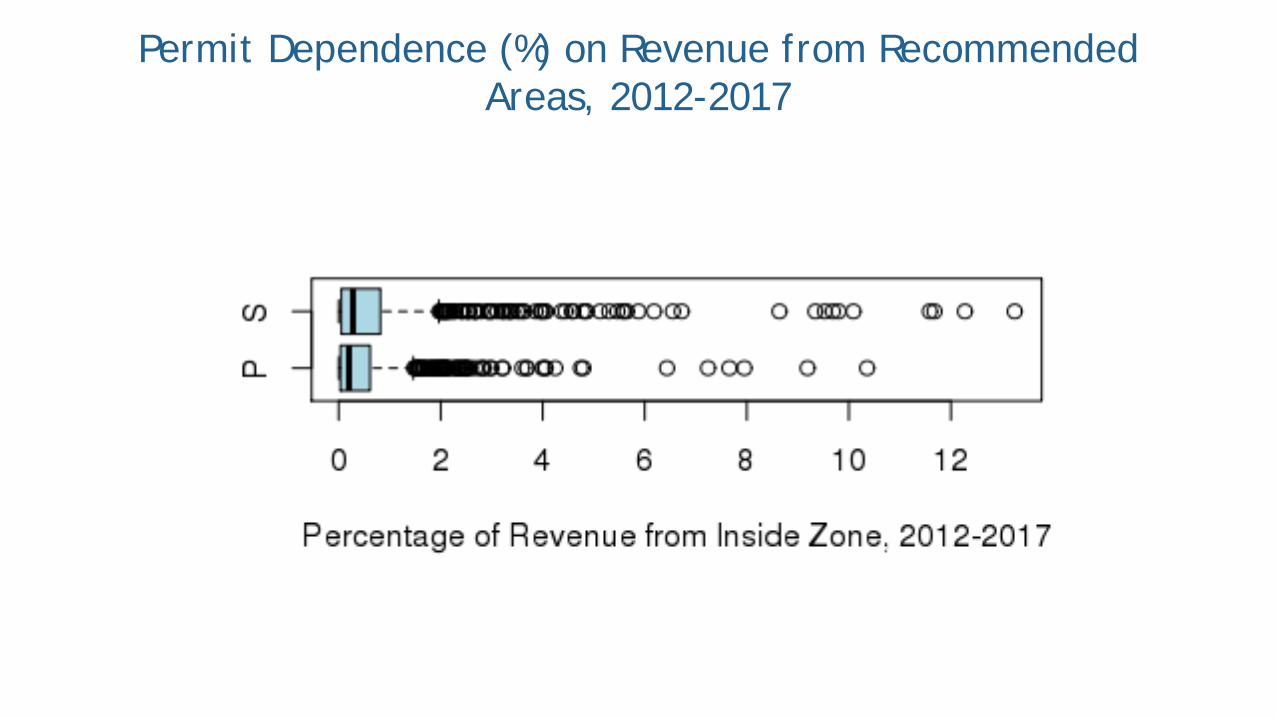
Permit Dependence (%) on Revenue from Recommended Areas, 2012-2017
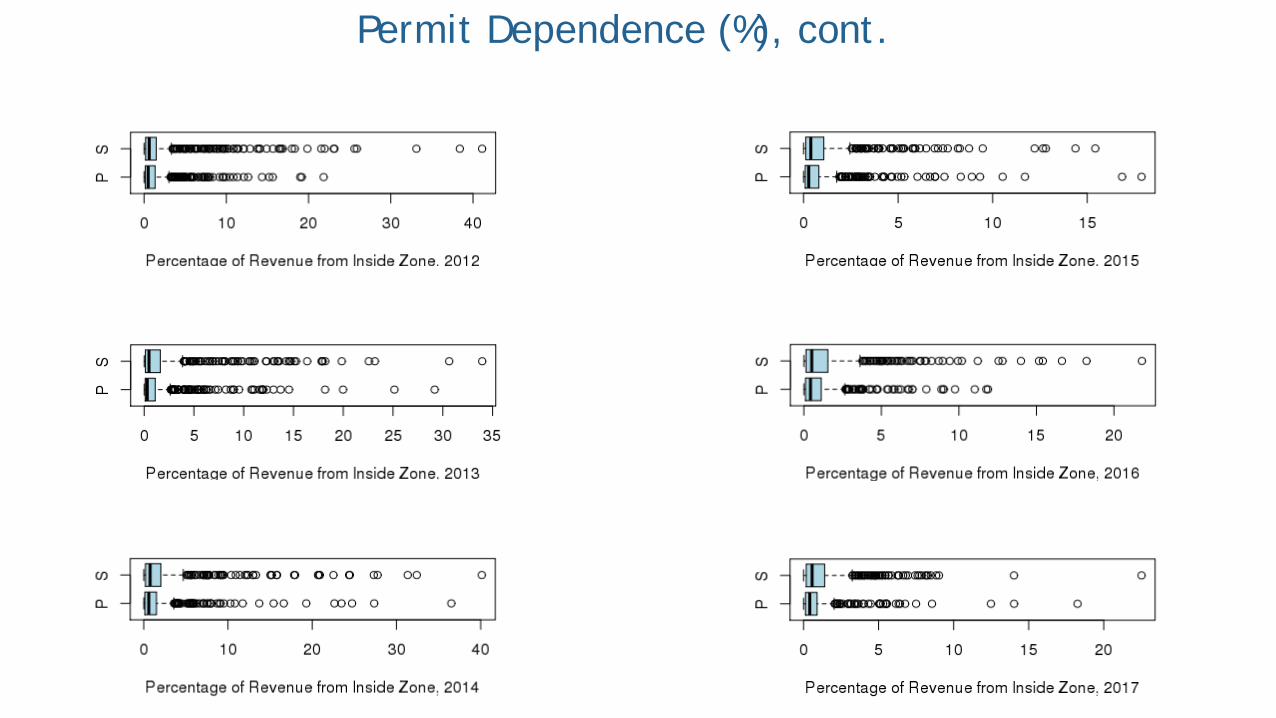
Permit Dependence (%), cont.
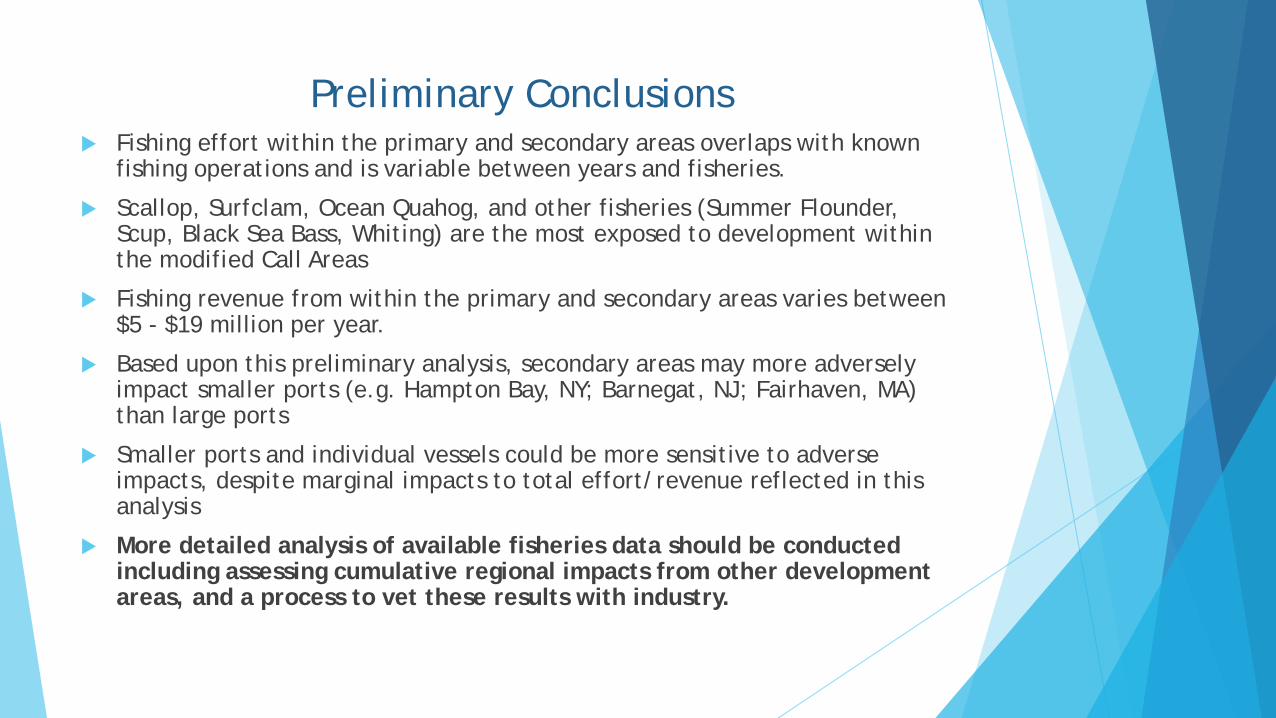
Preliminary Conclusions Fishing effort within the primary and secondary areas overlaps with known
fishing operations and is variable between years and fisheries.
Scallop, Surfclam, Ocean Quahog, and other fisheries (Summer Flounder, Scup, Black Sea Bass, Whiting) are the most exposed to development within the modified Call Areas
Fishing revenue from within the primary and secondary areas varies between $5 - $19 million per year.
Based upon this preliminary analysis, secondary areas may more adversely impact smaller ports (e.g. Hampton Bay, NY; Barnegat, NJ; Fairhaven, MA) than large ports
Smaller ports and individual vessels could be more sensitive to adverse impacts, despite marginal impacts to total effort/revenue reflected in this analysis
More detailed analysis of available fisheries data should be conducted including assessing cumulative regional impacts from other development areas, and a process to vet these results with industry.
Sources
DePiper, Geret. “Statistically Assessing the Precision of Self-reported VTR Fishing Locations.” National Marine Fisheries Service, NOAA, June 2014. https://www.nefsc.noaa.gov/publications/tm/tm229/tm229.pdf.
Original GARFO, NMFS, MAFMC, NEFMC public comment: http://s3.amazonaws.com/nefmc.org/180607_GARFO-to-BOEM-re-NY-Bight-Call-For-Information_NMFS-Comments_June-2018.pdf