permanent sample plots
TRANSCRIPT
More than just forest data
Editors: Hari Priyadi, Petrus Gunarso and Markku Kanninen
Proceedings of International Workshop on Promoting Permanent Sample Plots in Asia and the Pacific RegionBogor, Indonesia, 3-5 August 2005
PERMANENT SAMPLE PLOTS
Mo
re than
just fo
rest data
PER
MA
NEN
T SAM
PLE P
LOTS
Edito
rs: Hari Priyad
i, Petrus G
un
arso an
d M
arkku K
ann
inen
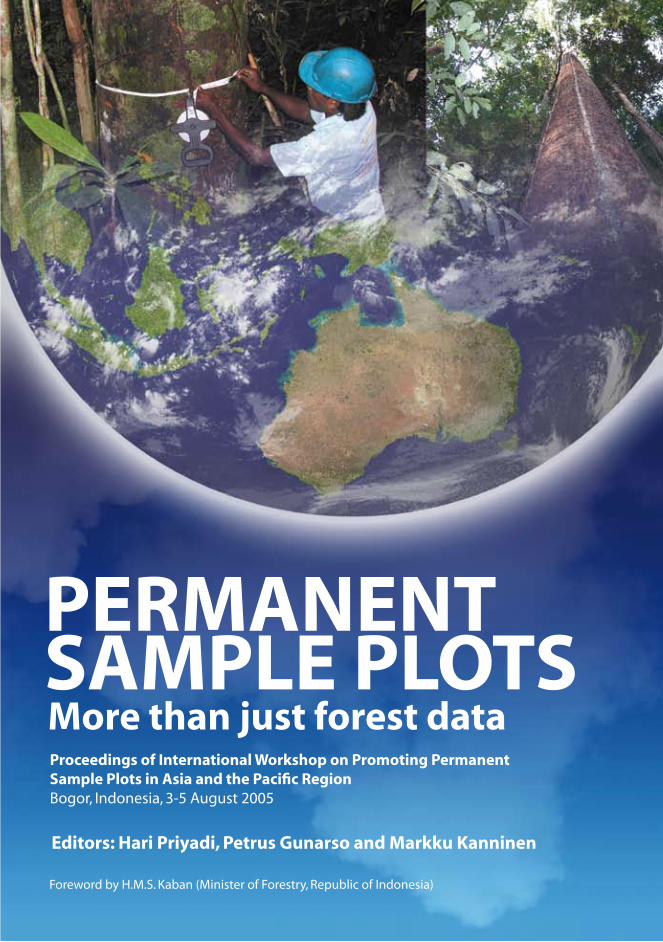
Permanent Sample Plots (PSP) are an important tool to monitor forest dynamics and changes, long term growth and yield and to provide critical data for evaluation of ecological models. For silvicultural purposes PSP supply data on diameter and volume increment as well as stand structure dynamics. This data is very useful for calculating Annual Allowable Cut (AAC) in a forest management unit. In addition, there has been increasing demand for data and information collected from PSP for accounting purposes in carbon-sequestration projects; the use of long-term measurements provided by PSP would increase the profile and credibility of such projects.
PSP will become more important in the future. They will likely be used in measures to indicate forest health, for instance, and those related to the services provided by forests, such as the provision of water and carbon storage. One of the reasons for convening the workshop was to strengthen collaboration between institutions already working with PSP with the aim of building a network in Southeast Asia and beyond.
Foreword by H.M.S. Kaban (Minister of Forestry, Republic of Indonesia)
Proceedings of International Workshop on Promoting Permanent Sample Plots in Asia and the Pacifi c Region
Bogor, Indonesia, 3-5 August 2005
EditorsHari PriyadiPetrus GunarsoMarkku Kanninen
More than just forest data
PERMANENT SAMPLE PLOTS

© 2006 by CIFOR & ITTOAll rights reserved. Published in 2006Printed by Citra Kharisma Bunda, JakartaCover photos by Hari Priyadi, Ahmad Zakaria and Eko PriantoGlobe image taken from http://agora.ex.nii.ac.jp/digital-typhoon/Design and layout by Eko Prianto
Published byCenter for International Forestry ResearchJl. CIFOR, Situ Gede, Sindang Barang, Bogor Barat 16680, IndonesiaTel.: +62 (251) 622622; Fax: +62 (251) 622100E-mail: [email protected] Web site: http://www.cifor.cgiar.org
Priyadi, Hari et al. (eds.)
PERMANENT SAMPLE PLOTS: More than just forest dataProceedings of International Workshop on Promoting Permanent Sample Plots in Asia and the Pacifi c Region: Bogor, Indonesia, 3-5 August 2005/ed. By Hari Priyadi, Petrus Gunarso, Markku Kanninen. Bogor, Indonesia: Center for International Forestry Research (CIFOR), 2006.
xix, 169p.
ISBN 979-24-4632-X
1. sample plot technique 2. forest trees 3. growth 4. yields 5. data collection 6. silvicultural systems 7. reduced impact logging 8. selective felling 9. carbon sequestration 10. Indonesia 11. Malaysia 12. Papua New Guinea 13. Laos 14. Netherlands 15. France 14. determination I. Gunarso, Petrus II. Kanninen, Markku.

Foreword vOpening Remarks viiiWelcoming Address xiPreface xiiiWorkshop Summary xvAcknowledgements xviii
An overview on sustainable forest management in Peninsular Malaysia Abd. Rahman Kassim 1
Making sustainability work for complex forests: towards adaptive forest yield regulation Herry Purnomo, Teddy Rusolono, Muhdin, Tatang Tiryana and Endang Suhendang 10
A brief note on TPTJ (Modifi ed Indonesia Selective Cutting System) from experience of PT Sari Bumi Kusuma (PT SBK) timber concessionaire Gusti Hardiansyah, Tri Hardjanto and Mamat Mulyana 23
Indonesian natural tropical forests would not be sustainable under the current silvicultural guidelines – TPTI: a simulation studyPaian Sianturi and Markku Kanninen 32
Tree growth and forest regeneration under different logging treatments in permanent sample plots of a hill mixed dipterocarps forest, Malinau Research Forest, Malinau, East Kalimantan, Indonesia Hari Priyadi, Douglas Sheil, Kuswata Kartawinata, Petrus Gunarso, Plinio Sist and Markku Kanninen 47
Progress on the studies of growth of logged-over natural forests in Papua New Guinea Peki Mex M. 70
Table of contents

Foreword
Assalamualaikum wr. Wb.
Good morning and may peace and prosperity be with all of us.
Distinguished Director General of CIFOR, Dr. David Kaimowitz, Director of Environmental Services and Sustainable Use of Forests Program, Dr. Markku Kaninnen, Workshop participants.
Ladies and Gentlemen,First of all, I would like to thank CIFOR for inviting me to officiate this workshop. It is a special honor to me to have a chance to be part of this event, which is of a high scientific eminence, and deals with an actual problem of natural forest management, namely the scarcity of growth and yield information. I also want to express my sincere appreciation to CIFOR for organizing this particular workshop.
Ladies and Gentlemen,I am not a forester by training, however I am a forester by nature and process which has given me sufficient knowledge to grasp the main logic of managing forests. First of all, I understand that the forest is a growing thing. It grows, not only the trees composing the forest, but the other components as well, grow dynamically. I further understand that the forest interacts with the site where it grows, with the local climate, and affected by external factors such as management regimes applied upon the forest. This growth aspect and the inter-relationship with many factors make the forest a very complex ecosystem. And since it is complex, it is by nature also quite fragile. Furthermore, because of this fragility, forests must be managed in a carefull manner, taking into account its inherent characteristics, including its growth behavior. To this point, I understand that sustainable utilization of forests is simply taking no more than the complex and growing entity can provide, which is determined by its growing ability.
MINISTER OF FORESTRY OF THE REPUBLIC OF INDONESIA
Forewordvi
Ladies and Gentlemen,I am not intending to teach you about forest growth, nor to brag of my limited knowledge of the subject. What I intended is merely to indicate that even a laymen like me can see the importance of this workshop in relation to attaining sustainable forest management.
Our predecessors actually have long adopted the same perception. I was informed that growth and yield research is old in Indonesia, dating back to the 19th century. A notable basic formula of relative-spacing for forest plantation management, which is still referred in today’s forest management handbook, was invented and fi rst published in the late 19th century by Mr Hart, a researcher at the Boschbouw Proefstation, Buitenzorg or Bogor. The tradition of establishing and measuring permanent sample plots (PSP) for monitoring forest growth continues in the period following the independence. From the accumulated data, we have developed stand tables for a number of forest plantation species in the century.
The tradition, however, began to discontinue in the mid seventies. That was the time when we started the exploitation of our natural forests in the outer islands. I discerned there might be a number of reasons for this.
Research, particularly on the subject of forest growth, is an undertaking that needs time in the scale of decades. The benefi ts are also not immediately recognizable. On the other hand, project-based planning approach, which was adopted in Indonesia in the several demands project output on as annual basis. In no way could forest growth research be able to give an output in such a short time. This fact alone may have led decision makers not to give adequate attention and allocate suffi cient budget on growth data collection. On a fundamental level, it is apparent that our lack of understanding on the laymen-logic of sustainable forest management is what led us to disregard the importance of forest growth data collection. Indeed, “mining” natural forests does not require any knowledge of growth and yield.
Ladies and Gentlemen,In the nineties we actually realized the mistake we have made. In 1994 the Minister of Forestry issued a decree requiring forest companies to establish and measure PSPs for monitoring the growth of the logged-over forest they managed. The growth data is to be submitted to FORDA of the Ministry of Forestry and, among others, will be used for calculating second cycle annual allowable cut. The data is to complement FORDA’s PSP data which is very limited in scope due to limited funding. For sometime this policy was implemented, and regardless of the quality of the data, at least there was a recognition that forest growth data is necessary and must be collected before it is too late. Unfortunately, the huge recession hit the country, forest companies collapsed, and most PSPs were never re-measured again.

H.M.S. Kaban vii
In the same period, there was cooperations with other countries, such as with France (CIRAD), UK (DFID) and The Netherlands (Tropenbosch) that included monitoring forest growth and yield as part of the subject of cooperation. I was told that these cooperation have resulted in substantial outputs, which turned out to be highly valuable. Among others, the Silvicultural Techniques for the Regeneration of Logged Over forest in East Kalimantan (STREK) PSP Series is now considered one of, if not the only, relatively good PSPs of Dipterocarp forests on earth.
Ladies and Gentlemen,You may have been informed about the soft landing policy issued in 2002. It was a good policy, which was aimed at saving the remaining natural forests by reducing the national annual allowable cut. When it comes to implementation, however, the policy could not be implemented as it was really intended. The constraint, as you may guest, was the scarcity of growth data which is needed for determining the right annual allowable cut. With the absence of the critical data, the policy was implemented in a modifi ed fashion. Ideally, the annual allowable cut of each single management unit must be calculated to come up with the aggregate national allowable cut. However, since it was not possible, the approach was the other way around, the national allowable cut was somehow determined, which was further disaggregated by province, and fi nally management unit. Of course that was not the right way of implementation.
With those illustrations, I want to indicate how I really welcome the workshop today. I have a high expectation that this workshop will be able to come up with a concrete and doable framework on how we together could be able to overcome the problem of forest growth data scarcity. The government of Indonesia will provide support and contribute to the effort. At this moment I understand that for some years FORDA has been putting more attention on this matter. And I know within its limitation FORDA also has something to contribute. I request FORDA to actively take part in this endeavor.
With that, Ladies and Gentlemen, I would like to conclude my words. Have a good and productive workshop. Thank you very much.
Wassalamualaikum Warachmatulahi Wabbarakatuh
Bogor, August 1, 2005
H.M.S. KabanMinister of ForestryRepublic of Indonesia

Opening remarks
His Excellency Minister of Forestry, today is represented by the Honorable Dr. Hadi Pasaribu, the Director General of Forestry Research and Development Agency (FORDA), Honorable Dr. Markku Kanninen, the Director of Environmental Services and Sustainable Forest Management Program of CIFOR, Distinguished Guests, Ladies and Gentlemen.
Good morning and welcome to CIFOR
First of all, I would like to thank all of you for coming to this workshop. I am pleased with the interest and response to this workshop. I have been informed that more than 75 participants applied for this workshop, and from those we have now 50 participants present here this morning and hopefully will be here until tomorrow. I have received some regrets and particularly I would like to convey the regret of my Director General, Dr. Kaimowitz, who is currently on his way from his duty travel to Brisbane for IUFRO Conference, so he cannot attend this workshop.
To those who have to travelled a long distance, I hope you had a suffi cient rest, and now you are fresh and well.
Let me start with introducing myself. My name is Petrus Gunarso and my current position here at CIFOR is coordinator for Malinau Research Forest. Malinau Research Forest is located in North East part of Kalimantan or Indonesian Borneo. The MRF is designated and provided by the government of Indonesia as a long term research site to CIFOR in Indonesia.
I take the fl oor here to representing the organizing committee of the workshop and the Malinau Research Forest. It would be interesting if we could organize this

Petrus Gunarso ix
workshop in Malinau, right in the middle of the forest in East Kalimantan, but due to limited resources and logistical problems we can not do so. I would like to share with you now the background of this workshop.
First, the recent discussion on Annual Allowable Cut, particularly in Indonesia, and its rationale in setting it up has triggered this workshop. The workshop is also a response to a call from the Minister of Forestry for research results derived from many long established PSP initiatives across Indonesia.
Second, from my communication with several colleagues from Asia and the Pacifi c region, we came up with a similar concern and similar feeling that we need to talk to each other on the data and results of PSP initiatives that has been established in the region ranging from eight to almost 20 years ago.
Third, the PSP as a long term observation of forest growth and yield is often neglected as a result of ignorance from those who are supposed to look after the sustainability of the forest. This is mainly due to imbalanced competition between a long term sustainability vision and a short term economic gain vision.
And lastly is the emerging possibility to utilize the data from PSP to measure Carbon Annual Increment, particularly important for Climate Change Monitoring.
The overall objectives of our two day workshop are:1. To share and compare data and analysis/results from different sites and
different methods for better understanding growth and yield, forest health, silviculture techniques and carbon stock.
2. To explore possibilities to develop a regional network of permanent sample plots.
3. To come up with possible silvicultural recommendations toward sustainable forest management.
Dr. Pasaribu and Dr. Kanninen, Ladies and Gentlemen, I would like to report to you the diversity and representativeness of participants that are present here today. It is truly international and represents Asia and the Pacifi c Regions. We have participants from:
Lao PDR 2 participantsMalaysia 1 participantPapua New Guinea 1 participantThailand 1 participant

Opening remarksx
The largest number is obviously from Indonesia with here 48 participants (representing FORDA 5, LIPI 7, Universities 13, MOF 4, International and National NGO 17 participants, private sector/concessionaries 1 and professional organization 1 participant).
I would like also to report that with us today are our colleagues from other networks, outside the region, from:
The Netherlands, representing sub tropical network: 1 participant France, representative of CIRAD Foret, bringing experience from network of tropical belt from Africa, Asia, and Latin America: 1 participant.
In total we have 50 participants.
In this occasion, I would like to thank the PERSAKI (The Indonesian Foresters Association) and INRR (Institute of Natural and Regional Resources) as our co-host of this workshop. This workshop is possible through funding of ITTO Project PD 39/00 Rev.3 (F) under the Forest and Livelihood Programme of CIFOR and Co Financed by Environmental Services and Forest Management Programme of CIFOR. I would like also express my sincere thanks to FORDA for actively participating since the initial stage in this workshop. I would like also to thank my colleagues and staff who have been working hard to make this workshop happen, to Hari Priyadi, Nani Djoko, Indah, Ketty, Kresno, Haris and Happy. These people will continue to serve you all during our two day workshop. If you have any problems, don’t hesitate to contact them.
I hope that we will have a good working experience together here in our campus and hope you all enjoy Bogor, the city of rain. Thank you.
Bogor, August 2005
Petrus GunarsoMalinau Research Forest Coordinator
Welcoming address
Good morning and welcome to you all,
First of all I would like to extend my warm thanks to the Minister of Forestry Mr. H.M.S. Kaban, represented here by Dr. Hadi Pasaribu, Director General of Forestry Research and Development Agency, for his kind welcoming words.
Issues and topics related to monitoring of forest ecosystems are gaining growing importance. We will be using permanent sample plots for monitoring of several of these topics. These include looking at forest health, forest productivity, and services other than wood such as water and climate regulation through carbon sequestration.
My home country, Finland was the fi rst country in the world to complete a national forest inventory in 1921. Since then, Finland has been doing that as a continuous exercise and will soon complete the 10th national inventory cycle. In addition, and as a response to concerns in the 1980s about forest ecosystem health, my countrymen established a network of 3500 permanent sample plots that have been monitored and measured ever since.
It is interesting to see how the focus of forest monitoring and measurement has changed over time in Europe. It started more than a hundred years ago by purely looking at the sustainability of timber supply. Then in the 1980’s the issue of forest health in relation to acid rain gained importance in Europe’s forestry agenda. This was refl ected in new monitoring schemes and now they are looking at biodiversity, carbon sequestration, and other aspects. My feeling is that we are heading in the same direction here in the Tropics, particularly if the second commitment period of the Kyoto Protocols includes all forests.
Since its inception in 1993, CIFOR’s work on permanent sample plots has been very important. As mentioned by Petrus Gunarso in his presentation, we have been

Welcoming addressxii
working with the kind support of the Indonesian Government in Malinau Research Forest in Kalimantan since the beginning of CIFOR’s existence. During that time we have also established a network of permanent sample plots in the area looking at the aspects of sustainable forest management, reduced impact logging and other important elements. So working on permanent sample plots has been important for us.
During this workshop we will present ideas of how, in the future, we can move towards the direction I mentioned earlier, and how we can add value to the data already collected from permanent sample plots. For instance, to support studies and work on carbon sequestration, CIFOR is launching a web service (CarboFor) for those interested in carbon sequestration. This web service will make available information, literature, and data collected from permanent sample plots into wider audience.
I also think we should start a closer collaboration between the institutions that are already measuring or working with permanent sample plots. For that purpose, CIFOR aims to initiate a network of permanent sample plots in South-East Asia. We are also discussing this idea with other institutions such as CIRAD. These discussions also include building a global network of research sites related to long-term monitoring and measuring of forest status or the impact of forest management interventions.
I am truly confi dent that in future years this workshop will be recognized internationally as having played a key role in establishing both an international network and international cooperation on permanent sample plots. Certainly we at CIFOR have committed ourselves to this goal.
For those who are heading to the IUFRO World Congress in Brisbane next week I would like to mention one historical anecdote. The founding of IUFRO - the International Union of Forestry Research Organizations – was very much about permanent sample plots. In the 1880s, there was a need to coordinate forestry research work based on permanent sample plots in Central Europe. This led to the establishment of IUFRO in 1892. Now IUFRO is one of the oldest and well-known scientifi c organizations in the world. So we have a good historical background, a good legacy and many good reasons to continue.
So with these words, I welcome you. I hope we all have an interesting, challenging and productive meeting. And fi nally, let me repeat, CIFOR truly is committed to the long-term success of the aims of this workshop.
Thank you
Dr. Markku KanninenDirector Environment and Sustainable Use of Forests, CIFOR
Preface
Determining Annual Allowable Cut (AAC) in Indonesia was becoming a very interesting issue and creating a hot debate among policy makers, forest practitioners, academia and research institutes. In the past 3 years, the AAC followed a soft landing policy issued by the Minister of Forestry showing declining a pattern from 6.892 million m3 (2003) to 5.743 million m3 (2004) and 5.456 million m3 (2005). In contrast, demand for industry amounts to more than 46 million m3, and is creating a huge gap between supply and demand.
In line with the above issue, the 35 year cutting cycle under TPTI regulation (Indonesian Selective Cutting and Replanting System) is now also in question. Is a 35 year cutting cycle appropriate enough towards sustainable forest management? More than three decades ago, silviculturists assumed that generalized tree growth for all species and all types of forests was 1 cm per year with the diameter limit for cutting at 50 cm and 60 cm (diameter at breast height or dbh), depending on forests type.
Tree growth data from permanent sample plots (PSPs) of tropical managed forest which were measured regularly proved less than that. Data fi gures from PSPs in dipterocarps forest of Malinau Research Forest of CIFOR, East Kalimantan show that the growth rate for non-dipterocarps family range from 0.24 – 0.39 cm per year, and for diptrocarps between 0.35 - 0.62 cm per year (CIFOR, 2004). Meanwhile in Berau, South of Malinau (under STREK and FORDA project) it is shown that the growth rate for all species is 0.22 cm per year, and 0.3 cm per year for dipterocarps (Nguyen-The et al. 1998). This is similar to the rates found by Manokaran, Khocummen (1987), Yong Teng Koon (1990) in mixed dipterocarp lowland forest of Peninsular Malaysia, although Nicholson (1965) mentioned an overall growth rate of 0.48 cm year-1 in the Sepilok Forest Reserve in Sabah. The studies suggest that the simplifi cation and generalization of growth is jeopardizing the sustainability of tropical forest management.

Prefacexiv
In order to have better forest stand data from the fi eld in various types of forests and from several countries, an initiative to develop a network of PSPs in Asia and the Pacifi c is being established. The data would be useful for supporting tree growth and research on carbon sequestration. Laos, Malaysia, Indonesia, Papua New Guinea are among other countries that are experiencing long term measurement of PSPs which were being regularly measured. This initiative will be giving an invaluable input to determine appropriate natural forest sivicultural systems and provide baseline data for carbon sequestration study.
Current Annual Increment (CAI) data from PSPs is very useful information. CAI data is needed when calculating annual carbon stocks in the biomass compartment by using a carbon bookkeeping model such as CO2Fix which is a user friendly program.
An intensive discussion which was facilitated by The Association of Indonesian Foresters earlier this year has come up with recommendations from the Minister of Forestry, the Republic of Indonesia, H.E MS Kaban to look closer into the issue. He further encouraged national and international research organizations to publish their study results to address the issue (Media Persaki 2005). This report presents the proceedings of the “International Workshop on Promoting Permanent Sample Plots in Asia and the Pacifi c Region: The role of Field Data to Support Silvicultural System and Carbon Sequestration Study in Naturally Managed Forests in Asia and the Pacifi c Region towards Sustainable Forest Management” which was held at CIFOR Headquaters, Bogor, Indonesia from 3-5 August 2005.
15 presentations have been delivered in different issues, namely: Overview Sustainable Forest Management, Permanent Sample plots and the Study on Growth and yield, The Importance of Permanent Sample Plots and Carbon Sequestration and Climate Change. At the end of the workshop, three working groups (WG) have been made to discuss different issues. WG 1 was about Data sharing from different sites, WG 2 was about Developing a Network of PSPs and the third WG was discussing Recommendation of Silvicultural Changes. In these proceedings, there are nine full papers, three abstracts and three slide presentations. We decided to publish abstracts and slides as well, because those are also important information.
Post workshop was arranged by visiting Bogor Botanical Garden in third day (5th August 2005). The garden was established by Prof. Dr. C.G.C Reinwart, a German botanist who lived in Indonesia in the early 19th century. Eventually on 18th May 1817 the Land Plantentuin or Hortus Botanicus Bogorienses was founded covering an initial area of 47 hectares (now 87 ha). Later the garden

Hari Priyadi, Petrus Gunarso and Markku Kanninen xv
become a benefi cial education center for agricultural instructors and botanist to promote public awareness in plant uses and nature conservation. The collection consists of 20,827 specimens belong to 3.174 genera and 218 families.
Bogor, February 2006
Hari PriyadiPetrus GunarsoMarkku Kanninen

The workshop brings together practitioners, policy makers, researchers and academia working in the area of silvicultur of natural managed forests and plantation forests in the region and elsewhere. At the same time, it is expected to support development of the networking on PSPs and carbon sequestration. The overall objectives are to:1. Share data and analysis from different sites2. Develop a regional network of Permanent Sample Plots3. Recommend silvicultural changes toward Sustainable Forest Management
Specifi c objectives are to:1. Further use shared data for wider purposes such as Environmental Services
(e.g. carbon trading) and link with networks of PSP for wildlife and PSP on Plantation Forests
2. Provide silvicultural approach that will help correcting unsustainable practices toward ITTO Objective 2000
3. Share efforts to make sure that the network is maintained and securely funded
The workshop was held in CIFOR campus, Bogor from 3-4 August 2005 followed by a post workshop in the Bogor Botanical Garden in 5 August 2005. 50 participants attended the workshop. They were from Malaysia, Papua New Guinea, Lao PDR, Japan, Indonesia, France and The Netherlands. In terms of background, they were working in multi fi elds such as universities, research institutions, NGOs, international projects, private companies and governmental agencies.
In the opening remarks Dr. Petrus Gunarso as a Coordinator of CIFOR’s Malinau Research Forest (MRF) pointed out that the PSP as a long term observation of forest growth and yield is often neglected as a result of ignorance from those who
Workshop summary
Workshop summary xvii
are supposed to look after the sustainability of the forest. This is mainly due to imbalanced competition between long term sustainability vision and short term economic gain vision.
Dr. Markku Kanninen, who gave the welcoming address has highlighted that in the future other aspects related to permanent sample plots and looking at forest health, will be more important, such as looking at the services other than wood, and that forests can provide for humankind. He thinks that they are becoming more and more important and it is timely that we discuss in this workshop all the aspects related to permanent sample plots; not only growth and yield aspect, but all the aspects related to data, information that we are gathering from the permanent sample plots. It is timely also that we have this workshop to start collaborating with institutions that are already measuring or working with permanent sample plots. CIFOR is keen to build a network in the region of South East Asia and also to discuss with other institutions.
In the offi ciating speech, His Excellency Minister of Forestry M.S. Kaban (represented by Honorable Dr. Hadi Pasaribu, DG FORDA) stressed softlanding as a good policy, which was aimed at saving the remaining natural forests by reducing the national annual allowable cut (AAC). When it comes to implementation, however, the policy could not be implemented as it was really intended. The constraint was the scarcity of growth data which is needed for determining the right AAC. With the absence of the critical data, the policy was implemented in a modifi ed fashion. Ideally, the AAC of each single management unit must be calculated to come up with the aggregate national allowable cut. However, since it was not possible, the approach was the other way around. The national allowable cut was somehow determined, which was further disaggregated by province, and fi nally management unit. Of course that was not the right way of implementation.
Followings are some conclusions and recommendations noted during the workshop:1. PSP is an important fi eld data to regulate forest yield. Basically, there are three
things resulted from PSP, namely: diameter increment, volume increment and stand structure dynamics.
2. There is no single yield regulation that can be implemented across area and dynamic complex interaction between forests and people.
3. Any yield regulation practices have to be considered as a hypothesis4. PT Sari Bumi Kusuma (Indonesia) has signifi cant experiences with
TPTJ (Tebang Pilih Tanam Jalur or Modifi ed Indonesia Selective Cutting System). The company is part of a pilot project site for silviculture intensive implementation, which is being encouraged by Ministry of Forestry.
Workshop summaryxviii
5. Using computer model SYMFOR, cutting cycle can be predicted. In the Jambi case, a 35 year cutting cycle is recommended.
6. CIRAD Foret suggested a good scenario to recommend would be the regular felling of 8 trees/ha every 40 years, which could yield 67 m3/ha at each harvesting.
7. According to fi eld data monitoring from PSP the tree growth (≥20 cm dbh) is less than assumed by the Indonesian Silvicultural system (TPTI) which is 1 cm per year. Field data from MRF shows per species mean increment of dipterocarps range from 0.42 – 0.62 cm per year. If we assume that this pattern continues, a longer cutting cycle is needed for sustainable forest management.
8. Papua New Guinea is using a database management system called PERSYST to analyze and produce a model called PINFORM for predicting the growth and yield of selectively cut natural forests in PNG
9. Malaysia suggests efforts and commitment by various sectors are required to ensure the successful implementation of sustainable forest management for the benefi ts of future generation.
10. Example PSP in Indonesia are located in Malinau/MRF, Berau/STREK (East Kalimantan), Jambi (Sumatera), Krui/ICRAF-SEA (West Lampung), Muara Bungo/ICRAF-SEA (Jambi).
11. In Lao PDR, PSP is being used to estimate tree growth and to predict the yield for future sustainable forest management and planning system (SFMS).
12. There has been an increasing demand for data and information collected from PSP for the accounting purposes in carbon sequestration projects under climate change agreements. Such information would support the development of the so-called baseline and additional scenarios presented in the project development design. The use of long-term measurements provided by PSP would increase the project is profi le and credibility.
13. CIFOR is very keen to facilitate data and information exchanges by providing a web-based platform, by which potential users may be directed to the originating institutions. CarboFor© will appear at CIFOR main page to serve both forestry and climate change communities.
14. Another role of PSP is to provide important means for up-scaling, both in time and space as well as to provide critical data for evaluation of ecological models.
Information regarding with CarboFor can be found in the website: www.cifor.cgiar.org/carbofor. CarboFor is web-based developed under CIFOR main webpage to serve the communities working on land-use, land-use change and forestry (LULUCF) activities and associated climate change. It features projects carried our by CIFOR and its partners: current publications of carbon/climate change related issues around LULUCF sector; Permanent Sample Plot (PSP) run by various agencies as part of their operational as well as research activities – mainly for forest management purposes. Highlights of current issues, detailed events and links to useful sites may be found.
The workshop is co-funded by ITTO PD 39/00 Rev.3 (F) and two CIFOR Programs (Forests and Livelihood Program and Environmental Services and Sustainable Use of Forests Program). Dr. Daniel Murdiyarso, Dr. Herry Purnomo, Dr. Paian Sianturi and Mr. Happy Tarumadevyanto are very much appreciated for their expertise in the facilitation process during the workshop. We are indebted to Dr. Markku Kanninen for his invaluable support. We are grateful to Dr. Hiras Sidabutar and ITTO Secretariat for their invaluable contribution. We also would like to thank Nani Djoko, Haris Iskandar, Kresno Santosa, Zakaria Ahmad, Lia Wan and Ketty Kustiawati for their outstanding contribution in the organization of this workshop. The comments and criticism of the reviewers are also fully acknowledged and appreciated. Among them are Jenny and Kuswata Kartawinata, Plinio Sist, Alison Ford, Greg Clough and most of authors of the contributed papers. We thank Eko Prianto and Gideon Suharyanto in CIFOR-Communication Unit for their excellent technical and creative support.
Acknowledgments


Abd. Rahman Kassim Forest Management & Ecology Program, Forestry & Conservation DivisionForest Research Institute Malaysia, Kepong 52109, Selangor, Malaysia
AbstractSustainable forest management has been a topical issue of today. It is not only limited to the removal of timber from the forest, but also the entire operation of planning and implementation of harvesting along established guidelines. The paper presents a brief overview of the development of sustainable forest management in Malaysia with special reference to Peninsular Malaysia. Among the topics discussed are the forest policy and legislation, forest management practices in different production forest types, forest management certifi cation and the importance of research support to evaluate and review the current management prescription. As interest about the need to manage forests in a sustainable manner continues, efforts and commitment by various sectors are required to ensure the successful implementation of sustainable forest management for the benefi ts of future generations.
Keywords: Sustainable forest management, forest certifi cation, dipterocarp forest, peat swamp forest, mangrove forest
An overview on sustainable forest management in Peninsular Malaysia
An overview on sustainable forest management in Peninsular Malaysia2
IntroductionSustainable forest management (SFM) has been a topical issue today not just by natural resource managers, but people from all walks of life. Not surprising though, because forests not only provide economic returns but also important social and cultural benefi ts and environmental services (Thang 2002). Forestry issues have gained greater attention in the international discussion, today than they had before. Through research, fi eld implementation and review, forest management in Malaysia is evolving towards its goal of sustainable forest management. The scope of activities is not only limited to the actual process of harvesting, but also includes the entire operation of planning and implementation of harvesting along established guidelines (Anon. 2004).
One of the major issues regarding forest management is the sustainability of the resources that are to satisfy the needs of current and future generations. Sustainability of resources implies that the invaluable forest resource has to be managed to ensure a continuous fl ow of goods and services in perpetuity for the benefi t of human kind, and which is compatible with the need to preserve the forest ecosystem and the environment (Thang 2002). To promote the implementation of sustainable forest management, International Tropical Timber Organization has published the “Guidelines for the Sustainable Management of Natural Tropical Forest” (1991 and updated in 1994) and “Criteria for Measurement of Sustainable Tropical Forest Management” (1992 and revised in 1998). The guidelines form the basis for the producer countries to develop their Criteria and Indicators for sustainable forest management. The development of sustainable forest management is still evolving with new fi ndings being considered to improve the management prescription. The paper presents an overview of development of sustainable forest management as experienced in Malaysia with special reference to Peninsular Malaysia.
Forest policy and legislationThe National Forest Policy 1978 is the main guiding document for sustainable forest management in Malaysia. Some modifi cation was made to the forest policy in 1992 due to concern by the world community on the importance of biological diversity conservation and sustainable utilization of forest genetic resources, as well as the role of local communities in forest development. The revised policy refl ects these important aspects of forestry. Malaysia has also ratifi ed several internationally-agreed conventions which include the Convention on Biological Diversity (CBD), Convention on International Trade in Endangered Species of Wild Fauna and Flora (CITES) and the Ramsar Convention on Wetlands (Anon. 2004).

Abd. Rahman Kassim 3
Table 2: Distribution and Extent of Protected and Production Forest in Malaysia (million ha) (Source: Modifi ed from Anon. 2004)
Region Production Forest
Total *protected areas
Total Land Area
Percentage of Land Area as Production Forest
Peninsular Malaysia
2.80 5.36 13.16 21.3
Sabah 3.00 3.87 7.37 40.7
Sarawak 5.16 7.16 12.30 42.0
Malaysia 10.96 16.39 32.83 33.4*Total protected areas include the protection forest under permanent forest reserve, Wildlife sanctuary, National park and State park. Figure is based on 2002 statistics Peninsular Malaysia, Sabah and Sarawak
Table 1: Distribution and Extent of Major forest types in Malaysia (million ha) (Source: Anon. 2004)
Region Mixed Dipterocarp forest
Swamp Forest
Mangrove Forest
Plantation Forest
Total ForestedLand
Total Land Area
Percentage of Land Area under Forest
Peninsular Malaysia
5.40 0.30 0.11 0.08 5.89 13.16 44.8
Sabah 3.81 0.12 0.34 0.14 4.41 7.37 59.8
Sarawak 7.92 1.12 0.15 0.05 9.24 12.30 75.1
Malaysia 17.13 1.54 0.60 0.27 19.54 32.83 59.5Figure is based on 2002 statistics for Peninsular Malaysia, Sabah and Sarawak
Forest areasThe forested area in Peninsular Malaysia is divided into four major forest types, namely the Inland Dipterocarp Forest, Mangrove Swamp Forest, Peat Swamp Forest and plantation forest (Table 1). The management guidelines for the respective forest types depend on the standing stock, size structures, and species composition. Malaysia has a total of 17.13 million ha of forested land.
The forested areas covered 19.54 million ha in 2002, covering 60 % of the total land area. Production forest management based on sustainability covers 10.96 million ha, or 33 % of the total land area. In Peninsular Malaysia the production forest, mainly found in the inland and classifi ed as inland mixed dipterocarp forest, covers approximately 8.5 % of the total land area (Table 2).
Managing forest resourcesForestry resource are categorized into timber and non-timber resources. As the timber resources look into single forest produce, the non-timber resources include goods and services provided by the forest ecosystem other than timber resources.
An overview on sustainable forest management in Peninsular Malaysia4
Mixed dipterocarp forestForest management practices began in the early 1900’s. Several silvicultural practices have been introduced to manage the inland dipterocarp forest (Table 3). Harvests were initially very selective in the early days of forestry in Malaysia, and focused on felling of gutta percha (Palaquium gutta), as well as durable hardwoods like Chengal (Neobalanocarpus heimii). By 1948, the Malayan Uniform System was employed. The system converted primary tropical lowland forest to an even-aged and reduced species mixed stand containing greater proportion of the commercial light red meranti timbers. Currently inland dipterocarp forest is managed under two management systems, namely modifi ed Malayan Uniform System (MMUS) and the Selective Management System (SMS). The MMUS is a modifi cation of the classical Malayan uniform system. The SMS, a polycyclic system, was introduced in 1978 as most of the forest operation had shifted to the hill dipterocarp forest. The MMUS entails removing all crop trees greater than 45 cm dbh in one single felling, while the SMS provides an option for selecting optimum management regimes based on pre-felling forest inventory data (Thang 2002).
Under the SMS, a minimum cutting limit of 50 and 45 cm dbh are set for dipterocarps and non-dipterocarp trees, except for Neobalanocarpus heimii, with minimum cutting limits at 60 cm dbh. A difference of at least 5 cm dbh was set for dipterocarps and non-dipterocarps to conserve a higher proportion of dipterocarps for the next cut. For example, a 60 cm dbh cutting limit for dipterocarps and 50 cm for non-dipterocarps species. A prerequisite of the system is the 10 % systematic line plot sampling before felling to determine the stocking as a basis to decide the cutting regime. Marking of all trees earmarked for felling is carried out. The system requires that residual trees to be felled should be 32 trees per hectare of trees between 30-45 cm or its equivalent, and proportion of residual dipterocarps 30 cm dbh and above must be equal or higher than before felling (Thang 1997; Shaharudin 1997). The management prescription has been reviewed and some modifi cations recommended in light of new fi ndings from growth and yield studies from permanent sample plots. Efforts are being made to look into the cutting regime for special forests such as Kapur (Dryobalanops aromatica) and Seraya-Ridge Forest (Shorea curtisii). The forest is rich in valuable timber stocking and in many cases dominated by single species in the larger size classes. Application of the selective cutting in these forests needs to be evaluated, as potentially extensive damage to the residual stand is unavoidable even when reduced impact logging is implemented. Simulation studies on these forest types indicated a need to control the amount of harvest to reduce the impact on residual stands (Abd. Rahman et al. 2002). Forestry Department has recently imposed another management prescription on the maximum allowable harvest both for primary forest and regulated forest. This move will reduce the potential impact of harvesting on the residual stands particularly for timber rich forest such as Kapur Forest and Seraya Ridge-Forest, and thus support the sustainable supply of timber
Abd. Rahman Kassim 5
for future cuts. The challenge will be to determine which trees to be cut among the harvestable size trees.
Peat swamp forestThe harvesting regime for the peat swamp forest is managed under the “modifi ed” SMS, where higher cutting limits are prescribed due to a lower stocking of natural regeneration stand. Currently researche is being undertaken by UNDP/GEF project on Conservation and Sustainable Use of Tropical Peat Swamp Forest and Associated Wetland Ecosystems which is expected to be completed by 2006 (Thang 2002). The peat swamp forest is a delicate and complex forest ecosystem. Any disturbance due to removal of vegetation cover during harvesting has to consider the effects on water regime. When a suffi cient quantity of water remains, plant material will continue to remain as peat, otherwise it will decay when water loss increases (Pahang Forestry Department 2005). The Forest Research Institute of Malaysia (FRIM) in collaboration with the Forestry Department of Peninsular Malaysia is conducting research on an appropriate harvesting regime for mixed peat swamp forest. Preliminary fi ndings indicated that some modifi cations on the species grouping, damage factor and revised growth and yield fi gures are required to determine the sustainable level of harvest for peat swamp forest (Abd. Rahman, unpublished).
Mangrove forestThe mangrove forest is managed on a clear cutting system at varying cutting cycles of 20-50 years. Mature trees are felled with retention of several mother trees, and a three meters wide river bank and coastal strip to ensure adequate regeneration and protection of the environment. The Matang mangrove forest is a strong example of long-term sustainable forest management. Matang mangrove is the single largest mangrove forest in Peninsular Malaysia covering more than 40,000 hectares of a continuous belt of trees within 19 forest reserves. Matang mangrove has been sustainably managed for almost 100 years, and still provides forest resources, such as poles and charcoal, for local consumption as well as export. It also provides a healthy ecosystem that preserves important fi shery breeding grounds. Efforts are being made to improve the appropriate time of thinning as many dead standing trees has been observed before the fi rst thinning indicating occurrence of competition induced mortality among the trees (Abd. Rahman et al. 2004).
Managing non-timber resourcesThe forest ecosystem is an important source of non-timber resources. The forests provide food sources, medicinal plants, sandalwood, potential areas for eco-tourism areas and recreation, and support a favorable condition for safeguarding the environment.
An overview on sustainable forest management in Peninsular Malaysia6
The management of non-timber resources is an important activity under sustainable forest management to ensure a sustainable utilization of the resources to meet current and future generation’s benefi ts. A study by Mohd. Azmi et al. (2002) estimated that the average economic value of non-timber resources is RM1.011.61 per hectare. Bamboo contributes the highest stocking value of RM 471 per hectare. The estimated realized economic value of non-timber resources by the local communities was RM210,717 per year. Among the non-timber resources, gaharu and sandalwood remain the most sought after products from the forest. Bamboo showed the lowest realized economic value although it supports the highest stock value, primarily due to low marketability.
The management of non-timber resources under sustainable forest management is crucial. Besides timber production, the forest is an important source of goods and services, particularly for the local communities. The integration of the non-timber resources into the sustainable forest management at forest management units requires comprehensive resource planning. In the 4th National Forest Inventory, non-timber resources are also recorded in the inventory. This will allow the estimate of the resources at national level.
Forest management certifi cationMalaysian forest management is evolving towards its goals of sustainable forest management through research, fi eld implementation and review. A national committee on Sustainable Forest Management in Malaysia was established in 1994 to coordinate the implementation of all activities required to ensure that the forest resources in Malaysia are sustainably managed (Thang 2004). A set of Malaysian Criteria and Indicators (MC&I) for Sustainable Forest Management (MC&I) at the national level and forest management unit level was developed to assess and monitor its progress towards achieving sustainable forest management. The MC&I is based on the International Tropical Timber Organization (ITTO)’s Criteria for Measurement of Sustainable Tropical Forest Management (1992 and revised in 1998). An independent non-profi t organization, Malaysian Timber Certifi cation Council (MTCC), was established to plan and operate a voluntary national timber certifi cation scheme to provide means of verifying that timber products have been sourced from sustainably managed forests. The MTCC scheme began in 2001, and is implemented using a phase approach.
The standard currently used for assessing Forest Management Units (FMUs) for the purpose of certifi cation is the Malaysian Criteria, Indicators Activities and Standard of Performance for Forest Management (known as the MC&I(2001) in short) which is based on the 1998 ITTO Criteria and Indicators for Sustainable Management of Natural Tropical Forests. It contains the key elements for sustainable forest management covering economic, social, environmental and
Abd. Rahman Kassim 7
conservational aspects. So far, eight timber producing States FMUs in Peninsular Malaysia have been independently assessed using this standard. In addition, a FMU in Sarawak has undergone a pre-assessment against the requirements of this standard.
As part of the MTCC-FSC (Forest Stewardship Council) cooperation, a multi-stakeholder National Steering Committee (NSC) that was formed in April 2001 has developed the Malaysian Criteria and Indicators for Forest Management [known as the MC&I(2002) in short] using the FSC Principles and Criteria as the template. The development of the MC&I (2002) involved broad-based consultation and consensus between social, environmental and economic stakeholder groups through several meetings of the NSC and regional consultations held in Peninsular Malaysia, Sabah and Sarawak where appropriate regional verifi ers were identifi ed. The MC&I (2002) is being implemented at the beginning of 2005. The MC&I (2002) will be reviewed and updated periodically, based on feedback and experience gained through its application in the fi eld (MTCC, 2005).
Research supportIn support of the sustainable forest management, research into the growth and yield of the forest after harvesting is crucial. Wan Razali (1996) highlighted that growth and yield information can be used to: i. update and project inventoriesii. determine harvesting levels/allowable cutiii. schedule the harvesting unitsiv. analyze the potential alternative stand treatmentsv. develop regional resources availability studies, and vi. determine site productivity.
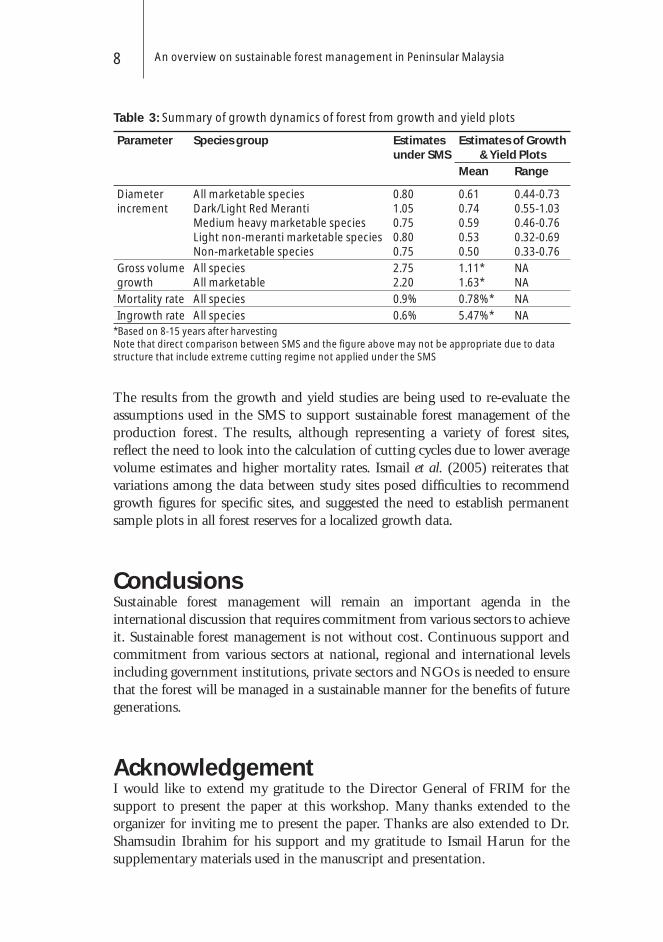
In Peninsular Malaysia a number of permanent sample plots have been established. These include the growth plots, Growth and Yield Plots, Silviculture Research Plots and Continuous Forest Inventory Plots (Shamsudin et al. 2003). The growth plots were established with the objectives of studying the regeneration capacity and growth potential of logged forests in Permanent Forest Reserve. The Growth and Yield Plots examine the effects of different cutting regimes on the growth response of trees and stand. Ismail et al. (2005) reported the results of analysis for the nine growth and yield study sites (out of 12 sites managed by Forestry Department) and two study sites managed by FRIM. The following are the summary of the results based on diameter increment, mortality and ingrowth of all trees greater than 30 cm dbh. The growth fi gures used under Selective Management System (SMS) are also included in the table for comparison (Table 3).
An overview on sustainable forest management in Peninsular Malaysia8
Table 3: Summary of growth dynamics of forest from growth and yield plots
Parameter Species group Estimates under SMS
Estimates of Growth & Yield Plots
Mean Range
Diameter increment
All marketable speciesDark/Light Red MerantiMedium heavy marketable speciesLight non-meranti marketable speciesNon-marketable species
0.801.050.750.800.75
0.610.740.590.530.50
0.44-0.730.55-1.030.46-0.760.32-0.690.33-0.76
Gross volume growth
All speciesAll marketable
2.752.20
1.11*1.63*
NANA
Mortality rate All species 0.9% 0.78%* NA
Ingrowth rate All species 0.6% 5.47%* NA*Based on 8-15 years after harvestingNote that direct comparison between SMS and the fi gure above may not be appropriate due to data structure that include extreme cutting regime not applied under the SMS
The results from the growth and yield studies are being used to re-evaluate the assumptions used in the SMS to support sustainable forest management of the production forest. The results, although representing a variety of forest sites, refl ect the need to look into the calculation of cutting cycles due to lower average volume estimates and higher mortality rates. Ismail et al. (2005) reiterates that variations among the data between study sites posed diffi culties to recommend growth fi gures for specifi c sites, and suggested the need to establish permanent sample plots in all forest reserves for a localized growth data.
ConclusionsSustainable forest management will remain an important agenda in the international discussion that requires commitment from various sectors to achieve it. Sustainable forest management is not without cost. Continuous support and commitment from various sectors at national, regional and international levels including government institutions, private sectors and NGOs is needed to ensure that the forest will be managed in a sustainable manner for the benefi ts of future generations.
AcknowledgementI would like to extend my gratitude to the Director General of FRIM for the support to present the paper at this workshop. Many thanks extended to the organizer for inviting me to present the paper. Thanks are also extended to Dr. Shamsudin Ibrahim for his support and my gratitude to Ismail Harun for the supplementary materials used in the manuscript and presentation.
Abd. Rahman Kassim 9
ReferencesAbd. Rahman K., Ismail H. and Shamsudin I. 2002. Evaluation of The Stocking,
Size-Structure and Species Composition of Kapur Forest And Seraya-Ridge Forest: Its Implication to Current Timber Management Practices Paper presented at the 13th Malaysia Forestry Conference, 20-23 August, 2001, Johor Bahru, Johor Darultakzim, Malaysia. 24p.
Anon., 2004. Malaysian rainforests: National heritage, our treasure. Ministry of Primary Industries, Kuala Lumpur. 53p.
Ismail H., Nur Hajar Z. S., Wan Mohd. Shukri.W.A. Harfendy O., and Chong P.F. 2005. Forest Growth Dynamics: Analysis of Growth and Yield Data in Peninsular Malaysia. FRIM Reports No. 82. 41p.
Mohd. Azmi M.I., Awang Noor A.G. Mohd. Shahwahid, Salleh M., Abdul Rahim N., and Ahmad Fauzi P. 2002. Methods for evaluation of NTFPS and environmental services. Pp 115-161. in Abdul Rahim N. (Eds) A Model for Cost Analysis to Achieve Sustainable Forest Management (PD 31/95 Rev. 3 (F)). Volume II Main Report. Forest Research Institute Malaysia.
MTCC 2005. Malaysia ciriteria and indicators for forest management certifi cation [MC&I(2002)]. Malaysian Timber Certifi cation Council, Kuala Lumpur.
Pahang Forestry Department 2005. Pekan, Peat Swamp Forest, Pahang, Malaysia: The role of water in conserving peat swamp forests. Pahang Forestry Department supported by Danida’s project on the Management for Conservation and Sustainable Use of Peat Swamp Forest and Associated Water Regimes in Malaysia in collaboration with UNDP/GEF. 36p.
Shamsudin I., Abd. Razak O., Noor Azlin Y., Samsudin M., Shafi ah M.Y., Baharudin K., and Siti Aisah S. 2003. Management prescriptions for non-production functional classes of forest. Malayan Forest Records No. 46. Forest Research Institute Malaysia.154p.
Shaharuddin, I. 1997. Technical requirements for the successful implementation of Selective Management System in Peninsular Malaysia. Proceeding of the Workshop on Selective Management System and Enrichment Planting, 24-26 June 1997, Ipoh, Perak.
Thang H.C. 2002. Towards achieving sustainable forest management in Peninsular Malaysia. The Malaysian Forester 65(4):210-228.
Thang, H. C. 1997. Concept and basis of selective management system in Peninsular Malaysia. Proceeding of the Workshop on Selective Management System and Enrichment Planting, 24-26 June 1997, Ipoh, Perak.

Herry Purnomo, Teddy Rusolono, Muhdin, Tatang Tiryana and Endang Suhendang Forest Biometrics Laboratory, Faculty of Forestry, Bogor Agricultural University (IPB)Kampus Darmaga Bogor, Indonesia
AbstractCriteria and indicators (C&I) have been worldwide accepted as a way to conceptualize and measure sustainability of forest management. Various C&I sets or standards were formulated by different organizations and processes such as ITTO, CIFOR, FSC, ATO and Montréal Process. These standards, particularly in the production aspect, underline the sustained forest yield principle and the importance of using permanent sample plot data to regulate forest yield. This principle can only be achieved when the forest yield is regulated according to its dynamics and growth which is unique for each site and unlikely to be completely known. As a result, no single yield regulation can be implemented across areas and dynamic complex interaction between forest and people. Any yield regulation practice has to be considered as a hypothesis. This hypothesis then is to be tested in the real world and to be learned for better practice in the future. This is what we call adaptive yield regulation’. Some simulation studies proved that this adaptive yield regulation concept meet up with the need for yield regulation schemes for small-scale forest management. In the broader sense the concept and practice of adaptive yield regulation is enfolded in adaptive management, which considers continuous and conscious learning as the only way to manage the complex forests.
Keywords: Complex forest, sustainability, criteria and indicators, growth, yield regulation, adaptive management
Making sustainability work for complex forests: towards adaptive forest yield regulation

Purnomo, H. et al. 11
Figure 1. Conceptual framework for sustainability assessment (After Becker 1997)
Introduction
The concept of sustainable forest managementAccording to Webster’s Dictionary (1988), the etymological root of sustainability is derived from the Latin verb sustenere (= to hold). This etymology is also refl ected in the debate among Spanish-speaking scientists about whether sostenibilidad (from sostener) or sustentabilidad (from sustentar) is the more accurate translation. The fi rst term is closer to “being upheld” while the latter term is closer to “to uphold” (Becker 1997). The latter terminology indicates a strong normative component in the concept of sustainable development.
Sustainable development has an essentially normative character, which makes it diffi cult to put into practice. It implies a close relationship between environmental considerations and economic growth. Within sustainable development, economic and social objectives must be balanced against natural constraints. A spirit of solidarity with future generations is included in the concept. Sustainable development is based on the common principles of self-reliance, fulfi llment of basic needs and quality of life (Schtivelman and Russel 1989). Bruntland’s Commission defi ned sustainable development as “a process in which the exploitation of resources, direction of investments, orientation of technology development and institutional changes are all in harmony, enhancing both current and future abilities to meet human needs and aspirations” (WCED 1987 in Haeruman 1995). To present the interdisciplinary nature of sustainability assessment, a conceptual framework or basic structure for sustainability assessment (Figure 1) was proposed (Becker 1997).

Making sustainability work for complex forests12
Criteria
Figure 2. Hierarchy structure of SFM
The framework shows very clearly that an assessment of sustainable development must involve consideration of society’s ethical or cultural values. Thus, any discussion about sustainable development should involve an understanding of local values. To assess or measure the degree of SFM a set of criteria and indicators (C&I) are needed. Indeed, C&I have been recognized as a way to conceptualize SFM as well as a practical guide towards SFM.
Measuring sustainable forest managementForests, in general, possess ecological, economic and social functions. Consideration of these functions of forests was used to derive principles, criteria and indicators (P, C and I) for sustainable forest management, which are structured hierarchically (Figure 2). A principle is a fundamental truth or law as the basis of reasoning (Concise Oxford Dictionary 1995). A principle refers to a function of a forest ecosystem or to a relevant aspect of the social system(s) that interact with the ecosystem.
Criterion is a standard, rule or test by which something can be judged (Concise Oxford Dictionary 1995). The function of the criteria is to show the level of compliance with principles related to the forest ecosystem or its related social system. Compliance with the principles is translated into descriptions of resulting specifi c and concrete states or dynamics of the forest ecosystem, or the resulting states of the interacting social system. As the function of criteria is to show the level of compliance with a principle for the forest ecosystem or related social systems, criteria should be formulated in terms of outcome. This means that a criterion describes which state is most desired in the forest or social system. Formulations of criteria must not express that a desired state should be achieved nor how this state is to be achieved. Formulations in the form of prescriptions do not comply with the requirements for criteria in the hierarchical framework. Prescriptions should be reserved for the formulation of guidelines and actions. The formulation of a criterion must allow a verdict to be given on the degree of compliance within an actual situation. (Bueren and Blom 1997).

Purnomo, H. et al. 13
An indicator was defi ned by the ITTO (1998) as a quantitative, qualitative or descriptive attribute that, when periodically measured or monitored, indicates the direction of change. To “indicate” is defi ned in the Concise Oxford Dictionary (1995) as point out, make shown, show, or be a sign or symptom of, express the presence of. FSC defi ned indicators as any variable, which can be measured in relation to specifi c criteria. An indicator is an assessable parameter describing features of the ecosystem or social system (outcome parameters), or policy and management conditions and processes (input or process indicators). An indicator as an outcome parameter often describes the actual condition of an element in the forest ecosystem or related social system in quantitative or relative terms. Indicators may also refer to a human process or intervention which is to be executed - or to an input (e.g. the existence or characteristics of a management plan; or a law). These types of indicators are respectively known as process and input indicators. They are in fact indirect indicators that refl ect elements of the management and policy system (Bueren and Blom 1997).
A fourth hierarchical level, below the level of these indicators, may be needed to describe the way the indicators are measured in the fi eld. The parameters at this level are called verifi ers. Verifi ers are not shown in the hierarchy because they are optional. They refer to the source of information for the indicator and relate to the measurable element of the indicator. The verifi cation procedure clarifi es the way the indicator is measured in the fi eld and the way reference values are established. Choosing a reference value is always diffi cult when formulating target values or thresholds because it is often an arbitrary procedure (Bueren and Blom 1997).
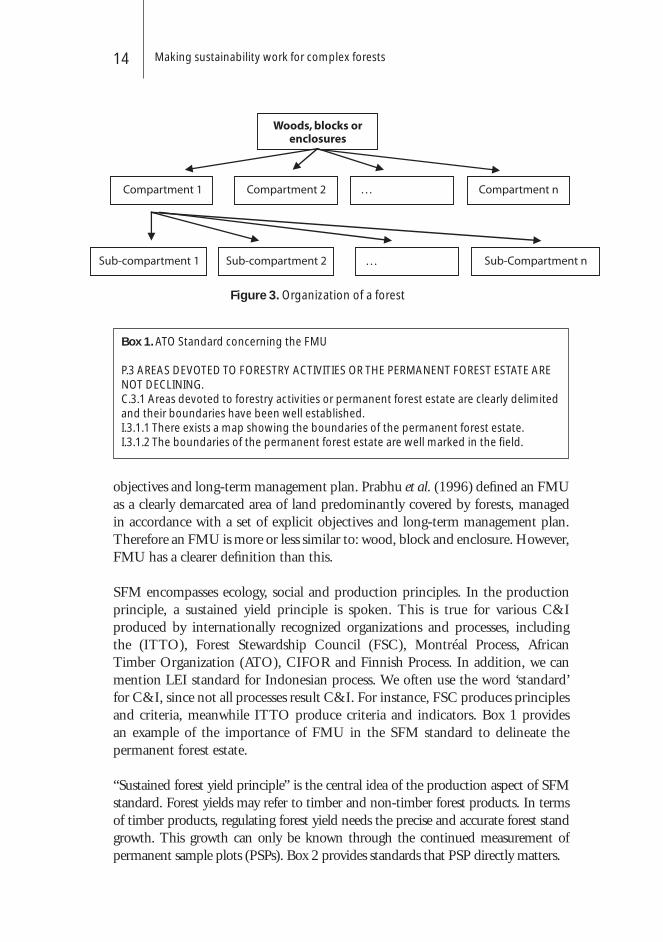
SFM criteria and indicators and permanent sample plotsSFM may apply to the forest management unit (FMU) or national scale. This paper concerns SFM at FMU scale. To understand the term that refers to FMU or unit of forest management needs fi rstly understanding forest organization. A primary territorial unit of forest is shown in Figure 3. Osmaton (1968), and defi nes woods, blocks and enclosures as synonymous terms used to refer to wooded areas bounded by natural features, which have well-known local names. They may have been the result of legal separation by the closing off from surrounding land for the purposes of preservation or distinction of ownership. Osmaton also defi ned ‘compartment’ as the smallest permanent sub-division of a forest. B.C.F.T (1953) in Osmaton (1968) defi ned compartment as a territorial unit of a forest permanently defi ned for the purposes of administration and records. Being a permanent unit, the compartment should be clearly demarcated on the ground and its boundaries should follow natural features or defi nite artifi cial features. A sub-compartment was defi ned as a unit of treatment.
International Tropical Timber Organization or ITTO (1998 p. 5) defi ned an FMU as a clearly defi ned forest area, managed in accordance with a set of explicit
Making sustainability work for complex forests14
Figure 3. Organization of a forest
Box 1. ATO Standard concerning the FMU
P.3 AREAS DEVOTED TO FORESTRY ACTIVITIES OR THE PERMANENT FOREST ESTATE ARE NOT DECLINING.C.3.1 Areas devoted to forestry activities or permanent forest estate are clearly delimited and their boundaries have been well established.I.3.1.1 There exists a map showing the boundaries of the permanent forest estate. I.3.1.2 The boundaries of the permanent forest estate are well marked in the fi eld.
objectives and long-term management plan. Prabhu et al. (1996) defi ned an FMU as a clearly demarcated area of land predominantly covered by forests, managed in accordance with a set of explicit objectives and long-term management plan. Therefore an FMU is more or less similar to: wood, block and enclosure. However, FMU has a clearer defi nition than this.
SFM encompasses ecology, social and production principles. In the production principle, a sustained yield principle is spoken. This is true for various C&I produced by internationally recognized organizations and processes, including the (ITTO), Forest Stewardship Council (FSC), Montréal Process, African Timber Organization (ATO), CIFOR and Finnish Process. In addition, we can mention LEI standard for Indonesian process. We often use the word ‘standard’ for C&I, since not all processes result C&I. For instance, FSC produces principles and criteria, meanwhile ITTO produce criteria and indicators. Box 1 provides an example of the importance of FMU in the SFM standard to delineate the permanent forest estate.
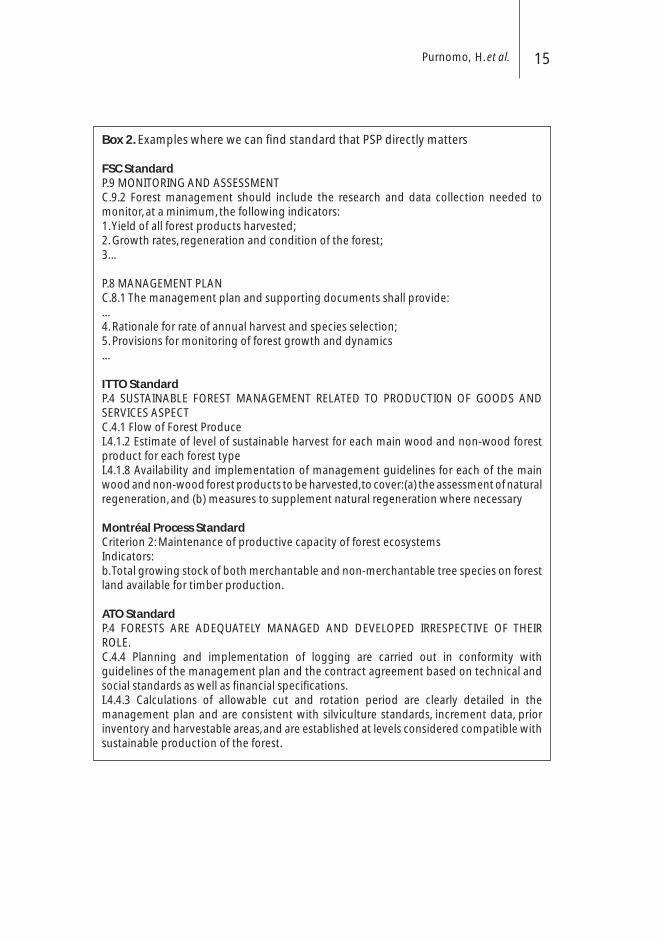
“Sustained forest yield principle” is the central idea of the production aspect of SFM standard. Forest yields may refer to timber and non-timber forest products. In terms of timber products, regulating forest yield needs the precise and accurate forest stand growth. This growth can only be known through the continued measurement of permanent sample plots (PSPs). Box 2 provides standards that PSP directly matters.
Purnomo, H. et al. 15
Box 2. Examples where we can fi nd standard that PSP directly matters
FSC StandardP.9 MONITORING AND ASSESSMENTC.9.2 Forest management should include the research and data collection needed to monitor, at a minimum, the following indicators: 1. Yield of all forest products harvested;2. Growth rates, regeneration and condition of the forest; 3…
P.8 MANAGEMENT PLANC.8.1 The management plan and supporting documents shall provide: …4. Rationale for rate of annual harvest and species selection;5. Provisions for monitoring of forest growth and dynamics…
ITTO StandardP.4 SUSTAINABLE FOREST MANAGEMENT RELATED TO PRODUCTION OF GOODS AND SERVICES ASPECTC.4.1 Flow of Forest ProduceI.4.1.2 Estimate of level of sustainable harvest for each main wood and non-wood forest product for each forest typeI.4.1.8 Availability and implementation of management guidelines for each of the main wood and non-wood forest products to be harvested, to cover: (a) the assessment of natural regeneration, and (b) measures to supplement natural regeneration where necessary
Montréal Process StandardCriterion 2: Maintenance of productive capacity of forest ecosystemsIndicators: b. Total growing stock of both merchantable and non-merchantable tree species on forest land available for timber production. ATO StandardP.4 FORESTS ARE ADEQUATELY MANAGED AND DEVELOPED IRRESPECTIVE OF THEIR ROLE.C.4.4 Planning and implementation of logging are carried out in conformity with guidelines of the management plan and the contract agreement based on technical and social standards as well as fi nancial specifi cations.I.4.4.3 Calculations of allowable cut and rotation period are clearly detailed in the management plan and are consistent with silviculture standards, increment data, prior inventory and harvestable areas, and are established at levels considered compatible with sustainable production of the forest.
Making sustainability work for complex forests16
Forest stand dynamic and cutting systems
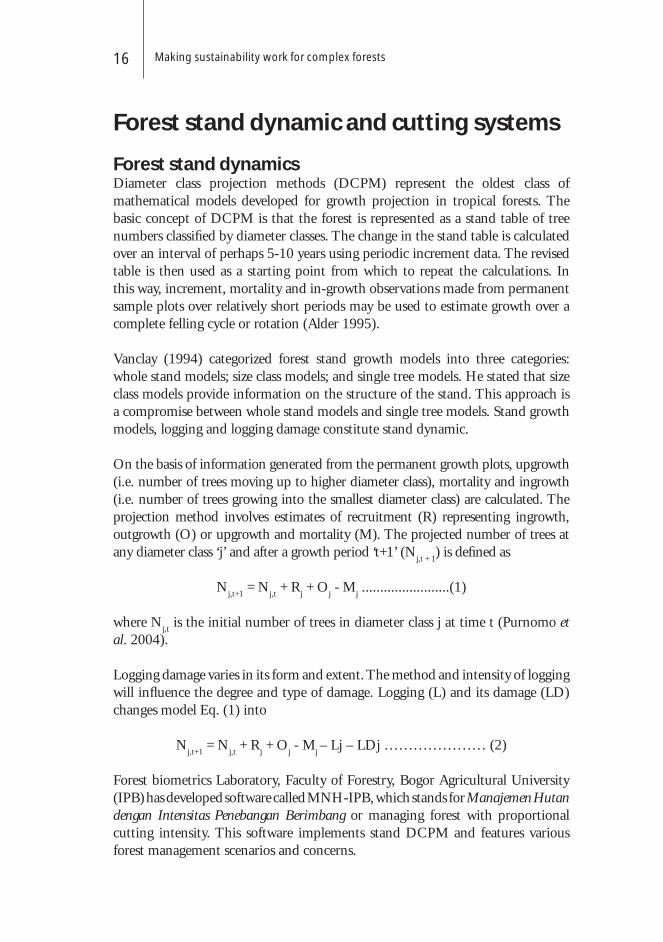
Forest stand dynamics Diameter class projection methods (DCPM) represent the oldest class of mathematical models developed for growth projection in tropical forests. The basic concept of DCPM is that the forest is represented as a stand table of tree numbers classifi ed by diameter classes. The change in the stand table is calculated over an interval of perhaps 5-10 years using periodic increment data. The revised table is then used as a starting point from which to repeat the calculations. In this way, increment, mortality and in-growth observations made from permanent sample plots over relatively short periods may be used to estimate growth over a complete felling cycle or rotation (Alder 1995).
Vanclay (1994) categorized forest stand growth models into three categories: whole stand models; size class models; and single tree models. He stated that size class models provide information on the structure of the stand. This approach is a compromise between whole stand models and single tree models. Stand growth models, logging and logging damage constitute stand dynamic.
On the basis of information generated from the permanent growth plots, upgrowth (i.e. number of trees moving up to higher diameter class), mortality and ingrowth (i.e. number of trees growing into the smallest diameter class) are calculated. The projection method involves estimates of recruitment (R) representing ingrowth, outgrowth (O) or upgrowth and mortality (M). The projected number of trees at any diameter class ‘j’ and after a growth period ‘t+1’ (N
j,t + 1) is defi ned as
Nj,t+1
= Nj,t + R
j + O
j - M
j ........................(1)
where Nj,t is the initial number of trees in diameter class j at time t (Purnomo et
al. 2004).
Logging damage varies in its form and extent. The method and intensity of logging will infl uence the degree and type of damage. Logging (L) and its damage (LD) changes model Eq. (1) into
Nj,t+1
= Nj,t + R
j + O
j - M
j – Lj – LDj ………………… (2)
Forest biometrics Laboratory, Faculty of Forestry, Bogor Agricultural University (IPB) has developed software called MNH-IPB, which stands for Manajemen Hutan dengan Intensitas Penebangan Berimbang or managing forest with proportional cutting intensity. This software implements stand DCPM and features various forest management scenarios and concerns.
Purnomo, H. et al. 17
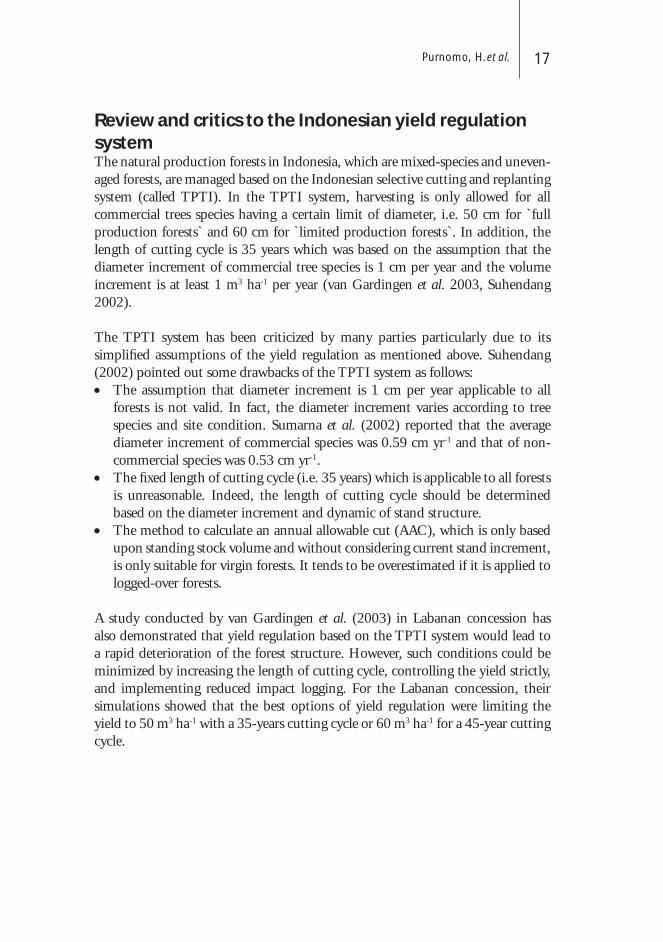
Review and critics to the Indonesian yield regulation systemThe natural production forests in Indonesia, which are mixed-species and uneven-aged forests, are managed based on the Indonesian selective cutting and replanting system (called TPTI). In the TPTI system, harvesting is only allowed for all commercial trees species having a certain limit of diameter, i.e. 50 cm for `full production forests` and 60 cm for `limited production forests`. In addition, the length of cutting cycle is 35 years which was based on the assumption that the diameter increment of commercial tree species is 1 cm per year and the volume increment is at least 1 m3 ha-1 per year (van Gardingen et al. 2003, Suhendang 2002).
The TPTI system has been criticized by many parties particularly due to its simplifi ed assumptions of the yield regulation as mentioned above. Suhendang (2002) pointed out some drawbacks of the TPTI system as follows:• The assumption that diameter increment is 1 cm per year applicable to all
forests is not valid. In fact, the diameter increment varies according to tree species and site condition. Sumarna et al. (2002) reported that the average diameter increment of commercial species was 0.59 cm yr-1 and that of non-commercial species was 0.53 cm yr-1.
• The fi xed length of cutting cycle (i.e. 35 years) which is applicable to all forests is unreasonable. Indeed, the length of cutting cycle should be determined based on the diameter increment and dynamic of stand structure.
• The method to calculate an annual allowable cut (AAC), which is only based upon standing stock volume and without considering current stand increment, is only suitable for virgin forests. It tends to be overestimated if it is applied to logged-over forests.
A study conducted by van Gardingen et al. (2003) in Labanan concession has also demonstrated that yield regulation based on the TPTI system would lead to a rapid deterioration of the forest structure. However, such conditions could be minimized by increasing the length of cutting cycle, controlling the yield strictly, and implementing reduced impact logging. For the Labanan concession, their simulations showed that the best options of yield regulation were limiting the yield to 50 m3 ha-1 with a 35-years cutting cycle or 60 m3 ha-1 for a 45-year cutting cycle.

Making sustainability work for complex forests18
Box 3. Adaptive Yield Regulation
ATO StandardC.4.4 Planning and implementation of logging are carried out in conformity with guidelines of the management plan and the contract agreement based on technical and social standards as well as fi nancial specifi cations.I.4.4.5 Felling programmes are adjusted rapidly if the change in data collected on the fi eld is signifi cantly different from that on which the manager’s initial estimate is based. The management plan is amended to be consistent with the true data.
ITTO StandardC.4.1 Flow of Forest ProduceI.4.1.9 Availability and implementation of procedures to monitor and review the management guidelinesI.4.1.11 Availability and implementation of: (a) procedures for comprehensive evaluation of the implementation of management guidelines, (b) procedures to assess damage to the residual stand, and (c) post-harvest surveys to assess the effectiveness of regeneration
Adaptive Yield Regulation
Principle of adaptive yield regulation Forest grow the varies from one place to another place and from one time to another time. Most of them are not known very well. The interaction among biophysical forest components e.g. insects, mammals, viruses, light and nutrients may effect the forest growth. People surrounding forests as the important actors of forest management in people-forest interactions may vary from one site to another. Therefore, no single silviculture system (e.g. TPTI) can be applied across different complex forests and people living systems. Fortunately, some standards have guided the continuous viewing of any silviculture systems (Box 3).
However, what is Adaptive Yield Regulation (AYR)? AYR is a term derived from the concept of adaptive management of forest. Purnomo (in press) defi nes adaptive management as “a management system which works consciously and actively in the complexity and uncertainty, which treats every action as a hypothesis to be tested in the real world, so that it will develop a continued learning process which reduces uncertainty in the system towards better management performance”. AYR is a term of yield regulation to include the complexity and uncertainty of forest stand growth and yield, which effect and is affected by its ecosystems and people surrounding it. The principles of AYR include:1. No single formula can be applied across the different complex forests. Forest
yield must be regulated based on a spatially and temporarily representative PSP. Otherwise, it is untrue.
2. Every forest yield fi gure and formula is a hypothesis to be tested in the real world. Learning from the past and future to make continued improvement is the only strategy for regulating forest yield.
Purnomo, H. et al. 19
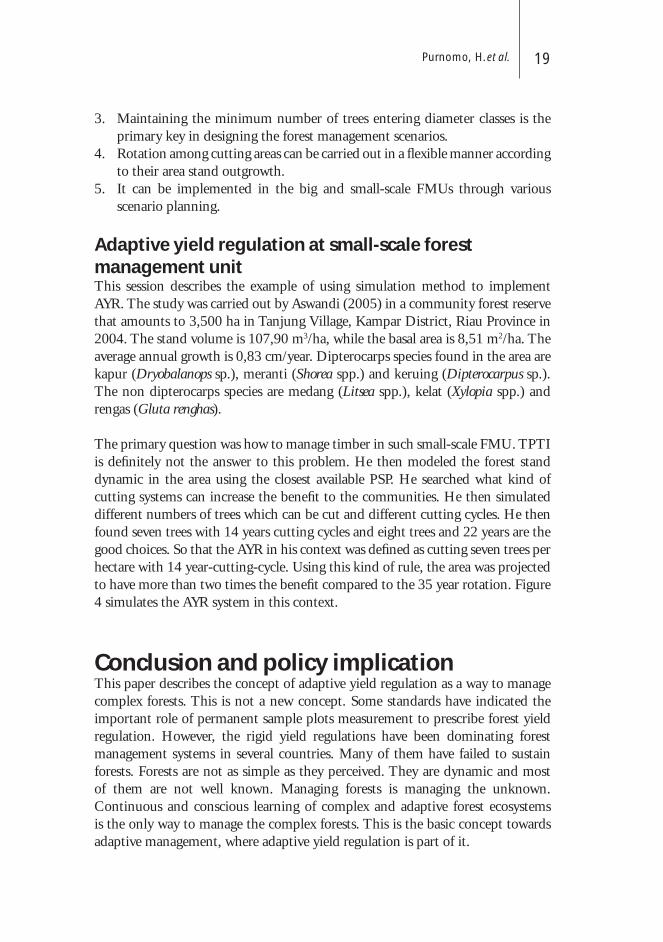
3. Maintaining the minimum number of trees entering diameter classes is the primary key in designing the forest management scenarios.
4. Rotation among cutting areas can be carried out in a fl exible manner according to their area stand outgrowth.
5. It can be implemented in the big and small-scale FMUs through various scenario planning.
Adaptive yield regulation at small-scale forest management unitThis session describes the example of using simulation method to implement AYR. The study was carried out by Aswandi (2005) in a community forest reserve that amounts to 3,500 ha in Tanjung Village, Kampar District, Riau Province in 2004. The stand volume is 107,90 m3/ha, while the basal area is 8,51 m2/ha. The average annual growth is 0,83 cm/year. Dipterocarps species found in the area are kapur (Dryobalanops sp.), meranti (Shorea spp.) and keruing (Dipterocarpus sp.). The non dipterocarps species are medang (Litsea spp.), kelat (Xylopia spp.) and rengas (Gluta renghas).
The primary question was how to manage timber in such small-scale FMU. TPTI is defi nitely not the answer to this problem. He then modeled the forest stand dynamic in the area using the closest available PSP. He searched what kind of cutting systems can increase the benefi t to the communities. He then simulated different numbers of trees which can be cut and different cutting cycles. He then found seven trees with 14 years cutting cycles and eight trees and 22 years are the good choices. So that the AYR in his context was defi ned as cutting seven trees per hectare with 14 year-cutting-cycle. Using this kind of rule, the area was projected to have more than two times the benefi t compared to the 35 year rotation. Figure 4 simulates the AYR system in this context.
Conclusion and policy implicationThis paper describes the concept of adaptive yield regulation as a way to manage complex forests. This is not a new concept. Some standards have indicated the important role of permanent sample plots measurement to prescribe forest yield regulation. However, the rigid yield regulations have been dominating forest management systems in several countries. Many of them have failed to sustain forests. Forests are not as simple as they perceived. They are dynamic and most of them are not well known. Managing forests is managing the unknown. Continuous and conscious learning of complex and adaptive forest ecosystems is the only way to manage the complex forests. This is the basic concept towards adaptive management, where adaptive yield regulation is part of it.
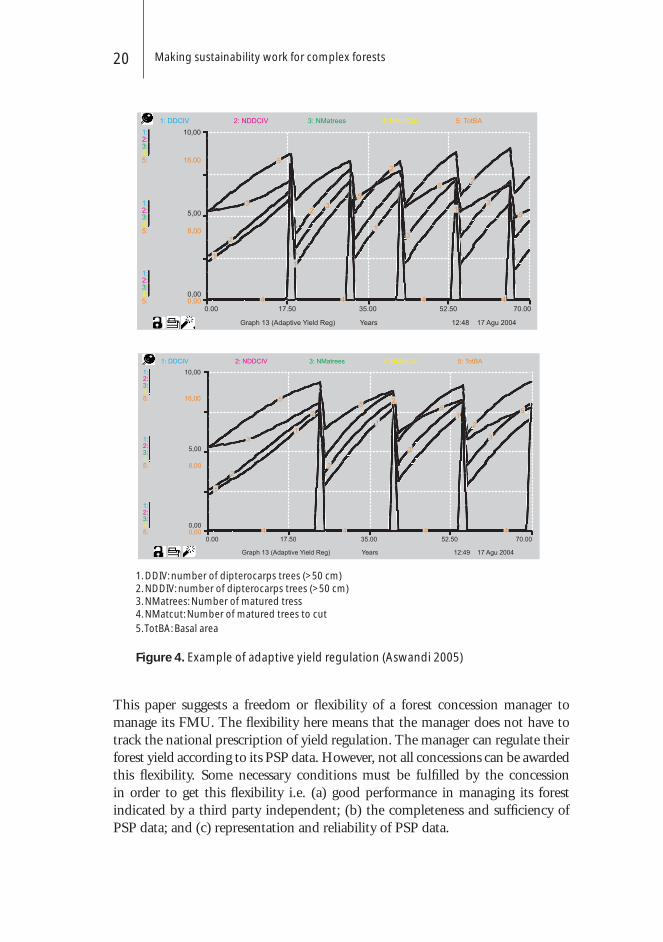
Making sustainability work for complex forests20
1. DDIV: number of dipterocarps trees (>50 cm)2. NDDIV: number of dipterocarps trees (>50 cm)3. NMatrees: Number of matured tress 4. NMatcut: Number of matured trees to cut5. TotBA: Basal area
Figure 4. Example of adaptive yield regulation (Aswandi 2005)
This paper suggests a freedom or fl exibility of a forest concession manager to manage its FMU. The fl exibility here means that the manager does not have to track the national prescription of yield regulation. The manager can regulate their forest yield according to its PSP data. However, not all concessions can be awarded this fl exibility. Some necessary conditions must be fulfi lled by the concession in order to get this fl exibility i.e. (a) good performance in managing its forest indicated by a third party independent; (b) the completeness and suffi ciency of PSP data; and (c) representation and reliability of PSP data.

Purnomo, H. et al. 21
ReferencesAlder, D. 1995. Growth modeling for mixed tropical forests. University of Oxford
Tropical Forestry Papers: 30.Aswandi. 2005. Skenario Pengaturan Hasil pada Unit Manajemen Skala Kecil.
Thesis. Sekolah Pascasarjana, Institut Pertanian Bogor.Becker, B. 1997. Sustainability Assessment: A Review of Values, Concepts, and
Methodological Approaches. Issue in Agriculture 10. Washington DC: CGIAR Publ.
Bueren EML de, Blom EM. 1997. Hierarchical Framework for the Formulation of Sustainable Forest Management Standards: Principle, Criteria and Indicators. The Netherlands: The Tropenbos Foundation.
Fowler, H.W. and Fowler, F.G. editors. 1995. The Concise Oxford Dictionary of Current English 9th edition. Oxford: Clarendon Press.
Haeruman, H. 1995. Strategy for Sustainable Forestry Management. In: E. Suhendang, Haeruman H, Soerianegara I, editor. Pengelolaan Hutan Produksi Lestari di Indonesia: Konsep, Permasalahan dan Strategi Menuju Era Ekolabel. Fakultas Kehutanan IPB, Yayasan Gunung Menghijau dan Yayasan Ambarwati. Jakarta. p. 100-126.
International Tropical Timber Organization. 1998. Criteria and indicators for sustainable management of natural tropical forests. Yokohama: Pol Dev Seri 7.
Neufeldt, V. and Guralnik, D.B. editor. 1988. Webster’s New World Dictionary of American English . Third College Edition. New York: Webster’s New World.
Osmaton, F.C. 1968. The Management of Forests. London: George Allen and Unwin Ltd.
Prabhu, R., Colfer, C.J.P., Venkateswarlu, P., Tan, L.C., Soekmadi, R. and Wollenberg, E. 1996. Testing Criteria and Indicators for the Sustainable Forest Management of Forest: Phase I. Final Report. Bogor: CIFOR Special Publ.
Purnomo, H. (in Press) Teori Sistem Kompleks and Manajemen Hutan Adaptif. Fakultas Kehutanan IPB.
Purnomo, H., Mendoza, G.A., Prabhu, R. and Yasmi, Y. 2004. Developing Multi-stakeholder Forest Management Scenarios: A Multi-Agent System Simulation Approach. Forest Policy and Economics Journal 7: 475– 491.
Schtivelman, J. and Russel, H.C. 1989. Sustainable development, human resources and technology. In: Nef J, Vanderkop J, Wisema H, editor. Ethics and Technology: Ethical Choices in the Age of Pervasive Technology. Toronto: Wall & Thomson.

Making sustainability work for complex forests22
Suhendang, E. 2002. Evaluasi konsep TPI, TPTI serta keadaan hutan dan pertumbuhan pada hutan alam dan implikasinya terhadap pengelolaan hutan alam produksi di Indonesia. Paper presented in ‘Workshop on Silvicultural Prescriptions and Cutting Cycle for Indonesia’s Production Forest’. FORDA, CIFOR and European Union. Bogor 10-11 Juni 2002.
Van Gardingen, P.R., McLeish, M.J., Phillips, P.D., Fadilah, D., Tyrie, G. and Yasman, I. 2003. Financial and ecological analysis of management options for logged-over Dipterocarp forests in Indonesian Borneo. Forest Ecology and Management 183: 1-29.
Vanclay, J.K. 1994. Modelling Forest Growth and Yield: Applications to Mixed Tropical Forests. Wallingford UK: Cab International.
Gusti Hardiansyah, Tri Hardjanto and Mamat Mulyana
Jl. Adisucipto Km 5,3 P.O. Box 16, PontianakKalimantan Barat, Indonesia
AbstractTPTJ is the selective cutting and strip planting system. This system is a modifi cation of the Indonesia Selective Cutting and Planting System (TPTI), and was put in practice in PT SBK in 1998. The main purpose of TPTJ is to ensure sustainable harvests, and the conservation of rainforest ecosystems.
The practice was carried out in a logged-over forest (208 300 ha), consisting of 148,939 ha for logging, 10,972 ha for replanting and 48 389 Ha for conservation. In TPTJ, selected trees with diameter > 45 cm were harvested. The width of clearcut strip is 3 m. A 15-22 m block or intermediate block is established between the clearcut strips. Only selected trees are cut in these blocks. Selected Shorea species are planted along the clearcut strip, and parent trees (Ø > 20 cm) in intermediate blocks were carefully maintained.
This management practice shows that TPTJ is a lot better than the former Indonesia Selective Cutting System. The natural regeneration in intermediate blocks is high due to the opening gaps. Under this adjustable TPTJ system, trees with Ø > 45 cm are logged, while in the Indonesia Selective Cutting and Planting System (TPTI) the harvest is limited to trees with Ø > 60 cm. Since the robust growths of natural regeneration, the logging cycle is predicted to be shorter than the 35 years logging cycle of TPTI. However, TPTJ is only applied to logged-over forests. Other disadvantages that are associated with the practice of TPTJ are increases in production costs and potential environmental impacts, resulting from the establishment of clearcut strips.
Keywords: Modifi ed Indonsian Selective Cutting, sustainable forest
A brief note on TPTJ (Tebang Pilih dan Tanam Jalur), a modifi ed Indonesia selective cutting system, from experience of PT Sari Bumi Kusuma timber concessionaire

A brief note on TPTJ24
IntroductionIndonesian Cutting Systems have experienced many modifi cations. The fi rst cutting system is called TPI (Tebang Pilih Indonesia, Indonesian Selective Cutting), which was introduced in 1972. The presently practiced cutting method is known as Tabang Pilih dan Tanam Indonesia (Indonesia Selective Cutting and Planting System, TPTI), which was fi rstly implemented in 1989. Finally, the Government has introduced a modifi ed TPTI, and this is called Tebang Pilih dan Tanam Jalur (Selective Cutting and Strip Planting System ,TPTJ).
PT Sari Bumi Kusuma (PT SBK), a forest concession company, was given a second lease for 70 years on 27 February 1998, with a total area of logged over forest of 208,300 ha. Under this new lease, the Government authorized PT SBK to apply TPTJ. The fi rst concession area, 270,000 ha, was granted in 1978.
The harvest was initially commenced in 1978, with the TPTI system. Major species found in the area are Meranti (Shorea spp), Melapi (Terictia spp), Kapur (Dryobalanops spp), Bangkirai (Shorea laevifolia), Keruing (Dipterocapus spp) and Mersawa (Anisoptera spp). The comparison of forest conditions in uncut and cut areas at the end of the fi rst concession cycle is presented in Tables 1 and 2.
This paper aims to introduce the preliminary results of TPTJ implementation in PT SBK.
MaterialThe system was applied in 1989. The logging area covers 148,939 ha for logging, 10,972 ha for replanting and 48,389 ha for conservation. The total concession area is 208,300 ha, which is divided into two blocks:1. Katingan/Seruyan Block, with a total area of about 147,600 ha, located in
the Katingan Hulu & Seruyan Hulu Sub District (Kecamatan), Katingan & Seruyan District (Kabupaten) of Central Kalimantan.
2. Delang Block, with a total area of about 60,700 ha, located in the Lamandau and Delang sub-districts, Lamandau District, Central Kalimantan.
The total effective forest area available under the new agreement is 148,939 ha and the annual area available for cutting is 4,255 ha of which 3,405 ha is in Block Katingan/Seruyan and 850 ha in Delang Block.
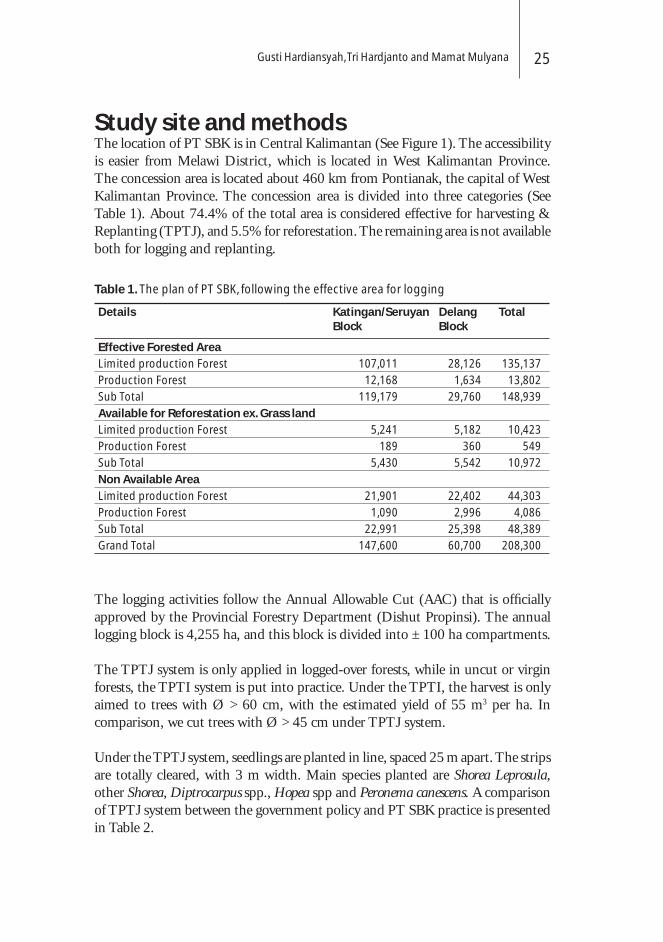
Gusti Hardiansyah, Tri Hardjanto and Mamat Mulyana 25
Table 1. The plan of PT SBK, following the effective area for logging
Details Katingan/Seruyan Block
Delang Block
Total
Effective Forested Area
Limited production Forest 107,011 28,126 135,137
Production Forest 12,168 1,634 13,802
Sub Total 119,179 29,760 148,939
Available for Reforestation ex. Grass land
Limited production Forest 5,241 5,182 10,423
Production Forest 189 360 549
Sub Total 5,430 5,542 10,972
Non Available Area
Limited production Forest 21,901 22,402 44,303
Production Forest 1,090 2,996 4,086
Sub Total 22,991 25,398 48,389
Grand Total 147,600 60,700 208,300
Study site and methodsThe location of PT SBK is in Central Kalimantan (See Figure 1). The accessibility is easier from Melawi District, which is located in West Kalimantan Province. The concession area is located about 460 km from Pontianak, the capital of West Kalimantan Province. The concession area is divided into three categories (See Table 1). About 74.4% of the total area is considered effective for harvesting & Replanting (TPTJ), and 5.5% for reforestation. The remaining area is not available both for logging and replanting.
The logging activities follow the Annual Allowable Cut (AAC) that is offi cially approved by the Provincial Forestry Department (Dishut Propinsi). The annual logging block is 4,255 ha, and this block is divided into ± 100 ha compartments.
The TPTJ system is only applied in logged-over forests, while in uncut or virgin forests, the TPTI system is put into practice. Under the TPTI, the harvest is only aimed to trees with Ø > 60 cm, with the estimated yield of 55 m3 per ha. In comparison, we cut trees with Ø > 45 cm under TPTJ system.
Under the TPTJ system, seedlings are planted in line, spaced 25 m apart. The strips are totally cleared, with 3 m width. Main species planted are Shorea Leprosula, other Shorea, Diptrocarpus spp., Hopea spp and Peronema canescens. A comparison of TPTJ system between the government policy and PT SBK practice is presented in Table 2.

A brief note on TPTJ26
Table 2. A comparison of TPTJ practice by PT SBK and the government policy
Criteria Govt. Prescriptions SBK modifi ed System
Distance between planting lines 25 m 25 m
Distance between trees on planting line 5 m 5 m
Witdh of clear-cut planting strip 3 m 3 m
Partially cleared strip on either side of clear-cut strip to reduce shading (all trees above 30 cm DBH are to be cut)
3.5 m wide on both sides of each clear-cut strips
None
Witdh of area in-between strips 15 m 22 m
Minimal DBH of trees to be harvested in the area in-between strips
40 cm Up 45 cm Up
Between two clearcut strips, a 22 m block is retained in order to enhance natural regeneration. A 35-year cutting cycle will be applied in this block.
ResultsBefore we present the results of TPTJ practice, we would like to present the conditions of uncut and logged areas from the concession.
Figure 1. The location of PT SBK concession area
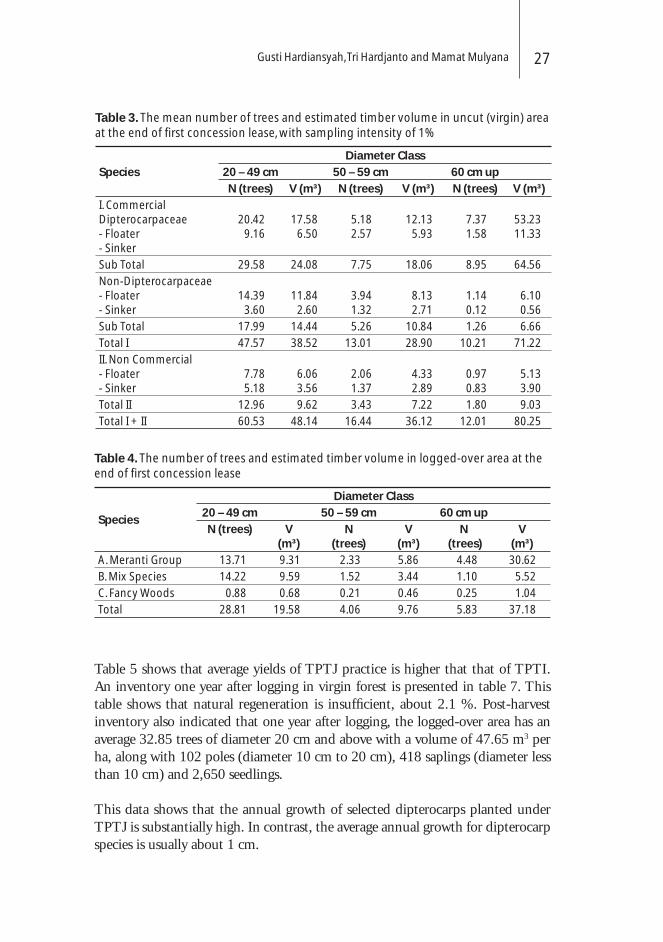
Gusti Hardiansyah, Tri Hardjanto and Mamat Mulyana 27
Table 4. The number of trees and estimated timber volume in logged-over area at the end of fi rst concession lease
Species
Diameter Class
20 – 49 cm 50 – 59 cm 60 cm up
N (trees) V (m³)
N (trees)
V (m³)
N (trees)
V (m³)
A. Meranti Group 13.71 9.31 2.33 5.86 4.48 30.62
B. Mix Species 14.22 9.59 1.52 3.44 1.10 5.52
C. Fancy Woods 0.88 0.68 0.21 0.46 0.25 1.04
Total 28.81 19.58 4.06 9.76 5.83 37.18
Table 3. The mean number of trees and estimated timber volume in uncut (virgin) area at the end of fi rst concession lease, with sampling intensity of 1%
Species
Diameter Class
20 – 49 cm 50 – 59 cm 60 cm up
N (trees) V (m³) N (trees) V (m³) N (trees) V (m³)
I. CommercialDipterocarpaceae- Floater- Sinker
20.429.16
17.586.50
5.182.57
12.135.93
7.371.58
53.2311.33
Sub Total 29.58 24.08 7.75 18.06 8.95 64.56
Non-Dipterocarpaceae- Floater- Sinker
14.393.60
11.842.60
3.941.32
8.132.71
1.140.12
6.100.56
Sub Total 17.99 14.44 5.26 10.84 1.26 6.66
Total I 47.57 38.52 13.01 28.90 10.21 71.22
II. Non Commercial- Floater- Sinker
7.785.18
6.063.56
2.061.37
4.332.89
0.970.83
5.133.90
Total II 12.96 9.62 3.43 7.22 1.80 9.03
Total I + II 60.53 48.14 16.44 36.12 12.01 80.25
Table 5 shows that average yields of TPTJ practice is higher that that of TPTI. An inventory one year after logging in virgin forest is presented in table 7. This table shows that natural regeneration is insuffi cient, about 2.1 %. Post-harvest inventory also indicated that one year after logging, the logged-over area has an average 32.85 trees of diameter 20 cm and above with a volume of 47.65 m3 per ha, along with 102 poles (diameter 10 cm to 20 cm), 418 saplings (diameter less than 10 cm) and 2,650 seedlings.
This data shows that the annual growth of selected dipterocarps planted under TPTJ is substantially high. In contrast, the average annual growth for dipterocarp species is usually about 1 cm.
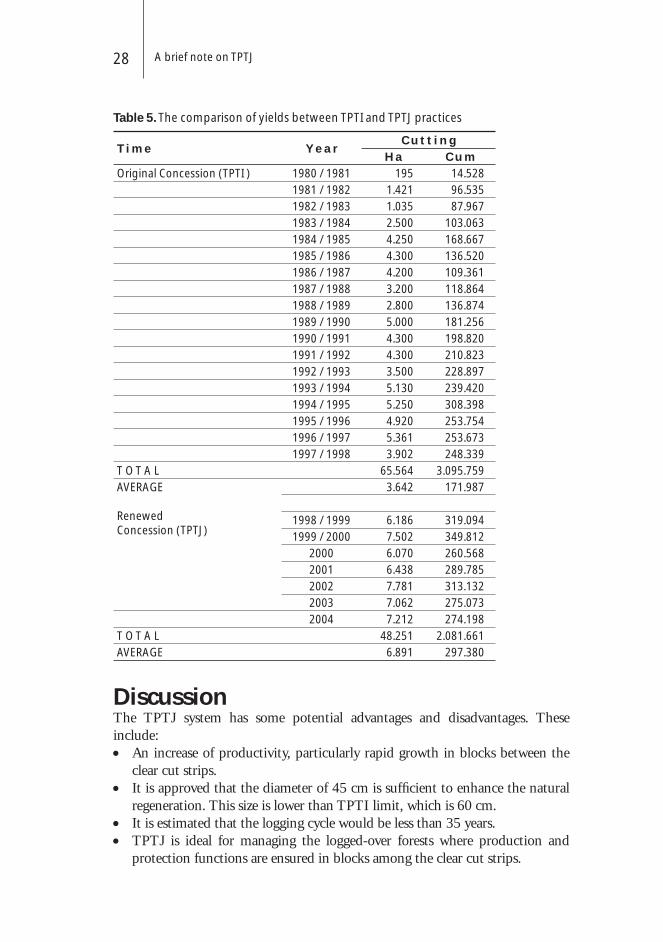
A brief note on TPTJ28
Table 5. The comparison of yields between TPTI and TPTJ practices
T i m e Y e a rC u t t i n g
H a C u m
Original Concession (TPTI ) 1980 / 1981 195 14.528
1981 / 1982 1.421 96.535
1982 / 1983 1.035 87.967
1983 / 1984 2.500 103.063
1984 / 1985 4.250 168.667
1985 / 1986 4.300 136.520
1986 / 1987 4.200 109.361
1987 / 1988 3.200 118.864
1988 / 1989 2.800 136.874
1989 / 1990 5.000 181.256
1990 / 1991 4.300 198.820
1991 / 1992 4.300 210.823
1992 / 1993 3.500 228.897
1993 / 1994 5.130 239.420
1994 / 1995 5.250 308.398
1995 / 1996 4.920 253.754
1996 / 1997 5.361 253.673
1997 / 1998 3.902 248.339
T O T A L 65.564 3.095.759
AVERAGE
RenewedConcession (TPTJ)
3.642 171.987
1998 / 1999 6.186 319.094
1999 / 2000 7.502 349.812
2000 6.070 260.568
2001 6.438 289.785
2002 7.781 313.132
2003 7.062 275.073
2004 7.212 274.198
T O T A L 48.251 2.081.661
AVERAGE 6.891 297.380
DiscussionThe TPTJ system has some potential advantages and disadvantages. These include:• An increase of productivity, particularly rapid growth in blocks between the
clear cut strips.• It is approved that the diameter of 45 cm is suffi cient to enhance the natural
regeneration. This size is lower than TPTI limit, which is 60 cm.• It is estimated that the logging cycle would be less than 35 years.• TPTJ is ideal for managing the logged-over forests where production and
protection functions are ensured in blocks among the clear cut strips.
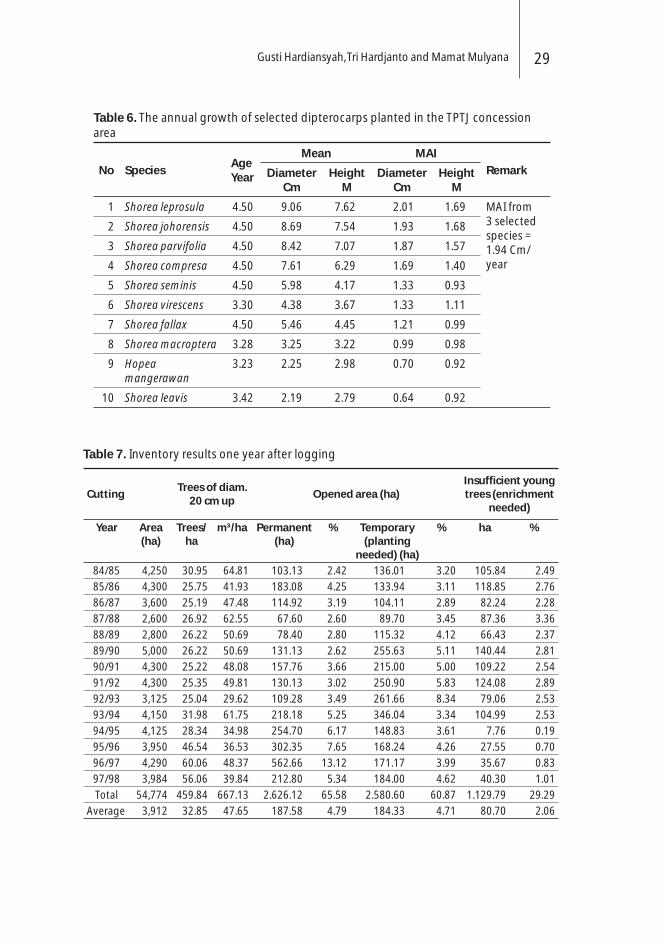
Gusti Hardiansyah, Tri Hardjanto and Mamat Mulyana 29
Table 6. The annual growth of selected dipterocarps planted in the TPTJ concession area
No SpeciesAge Year
Mean MAI
RemarkDiameterCm
HeightM
DiameterCm
HeightM
1 Shorea leprosula 4.50 9.06 7.62 2.01 1.69 MAI from 3 selected species = 1.94 Cm/year
2 Shorea johorensis 4.50 8.69 7.54 1.93 1.68
3 Shorea parvifolia 4.50 8.42 7.07 1.87 1.57
4 Shorea compresa 4.50 7.61 6.29 1.69 1.40
5 Shorea seminis 4.50 5.98 4.17 1.33 0.93
6 Shorea virescens 3.30 4.38 3.67 1.33 1.11
7 Shorea fallax 4.50 5.46 4.45 1.21 0.99
8 Shorea macroptera 3.28 3.25 3.22 0.99 0.98
9 Hopea mangerawan
3.23 2.25 2.98 0.70 0.92
10 Shorea leavis 3.42 2.19 2.79 0.64 0.92
Table 7. Inventory results one year after logging
CuttingTrees of diam.
20 cm upOpened area (ha)
Insuffi cient young trees (enrichment
needed)
Year Area (ha)
Trees/ha
m³/ha Permanent (ha)
% Temporary(planting
needed) (ha)
% ha %
84/85 4,250 30.95 64.81 103.13 2.42 136.01 3.20 105.84 2.49
85/86 4,300 25.75 41.93 183.08 4.25 133.94 3.11 118.85 2.76
86/87 3,600 25.19 47.48 114.92 3.19 104.11 2.89 82.24 2.28
87/88 2,600 26.92 62.55 67.60 2.60 89.70 3.45 87.36 3.36
88/89 2,800 26.22 50.69 78.40 2.80 115.32 4.12 66.43 2.37
89/90 5,000 26.22 50.69 131.13 2.62 255.63 5.11 140.44 2.81
90/91 4,300 25.22 48.08 157.76 3.66 215.00 5.00 109.22 2.54
91/92 4,300 25.35 49.81 130.13 3.02 250.90 5.83 124.08 2.89
92/93 3,125 25.04 29.62 109.28 3.49 261.66 8.34 79.06 2.53
93/94 4,150 31.98 61.75 218.18 5.25 346.04 3.34 104.99 2.53
94/95 4,125 28.34 34.98 254.70 6.17 148.83 3.61 7.76 0.19
95/96 3,950 46.54 36.53 302.35 7.65 168.24 4.26 27.55 0.70
96/97 4,290 60.06 48.37 562.66 13.12 171.17 3.99 35.67 0.83
97/98 3,984 56.06 39.84 212.80 5.34 184.00 4.62 40.30 1.01
Total 54,774 459.84 667.13 2.626.12 65.58 2.580.60 60.87 1.129.79 29.29
Average 3,912 32.85 47.65 187.58 4.79 184.33 4.71 80.70 2.06

A brief note on TPTJ30
• From a socio-economic perspective, the TPTJ needs more workers than the TPTI system (almost twice in number). And forest managed under TPTJ is locally considered as a man-made forest, which would prohibit local people to conduct shifting cultivation, as the customary law doesn’t allow cultivation in a man-made forest.
• TPTJ system is more costly than the other system.• Environmental impact from the clearcut strips could be potentially high, and
this needs a good environmental management plan.
In a 35-year-cycle, the estimated yield is about 267 m3 per ha from the clearcut strips, and 72 m3 from the blocks. Our calculation shows that the annual growth under TPTJ system is about 9.7 m3. This is a lot higher than the TPTI system, which is about 1 m3/ha/yr.
ConclusionAt this stage, we found that the TPTJ system is much better than the TPTI system. A major advantage of TPTJ is robust growth and rapid diameter increment of planted dipterocarps, both on the clearcut strips and intermediate blocks. This means that the logging cycle would be shorter than 35 years, and the company would enjoy sustainable harvest from planted dipterocarp forest. The TPTJ also employs more workers than the TPTI.
It is also important to note that environmental impact of clearcut strip establishment is potentially detrimental if no control measure is applied. With proper environmental management, the potential impacts could be reduced or managed. The establishment of planted forests also would reduce the rate of forest conversion into small scale food crop agriculture, particularly by shifting cultivators. According to customary laws, indigenous communities are not allowed to practice shifting cultivation in any planted forest without a permit from the owners.
AcknowledgementsThe authors are grateful to many people in the management of Alas Kusuma Group, namely: Mr. Suhadi, Mr. Imbran Susanto & Mr. Nana Suparna. Special thanks goes to Gusti Anshari, from Yayasan Konservasi Borneo, for editing the manuscript.
Gusti Hardiansyah, Tri Hardjanto and Mamat Mulyana 31
ReferencesAPHI. 2002. Evaluation of 30 HPHs Performance According to ITTO Criteria,
Draft.Ministry of Forestry RI – ITTO. 2004, Procceding Regional Workshop on
Strengthening The Asia Forestry Partnership. Yogyakarta. IndonesiaMulyana, Hardjanto, Hardiansyah. 2005. Membangun Hutan Tanaman Meranti
Membedah Mitos Kegagalan Melanggengkan Tradisi Pengusahaan Hutan [Developing Meranti (Shorea sp) Plantation, To Overcome Failure & To Sustain Forest Utilization Tradition]. Wana Aksara, Jakarta. Indonesia.
Mulyana, Hardjanto, Hardiansyah. 2005. Rencana Karya Tahunan Pengusahaan Hutan Tanaman Industri (Sistem TPTJ) Tahun 2005. PT. Sari Bumi Kusuma Kalimantan Tengah [The 2005 Year Planning Report of PT Sari Bumi Kusuma Central Kalimantan].
SmartWood. 2001. SmartWood Certifi cation Scoping Report – PT Sari Bumi Kusuma.
Suparna. N. Rationalization of Levies in the Forestry Sector, Urgent to Carry Out. Paper at APHI Working Meeting, Denpasar.
Suparna, Harimawan, Hardiansyah. 2002. Implementing RIL in Alas Kusuma Group. AFP Proceeding – Applying RIL advanced SFM. FAO. Bangkok, Thailand.

Paian Sianturi1 and Markku Kanninen2
1 Department of Mathematics, Faculty of Mathematics and Natural Sciences (FMIPA), Bogor Agricultural University (IPB), Bogor, 16680, Indonesia2 Center for International Forestry Research (CIFOR), Bogor, Indonesia
AbstractA permanent sample plot (PSP) dataset was enumerated from primary forest in Jambi province, Indonesia. No logging treatment was applied to the plot during the period in which measurements were taken. The dataset including individual tree information, such as tree identity, diameter and position within the plot, was put into the Sustainable Yield Management for Tropical Forests (SYMFOR) computer framework. The model has been calibrated using the Berau PSP dataset (a region in East Kalimantan).
Prior to the simulation, the Jambi dataset was compared to the Berau dataset in terms of diameter class distribution, the dominant tree species and tree family distribution. It was concluded that both datasets are not signifi cantly different. Moreover, both datasets are lowland tropical primary forest types. Therefore, the software recalibration process is not necessary.
Using the SYMFOR computer model several silvicultural methods were simulated. These were the conventional methods of TPTI, RIL (Reduced Impact Logging) and a set of silvicultural methods derived from the RIL namely RIL8, RIL50 and RIL60. The RIL8 indicates that 8 stems ha-1 is the maximum number of trees for the allowable cut, while the RIL50 and RIL60 are the maximum volume of the allowable cut are 50 m3 ha-1 and 60 m3 ha-1 respectively.
Indonesian natural tropical forests would not be sustainable under the current silvicultural guidelines – TPTI
A simulation study
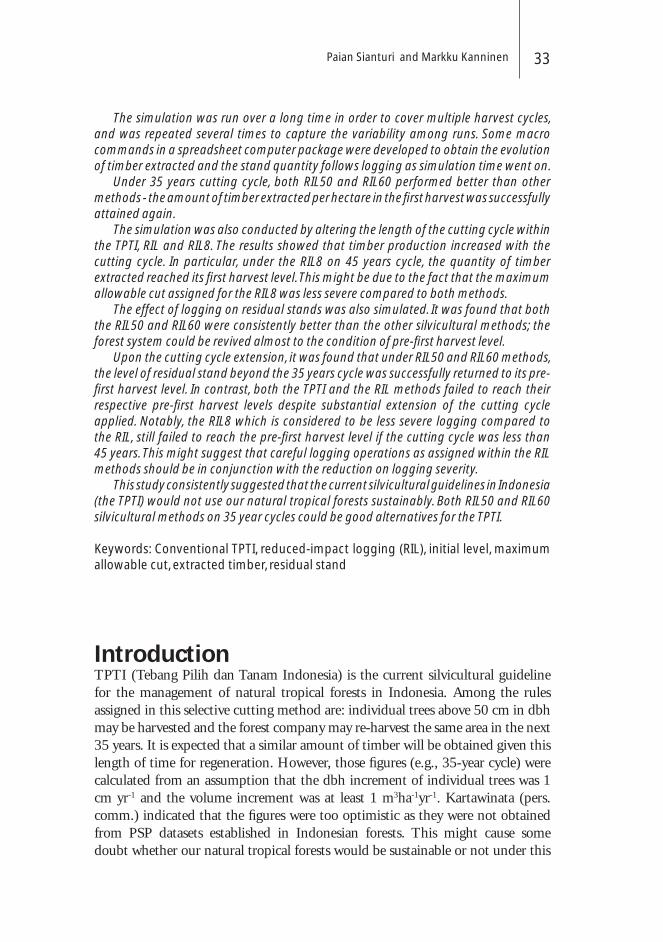
Paian Sianturi and Markku Kanninen 33
The simulation was run over a long time in order to cover multiple harvest cycles, and was repeated several times to capture the variability among runs. Some macro commands in a spreadsheet computer package were developed to obtain the evolution of timber extracted and the stand quantity follows logging as simulation time went on.
Under 35 years cutting cycle, both RIL50 and RIL60 performed better than other methods - the amount of timber extracted per hectare in the fi rst harvest was successfully attained again.
The simulation was also conducted by altering the length of the cutting cycle within the TPTI, RIL and RIL8. The results showed that timber production increased with the cutting cycle. In particular, under the RIL8 on 45 years cycle, the quantity of timber extracted reached its fi rst harvest level. This might be due to the fact that the maximum allowable cut assigned for the RIL8 was less severe compared to both methods.
The effect of logging on residual stands was also simulated. It was found that both the RIL50 and RIL60 were consistently better than the other silvicultural methods; the forest system could be revived almost to the condition of pre-fi rst harvest level.
Upon the cutting cycle extension, it was found that under RIL50 and RIL60 methods, the level of residual stand beyond the 35 years cycle was successfully returned to its pre-fi rst harvest level. In contrast, both the TPTI and the RIL methods failed to reach their respective pre-fi rst harvest levels despite substantial extension of the cutting cycle applied. Notably, the RIL8 which is considered to be less severe logging compared to the RIL, still failed to reach the pre-fi rst harvest level if the cutting cycle was less than 45 years. This might suggest that careful logging operations as assigned within the RIL methods should be in conjunction with the reduction on logging severity.
This study consistently suggested that the current silvicultural guidelines in Indonesia (the TPTI) would not use our natural tropical forests sustainably. Both RIL50 and RIL60 silvicultural methods on 35 year cycles could be good alternatives for the TPTI.
Keywords: Conventional TPTI, reduced-impact logging (RIL), initial level, maximum allowable cut, extracted timber, residual stand
IntroductionTPTI (Tebang Pilih dan Tanam Indonesia) is the current silvicultural guideline for the management of natural tropical forests in Indonesia. Among the rules assigned in this selective cutting method are: individual trees above 50 cm in dbh may be harvested and the forest company may re-harvest the same area in the next 35 years. It is expected that a similar amount of timber will be obtained given this length of time for regeneration. However, those fi gures (e.g., 35-year cycle) were calculated from an assumption that the dbh increment of individual trees was 1 cm yr-1 and the volume increment was at least 1 m3ha-1yr-1. Kartawinata (pers. comm.) indicated that the fi gures were too optimistic as they were not obtained from PSP datasets established in Indonesian forests. This might cause some doubt whether our natural tropical forests would be sustainable or not under this
Indonesian natural tropical forests34
silvicultural method. Here, sustainability was only defi ned as to the extent that the forest system could be restored back to the respective initial level of harvest and the pre-fi rst harvest level of the residual stand.
In order to conduct an assessment into the TPTI, extensive PSP datasets comprised of several experimental hectares, where continuous surveys have been conducted over a substantially long period of time, are required (Alder and Synott 1992). This is too expensive both in terms of labour, and fi nancial resources required. Even in terms of time intervals required to complete the survey, it is almost impossible to assess the TPTI in the conventional way. In addition, natural tropical forests are known for their complex systems, both in terms of the size and the species of trees growing in them (Whitmore 1998). This makes the task even more diffi cult. This is the reason why modelling becomes important, where natural phenomena are represented to build models. The natural phenomena being modelled are recruitment, tree mortality and tree growth.
SYMFOR is as a computer model framework, due to the modularity feature offered in this software. It enables forest managers or policy-makers to assess whether a silvicultural regime being practiced for their concessionary forests, could lead to forest sustainability or not (Young and Muetzelfeldt 1998).
SYMFOR has been calibrated for the Berau PSP dataset – meaning that mathematical equations and the parameter values implemented in the software were obtained using real datasets enumerated from this plot via regression analysis. Using these datasets, a computer simulation using SYMFOR was conducted, and concluded that the TPTI would not lead to sustainable forests (Phillips et al. 2003; van Gardingen et al. 2003). Therefore, the TPTI needs be revised.
In order to check whether such a conclusion is site specifi c or not, the model needs to be tested. A PSP dataset gathered from Jambi province Indonesia was utilised to conduct this test. Based on a statistical test that compared the spread of the mean basal area of both datasets, it was concluded that both datasets were not signifi cantly different. Therefore, recalibration of the mathematical equations implemented in the SYMFOR software were not necessary. Both the diameter and family distributions of all trees were presented to prove that the Jambi dataset is appropriate for this purpose. Also, both the Jambi and the Berau plots are categorised as lowland forests.
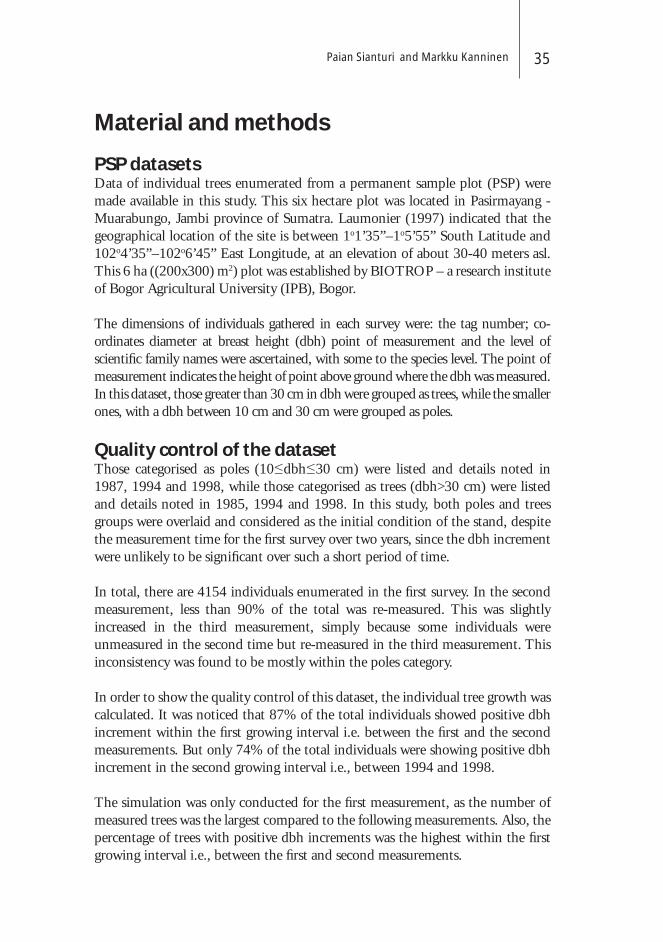
Paian Sianturi and Markku Kanninen 35
Material and methods
PSP datasetsData of individual trees enumerated from a permanent sample plot (PSP) were made available in this study. This six hectare plot was located in Pasirmayang - Muarabungo, Jambi province of Sumatra. Laumonier (1997) indicated that the geographical location of the site is between 1o1’35”–1o5’55” South Latitude and 102o4’35”–102o6’45” East Longitude, at an elevation of about 30-40 meters asl. This 6 ha ((200x300) m2) plot was established by BIOTROP – a research institute of Bogor Agricultural University (IPB), Bogor.
The dimensions of individuals gathered in each survey were: the tag number; co-ordinates diameter at breast height (dbh) point of measurement and the level of scientifi c family names were ascertained, with some to the species level. The point of measurement indicates the height of point above ground where the dbh was measured. In this dataset, those greater than 30 cm in dbh were grouped as trees, while the smaller ones, with a dbh between 10 cm and 30 cm were grouped as poles.
Quality control of the datasetThose categorised as poles (10≤dbh≤30 cm) were listed and details noted in 1987, 1994 and 1998, while those categorised as trees (dbh>30 cm) were listed and details noted in 1985, 1994 and 1998. In this study, both poles and trees groups were overlaid and considered as the initial condition of the stand, despite the measurement time for the fi rst survey over two years, since the dbh increment were unlikely to be signifi cant over such a short period of time.
In total, there are 4154 individuals enumerated in the fi rst survey. In the second measurement, less than 90% of the total was re-measured. This was slightly increased in the third measurement, simply because some individuals were unmeasured in the second time but re-measured in the third measurement. This inconsistency was found to be mostly within the poles category.
In order to show the quality control of this dataset, the individual tree growth was calculated. It was noticed that 87% of the total individuals showed positive dbh increment within the fi rst growing interval i.e. between the fi rst and the second measurements. But only 74% of the total individuals were showing positive dbh increment in the second growing interval i.e., between 1994 and 1998.
The simulation was only conducted for the fi rst measurement, as the number of measured trees was the largest compared to the following measurements. Also, the percentage of trees with positive dbh increments was the highest within the fi rst growing interval i.e., between the fi rst and second measurements.
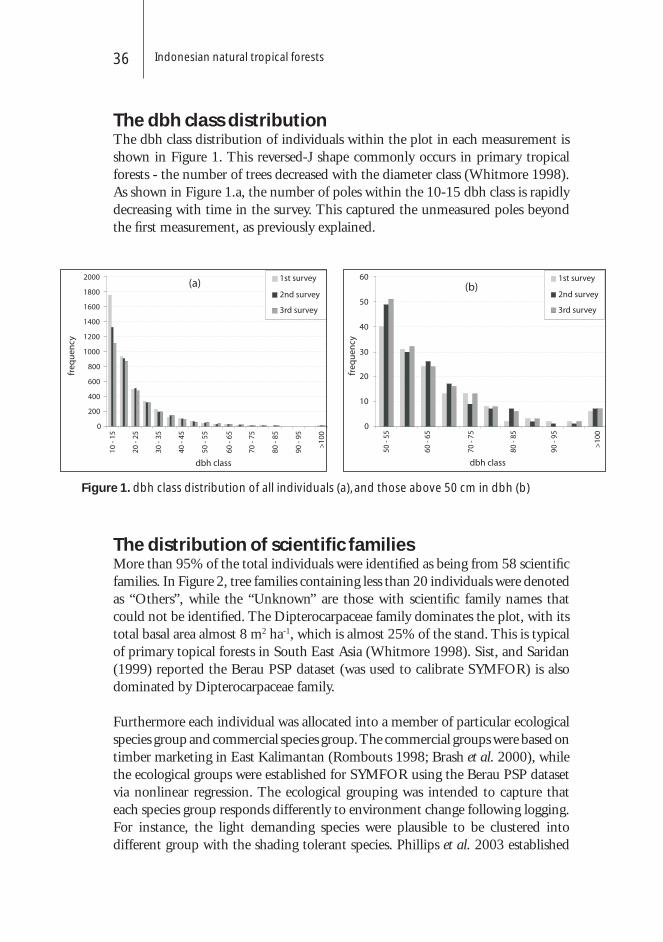
Indonesian natural tropical forests36
Figure 1. dbh class distribution of all individuals (a), and those above 50 cm in dbh (b)
The dbh class distributionThe dbh class distribution of individuals within the plot in each measurement is shown in Figure 1. This reversed-J shape commonly occurs in primary tropical forests - the number of trees decreased with the diameter class (Whitmore 1998). As shown in Figure 1.a, the number of poles within the 10-15 dbh class is rapidly decreasing with time in the survey. This captured the unmeasured poles beyond the fi rst measurement, as previously explained.
The distribution of scientifi c familiesMore than 95% of the total individuals were identifi ed as being from 58 scientifi c families. In Figure 2, tree families containing less than 20 individuals were denoted as “Others”, while the “Unknown” are those with scientifi c family names that could not be identifi ed. The Dipterocarpaceae family dominates the plot, with its total basal area almost 8 m2 ha-1, which is almost 25% of the stand. This is typical of primary topical forests in South East Asia (Whitmore 1998). Sist, and Saridan (1999) reported the Berau PSP dataset (was used to calibrate SYMFOR) is also dominated by Dipterocarpaceae family.
Furthermore each individual was allocated into a member of particular ecological species group and commercial species group. The commercial groups were based on timber marketing in East Kalimantan (Rombouts 1998; Brash et al. 2000), while the ecological groups were established for SYMFOR using the Berau PSP dataset via nonlinear regression. The ecological grouping was intended to capture that each species group responds differently to environment change following logging. For instance, the light demanding species were plausible to be clustered into different group with the shading tolerant species. Phillips et al. 2003 established
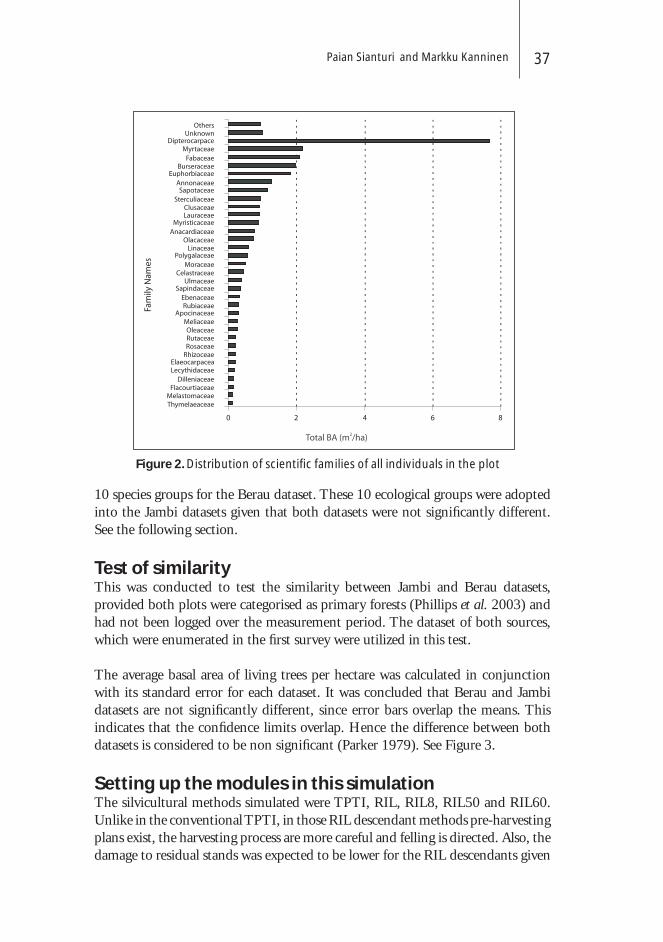
Paian Sianturi and Markku Kanninen 37
Figure 2. Distribution of scientifi c families of all individuals in the plot
10 species groups for the Berau dataset. These 10 ecological groups were adopted into the Jambi datasets given that both datasets were not signifi cantly different. See the following section.
Test of similarityThis was conducted to test the similarity between Jambi and Berau datasets, provided both plots were categorised as primary forests (Phillips et al. 2003) and had not been logged over the measurement period. The dataset of both sources, which were enumerated in the fi rst survey were utilized in this test.
The average basal area of living trees per hectare was calculated in conjunction with its standard error for each dataset. It was concluded that Berau and Jambi datasets are not signifi cantly different, since error bars overlap the means. This indicates that the confi dence limits overlap. Hence the difference between both datasets is considered to be non signifi cant (Parker 1979). See Figure 3.
Setting up the modules in this simulationThe silvicultural methods simulated were TPTI, RIL, RIL8, RIL50 and RIL60. Unlike in the conventional TPTI, in those RIL descendant methods pre-harvesting plans exist, the harvesting process are more careful and felling is directed. Also, the damage to residual stands was expected to be lower for the RIL descendants given

Indonesian natural tropical forests38
Figure 3. The comparison of basal area means between both data sets
Table 1. Specifi cation of silvicultural regimes set up in this simulation (adapted from van Gardingen et al. (2003))
TPTI RIL RIL8 RIL50 RIL60
maximum maximum maximum
8 stems/ha 50 m3/ha 60 m3/ha
Management modules
Felling Undirectional Directional Directional Directional Directional
Plan skidtrails Straight Branched Branched Branched Branched
Management parameters
Logging specifi cations
Dbh threshold (groups 1-5) (cm)
50 50 50 50 50
Proportion of commecial trees (groups 1-5)
0.3 0.3 0.3 0.3 0.3
Max. number of trees extracted
500 500 8 500 500
Max. volume extracted (m3)
500 500 500 50 60
Skidding (extraction)
Max. dbh likely to damage (cm)
40 30 30 30 30
Skid prepared radius (m)
5 3 3 3 3
Skid width (m) 7 5 5 5 5
Paian Sianturi and Markku Kanninen 39
a shorter Skid-prep-radius, narrower Skid-width and less damage to surrounding trees (Maxdbhdamage). Therefore, those RIL descendants are considered more ecologically sound than the conventional TPTI. See Table 1.
The maximum allowable cut assigned for TPTI and RIL was 500 m3 ha-1 while the RIL50 and RIL60 were assigned 50 m3 ha-1 and 60 m3 ha-1 respectively. For the RIL8, the maximum allowable cut was assigned 8 trees ha-1. The RIL8 is considered to be moderately severe logging compared to the conventional TPTI, but more intense than RIL50 and RIL60.
For each of these six hectare plots, the simulation ran for 350 years with 20 replicates, so that multiple harvests were covered and the variability among the runs captured.
The object categories stored were denoted as Livetrees and Felled trees (trees that were logged and extracted from the forest), while the other forest objects were denoted as Stand, describing data relating to the whole stand. Some macro commands in a spreadsheet computer package were developed to manipulate both Livetrees and Felledtrees objects to obtain the amount of timber extracted for each commercial species group as time went on. The Stand object was stored to obtain the quantity response of the residual stand on a particular silvicultural regime. This fl uctuate graph will be analysed to assess whether the silviculture applied would lead to sustainable forests or not.
Results and Discussion
Comparison among silvicultural regimesThe total basal area of timber extracted per hectare for each silvicultural method on 35-year cutting cycle, is presented in Figure 4. It was observed that the total quantity of timber rapidly dropped starting from the 2nd cycle to the 4th cycle (year-35 to year-105), then rose again.
Under the TPTI method, the basal area of timber has never reached its fi rst harvest level, despite having run the simulation 10 harvest cycles. This is because logging was too severe in the fi rst iteration. In other words, the maximum allowable cut assigned for this conventional TPTI was too high. As a consequence it will be very diffi cult to get back to its fi rst-harvest levels, although the simulation was carried out for a substantial long period of time. A similar pattern was depicted for the RIL and RIL8 methods.
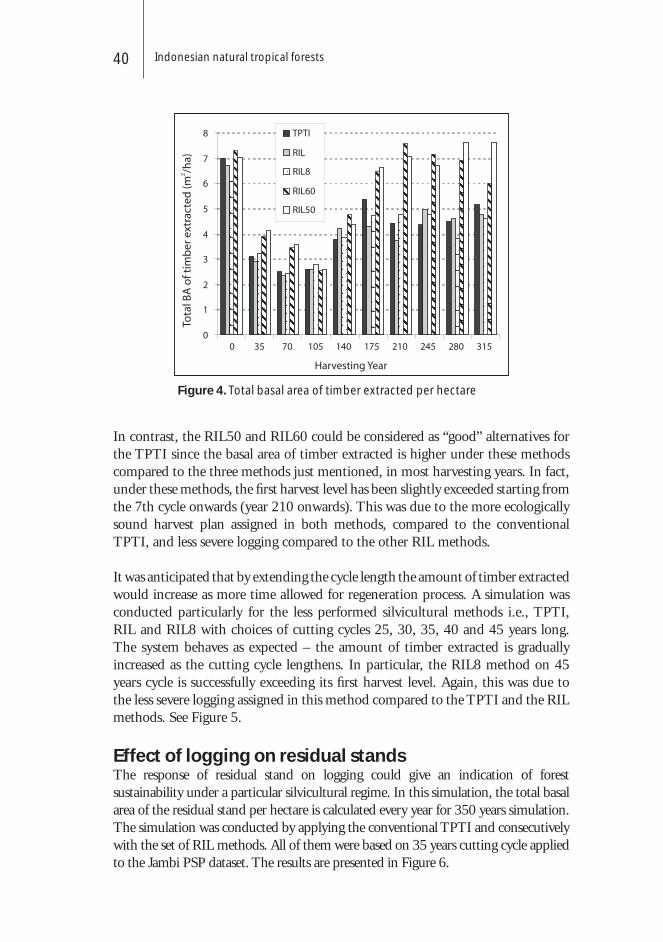
Indonesian natural tropical forests40
In contrast, the RIL50 and RIL60 could be considered as “good” alternatives for the TPTI since the basal area of timber extracted is higher under these methods compared to the three methods just mentioned, in most harvesting years. In fact, under these methods, the fi rst harvest level has been slightly exceeded starting from the 7th cycle onwards (year 210 onwards). This was due to the more ecologically sound harvest plan assigned in both methods, compared to the conventional TPTI, and less severe logging compared to the other RIL methods.
It was anticipated that by extending the cycle length the amount of timber extracted would increase as more time allowed for regeneration process. A simulation was conducted particularly for the less performed silvicultural methods i.e., TPTI, RIL and RIL8 with choices of cutting cycles 25, 30, 35, 40 and 45 years long. The system behaves as expected – the amount of timber extracted is gradually increased as the cutting cycle lengthens. In particular, the RIL8 method on 45 years cycle is successfully exceeding its fi rst harvest level. Again, this was due to the less severe logging assigned in this method compared to the TPTI and the RIL methods. See Figure 5.
Effect of logging on residual standsThe response of residual stand on logging could give an indication of forest sustainability under a particular silvicultural regime. In this simulation, the total basal area of the residual stand per hectare is calculated every year for 350 years simulation. The simulation was conducted by applying the conventional TPTI and consecutively with the set of RIL methods. All of them were based on 35 years cutting cycle applied to the Jambi PSP dataset. The results are presented in Figure 6.
Figure 4. Total basal area of timber extracted per hectare

Paian Sianturi and Markku Kanninen 41
Figure 5. Total basal area of timber extracted in the RIL8 method with cutting cycle altered
Figure 6. The residual stand’s response on 35-years cutting cycle
As discussed previously, both RIL50 and RIL60 are considered to be performing well in terms of the quantity of timber extracted. The same conclusion is drawn here. The total basal area of the residual stand under both silvicultural methods could reach its pre-fi rst harvest level, despite the fact that a long period of time is required.
In Figure 6, the total basal area of the residual stand under the TPTI method is lower than RIL50 and RIL60. This was expected, due to the less ecological
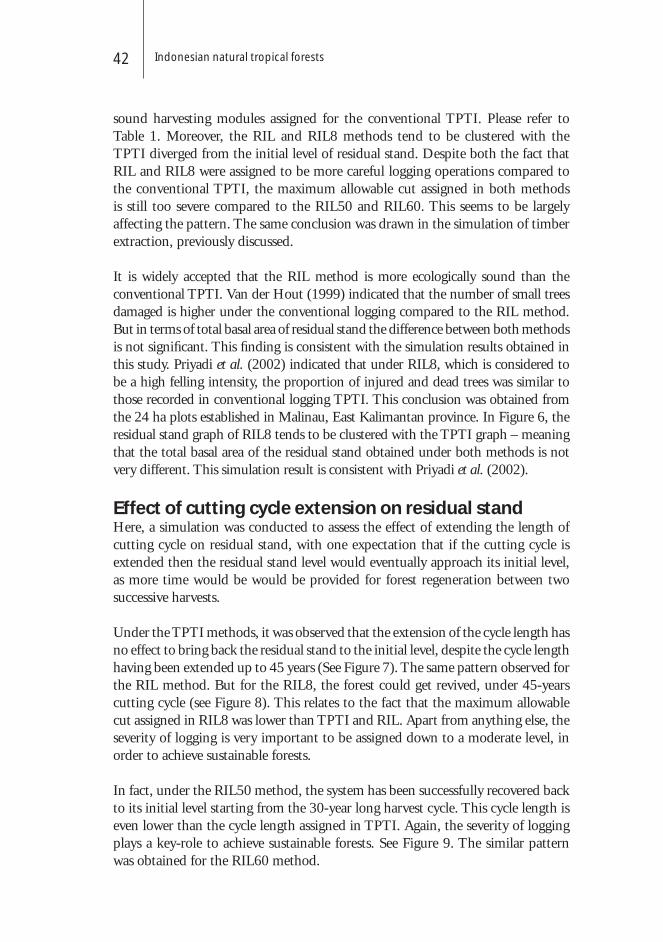
Indonesian natural tropical forests42
sound harvesting modules assigned for the conventional TPTI. Please refer to Table 1. Moreover, the RIL and RIL8 methods tend to be clustered with the TPTI diverged from the initial level of residual stand. Despite both the fact that RIL and RIL8 were assigned to be more careful logging operations compared to the conventional TPTI, the maximum allowable cut assigned in both methods is still too severe compared to the RIL50 and RIL60. This seems to be largely affecting the pattern. The same conclusion was drawn in the simulation of timber extraction, previously discussed.
It is widely accepted that the RIL method is more ecologically sound than the conventional TPTI. Van der Hout (1999) indicated that the number of small trees damaged is higher under the conventional logging compared to the RIL method. But in terms of total basal area of residual stand the difference between both methods is not signifi cant. This fi nding is consistent with the simulation results obtained in this study. Priyadi et al. (2002) indicated that under RIL8, which is considered to be a high felling intensity, the proportion of injured and dead trees was similar to those recorded in conventional logging TPTI. This conclusion was obtained from the 24 ha plots established in Malinau, East Kalimantan province. In Figure 6, the residual stand graph of RIL8 tends to be clustered with the TPTI graph – meaning that the total basal area of the residual stand obtained under both methods is not very different. This simulation result is consistent with Priyadi et al. (2002).
Effect of cutting cycle extension on residual standHere, a simulation was conducted to assess the effect of extending the length of cutting cycle on residual stand, with one expectation that if the cutting cycle is extended then the residual stand level would eventually approach its initial level, as more time would be would be provided for forest regeneration between two successive harvests.
Under the TPTI methods, it was observed that the extension of the cycle length has no effect to bring back the residual stand to the initial level, despite the cycle length having been extended up to 45 years (See Figure 7). The same pattern observed for the RIL method. But for the RIL8, the forest could get revived, under 45-years cutting cycle (see Figure 8). This relates to the fact that the maximum allowable cut assigned in RIL8 was lower than TPTI and RIL. Apart from anything else, the severity of logging is very important to be assigned down to a moderate level, in order to achieve sustainable forests.
In fact, under the RIL50 method, the system has been successfully recovered back to its initial level starting from the 30-year long harvest cycle. This cycle length is even lower than the cycle length assigned in TPTI. Again, the severity of logging plays a key-role to achieve sustainable forests. See Figure 9. The similar pattern was obtained for the RIL60 method.
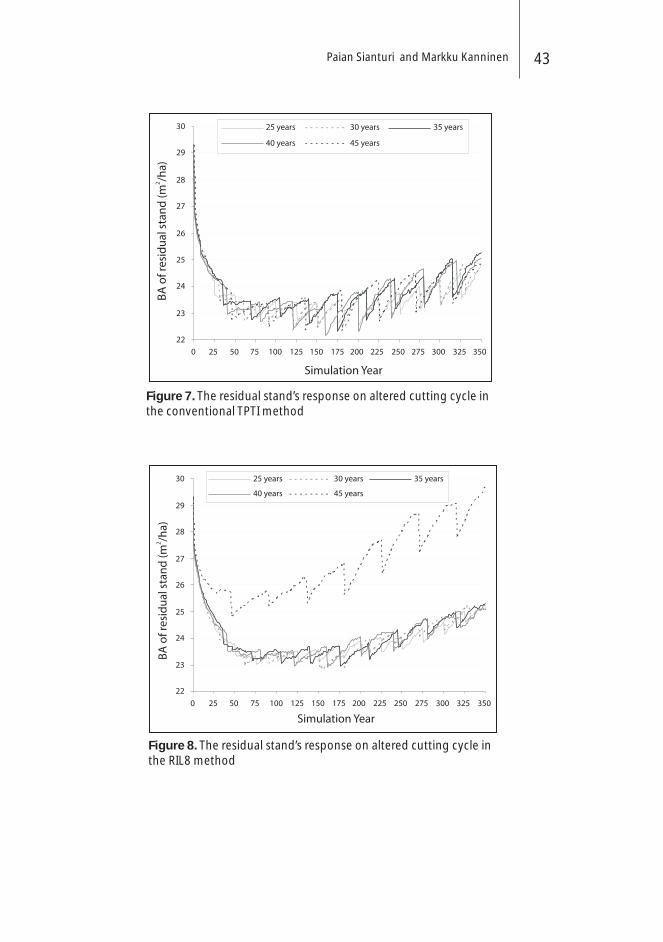
Paian Sianturi and Markku Kanninen 43
Figure 7. The residual stand’s response on altered cutting cycle in the conventional TPTI method
Figure 8. The residual stand’s response on altered cutting cycle in the RIL8 method

Indonesian natural tropical forests44
ConclusionsIn order to manage our natural forest in a sustainable manner, the current guidelines for the TPTI need to be revised, since the logging intensity assigned in the guidelines was found to be too severe. The silvicultural methods namely RIL50 and RIL60 are found to be the best alternative to the conventional TPTI, since the quantity of timber extracted per hectare could reach its initial level after a long period of time. It was shown that 35 years harvest cycle is adequate for both alternatives.
Moreover, in terms of the residual stand affected by logging, it was found that under the conventional TPTI the forest system has never reached its initial level, even after a long period of time. The main reason was that too much timber was extracted in the fi rst harvest. The reason seems to be valid for RIL8 method, a more ecologically sound harvest procedure, but logging was still too intense. The severity of logging is found to be the key factor affecting the failure to reach sustainability. The simulation on extending harvest cycle has shown that the forest system fails to be restored back to the initial level of timber extracted and the residual stand.
Figure 9. The residual stand’s response on altered cutting cycle in the RIL50 method
Paian Sianturi and Markku Kanninen 45
AcknowledgmentsI would like to thank CIFOR for the fi nancial support. My gratitude also goes to the University of Edinburgh for the SYMFOR software, and the BIOTROP for the datasets. Also, I am grateful for Glen for correcting the English and, of course, my family.
ReferencesAlder, D. and Synott, T.J., 1992. Permanent sample plot techniques for mixed
tropical forests. Tropical Forestry paper 25. Oxford Forestry Institute, Department of Plant Sciences, University of Oxford, UK.
Bertault, J. and Sist, P., 1997. An experimental comparison of different harvesting intensities with reduced-impact and conventional logging in East Kalimantan, Indonesia. For. Ecol. Manage. 94, 209-218.
Brash, T.E., Phillips, P.D. and van Gardingen, P.R., 2000. Species groups for use with the SYMFOR modelling framework. (http://meranti.ierm.ed.ac.uk/g&y/speciesgroups)
Laumonier, Y., 1997. The vegetation and physiography of Sumatra (Geobotany; v. 22). Kluwer Academic Publishers.
Parker, R.E., 1979. Introductory statistics for biology. 2nd ed. Institute of Biology. Studies in Biology: No. 43. Cambridge University Press.
Phillips, P.D., Yasman, I., Brash, T.E., and van Gardingen, P.R., 2002. Grouping tree species for analysis of forest data in Kalimantan (Indonesia Borneo). For. Ecol. Manage. 157, 205-216.
Phillips, P.D., Brash, T.E., Yasman, I., Subagyo, P. and van Gardingen, P.R., 2003. An Individual-based spatially explicit tree growth model for forests in East Kalimantan (Indonesian Borneo). Ecol. Modelling 159, 1-26.
Phillips, P.D. and van Gardingen, P.R., 2001. The SYMFOR framework for individual-based spatial ecological and silvicultural forest models. SYMFOR Technical Note Series No. 8. Centre for the study of Environmental Change and Sustainability (CECS). The University of Edinburgh, UK.
Priyadi, H., Kartawinata, K., Sist, P. and Sheil, D., 2002. Monitoring Permanent Sample Plots (PSPs) after Conventional and Reduced –Impact Logging in the Bulungan Research Forest, East Kalimantan, Indonesia. In: Shaharuddin bin Mohammad Ismail, Thai See Kiam, Yap Yee Hwai, Othman bin Deris and Svend Korsgaard (Eds). Proceedings of The Malaysia-ITTO International workshop on growth and yield of managed tropical forest 25-29 June 2002, Pan Pacifi c Hotel, Kuala Lumpur, Malaysia. Forestry Department Peninsular Malaysia.p 226-235.
Rombouts, J., 1998. Species grouping based on diameter increment in East Kalimantan. GTZ Sustainable Forest Management project, Samarinda Kalimantan Timur, 47 pp.

Indonesian natural tropical forests46
Sist, P. and Saridan, A., 1999. Stand structure and fl oristic composition of a primary lowland Dipterocarp forests in East Kalimantan. J. Trop. For. Sci. 11, 704-722.
Vanclay, J.K., 1994. Modelling Forest Growth and Yield: Application to Mixed Tropical Forests. CAB International, Wallingford, UK.
Van der Hout, P., 1999. Reduced impact logging in the tropical rain forest of Guyana: ecological, economic and silvicultural consequences. -- Georgetown, Guyana: Tropenbos - Guyana Programme. (Monograph) 335p.; ill. (Tropenbos - Guyana Series; no. 6).
Van Gardingen, P.R., 1998. TPTI implementation by Inhutani I Labanan: options for improving sustainable forest management. European Union, Berau Forest Management Project, Jakarta, 40 pp.
Van Gardingen, P.R, and Phillips, P.D., 2000. Growth and Yield Modelling: Application of SYMFOR to evaluate silvicultural systems. (DFID FRP Training Document). University of Edinburgh, UK.
Van Gardingen, P.R., McLeish, M.J, Phillips, P.D., Fadilah D., Tyrie, G. and Yasman, I., 2003. Financial and ecological analysis of management options for logged-over Dipterocarp forests in Indonesia Borneo. For. Ecol. Manage. 183, 1–29.
Whitmore, T.C., 1998. An Introduction to Tropical Rain Forests. Oxford University Press, Oxford, 226 pp.
Young, A.C. and Muetzelfeldt, R.I., 1998 The SYMFOR tropical modelling framework. Commonwealth Forestry Review, 77, 11-18.

Hari Priyadi1, Douglas Sheil1, Kuswata Kartawinata2, Plinio Sist3, Petrus Gunarso1 and Markku Kanninen1
1 Center for International Forestry ResearchP.O. Box 6596 JKPWB Jakarta 10065 Indonesia2 UNESCO Offi ce Jakarta, Regional Science Bureau for Asia and Pacifi c, Jl. Galuh (II) No. 5, Kebayoran Baru, P.O.Box 1273/JKT, Jakarta 12110, Indonesia3 Convenio Cirad-Embrapa, CENARGEN, Embrapa Recursos Genéticos e Biotecnologia, Parque Estação Biológica - PqEB - Av. W5 Norte (fi nal) PBE, Caixa Postal 02372 - Brasília, DF- 70770-900
AbstractPermanent sample plots (PSP) are an important tool in monitoring forest dynamics and change. In Malinau Research Forest, East Kalimantan, 24 PSPs of 1 ha each were established and all trees with dbh ≥ 20 cm were identifi ed and their diameters were measured in 1998 prior to logging operations and were re-assessed in 2000 and 2004. Two logging systems were implemented during that period: reduced-impact logging (RIL) and conventional logging (CNV). A total of 705 tree species with diameter at breast height (dbh) ≥ 20 cm were recorded from the permanent sample plots, of which 67 (9.5%) were dipterocarp species. Among the most common Dipterocarpaceae included Dipterocarpus lowii, D. stellatus, Shorea beccariana, S. brunescens, S. exelliptica, S. macroptera, S.maxwelliana, S. multifl ora, S. parvifolia, S. rubra and S. venulosa. Measurement of diameter increment and forest regeneration were undertaken in 2000 and 2004. In 2000, the mean sapling density calculated from 12 plots (of 5 x 100 m2 each) was 4,600 stem ha-1 both treatments. In the RIL plots, the mean annual increment of dipterocarp species assessed on a per plot basis varied with logging intensity from 0.35 to 0.52 cm/ yr, while in CNV plots, it ranged from 0.42 to 0.62 cm year-1. A group of selected non-dipterocarps were also assessed. The relationship between growth (cm year-1) and felling intensity (F
I in total number trees ha-1)
Tree growth and forest regeneration under different logging treatments in permanent sample plots of a hill mixed dipterocarps forest, Malinau Research Forest, Malinau, East Kalimantan, Indonesia
Tree growth and forest regeneration48
for dipterocarps and non-dipterocarps showed positive linear regressions: DiptRIL
= 0.242 yr-1 + 0.0850 F
I (R2=70.4%) and Non-Dipt
RIL = 0.190 + 0.0683 F
I (R2=54.3%). The mean
growth rate is less than the growth rate of 1 cm year-1 assumed by the Indonesian Selective Cutting and Replanting System or TPTI. A longer cutting cycle is needed for sustainable forest management.
Keywords: PSP, East Kalimantan, Hill mixed dipterocarps forest, Periodic annual diameter increment, RIL, TPTI, logging damage, forest regeneration
IntroductionIn December 1995, the Indonesian Ministry of Forestry designated 303,000 ha of forest in East Kalimantan (Indonesian Borneo) for CIFOR to develop into a model forest with long-term research-based management. The creation of this research forest - the fi rst ever in Indonesia - and the agreement with CIFOR grew out of a provision in the host-country agreement granting access to a long-term research site. CIFOR began the search for an appropriate site in 1994 and, in October 1995, submitted a recommendation to the Ministry of Forestry for an area in Malinau district (formerly in Bulungan district) (Figure 1). The Minister of Forestry approved the designation in December 1995.
The tropical forest of Malinau comprises protection forest (14%), conservation forest (25%), permanent production forest (26.5%), limited production forest (17%) and conversion forest (10.5%).
Both conventional and reduced-impact logging systems are currently used in Indonesia. The conventional logging system or logging as typically practiced is often described as unplanned and haphazard timber harvesting. In Indonesia, conventional logging refers to the TPTI system, which has been practiced by timber concession holders or HPH1 for over three decades. Despite detailed guidelines and requirements in TPTI, including pre-harvest survey and inventory, unplanned and uncontrolled timber harvesting has caused excessive logging damages leading to the imbalance between forest regeneration and production and yield of the forest will accordingly decline (Van der Hout 1999).
The concept of reduced-Impact Logging (RIL) surfaced about the middle of the 1990s. It is also referred to as ‘low impact logging’, ‘planned (as opposed to unplanned) logging’, ‘environmentally sound harvesting’ and ‘damage controlled logging’ (Van der Hout 1999). The RIL system is a collection of forest harvesting techniques and controls, which aims at a low level of damage to the stock of
1 Hak Pengusahaan Hutan
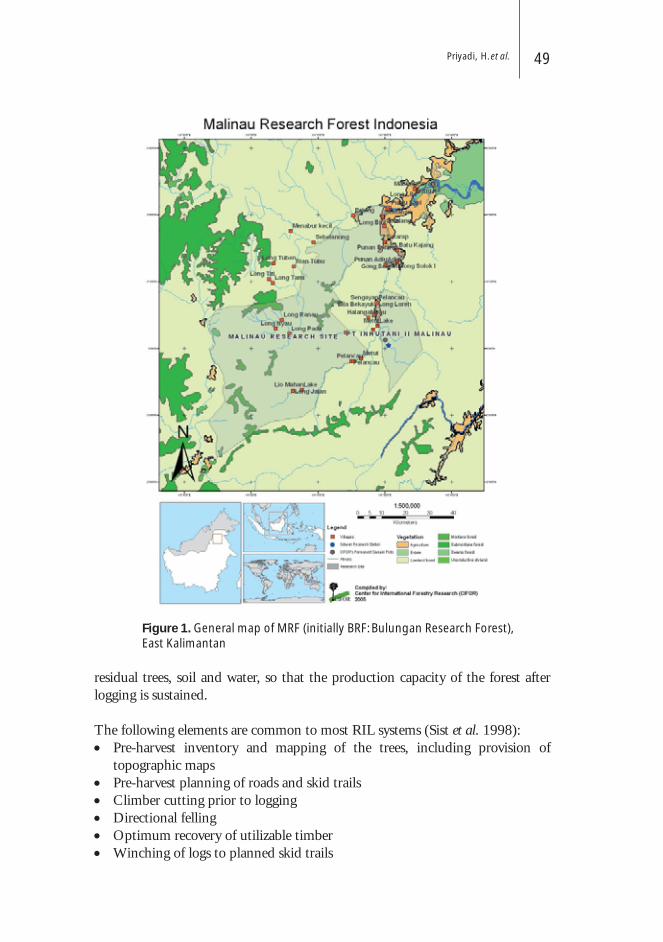
Priyadi, H. et al. 49
Figure 1. General map of MRF (initially BRF: Bulungan Research Forest), East Kalimantan
residual trees, soil and water, so that the production capacity of the forest after logging is sustained.
The following elements are common to most RIL systems (Sist et al. 1998):• Pre-harvest inventory and mapping of the trees, including provision of
topographic maps• Pre-harvest planning of roads and skid trails• Climber cutting prior to logging• Directional felling• Optimum recovery of utilizable timber• Winching of logs to planned skid trails

Tree growth and forest regeneration50
Conventional logging and reduced – impact logging were applied and compared in the Malinau production forest (Sist et al. 2003).The subsequent re-measurement of permanent sample plots in these logged-over forests will, therefore, be important in providing information on the biophysical data to assess these silvicultural systems and to determine the growth and yield of these forests.
Objectives of the studyThe objective of this study is the revision and improvement of the Indonesian silvicultural system by securing information on dynamics of the forest after CNV and RIL logging through observation of the Permanent Sample Plots (PSPs) to provide:1. Measurements of forest regeneration2. An understanding of the stand structure and status of species composition of
the logged forests 3. Quantitative data on tree growth that can be linked to site and logging
history
Research background and methods
Forest depletionEast Kalimantan is experiencing an ever accelerating loss of primary forest cover. Yet land use and vegetation patterns, both in spatial and temporal contexts, are not well-documented or understood because the conversions have been taking place so rapidly. Up to about four decades ago, the core of the forest area was little disturbed and sparsely populated by indigenous Dayak population, who practiced shifting agriculture and harvested various forest products. More intensive forest disturbances began in the late 1960s when commercial logging started. Initially it was small scale tree harvesting with low level of damage but later, large-scale logging operations began.
The need for best forest practiceAny efforts at sustainable management in mixed dipterocarp forest carry considerable risks due to the lucrative short term gains from destructive timber extraction. The question of how to achieve ‘sustainable forest management’ (in Malinau) is clearly neither purely a biophysical question, nor purely a social or economic one.
In general, logging causes various detectable impacts on the environment, depending on the intensity of disturbance and the extent of cover removed. By the same token, forest clearance and forest conversion to other land use are expected to cause greater
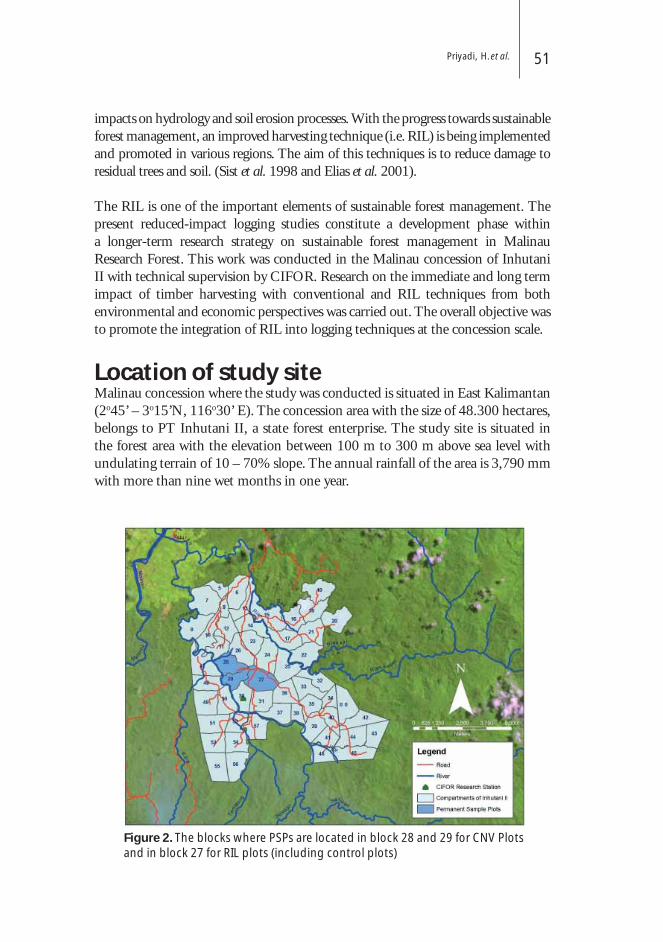
Priyadi, H. et al. 51
impacts on hydrology and soil erosion processes. With the progress towards sustainable forest management, an improved harvesting technique (i.e. RIL) is being implemented and promoted in various regions. The aim of this techniques is to reduce damage to residual trees and soil. (Sist et al. 1998 and Elias et al. 2001).
The RIL is one of the important elements of sustainable forest management. The present reduced-impact logging studies constitute a development phase within a longer-term research strategy on sustainable forest management in Malinau Research Forest. This work was conducted in the Malinau concession of Inhutani II with technical supervision by CIFOR. Research on the immediate and long term impact of timber harvesting with conventional and RIL techniques from both environmental and economic perspectives was carried out. The overall objective was to promote the integration of RIL into logging techniques at the concession scale.
Location of study siteMalinau concession where the study was conducted is situated in East Kalimantan (2o45’ – 3o15’N, 116o30’ E). The concession area with the size of 48.300 hectares, belongs to PT Inhutani II, a state forest enterprise. The study site is situated in the forest area with the elevation between 100 m to 300 m above sea level with undulating terrain of 10 – 70% slope. The annual rainfall of the area is 3,790 mm with more than nine wet months in one year.
Figure 2. The blocks where PSPs are located in block 28 and 29 for CNV Plots and in block 27 for RIL plots (including control plots)

Tree growth and forest regeneration52
Two blocks, namely number 28 and 29 with an area of 96 ha and 80 ha respectively, in company’s annual coupe (RKT) 1998/99 were selected for the conventional logging study while block 27, in the same annual coupe with an area of 137 ha, was selected for the reduced-impact logging investigation (Figure 2).
Description of plots Twelve plots were established in the CNV block and another 12 plots in the RIL blocks. Three plots in CNV block and three plots in RIL block was kept unlogged and used them as control plots. Each plot was a square (100 x 100 m), which was further subdivided into 25 subplots of 20 by 20 m each (Figure 3). The plots were aligned following a magnetic-north direction. The plot corners were clearly marked with posts set into mounds and with short ditches running from the corners along each side (about 2 m long and 40 cm deep). Additional posts were located every 20 m (horizontal) interval along each side.
A central stake and a series of marked posts run north, south, east and west from the center. Using these measured posts as a reference, ‘hip-chain’ threads were used to create the 20 by 20 m grid over the plot (each thread carrier starts out on a compass bearing but is called to the correct post 25m ahead by an individual
Figure 3. Plot, sub plot and grid label (source: Sheil 1998)
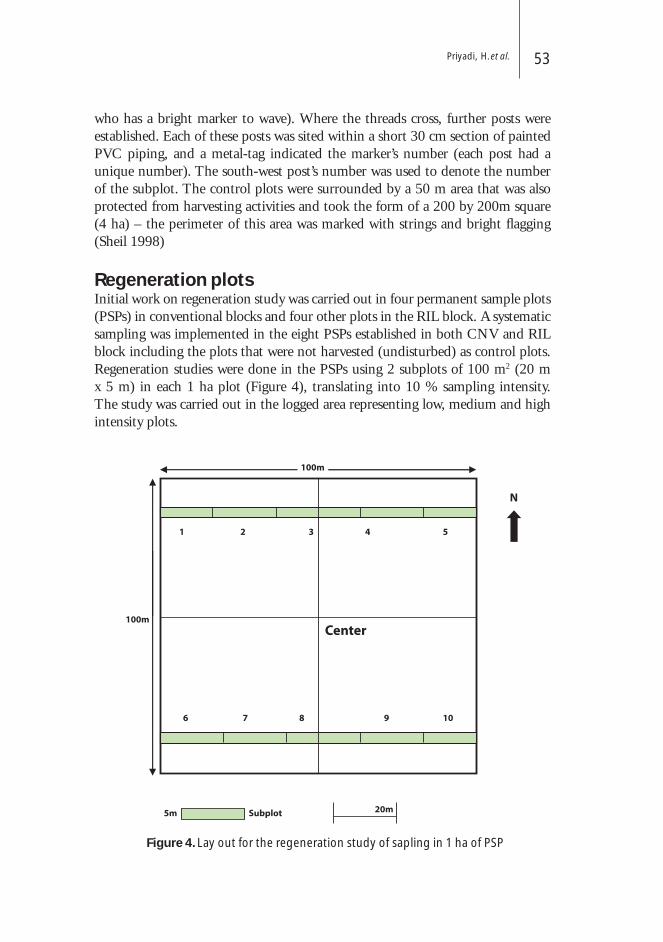
Priyadi, H. et al. 53
who has a bright marker to wave). Where the threads cross, further posts were established. Each of these posts was sited within a short 30 cm section of painted PVC piping, and a metal-tag indicated the marker’s number (each post had a unique number). The south-west post’s number was used to denote the number of the subplot. The control plots were surrounded by a 50 m area that was also protected from harvesting activities and took the form of a 200 by 200m square (4 ha) – the perimeter of this area was marked with strings and bright fl agging (Sheil 1998)
Regeneration plotsInitial work on regeneration study was carried out in four permanent sample plots (PSPs) in conventional blocks and four other plots in the RIL block. A systematic sampling was implemented in the eight PSPs established in both CNV and RIL block including the plots that were not harvested (undisturbed) as control plots. Regeneration studies were done in the PSPs using 2 subplots of 100 m2 (20 m x 5 m) in each 1 ha plot (Figure 4), translating into 10 % sampling intensity. The study was carried out in the logged area representing low, medium and high intensity plots.
Figure 4. Lay out for the regeneration study of sapling in 1 ha of PSP
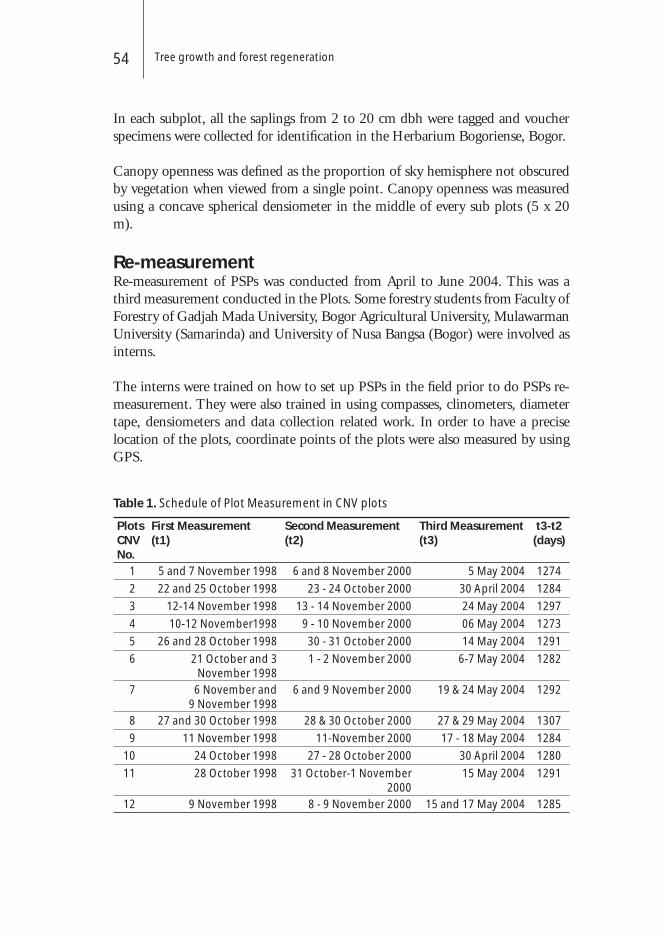
Tree growth and forest regeneration54
In each subplot, all the saplings from 2 to 20 cm dbh were tagged and voucher specimens were collected for identifi cation in the Herbarium Bogoriense, Bogor.
Canopy openness was defi ned as the proportion of sky hemisphere not obscured by vegetation when viewed from a single point. Canopy openness was measured using a concave spherical densiometer in the middle of every sub plots (5 x 20 m).
Re-measurement Re-measurement of PSPs was conducted from April to June 2004. This was a third measurement conducted in the Plots. Some forestry students from Faculty of Forestry of Gadjah Mada University, Bogor Agricultural University, Mulawarman University (Samarinda) and University of Nusa Bangsa (Bogor) were involved as interns.
The interns were trained on how to set up PSPs in the fi eld prior to do PSPs re-measurement. They were also trained in using compasses, clinometers, diameter tape, densiometers and data collection related work. In order to have a precise location of the plots, coordinate points of the plots were also measured by using GPS.
Table 1. Schedule of Plot Measurement in CNV plots
Plots CNV No.
First Measurement (t1)
Second Measurement (t2)
Third Measurement (t3)
t3-t2 (days)
1 5 and 7 November 1998 6 and 8 November 2000 5 May 2004 1274
2 22 and 25 October 1998 23 - 24 October 2000 30 April 2004 1284
3 12-14 November 1998 13 - 14 November 2000 24 May 2004 1297
4 10-12 November1998 9 - 10 November 2000 06 May 2004 1273
5 26 and 28 October 1998 30 - 31 October 2000 14 May 2004 1291
6 21 October and 3 November 1998
1 - 2 November 2000 6-7 May 2004 1282
7 6 November and 9 November 1998
6 and 9 November 2000 19 & 24 May 2004 1292
8 27 and 30 October 1998 28 & 30 October 2000 27 & 29 May 2004 1307
9 11 November 1998 11-November 2000 17 - 18 May 2004 1284
10 24 October 1998 27 - 28 October 2000 30 April 2004 1280
11 28 October 1998 31 October-1 November 2000
15 May 2004 1291
12 9 November 1998 8 - 9 November 2000 15 and 17 May 2004 1285

Priyadi, H. et al. 55
Pd= dt + k - dt x365
k(1)
Table 2. Schedule of Plot Measurement in RIL plots
Plots RIL No.
First Measurement (t1) Second Measurement (t2)
Third Measurement (t3)
t3-t2 (days)
1 9 and 11 March 1999 2 April 2001 10-11 May 2004 1116
2 10 March 1999 2 April 2001 8 May 2004 1113
3 14 March 1999 07 and 09 April 2001 21 May 2004 1119
4 26 February 1999 28 and 31 March 2001 10 -11 May 2004 1118
5 19 and 24 March 1999 9-10 April 2001 21 May 2004 1118
6 11 and 13 May 1999 17 - 18 April 2001 13 May 2004 1102
7 11 and 13 May 1999 5 - 6 April 2001 08 May 2004 1109
8 14 and 18 May 1999 5 and 7 April 2001 22 May 2004 1122
9 14 April 1999 16-17 April 2001 4 - 5 May 2004 1095
10 26 March and 5 May 1999 11 - 12 April 2001 13-14 May 2004 1109
11 3 May 1999 10 - 11 April 2001 28 - 29 April 2004 1095
12 5 April 1999 12 and 16 April 2001 12 May 2004 1102
Until now, three measurements have been undertaken in the plots. The fi rst measurement was conducted in 1998 or before logging. The second one was in 2000 or two years after logging. The third one was just conducted in 2004. Tables 1 and 2 show the series of measurements, including detail calculation of time length (in days) from the second measurement to the last one.
Periodic annual diameter increment Growth was measured by periodic annual diameter increment (Pd). In this study, the data used was based on measurements from 1998 to 2004. Pd was calculated using the following equation (1):
WherePd = observed periodic annual diameter increment (cm year-1)d
t+k = diameter at end of growth period (cm)
dt = diameter at beginning of growth period (cm)
k = Length of growth period (days)
TreatmentsThe experimental design was stratifi ed according to stocking which was defi ned as the density of the harvestable timber trees (dbh≥ 50 cm). Seven different treatments, each with three replicates and control were defi ned (Figure 2.4) as followed:
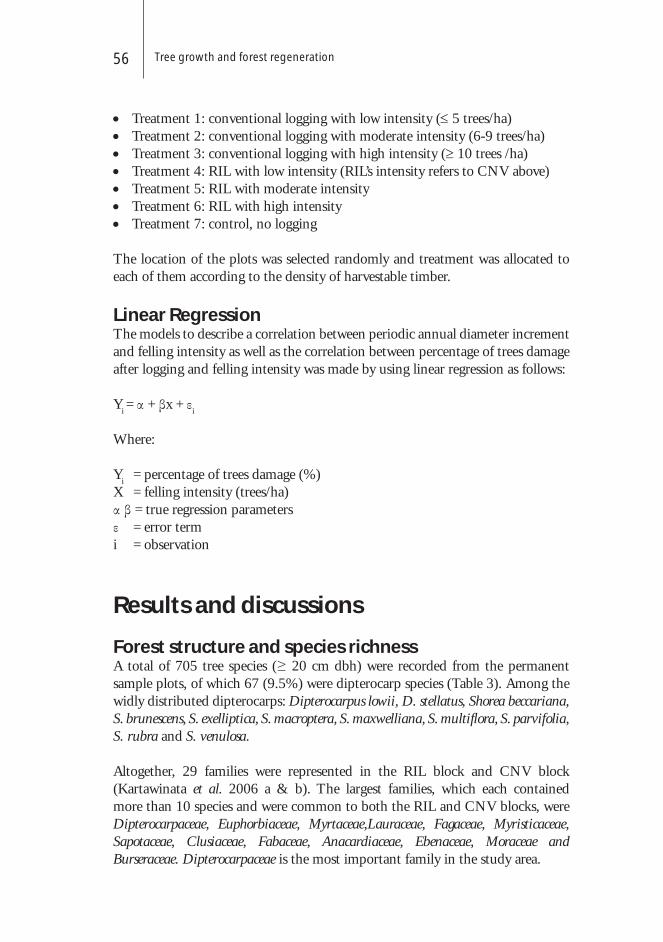
Tree growth and forest regeneration56
• Treatment 1: conventional logging with low intensity (≤ 5 trees/ha)• Treatment 2: conventional logging with moderate intensity (6-9 trees/ha)• Treatment 3: conventional logging with high intensity (≥ 10 trees /ha)• Treatment 4: RIL with low intensity (RIL’s intensity refers to CNV above) • Treatment 5: RIL with moderate intensity• Treatment 6: RIL with high intensity• Treatment 7: control, no logging
The location of the plots was selected randomly and treatment was allocated to each of them according to the density of harvestable timber.
Linear RegressionThe models to describe a correlation between periodic annual diameter increment and felling intensity as well as the correlation between percentage of trees damage after logging and felling intensity was made by using linear regression as follows:
Yi = α + βx + ε
i
Where:
Yi
= percentage of trees damage (%)X = felling intensity (trees/ha)α β = true regression parametersε = error termi = observation
Results and discussions
Forest structure and species richnessA total of 705 tree species (≥ 20 cm dbh) were recorded from the permanent sample plots, of which 67 (9.5%) were dipterocarp species (Table 3). Among the widly distributed dipterocarps: Dipterocarpus lowii, D. stellatus, Shorea beccariana, S. brunescens, S. exelliptica, S. macroptera, S. maxwelliana, S. multifl ora, S. parvifolia, S. rubra and S. venulosa.
Altogether, 29 families were represented in the RIL block and CNV block (Kartawinata et al. 2006 a & b). The largest families, which each contained more than 10 species and were common to both the RIL and CNV blocks, were Dipterocarpaceae, Euphorbiaceae, Myrtaceae,Lauraceae, Fagaceae, Myristicaceae, Sapotaceae, Clusiaceae, Fabaceae, Anacardiaceae, Ebenaceae, Moraceae and Burseraceae. Dipterocarpaceae is the most important family in the study area.
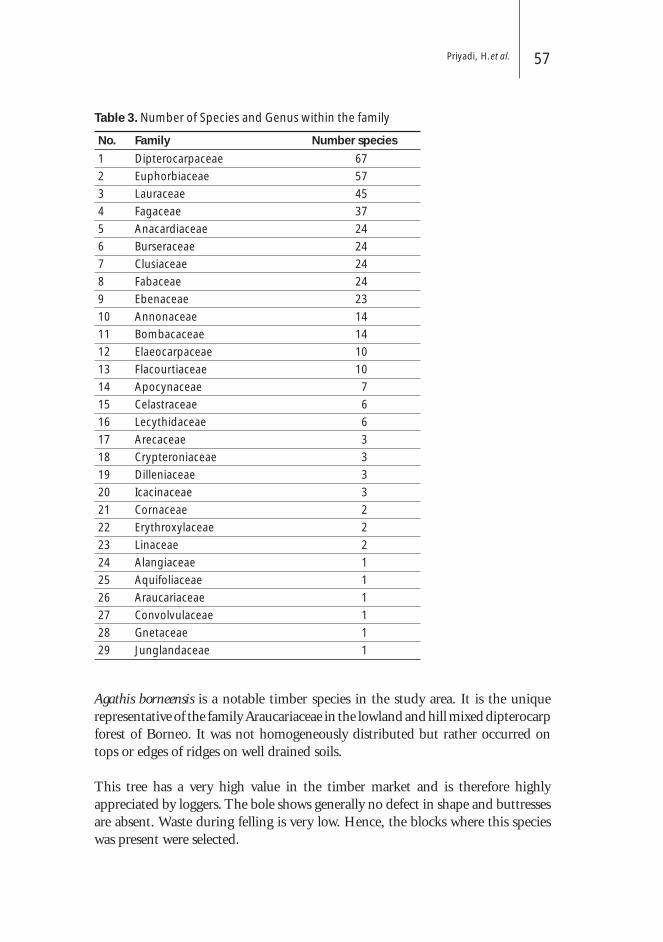
Priyadi, H. et al. 57
Table 3. Number of Species and Genus within the family
No. Family Number species
1 Dipterocarpaceae 67
2 Euphorbiaceae 57
3 Lauraceae 45
4 Fagaceae 37
5 Anacardiaceae 24
6 Burseraceae 24
7 Clusiaceae 24
8 Fabaceae 24
9 Ebenaceae 23
10 Annonaceae 14
11 Bombacaceae 14
12 Elaeocarpaceae 10
13 Flacourtiaceae 10
14 Apocynaceae 7
15 Celastraceae 6
16 Lecythidaceae 6
17 Arecaceae 3
18 Crypteroniaceae 3
19 Dilleniaceae 3
20 Icacinaceae 3
21 Cornaceae 2
22 Erythroxylaceae 2
23 Linaceae 2
24 Alangiaceae 1
25 Aquifoliaceae 1
26 Araucariaceae 1
27 Convolvulaceae 1
28 Gnetaceae 1
29 Junglandaceae 1
Agathis borneensis is a notable timber species in the study area. It is the unique representative of the family Araucariaceae in the lowland and hill mixed dipterocarp forest of Borneo. It was not homogeneously distributed but rather occurred on tops or edges of ridges on well drained soils.
This tree has a very high value in the timber market and is therefore highly appreciated by loggers. The bole shows generally no defect in shape and buttresses are absent. Waste during felling is very low. Hence, the blocks where this species was present were selected.
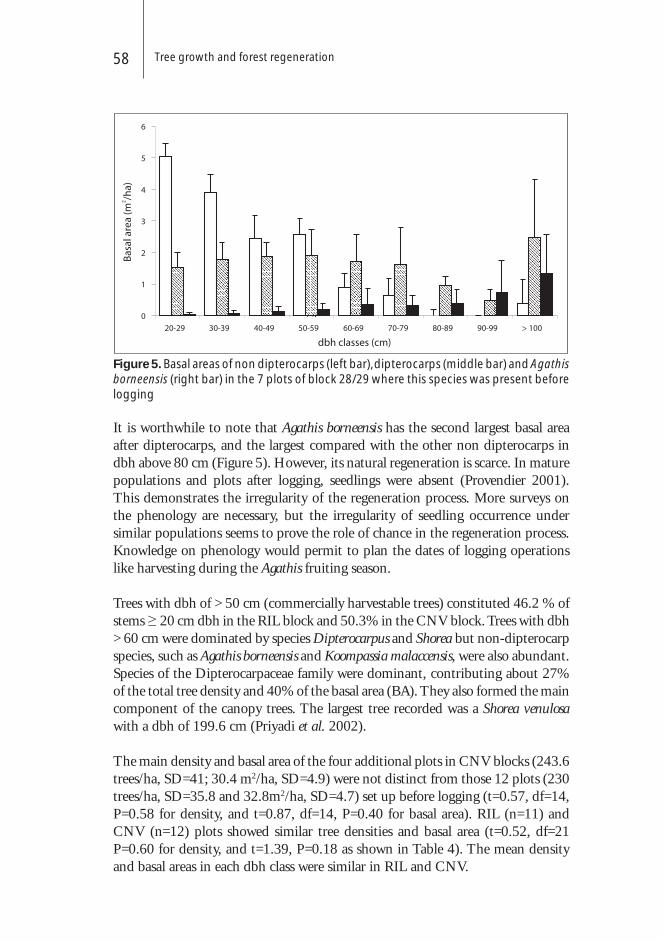
Tree growth and forest regeneration58
Figure 5. Basal areas of non dipterocarps (left bar), dipterocarps (middle bar) and Agathis borneensis (right bar) in the 7 plots of block 28/29 where this species was present before logging
It is worthwhile to note that Agathis borneensis has the second largest basal area after dipterocarps, and the largest compared with the other non dipterocarps in dbh above 80 cm (Figure 5). However, its natural regeneration is scarce. In mature populations and plots after logging, seedlings were absent (Provendier 2001). This demonstrates the irregularity of the regeneration process. More surveys on the phenology are necessary, but the irregularity of seedling occurrence under similar populations seems to prove the role of chance in the regeneration process. Knowledge on phenology would permit to plan the dates of logging operations like harvesting during the Agathis fruiting season.
Trees with dbh of > 50 cm (commercially harvestable trees) constituted 46.2 % of stems ≥ 20 cm dbh in the RIL block and 50.3% in the CNV block. Trees with dbh > 60 cm were dominated by species Dipterocarpus and Shorea but non-dipterocarp species, such as Agathis borneensis and Koompassia malaccensis, were also abundant. Species of the Dipterocarpaceae family were dominant, contributing about 27% of the total tree density and 40% of the basal area (BA). They also formed the main component of the canopy trees. The largest tree recorded was a Shorea venulosa with a dbh of 199.6 cm (Priyadi et al. 2002).
The main density and basal area of the four additional plots in CNV blocks (243.6 trees/ha, SD=41; 30.4 m2/ha, SD=4.9) were not distinct from those 12 plots (230 trees/ha, SD=35.8 and 32.8m2/ha, SD=4.7) set up before logging (t=0.57, df=14, P=0.58 for density, and t=0.87, df=14, P=0.40 for basal area). RIL (n=11) and CNV (n=12) plots showed similar tree densities and basal area (t=0.52, df=21 P=0.60 for density, and t=1.39, P=0.18 as shown in Table 4). The mean density and basal areas in each dbh class were similar in RIL and CNV.
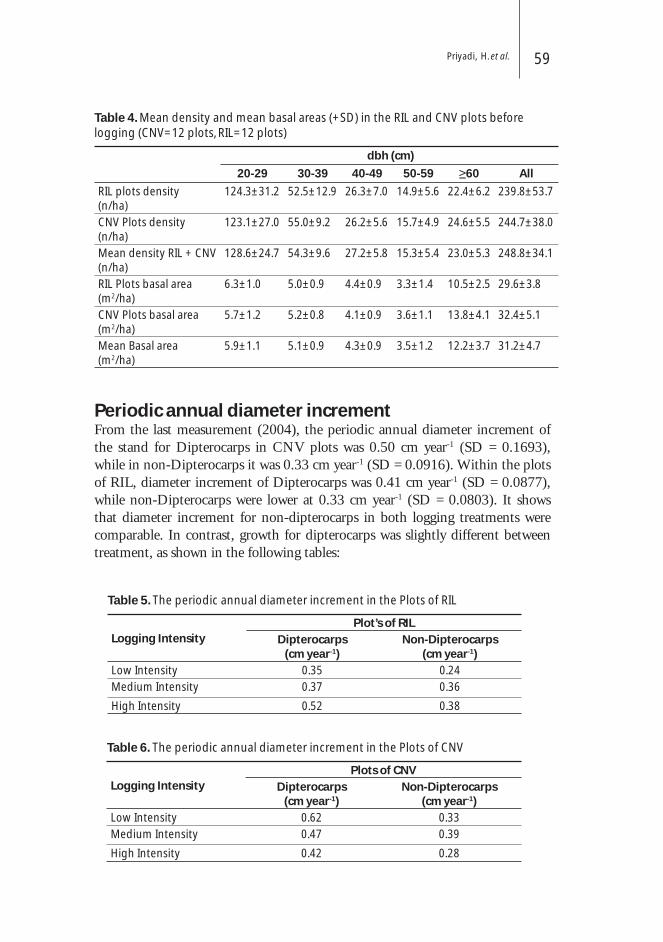
Priyadi, H. et al. 59
Table 4. Mean density and mean basal areas (+SD) in the RIL and CNV plots before logging (CNV=12 plots, RIL=12 plots)
dbh (cm)
20-29 30-39 40-49 50-59 ≥60 All
RIL plots density(n/ha)
124.3±31.2 52.5±12.9 26.3±7.0 14.9±5.6 22.4±6.2 239.8±53.7
CNV Plots density(n/ha)
123.1±27.0 55.0±9.2 26.2±5.6 15.7±4.9 24.6±5.5 244.7±38.0
Mean density RIL + CNV(n/ha)
128.6±24.7 54.3±9.6 27.2±5.8 15.3±5.4 23.0±5.3 248.8±34.1
RIL Plots basal area (m2/ha)
6.3±1.0 5.0±0.9 4.4±0.9 3.3±1.4 10.5±2.5 29.6±3.8
CNV Plots basal area(m2/ha)
5.7±1.2 5.2±0.8 4.1±0.9 3.6±1.1 13.8±4.1 32.4±5.1
Mean Basal area(m2/ha)
5.9±1.1 5.1±0.9 4.3±0.9 3.5±1.2 12.2±3.7 31.2±4.7
Periodic annual diameter increment From the last measurement (2004), the periodic annual diameter increment of the stand for Dipterocarps in CNV plots was 0.50 cm year-1 (SD = 0.1693), while in non-Dipterocarps it was 0.33 cm year-1 (SD = 0.0916). Within the plots of RIL, diameter increment of Dipterocarps was 0.41 cm year-1 (SD = 0.0877), while non-Dipterocarps were lower at 0.33 cm year-1 (SD = 0.0803). It shows that diameter increment for non-dipterocarps in both logging treatments were comparable. In contrast, growth for dipterocarps was slightly different between treatment, as shown in the following tables:
Table 5. The periodic annual diameter increment in the Plots of RIL
Logging IntensityPlot’s of RIL
Dipterocarps(cm year-1)
Non-Dipterocarps(cm year-1)
Low Intensity 0.35 0.24
Medium Intensity 0.37 0.36
High Intensity 0.52 0.38
Table 6. The periodic annual diameter increment in the Plots of CNV
Logging IntensityPlots of CNV
Dipterocarps(cm year-1)
Non-Dipterocarps(cm year-1)
Low Intensity 0.62 0.33
Medium Intensity 0.47 0.39
High Intensity 0.42 0.28

Tree growth and forest regeneration60
The tables above show that periodic annual diameter increment for Dipterocarps in CNV plots by using low and medium felling intensities is 0.62 and 0.47 cm year-1 respectively. Those increments were higher compared with RIL plots for the same group of species and felling intensity (0.35 cm year-1 and 0.37 cm year-1).
The same situation also applied to the non-dipterocarps group. In contrast, in the RIL plots in which high felling intensity occurred, the increment was higher compared with CNV (0.52 and 0.38 versus 0.42 and 0.28 cm year-1). Logging had a stimulating effect on growth as a consequence of the canopy opening and sudden light infl ow into the understorey. This is consistent with an initial study, in which the average canopy openness varied from 4 % (low felling intensity) to 18% (high felling intensity). In other words, more felling intensity creates more gaps or more open canopy.
Correlation between periodic annual diameter increment (y) and felling intensity (F
I) is expressed in the following regression equitation:
DiptRIL
= 0.242 + 0.0850 FI (R2=70.4%)
Non-DiptRIL
= 0.190 + 0.0683 FI (R2=54.3%).
DiptCNV
= 0.704 - 0.0985 FI (R2=27.4%)
Non-DiptCNV
= 0.370 - 0.0200 FI (R2=3.9%)
Where:Y = periodic annual diameter increment for Dipterocarps or Non-dipterocraps F
I = Felling intensity
The equitations above show that in RIL plots there is a positive correlation between periodic annual diameter increment and felling intensity both for dipterocarp and non-dipterocarp groups (P
value= 0.005 and P
value=0.024, respectively). Meanwhile,
correlation between increment and felling intensity in CNV plots both for dipterocarps and non-dipterocarps could not be positively explained ( P
value=0.186
and Pvalue
=0.724 respectively). In other words, there is no positive correlation between diamater increment and felling intensity in CNV plots for dipterocarps and non dipterocarps.
An initial measurement that was conducted in 2000 shows that the periodic annual diameter increment rate for all species in CNV block two years after logging was 0.28 cm year-1 and 0.48 cm year-1 for dipterocarps (Priyadi et al. 2003). Among the genera within dipterocarps, the fastest increment rates were Parashorea (0.59 cm year-1) and Shorea (0.51 cm year-), followed by Dipterocarpus (0.35 cm year-1) and Vatica (0.35 cm year-1).
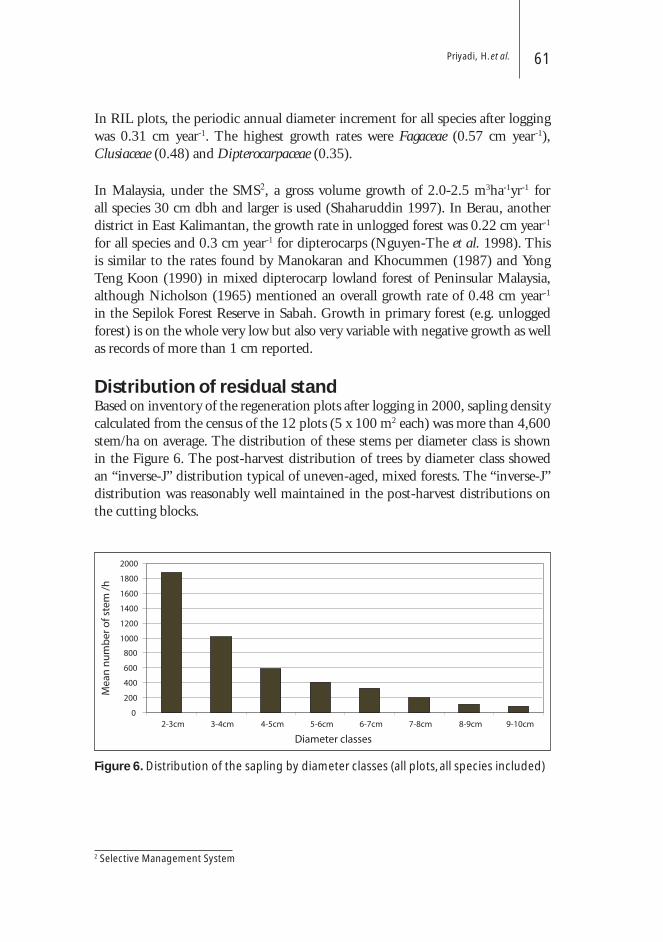
Priyadi, H. et al. 61
2 Selective Management System
Figure 6. Distribution of the sapling by diameter classes (all plots, all species included)
In RIL plots, the periodic annual diameter increment for all species after logging was 0.31 cm year-1. The highest growth rates were Fagaceae (0.57 cm year-1), Clusiaceae (0.48) and Dipterocarpaceae (0.35).
In Malaysia, under the SMS2, a gross volume growth of 2.0-2.5 m3ha-1yr-1 for all species 30 cm dbh and larger is used (Shaharuddin 1997). In Berau, another district in East Kalimantan, the growth rate in unlogged forest was 0.22 cm year-1 for all species and 0.3 cm year-1 for dipterocarps (Nguyen-The et al. 1998). This is similar to the rates found by Manokaran and Khocummen (1987) and Yong Teng Koon (1990) in mixed dipterocarp lowland forest of Peninsular Malaysia, although Nicholson (1965) mentioned an overall growth rate of 0.48 cm year-1
in the Sepilok Forest Reserve in Sabah. Growth in primary forest (e.g. unlogged forest) is on the whole very low but also very variable with negative growth as well as records of more than 1 cm reported.
Distribution of residual standBased on inventory of the regeneration plots after logging in 2000, sapling density calculated from the census of the 12 plots (5 x 100 m2 each) was more than 4,600 stem/ha on average. The distribution of these stems per diameter class is shown in the Figure 6. The post-harvest distribution of trees by diameter class showed an “inverse-J” distribution typical of uneven-aged, mixed forests. The “inverse-J” distribution was reasonably well maintained in the post-harvest distributions on the cutting blocks.

Tree growth and forest regeneration62
The most important families in terms of species composition were Euphorbiaceae, Dipterocarpaceae, Myrtaceae, and Lauraceae which constituted 54.7% of all families in the regeneration plots (Figure 7). There were 57 families and 453 genera found in the combined sapling stock for RIL and CNV plots. However, over 300 of the genera contained more than 10 species. Euphorbiaceae constituted 21.5% of the genera, followed by Dipterocarpaceae 13.3%, Myrtaceae 10.4%, and Lauraceae 9.4%.
Figure 7. Proportion of the main families and genera in the sapling stock
Canopy openingBefore logging, the mean canopy openness in CNV (three plots) and RIL (nine plots) was 3.6% and 3.1%, respectively (Chabbert and Priyadi 2001). The distributions of the values according to canopy openness classes in CNV and RIL plots were similar (Table 7 and Figure 8). After logging, the mean canopy openness was 19.2% in CNV (n=9 plots) and 13.3% in RIL (n=8 plots), respectively. There was a higher proportion of measurements in the 0-5% canopy openness class and a lower one in the more open (=30%) RIL than in CNV, as shown in Figure 8. Canopy openness was signifi cantly correlated with felling intensity in RIL but not in CNV (Pearson’s R = 0.84, P<0.01, df=7 for RIL, R = 0.33, P=0.38 df= 8 in CNV).
Figures in parenthese in Table 7 show the number measurements in each class before and after logging. Before logging, the measurements in CNV were done in three plots with 108 measurements, and RIL in nine plots with 324 measurements. After logging, the measurements in CNV were done in nine logged plots with 324
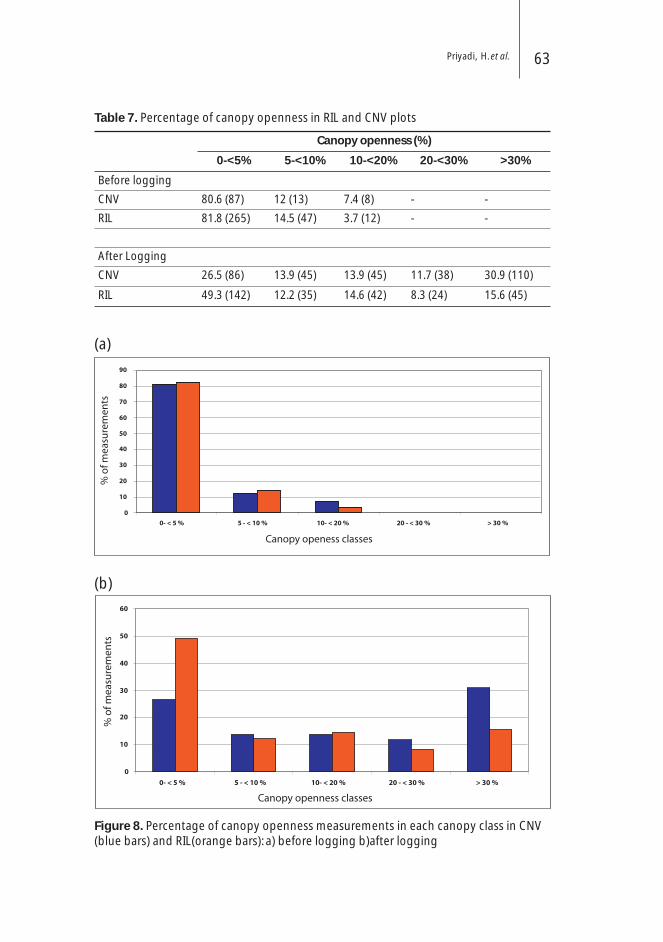
Priyadi, H. et al. 63
Table 7. Percentage of canopy openness in RIL and CNV plots
Canopy openness (%)
0-<5% 5-<10% 10-<20% 20-<30% >30%
Before logging
CNV 80.6 (87) 12 (13) 7.4 (8) - -
RIL 81.8 (265) 14.5 (47) 3.7 (12) - -
After Logging
CNV 26.5 (86) 13.9 (45) 13.9 (45) 11.7 (38) 30.9 (110)
RIL 49.3 (142) 12.2 (35) 14.6 (42) 8.3 (24) 15.6 (45)
Figure 8. Percentage of canopy openness measurements in each canopy class in CNV (blue bars) and RIL(orange bars): a) before logging b)after logging
(a)
(b)

Tree growth and forest regeneration64
measurements, and in RIL in eight logged plots with 288 measurements (before logging, x2=2.73, P=0.25;after logging x2=43.56, P<0.001).
TPTI needs to be revised (An analysis and recommendation)Logging companies are required to follow the TPTI regulation as stipulated by the Ministry of Forestry. One of the conditions is the minimum dbh cutting limit of 50 cm, while in the limited production forest it is 60 cm. However, foresters have debated the effectiveness of this regulation.
Sist (2001) and Sist et al (2003) stated that the application of minimum diameter limit (e.g. cut above 60 cm dbh), as practiced in many mixed dipterocarp forests in the Southeast Asia regions, is not sustainable even when RIL is implemented, largely due to the high volume and number of trees harvested.
In Indonesian’s forestry issue, the effectiveness of the TPTI in achieving sustainable forest management is being reviewed. The basic assumption on tree diameter increment of 1 cm per year for all species, all forest types and all forest conditions is baseless. The data from PSP measurements showed that the tree diameter increment is varies according to tree species or tree species group and site. From the plot observation in Malinau Research Forest, it is clear that the average stems ≥ 20 cm dbh varies from 0.35 to 0.62 cm year -1 and for non-dipterocarps from 0.24 to 0.39 cm year -1. In a forest of Berau District, the diameter increment in dipterocarps reached an average of 0.51 cm year -1 and in the non-dipterocarps, 0.34 cm year -1 (Nguyen-The et al. 1998). It proves that assumption on diameter increment stipulated in the TPTI is over-estimated. Suhendang (2003) noted the same phenomenon. Given the fact that the increments found on the ground are far under what TPTI assumed, the cutting cycle of 35 years, therefore, urgently needs to be justifi ed. It is clear that cutting cycle should be determined on the basis of the tree diameter increment. Taking this fi nding into account, the current practice of using yield regulation method based on standing stock volume, without observing actual tree diameter or stand volume increment, will lead to the wrong conclusion.
Conclusions and recommendations
ConclusionsTPTI needs to be revised because its assumptions are not commensurate with facts on the ground. The periodic annual diameter increment of stand of dipterocarps in the plots with different logging intensities varies from 0.35 cm year -1 to 0.62
Priyadi, H. et al. 65
cm year -1 both in RIL and CNV plots . On the other hand, the increment of the non-dipterocarps ranges from 0.24 cm year -1 to 0.39 cm year -1. These fi gures negate the basic assumption of the tree diameter increment of 1 cm year -1 adopted by the TPTI.
The study showed that the overall density of saplings was 4,600 stems/ha, which were mainly composed of two families: Euphorbiaceae and Dipterocarpaceae. Euphorbiaceae particularly dominated this stand, including the pioneer Macaranga species. Nevertheless, the proportion of dipterocarps remained stable, indicating also that canopy opening to some level favoured the dipterocarp’s regeneration.
In most classes, Euphorbiaceae dominated the sapling stock in class dbh class 2-10 cm where Macaranga spp was the main pioneer. Meanwhile, dipterocarps were the main component of dbh class 10-20 cm , consisting of Shorea spp, Vatica spp, Dipterocarpus spp, and Hopea spp., which are high value commercial timber species.
RecommendationsAttention must be paid to the possible changes in species composition after logging, primarily Agathis borneensis and most of Dipterocarpaceae family. Moreover, the quality of the injured stems will need further study. In any case, damage reduction by RIL techniques will be a benefi t in the long run.
The basic assumption of TPTI on tree diameter increment 1 cm per year for all species, all forest types and all forest conditions is incorrect. Assumptions regarding increment and cutting cycles of 35 years need further review to achieve sustainable forest management.
If dipterocarps can regenerate well two years after logging to an almost reconstituted stock level, systematic planting of seedlings after logging operations may not prove necessary except in wide bare areas such as landing sites and logyards.
PSPs should be well protected, continuously monitored and measured in order to provide good and reliable data to support research on biodiversity, biophysics and silviculture. In this regard, fi nancial supports from donors should be solicited.
AcknowledgementsWe are most grateful to the interns (Arif Rahmanullah, Rama Mulyana, Julita Budi and Fajar Arif ) from Faculty of Forestry of Gadjah Mada University (UGM), Bogor Agricultural University (IPB), Mulawarman University (UNMUL) and University Nusa Bangsa (UNB) who have assisted data collection.
Tree growth and forest regeneration66
We would like to pay tribute to the workers, foremen and technicians who did their utmost during the years of this study in a diffi cult environment for their untiring help.
Finally, our utmost appreciations are due to Mr. Kresno D. Santosa, Ahmad Zakaria, Sahar, Laing, Petrus Udin, Irang, Jalung and Ms. Ita for their close collaboration in the fi eld.
ReferencesChabbert, J. and Priyadi, H. 2001 Exploitation á Faible Impact (EFI) dans une
forêt á Bornéo Bois et Forêts des Tropiques, no 269:79-86.Elias, Applegate, G., Kartawinata,K., Machfudh and Klassen, A. 2001. Pedoman
Reduced-Impact Logging di Indonesia. CIFOR. Jakarta.Kuswata Kartawinata, Hari Priyadi, Douglas Sheil, Soedarsono Riswan, Plinio
Sist, Machfudh. (2006 a). A Field guide to the Permanent Sample Plots in the Reduced-Impact Blocks 27 at CIFOR Malinau Research Forest, East Kalimantan. Bogor, Indonesia: Center for International Forestry Research (CIFOR).
Kuswata Kartawinata, Hari Priyadi, Douglas Sheil, Soedarsono Riswan, Plinio Sist, Machfudh. (2006 b). A Field guide to the Permanent Sample Plots in the Conventional Logging Blocks 28 &29 at CIFOR Malinau Research Forest East Kalimantan. Bogor, Indonesia: Center for International Forestry Research (CIFOR).
Manokaran, N. and Kochummen, K.M., 1987. Recruitment, growth and mortality of tree species in a lowland dipterocarp forest in Peninsular Malaysia. Journal of Tropical Ecology 3: 315-330.
Nguyen-The, N., Favrichon, V., Sist, P., Houde, L., Bertault, J.G. and Fauvet, N. 1998. Growth and mortality patterns before and after logging. In: Bertault, J.G and Kadir,K. Silvicultural Research in lowland mixed dipterocarp forest of east Kalimantan. The contribution of STREK project. Jakarta.Indonesia. p 181-216.
Nicholson, D.I., 1965. A study of virgin forest near Sandakan, North Borneo. In: Symposium on humid tropics vegetation, Kuching. UNESCO, Paris,p.67-87.
Priyadi, H., Kartawinata, K., Sist, P. and Sheil, D. 2002.Monitoring Permanent Sample Plots (PSPs) after conventional and Reduced–Impact Logging in the Bulungan Research Forest, East Kalimantan, Indonesia. In: Shaharuddin bin Mohammad Ismail, Thai See Kiam, Yap Yee Hwai, Othman bin Deris and Svend Korsgaard (Eds). Proceedings of The Malaysia-ITTO International workshop on growth and yield of managed tropical forest 25-29 June 2002, Pan Pacifi c Hotel, Kuala Lumpur, Malaysia. Forestry Department Peninsular Malaysia.p 226-235.
Priyadi, H. et al. 67
Provendier, D. 2001. Occurrence, structure and impact of logging on regeneration of Agathis borneensis in a Mixed dipterocarp forest of East Borneo (Bulungan Distric). Master “Agro-silvo-pastoral systems management in tropical zones” University of Paris XII. Unpublished report.
Shaharuddin, M.I. 1997. Technical requirements for the successful implementation of selective management system in Peninsular Malaysia. Pp.15-28 in Wan Yusoff, W.A., Abdul Rahman, A.R., Yong,T.K., Mohd. Nizum,M.N. & Kadri, S. (Eds.) Proceedings of the workshop on Selective Management System and Enrichment Planting. Forestry Department Headquarter, Kuala Lumpur, Malaysia.
Sheil, D. 1998. Notes on permanent sample plot methods used in Bulungan. Unpublished Report. CIFOR.
Sist, P. Dykstra, D. and Fimbel, R. 1998. Reduced-Impact logging guidelines for lowland and hill dipterocarp forests in Indonesia. CIFOR Occasional Paper n°15.
Sist, P. 2001. Why RIL won’t work by minimum-diamater cutting limit alone. ITTO Tropical Forest Updated 11(2):5.
Sist, P., Sheil, D., Kartawinata, K. and Priyadi, H. 2003. Reduced Impact Logging in Indonesian Borneo: some results confi rming the needs for new silvicultural precriptions. Forest Ecology and Management 6139: 1-13.
Suhendang, E. 2002. Growth and yield studies: The implication for the management of Indonesian Tropical Forest. In: Shaharuddin bin Mohammad Ismail, Thai See Kiam, Yap Yee Hwai, Othman bin Deris and Svend Korsgaard (Eds). Proceedings of The Malaysia-ITTO International workshop on growth and yield of managed tropical forest 25-29 June 2002, Pan Pacifi c Hotel, Kuala Lumpur, Malaysia. Forestry Department Peninsular Malaysia.p 205-216.
Van Der Hout, P. 1999. Reduced-Impact logging in the tropical rain forest of Guyana. Tropenbos. Guyana Series, 335 pages.
Yong, T.C. 1990. Growth and yield of a mixed dipterocarp forest in Peninsular Malaysia. Fellowship report. ASEAN Institute of Forest Management, Kuala Lumpur. 160 p.
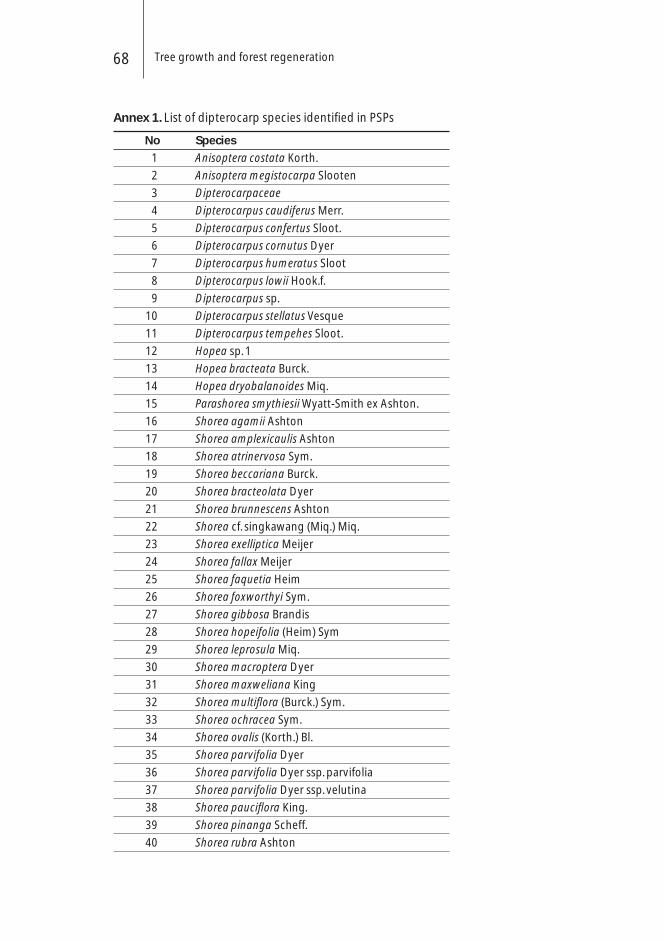
Tree growth and forest regeneration68
Annex 1. List of dipterocarp species identifi ed in PSPs
No Species
1 Anisoptera costata Korth.
2 Anisoptera megistocarpa Slooten
3 Dipterocarpaceae
4 Dipterocarpus caudiferus Merr.
5 Dipterocarpus confertus Sloot.
6 Dipterocarpus cornutus Dyer
7 Dipterocarpus humeratus Sloot
8 Dipterocarpus lowii Hook.f.
9 Dipterocarpus sp.
10 Dipterocarpus stellatus Vesque
11 Dipterocarpus tempehes Sloot.
12 Hopea sp. 1
13 Hopea bracteata Burck.
14 Hopea dryobalanoides Miq.
15 Parashorea smythiesii Wyatt-Smith ex Ashton.
16 Shorea agamii Ashton
17 Shorea amplexicaulis Ashton
18 Shorea atrinervosa Sym.
19 Shorea beccariana Burck.
20 Shorea bracteolata Dyer
21 Shorea brunnescens Ashton
22 Shorea cf. singkawang (Miq.) Miq.
23 Shorea exelliptica Meijer
24 Shorea fallax Meijer
25 Shorea faquetia Heim
26 Shorea foxworthyi Sym.
27 Shorea gibbosa Brandis
28 Shorea hopeifolia (Heim) Sym
29 Shorea leprosula Miq.
30 Shorea macroptera Dyer
31 Shorea maxweliana King
32 Shorea multifl ora (Burck.) Sym.
33 Shorea ochracea Sym.
34 Shorea ovalis (Korth.) Bl.
35 Shorea parvifolia Dyer
36 Shorea parvifolia Dyer ssp. parvifolia
37 Shorea parvifolia Dyer ssp. velutina
38 Shorea paucifl ora King.
39 Shorea pinanga Scheff.
40 Shorea rubra Ashton
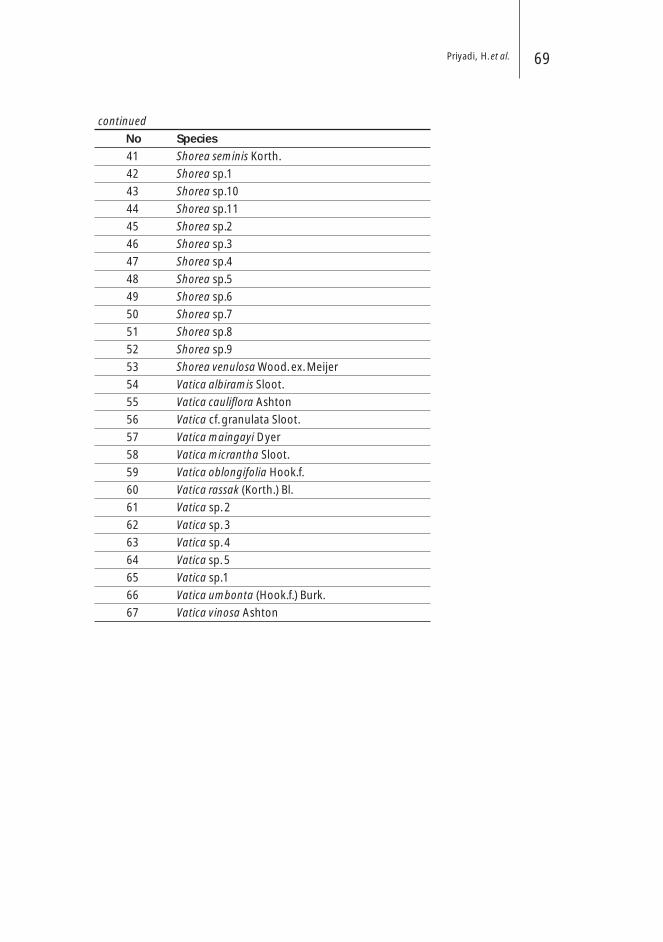
Priyadi, H. et al. 69
continued
No Species
41 Shorea seminis Korth.
42 Shorea sp.1
43 Shorea sp.10
44 Shorea sp.11
45 Shorea sp.2
46 Shorea sp.3
47 Shorea sp.4
48 Shorea sp.5
49 Shorea sp.6
50 Shorea sp.7
51 Shorea sp.8
52 Shorea sp.9
53 Shorea venulosa Wood. ex. Meijer
54 Vatica albiramis Sloot.
55 Vatica caulifl ora Ashton
56 Vatica cf. granulata Sloot.
57 Vatica maingayi Dyer
58 Vatica micrantha Sloot.
59 Vatica oblongifolia Hook.f.
60 Vatica rassak (Korth.) Bl.
61 Vatica sp. 2
62 Vatica sp. 3
63 Vatica sp. 4
64 Vatica sp. 5
65 Vatica sp.1
66 Vatica umbonta (Hook.f.) Burk.
67 Vatica vinosa Ashton
Peki Mex M.PNG Forest Research InstituteP.O. Box 314, Lae, 411, Papua New Guinea
AbstractThis is a summation of progress of growth of logged–over natural forests in Papua New Guinea (PNG) since 1992. A total of 126 PSPs (1ha plots) are distributed throughout PNG. A database management system called PERSYST (Permanent Plot System) was developed to analyse and produced a model called PINFORM (PNG/ITTO Natural Forest Model) for predicting the growth and yield of selectively cut natural forests in PNG. A total of 21 cohort species groups cover a range of mean increment and typical diameters for larger trees of the species. These groups represent different growth models. Average annual increment for overall species groups is 0.47 cm/yr regardless of species. Mortality rate, growth rate and typical tree size are inter-related. It was estimated that trees in common species groups have ages around 100 years when they reach a diameter that is 90% quantile of cumulative diameter distribution. Mortality rate of 2.5 % for healthy trees and 6.3% for defective or damaged trees. Recruitment rate depends to some extend on stand density and averages around 41 trees/year. Other studies also found similar results from eight sites in PNG. A total of 186 commercial tree species out of 330 species were encountered in the natural forests of PNG. Six common species; Canarium indicum, Ficus spp, Microcos argentata, Myristica spp, Pimeleodendron amboinicum and Pometia pinnata are common in all the plots studied. Parameters for growth characteristics; ingrowths, mortality, diameter increment coeffi cients was estimated and was tested and the parameter fi tted into a Feedback type Stand growth simulation model using Diameter transition probability (FSD) to predict the diameter distribution of stand at every two years and compared with the observed diameter distributions. Due to shorter
Progress on the studies of growth of logged-over natural forests in Papua New Guinea

Peki Mex M. 71
observation period, the diameter distribution was only predicted up to 10 years. The analysis of growth data using the model to predict future diameter distribution from the initial showed mostly Secondary (S) species with higher regeneration rates after selective cutting. Hence, if selective cutting sites are managed without further disturbances, e.g. fi re and human activities, the forest may recover with some degree compared to sites not affected. These PSPs need to be monitored for a much longer period to come up with more reliable growth and yield information.
Keywords: Permanent Sample Plots, Species groups, Growth Model, Diameter distribution, Mortality, Recruitment
IntroductionThe tropical rainforest of Papua New Guinea (PNG) comprising an area of 39.3 million hectares, predominantly covering PNG’s 46.4 million hectares. Only 11.9 million hectares are identifi ed as production forests (PNGFA 1998). Natural forests in PNG are decreasing at a rate of 120,000 ha per annum through logging, agricultural activities, mining and other land uses (PNGFA 2003).
Harvesting in the natural forests of PNG is selective. Only merchantable species with diameter breast height (DBH) ≥ 50 cm are felled. It is anticipated that the log export volume will increase from 1.8 million m3 in 2002 to 2.19 million m3 in 2008, refl ecting an average annual increase of 4% over this period. It will have the impact of increasing log export revenues from K367 million in 2002 to K831.1 million in 2008, refl ecting an annual average increase of 16% over this period. In US dollar terms the log export revenues are expected to increase by a massive 21% over the six years (Sabuin 2003). The taxes and tariffs are a very important source of revenue generated to assist the National Government to fund the social services and infrastructure development in PNG. Due to the reduction in the resource base, log output within the next 10 years may be expected to drop in volume for both log export and local processing (Sabuin 2003).
Stand dynamics of tropical forests in PNG is very little known in any detail, as is quantitative analysis of stand structure and growth of natural forests. The most important points essential for ecologically based management for sustainable harvest requires knowledge of the following three points:i. Understanding the characteristics of natural regeneration, density and species
composition ii. Dynamics of natural forest stand structure before and after selective cutting iii. Effects of selective cutting on the residual trees
Sustainable management of these natural forests for timber production has been somewhat diffi cult. There are several reasons for this. Firstly, little is known about
Progress on the studies of growth of logged-over natural forests in Papua New Guinea72
the ecological requirements of the main commercial species. Secondly, little information is available on the growth and yield of natural forests. There have been very few studies on the structure of residual trees after selective logging in PNG (e.g. Alder 1999, Abe et al., 2000; Pokana 2002; Peki 2001; 2004 and Yosi 2004).
The purpose of this paper is to discuss the progress of Permanent Sample Plot (PSP) establishment and provide a progressive report on the status of these plots in PNG.
Brief history of PSPs in PNGThe PSPs program began in 1992. The International Tropical Timber Organization (ITTO) funded the initial stages of the PSPs studies from 1992 to 1999 through ITTO Project Serial No: PD162/91 Rev.1 (F). This is one of a series of projects undertaken by PNG towards achieving Ecological, Economical and Socially Sustainable Tropical Rainforest Use (EESSTRU). The principle objective of the project was to strengthen and expand the PSPs and Timber Stand Improvement (TSI) Plot system established by the PNG Forest Research Institute (PNGFRI) and to provide the mechanism for using the data for forest management planning.
The actual implementation of the project, which was titled Intensifi cation of Growth and Yield Studies in Previously Logged Forest (ITTO Project PD 162/91) commenced with improving and reviewing existing forest sampling systems in PNG. The existing systems showed inadequate information and standard guidelines on forest sampling to continue from. Therefore, the initial task of the project was to develop proper and standard PSP procedures in establishing plots, data collections and data management and development of computer database system(s). The manuals on “PSP standards and Procedures: A permanent sample plot program to predicted growth and yield in previously logged forest; (Parts A – E)” was accomplished in 1994. The PSP establishment and measurement program in PNG by both ITTO funded project and National Forest Services (NFS) funded project were based on the standard procedures produced by Romijn (1994).
Study siteThe research sites are located in PNG (Fig.1). A total of 126 permanent sampling plots (1 ha plots) were established since 1992. Of the 126 plots, 72 plots were established by the ITTO funded project (Yosi 2000) and 54 plots by the PNGFRI internaly funded project (Pokana 2002).

Peki Mex M. 73
Figure 1. Location of PSPs in Papua New Guinea
Materials and methods
Summary of plot establishment and reassessmentThe more detailed information on PSP establishment, plot design, tree assessment and data management techniques are well described by ROMIJN (1994).
Data management and analysisA computer database system called PERSYST (Permanent Plot System) developed by the ITTO project’s fi rst consultant Mr. Klaus Romijn, in Microsoft FoxPro for windows in 1993 and with some modifi cations in 1997 and 1998 by Dr. Denis Alder (second consultant) incorporated various data analysis programs in the PERSYST. The second version of PERSYST2, also written by Dr. Denis Alder, incorporates PNGFRI and ITTO project data sets together (Fig. 2 & 3).
Results and discussions
PSP data management systemThe analysis of the PSP plots in PERSYST program (Romijn 1994, Alder 1997) was directed at developing growth functions for the PINFORM (PNG ITTO

Progress on the studies of growth of logged-over natural forests in Papua New Guinea74
Figure 2. PSP Database PERSYST menu showing main options
Figure 3. Types of PSP analysis programs in PERSYST database system
Natural Forest Model) stand growth model. The data analysis program model (Fig.3) is designed to generate small summary fi les from the total dataset of PSPs, which can be analyzed graphically using Microsoft Excel or other programs (Alder 1999). The most detail result of the analysis of the PINFORM stand simulation model could be found in Alder (1999). The result below is a summary of growth and yield information obtained from the PINFORM model.
A total of 417 species and genera are included in the PSP database. Of these, 40 species have more than 100 sample trees, while 300 species have less than 30 sample trees and only 100 species have only one or two sample trees. The species were grouped by mean diameter increment and 90% diameter quantile method (Alder 1995). As a result, 21 groups cover a range of mean increment and typical diameters for larger trees of the species. These species groups represent different
Peki Mex M. 75
cohort growth models (say growth model A – X). This model discusses design of tree growth function, which is unbiased when applied to projections of forest basal area. From this model(s) one could derive information on:• Average increments for species groups. The overall average increment of 0.47
cm/yr to calculate increment, regardless of species, size, crown position etc.• Modify by multiplier for stand density derived from stand basal area in the 10
– 30 cm DBH class.• Growth rate further adjusted by a site multiplier, which can be applied at a
provincial level.• Mortality rate, growth rate and typical tree size are inter-related. It was estimated
that trees in common species groups have ages around 100 years when they reach a diameter that is 90% quantile of cumulative diameter distribution. Mortality rate of 2.5 % for healthy trees and 6.3% for defective or damaged trees.
• Recruitment rate depends to some extent on stand density. The recruitment rates average around 41 trees/year. Species composition of recruits is modeled from existing species composition.
Other studies undertaken from the PSPs databaseThe author used a total of 20 PSP plots (from Ari, Serra, Hawain, Sogeram, Manus, Iva Inika, Gumi and Vudal) in PNG (Fig.1) established by PNGFRI since 1995 for graduate studies in Japan. During that time, the data from ITTO and FRI were kept separate. The data from the FRI PSP database was used for Masters at Tokyo University of Agriculture and Technology (1998 - 2001) and PhD studies at the University of Tokyo (2001 – 2004) respectively (Peki 2001; 2004).
The analysis of structure and growth characteristics of natural forestThe purpose of this study is to evaluate the stand structure and growth characteristics of natural forests.
The results of the analysis showed:I. Generally, total diameter distribution in all the plots showed an exponential
decrease pattern from a lower DBH class to a higher DBH class, suggesting that the inverse J - shape distribution pattern covers much of the tree population. Primary Species (P) and Primary/Secondary (P/S) species closely followed the above pattern, while Secondary (S) species showed a rising growth rate in the lower DBH class and little to none in the mid and upper DBH classes (Figs. 4, 5 & 6).
II. For all the plots, the number of P species is greater than P/S, which, in turn is also greater than S species. A total of 344 and 330 species were encountered in the initial and the last observations respectively for all the plot sites studied.

Progress on the studies of growth of logged-over natural forests in Papua New Guinea76
The most common species were Syzygium spp, Cryptocarya spp, Pometia pinnata J.R. Forster & J.G. Forster, Myristica spp, Macaranga tanarius (L.) Muell.Arg., Pouteria chartacea (F.v. Mueller) Baehni, Microcos argentata Burret., Pimeleodendron amboinicum Hassk., and Celtis latifolia (Blume) Planch. (Table 1). Generally high diameter growth increment for P and P/S species was found to be in the 20 to 50 cm DBH class. The highest for S species was found to be in the 10 to 15 cm DBH class.
III. Based on the results analyzed, especially from the diameter distribution patterns and its transition from one class to the next, about three forest types were tentatively proposed from the 20 plots (Peki 2001; 2004).
Type I. Stands at Ari, Hawain, Serra, Gumi and Manus showed a diameter transition increase from lower DBH class to upper classes (Fig.4).
Type II. Stands at Iva Inika and Sogeram showed that the diameter transition was not normal, decreasing from lower DBH classes to upper classes due to mortality mainly caused by fi re and logging damage infl icted during selective cutting (Fig. 5).
Type III. Stands at Vudal showed a high increase in the lower DBH class and only S species revealed an increasing trend from a lower DBH class to the upper classes (Fig.6).
Table 1. Common species encountered
No. Genus species FamilySpp Plots
Grp found
1 Syzygium spp Myrtaceae P 19
2 Cryptocarya spp Lauraceae P 18
3 Ficus spp Moraceae P/S 17
4 Pometia pinnata J.R. Forster & J.G. Forster. Sapindaceae P/S 16
5 Myristica spp Myristicaceae P 14
6 Gnetum gnemon L. Gnetaceae P 14
7 Canarium indicum L. Burseraceae P 14
8 Pouteria chatacea (F.v. Mueller) Baehni. Sapotaceae P 13
9 Micronos argentata Burret. Tiliaceae P/S 13
10 Dysoxylum gaudichaudianum (A. Juss.) Miq. Meliaceae P 13
11 Pimeleodendron amboinicum Hassk. Euphorbiaceae P/S 12
12 Chisochenton erythrocarpus Hiern. Meliaceae P 12
13 Macaranga tanarius (L.) Muell. Ang. Euphorbiaceae S 11
14 Cerbera fl oribunda K. Schumann. Apocynaceae P/S 11
15 Sterculia ampla Bakh. f. Sterculiaceae P/S 11
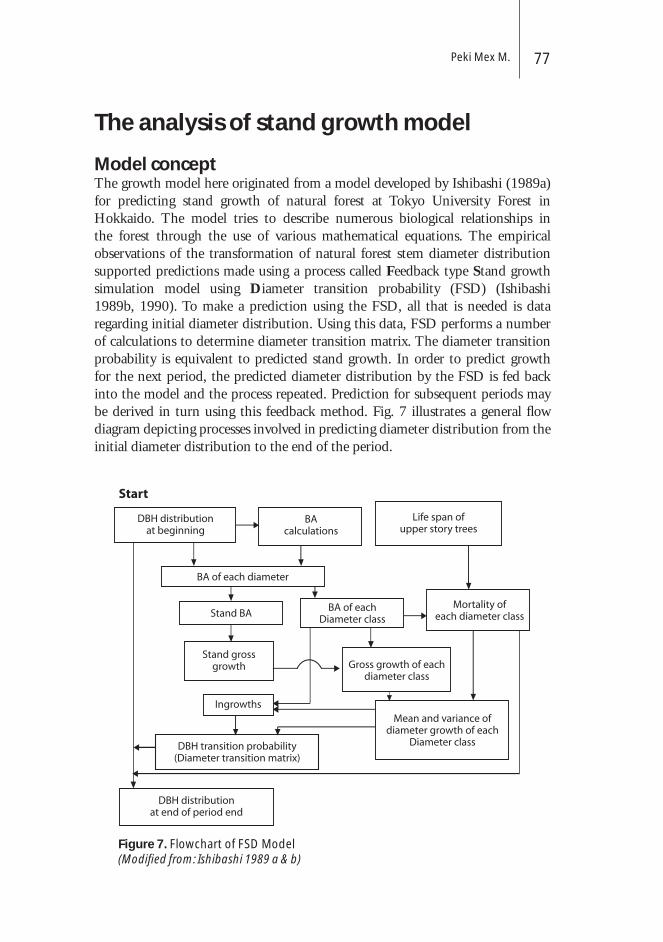
Peki Mex M. 77
The analysis of stand growth model
Model concept The growth model here originated from a model developed by Ishibashi (1989a) for predicting stand growth of natural forest at Tokyo University Forest in Hokkaido. The model tries to describe numerous biological relationships in the forest through the use of various mathematical equations. The empirical observations of the transformation of natural forest stem diameter distribution supported predictions made using a process called Feedback type Stand growth simulation model using Diameter transition probability (FSD) (Ishibashi 1989b, 1990). To make a prediction using the FSD, all that is needed is data regarding initial diameter distribution. Using this data, FSD performs a number of calculations to determine diameter transition matrix. The diameter transition probability is equivalent to predicted stand growth. In order to predict growth for the next period, the predicted diameter distribution by the FSD is fed back into the model and the process repeated. Prediction for subsequent periods may be derived in turn using this feedback method. Fig. 7 illustrates a general fl ow diagram depicting processes involved in predicting diameter distribution from the initial diameter distribution to the end of the period.
Figure 7. Flowchart of FSD Model(Modifi ed from: Ishibashi 1989 a & b)

Progress on the studies of growth of logged-over natural forests in Papua New Guinea78
Parameter estimationThe relationships tested to determine parameters needed for applying to FSD model included;
(a) Relationship between initial stand basal area and mean annual gross growth of standThe relationship between initial stand basal area and the mean annual gross growth of stand in total and each species group respectively, and from this relationship upper and lower limit of stand gross growth were determined.
Upper limit gGu = 0.00718 BA2– 0.01436 BA(BA < 15m2)gGu = 0.7 ( BA >= 15m2)lower limitgGl = 0.00103 BA2 – 0.00205 BA( BA < 15m2)gGl = 0.2 ( BA >= 15m2)
where:
gGu : upper limit of stand gross growthgGl : lower limit of stand gross growthBA : initial stand basal area
(b) Relationship between initial total basal area and mean annual gross growth in each diameter classThe relationship between initial total basal areas and mean annual gross growth in each diameter class. From these relationships, upper limit of gross growth in each diameter class was determined.
upper limit in small-sized treegGus = -0.063 BAs2 + 1.0702 BAs upper limit in mid-sized treegGum = 0.66 BAmupper limit in large-sized treegGul = -0.0149 BAl2 + 0.6316 BAl
where:
gGus : upper limit in small-sized treegGum : upper limit in mid-sized treegGul : upper limit in large-sized tree

Peki Mex M. 79
BAs : initial total basal area in small-sized treeBAm : initial total basal area in mid-sized treeBAl : initial total basal area in large-sized tree
The lower limit of gross growth in each diameter class was determined from the value of the lower limit of stand gross growth and the upper limit of gross growth in each diameter class.
lower limit in small-sized treegGls = gGus/(gGus + gGum + gGul) *gGllower limit in mid-sized treegGlm = gGum/(gGus + gGum + gGul) *gGllower limit in large-sized treegGll = gGul/(gGus + gGum + gGul) *gGl
where :
gGls : lower limit in small-sized treegGlm : lower limit in mid-sized treegGll : lower limit in large-sized tree
(c) Mean annual growth and coeffi cient of variation in each diameter class Mean annual growth The relationship between initial total basal area in mid-sized and large-sized trees and the mean annual diameter increment in small-sized trees by species group respectively. From this relationship, the mean annual diameter increment in each diameter class was determined.
Mean annual diameter increment in S speciesDis_s= -0.0211 × (BAm + BAl) + 0.8984Mean annual diameter increment in P/S speciesDis_p_s= -0.0198 × (BAm + BAl) + 0.723Mean annual diameter increment in P speciesDis_p= -0.0154 × (BAm + BAl) + 0.6488
where:
Dis_s: mean annual diameter increment in S species in small-sized treeDis_p_s: mean annual diameter increment in P/S species in small-sized treeDis_p : mean annual diameter Increment in P species in small-sized treeBAm : initial total basal area in mid-sized treeBAl : initial total basal area in large-sized tree
Progress on the studies of growth of logged-over natural forests in Papua New Guinea80
The relationship between initial total BA in large-sized trees and the mean annual diameter increment in mid-sized trees by species group respectively. From this relationship, the mean annual diameter increment in each diameter class was determined.
Mean annual diameter increment in S species Dim_s= 0.06377 ×BAl + 0.393
Mean annual diameter increment in P/S speciesDim_p_s= -0.0166 × BAl + 0.6188
Mean annual diameter increment in P speciesDim_p= -0.0117 × BAl + 0.5522
Where:
Dim_s : mean annual diameter increment in S species in mid-sized treeDim_p_s : mean annual diameter increment in P/S species in mid-sized treeDim_p : mean annual diameter increment in P species in mid-sized treeBAl : initial total basal area in large-sized tree
Mean annual diameter growth in large-sized tree was assumed constant independently of species group.
Mean annual diameter incrementDil = 0.40 cm
Where:
Dil: mean annual diameter increment in large-sized tree
(d) Coeffi cient of variationThe relationship between initial total basal area in mid-sized and large-sized trees and the coeffi cient of variation of mean annual diameter increment in small-sized class. From this relationship, the coeffi cient of variation of mean annual diameter increment in each diameter class was determined.
Coeffi cient of variation of mean annual diameter increment in small-sized tree CVs = 0.7 × (BAm + BAl) + 78.5
Peki Mex M. 81
Where:
CVs: coeffi cient of variation of mean annual diameter increment in small-sized treeBAm : initial total basal area in mid-sized treeBAl : initial total basal area in large-sized tree
The relationship between initial total basal area in large-sized trees and the coeffi cient of variation of mean annual diameter increment in mid-sized class. From this relationship, the coeffi cient of variation of mean annual diameter increment in each diameter class was determined.
Coeffi cient of variation of mean annual diameter increment in mid-sized tree CVm = 0.65 ×BAl + 78.87
where:
CVm : coeffi cient of variation of mean annual diameter increment in mid-sized treeBAl : initial total basal area in large-sized tree
The relationship between initial total basal area in large-sized trees and the coeffi cient of variation of mean annual diameter increment in large-sized class. From this relationship, coeffi cient of variation of mean annual diameter increment in each diameter class was determined.
Coeffi cient of variation of mean annual diameter increment in large-sized tree CVl = 2 ×BAl + 50
where:
CVl : coeffi cient of variation of mean annual diameter increment in large-sized treeBAl : initial total basal area in large-sized tree
(e) Relationship between initial total basal area and mortalityThe relationship between initial total basal area in mid-sized and large-sized trees and mortality in small-sized class. Mortality was assumed constant in small-sized trees for each species group respectively, because there was no relationship to initial total basal area in mid-sized and large-sized trees.
Progress on the studies of growth of logged-over natural forests in Papua New Guinea82
Mortality in S species in small-sized treePms_s = 0.20Mortality in P/S species in small-sized treePms_p_s = 0.89Mortality in P species in small-sized treePms_p = 2.32
where:
Pms_s : mortality in S species in small-sized treePms_p_s : mortality in P/S species in small-sized treePms_p : mortality in P species in small-sized tree
The relationship between initial total basal area in large-sized trees and mortality in mid-sized class. Mortality was assumed constant in mid-sized trees in each species group respectively, because there was no relationship to initial total basal area in large-sized trees. Mortality in S species in mid-sized treePmm_s = 0.11Mortality in P/S species in mid-sized treePmm_p_s = 0.61Mortality in P species in mid-sized treePmm_p = 1.77
where :
Pmm_s : mortality in S species in mid-sized treePmm_p_s : mortality in P/S species in mid-sized treePmm_p : mortality in P species in mid-sized tree
The relationship between initial total basal area in large-sized trees and mortality in large-sized class. Mortality in large-sized class was assumed constant independently of species group.
Mortality in large-sized tree Pml = 2.26
where:
Pml : mortality in large-sized tree
Peki Mex M. 83
(f ) IngrowthsThe relationship between initial total basal area in mid-sized and large-sized trees and number of ingrowths by species group respectively. From this relationship, number of ingrowths was determined. Number of ingrowths in S speciesni_s = -0.400 × (BAm + BAl) + 18.13Number of ingrowths in P/S speciesni_p_s = -0.296 × (BAm + BAl) + 8.40Number of ingrowths in P speciesni_p = -0.677 × (BAm + BAl) + 22.24
where :
ni_s : number of ingrowths in S speciesni_p_s : number of ingrowths in P/S speciesni_p : number of ingrowths in P speciesBAm : initial total basal area in mid-sized treeBAl : initial total basal area in large-sized tree
(g) Calculation of diameter transition probability and diameter distribution in the end of periodUsing above mean annual diameter increment and coeffi cient of variation of mean annual diameter increment, diameter transition probability in each diameter class was calculated by species group respectively (Ishibashi 1989a; Peki 2004).
The way to calculate diameter distribution in the end of the period is showed below:1) Species group calculated using above mortality number of trees that remain at
the end of the period in each diameter class respectively.2) Using the above diameter transition probability, remaining trees were divided
into the diameter class at the end of the period. For example, some trees in 10cm class stay in 10cm class at the end of period, some trees in 10cm class grow up to 15cm class and the other trees in 10cm class grow up to 20cm class.
3) Number of trees in 10cm class (least diameter class) was calculated by adding ingrowth and trees that remained from the initial of period.
Diameter distribution prediction from the FSD model The FSD model adopted to predict parameters from data collected in the PNG showed promising results, from this preliminary analysis, which showed most data from observed and predicted showed a somewhat similar pattern. This is seen more clearly on the plot sites that were selectively cut, especially from the areas where there were no major disasters (natural or man-made) (Figs. 8 & 9). It was found that the diameter frequency increased especially in the P and P/S species. Hence, the numbers
Progress on the studies of growth of logged-over natural forests in Papua New Guinea84
of trees increased from the beginning to the end of the period. It was also observed that there was an increase in Secondary (S) species too in the small-sized trees. The plots that have being affected by fi re, e.g. Sogeram and Iva Inika, showed decreased distributions in observed, but on the predicted showed an increased pattern. The Vudal plots showed normal increment pattern especially from the predictions, but from observation there was a high increasing trend mostly in the smaller sized trees. Vudal may have a more similar pattern as those sites not affected by fi re and human activities than selective cutting (Fig. 10). The FSD model should be applied and used in PNG once more quality data is available so that reliable parameters could be estimated for prediction of the growth of selectively cut areas and in predicting cutting cycles so that maximum Annual Allowable Cut (AAC) could be deduced (Peki 2004). Fig. 11 showes examples of the results of diameter predicted up to 10years in Manus, Gumi and Vudal plots.
ConclusionThe importance of Establishing PSPs in the natural forest of PNG by ITTO and PNGFRI since 1992 and 1995 respectively has provided some preliminary results on the growth and yield of logged-over natural forests in PNG.
The ITTO initiated project had come up with a PINFORM model. This model is a cohort model, based on simple average growth and mortality rates for functional groups of species. The groups are derived statistically for species of similar growth rate and maximum size. Increment is modifi ed by a stand density multiplier derived from basal area and a growth index is derived from residual analysis for groups of plots. Mortality rates differ between sound and defective trees in each species group. Recruitment depends on stand density fi ve years earlier, and varies in species composition depending on the degree of disturbance. These functions are empirically derived from the 72 ITTO PSPs, whose establishment and measurement have formed the core activity of the project since 1992. The use of the PINFORM model should provide some thought–provoking insights into the best way to manage PNG lowland rainforests (Alder 1999).
From the author’s study of 20 PSPs in PNG, it was concluded that: • Stand structure and growth characteristics just after selective cutting did not
experience high damage by logging• Recruitment of many trees in small-sized trees of Secondary species was
predicted by the FSD growth model• The careful monitoring of PSPs is required• Disturbances by human activities and fi re had severe effects on the stand
structure and growth

Peki Mex M. 85
• The FSD growth model to predict future stand structure is a useful tool for forest management purposes.
For both models, it was recommended that they should be improved and modifi ed as further data becomes available for forest management and planning tools.
AcknowledgementsThe author gratefully acknowledges Mr. Cossey Yosi and Mr. Joe Pokana for providing background information on ITTO and PNGFRI projects. The ITTO funded the initial data collection and management system (Project PD 162/91) and PNGFA (PNGFRI Natural Forest Management Program, Internal Budget).
ReferencesAbe, H., Sam, N., Niangu, M., Damas, K., Vatnabar, P., Matsuura, Y. and kiyono,
Y. (2000): Preliminary results of the study on the effects of logging at Mongi - Busiga, Finschhafen, PNG. PNGFRI BULLETIN No. 17, Special Edition. Lae, 79pp.
Alder, D. (1999): The ITTO Permanent Sample Plots in Papua New Guinea: Some results of analysis. (In GIDEON, O. and OAVIKA, F (Eds.): Proceedings of the workshop on PSP and growth model for lowland tropical forest in Papua New Guinea, 11 - 13th November 1998). ITTO Project PD162/91, Lae, 19 – 32.
Alder, D. (1995): Growth modeling for mixed tropical forests. Oxford Forestry Institute, Department of Plant Sciences, University of Oxford. Tropical Forestry Paper 30.
Ishibashi, S. (1989a): The growth prediction of natural forests (I): The construction of a simulation model. Journal of Jap. For. Soc. 71: 309 – 316 (in Japanese with English summary).
Ishibashi, S. (1989b): The growth prediction of natural forests (II): The long-term growth prediction by simulation model. Journal of Jap. For. Soc. 71: 356 - 362 (in Japanese with English summary).
Ishibashi, S. (1990): Studies on the structural dynamics of natural forest based on a simulation model. Bulletin of Tokyo University Forests, No. 82: 11 – 101 (in Japanese with English summary).
Papua new guinea forest authority (PNGFA). (1998): Corporate plan: 1998 - 2001. Port Moresby, PNG, 190pp.
Papua new guinea forest authority (PNGFA). (2003): Forest Resource of PNG, Newspaper Article, The National Newspaper, 20th September 2003. Printed in Port Moresby. PNG. P4.
Peki, M.M. (2004): The growth analysis and its application for management of
Progress on the studies of growth of logged-over natural forests in Papua New Guinea86
selective cutting natural forest in Papua New Guinea. PhD thesis, Graduate School of Agricultural and Life Sciences, Faculty of Agriculture, The University of Tokyo, 249pp.
Peki, M.M. (2001): Stand structure and growth of logged - over natural forest in Papua New Guinea. Master of Agriculture Science thesis, Faculty of Agriculture, Tokyo University of Agriculture and Technology, 145pp.
Pokana, J.N. (2002): Assessing the relationship between the soil groups and species in logged – over rainforest in Papua New Guinea. Master of Science thesis, School of Agricultural and Forest Sciences, The University of Wales, Bangor. UK, 96 pp.
Romijn, K. (1994): PSP standards and procedures: A permanent sample plot program to predict growth and yield in previously logged forest: Parts A – E., ITTO Project PD 162/91, PNG Forest Research Institute, Lae, PNG, 219 pp.
Sabuin, T. (2003): Country report – Papua New Guinea. (In: Proceedings of Heads of Forestry Meeting, 19 – 23 May 2003, Nadi, Fiji). SPC Forests & Trees Programme Field Document No.1, 156 – 179.
Yosi, C. (2000): Report on Status of PSP Database. SFM Programme / PNGFRI Internal Report PNGFRI, December 2000.
Yosi, C. (2004): Logging impacts on forest structure, composition and population of lowland rainforest in Papua New Guinea. Master of Science thesis, School of Agricultural and Forest Sciences, The University of Wales, Bangor. UK, 111 pp.
Rinaldi Imanuddin and Djoko WahjonoForestry Research and Development Agency, Ministry of Forestry of Indonesia
AbstractIllegal logging and wide circulation of wood without legal documents are indicators of the annual decrease in wood product caused by unstable forest planning as determined according to the Annual Allowable Cutting (AAC). Sustainable management of forest resources can be realized if every effort on forest utilization is based on and referred to sustainable forest management planning . One of the key information needed in forest planning is growth and yield data, and this valid data can be obtained if collected through Permanent Sample Plots (PSP) measurement. Basically, there are three things resulted from PSP, namely diameter increment, volume increment and stand stucture dynamics. Generally, diameter increment is used to determine the cutting cycle, cutting diameter limit and main tree diameter limit. While volume increment is used to determine the sustainable production quantity. Whereas stand sturucture dynamics can be used to know stand structure condition in the future.
Keywords: Growth and yield data, AAC, PSP
The utilization of growth and yield data to support sustainable forest management in Indonesia
The utilization of growth and yield data88
IntroductionThe fi rst step in the sustainable forest management is forest management planning, in which economic and ecological aspects must be integrated in order to achieve the planned forest utilization characteristics i.e. rational, optimal and sustained. One of the principal requirements is the availability of long term forest management planning which produces regulation as the main component, while the information on growth and yield monitoring is key in yield regulation.
It is well known that a silvicultural system called Selective Cutting (tebang pilih) is applied for forest management in Indonesia. This system regulates for example the diameter limitation for logging (50 cm up for forest production and 60 cm up for limited forest production), such the that volume produced may not exceed the amount of stand increment. Meanwhile, before data and information on growth and yield are available, the determination is done by assuming that diameter increment is 1 cm/year and volume increment is 1m3/ha/year.
Nonetheless, based on the data and information of forest management obtained to date, the assumption proved to be incompatible to be re-used. Some study results showed that growth and yield in the natural forest are highly varied, depending on the site specifi cs and its management intensity. Therefore, growth and yield monitoring as a base tool of constructing a rational and optimum yield regulation are needed in order to realize the expectation of sustainable forest management.
Policy of growth and yield monitoring The importance of growth and yield monitoring has been realized since the beginning of forest production utilization by undertaking studies at some logging concession company (HPH) locations conducted by the Forestry Research and Development Agency (FORDA), universities or the HPH itself. Generally, the results agree that annual increment and stand structure dynamics are infl uenced by site specifi cs and quality of management in logged-over forest areas.
Considering the importance of growth and yield data as basic datafor a more rational and sustainable forest management and utilization, the Ministry of Forestry established decree number 237/Kpts-II/95, and it is compulsory for each forest management unit to do monitoring of growth and yield by means of Permanent Sample Plots (PSPs). The result shall be reported each year to the Ministry of Forestry through FORDA, which shall do the monitoring and analysis.
FORDA has established the manual to conduct PSP and monitoring method (Decree of Director General of FORDA Number:38/1993) according to the handbill of the Director General of Forest Utilization Number: 1825/1995.

Rinaldi Imanuddin and Djoko Wahjono 89
Figure 1. The position and function of PSP in Long term Forest Management Planning
PSP data position in the sustainable forest managementBasically, sustainable forest management arranges how to utilize forest with the amount of certain products harvested continuously. To realize this management planning, the most important tool is the existence of growth and yield data and information obtained from each forest management unit, considering that growth and yield data are site specifi c.
Growth and yield monitoring can be done with sampling techniques with the PSP at the representative location. And then the results are used as a basis of sustainable forest management.
PSP utilization in sustainable forest managementPrincipally, there are three important points obtained by PSP, namely diameter increment, stand volume increment and stand structure dynamic. The practical purpose of the diameter increment is to determine the cutting cycle, diameter limit for harvesting and diameter limit of main trees. Volume increment can be used to determine sustainable production, while stand stucture dynamic can be used to project stand stucture condition (number of trees distribution for each diameter class) in the future.
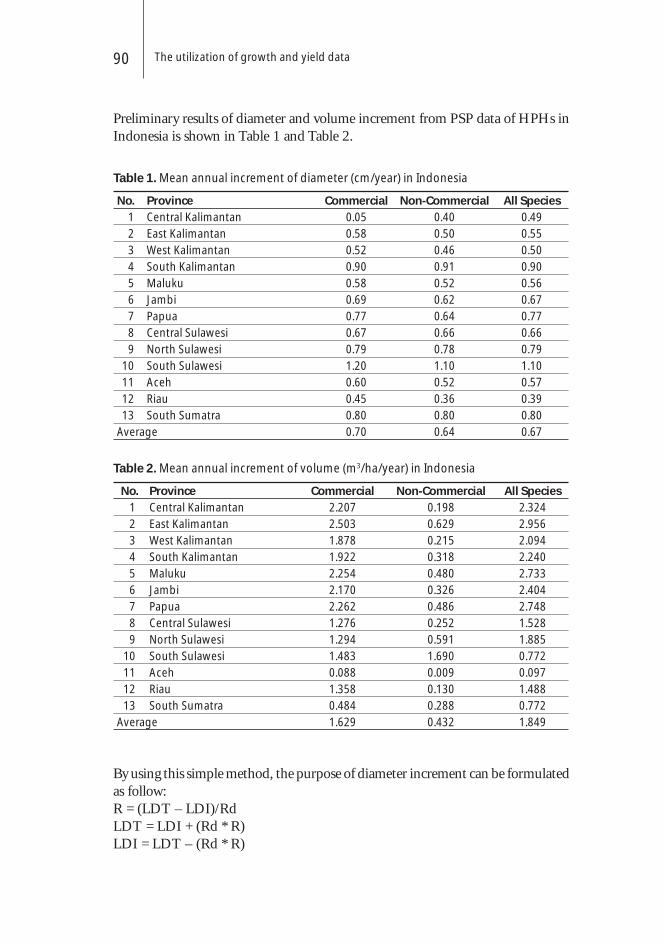
The utilization of growth and yield data90
Table 1. Mean annual increment of diameter (cm/year) in Indonesia
No. Province Commercial Non-Commercial All Species
1 Central Kalimantan 0.05 0.40 0.49
2 East Kalimantan 0.58 0.50 0.55
3 West Kalimantan 0.52 0.46 0.50
4 South Kalimantan 0.90 0.91 0.90
5 Maluku 0.58 0.52 0.56
6 Jambi 0.69 0.62 0.67
7 Papua 0.77 0.64 0.77
8 Central Sulawesi 0.67 0.66 0.66
9 North Sulawesi 0.79 0.78 0.79
10 South Sulawesi 1.20 1.10 1.10
11 Aceh 0.60 0.52 0.57
12 Riau 0.45 0.36 0.39
13 South Sumatra 0.80 0.80 0.80
Average 0.70 0.64 0.67
Table 2. Mean annual increment of volume (m3/ha/year) in Indonesia
No. Province Commercial Non-Commercial All Species
1 Central Kalimantan 2.207 0.198 2.324
2 East Kalimantan 2.503 0.629 2.956
3 West Kalimantan 1.878 0.215 2.094
4 South Kalimantan 1.922 0.318 2.240
5 Maluku 2.254 0.480 2.733
6 Jambi 2.170 0.326 2.404
7 Papua 2.262 0.486 2.748
8 Central Sulawesi 1.276 0.252 1.528
9 North Sulawesi 1.294 0.591 1.885
10 South Sulawesi 1.483 1.690 0.772
11 Aceh 0.088 0.009 0.097
12 Riau 1.358 0.130 1.488
13 South Sumatra 0.484 0.288 0.772
Average 1.629 0.432 1.849
Preliminary results of diameter and volume increment from PSP data of HPHs in Indonesia is shown in Table 1 and Table 2.
By using this simple method, the purpose of diameter increment can be formulated as follow:R = (LDT – LDI)/RdLDT = LDI + (Rd * R)LDI = LDT – (Rd * R)
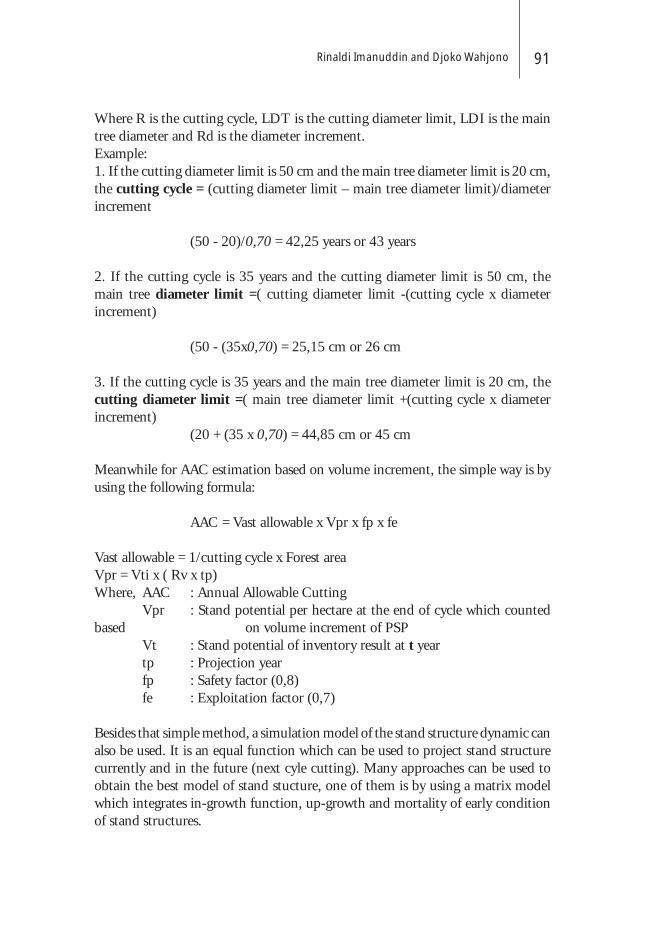
Rinaldi Imanuddin and Djoko Wahjono 91
Where R is the cutting cycle, LDT is the cutting diameter limit, LDI is the main tree diameter and Rd is the diameter increment.Example: 1. If the cutting diameter limit is 50 cm and the main tree diameter limit is 20 cm, the cutting cycle = (cutting diameter limit – main tree diameter limit)/diameter increment
(50 - 20)/0,70 = 42,25 years or 43 years 2. If the cutting cycle is 35 years and the cutting diameter limit is 50 cm, the main tree diameter limit =( cutting diameter limit -(cutting cycle x diameter increment) (50 - (35x0,70) = 25,15 cm or 26 cm 3. If the cutting cycle is 35 years and the main tree diameter limit is 20 cm, the cutting diameter limit =( main tree diameter limit +(cutting cycle x diameter increment) (20 + (35 x 0,70) = 44,85 cm or 45 cm
Meanwhile for AAC estimation based on volume increment, the simple way is by using the following formula:
AAC = Vast allowable x Vpr x fp x fe
Vast allowable = 1/cutting cycle x Forest areaVpr = Vti x ( Rv x tp)Where, AAC : Annual Allowable Cutting Vpr : Stand potential per hectare at the end of cycle which counted based on volume increment of PSP Vt : Stand potential of inventory result at t year tp : Projection year fp : Safety factor (0,8) fe : Exploitation factor (0,7)
Besides that simple method, a simulation model of the stand structure dynamic can also be used. It is an equal function which can be used to project stand structure currently and in the future (next cyle cutting). Many approaches can be used to obtain the best model of stand stucture, one of them is by using a matrix model which integrates in-growth function, up-growth and mortality of early condition of stand structures.
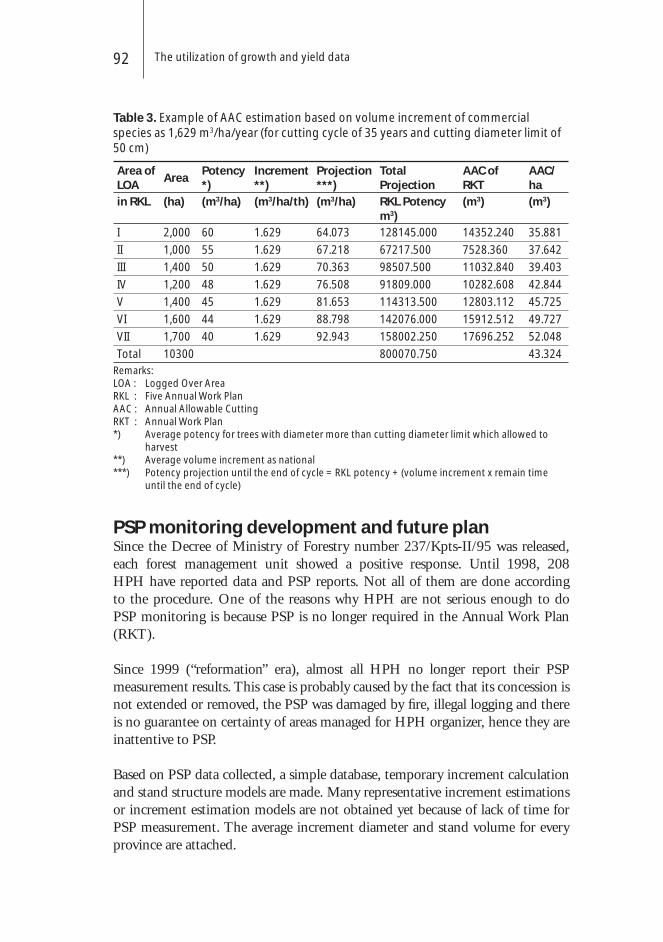
The utilization of growth and yield data92
Table 3. Example of AAC estimation based on volume increment of commercial species as 1,629 m3/ha/year (for cutting cycle of 35 years and cutting diameter limit of 50 cm)
Area of LOA
AreaPotency *)
Increment**)
Projection ***)
Total Projection
AAC of RKT
AAC/ha
in RKL (ha) (m3/ha) (m3/ha/th) (m3/ha) RKL Potency m3)
(m3) (m3)
I 2,000 60 1.629 64.073 128145.000 14352.240 35.881
II 1,000 55 1.629 67.218 67217.500 7528.360 37.642
III 1,400 50 1.629 70.363 98507.500 11032.840 39.403
IV 1,200 48 1.629 76.508 91809.000 10282.608 42.844
V 1,400 45 1.629 81.653 114313.500 12803.112 45.725
VI 1,600 44 1.629 88.798 142076.000 15912.512 49.727
VII 1,700 40 1.629 92.943 158002.250 17696.252 52.048
Total 10300 800070.750 43.324Remarks:LOA : Logged Over AreaRKL : Five Annual Work PlanAAC : Annual Allowable CuttingRKT : Annual Work Plan*) Average potency for trees with diameter more than cutting diameter limit which allowed to
harvest**) Average volume increment as national***) Potency projection until the end of cycle = RKL potency + (volume increment x remain time
until the end of cycle)
PSP monitoring development and future planSince the Decree of Ministry of Forestry number 237/Kpts-II/95 was released, each forest management unit showed a positive response. Until 1998, 208 HPH have reported data and PSP reports. Not all of them are done according to the procedure. One of the reasons why HPH are not serious enough to do PSP monitoring is because PSP is no longer required in the Annual Work Plan (RKT).
Since 1999 (“reformation” era), almost all HPH no longer report their PSP measurement results. This case is probably caused by the fact that its concession is not extended or removed, the PSP was damaged by fi re, illegal logging and there is no guarantee on certainty of areas managed for HPH organizer, hence they are inattentive to PSP.
Based on PSP data collected, a simple database, temporary increment calculation and stand structure models are made. Many representative increment estimations or increment estimation models are not obtained yet because of lack of time for PSP measurement. The average increment diameter and stand volume for every province are attached.

Rinaldi Imanuddin and Djoko Wahjono 93
Figure 2. Growth and yield network
Considering the importance of PSP data for sustainable forest management, there is a serious need for PSP making and measuring and also its security. Therefore, an immediate overall policy of sustainable forest management is needed, in which PSP monitoring results serve as one of the references of sustainable forest management, especially on forest management planning.
In order to achieve a valid and steady result in the way of PSP data handling and management, it is deemed necessary to establish a national growth and yield network. A recommendation team as the result of increment monitoring on each unit forest management can be used as the base of the policy in order to determine the level of wood which may be exploited. The network is formulated in Figure 2.
ConclusionsGrowth and yield monitoring is obligatory if we want to realize sustainable forest management. Therefore, forest product utilization must be based on yield regulation planning constructed according to stand increment data of PSP monitoring from each forest management unit (HPH).
It is hoped that this paper can give us a good understanding of the importance of PSP (growth and yield research) and also its relationship with sustainable forest management. With a better understanding, it is hoped that the appreciation and
The utilization of growth and yield data94
support from the stakeholders to the implementation of Decree Number 237/Kpts-II/95 will increase, so that one of sustainable forest management obstacles (increment information availability) can be overcome.
ReferencesAlder, D. 1999. Workshop Conclusions. In: H.L. Wright and D. Alder (Editors).
1999. Proceedings of a Workshop on Humid and Semi-humid Tropical Forest Yield Regulation with Minimal Data. Oxford Forestry Institute, Department of Plant Sciences, University of Oxford. O.F.I. Occasional Papers No. 52: 91-92.
Sumarna, K. 2000. Natural Regeneration in Dipterocarpaceae After Selected Cutting. Forestry and Estate Crop Bulletin. Vol I No. 2, 2000.
Wahjono, D. 2001. Evaluation and Analysis of Permanen Sample Plot (PSP) Data in Natural Forest. Forest and Nature Conservation Research and Development Center (Unpublished).
Chanhsamone Phongoudome and Phonesavanh ManivongForestry Research Centre (FRC), National Agriculture and Forestry Research Institute (NAFRI), Ministry of Agriculture and Forestry (MAF), P.O Box: 7174, Vientiane, Lao PDR
AbstractThis paper summarizes the present status of PSPs in Lao PDR during the past 10 years after initiating the establishment of permanent sample plots for Lao’s forestry sector. Three main forest types, namely mixed deciduous forest (MDF), dry dipterocarp forest (DDF) and dry evergreen forest (DEF), with different structure of diameter classes, seedlings, plot topographic features and location and subplot sizes are used to estimate tree growth and to predict yield for future sustainable forest management and planning system (SFMS). However, results of studies from PSPs have not been completed prior to the introduction of forest management systems.
Keywords: Lao PDR, permanent sample plots PSP, mixed deciduous forest, dry dipterocarp forest and dry evergreen forest
Current status of permanent sample plots in Lao PDR
IntroductionAccording to a nation wide reconnaissance survey in 1992, the forest area in 1992 in Lao PDR was about 11.2 million ha, or about 47% of the total land area. The forest area was divided into state production forests (SPF), which covered
Current status of permanent sample plots in Lao PDR96
approximately 2 million ha. Most of the SPFs are located in the central and southern parts of the country. In the past 10 years there have been several projects which have supported the establishment of PSPs. Under the Forest Management and Conservation Project in 1995-2000 (FOMACOP), Forestry Department (DOF) initiated the establishment of PSPs in Dong Sithouan State Production Forest in Savannakhet Province in the southern part of Lao PDR. FOMACOP was funded by the Government of Finland and the World Bank. Another two initiatives to establish permanent sample plots were undertaken between 1998-2001 by DOF-LSFP (Lao Swedish Forestry Programme), and are being undertaken in 2004-2007 by NAFES/SUFORD (National Agriculture and Forestry Extension Service/ Sustainable Forest and Rural Development Project) funded by the Government of Lao-Finnida-World Bank.
Materials and tools• Land Use and Forest Types Map• Map of State Production Forest areas• Forest types: mixed deciduous forest, dry dipterocarp and dry evergreen forest • Tape 50 or 30 m, diameter tape, clipboard, haga, clinometer, compass, tripod,
machete, pocket calculator, exercise book, graph papers, binoculars, PVC pipes, saw, wood, sign board, raffi a, aluminium nails, tags, no. punch, paint, hammers, brush, camping materials, pencils, pens, pencil eraser, oil drums, papers, printing costs, maps, medical kit, cooking utensils, fi eld clothes, etc.
Study sitesSite I: Dong Sithouan, state production area located in Thapangthong District, Savannakhet Provinces. Total area is 212,000 ha
Site II: Dong Kapho state production area located in Phin and Phalanxai Districts, Savannakhet Province. The total area selected from production forest area is 9,600 ha.
PSP designSite I: Dong Sithouan State Production Forest Area• Natural High Forest (NHF), Dry Evergreen Forest (DEF), Mixed Deciduous
Forest (MDF) and Dry Dipterocarp Forest (DDF) • 249 plots • Plot design: circular plot with 20 m radius
Chanhsamone Phongoudome and Phonesavanh Manivong 97
• Main plot size: radius 20 m for tree DBH >= 60 cm, NTFPs and epiphytes• Subplot size: radius 15 m for tree DBH 30-59 cm, NTFPs and epiphytes• Subplot size radius 10 m for tree DBH 15-29 cm, NTFPs and epiphytes• Subplot size: radius 5 m for tree DBH >= 5-14 cm, NTFPs, regeneration,
epiphytes• Biodiversity evaluation was also included
Site II: Dong Kapho State Production Forest Area• Natural High Forest (NHF), Dry Evergreen Forest (DEF), Mixed Deciduous
Forest (MDF) and Dry Dipterocarps Forest (DDF)• 27 plots, plot size 100m x 100m, plot design: square shape• 673 subplots, 20m x 20 m plots for tree DBH >=10 cm• 243 subplots, 5 m x 5 m, for tree DBH <10 cm - 1.5 m height (saplings and
poles)• 243 subplots, 2 m x 2 m, for tree >0.3 m - <1.5 m height (seedlings)
Tree species names based on Vidal, 1959, NAFRI, 2001 and Callaghan, 2003.
ResultsProper data from previous (FOMACOP, LSFP) studies is still lacking/inadequate.• 1995-2000 project produced some basic data and reports • 1998-2001 data have been used to developed GIS software for assessment of
species, diameter classes, tree growth and regeneration, etc.• 2004/05 two sites have been re-measured and data entry is in the process/
completed: site I: MDF 84 plots, DDF 74 plots and DEF 5 total 163 plots; site II: MDF 16 plots
Discussion• PSP plays an important role in SFM. • After the completion of the present project, Forest Department/DoF, NAFRI
and NAFES should continue providing support and funds for researchers to follow up and maintain PSP network, otherwise the valuable work done so far will be lost.
• Protection of PSPs should be given high priority (e.g. logging prohibited).• Besides development of PSPs, volume table development and biodiversity
monitoring should also be included.• Silvicultural systems need more improvement for SFM.
Current status of permanent sample plots in Lao PDR98
ConclusionsPermanent Sample Plots play a very important role in the forestry sector in sustainable management and planning practices. Although the development of PSP has been started in Lao PDR, it has to be further improved. Financial support for capacity building, fi eld activities and protecting PSP sites are the key issues to be solved. National and international cooperation and networking will be also needed to gain experience from different areas, countries and organizations.
AcknowledgementsThe authors want to thank the National Agriculture and Forestry Research Institute/Forestry Research Centre (NAFRI/FRC); the National Agriculture and Forestry Extension Services and Sustainable Forestry and Rural Development Project (NAFES/SUFORD) under the Ministry of Agriculture and Forestry, Lao PDR for their support for our work and our attendance in this workshop. We also give our warm thanks to CIFOR, ITTO and PERSAKI, for their full support in this workshop.
ReferencesCallaghan, M. (Compile). 2003. Checklist of Lao Plant Names. Vientiane.DOF. 1998. Guideline for Initiating Studies on the Growth and Regeneration of
Natural Forest in Lao PDR. Vientiane.NAFRI. 2001. Manual National Forest Inventory. Vientiane.NOFIP. 1992. Report on Nation Wide Reconnaissance Forest survey and Land
use in Lao PDR (Final Report). Vientiane.Vidal, J. E. 1959. Vernacular names (Lao, Meo, Kha). Paris.
Sulistyo A. SiranForestry Research Institute of Kalimantan, Samarinda
AbstractSuccessful implementation of sustainable forest management in the operational level relies on the understanding of the process which occurs in natural forest and the response of the forest due to intervention. Indonesia is fortunate enough to have a vast natural forest in which the forests have been managed for more than three decades, but the knowledge of such process and reaction of the forest (before and after logging) is still very scarce. Through the development of STREK (Silvicultural Techniques for the Regeneration of Logged Over Forest in East Kalimantan) Plot, such knowledge and understanding is expected to improve. These include knowledge of basic ecological patterns such as tree species richness and distribution, tree growth, tree mortality and regeneration, stands structure as well as forest dynamics. Improved knowledge will lead to the improvement of forest planning, particularly in the sustainability of production.
In order to provide the reliable data and information, STREK plots were designed in such a way so that the data and information available will meet the need to improve forest management. STREK Plots of 1,000 hectares each were developed in two sites, namely in the RKL-1 and RKL-4 of PT. Inhutani I, District Berau, East Kalimantan. In the fi rst site (RKL-1), six plots of 4 ha each were set up where two different silvicultural treatments were tested. On the second site (RKL-4), 12 plots of 4 ha each were set up where three different logging treatments were implemented; two Reduced Impact Logging (RIL) with two different diameter limits to be cut (> 50 cm and >60cm), and conventional logging (similar to Indonesian Selective Cutting System/TPI). All trees in the Plot which have diameters (dbh) >10 cm were measured, numbered and mapped with a scale of 1: 200. Physical features such as topography and soil were assessed in
The importance of STREK plots in contributing sustainable forest management in Indonesia

The importance of STREK plots100
each plot. For the purpose of species identifi cation, tree leaves and fruits were collected and deposited in the herbarium. All data collected from the fi eld has been recorded and well organized. The database organization consists of gathering data and information, recording and storing in fi les.
Until now, 49,959 trees with dbh of 10 cm have been recorded in the STREK database (covering 35,830 life trees and 14,129 dead trees), with the composition of 671 tree species in 71 families. This database is one of the largest in Indonesia and combined with the time frame of measurement, the STREK Plot is one of the best Plot in the world besides the similar Plot in the Salomon Islands. The above data and information provided by STREK Plot has been used to develop growth and yield studies and calibrate simulation models of natural forest stands, such as Yield Scheduling System (YSS) and Sustainable Yield Management for Tropical Forest (SYMFOR).
Keywords: STREK, database, silvicultural treatment, Berau, East Kalimantan
IntroductionAfter more than three decades of management of tropical forest in Indonesia, the forest condition is now experiencing degradation at an alarming rate. There is growing concern that sustainable forest management will not be achieved unless revolutionary effort in forest management takes place. The latest data from the Indonesian Ministry of Forestry shows that the rate of degradation was 2.8 million/ha/ year over the last fi ve years, while the degraded forest already reach 59.7 millions ha. Illegal logging, forest fi re, forest land encroachment and over exploitation are all contributing to the declining forest productivity and forest degradation. Besides, political, socio-economic and technical constraints have persisted to curb sustainable forest management though national commitment emerges.
Realizing the problem, the Indonesian Government strives to implement sustainable forest management both in the national scope and unit management level. Through the Decree No. 4795 and 4796 year 2002, the Minister of Forestry set up criteria and indicators of Sustainable Production Forest in the management unit level. This was the major breakthrough in assessing performance of Sustainable Forest Management conducted by concession holders in the fi eld.
The success of managing forest production very much depends on many scientifi c and technical factors. In the production aspect, for instance, efforts should be directed to produce logs in a sustainable way by reducing negative impacts on biodiversity, erosion and environment. Post logging management will be required to assess dynamic growth of vegetation and growth rate of regeneration to estimate the yield in the next harvesting cycle. In short, the concept of sustainable management was used as the basic philosophy to manage forest which covers three functions on production (economic), environment (ecosystem) and social.
Sulistyo A. Siran 101
In the context of sustainable management of forest production in the unit level described above, we will investigate the contribution of STREK PLOT in providing data and information to support conditions.
STREK plot history and objectivesSTREK is an acronym of “Silvicultural Techniques for the Regeneration of Logged Over Forest in East Kalimantan”. The Plot was built under the STREK project in 1989 by the Forestry Research and Development Agency (FORDA) in Cooperation with PT Inhutani I and supported by the CIRAD-Foret of France. Besides funds, CIRAD-Foret also provided technical expertise in designing the plot. It was established to investigate the characteristics and the evolution of the forest stand under different treatments. The objective of the development of the STREK Plot was therefore to give the Ministry of Forestry several options of silvicultural techniques based on a scientifi c and technical knowledge. Since 1996, the project was continued and became part of the Berau Forest Management Project (BFMP), a project under the cooperation between the Directorate General of Production Forest, the Ministry of Forestry of Indonesia and the European Union (EU). There were some questions raised which need to be addressed in time when the STREK Plot was established, namely: (1) How does the growth rate of natural forest stands look like due to several treatments and logging operation, (2) what is the dynamic growth of forest stands after logging and treatment in terms of recruitment rate and mortality and (3) what is the magnitude and type of injuries suffered by stands during logging and how fast will the stands recover. Those questions were expected to be addressed through monitoring of the Plot from time to time. The data collected from the Plot might also serve as valuable input in making strategy and choice on selecting appropriate silvicultural techniques and rotation for the next harvesting.
STREK plot designSTREK Plot is located in the concession of PT Inhutani I of Labanan in the province of East Kalimantan. Figure 1 and 2 show the site of STREK Plot which is very accessible, either by plane, water or land.
Figure 1 and 2 show that STREK Plot was designed under the two main activities located in the unit which corresponds to 5- year development plan (RKL) -1 with the total area of 24 ha and RKL-4 with total area of 48 ha.
Treatments• RKL-1, a unit consisting of 1,000 ha logged in 1978/1979. The RKL-1 consists
of six plots and each plot covers an area of 4 ha. The treatment applied in this
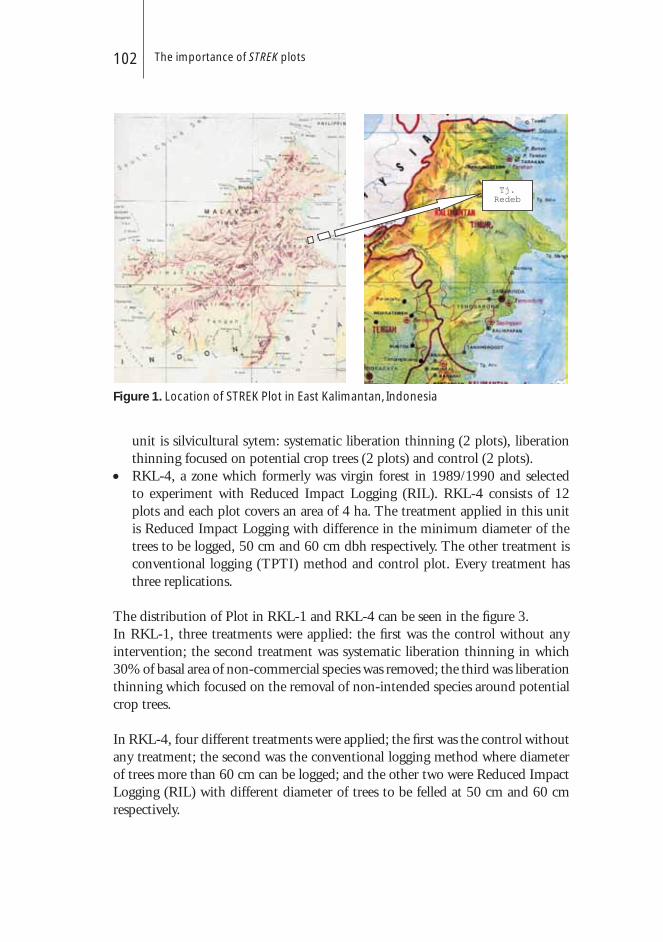
The importance of STREK plots102
unit is silvicultural sytem: systematic liberation thinning (2 plots), liberation thinning focused on potential crop trees (2 plots) and control (2 plots).
• RKL-4, a zone which formerly was virgin forest in 1989/1990 and selected to experiment with Reduced Impact Logging (RIL). RKL-4 consists of 12 plots and each plot covers an area of 4 ha. The treatment applied in this unit is Reduced Impact Logging with difference in the minimum diameter of the trees to be logged, 50 cm and 60 cm dbh respectively. The other treatment is conventional logging (TPTI) method and control plot. Every treatment has three replications.
The distribution of Plot in RKL-1 and RKL-4 can be seen in the fi gure 3.In RKL-1, three treatments were applied: the fi rst was the control without any intervention; the second treatment was systematic liberation thinning in which 30% of basal area of non-commercial species was removed; the third was liberation thinning which focused on the removal of non-intended species around potential crop trees.
In RKL-4, four different treatments were applied; the fi rst was the control without any treatment; the second was the conventional logging method where diameter of trees more than 60 cm can be logged; and the other two were Reduced Impact Logging (RIL) with different diameter of trees to be felled at 50 cm and 60 cm respectively.
Figure 1. Location of STREK Plot in East Kalimantan, Indonesia
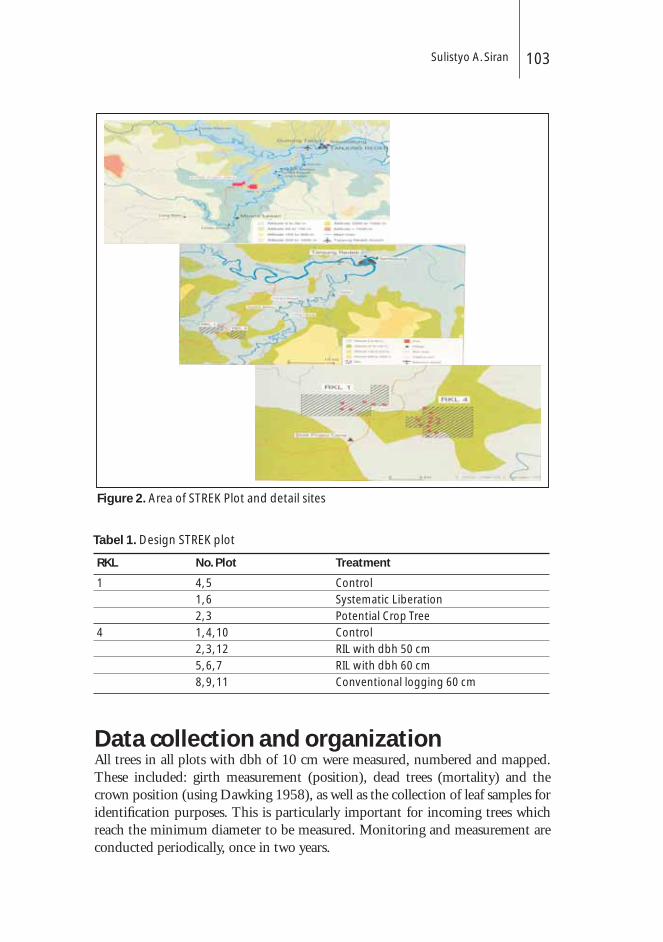
Sulistyo A. Siran 103
Figure 2. Area of STREK Plot and detail sites
Tabel 1. Design STREK plot
RKL No. Plot Treatment
1 4, 5 Control
1, 6 Systematic Liberation
2, 3 Potential Crop Tree
4 1, 4, 10 Control
2, 3, 12 RIL with dbh 50 cm
5, 6, 7 RIL with dbh 60 cm
8, 9, 11 Conventional logging 60 cm
Data collection and organizationAll trees in all plots with dbh of 10 cm were measured, numbered and mapped. These included: girth measurement (position), dead trees (mortality) and the crown position (using Dawking 1958), as well as the collection of leaf samples for identifi cation purposes. This is particularly important for incoming trees which reach the minimum diameter to be measured. Monitoring and measurement are conducted periodically, once in two years.

The importance of STREK plots104
Figure 3. Distribution of STREK Plots in Labanan
All data collected from the fi eld are recorded and well organized. The database organization consists of gathering data and information, recording and storing into fi les. Before data analysis, such data is checked in terms of accuracy and its reliability. There are main fi les to store tree parameter records• The fi rst fi le called SPECIE is the list of the tree species identifi ed in the plots
with their respective equation.• The second fi le, called SITREE_P (Permanent File) records the species names
and the coordinate of the trees in each square. Each plot therefore has a different Permanent File.
• The third fi le, called SITREE_D (Dynamic File), records all the variables gathered during measurement. This data includes girth, mortality, crown position, crown form, etc.
By using Visual FoxPro (Vfp) software database, all information gathered in the fi eld can be recorded into main fi les (SPECIE, SITREE_P, SITREE_D) and ExtCamp software to verify through a checking procedure. For the purpose of analysis, the data can be processed using the program provided by Visual FoxPro

Sulistyo A. Siran 105
(Vfp). The results include basic characteristics such as number of stems, basal area, volume, mortality and diameter increment. With a graphic program, all tree spatial distribution can also be performed. This will assist in more indepth studying of the relationships between species in the specifi c sites.
Results and discussionSTREK Plots have existed for 16 years. The Plot is measured periodically once every two years using the same method. The consistency of measurement is to guarantee the production of high quality data in terms of reliability and accuracy. There might be questions about why measurements are not conducted annually. It was suggested that the tree growing in natural forest does not show signifi cant increment both in diameter and height in a year. This consideration also applies to recruitment tree (ingrowth).
Plot data and information obtained from the continuous forest inventory of the Plot are among others: number of stands and basal area, potential of stand volumes (m3/ha), in-growth rate, mortality, information on condition of vegetation after logging (treatment), etc.
Preliminary results from the measurement and monitoring of the STREK Plot includes:
Tree speciesContinuous monitoring and measurement of the Plots have been conducted; eight measurements for RKL-4 and seven measurements for RKL-1. Preparation for the next measurement has been made for RKL-1 this month, which usually takes place over three months involving 20 persons. Until now, 49,959 trees with dbh of 10 cm have been recorded in the STREK database (covering 35,830 live trees and 14,129 dead trees), with composition of 671 tree species in 71 families. This database is one of the largest in Indonesia and combined with the time frame of measurement, the STREK Plot is one of the best Plot in the world besides similar Plot in the Salomon Islands.
The continuation of the monitoring of the trees in the Plot will provide valuable information for forest management. Reliable data gathered from the fi eld combined with basic information such as the magnitude of area and biodiversity damage, topography, soil characteristics, crown forms and position and climate will be benefi cial for modelling purposes.
The importance of STREK plots106
Forest stand dynamics In RKL-4, it was observed that nine years after logging either with Convention or RIL, the forests show recovery. Forest stand dynamics are refl ected by tree growth, in-growth and mortality. These three aspects also shape the stand structure. It was found that the population of trees per hectare (n/ha) is very high, as indicated by diameter distribution. Stand structure of every Plot shows differences due to different treatments, and this also occurs in growth patterns which shows shifting due to intervention.
In general, there is a positive correlation between forest stand dynamics or stand structure and treatment. The stand structure will fl uctuate if the intensity of intervention applied to the stands is high.
In-growth and mortalityOne of the most important aspects in determining growth function of forest stands is the rate of in-growth and mortality. There is a tendency that the rate of in-growth in early measurement (two years) after logging is smaller (5-15 trees/ha) as compared to that of measurement of nine years after logging (23-54 tree/ha), while in virgin forest, in-growth is relatively constant (5-15 trees/ha).
In terms of mortality, the effect of treatment in the fi rst year is very signifi cant. Mortality is calculated by summing up the total dead trees and the removal of trees from the forest due to logging. The total mortality of trees ranges from 73-157 trees/ha. The rate of mortality will decrease while forest stands continue to recover from damages. After nine years, the rate of mortality reaches 12-19 trees/ha, similar to what happens in virgin forest (11-19 trees/ha).
Stand volumes Potential stand volume is determined by several aspects namely the number of trees per ha (n/ha), basal area and volume (m3). Potential per hectare of forest stands is one the most crucial points in the production planning. Based on observation, the condition of STREK Plot after logging (nine years) is very encouraging in the sense that the potential volume amounts to 270-390 m3/ha, though this volume is slightly smaller than the volume before logging (340-460 m3/ha).
In virgin forest, the average growth rate in tree diameter for all species was 0.22 cm per year, with dipterocarps species growing faster (0.3 cm per year). After the forests were logged, the growth rates doubled: 0.39 cm per year for all species, 0.52 cm per year for dipterocarp species. There is a correlation between growth and intensity of logging. It was revealed that for small-diameter trees the growth increase is faster (50%) as compared to 20% in large-diameter trees.

Sulistyo A. Siran 107
ConclusionThe advantage of having STREK Plot was inevitable. Although monitoring and measurement of STREK Plot has been done in quite a short period of time, the data and information provided by the STREK Plot represents valuable observations, and will increase signifi cantly through time with continued consistency in data gathering and recording. The database provided by the STREK has served as a valuable input for forest management in the country for modeling. From the observations it was found that whatever intervention (type of logging) was sustained, the forest stands will recover within nine years. However, for the purpose of sustainable logging, Reduced Impact Logging would be preferred since it causes less damage to forest stands in comparison to the conventional ones. The crucial point would be how to protect the forest from destructive activity, such as re-logging, encroachment and fi re, so that forest will produce more yield in the next rotation.
Sylvie Gourlet-Fleury1 and Plinio Sist2
1 Forestry Department of CIRAD, Unit “Natural Forests Dynamics”Campus International de Baillarguet 34398 Montpellier Cedex 5, France
2 Forestry Department of Cirad, Unit “Natural Forests Dynamics”Convênio EMBRAPA-CIRAD EMBRAPA, Travessa Dr. Eneas Pinheiro, Belem-PA 66095-100
AbstractFrom 1977 to 1989, the Forestry Department of CIRAD has contributed to the settlement of several large PSPs in tropical regions worldwide, in collaboration with national forest services and/or agronomic research institutes: Mopri/Téné/Irobo in Ivory Coast, Mbaïki in Republic of Central Africa (RCA), Paracou in French Guiana, ZF2 in Brazil, Ngouha II in Congo-Brazzaville, Oyan in Gabon, STREK and Bulungan in Indonesia. The detailed objectives varied according to the particular situations encountered, but the most important, common to all sites, was to assess the impact of logging and possibly complementary silvicultural treatments on the dynamics of commercial species. With increasing experience, the experimental designs were improved and gained in “testability” of the effects of disturbance on many aspects of dynamics. As silvicultural practices and questioning evolved, so did silvicultural treatments tested. As an illustration, RIL techniques rather than complementary thinning were at the core of the experiments led in Indonesia on the STREK and Bulungan sites.
Data gathered on three of those sites – Mbaïki, Paracou and STREK – have been allowing the Forestry Department of CIRAD to develop and calibrate various models of forest dynamics since 1992: distribution-based models (density dependent and independent matrix models), single-tree based models (distance dependent and distance independent). Those models have been used so far both to make predictions
Contribution of permanent sample plots to the sustainable management of tropical forests: what rules to warrant the long-term recovery of timber-logged species?
Elements from STREK, Bulungan (Indonesia), Paracou (French Guiana) and Mbaïki (Republic of Central Africa)

Sylvie Gourlet-Fleury and Plinio Sist 109
on the development of stands and populations after various intensities of logging, to look for “sustainable scenarios” enabling the long-term maintenance of commercial populations and to test hypotheses on the detailed behaviour of particular species.
In this presentation, we particularly focus on lessons drawn from the STREK and Bulungan experiments. Two main conclusions were driven:1) The effi ciency of RIL techniques depends on the intensity of logging. In the rich
Dipterocarp forests encountered in North-East Kalimantan, no more than 8 trees/ha should be felled: adopting RIL techniques should allow to limit damages to less than 40% of the remaining trees in the stands.
2) Looking for the shortest felling cycle which could allow a sustainable production of timber over the long-term, we found that this duration correlated well with the intensity of logging. A good scenario to recommend would be the regular felling of 8 trees/ha every 40 years, which could yield 67 m3 at each cut, ie an annual yield of 1.6 m3.
More generally, general conclusions driven from our studies on the other sites are the following:1) Nowhere can volume at fi rst cut, as currently realised, be recovered within ongoing
durations of felling cycles (resp. 35 years, 40 years and 30 years in Indonesia, French Guiana and RCA): no more than 70% to 80% could.
2) RIL should be systematically implemented to reduce damages on the residual stand, and fi rst of all to preserve future crop trees.
3) The actual three combined criteria: duration of felling cycles, diameter cutting limit and logging intensity probably are unsustainable for most of the timber species.
4) However, lengthening felling cycles beyond 40 years may not be a good solution: fi nancial return will be too low, timber volume can be lost through natural mortality and stand closure will both slow down the growth of remaining trees while being counterproductive for the regeneration of many commercial species.
5) More species should be logged less intensively, and their ecological requirements should be taken into account.
6) Logging will unavoidably induce a change in the fl oristic composition of the stands.
We feel that it is time, and possibilities exist, to drive a thorough comparison between all the sites where PSP were implemented, in order to identify general trends and look for the possibilities of general conclusions and recommendations to forest managers in the tropics.
Keywords: Permanent Sample Plots, reduced-impact logging, silviculture, models of forest dynamics

Permanent sample plots in damar and rubber agroforests of Sumatra and use of the data for the spatially explicit individual based forest simulator (SExI-FS)
Degi Harja1, Gregoir Vincent1, 2 and Laxman Joshi1
1 ICRAF-SEA, IRD2 IRD
AbstractWith the loss of natural forest in Sumatra, the farmer planted and managed agroforests are gaining in importance as source of timber, in additional to their role as supplier of resins, latex and fruit. Long term sample plots have been established in the Damar agroforests of Krui (West Lampung) and the rubber agroforest of Muara Bungo (Jambi). Design of the plots follows the principles of long term forest sample plots. The design of the associated data base included options for parameterization and calibration of the SExI-FS model of growth in mixed tree stands. After calibration the model can be used for exploring management scenarios, timber yields and carbon stocks, as well as for giving visual impressions of stand development. The model is available from the www.ICRAF.org/SEA <fi le://www.ICRAF.org/SEA> site.
Keywords: Agroforestry, Rubber Agroforest, Damar Agroforest, System Dynamic, SExI-FS, Model and Simulation

Daniel MurdiyarsoCenter for International Forestry Research
AbstractPermanent Sample Plot (PSP) has been to some extent standardized in order to ease data and information sharing among developers and users. The community has traditionally been networked for silvicultural and wider forest management purposes. Even if there are differences in terms of format and components reported, there are substantial commonalities and rooms for improvement as far as data exchanges are concerned.
There has been an increasing demand for data and information collected from PSP for accounting purposes in carbon sequestration projects under climate change agreements. Such information would support the development of the so-called baseline and additionality scenarios presented in the project development design. Needless to say that the use of long-term measurements provided by PSP would increase the project profi le and credibility.
In this connection CIFOR is very keen to facilitate data and information exchanges by providing a web-based platform, by which potential users may be directed to the originating institutions. This way violation of intellectual property right may be avoided. CarboFor© will appear at the CIFOR main page to serve both forestry and climate change communities.
Keywords: PSP, climate change and CarboFor©
The importance of permanent sample plot network for climate change projects

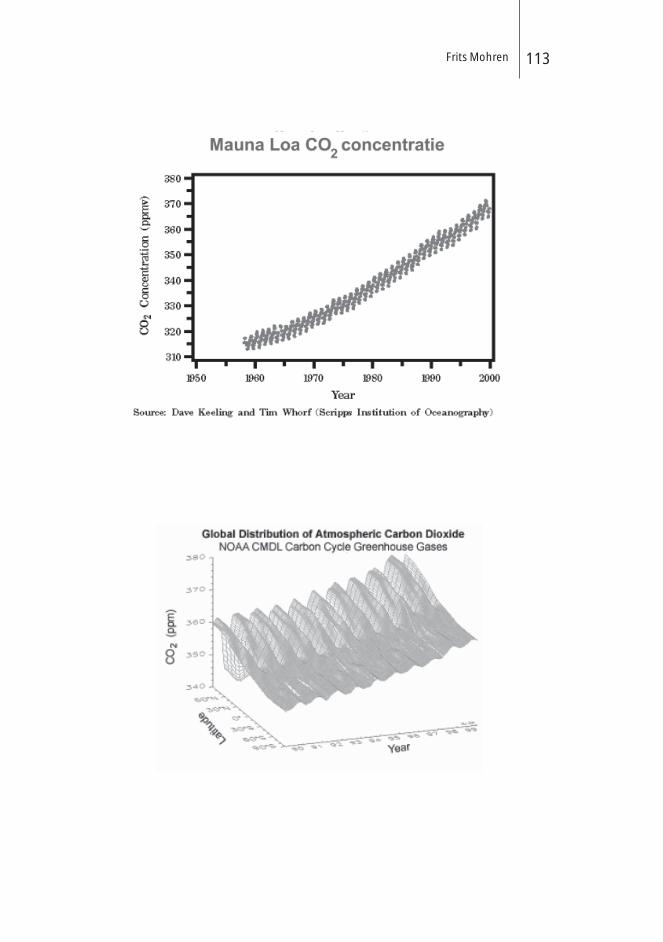
Frits Mohren 113
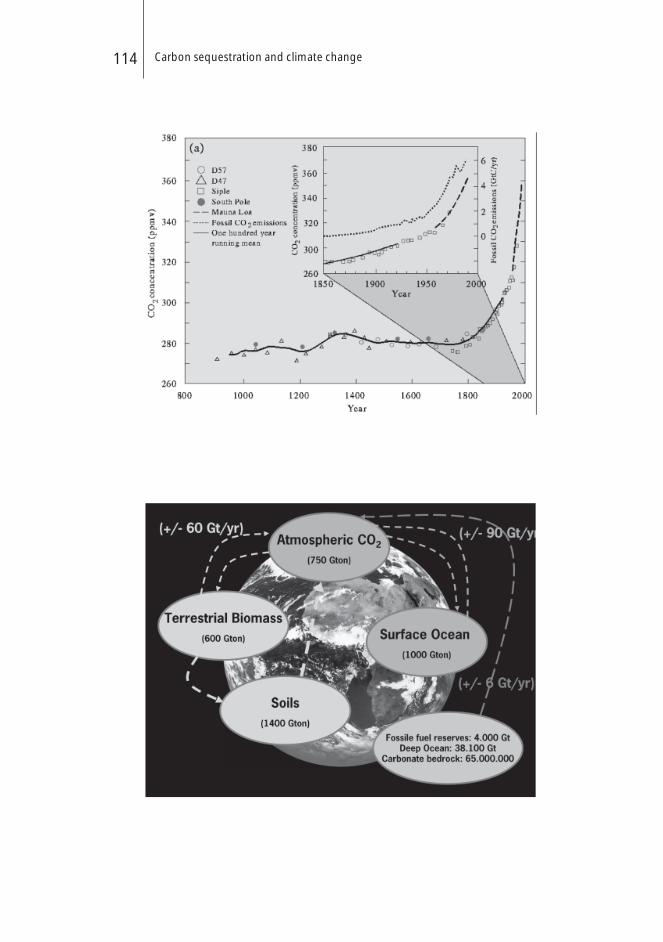
Carbon sequestration and climate change114
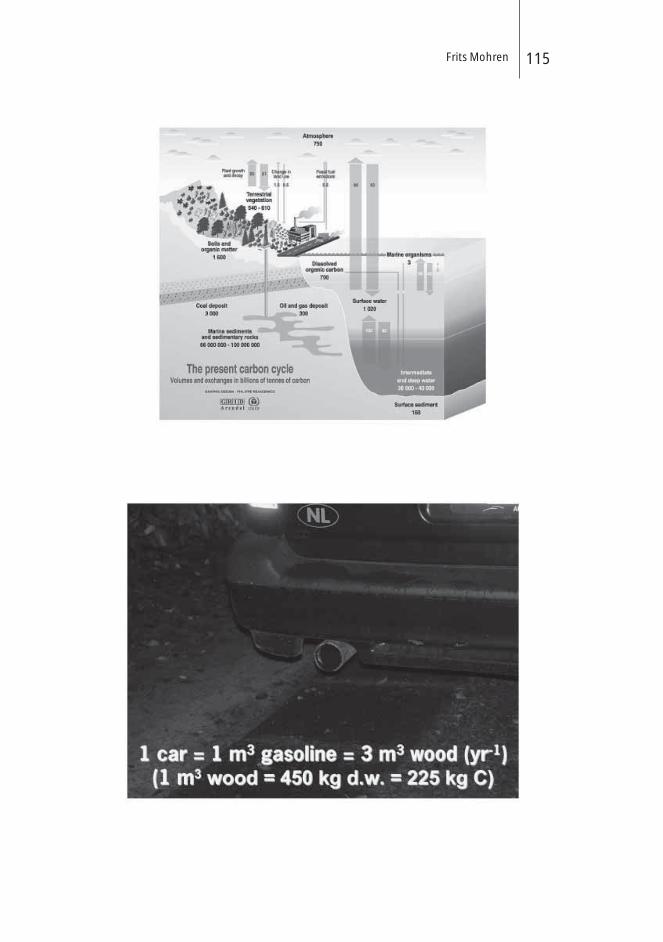
Frits Mohren 115

Carbon sequestration and climate change116
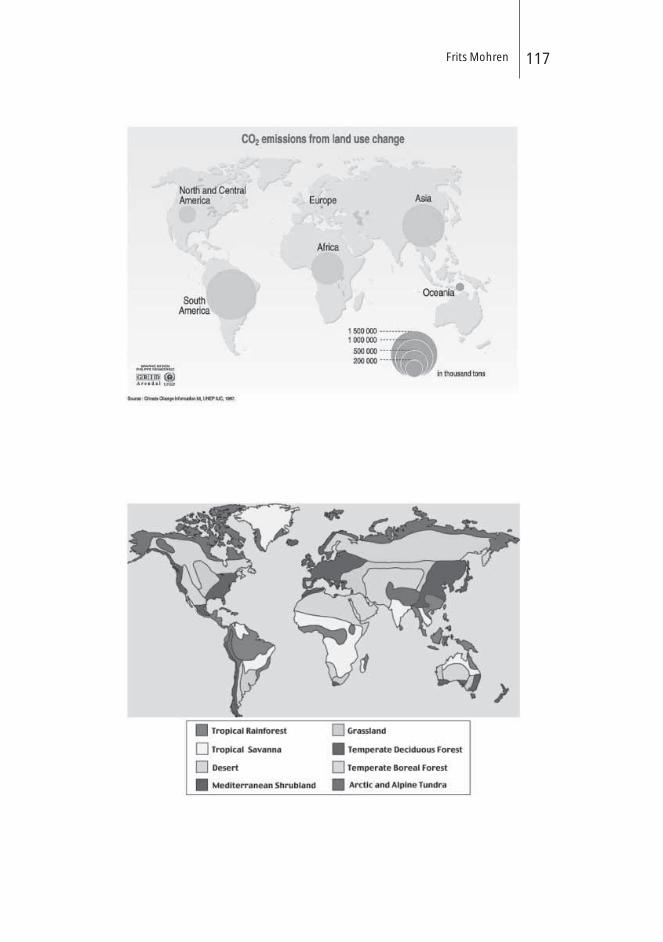
Frits Mohren 117
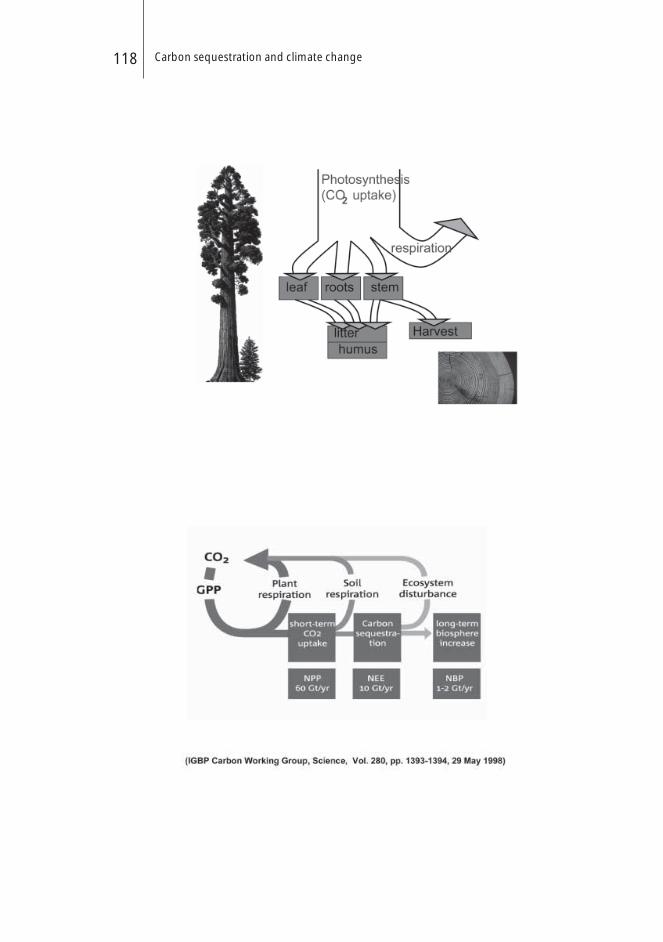
Carbon sequestration and climate change118
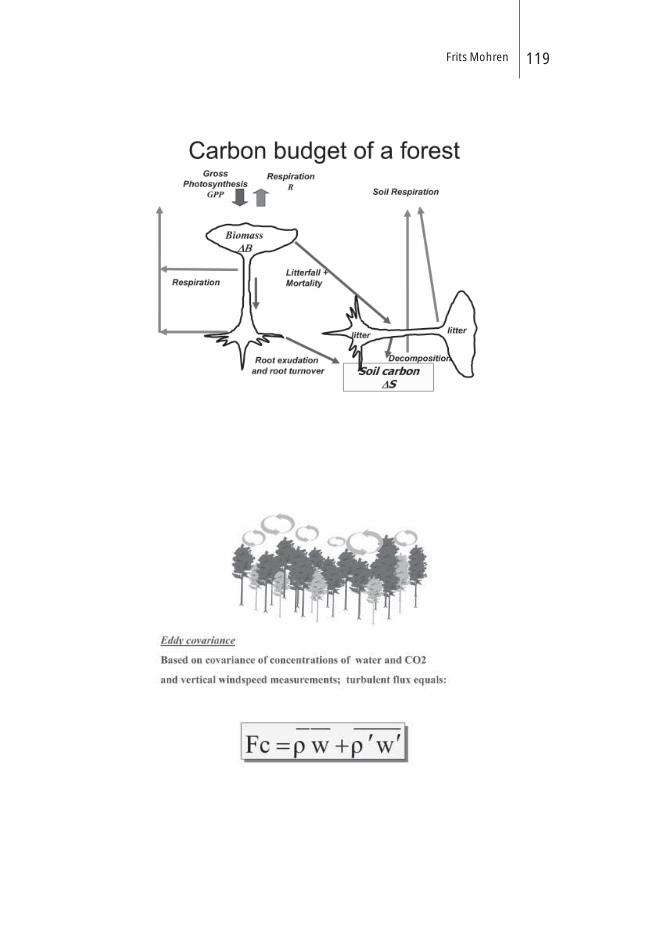
Frits Mohren 119

Carbon sequestration and climate change120
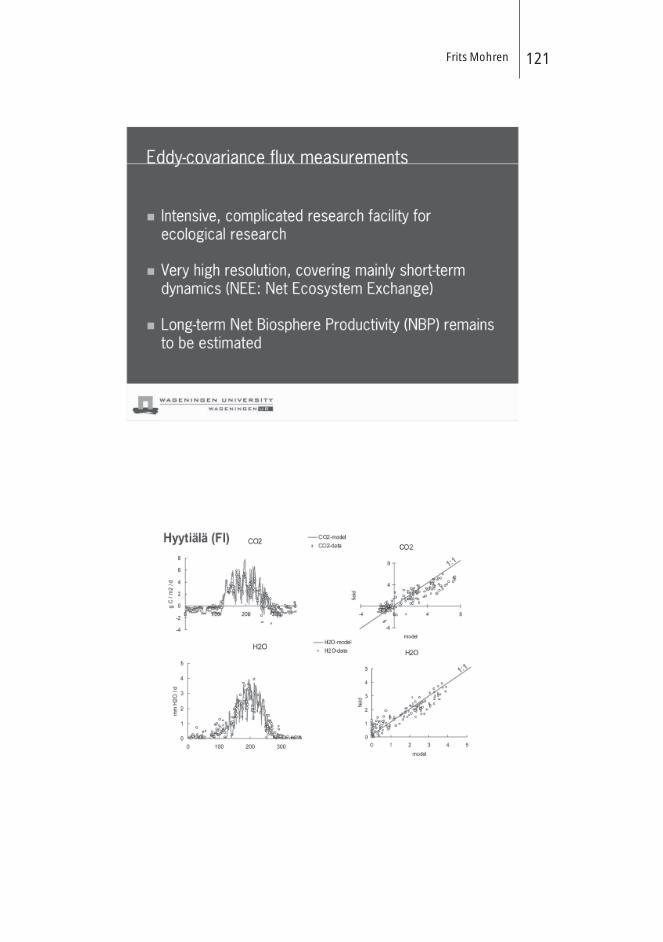
Frits Mohren 121

Carbon sequestration and climate change122

Frits Mohren 123

Carbon sequestration and climate change124
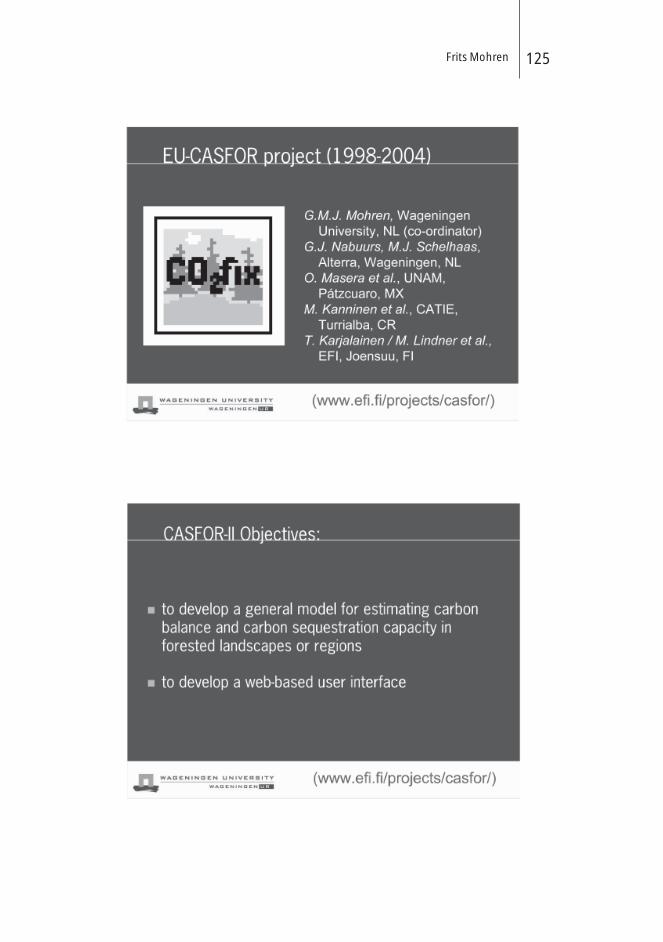
Frits Mohren 125

Carbon sequestration and climate change126

Frits Mohren 127
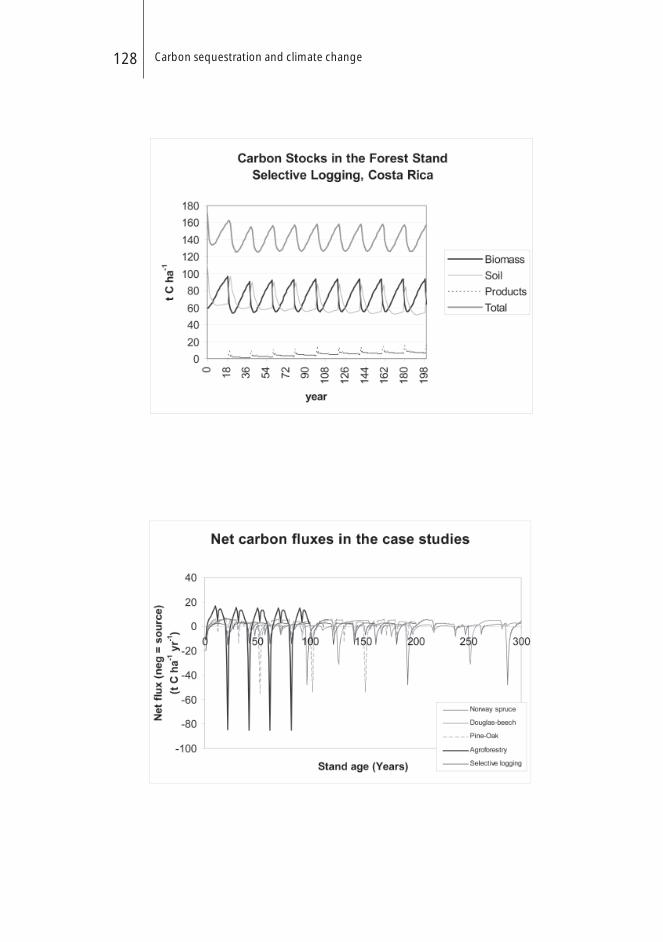
Carbon sequestration and climate change128
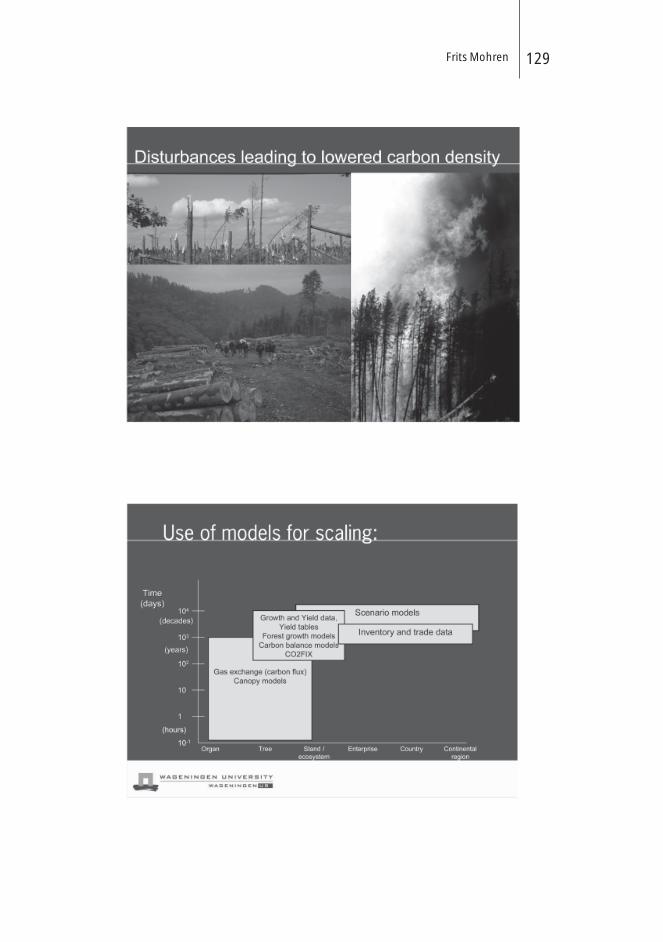
Frits Mohren 129
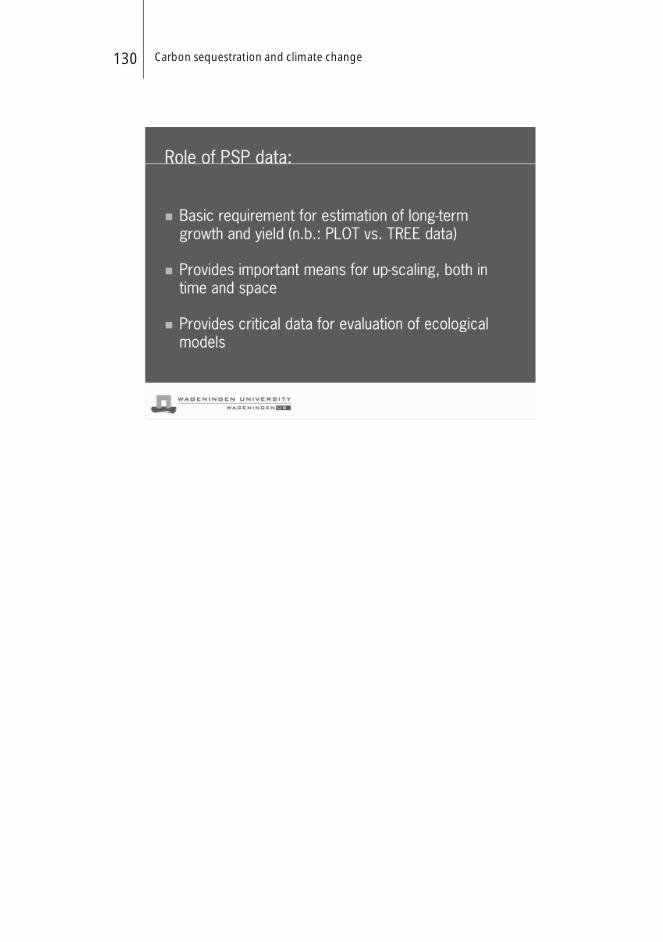
Carbon sequestration and climate change130
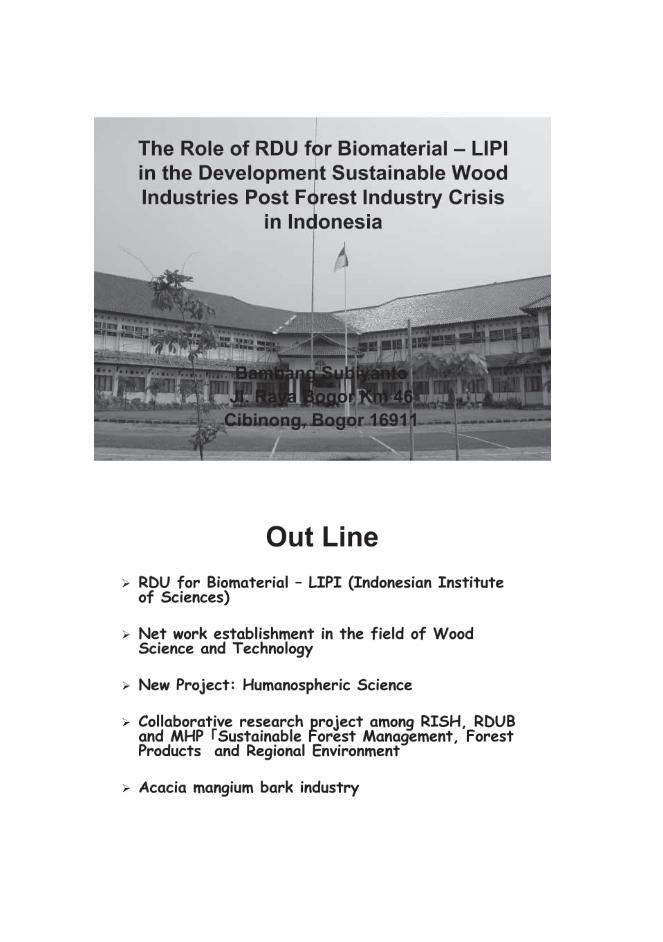

The role of RDU for biomaterial132
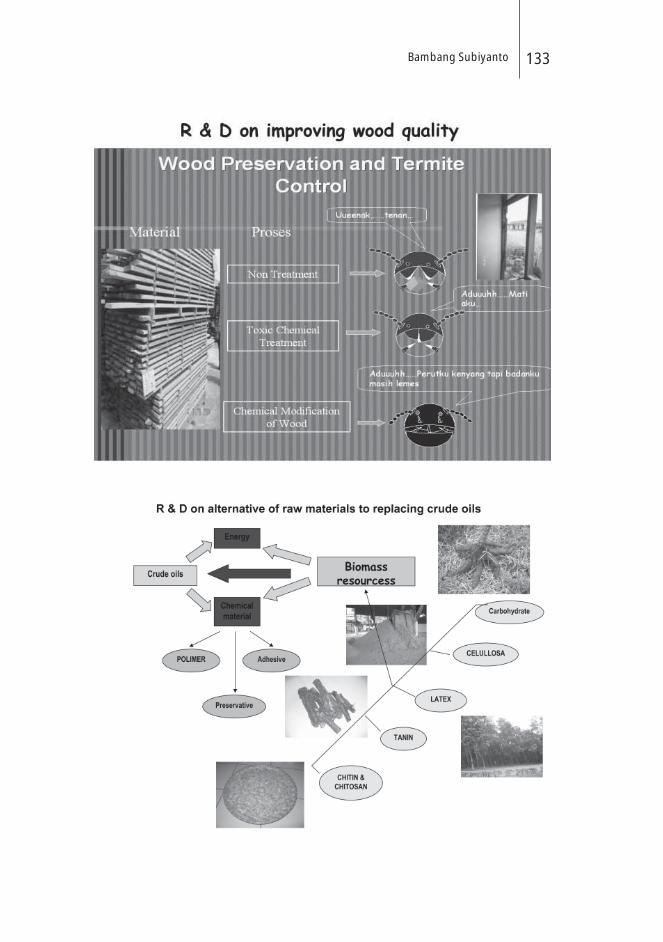
Bambang Subiyanto 133
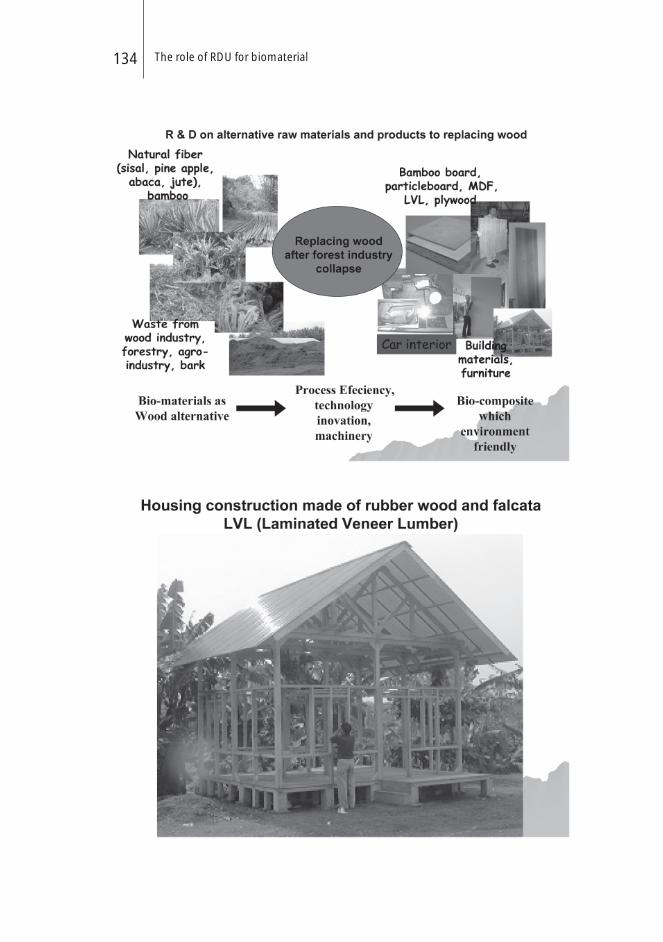
The role of RDU for biomaterial134
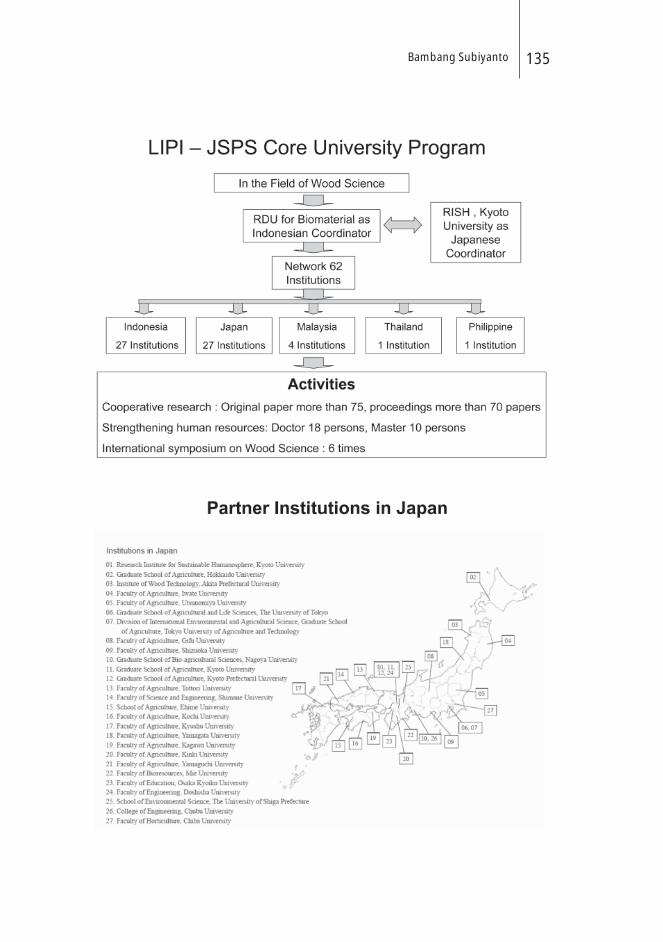
Bambang Subiyanto 135
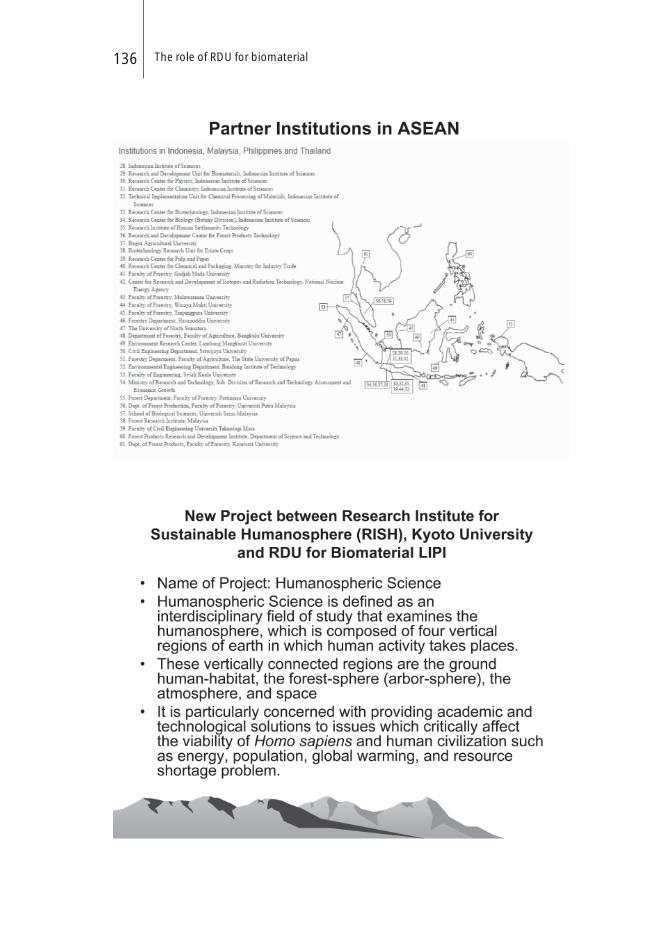
The role of RDU for biomaterial136
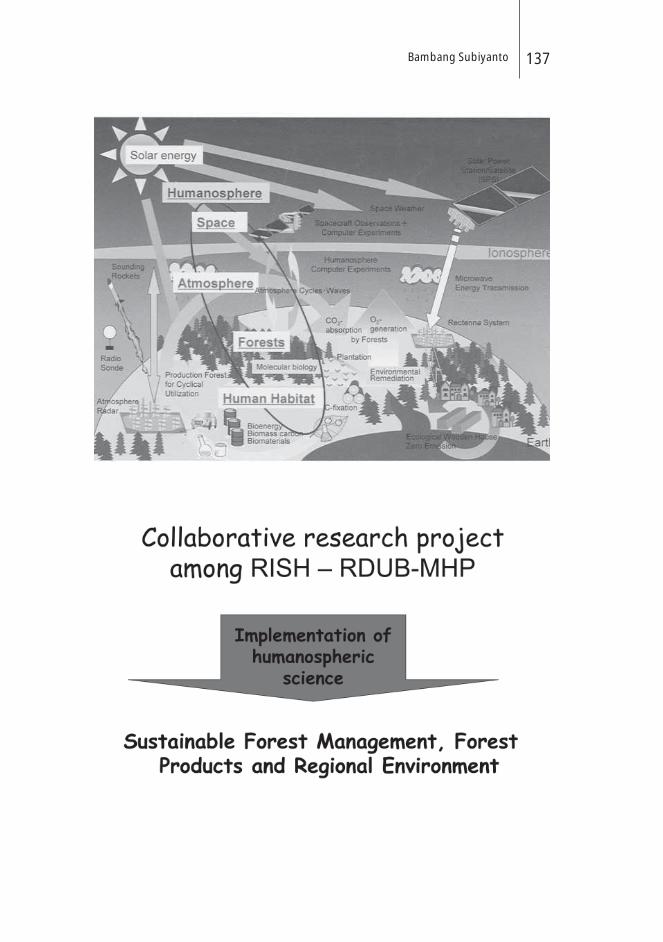
Bambang Subiyanto 137
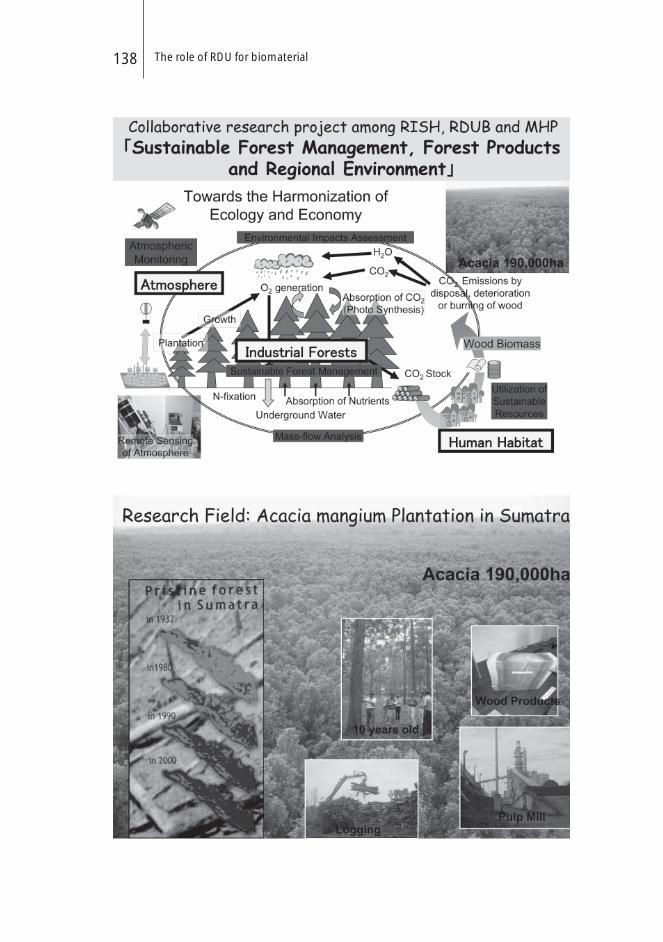
The role of RDU for biomaterial138

Bambang Subiyanto 139

The role of RDU for biomaterial140
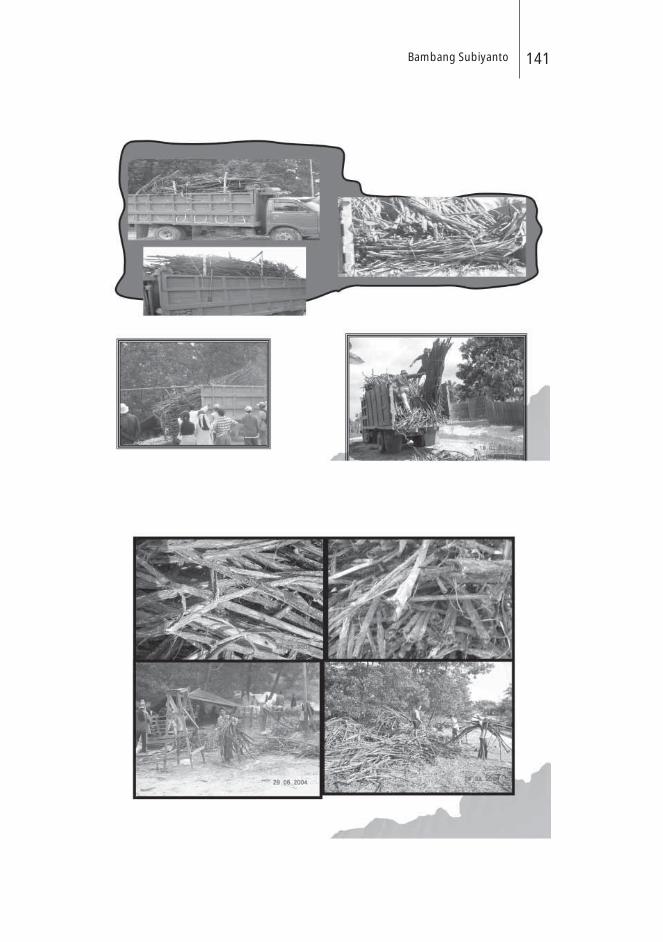
Bambang Subiyanto 141

The role of RDU for biomaterial142
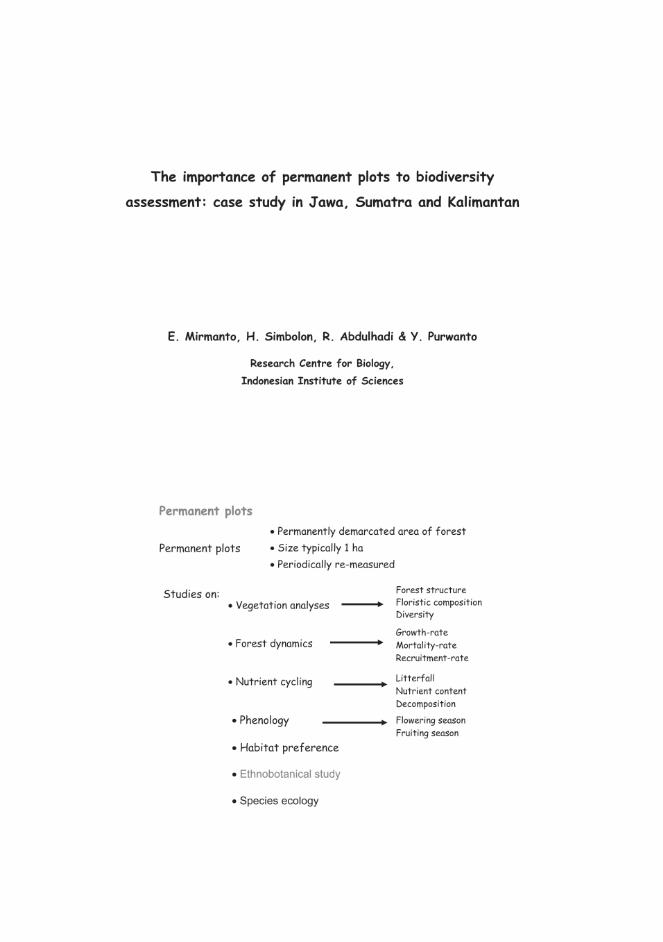
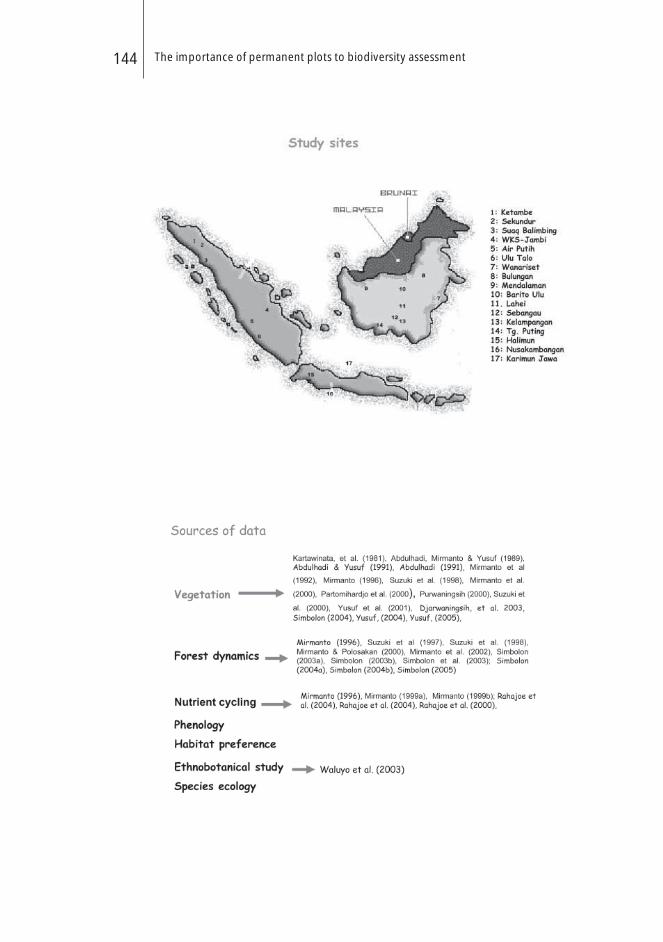
The importance of permanent plots to biodiversity assessment144
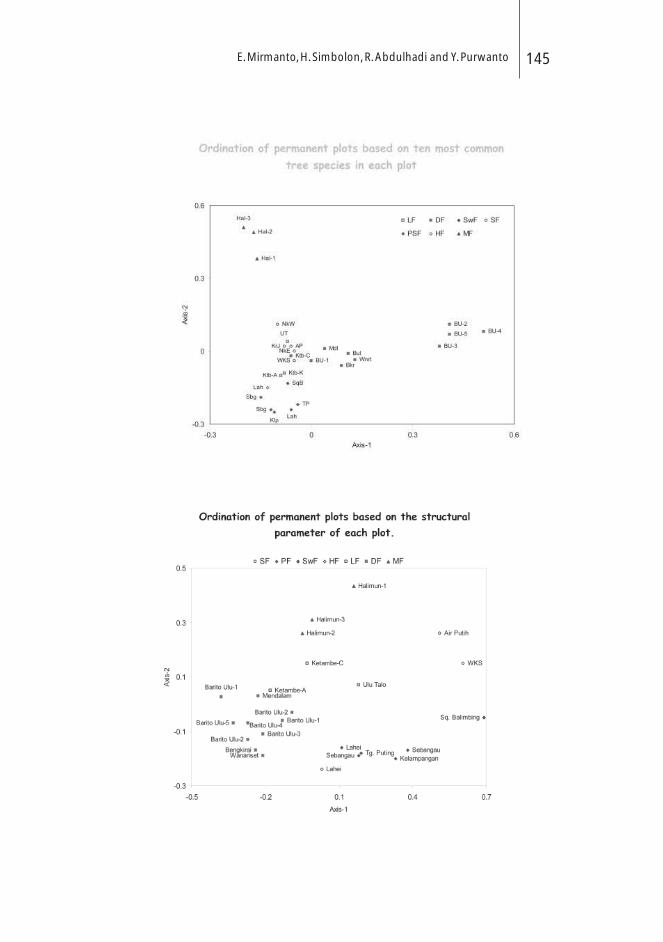
E. Mirmanto, H. Simbolon, R. Abdulhadi and Y. Purwanto 145
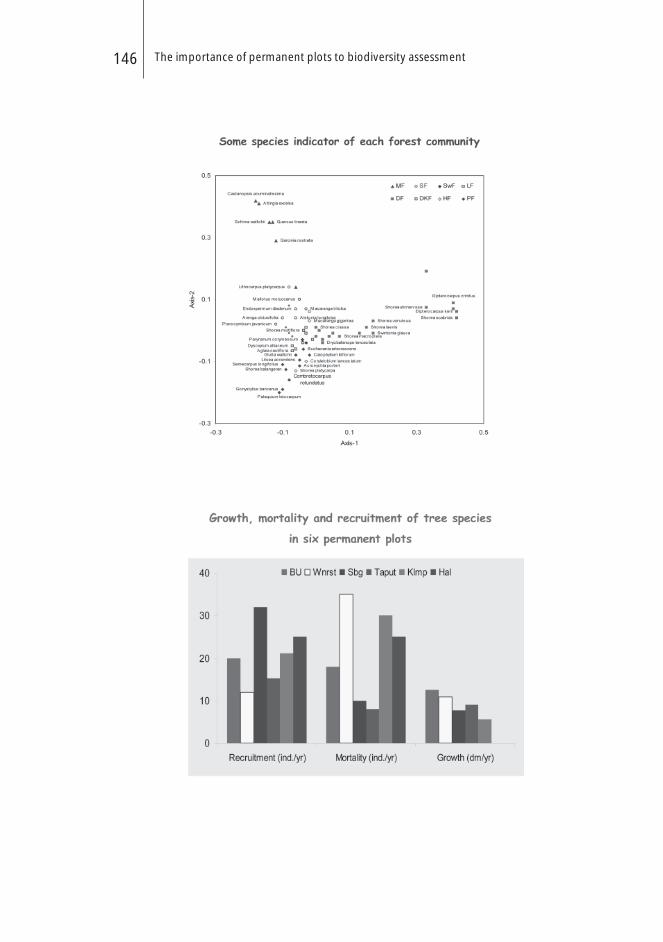
The importance of permanent plots to biodiversity assessment146
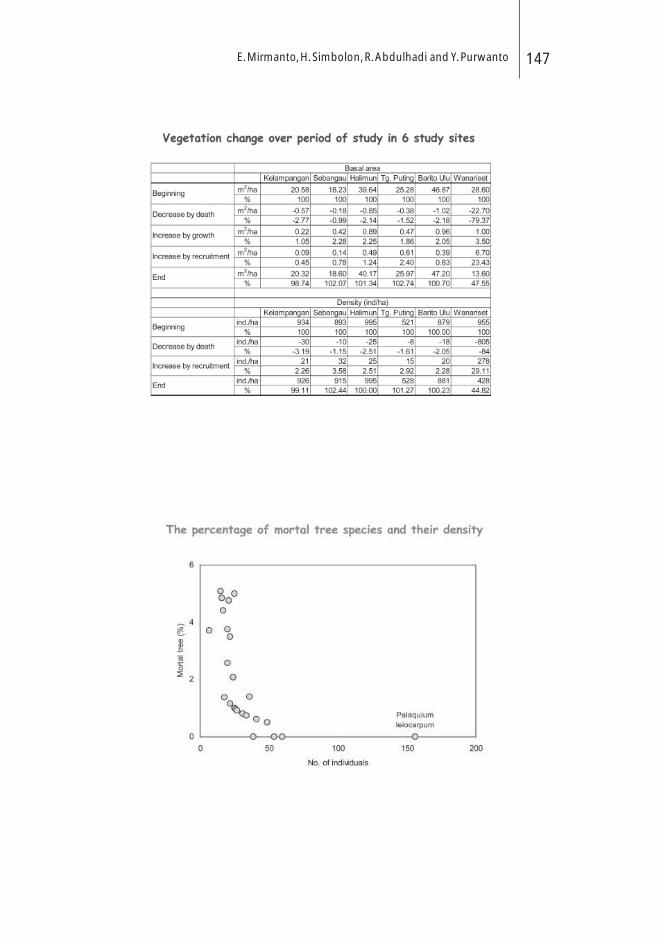
E. Mirmanto, H. Simbolon, R. Abdulhadi and Y. Purwanto 147
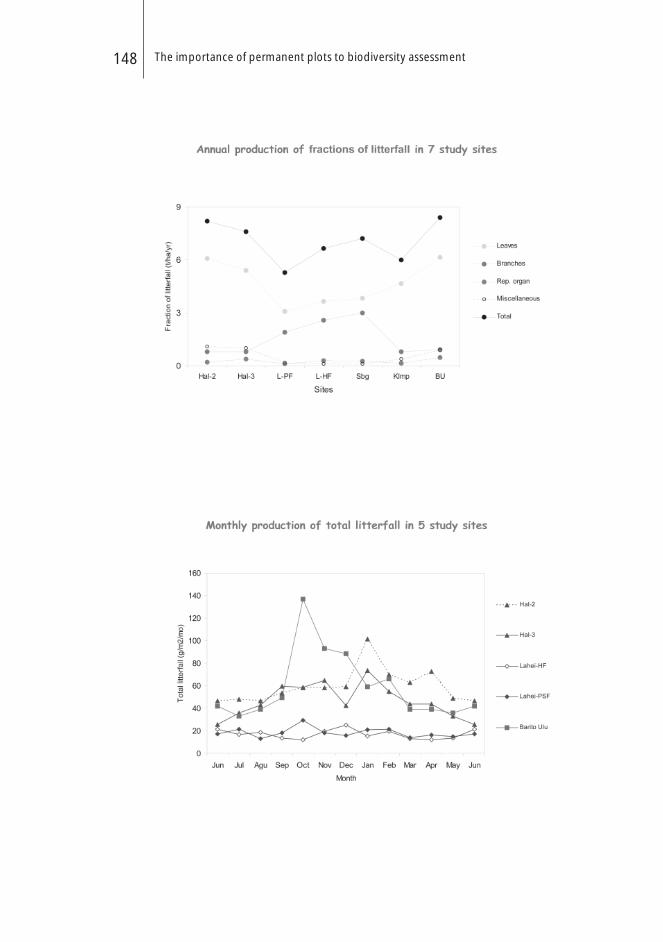
The importance of permanent plots to biodiversity assessment148

E. Mirmanto, H. Simbolon, R. Abdulhadi and Y. Purwanto 149
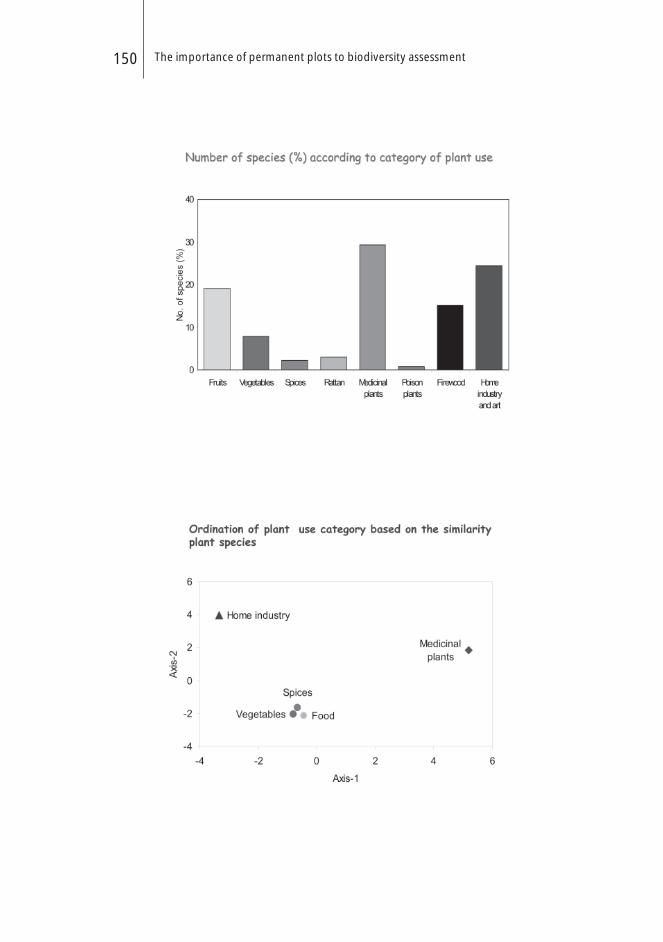
The importance of permanent plots to biodiversity assessment150

List of participantsNo Name Institution
1 Dr. Abdul Rahman Kassim(Speaker)
Forest Research Institute Malaysia (FRIM)Kepong 52109, SelangorMalaysiaPhone: +60 3 627 97179 Fax: +60 3 627 29852Email: [email protected]
2 Dr. Andry Indrawan Faculty of Forestry IPB - Bogor IndonesiaPhone: +62 251 620 280 Fax: +62 251 621256Email: [email protected] or [email protected]
3 Dr. Ir. Anita Firmanti, MT Departemen Pekerjaan UmumBadan Penelitian dan Pengembangan Pusat Penelitian dan Pengembangan PemukimanJl. Panyaungan Cileunyi WetanKabupaten Bandung 40393IndonesiaPhone: +62 22 7798393 Fax: +62 21 7798392Email: [email protected]
4 Dr. Art Klassen(Chairperson of the Session)
Tropical Forest FoundationManggala Wanabakti Bldg., Block IV, 7th Floor Jl. Jend. Gatot Subroto, JakartaIndonesiaPhone: +62 21 573 5589 Fax: +62 21 5790 2925Email: [email protected]
5 Prof. Dr. Bambang Subiyanto(Speaker)
Indonesian Institute of Sciences (LIPI)Research and Development Unit for BiomaterialsJl. Raya Bogor, Km. 46 Cibinong, Bogor 16911 IndonesiaPhone: +62 21 87914511, 87914509 Fax: +62 21 879 14510Email: [email protected] or [email protected]
6 Bambang Supriono, S.Hut Faculty of Forestry, Universitas Nusa BangsaJl. Baru, Km.4 Cimanggu, Tanah Sareal, BogorIndonesiaPhone: +62 251 340 217Fax: +62 251 505 605Email: [email protected]
List of participants152
7 Dr. Barita Manullang(Chairperson of the Session)
Conservation International IndonesiaJl. Pejaten Barat No.16 A, Kemang - Jakarta 12550IndonesiaPhone: +62 21 7883 8624 Fax: +62 21 780 6723Email: [email protected]
8 Dr. Chanhsamone Phongoudome(Speaker)
National Agriculture and Forestry Research InstituteMinistry of Agriculture and ForestryP.O.Box 7174 Dong Dok, VientianeLao PDRPhone & Fax: +856 21 770892Email: [email protected]
9 Dr. Daniel Murdiyarso(Speaker)
CIFOR - Bogor Indonesia Phone: +62 251 622 622 Ext. 424 Fax: +62 251 622 100Email: [email protected]
10 Ir. Degi Harja Asmara(Speaker)
ICRAF - Bogor IndonesiaPhone: +62 251 625 417Fax: +62 251 625 416Email: [email protected]
11 Diana Prameswari FORDA (Forestry Research Development Agency)Ministry of ForestryJln. Gunung Batu No.5 BogorIndonesiaPhone: +62 251 639191 Fax: +62 251 638 111Email: [email protected]
12 Ir. Djoko Wahyono, MSc.(Speaker)
FORDA (Forestry Research Development Agency)Ministry of Forestry Jln. Gunung Batu No.5 BogorIndonesiaPhone: +62 251 639 069 Fax: +62 251 638 111
13 Drs. Edi Mirmanto, M.Sc(Speaker)
Herbarium Bogoriense (LIPI) Jl. Ir. H. Juanda 22 BogorIndonesiaPhone: +62 251 322035 Fax: +62 251 325 854Email: [email protected]
14 Dr. Elias Faculty of Forestry, Bogor Agricultural UniversityIPB - Bogor IndonesiaPhone & Fax: +62 251 621 285Email: [email protected]
List of participants 153
15 F.X. Herwirawan BAPLANManggala Wanabakti Building, Block 7/5th FloorJl. Jend. Gatot Subroto, JakartaIndonesiaPhone: +62 21 573 5589 Fax: +62 21 5790 2925Email: [email protected]
16 Prof. Dr. Ir. G.M.J. (Frits) Mohren(Speaker)
Forest Ecology and Forest Management (FEM)Centre for Ecosystem Studies Wageningen UniversityP.O. Box 47 NL-6700 AA WageningenThe NetherlandsPhone: +31 317 47 8026 Fax: +31 317 47 8078Email: [email protected]
17 Ir. Gusti Hardiansyah, MSc, QAM(Speaker)
PT. Alas Kusuma GroupJln. Adi Sucipto, Km 5,3 Pontianak West KalimantanIndonesiaPhone: +62 561 721866 Fax: +62 561 725 028/721583Email: [email protected]
18 Dr. Hadi Pasaribu(DG Forda and Representing Minister of Forestry)
FORDA (Forestry Research Development Agency)Ministry of ForestryManggala Wanabakti Building, Block I, 11th fl oorJl. Jend. Subroto, JakartaIndonesiaPhone: +62 21 573 7945Fax: +62 21 572 0189
19 Dr. Hasim, DEA Pengelolaan Sumber Daya Alam (PSDA) WatchJl. Tulodong Bawah X No. 16Jakarta Selatan 12190Indonesia Phone & Fax: +62 21 573 8888Email: [email protected]
20 Dr. Herry Purnomo(Speaker &Facilitator of Working group)
Faculty of Forestry, Bogor Agricultural UniversityIPB - Bogor Indonesia Phone: +62 251 624 440 Fax: +62 251 621 244 and CIFOR - BogorIndonesia Phone: +62 251 622 622 Ext. 618 Fax: +62 251 622 100Email: [email protected]

List of participants154
21 Dr. Jozsef Micski GTZ-SMCPManggala Wanabakti Bldg. Block VII, 6th FloorJl. Jend. Gatot Subroto, JakartaIndonesia Phone: +62 21 572 0214 Fax: +62 21 572 0193Email: [email protected]
22 Mr. Kazuya Ando JICAJl. Gunung Batu No.5 BogorIndonesia Phone: +62 251 350 832 Fax: +62 251 350 833Email: [email protected]
23 Dr. Kuswata Kartawinata MAB UNESCO-LIPIJl. Galuh II, Kebayoran BaruJakarta SelatanIndonesia Phone: + 62 251 337 767 Fax: +62 251 382 965Email: [email protected]
24 Dr. Laxman Joshi ICRAF - Bogor IndonesiaPhone: +62 251 625 417 Fax: +62 251 625 416Email: [email protected]
25 Dr. Maman Sutisna Faculty of ForestryUniversity MulawarmanKampus Gunung Kelua Jl. Ki Hajar Dewantara, SamarindaEast KalimantanIndonesiaPhone & Fax: +62 541 749160Email: [email protected]
26 Dr. Markku Kanninen CIFOR - Bogor IndonesiaPhone: +62 251 622 622 Ext. 707 Fax: +62 251 622 100Email: [email protected]
27 Dr. Mex M. Peki(Speaker)
Natural Forest Management ProgramPNG Forest Research InstitutePO Box 314, Lae 411 MOROBE PROVINCEPapua New GuineaPhone: +675 472 4188 Fax: +675 472 6572Email: [email protected]
List of participants 155
28 M. Hesti Lestari Tata Forest and Nature Conservation Research and Development CentreFORDAJl. Gunung Batu No. 5 P.O. Box 165 Bogor 16610 IndonesiaPhone: +62 251 633234 Fax: +62 251 638111Email: [email protected] and [email protected]
29 Dr. Ombo Satjapradja Dean, Faculty of ForestryUniversitas Nusa BangsaJl. Baru, Km.4 CimangguTanah Sareal - BogorIndonesiaPhone: +62 251 340 217Fax: +62 251 505 605Email: [email protected]
30 Dr. Paian Sianturi(Chairperson of the Session and Speaker)
CIFOR BogorIndonesiaPhone: +62 251 622 622 Ext. 618 Fax: +62 251 622 100Email: [email protected]
31 Dr. Petrus Gunarso(Facilitator of Working group and Co-Speaker)
CIFOR - BogorIndonesiaPhone: +62 251 622 622 Ext. 682 Fax: +62 251 622 100Email: [email protected]
32 Phonesavanh Manivong(Speaker)
National Agriculture and Forestry Research InstituteMinistry of Agriculture and ForestryDong Dok, VientianeLao PDRPhone & Fax: + 856 21 770892Email: [email protected]
33 Dr. Pipin Permadi FORDA (Forestry Research Development Agency) Ministry of ForestryGedung Manggala WanabaktiJl. Jend. Gatot Subroto, JakartaIndonesiaPhone: +62 21 5730 397 Fax: +62 21 5720 189Email: [email protected]
34 Remco van Merm IFSOW (part of IFSA)Wageningen UniversityThe NetherlandsPhone: +31 317 421 806E-mail: [email protected]

List of participants156
35 Ir. Rinaldi(Speaker)
FORDA (Forestry Research Development Agency)Ministry of ForestryJln. Gunung Batu No.5 BogorIndonesia Phone: +62 251 639 069 Fax: +62 251 638 111Email: [email protected]
36 Dr. Subyakto Indonesian Institute of Sciences (LIPI)Research and Development Unit for BiomaterialsJl. Raya Bogor Km. 46 Cibinong, Bogor 16911 IndonesiaPhone: +62 21 87914511 Fax: +62 21 87914510Email: [email protected]
37 Prof. Dr. Sukotjo Faculty of ForestryUniversitas Gadjah MadaBulaksumur, YogyakartaIndonesiaPhone & Fax: +62 274 545 639Email: [email protected] ; [email protected] [email protected]
38 Sukaesih FORDABarito Ulu ProjectJl. Gunung Batu No. 5 BogorIndonesiaPhone: +62 251 339818
39 Ir. Sulistyo A. Siran, MSc.(Speaker)
Balai Penelitian KehutananJl. A.W. Syahrani No. 68 Sempaja, Samarinda East KalimantanIndonesiaPhone: +62 541 206 364, 203 234 Fax: +62 541 742 298Email: [email protected]
40 Dr. Ir. Suryo Hadiwinoto, M.Agr. Faculty of ForestryUniversitas Gadjah MadaBulaksumur. YogyakartaIndonesiaPhone & Fax: +62 274 550 541Email: [email protected] and [email protected]
41 Prof. Dr. Sofyan Warsito(Facilitator of Working group)
Faculty of ForestryUniversitas Gadjah Mada, Bulaksumur, Yogyakarta IndonesiaPhone & Fax: +62 274 550 543Email: [email protected]
List of participants 157
42 Dr. Sylvie Gourlet-Fleury(Speaker)
Département Forêts du CIRAD TA 10 / D Campus International de Baillarguet 34398 Montpellier Cedex 5 FrancePhone: +33 04 67 59 38 83 Fax: +33 04 67 59 37 33Email: sylvie.gourlet-fl [email protected]
43 Tanaka Satomi Demonstration Study on Carbon Fixing Forest ManagementJICA -FNCRDCJl. Gunung Batu No. 5 BogorIndonesiaPhone: +62 251 350832 Fax: +62 251 350 833 HP: 0815 840 73315 E-mail: [email protected]
44 Ir. Tatang Tiryana Lab. Biometrika Hutan - IPBKampus Darmaga BogorIndonesiaPhone: +62 251 624 440 Fax: +62 251 621 244
45 Teddy Ruslono Lab. Biometrika Hutan - IPBKampus Darmaga BogorIndonesiaPhone: +62 251 624 440 Fax: +62 251 621 244
46 Ir. Ujang Suwarna, MSc Faculty of ForestryIPB - BogorIndonesia Phone: +62 251 624 440Fax: +62 251 621 244
47 Dr. Upik Rosalina(Chairperson of the Session)
Faculty of ForestryInstitut Pertanian BogorBogorIndonesia
48 Dr. Wahyu Dwianto Indonesian Institute of Sciences (LIPI)Gedung Sasana Widya SarwonoJl. Jenderal Gatot Subroto Jakarta 12170IndonesiaPhone: +62 21 522 5711
49 Ir. Zakaria Ahmad CIFOR - Bogor Indonesia Phone: +62 251 622 622 Fax: +62 251 622 100Email: [email protected]

List of participants158
50 Dr. Meine Van Nordwidjk ICRAF - BogorIndonesiaPhone: +62 251 625 417 Fax: +62 251 625 416E-mail: [email protected]

Workshop agendaDay 1. Wednesday, 3 August 200508.00 am Arrival of Participants
09.00 am Opening Remarks by Dr. Petrus Gunarso, Coordinator Malinau Research Forest, CIFOR
09.10 am Welcoming Address by Dr. Markku Kanninen, Director Environmental Services andSustainable Use of Forests, CIFOR
09.20 am Keynote Speech by Indonesian Ministry of Forestry HE. MS. Kaban and Launching Offi ciation
09.30 am Coffee break and Exhibition (Posters Session)
Session 1: Overview of Sustainable Forest Management
Chair person 1: Mr. Arthur Klassen (Tropical Forest Foundation)
10.15 am Presentation 1: An Overview on Sustainable Forest Management in Peninsular Malaysia by Dr. Abd. Rahman Kassim
10.35 am Presentation 2. Making Sustainability Work for Complex Forests: Towards Adaptive Forest Yield Regulation By Dr. Herry Purnomo
10.55 am Presentation 3 :A brief note on TPTJ (Modifi ed Indonesia Selective Cutting System) from experience of PT Sari Bumi Kusuma (PT SBK) timber concessionaire by Ir. Gusti Hardiyansah MSc
11.15 am Presentation 4: Determination of sustainable forest management in Indonesia: a simulation study by Dr. Paian Sianturi
11.35 am Question and Answer
12.15 pm Lunch
Session 2: Permanent sample plots and the study on Growth and yield
Chair person 2: Dr. Barita Manulang (Conservation International-Indonesia)
13.15 pm Presentation 1: Contribution of permanent sample plots to the sustainable management of tropical forests: what rules to warrant the long-term recovery of timber-logged species?Elements from STREK, Bulungan (Indonesia), Paracou (French Guiana) and Mbaïki (Republic of Central Africa) by Dr. Sylvie Gourlet-Fleury
13.35 pm Presentation 2: Tree Growth and Forest Regeneration under Different Logging Treatments in Permanent Sample Plots of a Hill Mixed Dipterocarps Forest, Malinau Research Forest, Indonesia by Ir. Hari Priyadi, MSc

Workshop agenda160
13.55 pm Presentation 3: Progress on the studies of growth of logged-over natural forests in Papua New Guinea by Mex M. Peki
14.15 pm Presentation 4:The Utilization of growth and yield data to support of sustainable forest management in Indonesia by Ir. Joko Wahyono, MSc, Ir. Rinaldi
14.35 pm QA
15.15 pm Coffee break
Session 3: The Importance of Permanent Sample Plots
Chairperson 3 Dr. Paian Sianturi
15.30 pm Presentation 1: The importance of permanent sample plots for biodiversity Assessment: Case study for Java, Kalimantan and Sumatera By Drs. Edi Mirmanto
15.45 pm Presentation 2: The Role of RDU for Biomaterial – LIPI in the Development Sustainable Wood Industries Post Forest Industry Crisis in Indonesia by Dr. Bambang Subyanto
16.00 pm Presentation 3: Permanent sample plots in damar and rubber agroforests of Sumatra and use of the data for the spatially explicit individual based forest simulator (SExI-FS) by Degi Hardja, Gregoir Vincent and Laxman Joshi
16.15 pm Presentation 4: Current Status of Permanent Sample Plots in Lao PDR by Mr Chansamone and Mr. Phonesavan
16.30 pm Presentation 5: The importance of STREK Plots in contributing Sustainable Forest Management in Indonesia By Ir. Sulistyo A Siran, MSc
16.45 pm QA
18.00 pm Welcoming dinner

Workshop agenda 161
Day 2. Thursday, 4 August 2005Session 4 : Carbon Sequestration and Climate Change
Chairperson 4: Dr. Upik Rosalina
08.45 am Presentation 1: Carbon Sequestration and Climate Change by Prof. Dr. Frits Mohren
09.10 am Presentation 2: The importance of Permanent Sample Plot Network for Climate Change Projects By Prof. Dr. Daniel Murdiyarso
09.30 am QA
10.30 am Coffee Break
Working Group
10.30 am Briefi ng for Working Group: Dr. Petrus Gunarso
WG 1: Data sharing from different sites (Facilitated by Dr. Herry Purnomo)
WG 2: Developing a Network of PSPs (Facilitated by Dr. Petrus Gunarso)
WG 3: Recommendation of silvicultural changes (Facilitated by Dr. Sofyan Warsito)
12.30 pm Lunch
Plenary and Closing Remarks
14.00 pm Working Group Report: Dr. Sofyan Warsito
14.30 pm Closing Remarks: Dr. Petrus Gunarso
Day 3. Friday, 5 August 2005Visit to Bogor Botanical Garden
Organizing committee of the workshopNo. Name Institutions
1 Dr. Markku Kanninen(Advisor)
CIFORBogor – IndonesiaPhone: +62 251 622 622 Ext. 707 Fax: +62 251 622 100Email: [email protected]
2 Dr. Petrus Gunarso( Chairman)
CIFORBogor – IndonesiaPhone: +62 251 622 622 Ext. 682Fax: +62 251 622 100Email: [email protected]
3 Ir. Hari Priyadi, MSc(Coordinator)
CIFORBogor – IndonesiaPhone: +62 251 622 622 Ext. 307Fax: +62 251 622 100Email: [email protected]
4 Ir. Happy Taruma Devyanto(Facilitator)
INRR – JakartaIndonesiaPhone: +62 21 703 84432 Fax: +62 21 579 51 503Email: [email protected]
5 Kresno D. Santosa, MSi(Logistic)
CIFORBogor – IndonesiaPhone: +62 251 622 622 Ext. 209Fax: +62 251 622 100Email: [email protected]
6 Ir. Haris Iskandar (Documentation)
CIFORBogor – IndonesiaPhone: +62 251 622 622 Ext.217Fax: +62 251 622 100Email: [email protected]
7 Nani Djoko(Secretariat)
CIFORBogor – IndonesiaPhone: +62 251 622 622 Ext. 200Fax: +62 251 622 100Email: [email protected]
8 Ketty Kustiawati(Secretariat)
CIFORBogor – IndonesiaPhone: +62 251 622 622 Ext. 708Fax: +62 251 622 100Email: [email protected]
9 Lia Wan(Facility Offi cer)
CIFORBogor – IndonesiaPhone: +62 251 622 622 Fax: +62 251 622 100Email: [email protected]

Pictures
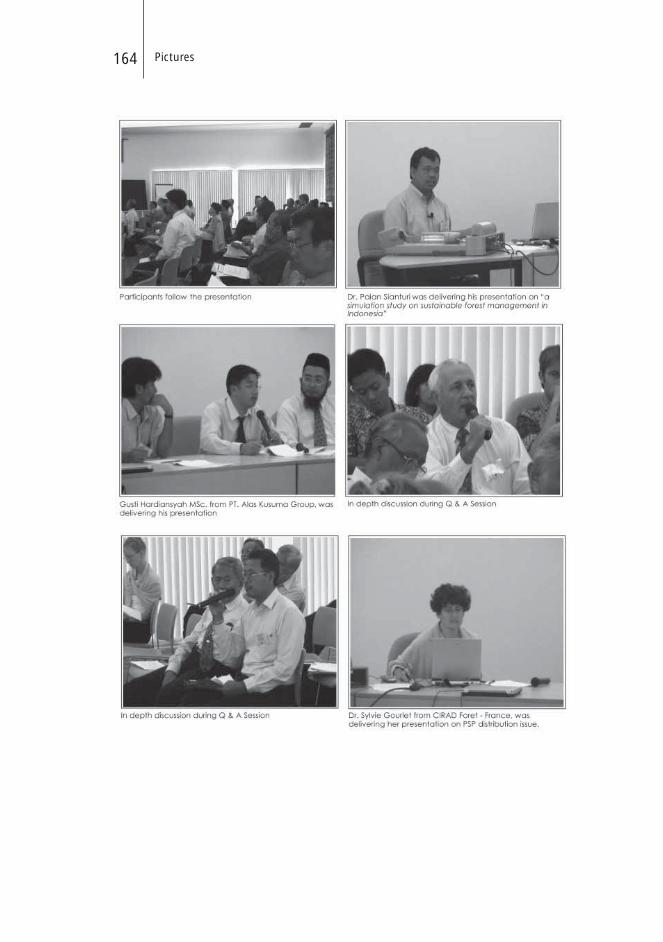
Pictures164
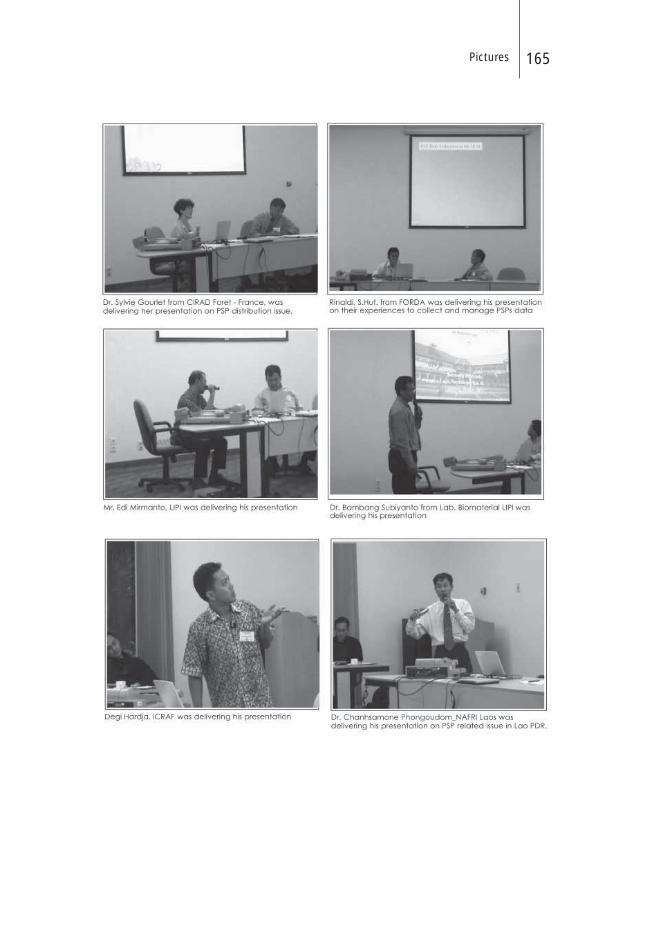
Pictures 165

Pictures166

Pictures 167

Pictures168

Pictures 169
The Center for International Forestry Research (CIFOR) is a leading international forestry research organization established in 1993 in response to global concerns about the social, environmental, and economic consequences of forest loss and degradation. CIFOR is dedicated to developing policies and technologies for sustainable use and management of forests, and for enhancing the well-being of people in developing countries who rely on tropical forests for their livelihoods. CIFOR is one of the 15 Future Harvest centres of the Consultative Group on International Agricultural Research (CGIAR). With headquarters in Bogor, Indonesia, CIFOR has regional offices in Brazil, Burkina Faso, Cameroon and Zimbabwe, and it works in over 30 other countries around the world.
DonorsThe Center for International Forestry Research (CIFOR) receives its major funding from governments, international development organizations, private foundations and regional organizations. In 2005, CIFOR received financial support from Australia, Asian Development Bank (ADB), Belgium, Brazil, Canada, China, Centre de coopération internationale en recherche agronomique pour le développement (CIRAD), Cordaid, Conservation International Foundation (CIF), European Commission, Finland, Food and Agriculture Organization of the United Nations (FAO), Ford Foundation, France, German Agency for Technical Cooperation (GTZ), German Federal Ministry for Economic Cooperation and Development (BMZ), Indonesia, International Development Research Centre (IDRC), International Fund for Agricultural Development (IFAD), International Tropical Timber Organization (ITTO), Israel, Italy, The World Conservation Union (IUCN), Japan, Korea, Netherlands, Norway, Netherlands Development Organization, Overseas Development Institute (ODI), Peruvian Secretariat for International Cooperation (RSCI), Philippines, Spain, Sweden, Swedish University of Agricultural Sciences (SLU), Switzerland, Swiss Agency for the Environment, Forests and Landscape, The Overbrook Foundation, The Nature Conservancy (TNC), Tropical Forest Foundation, Tropenbos International, United States, United Kingdom, United Nations Environment Programme (UNEP), World Bank, World Resources Institute (WRI) and World Wide Fund for Nature (WWF).
More than just forest data
Editors: Hari Priyadi, Petrus Gunarso and Markku Kanninen
Proceedings of International Workshop on Promoting Permanent Sample Plots in Asia and the Pacific RegionBogor, Indonesia, 3-5 August 2005
PERMANENT SAMPLE PLOTS
Mo
re than
just fo
rest data
PER
MA
NEN
T SAM
PLE P
LOTS
Edito
rs: Hari Priyad
i, Petrus G
un
arso an
d M
arkku K
ann
inen
Permanent Sample Plots (PSP) are an important tool to monitor forest dynamics and changes, long term growth and yield and to provide critical data for evaluation of ecological models. For silvicultural purposes PSP supply data on diameter and volume increment as well as stand structure dynamics. This data is very useful for calculating Annual Allowable Cut (AAC) in a forest management unit. In addition, there has been increasing demand for data and information collected from PSP for accounting purposes in carbon-sequestration projects; the use of long-term measurements provided by PSP would increase the profile and credibility of such projects.
PSP will become more important in the future. They will likely be used in measures to indicate forest health, for instance, and those related to the services provided by forests, such as the provision of water and carbon storage. One of the reasons for convening the workshop was to strengthen collaboration between institutions already working with PSP with the aim of building a network in Southeast Asia and beyond.
Foreword by H.M.S. Kaban (Minister of Forestry, Republic of Indonesia)