permanent capital solutions for investment managers fileactual results could differ materi ally from...
TRANSCRIPT

Permanent Capital Solutions for Investment Managers
999 18th Street, Suite 3000 535 Madison Avenue, 19th Floor
Denver, Colorado 80202 New York, New York 10022
T: (303) 357-4802 T: (212) 688-2341
F (303) 893 2902 F (212) 688 2343F: (303) 893-2902 F: (212) 688-2343
www.highburyfinancial.com
Forward-Looking Statement
Th f ll i lid h f i h d h S i i d E h C i i (SEC) f C R F 8 K fil d bThe following slide show was furnished to the Securities and Exchange Commission (SEC) as part of a Current Report on Form 8-K filed by Highbury Financial Inc. (Highbury) with the SEC on August 11, 2009.
This presentation contains forward-looking statements within the meaning of the Private Securities Litigation Reform Act, with respect to Highbury’s and Aston Asset Management LLC’s (Aston) future financial or business performance, strategies and expectations. Forward-looking statements are typically identified by words or phrases such as “trend,” “potential,” “opportunity,” “pipeline,” “believe,” “comfortable,” “expect,” “anticipate,” “current,” “intention,” “estimate,” “position,” “assume,” “outlook,” “continue,” “remain,” “maintain,” “sustain,” “seek,” “achieve,” and similar expressions, or future or conditional verbs such as “will,” “would,” “should,” “could,” “may” and similar expressions.similar expressions, or future or conditional verbs such as will, would, should, could, may and similar expressions.
Highbury cautions that forward-looking statements are subject to numerous assumptions, risks and uncertainties, which change over time. Forward-looking statements speak only as of the date they are made, and Highbury assumes no duty to and does not undertake to update forward-looking statements. Actual results could differ materially from those anticipated in forward-looking statements and future results could differ materially from historical performance.
In addition to factors previously disclosed in Highbury's SEC filings and those identified elsewhere in this press release, the following factors, among others, could cause actual results to differ materially from forward-looking statements or historical performance: (1) the impact ofamong others, could cause actual results to differ materially from forward looking statements or historical performance: (1) the impact of legislative and regulatory actions and reforms and regulatory, supervisory or enforcement actions of government agencies; (2) changes in political, economic or industry conditions, the interest rate environment or financial and capital markets, which could result in changes in demand for products or services or in the value of assets under management; (3) terrorist activities and international hostilities, which may adversely affect the general economy, financial and capital markets, specific industries, and Highbury; (4) changing conditions in global financial markets generally and in the equity markets particularly, and decline or lack of sustained growth in these markets; (5) Highbury's business strategy and plans; (6) the introduction, withdrawal, success and timing of business initiatives and strategies; (7) the unfavorable resolution of legal proceedings and/or harm to Highbury's reputation; (8) fluctuations in customer demand; (9) management of rapid growth; (10) the impact of fund p g g y p ; ( ) ; ( ) g p g ; ( ) pperformance on redemptions; (11) changes in investors' preference of investing styles; (12) changes in or loss of sub-advisers; (13) the impact of increased competition; (14) the results of future financing efforts; (15) the impact of future acquisitions or divestitures; (16) the relative and absolute investment performance of Highbury's investment products; (17) investment advisory agreements subject to termination or non-renewal; (18) a substantial reduction in fees received from third parties; (19) Highbury's success in finding or acquiring additional investment management firms on favorable terms and consummating acquisitions of investment management firms; (20) the ability to retain major clients; (21) the ability to attract and retain highly talented professionals; (22) significant limitations or failure of software applications; (23) expenses subject to significant fluctuations; (24) the impact, extent and timing of technological changes and the adequacy of intellectual property protection; (25) the impact of capital improvement projects; (26) the extent and timing of any share repurchases; (27) the impact of changes to tax legislation and, generally, the tax position of Highbury; and (28) expenses associated with the formation of the Special Committee and responding to initiatives of dissident stockholders.
Highbury's filings with the SEC, accessible on the SEC's website at http://www.sec.gov, discuss these factors in more detail and identify additional factors that can affect forward-looking statements.
1

Overview of Highbury Financial Inc.
• Publicly traded investment management holding company with $5.1 billion of AUM as of June 30, 2009
• Objective is to partner with dynamic, accomplished firms seeking long-term growth
– Provide permanent capital solutions to owners of investment management firms
– Diversify by asset class, investment style, distribution channel, client type and management team
• Access to proprietary mutual fund sales marketing operations compliance finance andAccess to proprietary mutual fund sales, marketing, operations, compliance, finance and administration resources of Aston Asset Management LLC
– 17 wholesalers, over 400 selling agreements
– Co-branded, sub-advised model
• Access to Berkshire Capital’s proprietary deal flow, strategic guidance and extensive network of contacts throughout the U.S. and Europe
2

Financial Highlights
Three Months Ended Six Months Ended(all data in millions, except per share amounts or as otherwise indicated) June 30, June 30,
2008 2009 2008 2009
Operating ResultsRevenue $9 7 $9 2 $19 0 $16 3Revenue $9.7 $9.2 $19.0 $16.3Net income attributable to Highbury Financial Inc. 0.9 0.7 1.5 1.1EBITDA * 1.5 1.2 2.5 1.8Cash Net Income * 1.2 1.0 2.1 1.6
Average shares outstanding - diluted 9.1 9.1 9.2 9.1Earnings per share - diluted $0.10 $0.08 $0.17 $0.12Earnings per share diluted $0.10 $0.08 $0.17 $0.12Cash Net Income per share - diluted * 0.13 0.11 0.23 0.18
Balance Sheet DataCash and equivalents and investments $14.4 $15.4 $14.4 $15.4Total assets 45.7 46.6 45.7 46.6Total liabilities 4.2 5.1 4.2 5.1Highbury Financial Inc. stockholders' equity 40.7 40.7 40.7 40.7
Assets Under ManagementTotal assets - EOP (in billions) $4.8 $5.1 $4.8 $5.1
Mutual fund assets - BOP (in billions) $4.5 $3.8 $5.0 $3.4( )Net client inflows (outflows) (0.0) 0.5 (0.0) 1.1Market appreciation and other changes 0.2 0.6 (0.3) 0.4
Mutual fund assets - EOP $4.7 $4.9 $4.7 $4.9
Separate account assets - EOP (in millions) $167 $132 $167 $132
3
* Note: Definitions for these metrics are provided on pages 33-36.

Strong Core Shareholder Group
• Management Founders (21.6% of common stock)
– 10 employees of Berkshire Capital, the leading merger and acquisition advisor to the investment management industry
Caledonia Investments plc a UK investment trust controlled by the Cayzer family with market– Caledonia Investments plc, a UK investment trust controlled by the Cayzer family with market capitalization of US$1.5 billion as of June 30, 2009
• Major Investors– Fairview Capital Investment Management, LLC– Healey Development, LLC– North Star Investment Management Corp.– Peerless Systems Corporation– Pine River Capital Management L.P.– Second Curve Capital, LLC– Talon Asset Management, LLC– Woodbourne Partners, L.P.
4

Directors and Officers
Background Transactions Experience Education
R. Bruce Cameron, CFA President & Co- 236 transactions 26 yrs Berkshire Harvard MBAChairman Founder, Berkshire $10.4 billion value 31 yrs total Trinity BA
Richard S. Foote, CFAPresident, CEO & Director
Managing Director, Berkshire
30 transactions$2.2 billion value
15 yrs Berkshire24 yrs total
Harvard BA
R Bradley Forth CFA Vice President 19 transactions 8 yrs Berkshire Duke BS & BAR. Bradley Forth, CFAEVP & CFO
Vice President, Berkshire
19 transactions$1.3 billion value
8 yrs Berkshire8 yrs total
Duke BS & BA
Aidan J. RiordanDirector
Partner, Calvert Street Capital
Partners
$1.3 billion total$500 million CSCP
6 yrs CSCP15 yrs total
Columbia MBAPennsylvania BA
Hoyt Ammidon Jr.Director
Advisory Director, Berkshire
Many at Berkshire, Cazenove, Chase,
E.F. Hutton & Morgan Stanley
15 yrs Berkshire42 yrs total
Yale BA
Theodore M. Leary Jr.Director
President, Crosswater Realty
Advisors
231 transactions$7.8 billion value
4 yrs Crosswater34 yrs total
George Washington JDHarvard BA
5
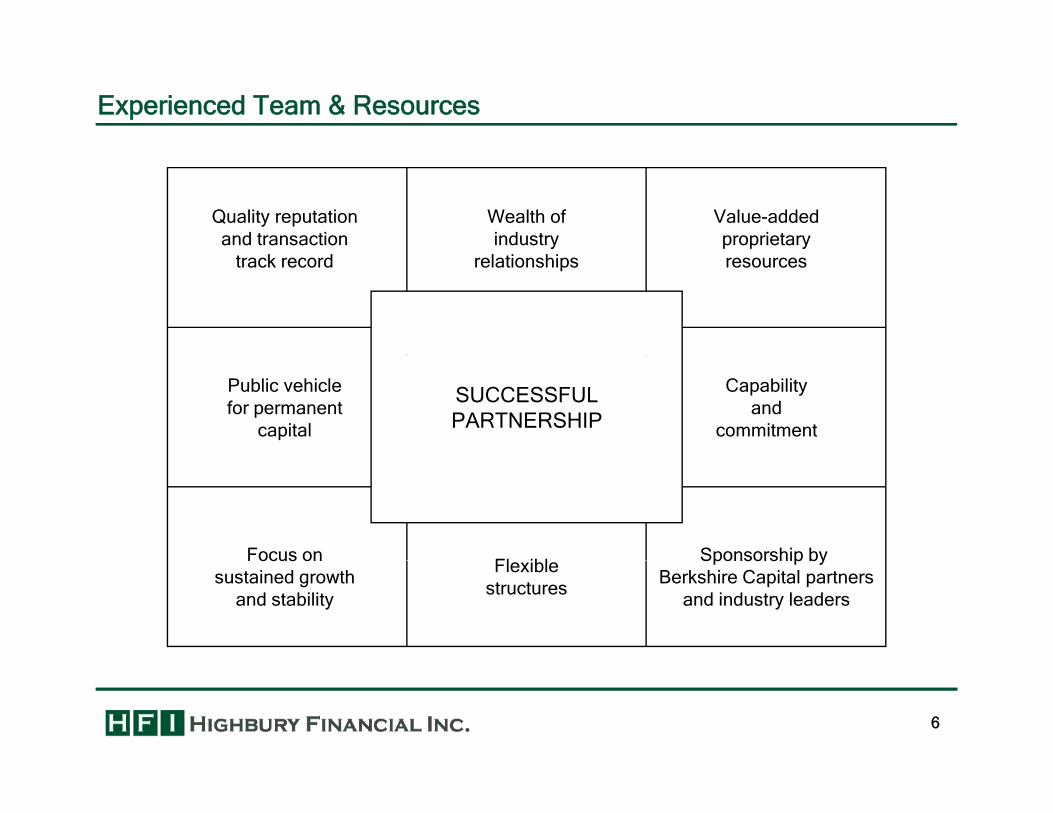
Experienced Team & Resources
Quality reputationand transaction
Wealth ofindustry
Value-addedproprietary
track record relationships resources
Public vehiclefor permanent
capital
Capabilityand
commitment
SUCCESSFULPARTNERSHIP
Sponsorship byFl ibl
Focus on Sponsorship by Berkshire Capital partners
and industry leaders
Flexiblestructures
Focus onsustained growth
and stability
6

Business Strategy Highlights
• Acquire majority equity positions in investment management firms with significant growth potential
• Partner with superior management teams
– Corporate divestitures
– Management buyouts
– Liquidity to unwind strategic joint ventures
– Liquidity for departing individual partners
– Diversification for founders and transition to next generation– Diversification for founders and transition to next generation
– Exit strategies for private equity funds
• Affiliates to operate independently
– Highbury not active in day-to-day management
– Retained ownership interest by affiliate management aligns interests with Highbury’s shareholders
• Seek diversified affiliates to provide growth potential with reduced downside risk
7

Investment Management Firms Provide Attractive Economics to Owners
8

Variety of Target Types
9

Robust Deal Flow Within Investment Management Industry
$60
Total Transaction Value ($B)
250
Number of Transactions
$36
$47
$37$40
126 130143 135 132 136
167
204 199
150
200
$17 $16$10 $9 $9
$16 $16$19$20
103126
74
50
100
$099 00 01 02 03 04 05 06 07 08 6m
09
099 00 01 02 03 04 05 06 07 08 6m
09
10
Source: Berkshire Capital Securities LLC

Partnership Criteria
Management integrity, character and ethics
Shared goals, values and alignment of interests
Team and/or successors committed for 7 years or more
Sustainable revenue growth of 10% or more
Operating leverage from fixed cost base
Pre-tax profits of $5 - $40 million
Founder diversificationPartner buyout
MBO
SUCCESSFUL BUSINESS COMBINATION
11
Compelling Opportunity for Investment Managers
• Structuring flexibility to preserve current value and maximize potential
– Highbury able to negotiate and execute transaction efficiently to minimize risk
– No integration (unlike strategic sale)
f– No interference with day-to-day management
• Permanent capital solution
– No future liquidity event or exit strategy required (unlike private equity sources)
– Ongoing value creation for management through equity ownership– Ongoing value creation for management through equity ownership
– Equity recycling to next generation of management to ensure long-term stability and growth
– Joint ownership by Highbury and management provides alignment of interests
• Ongoing strategic input from Highbury and Aston
– Access to proprietary mutual fund sales, marketing, operations, compliance, finance and administrative resources (17 wholesalers, over 400 selling agreements)
– Introductions to new business opportunities
– Industry insights and professional relationshipsy g p p
– Employee compensation, incentive, retention and succession structures
– Marketing, distribution and competitive positioning strategies
– Valuations
12

Overview of Revenue Sharing
• Revenues divided into operating allocation and owners’ allocation
– Operating allocation covers all expenses associated with the business; any residual income after expenses is additional compensation to the management team
Owners’ allocation is distributed pro rata to the equity owners of the business– Owners allocation is distributed pro rata to the equity owners of the business
• Highbury acquires 51% - 80% of the owners’ allocation
– Balance of owners’ allocation retained by management
– Joint ownership provides for alignment of interestsp p g
• Preserve integrity and autonomy of affiliate franchise
– Retain brand
– Permanent delegation of full operating authority
– Highbury approval required for limited set of major decisions
– No integration with legacy investment process or distribution system
– Contractual protections for all parties in operating agreement
– Long-term, enforceable restrictive covenants in employment contracts and definitive g , p ytransaction agreements
13
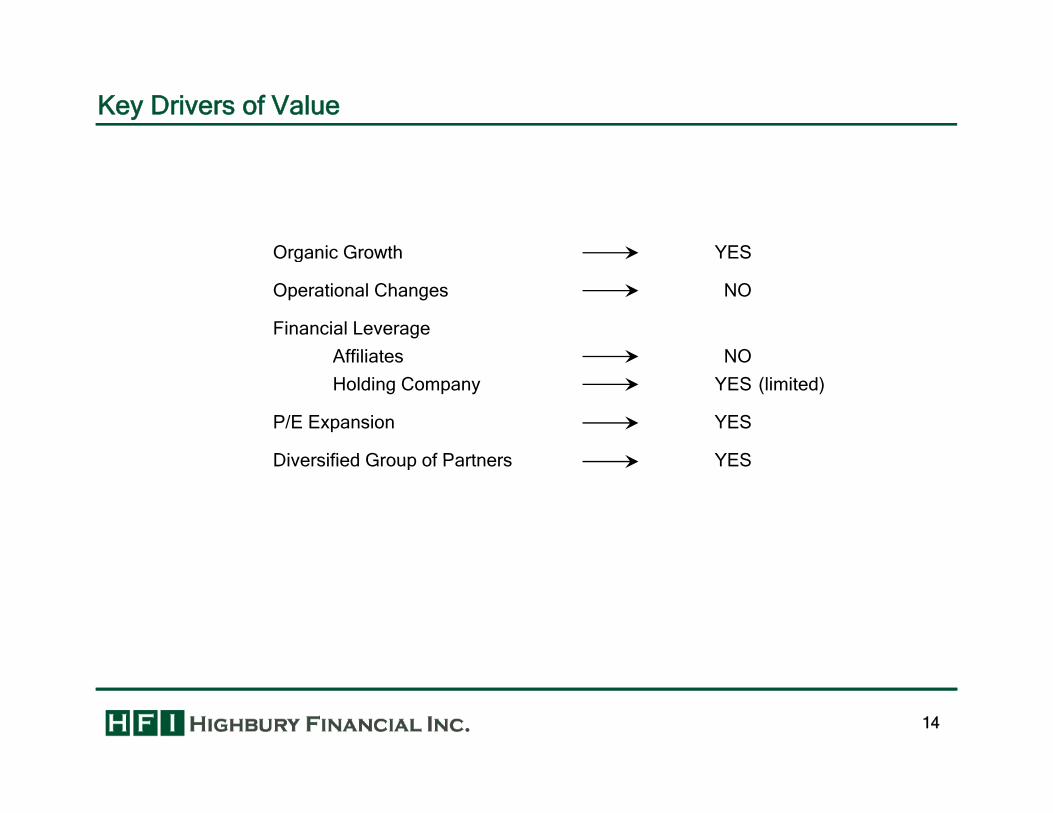
Key Drivers of Value
Organic Growth YESOrganic Growth YES
Operational Changes NO
Financial Leverage
Affiliates NOAffiliates NO
Holding Company YES (limited)
P/E Expansion YES
Diversified Group of Partners YESDiversified Group of Partners YES
14

Strategy Provides Long-Term Value Creation for Shareholders
15

Summary
Premier Shareholder Group• Employees of Berkshire Capital - leading
M&A advisor to investment management firms
Unique Capital Source• Permanent equity capital
• Flexible approach to transaction structuring
Li idi i h i d i idfirms
• Caledonia Investments plc
• Long term fundamental investors
• Liquidity with retained equity upside
• Permanent full delegation of operations
• No integration with legacy infrastructure
SUCCESSFULPARTNERSHIP
Compelling Opportunity for Partner• Eliminates need for future sale process
• Equity incentives for management
• Support and strategic input from Highbury• Support and strategic input from Highbury
• Proprietary mutual fund distribution
16
Exhibit A
Aston Funds Supplemental Information
17

Highlights of Aston Asset Management LLC
• $4.9 billion of mutual fund AUM and $132 million of separate account AUM as of June 30, 2009
• 14 funds opened since closing of acquisition
– Aston/Optimum Large Cap Opportunity Fund (December 2006)
– Aston/River Road Small-Mid Cap Fund (March 2007)
– Aston/Neptune International Fund (August 2007)
– Aston/Resolution Global Equity Fund (August 2007)
– Aston/ABN AMRO Global Real Estate Fund (August 2007)– Aston/ABN AMRO Global Real Estate Fund (August 2007)
– Aston/SGA International Small-Mid Cap Fund (November 2007)
– Aston/Barings International Fund (November 2007)
– Aston/Montag & Caldwell Mid Cap Growth Fund (November 2007)
– Aston/Cardinal Mid Cap Value Fund (November 2007)
– Aston/ClariVest Mid Cap Growth Fund (November 2007)
– Aston/Smart Allocation ETF Fund (January 2008)
– Aston/M.D. Sass Enhanced Equity Income Fund (January 2008)
– Aston/New Century Absolute Return ETF Fund (March 2008)
– Aston/Lake Partners LASSO Alternatives Fund (April 2009)
• Eight funds closed or merged as a result of poor investment performance, portfolio manager turnover or for other reasons between closing of acquisition and June 30 2009
18
or for other reasons between closing of acquisition and June 30, 2009
Highlights of Aston Asset Management LLC
• Diversified, scalable operating platform
– 17 sales and client service professionals
– Over 400 selling agreements in place
1 f f 30 2009– 15 high quality sub-advisors; five with limited non-compete provisions as of June 30, 2009
– Operations, administration and compliance
• Outstanding management team
– Shared values of integrity character and ethics– Shared values of integrity, character and ethics
– Track record of leading successful growth, internally and by acquisition
– Distribution, management and operating experience complement Highbury management
19

Broad Array of High Quality Investment Products
• Diversified mix of mutual funds
• Funds managed by independent sub-advisors with unique investment styles
• 9 funds with overall Morningstar Ratings of 4 or 5 stars; 4 funds with 3 stars• 9 funds with overall Morningstar Ratings of 4 or 5 stars; 4 funds with 3 stars
• Approximately 87% of assets under management in funds with overall Morningstar Ratings of 4 or 5 stars
FIXED INCOME FUNDSEQUITY FUNDS
Value Blend Growth Short Intermediate Long
Large ★★★★
★★★★★
★★★★
★★★★
★★★
★★★
High ★★★★
★★★
Medium ★★★★
★★★★★★★ Medium
S M i t f J 30 2009 F th hi t ti ll t d di t h f d' it fi d i t l d i ti t th t
Small ★★★★★★★★
★★Low
20
Source: Morningstar, as of June 30, 2009. For the graphic, star ratings are allocated according to each fund's equity or fixed income style designation not the category designation.
Strong Relationship with Diversified Group of Sub-Advisors
• Open-architecture, sub-advised platform brings strategic relationships
– Baring Asset Management
– Cardinal Capital Management
Fortis Investment Management USA *– Fortis Investment Management USA
– Lake Partners
– M.D. Sass Investors Services
– MFS Investment Management
Montag & Caldwell *– Montag & Caldwell *
– Neptune Investment Management
– New Century Capital Management
– Optimum Investment Advisors
River Road Asset Management *– River Road Asset Management *
– Smart Portfolios
– TAMRO Capital Partners *
– Taplin, Canida & Habacht
V d A t M t *– Veredus Asset Management *
21
* Limited non-competes in the current product styles through November 30, 2011, subject to certain exceptions

Historical Mutual Fund Assets Under Management and Net FlowsEquity AUM ($bn) Fixed Income AUM ($bn)Equity AUM ($bn) Fixed Income AUM ($bn)
4.1
6.26.7
6.05.3 4.9 4.9
6.0
8.0 0.7
0.6
0.5
0.6
0.8
3.3
0.0
2.0
4.0 0.3
0.20.1
0.1 0.1
0.0
0.2
0.4
Equity Net Flows ($bn) Fixed Income Net Flows ($bn)
1 0 1 1 1 11.5 0.10.1
2002 2003 2004 2005 2006 2007 2008 6m 09 2002 2003 2004 2005 2006 2007 2008 6m 09
1.0 1.1
0.0 0.2
1.1
(0 5)
0.0
0.5
1.0
0.1
(0.1)
(0 1)
(0.1)
(0.0)(0.0)
(0.1)
(0.0)
Source: Strategic Insight and FRC for periods prior to 2007 Aston Asset Management LLC for periods beginning in 2007 and thereafter
(1.0)(1.2)
(0.9)
(1.5)
(1.0)
(0.5)
2002 2003 2004 2005 2006 2007 2008 6m 09
(0.2)(0.1) (0.1)
(0.3)
(0.2)
2002 2003 2004 2005 2006 2007 2008 6m 09
22
Source: Strategic Insight and FRC for periods prior to 2007. Aston Asset Management LLC for periods beginning in 2007 and thereafter.Note: Does not include separate account assets under management.

Diverse Growth Opportunities for Aston
• Internal growth of existing products
– Market appreciation
– Future net asset flows
20 f $200– 20 funds with less than $200 million in assets
Established investment performance track records
Capacity for new assets has potential to drive future growth
• Additional product lines• Additional product lines
– Expansion of separately managed account platform
– Incubation and adoption of additional funds with existing and new sub-advisors
• Accretive add-on acquisitions
23

Diverse Family of Mutual Funds
Morningstar AUM ($m) % of TotalFund Subadvisor Morningstar Category Rating Inception 6/30/09 AUM
EQUITY Montag & Caldwell Growth Montag & Caldwell Large Growth ★★★★★ Nov 1994 2,097 42.5%Aston/Optimum Mid Cap Optimum Investment Advisors Mid Blend ★★★★ Sep 1994 693 14.1%Aston/TAMRO Small Cap TAMRO Capital Partners Small Blend ★★★★ Nov 2000 644 13.1%Aston/River Road Small Cap Value River Road Asset Management Small Value ★★★★ Jun 2005 429 8.7%Aston Value MFS Institutional Advisors Large Value ★★★★ Jan 1993 207 4.2%Aston Growth Montag & Caldwell Large Growth ★★★ Dec 1993 186 3.8%Aston/River Road Small Mid Cap River Road Asset Management Small Value -- Mar 2007 181 3.7%Aston/River Road Dividend All Cap Value River Road Asset Management Mid Value ★★★★ Jun 2005 130 2.6%Aston/Veredus Select Growth Veredus Asset Management Large Growth ★★★ Dec 2001 77 1.6%Aston/Veredus Aggressive Growth Veredus Asset Management Small Growth ★★ Jun 1998 44 0.9%Aston/Smart Portfolios Smart Portfolios Conservative Allocation -- Jan 2008 30 0.6%Aston/Barings International Baring Asset Management Foreign Large Blend -- Nov 2007 21 0.4%Aston/Fortis Real Estate Fortis Investment Management Real Estate ★★★ Dec 1997 21 0.4%Montag & Caldwell Balanced Montag & Caldwell Moderate Allocation ★★★★ Nov 1994 18 0.4%Aston/M.D. Sass Enhanced Equity M.D. Sass Investors Services Long-Short -- Jan 2008 17 0.3%Aston Balanced Montag & Caldwell Moderate Allocation ★★★ Sep 1995 17 0.3%Aston/New Century Absolute Return ETF New Century Capital Management Moderate Allocation -- Mar 2008 15 0.3%Aston/Fortis Gbl Real Estate Fortis Investment Management Global Real Estate -- Aug 2007 10 0.2%Aston/Neptune International Neptune Investment Management Foreign Large Growth -- Aug 2007 9 0.2%Aston/TAMRO All Cap TAMRO Capital Partners Large Blend ★★★★ Nov 2000 9 0.2%Aston/Optimum Large Cap Oppt. Optimum Investment Advisors Large Growth -- Dec 2006 4 0.1%Aston/Montag & Caldwell Mid Cap Growth Montag & Caldwell Mid Growth -- Nov 2007 3 0.1%Aston/Lake Partners LASSO Alternatives Lake Partners Long-Short -- Apr 2009 1 0.0%Aston/Cardinal Mid Cap Value Cardinal Capital Management Mid Value -- Nov 2007 1 0.0%
Total Equity 4,863 98.6%
FIXED INCOMEAston/TCH Fixed Income Taplin Canida & Habacht Int. Term Bond ★★★★ Dec 1993 69 1.4%
Total Fixed Income 69 1.4%
Total AUM $4,932 100.0%
24
Source: Morningstar, as of June 30, 2009.

Diverse Family of Mutual Funds
Morningstar AUM ($m) Annualized Total ReturnsFund Subadvisor Morningstar Category Rating 6/30/09 1-Year 3-Years 5-Years
EQUITY Montag & Caldwell Growth Montag & Caldwell Large Growth ★★★★★ 2,097 -21.6% -1.5% 0.2%Aston/Optimum Mid Cap Optimum Investment Advisors Mid Blend ★★★★ 693 -32.2% -4.4% -0.8%Aston/TAMRO Small Cap TAMRO Capital Partners Small Blend ★★★★ 644 -18.2% -6.1% 0.7%Aston/River Road Small Cap Value River Road Asset Management Small Value ★★★★ 429 -20.5% -7.0% -Aston Value MFS Institutional Advisors Large Value ★★★★ 207 -24.6% -6.4% 0.6%Aston Growth Montag & Caldwell Large Growth ★★★ 186 -21.4% -6.7% -3.8%Aston/River Road Small Mid Cap River Road Asset Management Small Value -- 181 -22.8% - -Aston/River Road Dividend All Cap Value River Road Asset Management Mid Value ★★★★ 130 -23.1% -6.7% -Aston/Veredus Select Growth Veredus Asset Management Large Growth ★★★ 77 -34.6% -8.3% -0.6%Aston/Veredus Aggressive Growth Veredus Asset Management Small Growth ★★ 44 -35.0% -15.1% -6.6%Aston/Smart Portfolios Smart Portfolios Conservative Allocation -- 30 -10.3% - -Aston/Barings International Baring Asset Management Foreign Large Blend -- 21 -33.0% - -Aston/Fortis Real Estate Fortis Investment Management Real Estate ★★★ 21 -43.9% -20.4% -3.8%Montag & Caldwell Balanced Montag & Caldwell Moderate Allocation ★★★★ 18 -11.5% 1.4% 1.6%Aston/M.D. Sass Enhanced Equity M.D. Sass Investors Services Long-Short -- 17 -10.3% - -Aston Balanced Montag & Caldwell Moderate Allocation ★★★ 17 -13.3% -2.4% -0.8%Aston/New Century Absolute Return ETF New Century Capital Management Moderate Allocation -- 15 -19.8% - -Aston/Fortis Gbl Real Estate Fortis Investment Management Global Real Estate -- 10 -40.9% - -Aston/Neptune International Neptune Investment Management Foreign Large Growth -- 9 -40.8% - -Aston/TAMRO All Cap TAMRO Capital Partners Large Blend ★★★★ 9 -22.3% -6.0% -0.9%Aston/Optimum Large Cap Oppt. Optimum Investment Advisors Large Growth -- 4 -34.5% - -Aston/Montag & Caldwell Mid Cap Growth Montag & Caldwell Mid Growth -- 3 -32.5% - -Aston/Lake Partners LASSO Alternatives Lake Partners Long-Short -- 1 - - -Aston/Cardinal Mid Cap Value Cardinal Capital Management Mid Value -- 1 -25.3% - -
Total Equity 4,863
FIXED INCOMEAston/TCH Fixed Income Taplin Canida & Habacht Int. Term Bond ★★★★ 69 4.2% 5.7% 4.4%
Total Fixed Income 69
Total AUM $4,932
25
Source: Morningstar, as of June 30, 2009.
Exhibit B
Highbury Supplemental Information
26

Highbury Officers and Directors – R. Bruce Cameron, CFA
R. Bruce Cameron, CFA has been our chairman of the board since our inception. Mr. Cameron has been the president
and chief executive officer of Berkshire Capital Securities LLC, or Berkshire Capital, a New York-based investment
banking firm, since its formation in May 2004. Mr. Cameron co-founded Berkshire Capital Corporation, the predecessor
firm to Berkshire Capital, in 1983 as the first independent investment bank covering the financial services industry, with p p g y
a focus on investment management and capital markets firms. Mr. Cameron and his partners have advised on 236
mergers and acquisitions of financial services companies, including high net worth managers, institutional investment
managers, mutual fund managers, real estate managers, brokerage firms, investment banks and capital markets firms
with aggregate client assets under management of nearly $520 billion and aggregate transaction value in excess of
$10 4 billi M C i th i b f B d H ll LLC tit f d f th f$10.4 billion. Mr. Cameron is the managing member of Broad Hollow LLC, an entity formed for the purpose of
facilitating the investments in us made by our founding shareholders, which owns 776,250 shares of our common stock
and 75,000 of our units. Prior to forming Berkshire Capital Corporation, Mr. Cameron was an associate director of Paine
Webber Group Inc.’s Strategic Planning Group from 1981 through 1983. Mr. Cameron began his career at Prudential
Insurance Company from 1978 through 1980, working first in the Comptroller’s Department and then in the Planning & p y g , g p p g
Coordination Group. Mr. Cameron was graduated from Trinity College, where he received a B.A. in Economics, and
from Harvard Business School, where he received an M.B.A. Mr. Cameron also attended the London School of
Economics. Mr. Cameron is a CFA charterholder and is on the membership committee of the New York Society of
Security Analysts. Mr. Cameron is a director of Capital Counsel LLC in New York City, a high net worth investment
management firm he advised when it was established. Mr. Cameron is a Fellow of the Life Management Institute. He is
also a past trustee of the Securities Industry Institute.
27

Highbury Officers and Directors – Richard S. Foote, CFA
Richard S. Foote, CFA has been our president and chief executive officer and a member of our board of directors since
our inception. Mr. Foote has been a managing director of Berkshire Capital since its formation in May 2004 and a
managing director, principal and vice president of Berkshire Capital Corporation, the predecessor firm to Berkshire
Capital, since 1994. Since 1994, Mr. Foote has advised on 30 completed mergers and acquisitions of financial services p p g q
companies, including high net worth managers, institutional investment managers, mutual fund managers, real estate
managers, brokerage firms, investment banks and capital markets firms with aggregate client assets under
management of approximately $131 billion and aggregate transaction value of approximately $2.2 billion. Mr. Foote is a
director of Berkshire Capital and serves on its compensation committee, commitment committee and technology
itt F 1991 th h 1994 M F t f d d t f K i ht b id C it l P tcommittee. From 1991 through 1994, Mr. Foote was a co-founder and partner of Knightsbridge Capital Partners, a
partnership engaged in investment banking and merchant banking activities. From 1985 to 1991, Mr. Foote was a vice
president, an associate, and an analyst in the investment banking division of PaineWebber Incorporated, primarily
working on mergers, acquisitions and the issuance of equity and debt securities. Mr. Foote was graduated from Harvard
College, cum laude, in 1985 with an A.B. in Economics. Mr. Foote is a CFA charterholder and a member of the CFA g , ,
Institute, the New York Society of Security Analysts, the Pension Real Estate Association and the National Council of
Real Estate Investment Fiduciaries.
28
Highbury Officers and Directors – R. Bradley Forth, CFA
R. Bradley Forth, CFA has been our executive vice president, chief financial officer and secretary since our inception.
Mr. Forth has been a vice president and an associate at Berkshire Capital since its formation in May 2004 and an
associate and an analyst at Berkshire Capital Corporation, the predecessor firm to Berkshire Capital since 2001. Mr.
Forth has advised on 19 mergers and acquisitions of financial services companies with aggregate transaction value of g q p gg g
approximately $1.3 billion. He was graduated from Duke University in 2001 with a B.S. in Economics and a B.A. in
Chemistry. Mr. Forth is a CFA charterholder and a member of the CFA Institute and the New York Society of Security
Analysts.
29
Highbury Officers and Directors – Aidan J. Riordan
Aidan J. Riordan has been a member of our board of directors since May 2007. Mr. Riordan is a partner at Calvert
Street Capital Partners, Inc. (“CSCP”), a Baltimore-based private equity investment firm focused on middle-market
manufacturing and service companies. Previously, he was an associate with Castle Harlan, Inc., a New York-based
middle-market private equity partnership from 2000 to 2003. Mr. Riordan also served as an associate for Berkshire p q y p p
Capital Corporation, the predecessor firm to Berkshire Capital, from 1994 to 1998. During his career, Mr. Riordan has
executed transactions with an aggregate value of $1.3 billion, including approximately $500 million of transactions in his
current position with CSCP. He holds a B.A. in Economics from the University of Pennsylvania and a M.B.A. in Finance
from Columbia Business School. Mr. Riordan currently serves on the boards of directors for two CSCP portfolio
i U i l Mill i i ti d hi i d ADAPCO di t ib t f i ltcompanies, Universal Millennium, a printing and graphics services company, and ADAPCO, a distributor of specialty
chemicals and equipment.
30

Highbury Officers and Directors – Hoyt Ammidon Jr.
Hoyt Ammidon Jr. has been a member of our board of directors since December 2008. Mr. Ammidon has been an
Advisory Director for Berkshire Capital since 2004. Prior to this role, he served as a Managing Director at Berkshire
Capital and its predecessor from 1994 to 2004. Mr. Ammidon was previously at Cazenove Incorporated, where he was
President of its U.S. brokerage and investment banking subsidiary from 1988 to 1993. He was also formerly the g g y y
Managing Director of Chase Investment Bank’s Merger and Acquisition Division from 1985 to 1987, and Senior Vice
President in E.F. Hutton Company’s Corporate Finance Department from 1977 to 1985. Mr. Ammidon began his career
in corporate finance at Morgan Stanley & Co. from 1963 to 1976 and worked in Paris for three years for Morgan & Cie.
International from 1972 to 1975. He is a former director of Tetra Technologies, Inc., Balchem Corporation and W. H.
S ith G (USA) H h l d b f th S iti I d t A i ti ’ I t ti l C ittSmith Group (USA). He has also served as a member of the Securities Industry Association’s International Committee.
Mr. Ammidon earned a BA in history from Yale University in 1959 and then served as a captain and aviator in the
United States Marine Corps from 1959 to 1963.
31

Highbury Officers and Directors – Theodore M. Leary Jr.
Theodore M. Leary Jr. has been a member of our board of directors since April 2009. Mr. Leary is the President of
Crosswater Realty Advisors LLC, a real estate advisory firm he founded in 2005, which provides workout, value
recovery and commingled fund/partnership restructuring assistance to owners, investors and managers holding
underperforming real estate and transportation infrastructure investments. Prior to founding Crosswater, Mr. Leary p g p g y
served for 22 years in a variety of roles as a Principal of Lowe Enterprises, a diversified real estate company. He was
the President of Lowe Enterprises Investment Management, LLC ("LEIM"), the institutional advisory arm of Lowe
Enterprises, from 1990 to 2004 and the Chairman from 2004 to 2005. Under Mr. Leary’s leadership, LEIM executed 136
acquisitions and 95 dispositions of real estate assets with an aggregate transaction value of $7.8 billion. Mr. Leary
k d f th Vi t P l i i C f 1975 t 1982 hi hl l k t i t f j fi i lworked for the Victor Palmieri Company from 1975 to 1982 on highly complex workout assignments for major financial
institutions. He has served on the boards of directors of the Pension Real Estate Association, the National Association
of Real Estate Investment Managers, the Association of Foreign Investors in Real Estate and the Real Estate Capital
Recovery Association, which represented the real estate workout industry during the savings and loan collapse in the
1990s. Mr. Leary was honored, in October 2005, with the prestigious Sponsors' Award by The UCLA Real Estate y , , p g p y
Finance and Investment Conference for his significant contributions to the real estate investment industry. Before
entering the real estate business, Mr. Leary worked in the United States Senate as the chief of staff to U.S. Senator
Abraham Ribicoff. Mr. Leary is a graduate of Harvard College and George Washington University Law School.
32

Disclosure – Adjusted EBITDA
As supplemental information, we provide information regarding Adjusted EBITDA, a non-GAAP liquidity measure. This
measure is provided in addition to, but not as a substitute for, cash flow from operations. Adjusted EBITDA means the
sum of (a) net income determined in accordance with GAAP, plus (b) amortization of intangible assets, plus (c) interest
expense, plus (d) depreciation, plus (e) other non-cash expenses, plus (f) income tax expense. This definition of p p ( ) p p ( ) p p ( ) p
Adjusted EBITDA is consistent with the definition of EBITDA used in our credit facility. Adjusted EBITDA, as calculated
by us, may not be consistent with computations of Adjusted EBITDA by other companies. As a measure of liquidity, we
believe that Adjusted EBITDA is useful as an indicator of our ability to service debt, make new investments and meet
working capital requirements. We provide this non-GAAP measure because our management uses this information
h l i th C ’ fi i l iti Th f ll i t bl id ili ti f t i twhen analyzing the Company’s financial position. The following table provides a reconciliation of net income to
Adjusted EBITDA.
Three Months Ended Six Months Ended
June 30, June 30,2008 2009 2008 2009
(unaudited) (unaudited) (unaudited) (unaudited)
Net Income attributable to Highbury Financial Inc. 900,881$ 712,875$ 1,525,160$ 1,115,812$ Provision for income taxes 504,559 457,526 905,393 626,222Interest expense - - - - Impairment of intangibles - - - -Impairment of intangibles
Depreciation and other amortization 45,997 45,921 95,056 91,842 Other non-cash expenses - - - - Adjusted EBITDA 1,451,437$ 1,216,322$ 2,525,609$ 1,833,876$
33

Disclosure – Cash Net Income
As supplemental information, we provide a non-GAAP performance measure that we refer to as Cash Net Income. This
measure is provided in addition to, but not as a substitute for, GAAP net income. Cash net income means the sum of (a)
net income determined in accordance with GAAP, plus (b) amortization of intangible assets, plus (c) deferred taxes
related to intangible assets, plus (d) affiliate depreciation, plus (e) other non-cash expenses. We consider Cash Net g p ( ) p p ( ) p
Income an important measure of our financial performance, as we believe it best represents operating performance
before non-cash expenses relating to the acquisition of our interest in our affiliated investment management firm. Cash
Net Income is not a measure of financial performance under GAAP and, as calculated by us, may not be consistent with
computations of Cash Net Income by other companies. Cash Net Income is used by our management and board of
di t f b h kdirectors as a performance benchmark.
Since our acquired assets do not generally depreciate or require replacement by us, and since they generate deferred
tax expenses that are unlikely to reverse, we add back these non-cash expenses to Net Income to measure operating
performance. We will add back amortization attributable to acquired client relationships because this expense does not
correspond to the changes in value of these assets, which do not diminish predictably over time. The portion of deferred
taxes generally attributable to intangible assets (including goodwill) that we do not amortize but which generates tax
deductions is added back, because these accruals would be used only in the event of a future sale of Aston or an
impairment charge. We will add back the portion of consolidated depreciation expense incurred by Aston because
under Aston’s operating agreement we are not required to replenish these depreciating assets We also add backunder Aston s operating agreement we are not required to replenish these depreciating assets. We also add back
expenses that we incur for financial reporting purposes for which there is no corresponding cash expense because such
expenses cause our Net Income to be understated relative to our ability to generate cash flow to service debt, if any,
finance accretive acquisitions, and repurchase securities, if appropriate.
34

Disclosure – Cash Net Income
Three Months Ended Six Months Ended
June 30, June 30,2008 2009 2008 2009
(unaudited) (unaudited) (unaudited) (unaudited)
Net Income attributable to Highbury Financial Inc. 900,881$ 712,875$ 1,525,160$ 1,115,812$ Intangible-related deferred taxes 233,262 210,214 466,525 420,428Other non-cash expenses - - - - Impairment of intangibles - - - - Affiliate depreciation 45,997 45,921 95,056 91,842 Cash net income 1,180,140$ 969,010$ 2,086,741$ 1,628,082$
Weighted average share outstanding, basic 9,126,628 9,088,014 9,192,309 9,102,603 Dilutive effect of warrants* - - - - Weighted average shares outstanding, diluted 9,126,628 9,088,014 9,192,309 9,102,603
Weighted average stock price 2 71$ 3 21$ 3 24$ 2 61$Weighted average stock price 2.71$ 3.21$ 3.24$ 2.61$
* R fl t dil ti ff t f t t t di ith $5 00 i i i th t t k th d d b d th i ht d t k i f th i d
35
* Reflects dilutive effect of warrants outstanding with a $5.00 exercise price, using the treasury stock method and based on the weighted average stock price for the periods.
Disclosure – Cash Net Income Per Share
Cash Net Income per share represents Cash Net Income divided by the diluted average shares outstanding. In this
calculation, the potential share issuance in connection with our warrants is measured using a treasury stock method.
Under this method, only the net number of shares of common stock equal to the value of the warrants in excess of the
exercise price, if any, is deemed to be outstanding. We believe the inclusion of net shares under a treasury stock p y g y
method best reflects the benefit of the increase in available capital resources (which could be used to repurchase
shares of common stock) that occurs when these securities are exercised. This method does not take into account any
increase or decrease in our cost of capital in an assumed exercise.
36

Disclosure
Source of data on pages 20, 24 and 25 is Morningstar, Inc. Past performance is no guarantee of future results. For
each fund with at least a 3-year history, Morningstar calculates a Morningstar RatingTM based on a Morningstar Risk-
Adjusted Return measure that accounts for variation in a fund’s monthly performance (including the effects of sales
charges, loads and redemption fees), placing more emphasis on downward variations and rewarding consistent g , p ), p g p g
performance. The top 10% of funds in each category receive five stars, the next 22.5% receive four stars, the next 35%
receive three stars, the next 22.5% receive two stars and the bottom 10% receive one star. (Each share class is
counted as a fraction of one fund within this scale and rated separately, which may cause slight variations in the
distribution percentages.) The Overall Morningstar Rating for a fund is derived from a weighted-average of the
f fi i t d ith it 3 5 d 10 (if li bl ) M i t R ti t iperformance figures associated with its 3-, 5-and 10-year (if applicable) Morningstar Rating metrics.
37

Permanent Capital Solutions for Investment Managers
R. Bruce Cameron, CFA Richard S. Foote, CFA R. Bradley Forth, CFA
T: (212) 688-2349 T: (212) 688-2341 T: (303) 357-4802
F: (212) 688-2343 F: (212) 688-2343 F: (303) 893-2902
b @hi hb fi i l f t @hi hb fi i l bf th@hi hb fi i [email protected] [email protected] [email protected]