perkins school for the blind · perkins school for the blind . notes to the consolidated financial...
TRANSCRIPT
Perkins School for the Blind Consolidated Financial Statements June 30, 2015 and 2014 (with Independent Auditors’ Report Thereon)

Perkins School for the Blind Index June 30, 2015 and 2014
Page(s)
Independent Auditor’s Report ............................................................................................................... 1-2
Consolidated Financial Statements
Statements of Financial Position .................................................................................................................. 3
Statements of Activities and Changes in Net Assets ................................................................................ 4-5
Statements of Functional Expenses ......................................................................................................... 6-7
Statements of Cash Flows ........................................................................................................................... 8
Notes to the Consolidated Financial Statements ................................................................................... 9–24

Independent Auditors’ Report
The Board of Trustees
Perkins School for the Blind:
Report on the Financial Statements
We have audited the accompanying consolidated financial statements of Perkins School for the Blind and its
subsidiaries, which comprise the consolidated statement of financial position as of June 30, 2015, and the
related consolidated statements of activities and changes in net assets, functional expenses, and cash flows
for the years then ended, and the related notes to the consolidated financial statements.
Management’s Responsibility for the Financial Statements
Management is responsible for the preparation and fair presentation of these consolidated financial
statements in accordance with U.S. generally accepted accounting principles; this includes the design,
implementation, and maintenance of internal control relevant to the preparation and fair presentation of
consolidated financial statements that are free from material misstatement, whether due to fraud or error.
Auditors’ Responsibility
Our responsibility is to express an opinion on these consolidated financial statements based on our audit. We
conducted our audit in accordance with auditing standards generally accepted in the United States of
America. Those standards require that we plan and perform the audit to obtain reasonable assurance about
whether the consolidated financial statements are free from material misstatement.
An audit involves performing procedures to obtain audit evidence about the amounts and disclosures in the
consolidated financial statements. The procedures selected depend on the auditors’ judgment, including the
assessment of the risks of material misstatement of the consolidated financial statements, whether due to
fraud or error. In making those risk assessments, the auditor considers internal control relevant to the entity’s
preparation and fair presentation of the consolidated financial statements in order to design audit procedures
that are appropriate in the circumstances, but not for the purpose of expressing an opinion on the effectiveness
of the entity’s internal control. Accordingly, we express no such opinion. An audit also includes evaluating
the appropriateness of accounting policies used and the reasonableness of significant accounting estimates
made by management, as well as evaluating the overall presentation of the consolidated financial statements.
We believe that the audit evidence we have obtained is sufficient and appropriate to provide a basis for our
audit opinion.
KPMG LLPTwo Financial Center60 South StreetBoston, MA 02111
KPMG LLP is a Delaware limited liability partnership, the U.S. member firm of KPMG International Cooperative (“KPMG International”), a Swiss entity.

Opinion
In our opinion, the consolidated financial statements referred to above present fairly, in all material respects,
the financial position of Perkins School for the Blind and its subsidiaries as of June 30, 2015, and the changes
in their net assets, their functional expenses, and their cash flows for the year then ended in accordance with
U.S. generally accepted accounting principles.
Other Matter
The accompanying financial statements of Perkins School for the Blind as of and for the year ended June 30,
2014 were audited by other auditors whose report thereon, dated October 30, 2014, expressed an unmodified
opinion.
October 22, 2015
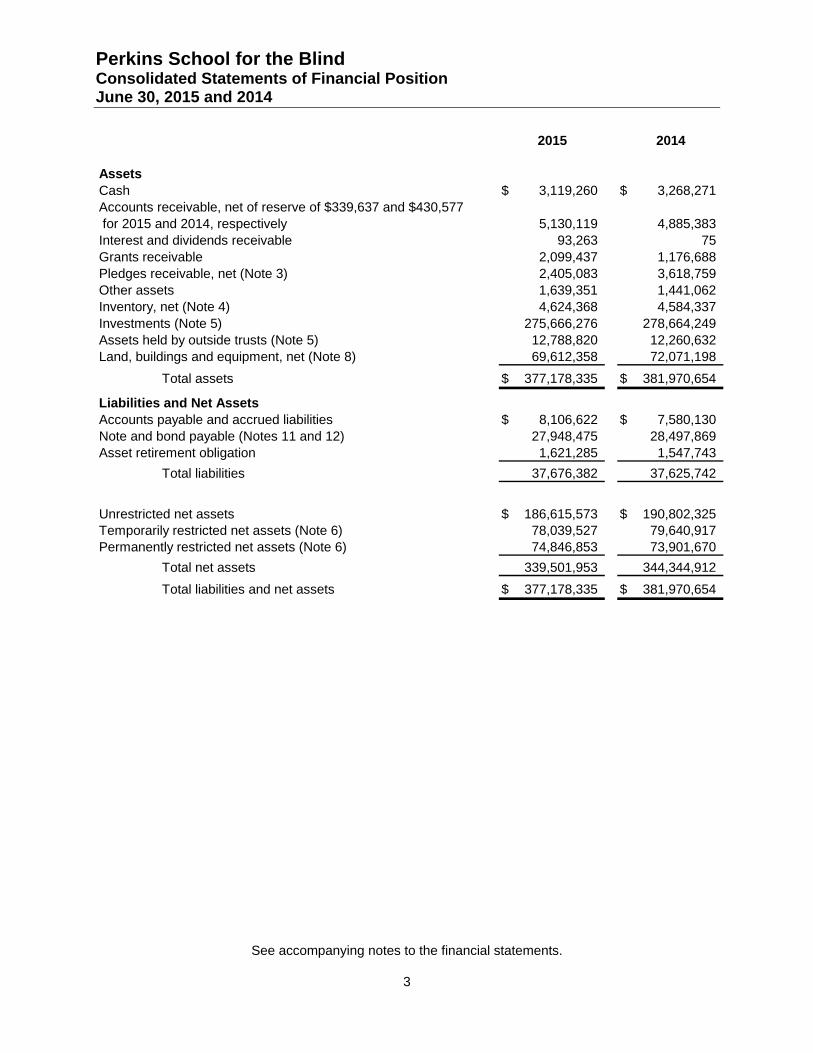
Perkins School for the Blind Consolidated Statements of Financial Position June 30, 2015 and 2014
See accompanying notes to the financial statements.
3
2015 2014
AssetsCash 3,119,260$ 3,268,271$ Accounts receivable, net of reserve of $339,637 and $430,577 for 2015 and 2014, respectively 5,130,119 4,885,383Interest and dividends receivable 93,263 75Grants receivable 2,099,437 1,176,688Pledges receivable, net (Note 3) 2,405,083 3,618,759Other assets 1,639,351 1,441,062Inventory, net (Note 4) 4,624,368 4,584,337Investments (Note 5) 275,666,276 278,664,249Assets held by outside trusts (Note 5) 12,788,820 12,260,632Land, buildings and equipment, net (Note 8) 69,612,358 72,071,198
Total assets 377,178,335$ 381,970,654$
Liabilities and Net AssetsAccounts payable and accrued liabilities 8,106,622$ 7,580,130$ Note and bond payable (Notes 11 and 12) 27,948,475 28,497,869Asset retirement obligation 1,621,285 1,547,743
Total liabilities 37,676,382 37,625,742
Unrestricted net assets 186,615,573$ 190,802,325$ Temporarily restricted net assets (Note 6) 78,039,527 79,640,917Permanently restricted net assets (Note 6) 74,846,853 73,901,670
Total net assets 339,501,953 344,344,912
Total liabilities and net assets 377,178,335$ 381,970,654$
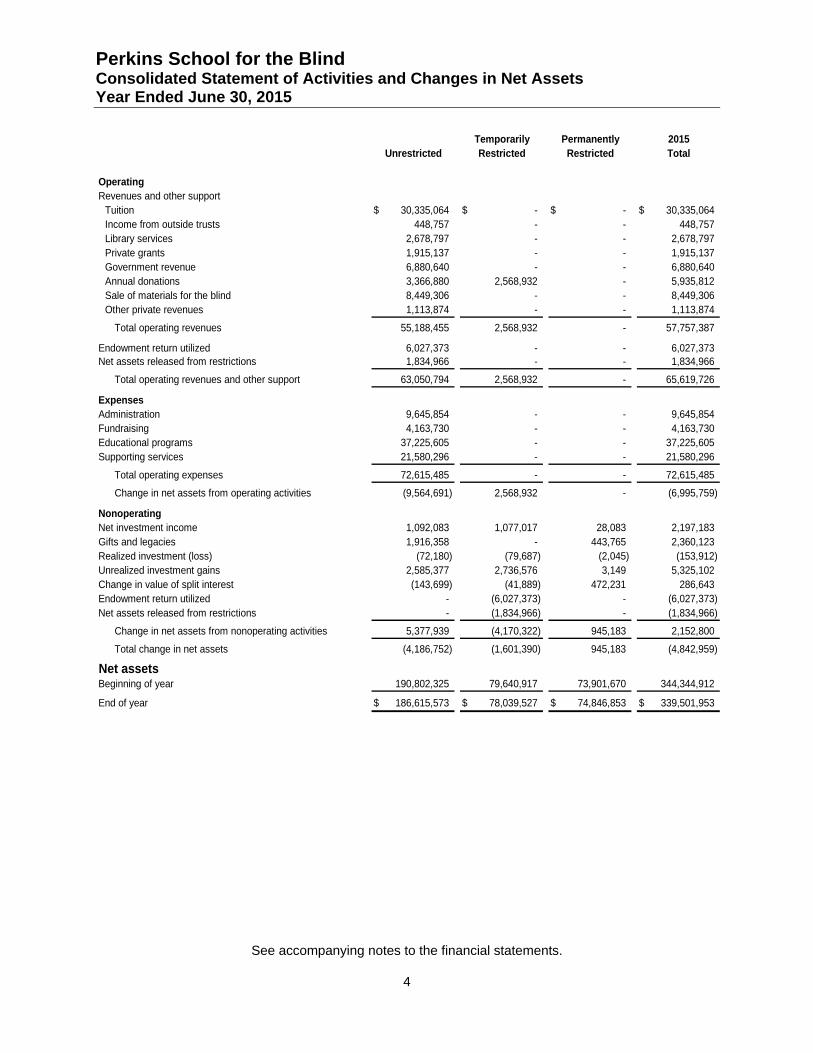
Perkins School for the Blind Consolidated Statement of Activities and Changes in Net Assets Year Ended June 30, 2015
See accompanying notes to the financial statements.
4
Temporarily Permanently 2015Unrestricted Restricted Restricted Total
OperatingRevenues and other support
Tuition 30,335,064$ -$ -$ 30,335,064$ Income from outside trusts 448,757 - - 448,757Library services 2,678,797 - - 2,678,797Private grants 1,915,137 - - 1,915,137Government revenue 6,880,640 - - 6,880,640Annual donations 3,366,880 2,568,932 - 5,935,812Sale of materials for the blind 8,449,306 - - 8,449,306Other private revenues 1,113,874 - - 1,113,874
Total operating revenues 55,188,455 2,568,932 - 57,757,387
Endowment return utilized 6,027,373 - - 6,027,373Net assets released from restrictions 1,834,966 - - 1,834,966
Total operating revenues and other support 63,050,794 2,568,932 - 65,619,726
ExpensesAdministration 9,645,854 - - 9,645,854Fundraising 4,163,730 - - 4,163,730Educational programs 37,225,605 - - 37,225,605Supporting services 21,580,296 - - 21,580,296
Total operating expenses 72,615,485 - - 72,615,485
Change in net assets from operating activities (9,564,691) 2,568,932 - (6,995,759)
NonoperatingNet investment income 1,092,083 1,077,017 28,083 2,197,183Gifts and legacies 1,916,358 - 443,765 2,360,123Realized investment (loss) (72,180) (79,687) (2,045) (153,912)Unrealized investment gains 2,585,377 2,736,576 3,149 5,325,102Change in value of split interest (143,699) (41,889) 472,231 286,643Endowment return utilized - (6,027,373) - (6,027,373)Net assets released from restrictions - (1,834,966) - (1,834,966)
Change in net assets from nonoperating activities 5,377,939 (4,170,322) 945,183 2,152,800
Total change in net assets (4,186,752) (1,601,390) 945,183 (4,842,959)
Net assetsBeginning of year 190,802,325 79,640,917 73,901,670 344,344,912
End of year 186,615,573$ 78,039,527$ 74,846,853$ 339,501,953$

Perkins School for the Blind Consolidated Statement of Activities and Changes in Net Assets Year Ended June 30, 2014
See accompanying notes to the financial statements.
5
Temporarily Permanently 2014Unrestricted Restricted Restricted Total
OperatingRevenues and other support
Tuition 32,522,391$ -$ -$ 32,522,391$ Income from outside trusts 380,616 - - 380,616Library services 2,672,568 - - 2,672,568Private grants 3,529,928 - - 3,529,928Government revenue 5,315,060 - - 5,315,060Annual donations 3,414,115 2,377,943 - 5,792,058Sale of materials for the blind 11,822,808 - - 11,822,808Other private revenues 1,122,406 - - 1,122,406
Total operating revenues 60,779,892 2,377,943 - 63,157,835
Endowment return utilized 5,352,276 - - 5,352,276Net assets released and reclassified from restrictions 4,215,964 - - 4,215,964
Total operating revenues and other support 70,348,132 2,377,943 - 72,726,075
ExpensesAdministration 8,802,957 - - 8,802,957Fundraising 4,204,750 - - 4,204,750Educational programs 38,746,193 - - 38,746,193Supporting services 24,236,643 - - 24,236,643
Total operating expenses 75,990,543 - - 75,990,543
Change in net assets from operating activities (5,642,411) 2,377,943 - (3,264,468)
NonoperatingNet investment income 1,799,504 532,839 30,237 2,362,580Gifts and legacies 1,343,156 - 10,706,892 12,050,048Realized investment gains 6,438,934 6,316,765 162,029 12,917,728Unrealized investment gains 12,873,380 12,801,487 14,205 25,689,072Change in value of split interest 77,456 67,218 999,775 1,144,449Endowment return utilized - (5,352,276) - (5,352,276)Net assets released from restrictions - (4,215,964) - (4,215,964)
Change in net assets from nonoperating activities 22,532,430 10,150,069 11,913,138 44,595,637
Total change in net assets 16,890,019 12,528,012 11,913,138 41,331,169
Net assetsBeginning of year 173,912,306 67,112,905 61,988,532 303,013,743
End of year 190,802,325$ 79,640,917$ 73,901,670$ 344,344,912$
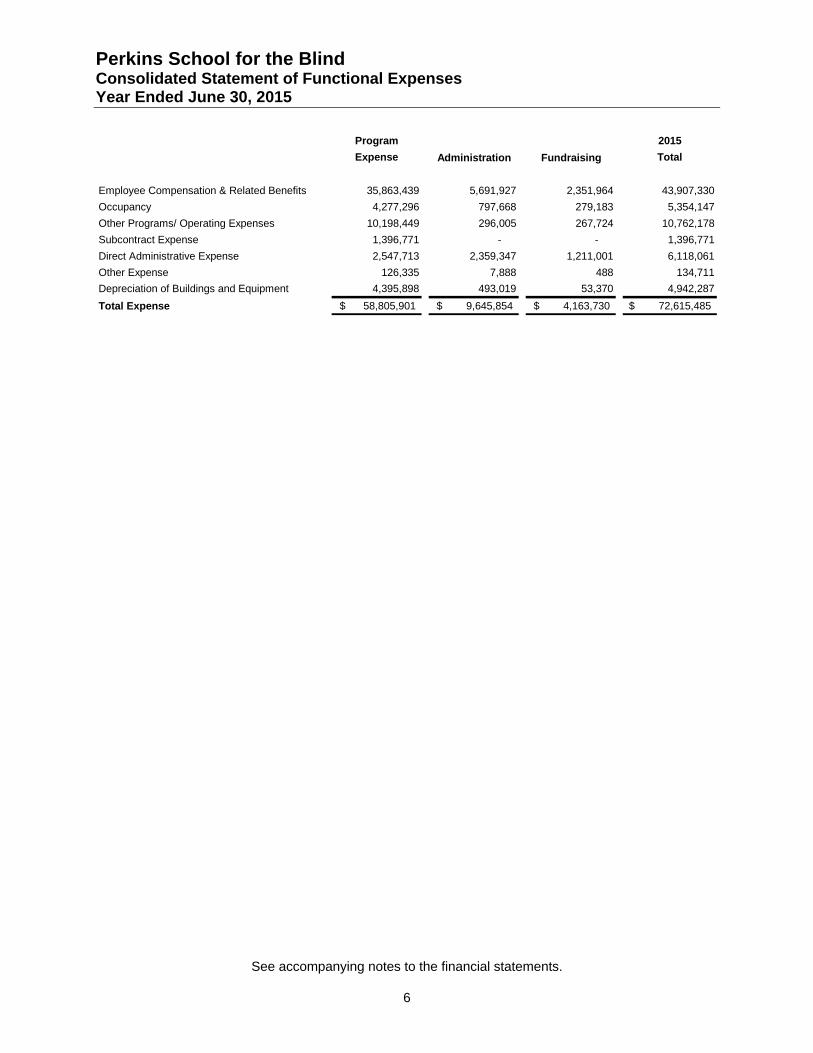
Perkins School for the Blind Consolidated Statement of Functional Expenses Year Ended June 30, 2015
See accompanying notes to the financial statements.
6
Program 2015
Expense Administration Fundraising Total
Employee Compensation & Related Benefits 35,863,439 5,691,927 2,351,964 43,907,330
Occupancy 4,277,296 797,668 279,183 5,354,147
Other Programs/ Operating Expenses 10,198,449 296,005 267,724 10,762,178
Subcontract Expense 1,396,771 - - 1,396,771
Direct Administrative Expense 2,547,713 2,359,347 1,211,001 6,118,061
Other Expense 126,335 7,888 488 134,711
Depreciation of Buildings and Equipment 4,395,898 493,019 53,370 4,942,287
Total Expense 58,805,901$ 9,645,854$ 4,163,730$ 72,615,485$
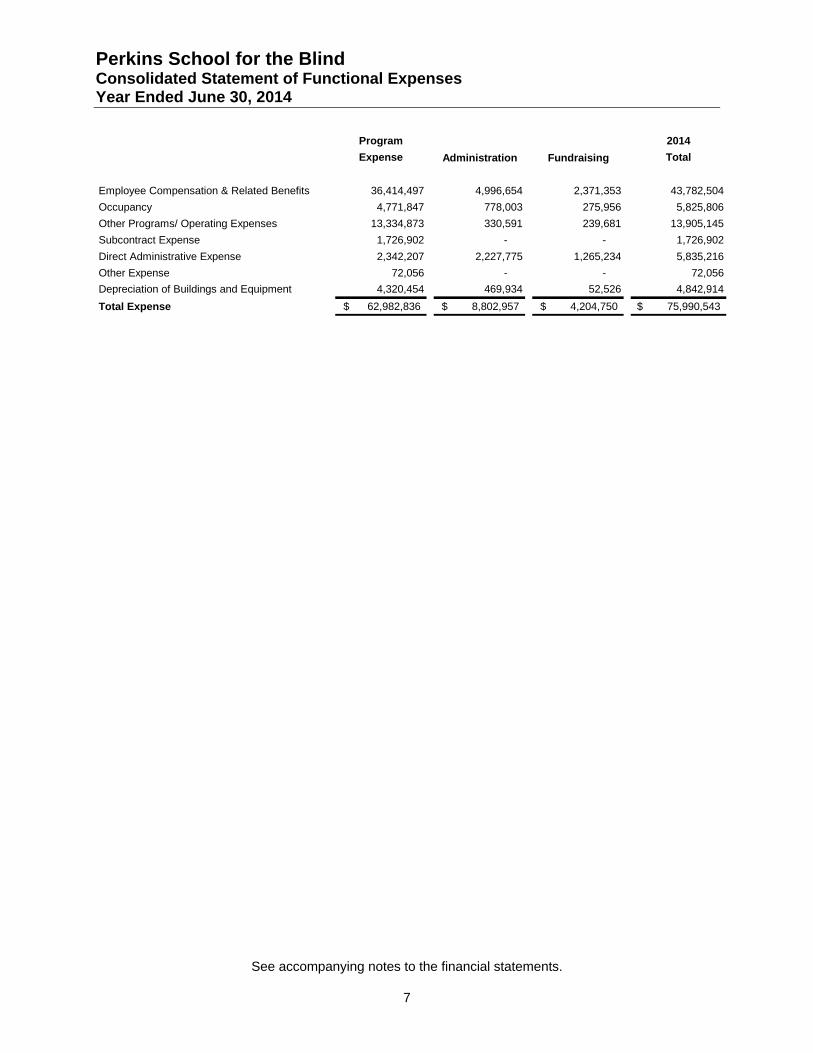
Perkins School for the Blind Consolidated Statement of Functional Expenses Year Ended June 30, 2014
See accompanying notes to the financial statements.
7
Program 2014
Expense Administration Fundraising Total
Employee Compensation & Related Benefits 36,414,497 4,996,654 2,371,353 43,782,504
Occupancy 4,771,847 778,003 275,956 5,825,806
Other Programs/ Operating Expenses 13,334,873 330,591 239,681 13,905,145
Subcontract Expense 1,726,902 - - 1,726,902
Direct Administrative Expense 2,342,207 2,227,775 1,265,234 5,835,216
Other Expense 72,056 - - 72,056
Depreciation of Buildings and Equipment 4,320,454 469,934 52,526 4,842,914
Total Expense 62,982,836$ 8,802,957$ 4,204,750$ 75,990,543$
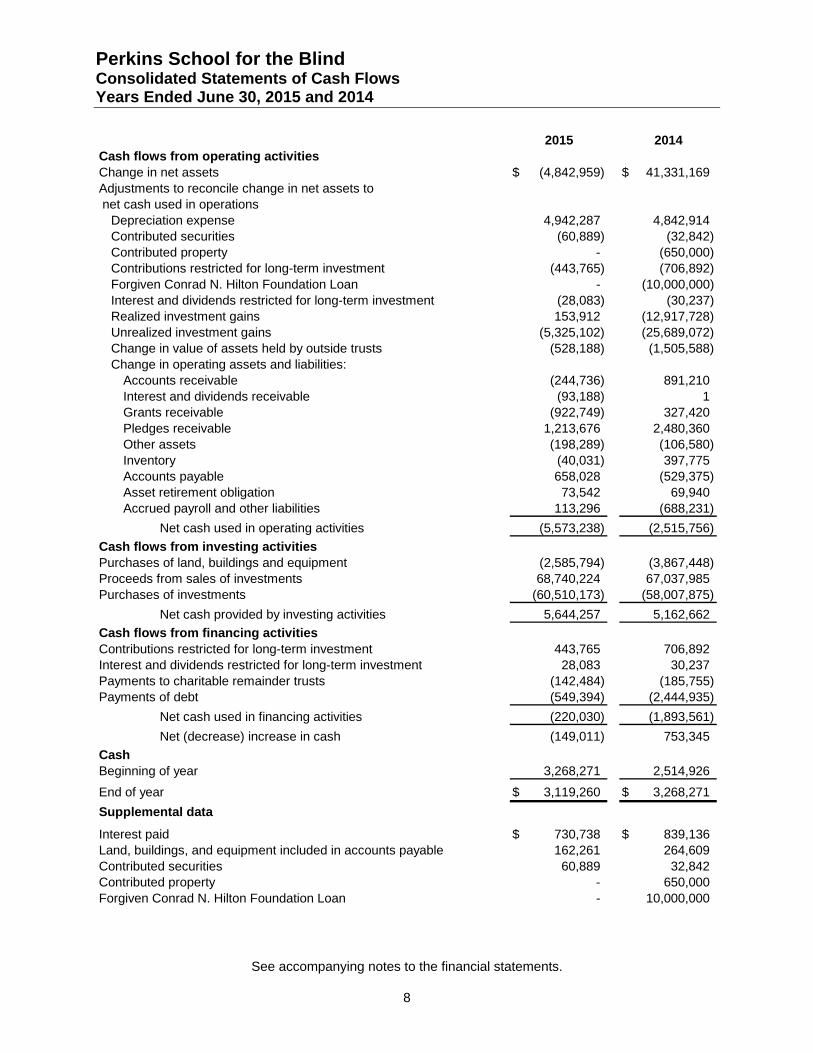
Perkins School for the Blind Consolidated Statements of Cash Flows Years Ended June 30, 2015 and 2014
See accompanying notes to the financial statements.
8
2015 2014Cash flows from operating activitiesChange in net assets (4,842,959)$ 41,331,169$ Adjustments to reconcile change in net assets to net cash used in operations
Depreciation expense 4,942,287 4,842,914Contributed securities (60,889) (32,842)Contributed property - (650,000)Contributions restricted for long-term investment (443,765) (706,892)Forgiven Conrad N. Hilton Foundation Loan - (10,000,000)Interest and dividends restricted for long-term investment (28,083) (30,237)Realized investment gains 153,912 (12,917,728)Unrealized investment gains (5,325,102) (25,689,072)Change in value of assets held by outside trusts (528,188) (1,505,588)Change in operating assets and liabilities:
Accounts receivable (244,736) 891,210Interest and dividends receivable (93,188) 1Grants receivable (922,749) 327,420Pledges receivable 1,213,676 2,480,360Other assets (198,289) (106,580)Inventory (40,031) 397,775Accounts payable 658,028 (529,375)Asset retirement obligation 73,542 69,940Accrued payroll and other liabilities 113,296 (688,231)
Net cash used in operating activities (5,573,238) (2,515,756)
Cash flows from investing activitiesPurchases of land, buildings and equipment (2,585,794) (3,867,448)Proceeds from sales of investments 68,740,224 67,037,985Purchases of investments (60,510,173) (58,007,875)
Net cash provided by investing activities 5,644,257 5,162,662
Cash flows from financing activitiesContributions restricted for long-term investment 443,765 706,892Interest and dividends restricted for long-term investment 28,083 30,237Payments to charitable remainder trusts (142,484) (185,755)Payments of debt (549,394) (2,444,935)
Net cash used in financing activities (220,030) (1,893,561)
Net (decrease) increase in cash (149,011) 753,345
CashBeginning of year 3,268,271 2,514,926
End of year 3,119,260$ 3,268,271$
Supplemental data
Interest paid 730,738$ 839,136$ Land, buildings, and equipment included in accounts payable 162,261 264,609Contributed securities 60,889 32,842Contributed property - 650,000Forgiven Conrad N. Hilton Foundation Loan - 10,000,000
Perkins School for the Blind Notes to the Consolidated Financial Statements June 30, 2015 and 2014
9
1. Organization
Perkins School for the Blind (the “School”) provides educational programs and services to individuals who are blind, deafblind or multi-impaired, and their parents and teachers. These services include the manufacture and distribution of educational products for individuals who are blind, deafblind or multi-impaired. This manufacture and distribution function is an integral part of the School’s operations. The School’s consolidated financial statements include two separate subsidiaries, referred to in Note 14 and 15, respectively: The John Milton Society for the Blind and the Kilimanjaro Blind Trust, Inc.
2. Summary of Significant Accounting Policies
(a) Basis of Presentation The financial statements have been prepared on the accrual basis of accounting in accordance with U.S. generally accepted accounting principles and present net assets and revenues, expenses, and gains and losses based on the existence or absence of donor-imposed restrictions. Accordingly, net assets and changes in net assets are classified as follows:
Unrestricted Net assets that are not subject to donor-imposed stipulations and available for general operations of the School. Unrestricted net assets may be designated for specific purposes by action of the Board of Trustees, including to function as endowment.
Temporarily Restricted Net assets subject to donor-imposed stipulations as to the timing of their availability or use for a particular purpose. Investment returns on donor-restricted endowment funds are classified as changes in temporarily restricted net assets and are generally available for appropriation to support operational needs in accordance with the School’s endowment spending policy and any restrictions on use imposed by donors.
Permanently Restricted Net assets subject to donor-imposed stipulations that they be maintained permanently by the School. The School classifies the following portions of donor-restricted endowment funds as permanently restricted net assets: (a) the original value of assets contributed to permanently restricted net assets, (b) subsequent contributions to such funds valued at the date of contribution, and (c) reinvested earnings on permanent endowment when specified by the donor.
(b) Revenues Revenues are reported as increases in unrestricted net assets unless their use is limited by donor-imposed restrictions or by law in which case they are reported as increases in temporarily or permanently restricted net assets. Expirations of temporarily restrictions are reflected in the statement of activities as net assets released from restrictions. Net realized gains (losses) from the sale or other disposition of investments and the change in unrealized appreciation (depreciation) of investments are reported as revenue in unrestricted net assets, unless use of these gains is restricted by donor-imposed stipulations or by law. Expenses are reported as decreases in unrestricted net assets. Contributions, including assets held by outside trusts and unconditional pledges, are recognized as revenues in the period received. Conditional promises to give are not recorded until they become unconditional, that is when the conditions on which they depend are substantially met.
Perkins School for the Blind Notes to the Consolidated Financial Statements June 30, 2015 and 2014
10
Contributions of land, buildings and equipment without donor stipulations concerning the use of such long-lived assets are reported as unrestricted revenues. Contributions of cash or other assets which a donor has stipulated be used to acquire land, building and equipment are reported as temporarily restricted revenues. The temporary restrictions are considered to be released at the time such long-lived assets are placed in service.
Revenues associated with contracts and grants are recognized as the related costs are incurred. Expenses consist of direct costs incurred and related indirect costs as reimbursed under the terms and conditions of such agreements.
Donated Services Revenues and expenses include the value of donated services which otherwise would have been performed by salaried personnel. The total donated services were valued at $600,262 and $624,637 in 2015 and 2014, respectively, and are classified as unrestricted revenue.
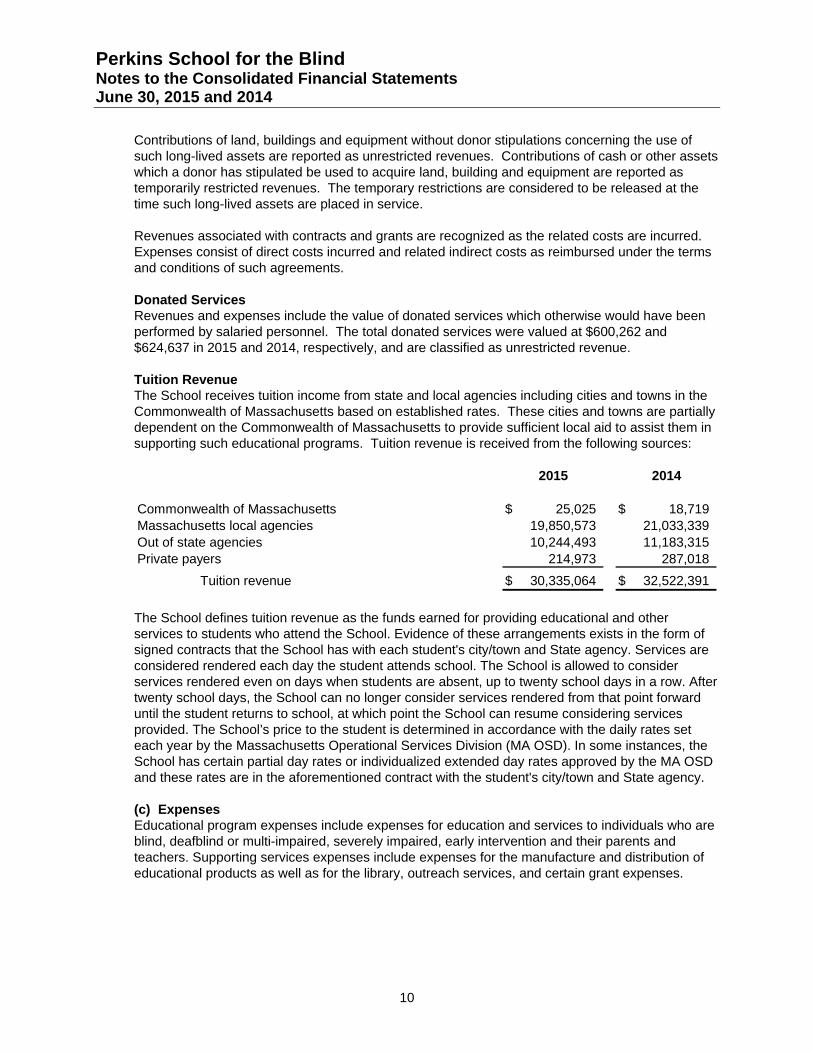
Tuition Revenue The School receives tuition income from state and local agencies including cities and towns in the Commonwealth of Massachusetts based on established rates. These cities and towns are partially dependent on the Commonwealth of Massachusetts to provide sufficient local aid to assist them in supporting such educational programs. Tuition revenue is received from the following sources:
2015 2014
Commonwealth of Massachusetts 25,025$ 18,719$ Massachusetts local agencies 19,850,573 21,033,339Out of state agencies 10,244,493 11,183,315Private payers 214,973 287,018
Tuition revenue 30,335,064$ 32,522,391$ The School defines tuition revenue as the funds earned for providing educational and other services to students who attend the School. Evidence of these arrangements exists in the form of signed contracts that the School has with each student's city/town and State agency. Services are considered rendered each day the student attends school. The School is allowed to consider services rendered even on days when students are absent, up to twenty school days in a row. After twenty school days, the School can no longer consider services rendered from that point forward until the student returns to school, at which point the School can resume considering services provided. The School’s price to the student is determined in accordance with the daily rates set each year by the Massachusetts Operational Services Division (MA OSD). In some instances, the School has certain partial day rates or individualized extended day rates approved by the MA OSD and these rates are in the aforementioned contract with the student's city/town and State agency.
(c) Expenses Educational program expenses include expenses for education and services to individuals who are blind, deafblind or multi-impaired, severely impaired, early intervention and their parents and teachers. Supporting services expenses include expenses for the manufacture and distribution of educational products as well as for the library, outreach services, and certain grant expenses.
Perkins School for the Blind Notes to the Consolidated Financial Statements June 30, 2015 and 2014
11
(d) Functional Allocation of Expenses The School used several different methods to allocate costs to the programs, administrative, supporting services and fundraising functions. Time and expense reports and after-the-fact determinations of effort were used to distribute salary and wage expenses. Other expenses were allocated using one of the following bases: salary and wages; student full-time equivalents; square footage, or some other appropriate base.
(e) Nonoperating Activities The Statement of Activities reports the changes in net assets from operating and nonoperating activities. Nonoperating activities include gifts and legacies, investment income, realized and unrealized gains on investments, changes in value of split interests, and other nonoperating revenues during the year. Nonoperating activities are classified as unrestricted, temporarily restricted or permanently restricted. To the extent the restrictions on temporarily restricted gifts and legacies are not met within the year, they are classified as temporarily restricted. Subsequently, as the restrictions are met and used for operations, they are reclassified as net assets released from restrictions on the Statement of Activities. All other activity is classified as operating activities. (f) Cash and Cash Equivalents The School maintains its cash at one institution. The School maintains its cash in deposit accounts which, at times, may exceed federally insured limits. The School has not experienced any losses in such accounts. The School believes it is not exposed to any significant credit risk on cash. Cash equivalents consist of short-term highly liquid investments with maturities of 90 days or less at date of purchase and are included in the investment section of the Statement of Financial Position.
(g) Land, Buildings and Equipment Land, buildings and equipment are recorded at cost if purchased or constructed or at fair market or appraised value on the date of donation in the case of gifts.
Depreciation expense is computed on the straight-line basis using the following useful lives:
Automobiles 5 yearsFurniture and equipment 3–7 yearsMachinery and equipment 10 yearsBuilding improvements 20 yearsBuilding 27.5–40 years
Maintenance and repairs are expensed as incurred, and improvements are capitalized. When assets are retired or disposed of, the cost and accumulated depreciation thereon are removed from the accounts, and gains or losses are included in operations.
Perkins School for the Blind Notes to the Consolidated Financial Statements June 30, 2015 and 2014
12
(h) Asset Retirement Obligations Asset retirement obligations (“ARO”) are legal obligations associated with the retirement of long lived assets. These liabilities are initially recorded at fair value and the related asset retirement costs are capitalized by increasing the carrying amount of the related assets by the same amount as the liability. Asset retirement costs are subsequently depreciated over the useful lives of the related assets. Subsequent to the initial recognition, the School records period-to-period changes in the ARO liability resulting from the passage of time and revisions to either the timing or the amount of the original estimate of undiscounted cash flows. The School adjusts the ARO liabilities when the related obligations are settled. The asset retirement obligations were reported for the following amounts $1,621,285 and $1,547,743 for 2015 and 2014, respectively, in the Statement of Financial Position.
(i) Fair Value Measurements The School reports required types of assets and liabilities at fair value. Fair value represents the price that would be received upon the sale of an asset or paid upon the transfer of a liability in an orderly transaction between market participants as of the measurement date. GAAP establishes a fair value hierarchy that prioritizes inputs used to measure fair value into three levels:
Level 1 – Valuation based on quoted prices (unadjusted) in active markets that are accessible at the measurement date for identical assets or liabilities.
Level 2 – Valuations based on inputs other than quoted prices that are observable for the asset or liability, either directly or indirectly.
Level 3 – Valuations based on unobservable inputs are used in situation in which little or no market data is available.
The fair value hierarchy gives the highest priority to Level 1 inputs and the lowest priority to Level 3 inputs. The School utilizes the valuation techniques that maximizes the use of observable inputs and minimizes the use of unobservable inputs to the extent possible. Transfers between categories occur when there is an event that changes the inputs used to measure the fair value of an asset or liability. Transfers between fair value categories are recognized at the end of the reporting period.
The estimated fair values of the School's financial instruments not measured at fair value, including cash and cash equivalents, receivables, accounts payable, and accrued liabilities approximated their carrying values based on the generally shorter-term nature of these items as of June 30, 2015 and 2014. Utilizing available pricing information provided by a third party and other inputs that would be classified in Level 2 of the fair value hierarchy, management determined the estimated fair value of the School's long-term debt was $24,161,777 and $25,081,432 at June 30, 2015 and 2014, respectively. (j) Assets Held by Outside Trusts The School has a number of Outside Trusts where the School is an income beneficiary. The Assets of these Outside Trusts are to be held in perpetuity by the financial agency in charge of the trust. Perkins takes the percentage of this trust that belongs to the School and books the year end market value of that percentage on the School’s Statement of Financial Position each year. Adjustments to the value of these trusts flow through the Statement of Activities as Changes in value of split interests. The School receives income from these trusts and it is booked as it is received on the Statement of Activities as Income from Outside trusts. If there is a donor restriction on the income received, it is booked as temporarily or permanently restricted income.

Perkins School for the Blind Notes to the Consolidated Financial Statements June 30, 2015 and 2014
13
(k) Use of Estimates The preparation of financial statements in conformity with accounting principles generally accepted in the United States requires management to make estimates and assumptions that affect the reported amounts of assets and liabilities and disclosure of contingent assets and liabilities at the date of the financial statements and the reported amounts of revenues and expenses during the reporting period. Estimates are used in the allowance for doubtful accounts and reserve for inventory excess and obsolescence. Actual results could differ from those estimates.
(l) Tax Status The School is a tax-exempt organization as described under Section 501(c)(3) of the Internal Revenue Code (IRC) and is generally exempt from federal and state income taxes under Section 501(a) of the IRC and applicable state laws. The School believes it has no significant uncertain tax positions.
(m) Reclassifications Certain 2014 information has been reclassified to conform to the 2015 presentation.
3. Pledges Receivable
Pledges receivable as of June 30, 2015 and 2014 are expected to be realized in the following time frame:
2015 2014
One year or less 1,443,837$ 1,671,555$ Between one year and seven 994,939 2,042,896Less: Discount (33,693) (95,692)
Pledges receivables, net 2,405,083$ 3,618,759$
Pledges are recorded after discounting to the present value of future cash flows with discount rates ranging from 1.69% to 3.23% depending upon the anticipated pledge fulfillment date.
4. Inventory
Inventory consists of raw materials, work in progress and finished goods related to the production of braillers, appliances and other products of the Perkins Solutions Division and are stated at the lower of cost (first-in, first-out method) or market.
The components of inventory at June 30, 2015 and 2014 include the following:
2015 2014
Raw material 1,852,300$ 1,836,054$ Work in progress 1,616,521 2,400,680Finished goods 1,469,631 546,667Inventory reserve (314,084) (199,064)
Net inventory 4,624,368$ 4,584,337$

Perkins School for the Blind Notes to the Consolidated Financial Statements June 30, 2015 and 2014
14
5. Investments
The investment objective of the School is to invest its assets in a prudent manner to achieve a long-term rate of return sufficient to fund a portion of its spending and to increase investment value after inflation. The School diversifies its investments among asset classes by incorporating several strategies and managers. Major investment decisions are authorized by the School’s Trustee Investment Committee that oversees the School’s investments.
In addition to equity and fixed income investments, the School may also hold shares or units in institutional funds and alternative investment funds involving hedged and private equity strategies. Hedged strategies involve funds whose managers have the authority to invest in various asset classes at their discretion, including the ability to invest long and short. Funds with hedged strategies generally hold securities or other financial instruments for which a ready market exists, and may include stocks, bonds and securities sold short and often require the estimation of fair values by the fund managers in the absence of readily determinable market values. Because of the inherent uncertainties of valuation, these estimated fair values may differ significantly from values that would have been used had a ready market existed, and the differences could be material. Such valuations are determined by fund managers and generally consider variables such as operating results, comparable earnings multiples, projected cash flows, recent sales prices, and other pertinent information, and may reflect discounts for the illiquid nature of certain investments held. Investments also include assets associated with gift annuities.
Investments are reported at estimated fair value. If an investment is held directly by the School and an active market with quoted prices exists, the market price of an identical security is used as the reported fair value. Reported fair values for shares in registered mutual funds are based on share prices reported by the funds as of the last business day of the fiscal year. The School’s interests in alternative investment funds are generally reported at net asset values (NAV) reported by fund managers, which are used as a practical expedient to estimate the fair value of the School’s interests therein, unless it is probable that all or a portion of the investment will be sold for an amount different from NAV. As of June 30, 2015 and 2014, the School had no plans or intentions to sell investments at amounts different from NAV.
Registered mutual funds are classified in Level 1 of the fair value hierarchy. The School’s fixed income strategy includes directly held U.S. corporate bonds, which although readily marketable are valued using matrix pricing and are classified in Level 2. Most investments classified in Levels 2 and 3 consist of shares or units in nonregistered investment funds as opposed to direct interests in the funds’ underlying securities, which may be readily marketable or not difficult to value. Because the NAV reported by each fund is used as a practical expedient to estimate the fair value of the School’s interests therein, its classification in Level 2 or 3 is based on the School’s ability to redeem its interest at or near the balance sheet date. If the interest can be redeemed in the near term, the investment is classified in Level 2. Accordingly, the inputs or methodology used for valuing or classifying investments for financial reporting purposes are not necessarily an indication of the risks associated with those investments or a reflection of the liquidity of or degree of difficulty in estimating the fair value of each fund’s underlying assets and liabilities.
Perkins School for the Blind Notes to the Consolidated Financial Statements June 30, 2015 and 2014
15
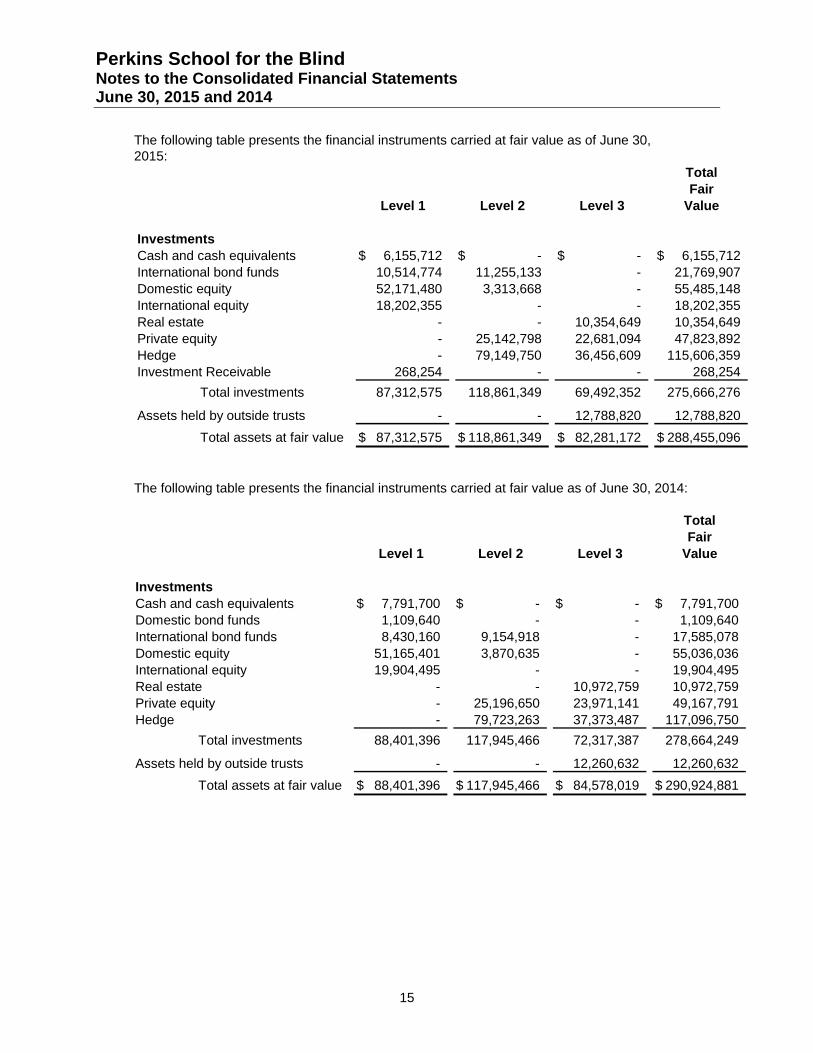
The following table presents the financial instruments carried at fair value as of June 30, 2015:
TotalFair
Level 1 Level 2 Level 3 Value
InvestmentsCash and cash equivalents 6,155,712$ -$ -$ 6,155,712$ International bond funds 10,514,774 11,255,133 - 21,769,907Domestic equity 52,171,480 3,313,668 - 55,485,148International equity 18,202,355 - - 18,202,355Real estate - - 10,354,649 10,354,649Private equity - 25,142,798 22,681,094 47,823,892Hedge - 79,149,750 36,456,609 115,606,359Investment Receivable 268,254 - - 268,254
Total investments 87,312,575 118,861,349 69,492,352 275,666,276
Assets held by outside trusts - - 12,788,820 12,788,820
Total assets at fair value 87,312,575$ 118,861,349$ 82,281,172$ 288,455,096$
The following table presents the financial instruments carried at fair value as of June 30, 2014:
TotalFair
Level 1 Level 2 Level 3 Value
InvestmentsCash and cash equivalents 7,791,700$ -$ -$ 7,791,700$ Domestic bond funds 1,109,640 - - 1,109,640International bond funds 8,430,160 9,154,918 - 17,585,078Domestic equity 51,165,401 3,870,635 - 55,036,036International equity 19,904,495 - - 19,904,495Real estate - - 10,972,759 10,972,759Private equity - 25,196,650 23,971,141 49,167,791Hedge - 79,723,263 37,373,487 117,096,750
Total investments 88,401,396 117,945,466 72,317,387 278,664,249
Assets held by outside trusts - - 12,260,632 12,260,632
Total assets at fair value 88,401,396$ 117,945,466$ 84,578,019$ 290,924,881$

Perkins School for the Blind Notes to the Consolidated Financial Statements June 30, 2015 and 2014
16
Investments included in Level 3 primarily consist of the School’s ownership in alternative investments (principally limited partnership interests in hedge funds, private equity, real estate, and other similar funds). The value of certain alternative investments represents the ownership interest in the net asset value (NAV) of the respective partnership. The fair values (NAV) of the securities held by limited partnerships that do not have readily determinable fair values are determined by the general partner and are based on appraisals, or other estimates that require varying degrees of judgment. If no public market exists for the investment securities, the fair value is determined by the general partner taking into consideration, among other things, the cost of the securities, prices of recent significant placements of securities of the same issuer, and subsequent developments concerning the companies to which the securities relate.
Assets held by outside trusts are valued at the present value of the future distributions expected to be received over the term of the agreement.
The methods described above may produce a fair value calculation that may not be indicative of net realizable value or reflective of future fair values. Furthermore, while the School believes its valuation methods are appropriate and consistent with other market participants, the use of different methodologies or assumptions to determine the fair value of certain financial instruments could result in a different estimate of fair value at the reporting date.
The following tables present activity for the years ended June 30, 2015 and 2014 for long term investments classified in level 3 of the fair value hierarchy:
Fair Value Realized Unrealized Fair ValueJune 30, 2014 Gains Gains (Losses) Purchases Sales June 30, 2015
Real estate 10,972,759 - 1,035,253 - (1,653,363) 10,354,649 Private equity 23,971,141 431,997 2,473,884 2,647,293 (6,843,221) 22,681,094 Hedge Funds 37,373,487 84,701 (1,001,579) - - 36,456,609
Total investments 72,317,387 516,698 2,507,558 2,647,293 (8,496,584) 69,492,352
Assets held by outside trusts 12,260,632 - 528,188 - - 12,788,820
Total investments 84,578,019$ 516,698$ 3,035,746$ 2,647,293$ (8,496,584)$ 82,281,172$
Fair Value Realized Unrealized Fair ValueJuly 1, 2013 Gains Gains (Losses) Purchases Sales June 30, 2014
Real estate 11,381,362$ -$ 987,534$ -$ (1,396,137)$ 10,972,759$ Private equity 21,710,113 666,116 3,309,238 3,782,414 (5,496,740) 23,971,141Hedge Funds 36,042,787 6,272,047 (1,958,300) 12,000,000 (14,983,047) 37,373,487
Total investments 69,134,262 6,938,163 2,338,472 15,782,414 (21,875,924) 72,317,387
Assets held by outside trusts 10,755,044 - 1,505,588 - - 12,260,632
Total investments 79,889,306$ 6,938,163$ 3,844,060$ 15,782,414$ (21,875,924)$ 84,578,019$
For purposes of recording realized and unrealized gains and losses, the cost of securities sold is determined on a specific identification basis.
Perkins School for the Blind Notes to the Consolidated Financial Statements June 30, 2015 and 2014
17
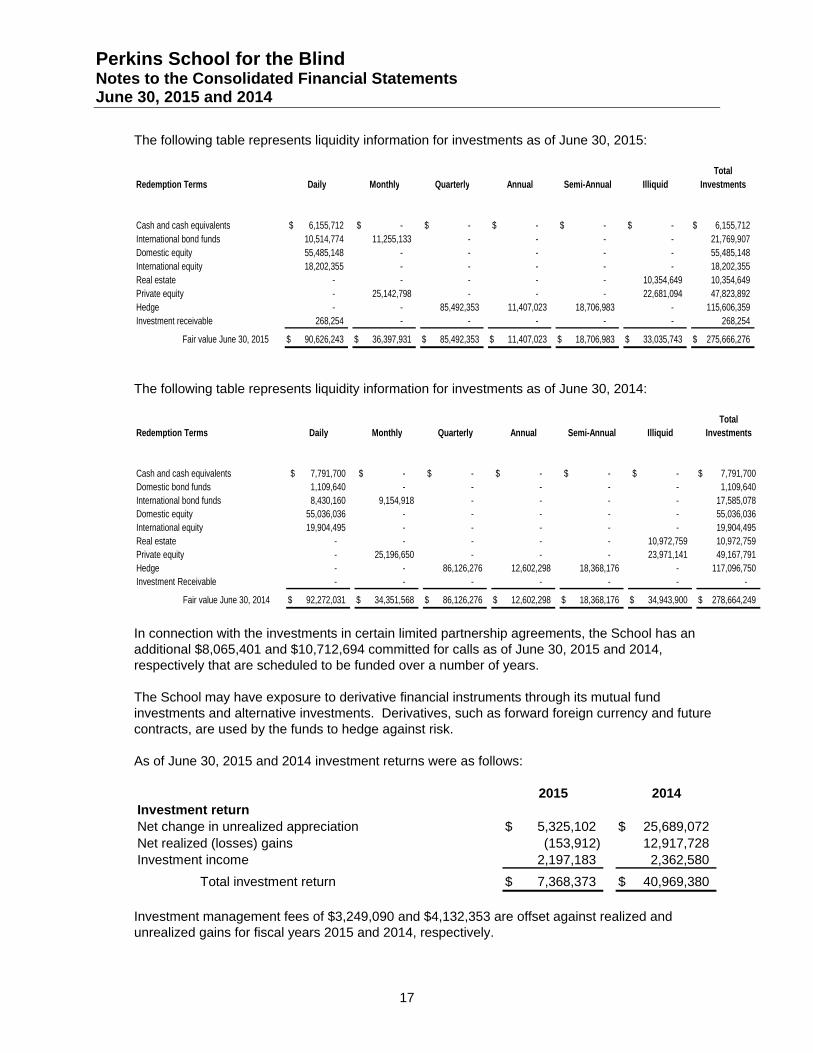
The following table represents liquidity information for investments as of June 30, 2015:
TotalRedemption Terms Daily Monthly Quarterly Annual Semi-Annual Illiquid Investments
Cash and cash equivalents 6,155,712$ -$ -$ -$ -$ -$ 6,155,712$ International bond funds 10,514,774 11,255,133 - - - - 21,769,907 Domestic equity 55,485,148 - - - - - 55,485,148 International equity 18,202,355 - - - - - 18,202,355 Real estate - - - - - 10,354,649 10,354,649 Private equity - 25,142,798 - - - 22,681,094 47,823,892 Hedge - - 85,492,353 11,407,023 18,706,983 - 115,606,359 Investment receivable 268,254 - - - - - 268,254
Fair value June 30, 2015 90,626,243$ 36,397,931$ 85,492,353$ 11,407,023$ 18,706,983$ 33,035,743$ 275,666,276$
The following table represents liquidity information for investments as of June 30, 2014:
TotalRedemption Terms Daily Monthly Quarterly Annual Semi-Annual Illiquid Investments
Cash and cash equivalents 7,791,700$ -$ -$ -$ -$ -$ 7,791,700$ Domestic bond funds 1,109,640 - - - - - 1,109,640 International bond funds 8,430,160 9,154,918 - - - - 17,585,078 Domestic equity 55,036,036 - - - - - 55,036,036 International equity 19,904,495 - - - - - 19,904,495 Real estate - - - - - 10,972,759 10,972,759 Private equity - 25,196,650 - - - 23,971,141 49,167,791 Hedge - - 86,126,276 12,602,298 18,368,176 - 117,096,750 Investment Receivable - - - - - - -
Fair value June 30, 2014 92,272,031$ 34,351,568$ 86,126,276$ 12,602,298$ 18,368,176$ 34,943,900$ 278,664,249$
In connection with the investments in certain limited partnership agreements, the School has an additional $8,065,401 and $10,712,694 committed for calls as of June 30, 2015 and 2014, respectively that are scheduled to be funded over a number of years.
The School may have exposure to derivative financial instruments through its mutual fund investments and alternative investments. Derivatives, such as forward foreign currency and future contracts, are used by the funds to hedge against risk.
As of June 30, 2015 and 2014 investment returns were as follows:
2015 2014Investment returnNet change in unrealized appreciation 5,325,102$ 25,689,072$ Net realized (losses) gains (153,912) 12,917,728Investment income 2,197,183 2,362,580
Total investment return 7,368,373$ 40,969,380$
Investment management fees of $3,249,090 and $4,132,353 are offset against realized and unrealized gains for fiscal years 2015 and 2014, respectively.
Perkins School for the Blind Notes to the Consolidated Financial Statements June 30, 2015 and 2014
18
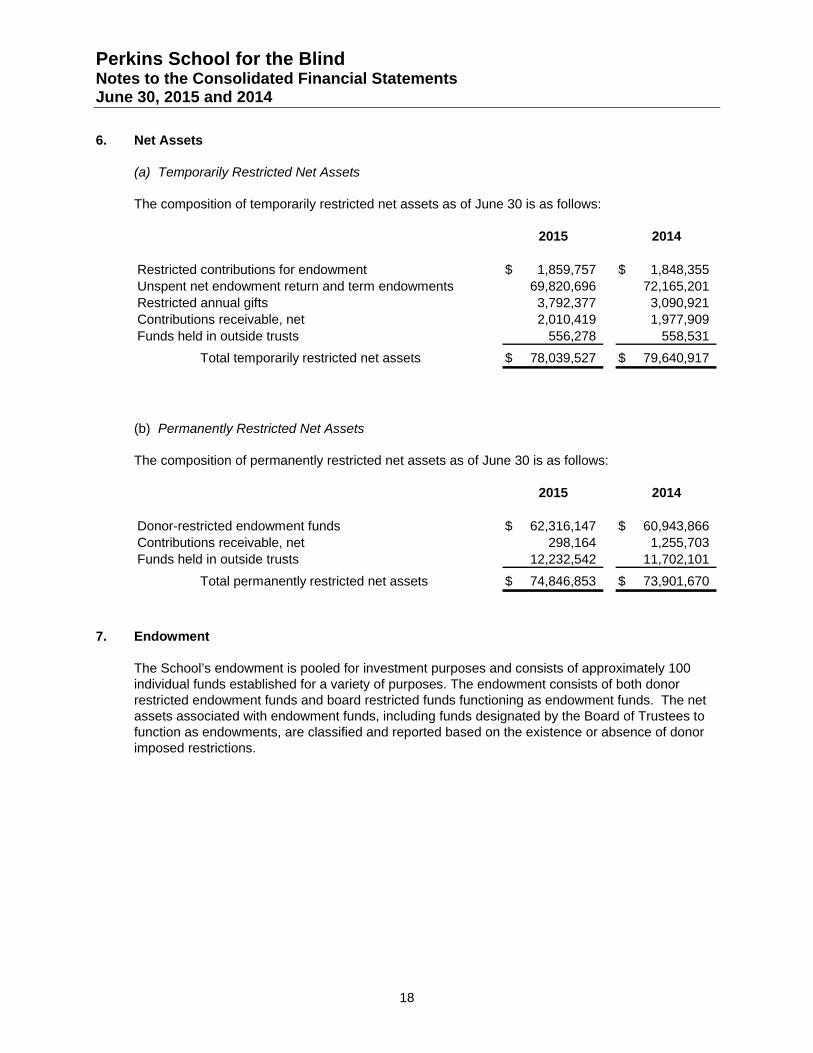
6. Net Assets
(a) Temporarily Restricted Net Assets
The composition of temporarily restricted net assets as of June 30 is as follows:
2015 2014
Restricted contributions for endowment 1,859,757$ 1,848,355$ Unspent net endowment return and term endowments 69,820,696 72,165,201Restricted annual gifts 3,792,377 3,090,921Contributions receivable, net 2,010,419 1,977,909Funds held in outside trusts 556,278 558,531
Total temporarily restricted net assets 78,039,527$ 79,640,917$
(b) Permanently Restricted Net Assets
The composition of permanently restricted net assets as of June 30 is as follows:
2015 2014
Donor-restricted endowment funds 62,316,147$ 60,943,866$ Contributions receivable, net 298,164 1,255,703Funds held in outside trusts 12,232,542 11,702,101
Total permanently restricted net assets 74,846,853$ 73,901,670$
7. Endowment
The School’s endowment is pooled for investment purposes and consists of approximately 100 individual funds established for a variety of purposes. The endowment consists of both donor restricted endowment funds and board restricted funds functioning as endowment funds. The net assets associated with endowment funds, including funds designated by the Board of Trustees to function as endowments, are classified and reported based on the existence or absence of donor imposed restrictions.

Perkins School for the Blind Notes to the Consolidated Financial Statements June 30, 2015 and 2014
19
The Board of Trustees of the School has interpreted the “Uniform Prudent Management of Institutional Funds Act” (UPMIFA) as requiring the preservation of the original gift as of the gift date of the donor-restricted endowment funds absent explicit donor stipulations to the contrary. As a result of this interpretation, the School classifies as permanently restricted net assets, (a) the original value of gifts donated to the permanent endowment, (b) the original value of subsequent gifts to the permanent endowment, and (c) accumulations to the permanent endowment made in accordance with the direction of the applicable donor gift instrument at the time the accumulation is added to the fund. The remaining portion of the donor-restricted endowment fund that is not classified in permanently restricted net assets is classified as temporarily restricted net assets until those amounts are appropriated for expenditure by the School in a manner consistent with the standard of prudence prescribed by UPMIFA. In accordance with UPMIFA, the School considers the following factors in making a determination to appropriate or accumulate endowment funds:
The duration and preservation of the fund.
The purposes of the School and the donor restricted endowment fund.
General economic conditions.
The possible effect of inflation and deflation.
The expected total return from income and the appreciation of investments.
Other resources of the School.
The investment policies of the School.
The School had the following endowment activities during the years ended June 30, 2015 and 2014 delineated by net asset class and donor-restricted versus undesignated funds:
Endowment composition by type of fund as of June 30, 2015:
Temporarily PermanentlyUnrestricted Restricted Restricted Total
Donor restricted -$ 71,680,453$ 62,316,147$ 133,996,600$ Quasi (Board-designated) 141,399,460 - - 141,399,460
Total 141,399,460$ 71,680,453$ 62,316,147$ 275,396,060$
Perkins School for the Blind Notes to the Consolidated Financial Statements June 30, 2015 and 2014
20
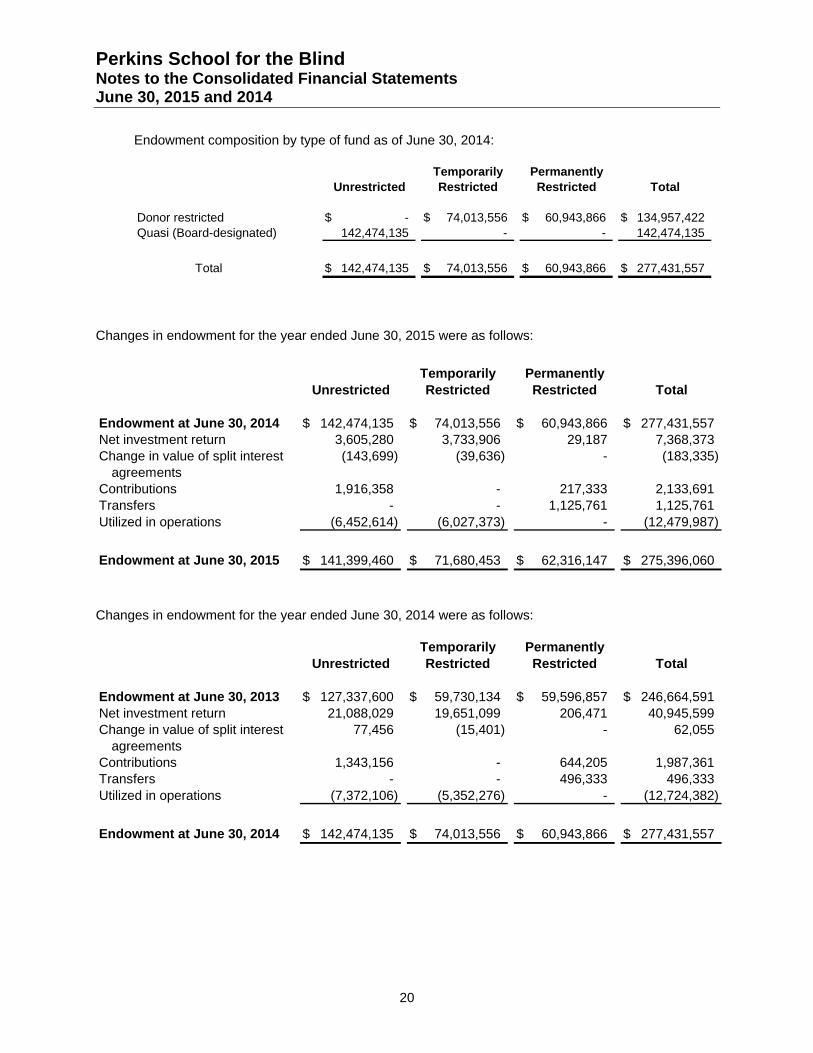
Endowment composition by type of fund as of June 30, 2014:
Temporarily PermanentlyUnrestricted Restricted Restricted Total
Donor restricted -$ 74,013,556$ 60,943,866$ 134,957,422$ Quasi (Board-designated) 142,474,135 - - 142,474,135
Total 142,474,135$ 74,013,556$ 60,943,866$ 277,431,557$
Changes in endowment for the year ended June 30, 2015 were as follows:
Temporarily Permanently
Unrestricted Restricted Restricted Total
Endowment at June 30, 2014 142,474,135$ 74,013,556$ 60,943,866$ 277,431,557$ Net investment return 3,605,280 3,733,906 29,187 7,368,373Change in value of split interest (143,699) (39,636) - (183,335)
agreementsContributions 1,916,358 - 217,333 2,133,691Transfers - - 1,125,761 1,125,761Utilized in operations (6,452,614) (6,027,373) - (12,479,987)
Endowment at June 30, 2015 141,399,460$ 71,680,453$ 62,316,147$ 275,396,060$
Changes in endowment for the year ended June 30, 2014 were as follows:
Temporarily PermanentlyUnrestricted Restricted Restricted Total
Endowment at June 30, 2013 127,337,600$ 59,730,134$ 59,596,857$ 246,664,591$ Net investment return 21,088,029 19,651,099 206,471 40,945,599Change in value of split interest 77,456 (15,401) - 62,055
agreementsContributions 1,343,156 - 644,205 1,987,361Transfers - - 496,333 496,333Utilized in operations (7,372,106) (5,352,276) - (12,724,382)
Endowment at June 30, 2014 142,474,135$ 74,013,556$ 60,943,866$ 277,431,557$
Perkins School for the Blind Notes to the Consolidated Financial Statements June 30, 2015 and 2014
21
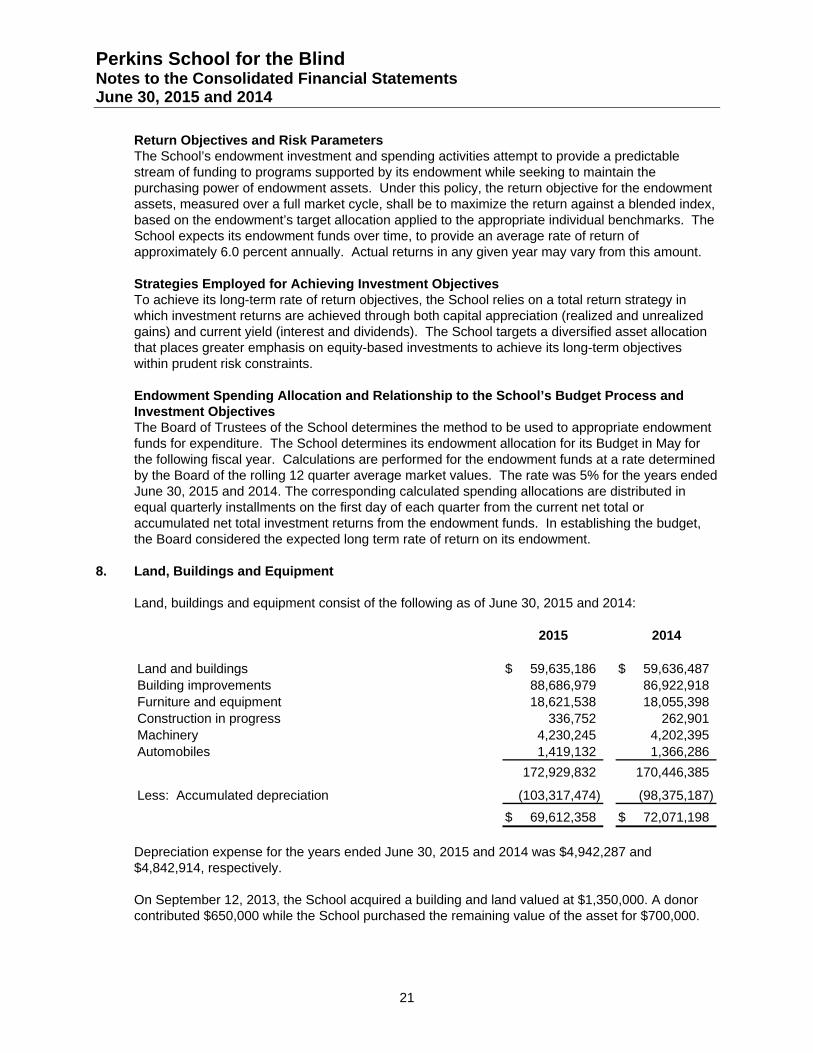
Return Objectives and Risk Parameters The School’s endowment investment and spending activities attempt to provide a predictable stream of funding to programs supported by its endowment while seeking to maintain the purchasing power of endowment assets. Under this policy, the return objective for the endowment assets, measured over a full market cycle, shall be to maximize the return against a blended index, based on the endowment’s target allocation applied to the appropriate individual benchmarks. The School expects its endowment funds over time, to provide an average rate of return of approximately 6.0 percent annually. Actual returns in any given year may vary from this amount.
Strategies Employed for Achieving Investment Objectives To achieve its long-term rate of return objectives, the School relies on a total return strategy in which investment returns are achieved through both capital appreciation (realized and unrealized gains) and current yield (interest and dividends). The School targets a diversified asset allocation that places greater emphasis on equity-based investments to achieve its long-term objectives within prudent risk constraints.
Endowment Spending Allocation and Relationship to the School’s Budget Process and Investment Objectives The Board of Trustees of the School determines the method to be used to appropriate endowment funds for expenditure. The School determines its endowment allocation for its Budget in May for the following fiscal year. Calculations are performed for the endowment funds at a rate determined by the Board of the rolling 12 quarter average market values. The rate was 5% for the years ended June 30, 2015 and 2014. The corresponding calculated spending allocations are distributed in equal quarterly installments on the first day of each quarter from the current net total or accumulated net total investment returns from the endowment funds. In establishing the budget, the Board considered the expected long term rate of return on its endowment.
8. Land, Buildings and Equipment
Land, buildings and equipment consist of the following as of June 30, 2015 and 2014:
2015 2014
Land and buildings 59,635,186$ 59,636,487$ Building improvements 88,686,979 86,922,918Furniture and equipment 18,621,538 18,055,398Construction in progress 336,752 262,901Machinery 4,230,245 4,202,395Automobiles 1,419,132 1,366,286
172,929,832 170,446,385
Less: Accumulated depreciation (103,317,474) (98,375,187)
69,612,358$ 72,071,198$
Depreciation expense for the years ended June 30, 2015 and 2014 was $4,942,287 and $4,842,914, respectively.
On September 12, 2013, the School acquired a building and land valued at $1,350,000. A donor contributed $650,000 while the School purchased the remaining value of the asset for $700,000.

Perkins School for the Blind Notes to the Consolidated Financial Statements June 30, 2015 and 2014
22
9. Retirement Plan
The Retirement Plan (the “Plan”) qualifies under code Sections 401(a), 501(a), and 404(c) of the Internal Revenue Code. The Plan has discretionary basic contributions and supplemental discretionary contributions.
Employees with a year of continuous service who work 500 or more hours qualify for the discretionary basic contributions of the Plan. Contributions are determined annually by the Board of Trustees based on a percentage of eligible gross salary. The School contributed 3.5% of eligible employees’ salaries to the Plan in 2015 and 2014. Total pension expense for the years ended June 30, 2015 and 2014 was $968,440 and $985,686, respectively, for the discretionary basic portion of the Plan.
The supplemental discretionary contributions of the Plan are made by the School based on employees’ years of service. Total pension expense under this portion of the Plan for the years ended June 30, 2015 and 2014 was $1,353,370 and $1,294,274, respectively.
10. Conrad N. Hilton Foundation Grant
In 1989, the Hilton/Perkins Program (the “Program”) was established with a five-year grant from the Conrad N. Hilton Foundation (the “Foundation”). The purpose of the Program is to develop programs for the multi-handicapped blind individuals and their parents and teachers. In 1994, 1999, 2004 and 2009, the Foundation approved additional five-year grants for the purpose of continuing the Program and establishing the Conrad N. Hilton Endowment Fund at the School. In 2009, a five-year grant of $5,000,000 was approved and the final payment of $250,000 was received in fiscal year 2014.
11. Conrad N. Hilton Foundation Loan
The Conrad N. Hilton Foundation (the “Foundation”) approved a $15,000,000 loan in support of the Hilton/Perkins Program (the “Program”). The terms of the agreement initially included payment in three installments of $5,000,000 every five years beginning March 1, 1994. The loan, which proceeds are to be invested, was originally set to mature March 1, 2009. The terms of the loan agreement were modified on September 24, 2008 to repay $5,000,000 of the loan on March 1, 2009 and to extend the remaining balance of the loan until March 1, 2014. The Foundation forgave the remaining loan balance of $10,000,000 on its due date of March 1, 2014 and instructed the School to use the forgiven balance to create a permanently restricted endowment.
While the loan was still in place in fiscal year 2014, interest was payable quarterly to the Foundation at a rate of 2% per annum. A total of $0 and $133,333 was expensed for each of the years ended June 30, 2015 and 2014.

Perkins School for the Blind Notes to the Consolidated Financial Statements June 30, 2015 and 2014
23
12. Bond and Loan Payable
Bond Payable The Massachusetts Development Finance Agency issued $30 million in Revenue Bonds, Perkins School for the Blind Issue, Series 2010. On February 12, 2010, these Bonds, maturing in 2035, were issued at a fixed rate of 4.5% for 15 years with a 25 year amortization schedule. The bond is subject to mandatory tender by the Bondowner on February 1, 2025. The Bondowner is TD BANK. On September 10, 2012, the Bond was amended with a fix rate of 2.774% for the remaining years with the same amortization schedule and covenants of the original issuance on February 12, 2010. The School has covenants of banking relationships, ratios and reporting requirements during each year. The bank requires the School to maintain a liquidity ratio. The School has met all of its covenants at June 30, 2015 and 2014. The proceeds of the Bond were for the Lower School Project and a Central Cooling Plant, (Construction Project). During the first eighteen months, the School was obligated to pay interest only on the bonds. As of June 30, 2015 and 2014, the outstanding bond is $27,948,475 and $28,497,869, respectively. The aggregate maturities for all bonds payable for the years ending June 30 were as follows: Year Ended June 30,2016 571,482$ 2017 601,6142018 629,6442019 658,9802020 and thereafter 25,486,755
Carrying amount of Bond 27,948,475$
Loan Payable On December 1, 2010, the School entered into a two year Construction Credit Note (loan) for up to $10,000,000 with TD BANK for the construction of the Grousbeck Center for Students and Technology with interest only payments due on the outstanding balance at a variable rate of interest 1.60% above London Interbank Offered Rate (LIBOR) each month. The loan converted to a term loan on December 1, 2012 with a maturity date of December 1, 2014, with principal and interest due monthly. The loan had the same covenants as the Bond. The loan was fully paid off on January 21,, 2014.
For fiscal years 2015 and 2014 the bond and loan interest expense was $795,457 and $831,400 respectively.
13. Commitments and Contingencies
The School is engaged in legal cases that have arisen in the normal course of its operations. The School believes that the outcomes of these cases will not have a material adverse effect on the financial position of the School.

Perkins School for the Blind Notes to the Consolidated Financial Statements June 30, 2015 and 2014
24
14. John Milton Society
John Milton Society received $223 and $200 related to gifts and earned $73 and $76 in investment returns in 2015 and 2014, respectively. The John Milton Society had expenses of $35,903 and $37,778 during fiscal years 2015 and 2014 and had $682,455 and $718,062 in net assets at June 30, 2015 and 2014, respectively. According to a New York court ruling, the John Milton Society unrestricted net assets are to be used by Perkins School for the Blind and the restricted net assets should be used for the restricted purposes originally designated by the donors. Accordingly, the assets received from the John Milton Society have been recorded as either a temporarily or permanently restricted contribution. There were no inter-company transactions during the fiscal year.
15. Kilimanjaro Blind Trust, Inc.
On December 12, 2006, the Kilimanjaro Blind Trust, Inc. was incorporated as a Section 501(c)(3) organization. Its mission is to raise funds to support Perkins School for the Blind. During the fiscal years ended June 30, 2015 and 2014, the Kilimanjaro Blind Trust raised $14,827 and $54,102, respectively, in gifts and pledges and investment returns of $16,325 and $85,685, respectively. The Trust had expenses of $297,959 and $269,238 in fiscal years 2015 and 2014, respectively. The Trust had $636,737 and $903,544 in net assets at June 30, 2015 and 2014, respectively. There were no inter-company transactions during the fiscal year.
16. Related Parties
Members of the School’s Board of Trustees and senior management may, from time to time, be associated, either directly or indirectly, with companies doing business with the School. The School as a written conflict of interest policy that requires, among other things, that no member of the Board of Trustees may participate in any decision in which he or she has a material financial interest. Each Trustee is required to certify compliance with the conflict of interest policy on an annual basis as well as disclose any potential related party transactions to the audit committee. When such a relationship exists, the School requires that such transactions be conducted at arms’ length with terms that are fair and reasonable to and for the benefit of the School. For senior management, the School requires annual disclosure of significant financial interests in, or governance of employment or consulting relationships with, entities doing business with the School. When such relationships exist, measures are taken to appropriately manage the actual or perceived conflict in the best interest of the School.
17. Subsequent Events
Management has evaluated events subsequent to June 30, 2015 and through October 22, 2015, the date on which these audited consolidated financial statements were issued and concluded that there were no subsequent events.