perishables markets modal shift -...
TRANSCRIPT
1
BerlinMarch 15-17, 2016IATA World Cargo Symposium
Perishables Markets – Modal Shift - Trends
Gerard de WitWorldACD Market Data
The Netherlands
2March 2016
3March 2016
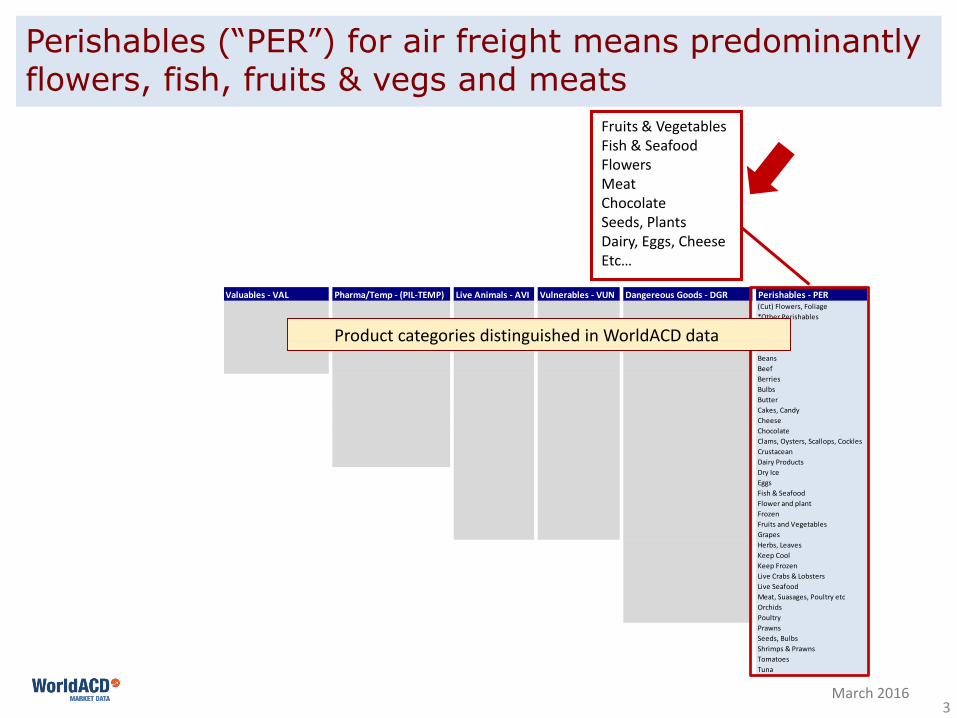
Perishables (“PER”) for air freight means predominantly flowers, fish, fruits & vegs and meats
Valuables - VAL Pharma/Temp - (PIL-TEMP) Live Animals - AVI Vulnerables - VUN Dangereous Goods - DGR Perishables - PER(Cut) Flowers, Foliage*Other PerishablesAsparagusAvocadosBaitBeansBeefBerriesBulbsButterCakes, CandyCheeseChocolateClams, Oysters, Scallops, CocklesCrustaceanDairy ProductsDry IceEggsFish & SeafoodFlower and plantFrozenFruits and VegetablesGrapesHerbs, LeavesKeep CoolKeep FrozenLive Crabs & LobstersLive SeafoodMeat, Suasages, Poultry etcOrchidsPoultryPrawnsSeeds, BulbsShrimps & PrawnsTomatoesTuna
Fruits & VegetablesFish & SeafoodFlowersMeatChocolateSeeds, PlantsDairy, Eggs, CheeseEtc…
Product categories distinguished in WorldACD data
4March 2016
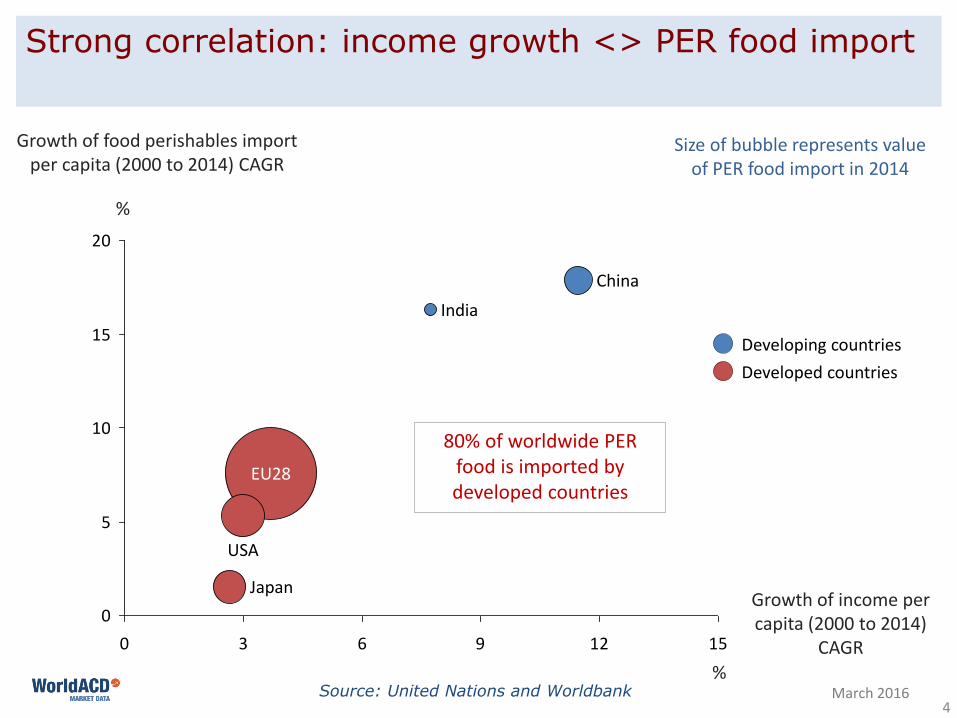
Strong correlation: income growth <> PER food import
Source: United Nations and Worldbank
0
5
10
15
20
0 3 6 9 12 15
USA
Japan
India
EU28
China
Developing countriesDeveloped countries
Growth of food perishables import per capita (2000 to 2014) CAGR
%
Growth of income per capita (2000 to 2014)
CAGR
Size of bubble represents value of PER food import in 2014
%
80% of worldwide PER food is imported by developed countries

5March 2016
Strong correlation: spend on food <> PER food import
Source: United Nations and US Dep of Agriculture
0
100
200
300
400
500
600
0 1,000 2,000 3,000 4,000
EU28
ChinaIndia
Japan
USA
Developed countriesDeveloping countries
Value of food perishables import per capita (US$ in 2014)
Food spend per capita (US$ in 2014)
6March 2016
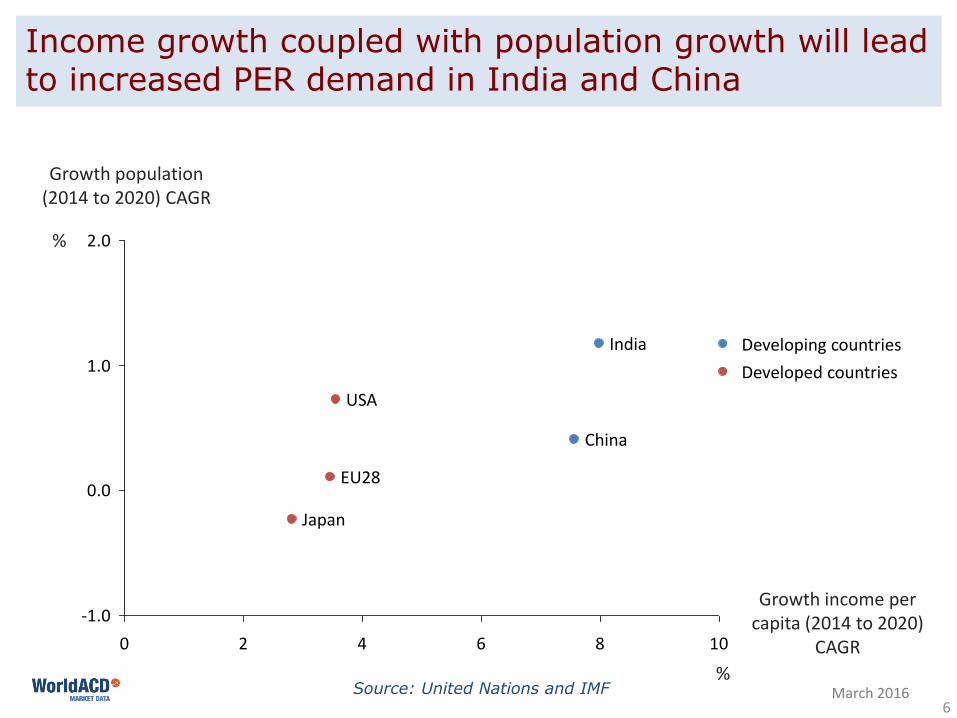
Income growth coupled with population growth will lead to increased PER demand in India and China
Source: United Nations and IMF
-1.0
0.0
1.0
2.0
0 2 4 6 8 10
USA
Japan
India
EU28
China
Developed countriesDeveloping countries
Growth population (2014 to 2020) CAGR
Growth income per capita (2014 to 2020)
CAGR%
%

7March 2016
Developed countries spend more on fresh food
Source: The Nielsen Company, United Nations, and US Dep of Agriculture
351
392
551
676
693
1,401
1,470
1,472
1,958
0 1,000 2,000 3,000 4,000 5,000
Hungary
Poland
Finland
USA
Australia
Switzerland
Norway
China
Indonesia
PER food import valueGeneral food spend
Fresh food spend
Figures per capita in US$ in 2014:

8March 2016
Changing shares in global middle class consumption
Source: OECD Development Centre
Find figures Process chart
Shares of global middle classconsumption (2000 to 2050)
Middle class = households with USD10-100 dailyexpenditure p.p. in purchasing power parity terms
9March 2016
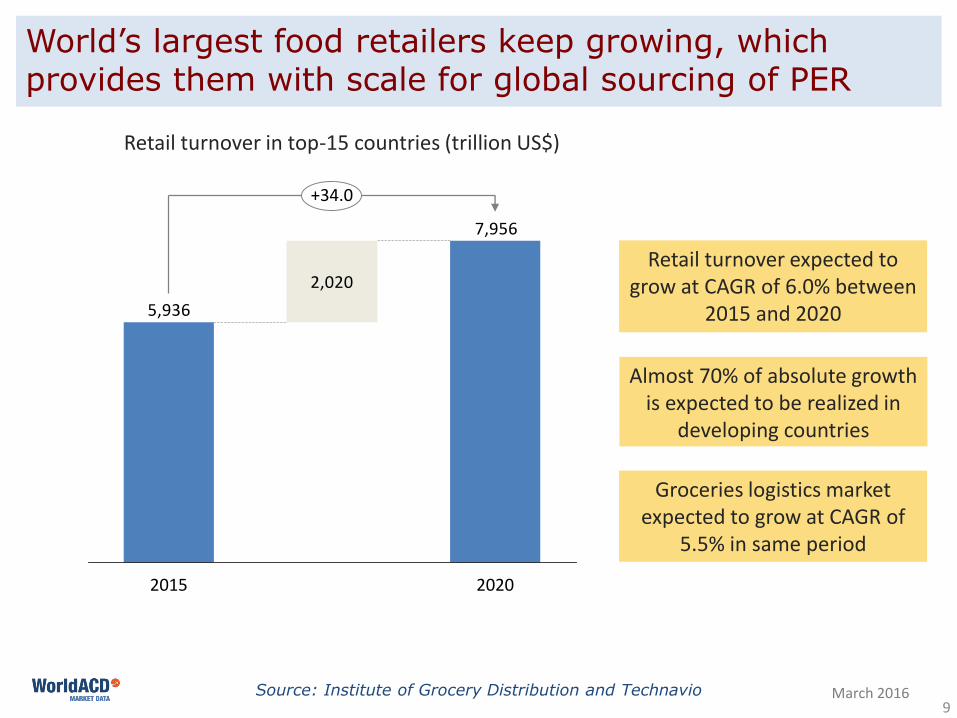
World’s largest food retailers keep growing, which provides them with scale for global sourcing of PER
Source: Institute of Grocery Distribution and Technavio
7,956
5,9362,020
2015 2020
+34.0
Almost 70% of absolute growth is expected to be realized in
developing countries
Retail turnover in top-15 countries (trillion US$)
Groceries logistics market expected to grow at CAGR of
5.5% in same period
Retail turnover expected to grow at CAGR of 6.0% between
2015 and 2020

10
Top-10 origins for perishables-by-air
Top-10 countries based on perishable volume – 2015
1. Kenya (1)2. India (3)3. USA Pacific States (2)4. Australia (4)5. Netherlands (8)6. Egypt (7)7. Ecuador (5) 8. Colombia (6)9. Norway (11)10. Chile (9)( ) = position in 2014
Source: WorldACD March 2016
11
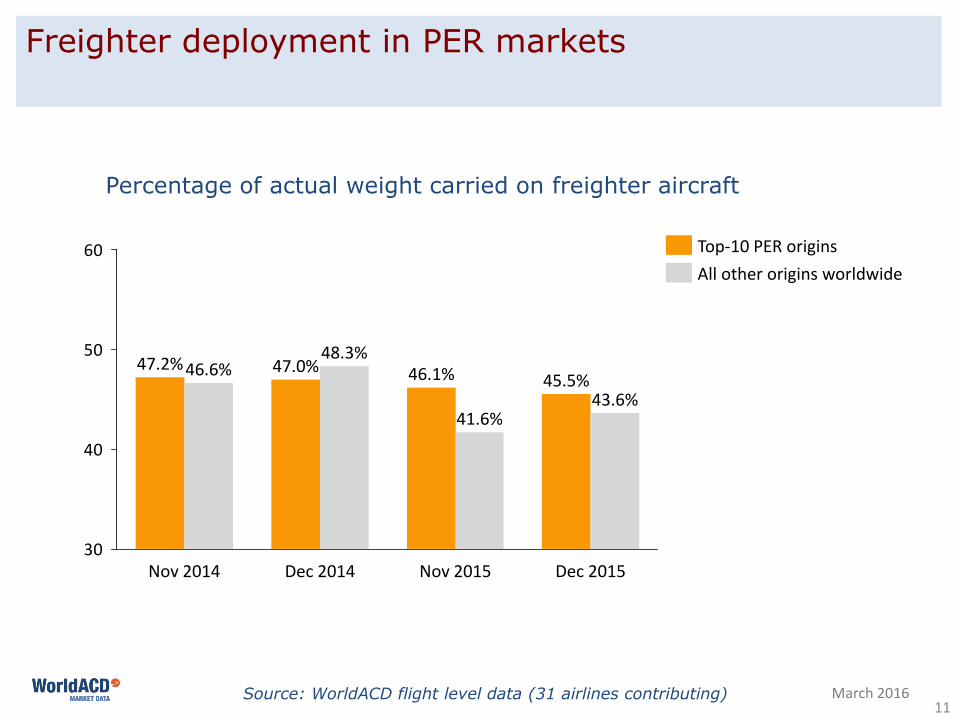
Freighter deployment in PER markets
Source: WorldACD flight level data (31 airlines contributing) March 2016
30
40
50
60
48.3%
41.6%43.6%
45.5%46.6%
Dec 2015Nov 2014 Dec 2014 Nov 2015
47.2% 47.0% 46.1%
Top-10 PER originsAll other origins worldwide
Percentage of actual weight carried on freighter aircraft

12
Key markets perishables-by-air (top-3 flows per sub-category)
Norway
USA North East
Ecuador
UK
Netherlands
Japan
Hong Kong
Kenya
Source: WorldACD
Fruit & Vegetables
Fish & Seafood
Flowers
March 2016
USA Atlantic South
Colombia
Peru
Chile
13
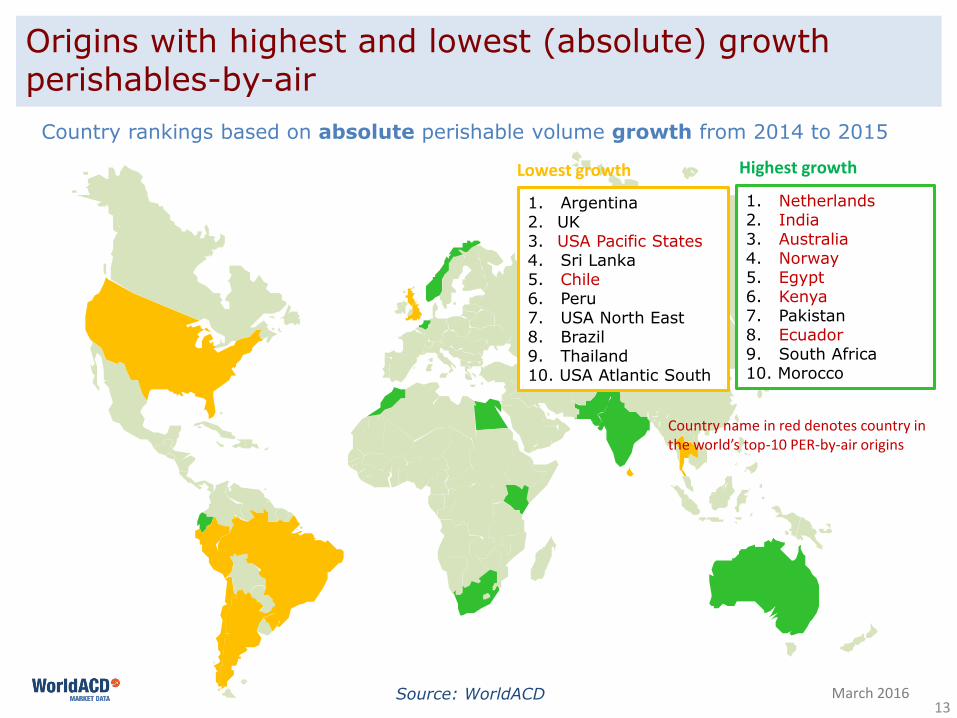
Origins with highest and lowest (absolute) growth perishables-by-air
Country rankings based on absolute perishable volume growth from 2014 to 2015
1. Argentina2. UK3. USA Pacific States4. Sri Lanka5. Chile6. Peru7. USA North East8. Brazil9. Thailand10. USA Atlantic South
Source: WorldACD March 2016
1. Netherlands2. India3. Australia4. Norway5. Egypt6. Kenya7. Pakistan8. Ecuador9. South Africa10. Morocco
Highest growthLowest growth
Country name in red denotes country in the world’s top-10 PER-by-air origins

14March 2016
Worldwide shares – volume & yield changes
12%
9%
8%
6%
2%
SHARE of perishable volume last 2 years
together
Meat 9%
Flowers 17%
Fish & Seafood 27%
Fruits & Vegetables 47%
Vol CHANGE 2014 > 2015
ALL CARGO
Source: WorldACD
15
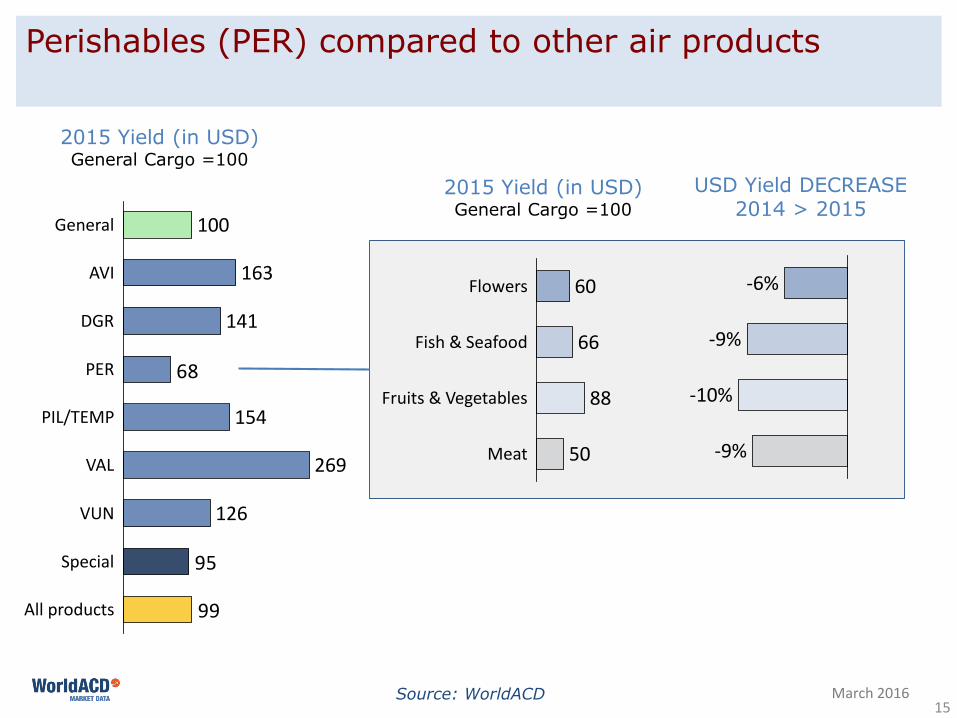
Perishables (PER) compared to other air products
2015 Yield (in USD)General Cargo =100
99
95
68
All products
Special
VUN 126
VAL 269
PIL/TEMP 154
PER
DGR 141
AVI 163
General 100
Meat 50
Fruits & Vegetables 88
Fish & Seafood 66
Flowers 60
USD Yield DECREASE 2014 > 2015
March 2016
-9%
-6%
-9%
-10%
2015 Yield (in USD)General Cargo =100
Source: WorldACD

PER yield has dropped less than General Cargo yield over last two years
40
50
60
70
80
90
100
110
JDNOSA
General
DNOSAJJMAMFJ JJMAMF
JetA fuel
PER
Index Jan 2014 = 100
2014 2015
Source: Platts/IATA (fuel data) and WorldACD March 201614
17
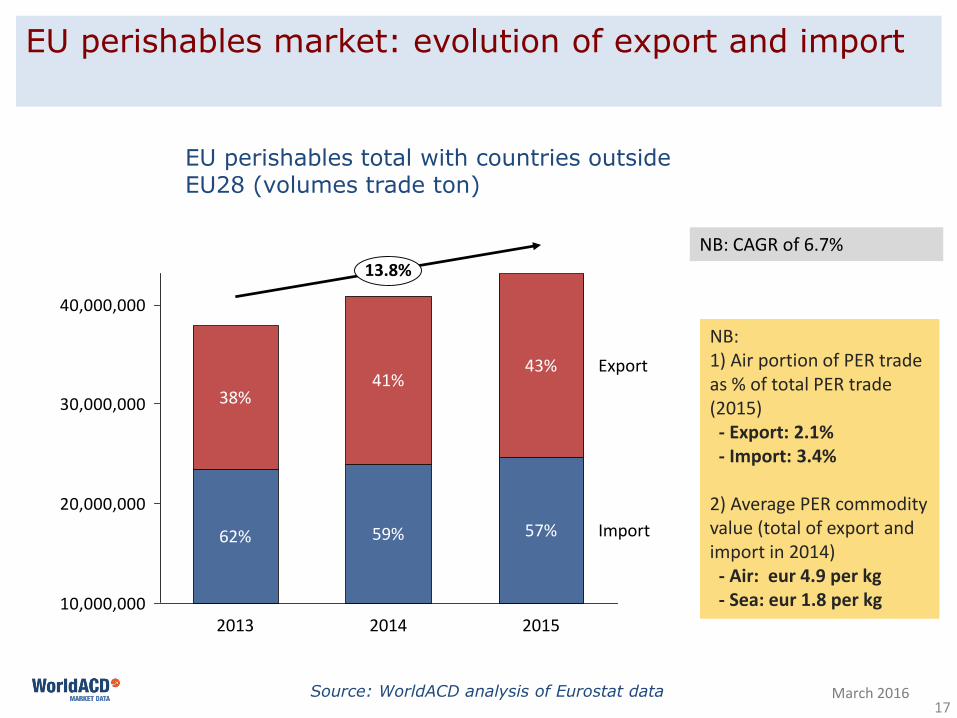
EU perishables market: evolution of export and import
Source: WorldACD analysis of Eurostat data
EU perishables total with countries outside EU28 (volumes trade ton)
10,000,000
20,000,000
30,000,000
40,000,000
13.8%
Import
2015
57%
43% Export
59%
38%41%
62%
20142013
March 2016
NB: 1) Air portion of PER trade as % of total PER trade (2015) - Export: 2.1%- Import: 3.4%
2) Average PER commodity value (total of export and import in 2014) - Air: eur 4.9 per kg- Sea: eur 1.8 per kg
NB: CAGR of 6.7%

18March 2016
Main markets perishables-by-air to and from Europe
Europe
North America
Central & South America
Asia PacificMiddle East &
South Asia
Africa
Source: WorldACD
Inbound Europe
Outbound Europe
12
3
1
3
2

19
Modal shift is best analyzed per individual market
-20
0
20
40
-40 -20 0 20 40
UAE
CanadaChina
Hong Kong
Japan
Qatar Saudi Arabia
Taiwan
USA
Singapore
Export from Europe
Sea transport
Year-on-year trade growth by mode of transport (2014 to 2015)For top 10 countries based on perishables weight
Air transport
Source: WorldACD analysis of Eurostat data March 2016
%Air growth > sea growth

20
Modal shift is best analyzed per individual market
-20
0
20
40
-40 -20 0 20 40
UAE
CanadaChina
Hong Kong
Japan
Qatar Saudi Arabia
Taiwan
USA
Singapore
Export from Europe
Sea transport
Year-on-year trade growth by mode of transport (2014 to 2015)For top 10 countries based on perishables weight
Air transport
Source: WorldACD analysis of Eurostat data March 2016
%
-20
-10
0
10
20
30
40
-40 -20 0 20 40
Brazil
USAPeru
Kenya South Africa
Colombia
India
EcuadorEgypt
Ethiopia
Import to Europe
Sea transport
Air transport
%Air growth > sea growthAir growth > sea growth

21
Modal shift in key perishables: From Europe TO selected countries
March 2016Source: WorldACD analysis of Eurostat data
∆ in air share =
Air and sea share for selected markets and commodities
Europe to UAE
20152014
50% 47%
50% 53%
Vegetables
-3%
Europe to Qatar
2014
20%
82%
2015
18%
80%
100%
Flowers & plants
-2%
Europe to USA
2015
60%
40%34%
2014
66%
Fish
-6%
Europe to Japan
2015
40%
60%
36%
64%
2014
Vegetables
+4%
AirSea
22
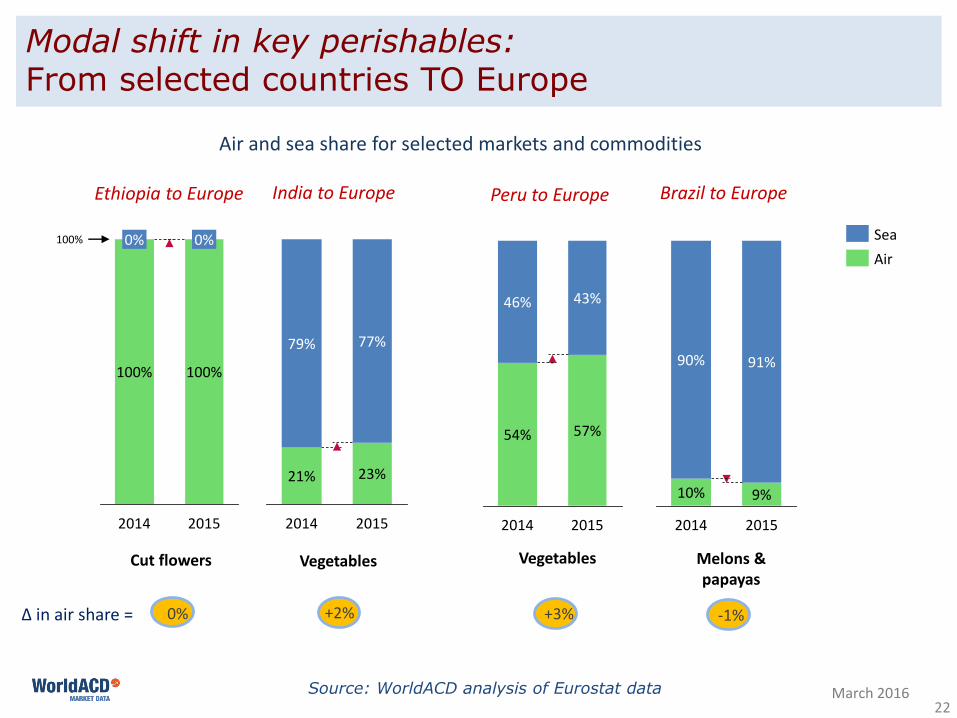
Modal shift in key perishables: From selected countries TO Europe
March 2016Source: WorldACD analysis of Eurostat data
∆ in air share =
Air and sea share for selected markets and commodities
India to EuropeEthiopia to Europe Peru to Europe Brazil to Europe
79%
23%
77%
2014
21%
2015
100%
2015
100%
0%
2014
100%
0%
2015
57%
43%
2014
54%
46%
9%
2014
91%
10%
2015
90%
AirSea
Cut flowers Vegetables Melons & papayas
Vegetables
+2%0% +3% -1%
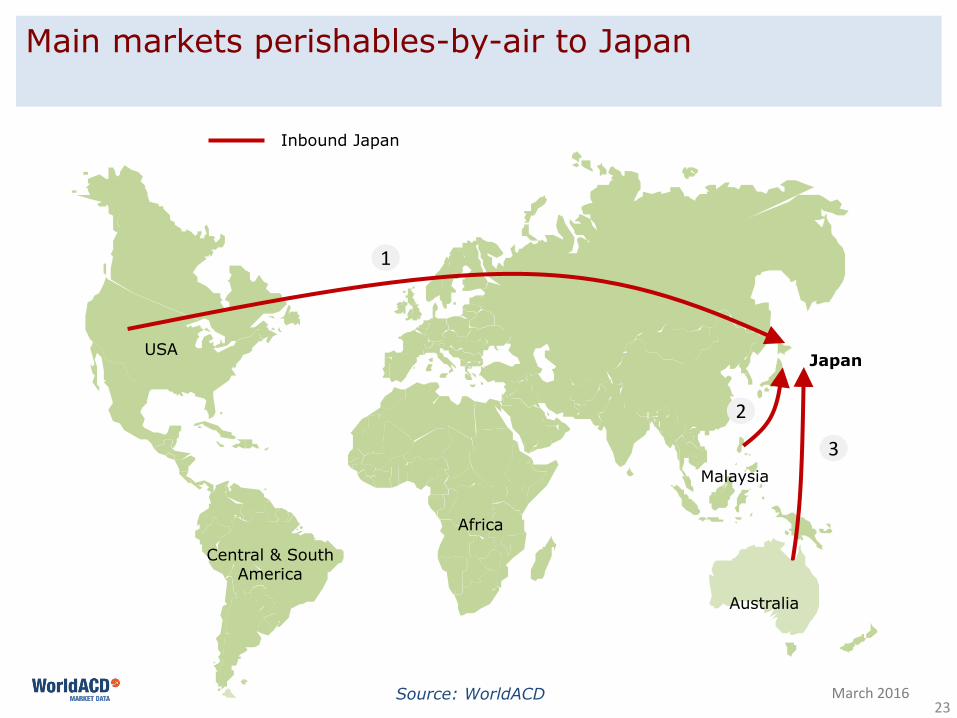
23March 2016
Main markets perishables-by-air to Japan
JapanUSA
Central & South America
Malaysia
Africa
Source: WorldACD
Inbound Japan
3
1
2
Australia
24
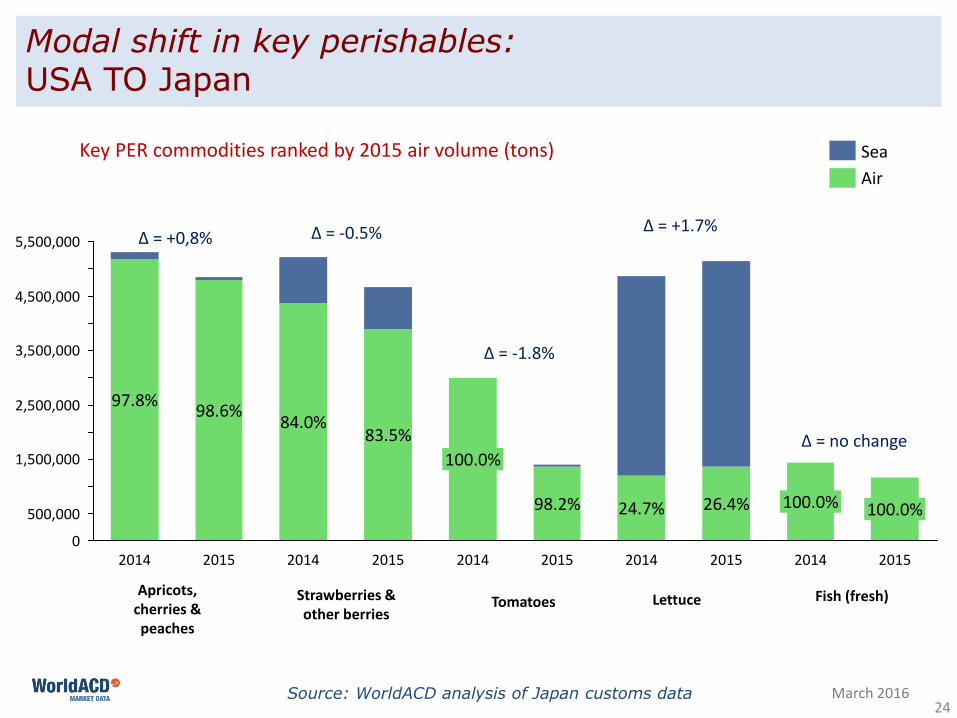
Modal shift in key perishables: USA TO Japan
Source: WorldACD analysis of Japan customs data March 2016
1,500,000
500,000
5,500,000
3,500,000
4,500,000
0
2,500,000 97.8%
20142014 2015 2015
98.2% 24.7%
83.5%
2015
100.0%
2014 2014
98.6%
100.0%
20152015
100.0%
84.0%
26.4%
2014
Apricots, cherries & peaches
Strawberries & other berries
Lettuce Fish (fresh)Tomatoes
∆ = +0,8% ∆ = -0.5%
∆ = -1.8%
∆ = +1.7%
∆ = no change
SeaAir
Key PER commodities ranked by 2015 air volume (tons)
25
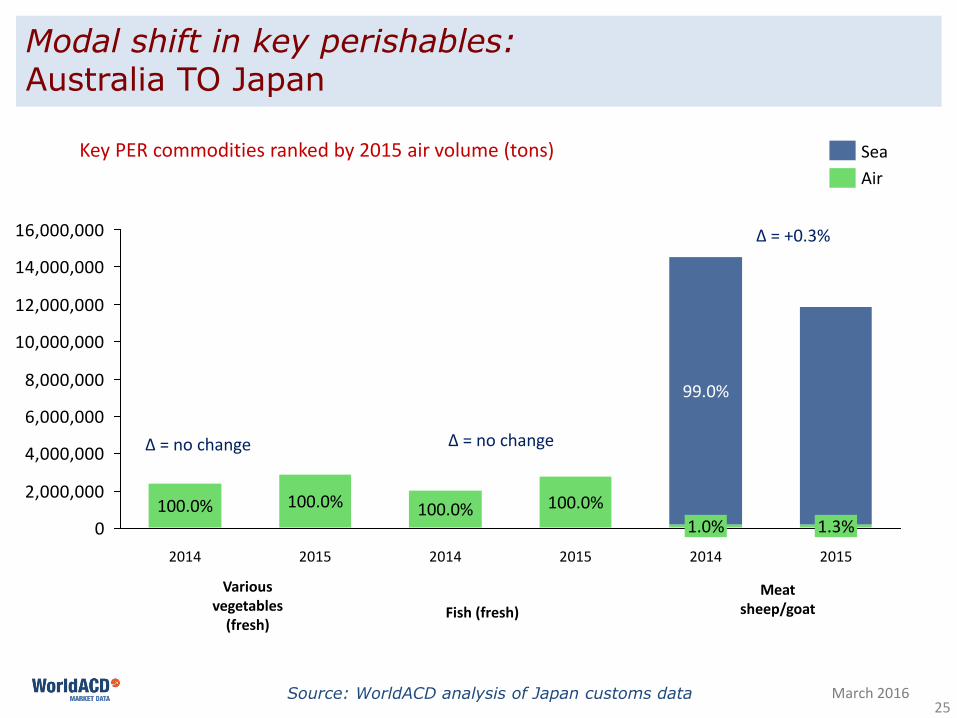
Modal shift in key perishables: Australia TO Japan
March 2016
0
2,000,000
4,000,000
6,000,000
8,000,000
10,000,000
12,000,000
14,000,000
16,000,000
1.0% 1.3%2015 2015
100.0% 100.0%
2014
99.0%
2014
100.0% 100.0%
2014 2015
Various vegetables
(fresh)Fish (fresh)
Meat sheep/goat
∆ = no change
∆ = +0.3%
∆ = no change
Source: WorldACD analysis of Japan customs data
SeaAir
Key PER commodities ranked by 2015 air volume (tons)

26
Modal shift in key perishables: Malaysia TO Japan
March 2016
0
9,000,000
13,000,000
5,000,000
7,000,000
11,000,000
3,000,000
1,000,000 100.0%
2014 20152014
100.0%
2015
89.5%94.2%
Cut Flowers Plants without flowers
∆ = +4.7%
∆ = no change
Source: WorldACD analysis of Japan customs data
SeaAir
Key PER commodities ranked by 2015 air volume (tons)
27
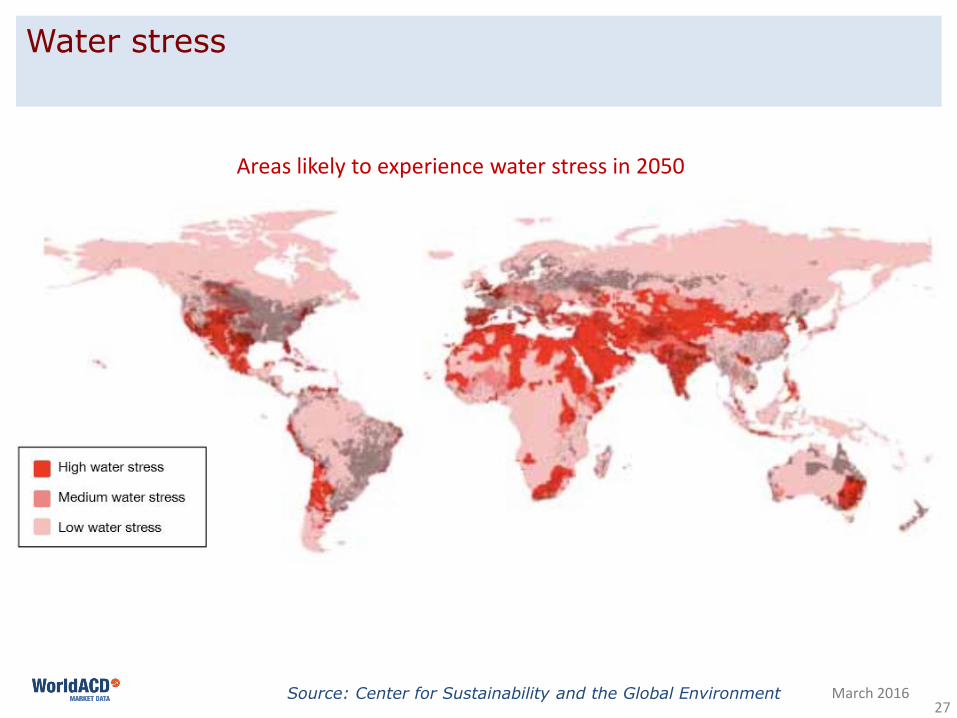
Water stress
March 2016Source: Center for Sustainability and the Global Environment
Areas likely to experience water stress in 2050
28
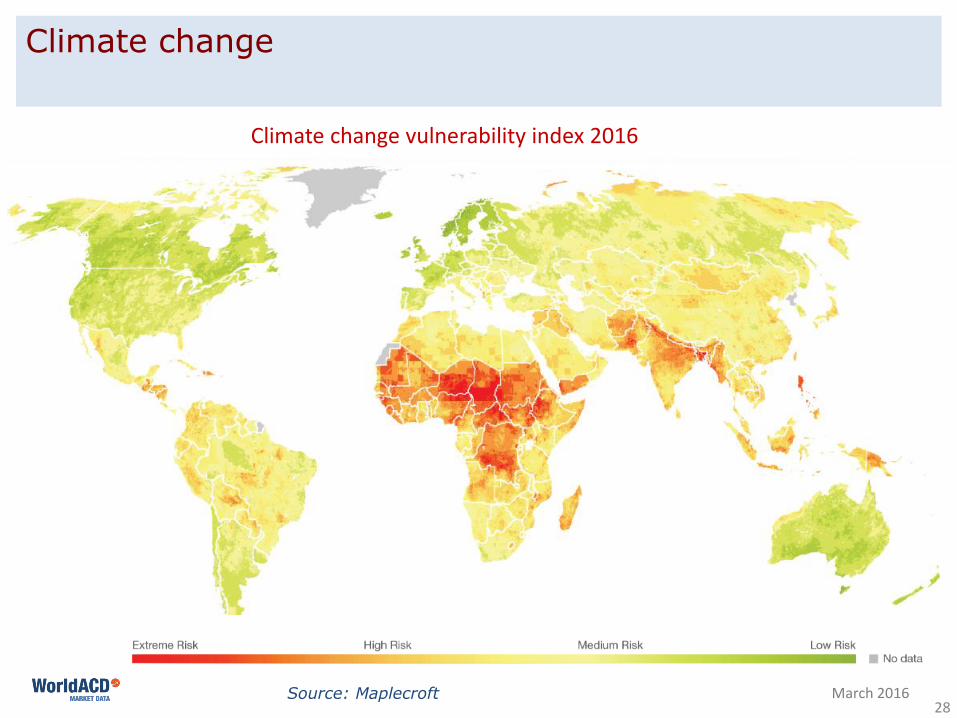
Climate change
March 2016Source: Maplecroft
Climate change vulnerability index 2016

29
Food outsourcing (outside country)
March 2016Source: IFTF
27%
0%6%
5%1%
11%
37%
13%
Share of total hectares leased outside country
China
India
Japan
Libya
Future food demand may increase food sourcing outside Asia for Asian countries, given more competition for land use, increased demand and challenges with water.
South Korea is leading country leasing agricultural land in other countries for own food sourcing. Likely that India and China will increase food outsourcing in future.

30
Trends
March 2016
Income growth and population growth are shifting the PER trade growth from developed to developing countries.
Supermarket chains will become bigger facilitating the year round supply of fresh produce, thus supporting international PER trade, also by air.
Many types of fresh fruit such as different berries and various vegetables are transported by sea already: even with volume growth, it may be a challenge for air cargo to maintain its current volumes.
Cut flowers and certain fish commodities remain the exceptions, for which air cargo is able to maintain a very high market share.
Given investments in the air cargo community, there are high hopes for cool chain products to support the bottom line.
Agriculture land souring by third countries for large countries like China, could further support growth of international PER trade.

31
Conclusions
March 2016
PER products by air showed much higher growth than the overall cargo market in 2015.
Growth of PER demand will mostly be seen in developing countries, where regional supply is insufficient.
New long distance PER trade will emerge.
Growing middle classes in emerging countries will play a large role in future PER trade patterns, and therefore in the demand for PER by air.
Modal shift is best analysed per individual market: different results for different markets are observed.
32March 2016
FOR FURTHER INFORMATION:
Ken de Witt HamerMarket Analysis & Commercial Development [email protected] +31-6-2265-0855
WorldACD Market Data BVKeizersgracht 117-B1015 CJ AmsterdamThe Netherlands
Further Information
SOURCES USED FOR THIS PRESENTATION:
DrewryEurostatIFTFIMFInstitute of Grocery Distribution Japan Customs OECDPlatts / IATATechnavioThe Nielsen CompanyUnited NationsUS Department of AgricultureWorldbank
&WorldACD databases:
•More than 225 million AWB’s • Adding > 2 million AWB’s every month• Monthly inputs of full worldwide AWB-data from over 60 airlines• Data provided cover all sales via all distribution channels as well as direct sales