perirhinal and postrhinal cortices of the rat: interconnectivity and connections with the entorhinal...
TRANSCRIPT

Perirhinal and Postrhinal Corticesof the Rat: Interconnectivity and
Connections With the Entorhinal Cortex
REBECCA D. BURWELL1* AND DAVID G. AMARAL2
1Department of Psychology, Brown University, Providence, Rhode Island 029122Department of Psychiatry and Center for Neuroscience,
The University of California at Davis, Davis, California 95616
ABSTRACTThe cortical regions dorsally adjacent to the posterior rhinal sulcus in the rat can be
divided into a rostral region, the perirhinal cortex, which shares features of the monkeyperirhinal cortex, and a caudal region, the postrhinal cortex, which has connectionalattributes similar to the monkey parahippocampal cortex. We examined the connectivityamong the rat perirhinal (areas 35 and 36), postrhinal, and entorhinal cortices by placinganterograde and retrograde tracers in all three regions. There is a dorsal-to-ventral cascade ofconnections in the perirhinal and entorhinal cortices. Dorsal area 36 projects strongly toventral area 36, and ventral area 36 projects strongly to area 35. The return projections aresubstantially weaker. The cascade continues with the perirhinal to entorhinal connections.Area 35 is more strongly interconnected with the entorhinal cortex, ventral area 36 somewhatless strongly, and dorsal area 36 projects only weakly to the entorhinal cortex. Thepostrhinal-to-perirhinal connections also follow this general pattern. The postrhinal cortex ismore heavily connected with dorsal area 36 than with ventral area 36 and is more heavilyconnected with area 36 than with area 35. The rostral portion of the postrhinal cortex has thestrongest connections with the perirhinal cortex. Like in the monkey, the perirhinal andpostrhinal cortices have different patterns of projections to the entorhinal cortex. Theperirhinal cortex is preferentially connected with the rostrolateral portion of the entorhinalcortex. The postrhinal cortex projects to a part of this same region but is also connected tocaudal and medial portions of the entorhinal cortex. The perirhinal and postrhinal projectionsto the entorhinal cortex originate in layers III and V and terminate preferentially in layers IIand III. J. Comp. Neurol. 391:293–321, 1998. r 1998 Wiley-Liss, Inc.
Indexing terms: polysensory cortex; hippocampus; memory; anterograde; retrograde
The primate perirhinal and parahippocampal corticesplay a critical role in certain forms of memory (Gaffan andMurray, 1992; Murray and Mishkin, 1986; Suzuki et al.,1993; Zola-Morgan et al., 1989). The origins of corticalinput differ for the two regions (Suzuki and Amaral,1994a), suggesting that they might contribute differentlyto memory function. In the rat, most cytoarchitectonicdescriptions of the cortex include a region called theperirhinal cortex, although the borders differ widely indifferent studies. This region is commonly taken to be thehomologue of the perirhinal cortex in the monkey (forreview, see Burwell et al., 1995) and has also been impli-cated in memory (Bunsey and Eichenbaum, 1993; Mumbyand Pinel, 1994; Myhrer and Wangen, 1996; Otto andEichenbaum, 1992; Wiig et al., 1996; Zhu et al., 1995).
Until recently, there were insufficient neuroanatomicaldata on the rat perirhinal cortex to resolve controversial
issues, such as the precise borders of the field. Anotherunresolved issue is whether there is any region of the ratbrain that is homologous to the monkey parahippocampalcortex. We have conducted a program of cytoarchitectonic,histochemical, and connectional studies on the rat perirhi-nal region that shed new light on these issues (preliminarydata reported in Burwell and Amaral, 1993, 1995, 1996;Burwell et al., 1994; Dolorfo and Amaral, 1993, 1994).These data provide support for the conclusion that the
Grant sponsor: NIH; Grant number: NS 16980; Grant sponsor: NIMH;Grant number: F32-NS09247.
*Correspondence to: Rebecca D. Burwell, Ph.D., Department of Psychol-ogy, Brown University, Providence, RI 02912.E-mail: [email protected]
Received 13 June 1997; Revised 18 September 1997; Accepted 19September 1997
THE JOURNAL OF COMPARATIVE NEUROLOGY 391:293–321 (1998)
r 1998 WILEY-LISS, INC.
rostral ‘‘perirhinal’’ region in the rat resembles the perirhi-nal cortex of the monkey, and the caudal ‘‘perirhinal’’region exhibits connectional characteristics similar to thoseof the parahippocampal cortex of the monkey. For reasonsthat we have reviewed elsewhere (Burwell et al., 1995), theterm postrhinal, originally used by Deacon et al. (1983),rather than parahippocampal, has been applied to thecaudal region in the rat. Essentially, although the postrhi-nal cortex appears to have connectional similarities withthe parahippocampal cortex, the cytoarchitecture of therat and monkey regions is quite different.
Maintenance of the two terms for these regions isjustified, because, in the rat, as in the monkey, thecytoarchitecture of the two regions is quite distinct. More-over, the origins of cortical input to the rat perirhinal andpostrhinal cortices differ substantially. For example, theperirhinal cortex receives roughly 4% of its cortical inputfrom visual associational regions, whereas the postrhinalcortex receives almost 40% (Burwell and Amaral, unpub-lished findings). The perirhinal cortex, in contrast, re-ceives substantially more somatosensory, olfactory, andauditory input than the postrhinal cortex. The two regionsalso differ substantially in the amount of input fromcingulate, retrosplenial, and parietal regions, with thepostrhinal cortex receiving the stronger inputs (Burwelland Amaral, unpublished findings).
In the monkey, the perirhinal and parahippocampalcortices provide the major source of sensory information tothe hippocampal formation through their connections withthe entorhinal cortex (Insausti et al., 1987). The extentand patterns of perirhinal and postrhinal connections withthe rat hippocampal formation have not yet been studiedextensively. In fact, in the only previous study of theconnectivity of the perirhinal region, the perirhinal-to-entorhinal connections were largely ignored (Deacon et al.,1983). Given the major role that these regions are likely toplay in memory function in the rat, it is important todetermine the details of how these regions are intercon-nected and how they interact with the entorhinal cortex.We present here a detailed description of the topographyand laminar pattern of interconnections among the perirhi-nal, postrhinal, and entorhinal cortices of the rat.
MATERIALS AND METHODS
Surgery
One hundred and twenty-seven previously untreated,male, Sprague-Dawley rats obtained from Harlan Labora-tories (Houston, TX) and weighing between 300 g and400 g were used for these neuroanatomical tracing experi-ments. Injection sites from 42 cases were selected foranalysis. All subjects were housed individually or in pairsunder standard vivarium conditions with ad libitum ac-cess to food and water. All methods involving the use of livesubjects were approved by the appropriate institutionalanimal care committee and conformed to NIH guidelines.
Animals were anesthetized with one of two protocols.Subjects were either injected with pentobarbital sodium(n 5 98; Nembutal; 50 mg/kg, i.p.; Abbott Laboratories,North Chicago, IL) or brought to a surgical level ofanesthesia with halothane gas (n 5 29). All subjects werethen secured in a Kopf stereotaxic apparatus (Tujunga,CA) in the flat skull position. A hole was drilled in the skullabove each intended injection site, and a small incisionwas made in the dura to permit unobstructed penetration
of the glass micropipette. Each animal received one tothree tracer injections. After all injections were completed,the wound was sutured, and the animal was kept warm inits cage for 1–2 hours before being returned to the colony.
Anterograde tracer injections. The anterograde trac-ers, Phaseolus vulgaris-leucoagglutinin (PHA-L; VectorLaboratories, Burlingame, CA) or biotinylated dextranamine (BDA; Molecular Probes, Inc., Eugene, OR), werestereotaxically injected at various locations along therhinal sulcus according to the rat brain atlas of Paxinosand Watson (1986). PHA-L was used in a 2.5% solution in0.1 M phosphate-buffered saline (PBS), and BDA was usedin a 10% solution in 0.1 M PBS. The tracers were injectedby iontophoresis with positive DC current (4 µamps; 7seconds on and 7 seconds off) for 8 minutes through glassmicropipettes with tip diameters ranging from 5 µm to15 µm.
Retrograde tracer injections. The retrograde trac-ers, fast blue (FB) or Diamidino yellow (DY; Dr. IllingGmbH and Co., Gross Umstadt, Germany), were stereotaxi-cally injected at various locations along the rhinal sulcus(Paxinos and Watson, 1986). For FB, approximately 150 nlof a 3% solution in distilled H2O were injected. For DY,approximately 200 nl of a 2% solution in distilled H2O wereinjected. In one experiment (108FG), 100 nl of a 2%solution of Fluoro-Gold (FG; Fluorochrome, Inc., Engle-wood, CO) in normal saline was used (Schmued andFallon, 1986). The tracers were injected through glassmicropipettes (tip diameters ranging from 60 µm to 90 µm)with air-pressure pulses (Amaral and Price, 1983). Theapproximate rate of injection was 30 nl/minute. Followinginjection of the tracer, the micropipette was raised 100 µm,followed by a 10-minute wait, then slowly raised theremaining distance in 5–10 minutes, depending upon thedepth of the injection site.
Tissue processing
Following a 7–9 day survival period, subjects weredeeply anesthetized with a 35% solution of chloral hy-drate. The subjects were transcardially perfused by usinga pH-shift protocol, chosen to optimize immunohistochemi-cal processing of the anterograde tracers. The perfusionwas accomplished with a peristaltic pump at a flow rate of35–40 ml/minute. Room temperature saline was firstperfused for 2 minutes to clear the blood. Saline wasfollowed by a solution of 4% paraformaldehyde in 0.1 Msodium acetate buffer, pH 6.5, at 4°C for 10 minutesfollowed by a solution of 4% paraformaldehyde in 0.1 Msodium borate buffer, pH 9.5, at 4°C for 15 minutes. Icewas packed around the head of the animals during perfu-sion. After removal from the skull, the brains were post-fixed for 6 hours in the final fixative at 4°C and cryopro-tected for at least 24 hours by using 20% glycerol in 0.02 Mpotassium PBS (KPBS), pH 7.4, at 4°C.
The brains were coronally sectioned at 30 µm on afreezing microtome. Sections were collected in five seriesfor processing and storage. Depending on the experiment,one or two 1-in-5 (1:5) series were collected in KPBS forimmunohistochemical processing for anterograde tracers,and one or two 1:5 series were collected into 0.1 Mphosphate buffer for retrograde tracer procedures. Oneseries was mounted and stained for Nissl by using thionin.The remaining one or two series were collected and storedat 220°C in cryoprotectant tissue-collecting solution con-
294 R.D. BURWELL AND D.G. AMARAL

sisting of 30% ethylene glycol and 20% glycerol in sodiumphosphate buffer, pH 7.4.
Anterograde tracer procedures. Immunohistochemi-cal processing for visualization of PHA-L-immunoreactivefibers was accomplished by one of two methods, dependingon whether the subject received one anterograde injectionof PHA-L alone or two injections of PHA-L and BDA. Thefirst method was adapted from Gerfen and Sawchenko(1984) and employed a biotinylated secondary antibodywith an avidin-biotin incubation to visualize PHA-L-immunoreactive fibers. Nonspecific binding was reducedby incubating the sections for 2–3 hours in 5% normal goatserum (NGS) and 0.5% Triton X-100 (TX) in KPBS. Thesections were then incubated in the primary antiserumsolution of rabbit anti-PHA-L (1:12,000 dilution; Dako,Carpenteria, CA) in 0.3% TX and 2% NGS in KPBS at 4°Cfor 42–48 hours. The remainder of processing was con-ducted at room temperature. Following two 10-minutewashes in 2% NGS in KPBS, the sections were incubatedin the biotinylated secondary antibody solution containinggoat anti-rabbit IgG (1:227 dilution; Vector Laboratories,Burlingame, CA), 0.3% TX, and 2% NGS in KPBS for 1hour. Following two 10-minute washes in 2% NGS inKPBS, the sections were incubated in a solution of avidinreagent and stabilizer (1:100 and 1:200 dilutions, respec-tively; Super ABC Kit; Biomeda Corporation, Foster City,CA) in KPBS for 45 minutes. The sections were washedtwice for 10 minutes in 2% NGS in KPBS and then recycledinto the biotinylated secondary solution for 45 minutes.The sections were then washed twice for 10 minutes inKPBS only and recycled into the avidin solution for 30minutes. Following three 10-minute washes in KPBS, thesections were processed for visualization by incubation in0.05% diaminobenzidine (DAB; Pierce, Tacoma, WA) and0.04% H2O2 in KPBS for 5–10 minutes.
The second method for PHA-L visualization was used fortissue that also contained BDA and utilized a peroxidaseanti-peroxidase (PAP) complex rather than an avidinreagent. The protocol for this method was identical to theone described previously, with the following exceptions:The secondary antiserum was goat anti-rabbit IgG fromSternberger Monoclonals (Baltimore, MD) at a 1:200 dilu-tion, and the two avidin-reaction incubations were re-placed by PAP incubations utilizing a rabbit-PAP complex,also from Sternberger Monoclonals, at a 1:200 dilution.
An avidin-biotin reaction was used for visualization ofBDA-immunoreactive fibers. The sections were first pre-treated in a 1% solution of TX in KPBS for 1 hour toincrease subsequent penetration of the reagents. Thesections were incubated overnight at 4°C in a solution ofavidin reagent and stabilizer (1:25 and 1:50 dilutions,respectively; Super ABC Kit; Biomeda Corporation) inKPBS plus 0.1% solution of TX. Following three 10-minutewashes in KPBS, the sections were processed for visualiza-tion by incubation at room temperature in 0.05% DAB and0.04% H2O2 in KPBS for 15–30 minutes.
After immunohistochemical processing, all sections werewashed, mounted on gelatin-coated slides, dried, defatted,and intensified with osmium tetroxide and thiocarbohydra-zide (Lewis et al., 1986).
Retrograde tracer procedures. Sections to be ana-lyzed for fluorescent, retrogradely labeled cells were
mounted onto gelatin-coated slides. The mounted tissuewas dried for 2–4 hours in a vacuum dessicator at roomtemperature, dehydrated in 100% ethanol (2 3 2 minutes),cleared in xylene (3 3 2 minutes), and coverslipped withDPX. This technique improves visibility and retards fad-ing of fluorescent dyes, indefinitely preserving material forrepeated inspection.
Data analysis
To quantify and present the patterns of anterograde orretrograde labeling within a cortical region, a techniquewas employed that permits displaying the three dimen-sional distribution of label in two dimensions. This can beaccomplished by ‘‘flattening,’’ or unfolding, the surface ofthe neocortex from the coronal sections. Techniques forconstructing unfolded maps of cortical regions have beendescribed previously (Suzuki and Amaral, 1996; Van Essenand Maunsell, 1980).
Construction of two-dimensional unfolded maps. Inthe present study, unfolded maps of the perirhinal, postrhi-nal, and entorhinal cortices were used for documentingpatterns of anterograde and retrograde labeling. Figure1A shows lateral (top) and ventral (bottom) surface viewsof the rat brain, with these regions designated by differentshading patterns. Figure 1C shows a subset of the draw-ings used to construct the map. Figure 1B shows thefinished map. The fundus of the rhinal sulcus was markedfor use as the alignment point. At more caudal levels,where the rhinal sulcus is little more than a shallowindentation, a point was marked at the center of theindentation. To quantify the number of retrogradely la-beled cells, counting bins were constructed throughout theanalyzed cortex. A spreadsheet program (Excel; Microsoft,Redmond, WA) was used to create straight-line, unfoldedmaps from the analyzed cortical sections (Fig. 1C, right).The resulting unfolded map represents the surface area ofthe perirhinal, postrhinal, and entorhinal cortices for eachcase.
Quantification of anterograde label. Sections fromeach anterograde experiment were initially surveyed byusing both bright- and darkfield optics. Section contourswere drawn from a 1:5 series of 30-µm Nissl-stainedsections at a total magnification of 163 by using a Wildstereomicroscope (Leica, Deerfield, IL). The contour sur-face was then segmented at 4-mm intervals representing250-µm columns. For density analysis, the adjacent PHA-L-or BDA-labeled sections were examined at a total magnifi-cation of 503 or 1253, depending on the quality of thelabeled material, with a Leica Laborlux D microscopefitted with a drawing tube. The density of anterogradelabel was rated while it was visualized with darkfieldoptics. Density for all experiments was rated according to afive-level set of standards, designated very light, light,moderate, heavy, and very heavy. Qualitatively, the stan-dards ranged from very light, in which the labeling con-sisted of only one to a few fibers, to very heavy, in which thelabeling was so dense that individual fibers could not bediscerned.
Once all the contours were analyzed, the location of theinjection site and the density level for each column ofcortex were entered into the appropriate bins of the Excelspreadsheet. For easier interpretation and presentation ofthe data, the numeric density ratings were transformed
PERIRHINAL, POSTRHINAL, AND ENTORHINAL INTERCONNECTIONS 295

into a five-level gray scale, and straight-line, unfoldedmaps were generated. The bins corresponding to columnsin which the injection site was located were marked by adistinctive pattern. After the experiments were analyzedin this way, all of the injection sites were transferred to acomposite unfolded map (Fig. 2A).
Quantification of retrogradely labeled cells. Sec-tions from each retrograde experiment were initially sur-veyed for placement of injection site by using brightfield
optics. The contour of the hemisphere and the distributionof fluorescently labeled cells were then plotted for a 1:10series of sections throughout the ipsilateral perirhinal,postrhinal, and entorhinal cortices. This was accomplishedat a total magnification of 1003 by using a computerizeddata collection system (Neurolucida V1.5; MicroBright-field, Inc., Colchester, VT) coupled to a Nikon Optiphot-2microscope (Tokyo, Japan). The contours and plotted cellswere printed at a magnification of 163. The plots were
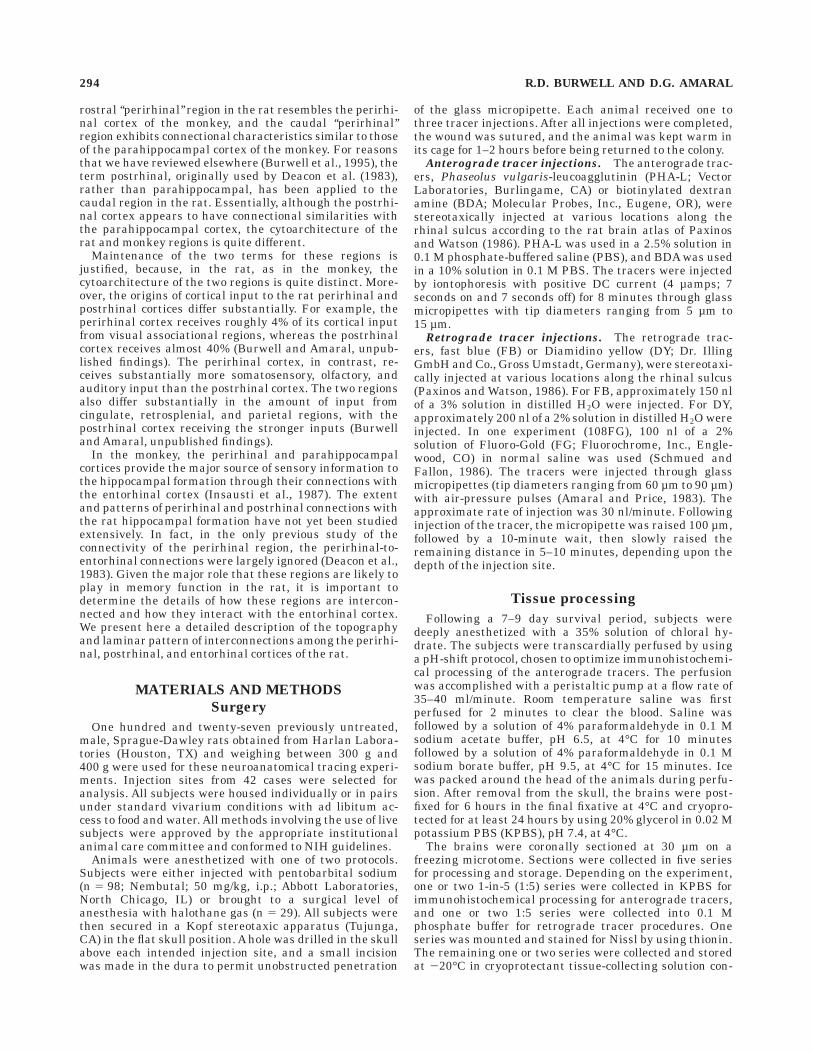
Fig. 1. A: Lateral (top) and ventral (bottom) views of the rat brain.The perirhinal cortex (PR) is shown in two shades of unmarked gray.The darker gray represents area 36 (36), and the lighter grayrepresents area 35 (35). The postrhinal cortex (POR) is indicated by adotted shading pattern on light gray. The entorhinal cortex (EC) isshown in a hatched pattern on light or dark gray. The lateralentorhinal area (LEA) is dark, and the medial entorhinal area (MEA)is light. Vertical lines mark the locations of six coronal planes labeleda–f. B: Straight-line, unfolded surface map of the PR, POR, and EC.
Letters a–f indicate slabs of the unfolded map that correspond to thecoronal planes demarcated in the surface views. C: Six coronalsections used for the unfolded map. Each coronal section correspondsto the indicated level of the surface views and the unfolded map. Levelwith respect to Bregma is shown below for each section for Swanson(1992) and for Paxinos and Watson (1986). rs, Rhinal sulcus; PaSub,parasubiculum; D, dorsal; L, lateral; R, rostral; C, caudal; V, ventral;M, medial.
296 R.D. BURWELL AND D.G. AMARAL

aligned to adjacent Nissl-stained sections by using a Wildstereomicroscope in order to add cytoarchitectonic bordersand to document the location of the injection site. Thecontour surface was then segmented at 4.8-mm intervalsrepresenting 300-µm sampling columns.
The number of retrogradely labeled cells per column wascounted for the perirhinal, postrhinal, and entorhinalcortices. The numbers of retrogradely labeled cells and thelocation of the injection site were then entered into aspreadsheet to generate a straight-line, unfolded map. Tobetter present the data and permit comparison withunfolded maps of anterograde material, the density oflabel was transformed into a five-level proportional den-sity scale. Only the bins representing columns of cortexwith some retrogradely labeled cells were included in theproportion. These density levels were then converted intoa five-level gray scale, representing density of labeling ineach bin. Bins with labeling above the 90th percentile weredesignated very heavy and are shown in black. Bins abovethe 75th percentile and below the 90th were designated asrepresenting heavy labeling and are shown in dark gray.Bins between the 55th and 75th percentiles representmoderate labeling and are shown in middle gray. Binsbetween the 30th and 55th percentiles represent lightlabeling and are shown in light gray. Bins below the 30thpercentile were designated very light and are shown invery light gray. Bins representing columns in which theinjection site was located were marked by a distinctiveshading pattern. When all experiments were analyzed, theinjection sites were transferred to a composite generic,unfolded map (Fig. 2B).
RESULTS
Nomenclature
Based on cytoarchitectonic, chemoarchitectonic, and con-nectional criteria, we have proposed that the perirhinalcortex be divided into two regions: a rostral region, forwhich we have retained the name perirhinal cortex, and acaudal region, termed the postrhinal cortex (Burwell andAmaral, 1995; Burwell et al., 1995). A detailed descriptionof the borders and neuroanatomical characteristics ofthese regions is in preparation (Burwell and Amaral,unpublished observations). For the purposes of the presentstudy, the major neuroanatomical features that we used toset the borders of the perirhinal and postrhinal corticeswill be briefly described.
The perirhinal, postrhinal, and entorhinal cortices of therat occupy the lateral, ventral, and caudal surfaces of theposterior cortical mantle. The perirhinal and postrhinalcortices comprise a strip of cortex on the lateral surface ofthe rat brain; the perirhinal cortex lies rostral to thepostrhinal cortex (Fig. 1A, top). The entorhinal cortexprovides the ventral border for the posterior perirhinalcortex and the postrhinal cortex and wraps around theventrocaudal surface of the brain (Fig. 1A, top, Fig. 1B).Previous descriptions indicated that the perirhinal andpostrhinal cortices occupy both banks of the rhinal sulcusfrom midrostrocaudal levels to its caudal extent (Deacon etal., 1983). Subsequent histochemical and tract tracingstudies, however, showed that the entorhinal cortex occu-pies both banks of the rhinal sulcus at caudal levels(Dolorfo and Amaral, 1993). The postrhinal cortex lies
Fig. 2. A: Representative unfolded map of the perirhinal (PR;areas 35 and 36), postrhinal (POR), and entorhinal (EC; areas lateralentorhinal area [LEA] and medial entorhinal area [MEA]) corticesshowing the location of the 24 anterograde injection sites selected foranalysis. Hatching or open boxes are used to show location wheninjection sites are overlapping. Otherwise, the sites are shown inshades of gray. B: Representative unfolded map showing the location
of the 33 retrograde injection sites selected for analysis. C: Genericunfolded map showing the approximate location of the lateral, interme-diate, and medial dentate-projecting bands in the entorhinal cortex.See text for details of the organization of these projections. DG,dentate gyrus; B, biotinylated dextranamine (BDA); P, Phaseolusvulgaris-leucoagglutinin (PHA-L); FB, fast blue; DY, Diamidino yel-low. Scale bar 5 1 mm.
PERIRHINAL, POSTRHINAL, AND ENTORHINAL INTERCONNECTIONS 297

dorsally adjacent to the entorhinal cortex and does notinclude any of the cortex that occupies the rhinal sulcus(Fig. 1C,e,f).
Perirhinal cortex. The perirhinal cortex is comprisedof two strips of cortex associated with the most deeplyinvaginated portion of the rhinal sulcus. The region isbordered rostrally by the insular cortex, which overlies theclaustrum. The perirhinal cortex, as we have defined it,begins at the caudal limit of the claustrum. The rostrocau-dal level at which this border occurs corresponds roughlyto plate 26 of Paxinos and Watson (1986). Area 35 is anarrow strip of cortex that primarily occupies the ventralbank and the fundus of the rhinal sulcus. Area 36 is abroader, more dorsally situated strip that includes much ofthe dorsal bank of the rhinal sulcus as well as a portion ofthe dorsally adjacent cortex.
Area 35 in the rat is agranular cortex characterized by abroad layer I. It is distinguished from the nearby piriformand entorhinal cortices by a population of lightly stainedround cells occupying layer II and a poorly populated layerIII. Layer V is distinguished by the occurrence of large,darkly stained, heart-shaped pyramidal cells that areorganized in a gradient fashion, with smaller cells locatedsuperficially and progressively larger cells located moredeeply in the layer. In the portion of area 35 that liesventral and deep to the fundus of the rhinal sulcus, thecells are arranged in a distinctive arc-like pattern.
Area 36 has a distinctly different cytoarchitecture fromarea 35. It is characterized by a prominent layer IIcontaining many round cells that are often smaller anddarker than those in area 35. Layer II generally has apatchy appearance. Layer III is sparsely populated withsmall pyramids. A very weak granular layer (IV) is presentin which granule cells are intermixed with the cells thatconstitute layers III and V. Layer V is noticeably broader,and the cells are smaller and more densely packed than inlayer V of area 35. In dorsal portions of area 36, the cortexis organized in a more columnar fashion. Layer IV is moreprominent in the dorsal portion of the field. Layer V isbroader, and the cells are slightly larger and less denselypacked than in ventral area 36. Area 36 extends caudallybeyond the level at which area 35 is visible and, at theselevels, is bordered ventrally by the entorhinal cortex. Atcaudal levels, area 36 is less radial in appearance, and thedifferences between the dorsal and ventral area 36 are lessapparent.
By most accounts, the dorsal border of the perirhinalcortex is formed by association cortex, either multimodalassociation cortex or auditory association cortex (Kreig,1946a,b; Swanson, 1992; Zilles, 1985). The band of cortexlying dorsal to area 36 can be distinguished from it by acombination of several cytoarchitectonic features. Thecortex, in general, is both more columnar and morelaminar. Layer IV is clearly visible. Layer V is broader andsparsely populated with larger cells. Layer VI is alsobroader than that of area 36 and is separated from layer Vby a cell sparse gap.
It is important to note that the perirhinal cortex, asdefined here, extends farther dorsally than typically de-scribed. The region includes the ventral portions of caudalPar2, Te3, and Te2 according to Paxinos and Watson (1986)and the ventral portion of Tev according to Swanson(1992).
Postrhinal cortex. This postrhinal cortex includesportions of areas that have been described previously as
the perirhinal, ectorhinal, and postrhinal cortices. Theborders, as defined here, are different from all previousdescriptions (for full discussion, see Burwell et al., 1995).The postrhinal cortex is located caudal to the perirhinalcortex and dorsal to the rhinal sulcus. Perhaps the mostcharacteristic cytoarchitectonic feature of the POR is itsbilaminate appearance. Layers II and III are fused andhave a fairly homogeneous appearance due to the similarsize, staining intensity, and packing densities of the resi-dent cells. Cells in layers V and VI are also merged and arequite similar in appearance. In the ventral portion of thepostrhinal cortex, layer V is narrower than in the dorsalportion. Another difference between dorsal and ventralpostrhinal cortex is that cells in layer III are relativelyhomogeneous ventrally but are more heterogeneous insize, shape and color dorsally.
The postrhinal cortex can be distinguished from thedorsally adjacent associational regions primarily by thedifferences in layer IV; dorsally adjacent cortices have amuch more prominent layer IV. The postrhinal cortex isbordered medially by the cytoarchitectonically distinctagranular retrosplenial cortex (Vogt, 1985). Although theretrosplenial cortex has a broad fused layer II/III, like thepostrhinal cortex, it has a weaker layer IV that is nonethe-less made up of distinctive, very large cells. In horizontalsections, there are prominent cell-sparse gaps on eitherside of layer IV. The postrhinal cortex is bordered ventrallymainly by the entorhinal cortex. The caudomedial portionof the postrhinal cortex, however, is bordered by a thinband of the parasubiculum that is interposed between theentorhinal and postrhinal cortices (Fig. 1C,f). The postrhi-nal cortex, as defined here, includes the most caudalportions of the perirhinal cortex and Te2 as well as ventralportions of Oc2L according to Paxinos and Watson (1986).In Swanson’s terminology (1992) our postrhinal cortexincludes caudal ectorhinal cortex and the ventral portionof caudal Tev.
Entorhinal cortex. The nomenclature used for theentorhinal cortex is based on classical descriptions of thisregion (Blackstad, 1956; Kreig, 1946a,b). The entorhinalcortex is subdivided into a lateral entorhinal area (LEA)and a medial entorhinal area (MEA; Fig. 1A). The LEA is aroughly triangular-shaped region of cortex (Fig. 1B). It isbordered dorsally by the perirhinal and postrhinal corticesand rostrally by the piriform and periamygdaloid cortices.At caudal levels, the LEA is bordered caudally and medi-ally by the MEA. The MEA is interposed between thepostrhinal cortex and caudal LEA. The MEA, which encom-passes a substantial portion of the caudal pole of thecortical mantle, is bordered medially by the parasubicu-lum (Dolorfo and Amaral, 1993).
Description of injection sites
Figure 2 shows the location of the anterograde (Fig. 2A)and retrograde (Fig. 2B) tracer injection sites that wereselected for analysis. The injection sites are plotted onrepresentative straight-line, unfolded maps of the perirhi-nal, postrhinal, and entorhinal cortices. Tracer experi-ments were selected for analysis on the basis of location ofthe injection site and the quality of labeled material.Twenty-four representative experimental injections wereselected from a library of 75 anterograde tracer injectionsites in and around the perirhinal, postrhinal, and entorhi-nal cortices. It is evident in the unfolded maps that nosystematic differences in the density or patterns of fiber
298 R.D. BURWELL AND D.G. AMARAL

labeling related to tracer (BDA or PHA-L) or size ofinjection site were observed. Thirty-three experimentalinjections were selected from a library of 72 retrogradetracer injection sites. It is evident in the unfolded mapsthat no systematic differences in the density or patterns ofretrogradely labeled cells related to tracer (FB or DY) orsize of injection were observed in the experiments selectedfor analysis. Because some cases involved multiple tracers,the injection sites are indicated by the number of the caseand a suffix denoting the tracer type. For anterogradetracer experiments, the injection site was defined as thearea containing labeled cell bodies. For retrograde tracerexperiments, the injection site was defined as the regionoccupied by the dye core plus the region of heavy necrosisimmediately surrounding the dye core. Any bin of theunfolded map that included even a part of an injection site,as defined above, was coded as part of the injection site.Thus, the unfolded maps may overestimate the size ofinjections. The approximate size and the laminar locationof the injection sites in each region are summarized inTables 1 and 2.
Overview of the presentation of results
Descriptions of the intrinsic connections of the perirhi-nal cortex and the postrhinal cortex are followed bydescriptions of the interconnections between the perirhi-nal and postrhinal cortices, the perirhinal and entorhinalcortices, and the postrhinal and entorhinal cortices. Ineach section, the results of the anterograde and retrogradeexperiments are discussed in terms of both regional andlaminar patterns of labeling. Projections may be describedin terms of strength or heaviness, but all such descriptionsare based on density of retrogradely labeled cells oranterogradely labeled fibers. To minimize the number ofillustrations, only a single unfolded map is shown for eachinjection site, and the unfolded map shows the patterns oflabeling in the perirhinal, postrhinal, and entorhinal
cortices. The patterns of anterograde and retrograde label-ing in all three regions arising from injection sites in theperirhinal, postrhinal, and entorhinal cortices are shownin Figures 3, 4, and 5, respectively.
In addition to addressing the conventional subdivisionsof the entorhinal cortex (LEA and MEA), its connectionswith the perirhinal and postrhinal cortices are also de-scribed within the context of recent findings concerningthe topography of the entorhinal projection to the dentategyrus. The entorhinal projections to septal versus tempo-ral levels of the dentate gyrus of the rat originate fromlargely nonoverlapping bands within the entorhinal cortex(Ruth et al., 1982, 1988; Witter et al., 1989; Dolorfo andAmaral, unpublished observations). A caudolaterally situ-ated band of entorhinal cortex (which contains portions ofLEA and MEA) projects to the septal half of the dentategyrus, whereas intermediate and medially situated bandsproject to the third and fourth quarters, respectively (Fig.2C). Intrinsic entorhinal connections also respect thisband-like organization, such that the associational projec-tions preferentially terminate within the band of origin(Dolorfo and Amaral, 1994; Kohler, 1988a,b; Witter et al.,1989). Thus, the entorhinal cortex will be described ascomprising lateral, intermediate, and medial bands, whichmay be further broken down to the LEA or MEA portions ofa certain band. To illustrate the types of connectivitypatterns that we have observed in a more traditionalformat than the unfolded maps, Figures 6–10 show thedistributions of retrogradely labeled cells from computer-generated plots of four rostrocaudal levels of five retro-
TABLE 1. Anterograde Tracer Injection Sites1
Location Experiment Size (µm) Layer
PerirhinalRostral area 36 54P 400 V–VIRostral area 36 90P 400 V–VIMidrostrocaudal area 36 45P 300 V–VIMidrostrocaudal area 36 62B 400 II–VMidrostrocaudal area 36 128B 400 II–VIVentral area 36 130B2 500 III–VIVentral area 36 129B 300 II–VCaudal area 36 27P 300 III–VIRostral area 35 24P 300 III–VICaudal area 35 16P 400 II–V
PostrhinalRostrodorsal POR 83B 500 V–VIDorsal POR 134B 500 I–VIRostral POR 39P 400 I–VICaudal POR 40P 500 III–VI
EntorhinalRostral LEA 127B3 500 III–VIRostral LEA 21P 300 III–VLateral LEA 61B4 400 I–IIIRostral LEA 57P 400 III–VIMidrostrocaudal LEA 66P 300 II–IIIMidrostrocaudal LEA 60B 700 II–VCaudomedial LEA 70P 400 III–VILateral MEA 28P 300 V–VIMedial MEA 68P 500 V–VIMedial MEA 41P 200 V–VI
1Anterograde injection sites have the suffix P or B, respectively, for Phaseolus vulgaris-leucoagglutinin (PHA-L) or biotinylated dextran amine (BDA). LEA, lateral entorhinalarea; MEA, medial entorhinal area; POR, postrhinal area.2Experiment 130B encroached slightly on area 35.3Experiment 127B encroached slightly on deep layers of area 35.4Experiment 61B encroached slightly on superficial layers of area 36.
TABLE 2. Retrograde Tracer Injection Sites1
Location Experiment Size (µm) Layer
PerirhinalRostral area 36 119FB 400 I–VRostrodorsal area 36 120FB 700 III–VRostroventral area 36 97DY 500 III–VMidrostrocaudal area 36 98DY 300 I–VMidrostrocaudal area 36 132FB2 200 I–IIMidrostrocaudal area 36 94FB 200 VVentral area 36 99DY 300 II–IIICaudodorsal area 36 120DY 300 VCaudoventral area 36 100DY 300 VRostral area 35 102DY 400 I–IIIRostroventral area 35 132DY 300 V–VIVentral area 35 112DY 400 VCaudal area 35 108FG 300 I–VI
PostrhinalRostral POR 97FB 400 VRostroventral POR 102FB 200 VMiddle POR 98FB 600 I–VICaudodorsal POR 100FB 500 I–VCaudal POR 95DY 400 III–VICaudal POR 99FB 500 I–V
EntorhinalRostrolateral LEA 113FB 600 I–VRostral LEA 129DY 300 III–VCaudolateral LEA 130FB 400 V–VIRostral LEA 124FB 800 I–VICaudal LEA 105DY 400 VCaudal LEA 128DY 300 VCaudomedial LEA 105FB3 400 III–VIMedial LEA 129FB 300 V–VIMEA at caudal LEA border 119DY 400 I–IILateral MEA 113DY 300 VLateral MEA 118FB 600 III–VICaudomedial MEA 124DY 600 I–IIIMEA at medial LEA border 106DY 500 II–VIMEA at medial LEA border 128FB 300 V
1Retrograde injection sites have the suffix DY, FB, or FG for Diamidino yellow, fast blue,or Fluoro-Gold, respectively. For other abbreviations, see Table 1.2The dye core and heavy necrosis of the injection site in experiment 132FB involvedsuperficial layers, but moderate necrosis was observed in an arc that extended into theexternal capsule.3Experiment 105FB may have slightly involved the underlying white matter.
PERIRHINAL, POSTRHINAL, AND ENTORHINAL INTERCONNECTIONS 299

Fig. 3. Unfolded maps of the density and distribution of labelarising from perirhinal injection sites. Location of injection sites isshown in white-and-black hatching. Bins shaded in black represent
areas of the heaviest labeling. Progressively lighter shades of grayrepresent lighter labeling. A: Anterograde maps. B: Retrograde maps.Scale bar 5 1 mm.
300 R.D. BURWELL AND D.G. AMARAL

Figure 3 (Continued)
PERIRHINAL, POSTRHINAL, AND ENTORHINAL INTERCONNECTIONS 301

Fig. 4. Unfolded maps of the density and distribution of labelarising from postrhinal injection sites. Location of injection sites isshown in white- and black-hatching. Bins shaded in black represent
areas of the heaviest labeling. Progressively lighter shades of grayrepresent lighter labeling. A: Anterograde maps. B: Retrograde maps.Scale bar 5 1 mm.
302 R.D. BURWELL AND D.G. AMARAL

Fig. 5. Unfolded maps of the density and distribution of labelarising from entorhinal injection sites. Location of injection sites isshown in white-and-black hatching. Bins shaded in black representareas of the heaviest labeling. Progressively lighter shades of gray
represent lighter labeling. A: Anterograde maps of lateral entorhinalarea sites. B: Anterograde maps of medial entorhinal area sites.C: Retrograde maps of lateral entorhinal area sites. D: Retrogrademaps of medial entorhinal area sites. Scale bar 5 1 mm.
PERIRHINAL, POSTRHINAL, AND ENTORHINAL INTERCONNECTIONS 303

Figure 5 (Continued)

grade cases. Photomicrographs of four levels of five antero-grade tracer experiments for areas 35 and 36, POR, LEA,and MEA are shown in Figures 11–15.
Intrinsic connections of the perirhinal cortex
Several principles of intrinsic connectivity were appar-ent in the patterns of labeling arising from area 36injections. First, intrinsic connections in area 36 aredistributed extensively throughout the field. When ananterograde tracer was placed into area 36, the areas ofhighest density of labeled fibers were usually found inareas adjacent to the injection site, but labeled fibers weregenerally observed throughout area 36 (Figs. 3A, 11D).
Similarly, when a retrograde tracer was placed into area36, the highest numbers of labeled cells were found inareas close to the injection site, but labeled cells were alsoobserved throughout the region (Figs. 3B, 6C). Second,projections to a focus in area 36 originate about equallyfrom regions located rostrally and caudally to the focus.Experiments 128B and 94FB provided particularly goodexamples of this principle (Fig. 3A,B). Third, althoughthere is no gradient in the rostrocaudal origin of projec-tions, there is a prominent dorsal to ventral gradient.There were always more labeled cells located dorsallyto a retrograde tracer injection than ventrally (Fig. 3B,experiment 99DY). Although this pattern was more evi-dent in cases with injection sites located closer to the
Figure 5 (Continued)
PERIRHINAL, POSTRHINAL, AND ENTORHINAL INTERCONNECTIONS 305

rhinal sulcus, it was generally true for all injections inarea 36. The laminar location of the injection sitedid not alter this pattern. This dorsal-to-ventral polaritywas also reflected in connections between areas 35and 36. Projections to area 36 were heavier from dorsallyadjacent area 36 than from 35 (Fig. 3B, experiment 97DY).This pattern of connections was confirmed by the anterogradetracer experiments (Fig. 3A, experiments 45P and 128B).
The area 36 associational connections appeared to arisefrom all cell layers, although retrogradely labeled cellswere more concentrated in layers II, V, and deep VI (Fig.
6A,B). The terminal labeling arising from anterogradeinjection sites was also distributed to all layers; layers Iand V demonstrated the highest density of labeled fibers(Fig. 11B).
Associational connections within area 35 are lighterthan in area 36. This was apparent in both anterogradeand retrograde tracing experiments (Fig. 3A,B, bottomrows). The area 35 associational connections arise from allcell layers, but the largest numbers of cells were observedin layers II and III (Fig. 7C). The associational connectionsterminate in all layers, but the projections are heavy to
Fig. 6. A–D: Computer-generated plots of coronal sections showingthe location of a retrograde tracer injection in area 36 of the perirhinalcortex and the distribution of retrogradely labeled cells arising fromthat injection site in the regions of interest. Arrows indicate cytoarchi-
tectonic boundaries. Four rostrocaudal levels are shown for experi-ment 94FB. POR, postrhinal cortex; LEA, lateral entorhinal area;MEA, medial entorhinal area. Scale bar 5 1 mm.
306 R.D. BURWELL AND D.G. AMARAL

layers II through V and moderate to layers I and VI (Fig.12C).
Area 36, as noted previously, projects heavily to area 35,but area 35 returns a weaker projection to area 36. Thisprinciple is well illustrated by comparing the area 36injection site in experiment 120FB with the area 35injection site in experiment 112DY (Fig. 3B). Based onobservations of the anterograde material, the projection toarea 35 appeared to arise primarily from ventral area 36.Moreover, the projections terminate at about the samerostrocaudal level at which they originate, i.e., retrogradetracer injections in area 35 produced high densities of
labeled cells in a strip of area 36 located dorsal to theinjection site. Thus, projections originating in area 36 andterminating in area 35 exhibit a strong dorsal-to-ven-tral polarity, with very little spread in the rostrocaudal direc-tions (Fig. 3B, experiments 102DY, 108FG, and 112DY).
Cells in layers II/III and deep VI of area 36 provide thepredominant input to area 35 (Fig. 7A), and the projectionterminates in all layers (Fig. 11C). The reciprocal pro-jection, area 35 to area 36, arises primarily in layers II andVI (Fig. 6C) and terminates in layers I, II, and VI (Fig. 12B).
To summarize, associational connections are more exten-sive in area 36 than in area 35. Area 36 projects heavily to
Fig. 7. A–D: Computer-generated plots of coronal sections showingthe location of a retrograde tracer injection in area 35 of the perirhinalcortex and the distribution of retrogradely labeled cells arising fromthat injection site. Arrows indicate cytoarchitectonic boundaries. Four
rostrocaudal levels are shown for experiment 112 DY. POR, post-rhinal cortex; LEA, lateral entorhinal area; MEA, medial entorhinalarea. Scale bar 5 1 mm.
PERIRHINAL, POSTRHINAL, AND ENTORHINAL INTERCONNECTIONS 307

area 35, but the reciprocal projections are lighter. Through-out the perirhinal cortex, there is a dorsoventral cascade ofprojections. Dorsal area 36 projects more strongly toventral area 36 than the reciprocal projection, and ventralarea 36 projects more strongly to area 35 than the recipro-cal connection. Based on the laminar origins and termina-tions of these connections, the area 36 projection to area 35can best be described as a lateral pathway according to thecriteria for hierarchical relationships in cortical regionsdescribed by Felleman and Van Essen (1991), i.e., cells insuperficial and deep layers terminate in all layers. The
return projection, however, resembles a feedback path-way (Felleman and Van Essen, 1991), i.e., the projectionexhibits a bilaminate origin in area 35 and a bilaminatetermination in area 36.
Intrinsic connectionsof the postrhinal cortex
The associational projections within the POR, like thosein area 36, are fairly extensive. Unlike the perirhinalcortex, the postrhinal associational connections do not
Fig. 8. A–D: Computer-generated plots of coronal sections showing the location of a retrograde tracerinjection in the postrhinal cortex and the distribution of retrogradely labeled cells arising from thatinjection site. Four rostrocaudal levels are shown for experiment 98FB. POR, postrhinal cortex; LEA,lateral entorhinal area; MEA, medial entorhinal area. Scale bar 5 1 mm.
308 R.D. BURWELL AND D.G. AMARAL

exhibit any clear-cut topography (Fig. 4A,B). Injections ofeither anterograde or retrograde tracers into the PORproduced a pattern of labeling that demonstrated anabrupt drop-off of labeling at the border with area 36.Thus, the POR associational connections appear to providea useful criterion for defining the border between area 36and the POR. The laminar pattern of the associationalconnections in the postrhinal cortex is similar to thatfound in area 36. Labeled cells were densest in layers II, V,and VI (Fig. 8C), and terminal label was heaviest in layersI and V/VI (Fig. 13D).
Perirhinal and postrhinal interconnections
Perirhinal projection to the postrhinal cortex. Ar-eas 35 and 36 both project to the postrhinal cortex (Fig. 4B),with the heavier projection originating in area 36 (Fig. 3A,experiments 128P, 129P, and 62B). The perirhinal projec-tions are generally heavier to rostral levels of POR (Fig.3A, middle row). However, projections arising in the mostrostral part of area 36, terminate either exclusively ormore heavily in the caudal part of POR (Fig. 3A, experi-ments 90P and 54P).
Fig. 9. A–D: Computer-generated plots of coronal sections showingthe location of a retrograde tracer injection in the lateral entorhinalarea (LEA) of the entorhinal cortex and the distribution of retro-gradely labeled cells arising from that injection site. Arrows indicate
cytoarchitectonic boundaries. Four rostrocaudal levels are shown forexperiment 129DY. POR, postrhinal cortex; MEA, medial entorhinalcortex. Scale bar 5 1 mm.
PERIRHINAL, POSTRHINAL, AND ENTORHINAL INTERCONNECTIONS 309

The cells of origin of the perirhinal to postrhinal projec-tions were observed primarily in deep layer V and in layerVI (Fig. 7D). There were fewer labeled cells in layer II.Terminal labeling was observed in layers I/II and V/VI ofthe postrhinal cortex, although scattered labeled fiberswere observed in other layers.
Postrhinal projection to the perirhinal cortex. Thepostrhinal cortex projects both to area 36 and to area 35.The projections arise primarily in rostral postrhinal cortex(Fig. 3B). They terminate more strongly in dorsal area 36than in ventral area 36 (see experiments 120DY and
100DY in Fig. 3B for a good comparison) and more stronglyin area 36 than in area 35 (Fig. 4A). The postrhinal projectionterminates preferentially in the caudal half of area 36 (seeexperiments 120FB and 120DY in Fig. 3B for a good compari-son) and the caudal half of area 35 (Fig. 3B, bottom row).
The cells of origin of the postrhinal to perirhinal projec-tions are located primarily in layers II and V, althoughscattered retrogradely labeled cells were observed in otherlayers (Figs. 6D, 7D). The postrhinal projection to area 36and to area 35 terminated in a columnar fashion in alllayers (Fig. 13A–C).
Fig. 10. A–D: Computer-generated plots of coronal sections show-ing the location of a retrograde tracer injection in the medial entorhi-nal cortex (MEA) of the entorhinal cortex and the distribution ofretrogradely labeled cells arising from that injection site. Arrows
indicate cytoarchitectonic boundaries. Four rostrocaudal levels areshown for experiment 106DY. POR, postrhinal cortex; LEA, lateralentorhinal area. Scale bar 5 1 mm.
310 R.D. BURWELL AND D.G. AMARAL

Fig. 11. A–D: Darkfield photomicrographs of coronal sections forcase 129B with a BDA injection in area 36 of the perirhinal cortex (D)and the distributions of fiber labeling in the perirhinal, postrhinal,and entorhinal cortices resulting from the anterograde tract tracerinjection. These photomicrographs and those in the following figureswere taken with a Nikon HFX-DX photographic attachment coupled
with a Leica MZ-6 stereomicroscope, scanned into Adobe Photoshop at450 dpi, and digitally adjusted for brightness and contrast. Thebackground was darkened, and any obvious dust specks were cor-rected. Arrowheads indicate cytoarchitectonic boundaries. Four rostro-caudal levels are shown. LEA, lateral entorhinal area. Scale bar 5 1mm.
PERIRHINAL, POSTRHINAL, AND ENTORHINAL INTERCONNECTIONS 311

Fig. 12. A–D: Darkfield photomicrographs of coronal sections forcase 16P with a PHA-L injection site in area 35 of the perirhinal cortex(C) and the distributions of fiber labeling in the perirhinal, postrhinal,and entorhinal cortices resulting from the anterograde tract tracer
injection. Arrowheads indicate cytoarchitectonic boundaries. Fourrostrocaudal levels are shown. POR, postrhinal cortex; LEA, lateralentorhinal area; MEA, medial entorhinal area. Scale bar 5 1 mm.
312 R.D. BURWELL AND D.G. AMARAL

Fig. 13. A–D: Darkfield photomicrographs of coronal sections forcase 40P with a PHA-L injection site in the postrhinal cortex (D) andthe distributions of fiber labeling in the perirhinal, postrhinal, andentorhinal cortices resulting from the anterograde tract tracer injec-
tion. Arrowheads indicate cytoarchitectonic boundaries. Four rostro-caudal levels are shown. POR, postrhinal cortex; LEA, lateral entorhi-nal area; MEA, medial entorhinal area. Scale bar 5 1 mm.
PERIRHINAL, POSTRHINAL, AND ENTORHINAL INTERCONNECTIONS 313

Fig. 14. A–D: Darkfield photomicrographs of coronal sections forcase 60P with a PHA-L injection site in the lateral entorhinal area(LEA) of the entorhinal cortex (C) and the distributions of fiberlabeling in the perirhinal, postrhinal, and entorhinal cortices result-
ing from the anterograde tract tracer injection. Arrowheads indicatecytoarchitectonic boundaries. Four rostrocaudal levels are shown.POR, postrhinal cortex; MEA, medial entorhinal area. Scale bar 51 mm.
314 R.D. BURWELL AND D.G. AMARAL

Fig. 15. A–D: Darkfield photomicrographs of coronal sections forcase 41P with a PHA-L injection site in the medial entorhinal area(MEA) of the entorhinal cortex (D) and the distributions of fiberlabeling in the perirhinal, postrhinal, and entorhinal cortices result-
ing from the anterograde tract tracer injection. Arrowheads indicatecytoarchitectonic boundaries. Four rostrocaudal levels are shown.POR, postrhinal cortex; LEA, lateral entorhinal area. Scale bar 51 mm.
PERIRHINAL, POSTRHINAL, AND ENTORHINAL INTERCONNECTIONS 315

Summary of perirhinal-postrhinal connections. Therostral postrhinal cortex is more strongly interconnectedwith the perirhinal cortex than the caudal postrhinalcortex, and the postrhinal-to-perirhinal projection is onlyslightly stronger than its reciprocal. The topography of theconnections, however, is complex. The postrhinal cortex ismore heavily interconnected with dorsal area 36 than withventral area 36 and is more heavily interconnected witharea 36 than with area 35. Moreover, these interconnec-tions were not point-to-point reciprocal. The dorsal portionof the postrhinal cortex gives rise to the heavier projectionto the perirhinal cortex, whereas the ventral portion of thepostrhinal cortex receives the heavier return projectionfrom the perirhinal cortex. Finally, the postrhinal projec-tion to the perirhinal cortex exhibits characteristics of alateral pathway, in that deep and superficial layers projectto all layers in a columnar fashion (Felleman and VanEssen, 1991). The perirhinal projection to the postrhinalcortex, in contrast, exhibits characteristics of a feedbackpathway, because the projection originates in deep andsuperficial layers and terminates in a bilaminar fashion.
Perirhinal and Entorhinal Interconnections
Perirhinal projection to the entorhinal cortex. Theperirhinal cortex projects strongly to the entorhinal cortex.The topography of the projections is best described both interms of the regional subdivisions (LEA and MEA) and theorganization of entorhinal projections to the dentate gyrus(see Fig. 2C for the topography of these bands). Rostralperirhinal cortex (areas 35 and 36) projects preferentiallyto rostrolateral LEA. This projection is heavier from area35 than from area 36 (Fig. 5C). These projections termi-nate in the rostral portion of LEA that innervate septallevels of the dentate gyrus, i.e., ‘‘the lateral band’’ (Fig. 3A,anterograde experiments 54P, 90P, and 24P). Projectionsarising in the caudal half of the perirhinal cortex termi-nate more medially and caudally in the LEA. They projectmore lightly to the rostral portion of LEA of the lateralband and more heavily to the LEA portions of the interme-diate band that innervates midseptotemporal levels of thedentate gyrus (Fig. 3A, experiments 128B and 16P). Theseobservations were confirmed in the retrograde material.When a retrograde tracer injection was placed into rostro-lateral LEA, labeling was heaviest in rostral area 35 and36 (Fig. 5A, experiment 113FB). When the injection was inthe intermediate LEA region, there were more labeled cellsin the caudal part of areas 35 and 36 (Fig. 5A, experiment128DY). The perirhinal cortex has only minor projectionsto the most medial portion of the LEA i.e. the portion whichinnervates temporal levels of the dentate gyrus. Theperirhinal projections to the MEA are light and are di-rected only to the most lateral portion of MEA (Fig. 5D,experiments 113DY and 118FB). All other portions of theMEA receive little if any input from the perirhinal cortex(Fig. 3A; see also Fig. 5D, last four experiments).
The area 36 projections to the entorhinal cortex origi-nate primarily in layers II, superficial V, and VI (Figs.9A–C, 10A–C). The projections to lateral portions of theentorhinal cortex originate preferentially in layer II,whereas the projections to intermediate portions of theentorhinal cortex preferentially originate from layer VI. Inarea 35, there are more retrogradely labeled cells in layersII/III and less in layers V and VI. The perirhinal projectionto the entorhinal cortex terminates mainly in layers II andIII. At the focus of the heaviest labeling, labeled fibers are
denser in layer II than in layer III. The pattern of terminallabeling is similar regardless of whether the projectionoriginates in area 35 or area 36 (Fig. 12D).
Entorhinal projection to the perirhinal cortex. Theentorhinal projection to the perirhinal cortex arises almostexclusively from the LEA. The projection originates mainlyin the rostrolateral LEA and terminates more heavily inarea 35 than in area 36 (Fig. 5A, experiments 61B and66P). Within area 36, the ventral portion is more heavilyinnervated than the dorsal (Fig. 5A, experiments 127Band 57P). Medial portions of the LEA project lightly to area35 and very lightly to area 36 (Fig. 5A, experiments 60Band 70P). The rostral LEA projects preferentially to therostral perirhinal cortex, whereas the caudal LEA projectsthroughout the perirhinal cortex (Fig. 5A, 70P). MEAinjections gave rise to little or no labeling in the perirhinalcortex (Figs. 3B, 5A, bottom row). The only exception tothis conclusion involves a portion of the perirhinal cortexlocated very near to the border with the entorhinal cortex;this portion of area 35 receives a minor projection from allportions of the entorhinal cortex (Fig. 3B, experiments132FB, 112DY, and 108FG).
The entorhinal projection to the perirhinal cortex origi-nates predominantly in layers III and V (Figs. 6C, 7C).When a retrograde tracer site was located in area 35,retrogradely labeled cells appeared primarily in layers IIIand superficial layer V in most portions of the LEA butwere labeled in all cellular layers in extreme rostrolateralLEA. Only cells in layer V were labeled in the MEA. Theentorhinal projections to area 36 invariably originate inlayer V. However, layer III also contributes to the projec-tions to caudal portions of ventral area 36. Projectionsarising in the LEA terminate in all layers of area 35 butare heaviest in layers I and V (Fig. 14A,B). The samepattern was observed in area 36 for projections originatingin rostrolateral LEA. Projections from more medial por-tions of the LEA terminate in layers II/III and VI.
Summary of perirhinal-entorhinal connections. Theperirhinal cortex projects preferentially to the LEA, particu-larly to those portions that innervate septal and midsepto-temporal levels of the dentate gyrus. Area 35 is morestrongly interconnected with the entorhinal cortex thanarea 36. Rostral perirhinal locations project more stronglyto the portion of the LEA that projects to the septal half ofthe dentate gyrus whereas caudal perirhinal cortex projectsmore strongly to the part of LEA that innervates midsepto-temporal levels of the dentate gyrus. The perirhinal toentorhinal projection resembles a feed forward pathway inthat deep and superficial layers project primarily to layersII and III (Felleman and Van Essen, 1991). The entorhinalcortex projection to the perirhinal cortex appears to berelatively weaker than the perirhinal to entorhinal projec-tion. It resembles a feedback pathway in that superficialand deep layers of the entorhinal cortex project ontosuperficial and deep layers of the perirhinal cortex (Felle-man and Van Essen, 1991).
Postrhinal and entorhinal interconnections
Postrhinal projection to the entorhinal cortex. Incontrast to the perirhinal cortex, which projects mainly tothe LEA, the postrhinal cortex projects both to the LEAand to the MEA. The postrhinal cortex projects moststrongly to the lateral (septally projecting) band of theentorhinal cortex and slightly less strongly to the interme-diate (midseptotemporally projecting) band (Fig. 4A). Like
316 R.D. BURWELL AND D.G. AMARAL

the perirhinal cortex, the most medial (temporally project-ing) band of the entorhinal cortex is only lightly inner-vated by the postrhinal cortex (Fig. 4A). The projections tothe LEA arise mainly in ventral and caudal portions of thepostrhinal cortex (Fig. 5C), but all portions of the postrhi-nal cortex project to the MEA (Fig. 5D).
The postrhinal-to-entorhinal projection originates pri-marily in layers II/III and V. The projections terminate inlayers I–III of the rostrolateral entorhinal cortex andmainly in layers II and III of more caudal and medialportions of the entorhinal cortex.
Entorhinal projection to the postrhinal cortex. Allportions of the entorhinal cortex provide input to someportion of the postrhinal cortex. The strongest projectionsarise primarily in the lateral band of the entorhinal cortex(Figs. 4B, 5A, top row), but the postrhinal cortex alsoreceives substantial input from the intermediate band(Figs. 4B, 5A, intermediate row). A substantially lighterprojection originates in the medial band (Fig. 4B, experi-ments 97FB and 95DY). The entorhinal projections termi-nate mainly in layer VI of the postrhinal cortex except inits ventral border region, where terminations were ob-served in all layers.
Summary of postrhinal-entorhinal connections. Thepostrhinal cortex is reciprocally interconnected with boththe LEA and MEA portions of all three projection bands ofthe entorhinal cortex. The connections are strongest be-tween the postrhinal cortex and the lateral band, lesssubstantial with the intermediate band, and relativelymeager with the medial band. The postrhinal cortexprojects to a more restricted portion of the rostrolateralLEA than the perirhinal cortex but is heavily intercon-nected with caudal and medial portions of the MEA. It isthis substantial projection to the MEA that differentiatesthe postrhinal cortex from the perirhinal cortex. Like theperirhinal cortex, the postrhinal projections to the entorhi-nal cortex exhibit a modified feed-forward pattern and thereciprocal projections resemble a feedback pathway.
DISCUSSION
The perirhinal and postrhinal cortices of the rat areimportant sources of cortical input to the hippocampalformation via their connections with the entorhinal cortex(Burwell et al., 1995; Naber et al., 1996). The presentreport describes new information on the organization ofassociational connections within the perirhinal and postrhi-nal cortices, on the connections between the perirhinal andpostrhinal cortices, and on the interconnections betweenthe perirhinal/postrhinal cortices and the entorhinal cor-tex. This information is summarized in Figure 16.
Although the precise topography of these connections iscomplex, there are some simplifying organizational prin-ciples. For example, there is a strong dorsal-to-ventral biasto the perirhinal intrinsic connections (Fig. 16A). Dorsalarea 36 projects strongly to ventral area 36, but thereciprocal projection is relatively weak. Similarly, ventralarea 36 projects strongly to area 35, and the reciprocalprojection is relatively weak. A similar type of cascade-liketopography is also apparent in the perirhinal-postrhinalconnections (Fig. 16B). The postrhinal cortex is morestrongly interconnected with dorsal area 36 than withventral area 36 and more strongly interconnected withventral area 36 than with area 35. These data are consis-tent with previous findings by Romanski and LeDoux
(1993), who demonstrated that there is a similar cascade ofconnections from sensory cortices lying dorsal to theperirhinal cortex that ultimately leads to the dorsal por-tion of area 36.
These assertions concerning the strength of projectionswithin the perirhinal region are based on the numbers ofretrogradely labeled cells or the density of anterogradelylabeled fibers that are observed in the various experi-ments. Our conclusions about the polarity of connectionswould need to be markedly altered if the numbers of fibersgoing in each direction were under differential physiologi-cal control. Barring this scenario, however, it would appearthat the feedback projections from the entorhinal to perirhi-nal and from the perirhinal to sensory cortices are not asprominent in the rat as in the monkey. In the monkey, thereturn projections from the entorhinal cortex to the perirhi-nal cortex are as prominent as the perirhinal projectionsinto the entorhinal cortex.
Another implication of this progression of connections isthat much of the information that reaches ventral area 36and area 35 arrives from dorsal area 36. Thus, to theextent that the perirhinal cortex may mediate some formsof memory on its own (Ennaceur, et al., 1996; Meunier etal., 1993; Murray and Gaffan, 1993; Ramus et al., 1994;Wiig and Bilkey, 1995), a lesion involving dorsal area 36may be as devastating to its function as a lesion involvingthe entire perirhinal cortex.
A similar topography was found for the perirhinal inputsto the entorhinal cortex. Area 35 provides the strongestinput to the entorhinal cortex (Fig. 16C), with progres-sively weaker inputs originating in ventral area 36 anddorsal area 36. Thus, a lesion of area 35 would effectivelyeliminate most of the perirhinal input to the hippocampalformation. To the extent that this input is essential for thehippocampal formation to mediate certain memory tasks,this lesion should be as disruptive as total perirhinallesions or lesions of the hippocampus.
The present study has provided conclusive evidence thatthe perirhinal and postrhinal cortices project differently toportions of the entorhinal cortex (Burwell and Amaral,1996; Naber et al., 1996). Although the projections areoverlapping, a simplifying statement is that the perirhinalcortex preferentially innervates the LEA and, thus, itsconnections to the rest of the hippocampal formation,whereas the postrhinal cortex preferentially innervatesthe MEA and, thus, its connections to the hippocampalformation (Figs. 16D, 17). For both the perirhinal andpostrhinal cortices, connections are stronger with thelateral (septally projecting) and intermediate (midsepto-temporally projecting) portions of the entorhinal cortexand are only meager to the medial (temporally projecting)portion of the cortex.
What are the functional implications of the differenttopographies of the perirhinal and postrhinal inputs to theentorhinal cortex? We first review previous findings regard-ing principles of hippocampal connectivity. The flow ofinformation through the hippocampal formation is definedby unique and largely unidirectional pathways (for review,see Amaral and Witter, 1995). Thus, the entorhinal cortexprovides the dentate gyrus with its major input throughthe perforant pathway, and this input is not reciprocated.Similar, largely unidirectional, projections characterizeother intrinsic connections of the hippocampal formation(dentate gyrus to the CA3 field of the hippocampus, CA3 tothe CA1 field, and CA1 to the subiculum). Importantly, the
PERIRHINAL, POSTRHINAL, AND ENTORHINAL INTERCONNECTIONS 317

entorhinal cortex appears to have three domains or bandsthat project to three different septotemporal levels of thedentate gyrus, hippocampus, and subiculum. It is impor-tant to keep in mind that each one of these bands occupiesportions of the LEA and the MEA. The lateral bandprojects to the septal half of the dentate gyrus andhippocampus, the intermediate band projects to the thirdquarter, and the medial band projects to the temporalquarter (Fig. 17; Ruth et al., 1982, 1988; Witter et al., 1989;Dolorfo, personal communication). The associational pro-jections within the entorhinal cortex tend to reinforce theisolation of these three bands. Thus, associational connec-tions arising within one of these bands tend to stay withinthe same band. (Fig. 16A; Dolorfo and Amaral, 1994;
Kohler, 1988a,b; Witter et al., 1989). Another well-established principle is that the LEA projects to the outerone-third of the dentate molecular layer and the outerportion of the CA3 stratum lacunosum-moleculare, whereasthe MEA projects to the middle one-third of the dentatemolecular layer and the inner portion of the CA3 stratumlacunosum-moleculare (Steward, 1976; Witter, 1990, 1993;Wyss, 1981). In contrast to the laminar or radial pattern ofthe entorhinal to dentate gyrus and CA3 projections, theentorhinal projections to CA1 and the subiculum termi-nate in a transverse topographic pattern. The LEA andMEA projections to CA1 and the subiculum terminatethroughout the molecular layer (Steward, 1976; Witterand Amaral, 1991). Fibers from the MEA terminate in the
Fig. 16. Wiring diagrams illustrating the interconnections amongthe perirhinal (PR; areas 35 and 36), postrhinal (POR), and entorhinalcortices (LEA and MEA) and their intrinsic connections. The upper leftbox of each diagram represents the perirhinal cortex (PR) divided intoareas 35 and 36. The upper right box represents the postrhinal cortex(POR). The lower box represents the entorhinal cortex divided into theLEA and the MEA by an oblique dashed line. Both subdivisions arefurther divided by horizontal dashed lines into bands characterized bydifferent patterns of projections to the dentate gyrus. The bands arelabeled L, I, and M to represent, respectively, the lateral, intermedi-
ate, and medial DG-projecting bands of the entorhinal cortex. The L, I,and M bands project to septal, intermediate, and temporal levelsof the dentate gyrus, respectively. The origin of a connection isindicated by the circle, and the termination is indicated by the ‘‘Y.’’ Thethickness of the line represents the strength of a connection (light,moderate, or heavy), and very light connections are denoted by dashes.A: The intrinsic connections for each area. B: The interconnectionsof the perirhinal and postrhinal cortices. C: The interconnections ofthe perirhinal and entorhinal cortices. D: The interconnections of thepostrhinal and entorhinal cortices.
318 R.D. BURWELL AND D.G. AMARAL

portion of CA1 that is located closer to CA3 and the portionof the subiculum that is closer to the presubiculum. Fibersfrom the LEA terminate closer to the border of CA1 withthe subiculum.
These principles of hippocampal connectivity togetherwith the topography of the perirhinal and postrhinalprojections to the entorhinal cortex suggest conclusionsthat are summarized schematically in Figure 17. Theperirhinal and postrhinal cortices exert more influenceover septal levels of the dentate gyrus and hippocampusthan temporal levels. Within a septotemporal level, thepostrhinal cortex influences entorhinal input to the middleone-third of the dentate molecular layer, but both theperirhinal and, to a lesser extent, the postrhinal corticesinfluence input to the outer one-third. In contrast to thisradial topography, the perirhinal and postrhinal influ-ences upon the CA1 field and the subiculum exhibit atransverse topography. Information arising from thepostrhinal cortex via the MEA has the greatest influenceon the portion of CA1 that is closer to CA3, whereasinformation arising from the perirhinal cortex via thelateral LEA innervates the distal portion of the CA1 (nearthe border with the subiculum). A similar transverseinfluence would also be seen in the subiculum.
There are several implications of this neuroanatomicalorganization. Our studies indicate that the primary unimo-dal associational input to the postrhinal cortex is visual,whereas the unimodal associational input to the perirhinalcortex is evenly weighted across all sensory modalities
(Burwell and Amaral, unpublished observations). Becauseinformation from the perirhinal and postrhinal corticesconverges in the dentate gyrus, one would expect thegranule cells to be receiving more integrated or multimo-dal information. In contrast, the input to different trans-verse regions of the CA1 and subiculum would be moredistinctly related to the perirhinal or postrhinal cortex.One would expect the perirhinal cortex to have moreinfluence over the CA1-subiculum border and the postrhi-nal cortex to have more influence over the part of CA1 thatis near CA3. These same CA1 cells, however, would also bereceiving the integrated input from the dentate gyrus viathe Schaffer collateral projection arising in CA3.
Another important implication of these findings is thatseptal levels of the dentate gyrus and hippocampus appearto receive substantially more cortically derived sensoryinput than temporal levels. Experimental lesion and physi-ological studies have already provided evidence that theremay be septotemporal differences in the function of thehippocampus. Lesions of the septal hippocampus that areno greater than 20% of the total volume of the structureare sufficient to impair performance on measures of spatiallearning. Yet, lesions of the ventral hippocampus spareperformance unless nearly 50% of the structure is dam-aged (Moser et al., 1993, 1995). The response properties ofneurons in the septal and temporal portions of the hippo-campus also show differences. The proportion of neuronswith spatially selective firing patterns is lower and thefiring fields less selective in the ventral hippocampus than
Fig. 17. A summary of the connections among the perirhinal,postrhinal, and entorhinal cortices showing how these connectionsimpact the entorhinal projections to the DG via the perforant path. Onthe left are boxes representing the perirhinal cortex divided into areas35 and 36, the postrhinal cortex (POR), and the entorhinal cortexdivided into the LEA and the MEA. The connections among theseregions are represented by arrows. In the middle of the figure is aschematic of the DG from the septal pole (top) to the temporal pole(bottom). On the right are icons representing septal and temporallevels of the DG. The perirhinal and postrhinal regions are hatched, sothat the processing of information arising in these areas can befollowed along the projection paths. In the entorhinal cortex box, thearea that receives input from the perirhinal cortex is marked with
diagonal hatching from the upper left to the lower right. The area thatreceives input from the postrhinal cortex is marked with diagonalhatching from the upper right to the lower left. Thus, the area thatreceives input from both the perirhinal and postrhinal cortices is crosshatched. These patterns are carried through to the coronal views of theDG and hippocampus, so that it is possible to see where informationarising in the perirhinal and postrhinal corticies is transmitted inthese structures. In the entorhinal box, the three DG-projecting bandsare represented by different shades of gray. These shades are carriedthrough the projection path (curved arrows) and are seen in theunfolded dentate gyrus and in the coronal views of the DG and thehippocampus.
PERIRHINAL, POSTRHINAL, AND ENTORHINAL INTERCONNECTIONS 319

in the dorsal hippocampus (Jung et al., 1994; but seePoucet et al., 1994).
In work directed at developing a monkey model ofmemory function, there has been a change in thinkingabout the relative roles of the hippocampal formation andthe perirhinal and parahippocampal cortices. This hasoccurred, in part, because the ‘‘benchmark’’ task for evalu-ating medial temporal lobe memory function appears to bemediated entirely by the perirhinal cortex (Meunier et al.,1993; Murray and Gaffan, 1993; Ramus et al., 1994). Workfrom our laboratory has established that substantiallydifferent complements of cortical inputs reach the perirhi-nal and parahippocampal cortices (Suzuki and Amaral,1994a). The perirhinal cortex is dominated by input fromthe inferotemporal visual areas and, thus, is in an idealposition to mediate visual object memory tasks. Theparahippocampal cortex also receives visual input but,unlike the perirhinal cortex, receives additional inputsfrom the posterior parietal cortex and from the retrosple-nial cortex. These inputs undoubtedly convey spatial infor-mation that might be relevant to performing tasks ofvisuospatial memory. A major unresolved issue is whatform of memory the hippocampal formation, which re-ceives inputs both from the perirhinal and parahippocam-pal cortices, is carrying out.Amajor motivation for conduct-ing the present study was to determine whether theorganization and connectivity of the rat perirhinal regionresembles that of the monkey. A number of questions wereraised in the introduction that can now be answered.
It is quite clear that the caudal perirhinal region is bothcytoarchitectonically and connectionally distinct from therostral perirhinal region, i.e., the postrhinal cortex isdifferent from the perirhinal cortex. We found, for example,that the associational connections of the postrhinal cortexterminate at the border with the perirhinal cortex. What arethe similarities and differences of these regions in the rat andmonkey? In the rat, as in the monkey, the postrhinal cortexprojects to medial entorhinal area, which, in the monkey, isECL, EC, and the caudal portion of EI, whereas the perirhinalcortex projects to the lateral entorhinal area, which, in themonkey is EO, ER, and rostral EI (for the monkey, see Insaustiet al., 1987; Suzuki and Amaral, 1994b; Van Hoesen andPandya, 1975a,b). In both species, the connections of theperirhinal and postrhinal cortices with the entorhinal cortexare reciprocal (for the monkey, see Insausti et al., 1987; Jonesand Powell, 1970; Suzuki andAmaral, 1994b; Van Hoesen andPandya, 1975a,b). Moreover, the laminar patterns of theentorhinal connections are similar in the monkey and in therat. The perirhinal and postrhinal/parahippocampal corticesproject to the entorhinal cortex with a laminar pattern thatresembles a feed-forward pathway, whereas the reciprocalprojections resemble feedback pathways (Suzuki and Amaral,1994a,b). We will show in a forthcoming paper that, again,similar to the situation in the monkey, the perirhinal andpostrhinal cortices receive distinct complements of corticalinputs.
There are, however, some important differences betweenthe rat and monkey. The cytoarchitectonic characteristicsof the postrhinal cortex are very different from those of theparahippocampal cortex in the monkey. Hence, the deci-sion to retain the name postrhinal cortex for this region inthe rat. There are other connectional differences as well.The perirhinal cortex, as one might expect, is not domi-nated by visual input in the rat, and, in fact, more visualinput reaches the hippocampal formation via the postrhi-
nal cortex than through the perirhinal cortex. Althoughthis difference could be attributable to the different sen-sory processing needs of the rat and the monkey, thedifferences in the weighting of interconnections betweenthe entorhinal cortex and the perirhinal/postrhinal cortexare not as easy to explain. In the monkey, the feedbackprojections from the entorhinal cortex to the perirhinal/parahippocampal cortex are as strong as the projectionsinto the entorhinal cortex. In the rat, however, entorhinalprojections to the perirhinal/postrhinal cortices are rela-tively meager. This suggests that the entorhinal projec-tions to the perirhinal and postrhinal cortices may providea relatively less important output route for the hippocam-pus in the rat compared with the monkey. Finally, in themonkey, the parahippocampal cortex projects strongly tothe perirhinal cortex, but the reciprocal projection isrelatively weak (Suzuki and Amaral, 1994b). The evidencein the rat suggests that these reciprocal connections aremuch more comparable in magnitude.
To conclude, there are a number of neuroanatomicalsimilarities between the perirhinal and postrhinal corticesin the rat and the perirhinal and parahippocampal corticesin the monkey. In both species, they provide the majorcortical input to the hippocampal formation, although theinformation that is conveyed is probably different in bothspecies. It remains to be seen, based on electrophysiologi-cal and behavioral studies of these regions, whether theyare carrying out similar functions in both species andwhether they are collaborating with the hippocampalformation in the same manner.
ACKNOWLEDGMENTS
This research was supported by an NIMH postdoctoralfellowship (F32-NS09247) to R.D.B. and an NIH grant (NS16980) to D.G.A. These studies were conducted, in part, atthe Salk Institute for Biological Studies, La Jolla, CA, andat the Center for Behavioral Neuroscience, State Univer-sity of New York, Stony Brook, NY. The authors gratefullyacknowledge the technical support of Janet Weber, DanAntoniello, and Guadalupe Garcia. We also thank HowardEichenbaum, Peter R. Rapp, and Menno P. Witter forcomments on earlier versions of this paper.
LITERATURE CITED
Amaral, D.G., and J.L. Price (1983) An air pressure system for the injectionof tracer substances into the brain. J. Neurosci. Methods 9:35–43.
Amaral, D.G., and M.P. Witter (1995) Hippocampal formation. In G.Paxinos (ed): The Rat Nervous System, 2nd Ed. San Diego: AcademicPress, Inc., pp. 443–493.
Blackstad, T.W. (1956) Commissural connections of the hippocampal regionin the rat, with special reference to their mode of termination. J. Comp.Neurol. 105:417–537.
Bunsey, M., and H. Eichenbaum (1993) Critical role for the parahippocam-pal region for paired-associate learning in rats. Behav. Neurosci.107:740–47.
Burwell, R.D., and D.G. Amaral (1993) A PHA-L study of projections fromperirhinal cortex in the rat. Soc. Neurosci. Abstr. 19:853.
Burwell, R.D., and D.G. Amaral (1995) The issue of parahippocampal cortexin the rat. Soc. Neurosci. Abstr. 21:1494.
Burwell, R.D., and D.G. Amaral (1996) The perirhinal and postrhinal intercon-nections with the entorhinal cortex. Soc. Neurosci.Abstr. 22:1118.
Burwell, R.D., M. Caballero, M.P. Witter, and D.G. Amaral (1994) A PHA-Lstudy of the perirhinal projection to the thalamus in the rat. Soc.Neurosci. Abstr. 20:1415.
Burwell, R.D., M.P. Witter, and D.G. Amaral (1995) The perirhinal andpostrhinal cortices of the rat: A review of the neuroanatomical literature
320 R.D. BURWELL AND D.G. AMARAL

and comparison with findings from the monkey brain. Hippocampus5:390–408.
Deacon, T.W., H. Eichenbaum, P. Rosenberg, and K.W. Eckmann (1983)Afferent connections of the perirhinal cortex in the rat. J. Comp. Neurol.220:168–190.
Dolorfo, C.L., and D.G. Amaral (1993) Connectional and immunocytochemi-cal differences at the border of the entorhinal and perirhinal cortices inthe rat. Soc. Neurosci. Abstr. 19(1):853.
Dolorfo, C.L., and D.G. Amaral (1994) Information processing in theentorhinal cortex of the rat: A neuroanatomical study of entorhinalintrinsic connections. Soc. Neurosci. Abstr. 20:350.
Ennaceur, A., N. Neave, and J.P. Aggleton (1996) Neurotoxic lesions of theperirhinal cortex do not mimic the behavioral effects of fornix transec-tion in the rat. Behav. Brain Res. 80:9–25.
Felleman, D.J., and D.C. Van Essen (1991) Distributed hierarchical process-ing in the primate cerebral cortex. Cerebral Cortex 1:1–47.
Gaffan, D., and E.A. Murray (1992) Monkeys (Macaca fascicularis) withrhinal cortex ablations succeed in object discrimination learning de-spite 24-hr intertrial intervals and fail at matching to sample despitedouble sample presentations. Behav. Neurosci. 106:30–38.
Gerfen, C.R., and P.E. Sawchenko (1984) An anterograde neuroanatomicaltracing method that shows the detailed morphology of neurons, theiraxons and terminals: Immunohistochemical localization of an axonallytransported plant lectin, Phaseolus vulgaris leucoagglutinin (PHA-L).Brain Res. 290:219–238.
Insausti, R., D.G. Amaral, and M.W. Cowan (1987) The entorhinal cortex ofthe monkey: II. Cortical afferents. J. Comp. Neurol. 264:356–395.
Jones, E.G., and T.P.S. Powell (1970) An anatomical study of convergingsensory pathways within the cerebral cortex of the monkey. Brain93:793–820.
Jung, M.W., S.I. Weiner, and B.L. McNaughten (1994) Comparison ofspatial firing characteristics of units in dorsal and ventral hippocampusof the rat. J. Neurosci. 14:7347–7356.
Kohler, C. (1988a) Intrinsic connections of the retrohippocampal region inthe rat brain. II. The medial entorhinal area. J. Comp. Neurol.246:149–169.
Kohler, C. (1988b) Intrinsic connections of the retrohippocampal region inthe rat brain: III. The lateral entorhinal area. J. Comp. Neurol.271:208–228.
Kreig, W.J.S. (1946a) Connections of the cerebral cortex. I. The albino rat.A. Topography of the cortical areas. J. Comp. Neurol. 84:221–275.
Kreig, W.J.S. (1946b) Connections of the cerebral cortex. I. The albino rat.B. Structure of the cortical areas. J. Comp. Neurol. 84:277–323.
Lewis, D.A., M.J. Campbell, and J.H. Morrison (1986) An immunohisto-chemical characterization of somatostatin-28 and somatostatin-28-1-12in monkey prefrontal cortex. J. Comp. Neurol. 248:1–18.
Meunier, M., J. Bachevalier, M., J. Bachevalier, M. Mishkin, and E.A.Murray (1993) Effects on visual recognition of combined and separateablations of the entorhinal and perirhinal cortex in rhesus monkeys. J.Neurosci. 13:5418–5432.
Moser, E., M. Moser, and P. Andersen (1993) Spatial learning impairmentparallels the magnitude of dorsal hippocampal lesions, but is hardlypresent following ventral lesions. J. Neurosci. 13:3916–3925.
Moser, M., E.I. Moser, E. Forrest, P. Andersen, and R.G.M. Morris (1995)Spatial learning with a minislab in the dorsal hippocampus. Proc. Natl.Acad. Sci., USA 92:9697–9701.
Mumby, D.G., and J.P.J. Pinel (1994) Rhinal cortex lesions and objectrecognition in rats. Behav. Neurosci. 108:11–18.
Murray, E.A., and D. Gaffan (1993) Effects of lesions of rhinal cortex,hippocampus, or parahippocampal gyrus in rhesus monkeys on objectand spatial reversals. Soc. Neurosci. Abstr. 19:438.
Murray, E.A., and M. Mishkin (1986) Visual recognition in monkeysfollowing rhinal cortical ablations combined with either amygdalec-tomy or hippocampectomy. J. Neurosci. 6:1991–2003.
Myhrer, T., and K. Wangen (1996) Marked retrograde and anterogradeamnesia of a visual discrimination task in rats with selective lesions ofthe perirhinal cortex. Neurobiol. Learning Memory 65:244–252.
Naber, P.A., M. Caballero-Bleda, and M.P. Witter (1996) Perirhinal andpostrhinal cortex innervate different parts of entorhinal cortex: Indica-tion for segregated information processing in the hippocampal system.Eur. J. Neurosci. 9(Suppl.).
Otto, T., and H. Eichenbaum (1992) Complementary roles of orbitalprefrontal cortex and the perirhinal/entorhinal cortices in an odor-guideddelayed non-matching to sample task. Behav. Neurosci. 106:762–775.
Paxinos, G., and C. Watson (1986) The Rat Brain in Stereotaxic Coordi-nates, 2nd Ed. San Diego: Academic Press.
Poucet, B., C. Thinus-Blanc, and R.U. Muller (1994) Place cells in theventral hippocampus of rats. Neuroreport 5:2045–2048.
Ramus, S.J., S. Zola-Morgan, and L.R. Squire (1994) Effects of lesions ofperirhinal cortex or parahippocampal cortex on memory in monkeys.Soc. Neurosci. Abstr. 20:1074.
Romanski, L.M., and J.E. LeDoux (1993) Information cascade from primaryauditory cortex to the amygdala: Corticocortical and corticoamygdaloidprojections of temporal cortex in the rat. Cerebral Cortex 3:515–532.
Ruth, R.E., T.J. Collier, and A. Routtenberg (1982) Topography between theentorhinal cortex and the dentate septotemporal axis in rats. I. Medialand intermediate entorhinal projecting cells. J. Comp. Neurol. 209:69–78.
Ruth, R.E., T.J. Collier, and A. Routtenberg (1988) Topography between theentorhinal cortex and the dentate septotemporal axis in rats. II. Cellsprojecting from lateral entorhinal subdivisions. J. Comp. Neurol.270:506–516.
Schmued, L.C., and J.H. Fallon (1986) Fluoro-Gold: A new fluorescentretrograde axonal tracer with numerous unique properties. Brain Res.377:147–54.
Steward, O. (1976) Topographic organization of the projections from theentorhinal area to the hippocampal formation of the rat. J. Comp.Neurol. 167:285–315.
Suzuki, W.A., and D.G. Amaral (1994a) The perirhinal and parahippocam-pal cortices of the macaque monkey: Cortical afferents. J. Comp.Neurol. 350:497–533.
Suzuki, W.A., and D.G. Amaral (1994b) Topographic organization of thereciprocal connections between the monkey entorhinal cortex and theperirhinal and parahippocampal cortices. J. Neurosci. 14:1856–1877.
Suzuki, W.A., and D.G. Amaral (1996) The construction of straight lineunfolded two-dimensional density maps of neuroanatomical projectionsin the monkey cerebral cortex. Neurosci. Protocols 80:1–19.
Suzuki, W.A., S. Zola-Morgan, L.R. Squire, and D.G. Amaral (1993) Lesionsof the perirhinal and parahippocampal cortices in the monkey producelong-lasting memory impairment in the visual and tactual modalities.J. Neurosci. 13:2430–2451.
Swanson, L.W. (1992) Brain Maps: Structure of the Rat Brain. Amsterdam:Elsevier.
Van Essen, D.C., and J.H.R. Maunsell (1980) Two-dimensional maps of thecerebral cortex. J. Comp. Neurol. 191:317–330.
Van Hoesen, G.W., and D.N. Pandya (1975a) Some connections of theentorhinal (area 28) and perirhinal (area 35) cortices of the rhesusmonkey. I. Temporal lobe afferents. Brain Res. 95:1–24.
Van Hoesen, G.W., and D.N. Pandya (1975b) Some connections of theentorhinal (area 28) and perirhinal (area 35) cortices of the rhesusmonkey. III. Efferent connections. Brain Res. 95:39–59.
Vogt, B.A. (1985) Cingulate cortex. In A. Peters and E.G. Jones (eds):Cerebral Cortex, Vol. 4: Association and Auditory Cortices. New York:Plenum Press, pp. 89–179.
Wiig, K.A., and D.K. Bilkey (1995) Lesions of rat perirhinal cortexexacerbate the memory deficit observed following damage to thefimbria-fornix. Behav. Neurosci. 109:620–630.
Wiig, K.A., L.N. Cooper, and M.F. Bear (1996) Temporally graded retro-grade amnesia following separate and combined lesions of the perirhi-nal cortex and fornix in the rat. Learning Memory 3:313–325.
Witter, M.P. (1990) Organization of the entorhinal projections to thehippocampal formation of the rat. Soc. Neurosci. Abstr. 16:124.
Witter, M.P. (1993) Organization of the entorhinal-hippocampal system: Areview of the current anatomical data. Hippocampus 3:33–44.
Witter, M.P., and D.G. Amaral (1991) Entorhinal cortex of the monkey: V.Projections to the dentate gyrus, hippocampus, and subicular complex.J. Comp. Neurol. 307:437–459.
Witter, M.P., H.J. Groenewegen, F.H. Lopes de Silva, and A.H.M. Lohman(1989) Functional organization of the extrinsic and intrinsic circuitry ofthe parahippocampal region. Prog. Neurobiol. 33:161–253.
Wyss, J.M. (1981) An autoradiographic study of the efferent connections ofthe entorhinal cortex in the rat. J. Comp. Neurol. 199:495–512.
Zhu, X.O., M.W. Brown, and J.P. Aggleton (1995) Neuronal signalling ofinformation important to visual recognition memory in rat rhinal andneighboring cortices. Eur. J. Neurosci. 7:753–765.
Zilles, K. (1985) The Cortex of the Rat: A Stereotaxic Atlas. Berlin:Springer-Verlag.
Zola-Morgan, S., L.R. Squire, D.G. Amaral, and W.A. Suzuki (1989) Lesionsof perirhinal and parahippocampal cortex that spare the amygdala andhippocampal formation produce severe memory impairment. J. Neuro-sci. 9:4355–4370.
PERIRHINAL, POSTRHINAL, AND ENTORHINAL INTERCONNECTIONS 321