periodic slow earthquakes on the flank of k lauea volcano ... · periodic slow earthquakes on the...
TRANSCRIPT

tters 246 (2006) 207–216www.elsevier.com/locate/epsl
Earth and Planetary Science Le
Periodic slow earthquakes on the flank of Kīlauea volcano, Hawaiʻi
Benjamin A. Brooks a,⁎, James H. Foster a, Michael Bevis b, L. Neil Frazer a,Cecily J. Wolfe a, Mark Behn c
a School of Ocean and Earth Science and Technology, University of Hawaiʻi, 1680 East–West Rd, Honolulu, HI 96816, USAb Geodetic Science, Ohio State University, 2036 Neil Ave. Mall, Columbus, OH 43210, USA
c Department of Geology and Geophysics, Woods Hole Oceanographic Institution, Woods Hole, MA 02543, USA
Received 21 December 2005; received in revised form 16 March 2006; accepted 20 March 2006Available online 22 May 2006
Editor: S. King
Abstract
We analyze 8 years of continuous GPS data from the Hilina slump (HS) on Kīlauea volcano's south flank and identify 3 newslow earthquake (SE) events. The new SEs are very similar to the previously identified one from November 2000, suggesting theyshare a common source. The series of SEs are separated by regular periods of 774 (±7) days. None of the newly identified eventsare associated with increased rainfall rates, precluding rainfall as a necessary SE trigger. All of the SEs are followed by increasedmicroseismicity in a ∼NW–SE trending band in the southern HS, suggesting that the SEs trigger seismicity. SE location and sourceparameters are not well-constrained by the CGPS network, although moment can be constrained adequately for the January 2005event. Using this as a reference, we calculate for the four events equivalent moment magnitude values of 5.6, 5.7, 5.5, and 5.8, intheir order of occurrence.© 2006 Elsevier B.V. All rights reserved.
Keywords: slow earthquakes; deformation; GPS geodesy; landslide; tsunami
1. Introduction
Following the initial detection of ‘silent’ or slowearthquakes (SE) using strainmeters [1–3], continuousGPS (CGPS) observations have led to the discovery ofsilent after-slip events after conventional subductionzone earthquakes in Japan [4], a SE in the CascadiaSubduction Zone unassociated with a conventionalearthquake [5], and recognition that Cascadia SEs areperiodic [6] and accompanied by seismic tremor [7].The first SE detected in an intraplate setting occurred inNovember 2000 following intense rainfall at the Hilina
⁎ Corresponding author.E-mail address: [email protected] (B.A. Brooks).
0012-821X/$ - see front matter © 2006 Elsevier B.V. All rights reserved.doi:10.1016/j.epsl.2006.03.035
slump (HS) on Kīlauea volcano's south flank [8].Because of their increasingly widespread detection [9–12] much recent work has focused on developing amechanical explanation for subduction zone SEs. Someworkers have argued that the tremor associated with theepisodic slip (now termed ETS – ‘Episodic Tremor andSlip’) is closely related to ‘harmonic tremor’, a seismicphenomenon frequently observed in the early stages ofan eruption and which is thought to be driven by forcedfluid flow [13]. It has been suggested that ETS is drivenby water released during metamorphic phase changes atthe interface between a subducting and overriding plate[14–16].
It is unclear, however, whether ETS is applicablein other types of actively deforming regions where

208 B.A. Brooks et al. / Earth and Planetary Science Letters 246 (2006) 207–216
SEs have occurred, such as strike–slip plate bound-aries [1] or volcano flanks [8], where there are distinctlydifferent rheological conditions. At Kīlauea's Hilinaslump (HS), for instance, because the event followed aperiod of intense rainfall, Cervelli et al. [8] suggested aSE-triggering mechanism where percolating rainwateracted to lubricate a slip plane at ∼5 km depth.
In this study, we identify 3 new Hilina slump SEs thatare very similar to the November 2000 SE, suggestingthey share a common source. We find that none of thenew events are associated with significant rainfall andthat they consistently trigger microearthquakes in aspecific location within the HS. More surprisingly, wefind that the series of 4 SEs is apparently periodic: 774-day (±7-day) intervals separate each event. As rainfall isclearly not a necessary condition for SEs to occur, and asthe SEs likely occurred in a well-hydrated wedgeshallower than ∼10 km, our results suggest that if ageneral theory is to be developed to explain SEoccurrence and periodicity, it should consider a widerrange of mechanical conditions than previously thought.
2. Kīlauea's mobile south flank
The Hawaiian Volcano Observatory (HVO), theUniversity of Hawaiʻi, and Stanford University jointlyoperate a network of continuous GPS (CGPS) stationsfocused on Kīlauea volcano (Fig. 1). Data from theCGPS network and periodically reoccupied survey GPSsites demonstrate that under the influence of somecombination of gravitational and magmatic forces,Kīlauea's entire south flank, known as the ‘Hilinaslump’ (HS), currently slides seaward at average rates of∼6–10 cm/yr [17,18] (Fig. 1B). Underlain by a gentlynorth-dipping decollement at depths of ∼7–11 km, fully3/4 of the HS is expressed offshore as a submarinelandslide [19–21] that poses a major tsunami hazardboth locally and across the eastern Pacific basin [22,23].Microseismicity in the region is dominated by decolle-ment events [24] and the decollement has beenpostulated as the source for large recent earthquakessuch as the 1975 M 7.2 Kalapana [25] and 1868 M 7.7Great Kaʻū earthquakes [26,27].
It is generally believed that Kīlauea's southwestand east rift zones (SWRZ, ERZ) delineate the HS'supslope boundary (e.g. 28]) and that the ∼500 m high,south-facing scarps of the Hilina Pali represent normalfaults in the headwall of the HS. The downdipcontinuity of the Hilina Pali fault plane has beendebated with some authors suggesting the faultscontinue to depth and intersect the decollement [29]while others suggest the faults shoal at shallow depths
[30,31]. The different geometric scenarios havedistinctly different implications for HS wedge kine-matics and tsunamigenesis: slip occurring on ashoaling Hilina Pali fault would not be expected toinduce as much slip on the decollement as a Hilina Palifault which extended to greater depths. The latterscenario might be expected to generate larger subma-rine volume movements and associated tsunamis thanthe former.
3. GPS processing and displacement estimates
Our analysis of the CGPS data from the Kīlaueanetwork comprises estimating both long term velocitiesover yearly time-scales and the magnitude of discretedisplacements occurring over periods of days. Toestimate long-term velocities we perform daily regionalgeodetic analyses on CGPS measurements from allavailable Hawaiʻi stations and fiducial sites around thePacific using the GAMIT and GLOBK software [32]and precise orbits computed by the Scripps Orbit andPermanent Array Center (SOPAC) (http://sopac.ucsd.edu). For more details on our long-term velocitydetermination we refer the reader to Caccamise et al.[33].
We estimate the magnitude of discrete displacementsusing a robust least squares fit to a step function and alinear velocity for each component. A window of20 days either side of the event is used for the fit. Thiswas empirically determined to optimize the trade-offbetween minimizing the impact of short period (3–7 days) correlated “noise” in the time series that mightbias the step estimates and real, longer period changes inthe velocities that would require more parameters toestimate. The formal errors for this fit represent theuncertainties in the displacement estimates.
In a Pacific plate-fixed reference frame, the timeseries solutions show the HS CGPS sites movingseaward at an average rate of ∼6–10 cm/yr, punctuatedby discrete steps of millimetres to a few centimetresdisplacement over periods of a few days (Fig. 2). It isimportant to note that these data are well-suited for eventdetection because hydrological loading effects do notcomplicate the GPS displacement records as they do inmany continental settings [34].
In Figs. 2A and 3, we identify a total of 3 newdiscrete SE events along with the November 2000 event[8] and a major dyke intrusion from Kīlauea's east riftzone [35]. The displacements associated with the SEsare clearly significant at the 95% confidence level (Figs.1 and 3) and they stand out from other transient motionsin the time series because of their similar location and
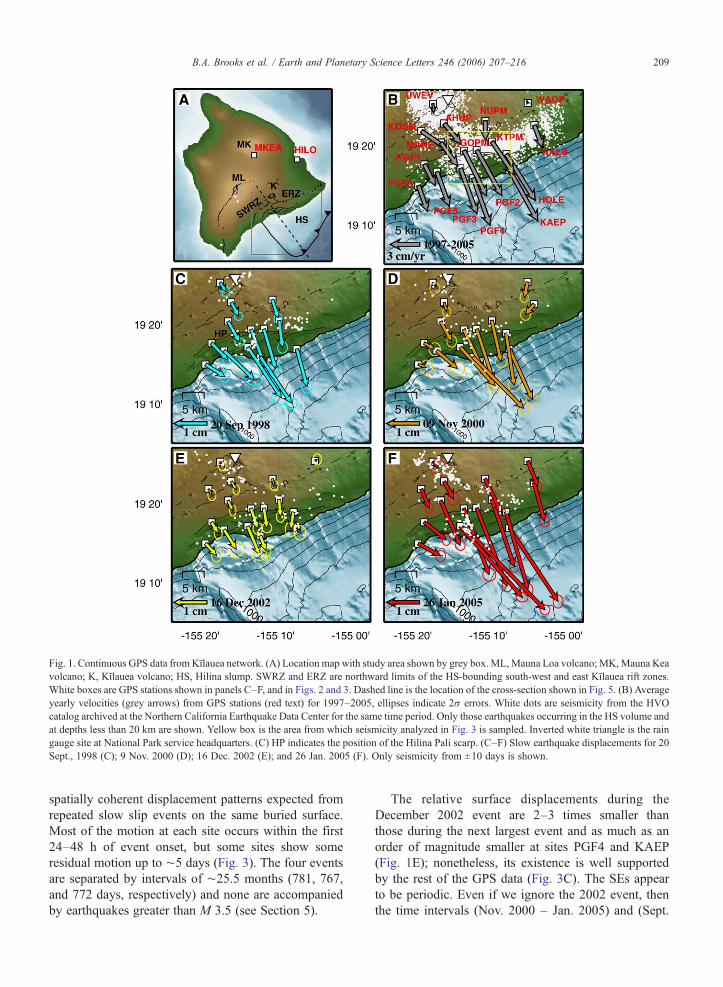
Fig. 1. Continuous GPS data from Kīlauea network. (A) Location map with study area shown by grey box. ML, Mauna Loa volcano; MK,Mauna Keavolcano; K, Kīlauea volcano; HS, Hilina slump. SWRZ and ERZ are northward limits of the HS-bounding south-west and east Kīlauea rift zones.White boxes are GPS stations shown in panels C–F, and in Figs. 2 and 3. Dashed line is the location of the cross-section shown in Fig. 5. (B) Averageyearly velocities (grey arrows) from GPS stations (red text) for 1997–2005, ellipses indicate 2σ errors. White dots are seismicity from the HVOcatalog archived at the Northern California Earthquake Data Center for the same time period. Only those earthquakes occurring in the HS volume andat depths less than 20 km are shown. Yellow box is the area from which seismicity analyzed in Fig. 3 is sampled. Inverted white triangle is the raingauge site at National Park service headquarters. (C) HP indicates the position of the Hilina Pali scarp. (C–F) Slow earthquake displacements for 20Sept., 1998 (C); 9 Nov. 2000 (D); 16 Dec. 2002 (E); and 26 Jan. 2005 (F). Only seismicity from ±10 days is shown.
209B.A. Brooks et al. / Earth and Planetary Science Letters 246 (2006) 207–216
spatially coherent displacement patterns expected fromrepeated slow slip events on the same buried surface.Most of the motion at each site occurs within the first24–48 h of event onset, but some sites show someresidual motion up to ∼5 days (Fig. 3). The four eventsare separated by intervals of ∼25.5 months (781, 767,and 772 days, respectively) and none are accompaniedby earthquakes greater than M 3.5 (see Section 5).
The relative surface displacements during theDecember 2002 event are 2–3 times smaller thanthose during the next largest event and as much as anorder of magnitude smaller at sites PGF4 and KAEP(Fig. 1E); nonetheless, its existence is well supportedby the rest of the GPS data (Fig. 3C). The SEs appearto be periodic. Even if we ignore the 2002 event, thenthe time intervals (Nov. 2000 – Jan. 2005) and (Sept.

Fig. 2. (A) Daily solution time series of relative northward motion of GPS stations indicated in Fig. 1. Stations HILO and MKEA shown as stablereferences. Four slow earthquakes colored as in Fig. 1. Dashed pink line indicates September 1999 dyke intrusion. Vertical dashed red line indicatesthe time of the event. (B) Cumulative rainfall measured at the National Park Service headquarters (see Fig. 1 for location). (C) Daily counts ofearthquakes within the slump volume (19°21″55″ : 19°33″43″N, −155°31′10″ :−155°14′62″W, 0.20 km depth) from the HVO catalog archived atthe Northern California Earthquake Data Center.
210 B.A. Brooks et al. / Earth and Planetary Science Letters 246 (2006) 207–216
1998 – Nov. 2000) have durations in the ratio 1.97 :1,which differs only by 1.5% from the integer ratio 2 :1.Once the 2002 event is included, all three intervalshave a similar duration falling in the range 774±7 days. While interseismic strain rates near a lockedsubduction zone (as in Cascadia) are expected to varyvery little from one year to the next, the temporaldevelopment of strain in the near-field of an activelyerupting volcano is expected to be less steady due totemporal variation in the stress field [36]. Even forCascadia SE events, some GPS stations do not recordall of the jumps observed at other stations. It is not
unreasonable that event amplitudes would be rathermore heterogeneous at Kīlauea.
Fig. 2B shows cumulative rainfall since 1998 for asite near Kīlauea caldera and demonstrates that,although there certainly was a large rainfall event(>1 m) a week prior to the November 2000 SE, no suchrelationship exists with the other SEs. Moreover, largerainfall events elsewhere in the time series are notaccompanied with obvious deformation events and weconclude that heavy rainfall is not a necessary conditionfor a slow earthquake to occur at the HS. This does not,however, preclude the possibility that cumulative

Fig. 3. Detrended time series for the North component of stations indicated in Fig. 1B for each of the four SE events. Solid blue dots, indicates awindow of 80 days either side of the event. Red line indicates the fit to a step function and a linear velocity: (A) 20 Sept., 1998; (B) 9 Nov. 2000; (C)16 Dec. 2002; (D) 26 Jan. 2005.
211B.A. Brooks et al. / Earth and Planetary Science Letters 246 (2006) 207–216

Fig. 3 (continued).
212 B.A. Brooks et al. / Earth and Planetary Science Letters 246 (2006) 207–216
213B.A. Brooks et al. / Earth and Planetary Science Letters 246 (2006) 207–216
rainwater filtration to seismogenic depths may still exertsome influence on deformational activity.
4. Inversion for slow earthquake source parameters
In order to investigate SE source mechanism wefollow Brooks and Frazer [38] and use a MonteCarlo-based Gibbs sampling (GS) algorithm to invertsurface displacements for the 9 non-linear parametersdescribing the geometry and kinematics of a rectan-gular dislocation in an elastic half-space [37]. Ourgoal is not simply to obtain an optimal solution, butrather to estimate posterior densities for their value asindicators of resolution and uncertainty. This isespecially important for two reasons: first, samplinggeometry is spatially biased because the CGPSnetwork is restricted by the shoreline and simplyreporting an optimal model may seriously misrepre-sent the complexity of parameter/misfit space; second,the HS is a potential tsunami hazard both locally andfor the Pacific region and mischaracterization of
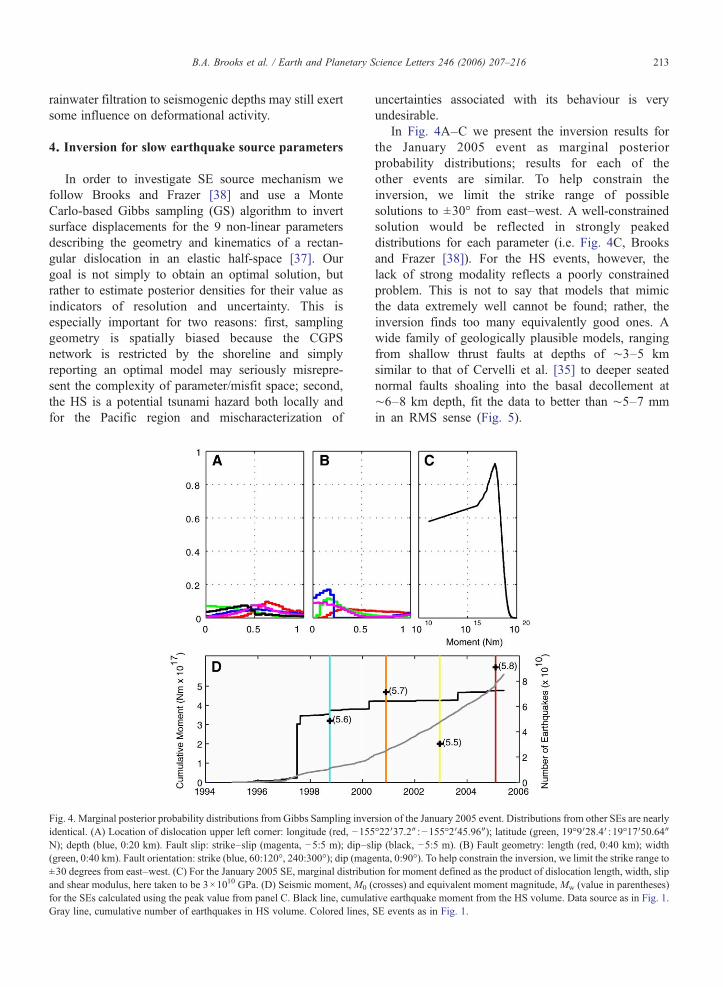
Fig. 4. Marginal posterior probability distributions from Gibbs Sampling inveidentical. (A) Location of dislocation upper left corner: longitude (red, −155N); depth (blue, 0:20 km). Fault slip: strike–slip (magenta, −5:5 m); dip–sl(green, 0:40 km). Fault orientation: strike (blue, 60:120°, 240:300°); dip (mag±30 degrees from east–west. (C) For the January 2005 SE, marginal distributand shear modulus, here taken to be 3×10¹⁰ GPa. (D) Seismic moment, M0 (for the SEs calculated using the peak value from panel C. Black line, cumulaGray line, cumulative number of earthquakes in HS volume. Colored lines,
uncertainties associated with its behaviour is veryundesirable.
In Fig. 4A–C we present the inversion results forthe January 2005 event as marginal posteriorprobability distributions; results for each of theother events are similar. To help constrain theinversion, we limit the strike range of possiblesolutions to ±30° from east–west. A well-constrainedsolution would be reflected in strongly peakeddistributions for each parameter (i.e. Fig. 4C, Brooksand Frazer [38]). For the HS events, however, thelack of strong modality reflects a poorly constrainedproblem. This is not to say that models that mimicthe data extremely well cannot be found; rather, theinversion finds too many equivalently good ones. Awide family of geologically plausible models, rangingfrom shallow thrust faults at depths of ∼3–5 kmsimilar to that of Cervelli et al. [35] to deeper seatednormal faults shoaling into the basal decollement at∼6–8 km depth, fit the data to better than ∼5–7 mmin an RMS sense (Fig. 5).
rsion of the January 2005 event. Distributions from other SEs are nearly°22′37.2″ :−155°2′45.96″); latitude (green, 19°9′28.4′ : 19°17′50.64″ip (black, −5:5 m). (B) Fault geometry: length (red, 0:40 km); widthenta, 0:90°). To help constrain the inversion, we limit the strike range toion for moment defined as the product of dislocation length, width, slipcrosses) and equivalent moment magnitude, Mw (value in parentheses)tive earthquake moment from the HS volume. Data source as in Fig. 1.SE events as in Fig. 1.

Fig. 5. Cross-section of Kīlauea's south flank along dashed line in Fig.1 after Got and Okubo [24]. K, Kīlauea. HP, Hilina Pali; HS, Hilinaslump. Black line below K is the seismic (solid) and aseismic (dashed)position of the decollement from Got and Okubo [24]. Two thickerblack lines with grey shaded area, family of geologically plausibledislocation solutions equivalently supported by inversion of GPS data.Colored circles indicate locations of microearthquakes from ±5 daysaround each slow earthquake event. Earthquakes are from the samesource as Fig. 1. Coloring as in Fig. 1 (cyan, 20 Sept., 1998; orange, 9Nov. 2000; yellow, 16 Dec. 2002; red, 26 Jan. 2005).
214 B.A. Brooks et al. / Earth and Planetary Science Letters 246 (2006) 207–216
These different solutions have distinctly differentimplications for how strain is accommodated in the HS.Given that much of the inferred fault plane is offshore,that the GPS network geometry is seriously suboptimalfor imaging deformation offshore, and the possibility ofmodel specification errors (i.e. incomplete knowledge ofSE physics), model preference cannot be assigned basedon such small misfit differences.
Although not all SE source kinematics are well-constrained by the existing data, seismic moment, M0
(defined as the product of shear modulus, slipmagnitude, and slip area) can be constrained adequatelyfor the January 2005 event (Fig. 4C). Using this as areference we calculate M0 (and equivalent momentmagnitude, Mw) released in the other SEs (Fig. 4D).Consider two slow earthquake events, event j and eventk, sharing the same focal mechanism. The seismicmoment,M, of each event will be related to the observedsurface displacements by:
M 2j ¼ c
XNs
idijd dij ð1Þ
where dij·dij represents the inner product of the surfacedisplacements for the ith station during the jth (or kth)event; Ns is the number of stations (the same for eachevent); and c is a constant which is also the same foreach event. The relationship between moments for eachevent is thus given by the ratio:
M 2j
M 2k
¼PNs
i dijd dijPNsi dikd dik
ð2Þ
where the constant c has been cancelled. If a value forMk is determined independently we can use (2) tocalculate Mj. If no independent estimate for Mk isavailable, then Mj is a relative measure of moment.
Mw values for the September 1998, November 2000,December 2002 and January 2005 events are 5.6, 5.7,5.5, and 5.8, respectively (Fig. 4D). Our Mw∼5.7estimate for the November 2000 event is identical to theindependent estimate of Cervelli et al. [35].
5. Relationship with seismicity
Microseismicity in the HS region is highly complexdue to the various volcanic and gravitationally driventectonic phenomena occurring in such close proximity[24]. Although none of the SEs are accompanied byconventional earthquakes greater than M 3.5, dailycounts of microearthquakes show spikes at the times ofthe SEs, especially the January 2005 event (Fig. 2C).However, many spikes of activity are not associatedwith SEs. Although the mean value of the SE moments(3.97×10¹⁷ N m) is roughly equivalent to thecumulative earthquake moment release over the sametime period (4.77×10¹⁷ N m), it does not appear thatthere is any obvious relationship between SE magni-tude and earthquake seismicity in the entire HS volume(Fig. 4D). In early 2000, there was an earthquake rateincrease that corresponds roughly with a moment rateincrease, but these changes are not correlative with anySE signal.
The SEs, however, do appear to trigger a set ofmicroearthquakes that occur in a confined ∼NW–SEtrending band terminating at the Hilina Pali (Fig. 1C–F).Plots of cumulative number for 80 days around eachevent demonstrate that the SEs are followed by a jumpin seismicity in a region around the band (Fig. 6, box inFig. 1B). In Fig. 5 we show a cross-section placing theHVO catalog locations (http://www.ncedc.org/) of theseevents in the context of the general structure of the HSand the family of good-fitting dislocation solutions forthe SEs. The triggered earthquakes generally occurbetween ∼5 and 10 km and with a N–S position belowthe Hilina Pali. Moreover, based on waveform cross-correlation relocation of thousands of Kīlauea eventsbetween 1988 and 1999, Got and Okubo [24]demonstrated that the same band of microearthquakes(Fig. 1B) occurs on a steeply south-dipping, subdecolle-ment reverse fault plane (Fig. 5). Thus, it appears likelythat the SEs regularly trigger seismicity near thedecollement and that the triggered seismicity mayoccur on a well-defined fault plane. In order to verifythis, future work will entail performing waveform cross-

Fig. 6. Cumulative earthquake count from within the region defined bythe yellow box in Fig. 1B for each slow earthquake. Data are from±20 days of the onset of the event (grey dashed line).
215B.A. Brooks et al. / Earth and Planetary Science Letters 246 (2006) 207–216
correlation relocations for the entire catalog spanning allof the SE event times. If the events do, indeed, collapseto a well-defined plane then we will use this informationto define the orientation of a ‘receiver’ fault in Coulombstress change calculations that can be combined with thegeodetic data in a joint inversion scheme. At the presenttime, however, the most we can say is that the cataloglocations of the triggered events appear to favour thedeeper dislocation solutions for the SEs.
6. Discussion
The detection of repeated, apparently periodic SEs atthe HS means that the range of mechanical conditionspermitting periodic SEs is likely not limited to thehigher pressures and temperatures of subduction zones.Because the inversion results do not permit adequateresolution of SE source location and mechanism,however, we can at this time place only broadconstraints on a possible mechanism for the SEs. Onepossibility is that overpressurized confined aquifersbeing recharged by surface water systems such as thosefound at ∼3 km depth in the Hawaiʻi Scientific DrillingProject II borehole [39] could facilitate SE slip. Thisscenario presents a possible explanation for periodicity:the SE slip could rupture the confined aquifer andpartially drain it. If the aquifer recharged at a constantrate, periodic slip could be facilitated each time somecritical pressure threshold is exceeded.
SEs that occur in subduction zones are alsoassociated with the newly identified phenomenon ofseismic tremor [7,40]. Clearly it will be important todetermine if tremor or a similar phenomenon accom-
panies the SEs in the HS. Even including the HS SEs,there is a very small number of natural examples ofhighly periodic fault slip behavior. Of these, theParkfield, CA periodic behavior appears to have brokendown with time [41] while Cascadia periodicity haspersisted. Further measurements will be needed at theHS to document whether our observation of SEperiodicity will hold true for future behavior. Addition-ally, in order to better constrain the geometry of the faulton which a future SE may occur, we will needconcurrent deformation measurements on the submarineextension of the HS. The emerging field of seafloorgeodesy [42,43] is the obvious approach, although themeasurements we need must be made on a continuousbasis.
Acknowledgements
We thank the Hawaiian Volcano Observatory (HVO-USGS), especially Asta Miklius, and Paul Segall ofStanford University for interchange of GPS data, and theNational Park Service for their support in establishingour GPS network. Earthquake hypocenters were pro-vided by the Northern California Earthquake DataCenter (NCEDC) and HVOUSGS. Rainfall data wasprovided by the National Park Service. Special thanks toFran Coloma and Ricky Herd for maintaining the GPSstations through the years, to David Okita for providinginvaluable helicopter support, and to Paul Okubo, Jean-Luc Got, Juli Morgan, and Tomas Zapata for stimulatingdiscussion. This work was supported by the Geophysicsand Geochemistry programs of the US National ScienceFoundation. SOEST contribution # 6768.
References
[1] A.T. Linde, M.T. Gladwin, M.J.S. Johnston, R.L. Gwyther, R.G.Bilham, A slow earthquake sequence on the San Andreas Fault,Nature (Lond.) 383 (6595) (1996) 65–68.
[2] I.S. Sacks, S. Suyehiro, A.T. Linde, J.A. Snoke, Slow earth-quakes and stress redistribution, Nature 275 (1978) 599–602.
[3] A.T. Linde, K. Suyehiro, S. Miura, I.S. Sacks, A. Takagi,Episodic aseismic earthquake precursors, Nature 334 (1988)513–515.
[4] K. Heki, S.-I. Miyazaki, H. Tsuji, Silent fault slip following aninterplate thrust earthquake at the Japan Trench, Nature 386(6625) (1997) 595–598.
[5] H. Dragert, K. Wang, T.S. James, A silent slip event on the deeperCascadia subduction interface, Science 292 (2001) 1525–1528.
[6] M.M. Miller, T.I. Melbourne, D.J. Johnson, W.Q. Sumner,Periodic slow earthquakes from the Cascadia Subduction Zone,Science 295 (2002) 2423.
[7] G. Rogers, H. Dragert, Episodic Tremor and slip on the CascadiaSubduction Zone: the chatter of silent slip, Science 300 (2003)1942–1943.

216 B.A. Brooks et al. / Earth and Planetary Science Letters 246 (2006) 207–216
[8] P. Cervelli, P. Segall, K. Johnson, M. Lisowski, A. Miklius,Sudden aseismic fault slip on the south flank of Kilauea volcano,Nature 415 (6875) (2002) 1014–1018.
[9] J. Freymueller, C. Zweck, H. Fletcher, S. Hreinsdottir, S.C.Cohen, M. Wyss, The great Alaska ‘earthquake’ of 1998–2001,EOS, Trans.-Am. Geophys. Union, vol. 82, 2001.
[10] V. Kostoglodov, S.K. Singh, A. Santiago, S.I. Franco, K.M.Larson, A.R. Lowry, R. Bilham, A large silent earthquake in theGuerrero seismic gap, Mexico, Geophys. Res. Lett. 30 (15)(2003) 1807, doi:10.1029/2003GL017219.
[11] K.M. Larson, A.R. Lowry, V. Kostoglodov, Crustal deformationmeasurements in Guerrero, Mexico, J. Geophys. Res. 92 (2004)12,751–12,762.
[12] A.R. Lowry, K.M. Larson, V. Kostoglodov, R. Bilham, Transientfault slip in Guerrero, southern Mexico, Geophys. Res. Lett. 28(2001) 3753–3756.
[13] K. Aki, M. Fehler, S. Das, Source mechanism of volcanictremors: fluid driven crack models and their application to the1963 Kilauea eruption, J. Volcanol. Geotherm. Res. (1977)259–287.
[14] B. Julian, Seismological detection of slab metamorphism,Science 296 (2002) 1625–1626.
[15] H. Kao, S.-J. Shan, H. Dragert, G. Rogers, J.F. Cassidy, K.Ramachandran, A wide depth distribution of seismic tremorsalong the northern Cascadia margin, Nature 436 (2005) 841–844.
[16] S. Peacock, K. Wang, Seismic consequences of warm versus coolsubduction metamorphism: examples from southwest andnortheast Japan, Science 286 (1999) 937–939.
[17] S. Owen, et al., Rapid deformation of the south flank of Kilaueavolcano, Hawaii, Science 267 (5202) (1995) 1328–1332.
[18] S. Owen, P. Segall, M. Lisowski, A. Miklius, R. Denlinger, M.Sako, Rapid deformation of Kilauea volcano: global positioningsystem measurements between 1990 and 1996, J. Geophys. Res.105 (B8) (2000) 18,983–18,998.
[19] R.P. Denlinger, P. Okubo, Structure of the mobile south flank ofKilauea volcano, Hawaii, J. Geophys. Res. 100 (1995)24,499–24,507.
[20] J.R. Smith, A. Malahoff, A.N. Shor, Submarine geology of theHilina slump and morpho-structural evolution of Kilaueavolcano, Hawaii, J. Volcanol. Geotherm. Res. 94 (1999) 59–88.
[21] J.K. Morgan, G.F. Moore, D.A. Clague, Slope failure andvolcanic spreading along the submarine south flank of Kilaueavolcano, Hawaii, J. Geophys. Res. 108 (B9) (2003) 2415,doi:10.1029/2003JB002411.
[22] J.G. Moore, W.R. Normark, R.T. Holcomb, Giant Hawaiianunderwater landslides, Science 264 (5155) (1994) 46–47.
[23] S.N. Ward, Slip-sliding away, Nature 415 (2002) 973–974.[24] J.-L. Got, P.G. Okubo, New insights into Kilauea's volcano
dynamics brought by large-scale relative relocation of micro-earthquakes, J. Geophys. Res. 108 (B7) (2003), doi:10.1029/2002JB002060,2003.
[25] M. Ando, The Hawaii earthquake of November 29, 1975: low dipangle faulting due to forceful injection of magma, J. Geophys.Res. 94 (1979) 7616–7626.
[26] M. Wyss, A proposed source model for the Great Kau, Hawaii,earthquake of 1868, Bull. Seismol. Soc. Am. 78 (1988)1450–1462.
[27] M. Nettles, G. Ekstrom, Long-period source characteristics of the1975 Kalapana, Hawaii, earthquake, Bull. Seismol. Soc. Am. 94(2004) 422–429.
[28] D.A. Swanson, W.A. Duffield, R.S. Fiske, Displacement of thesouth flank of Kilauea volcano: the result of forceful intrusion ofmagma into the rift zones, USGS Professional Paper, vol. 963,1974.
[29] P.G. Okubo, H.M. Benz, B.A. Chouet, Imaging the crustalmagma sources beneath Mauna Loa and Kilauea volcanoes,Hawaii, Geology 25 (20) (1997) 867–870.
[30] E.C. Cannon, R. Bürgmann, S.E. Owen, Shallow normal faultingand block rotation associated with the 1975 Kalapana earth-quake, Kilauea volcano, Hawaii, Bull. Seismol. Soc. Am. 91 (6)(2001) 1553–1562.
[31] J.K. Morgan, G.F. Moore, D.J. Hills, S. Leslie, Overthrusting andsediment accretion along Kilauea's mobile south flank, Hawaii:evidence for volcanic spreading from marine seismic reflectiondata, Geology 28 (7) (2000) 667–670.
[32] R. King, Y. Bock, Documentation for the GAMIT GPS AnalysisSoftware 2000, MIT and Scripps Inst. of Oceanogr., Cambridge,MA, 2000.
[33] D.J.I. Caccamise, M.A. Merrifield, M. Beivs, J. Foster, Y. Firing,M.S. Schenewerk, F.W. Taylor, D.T. Thomas, Sea level rise atHonolulu and Hilo, Hawaii: GPS estimates of differential landmotion, Geophys. Res. Lett. 32 (2005).
[34] K. Heki, Seasonal modulation of interseismic strain buildup inNortheastern Japan driven by snow loads, Science 293 (89–92)(2001).
[35] P. Cervelli, C. Meertens, S. Owen, A. Miklius, M. Lisowski, P.Segall, F. Amelung, H. Garbeil, The 12 September 1999 UpperEast Rift Zone dike intrusion at Kilauea volcano, Hawaii,J. Geophys. Res. B: Solid Earth 107 (7) (2002) 3-1–3-13.
[36] J. Dieterich, V. Cayol, P.G. Okubo, The use of earthquake ratechanges as a stress meter at Kilauea volcano, Nature 408 (2000)457–460.
[37] Y. Okada, Surface deformation due to shear and tensile faults in ahalfspace, Bull. Seismol. Soc. Am. 75 (1985) 1135–1154.
[38] B. Brooks, L.N. Frazer, Importance reweighting reducesdependence on temperature in Gibbs samplers: an applicationto the coseismic geodetic inverse problem, Geophys. J. Int. 161(1) (2005) 12–21.
[39] D.T. Thomas, Stratigraphy and hydrologic conditions in theHSDP II Borehole: implications for ocean island stability,Eos Trans. AGU, 86 (52), 2005, Fall Meet. Suppl.AbstractV21B-0606.
[40] K. Obara, Nonvolcanic deep tremor associated with subductionin southwest Japan, Science 296 (2002) 1679–1681.
[41] J. Murray, P. Segall, Testing time-predictable earthquakerecurrence by direct measurement of strain accumulation andrelease, Nature 419 (2002) 287–291.
[42] K. Gagnon, C.D. Chadwell, E. Norabuena, Measuring the onsetof locking in the Peru–Chile trench with GPS and acousticmeasurements, Nature 434 (2005) 205–208.
[43] A. Sweeney, C.D. Chadwell, J.A. Hildebrand, F.N. Spiess,Centimeter-level positioning of seafloor acoustic transpondersfrom a deeply-towed interrogator, Mar. Geol. 28 (2005) 39–70,doi:10.1080/01490410590884502.