period formulas for concrete shear wall buildings(18)
DESCRIPTION
for Concrete Shear Wall Buildings(18)TRANSCRIPT

PERIOD FORMULAS FOR CONCRETE SHEAR WALL BUILDINGS
By Rakesh K. Goel,l and Anil K. Chopra 2
ABSTRACT: Most seismic codes specify empirical fonnulas to estimate the fundamental vibration period of buildings. Evaluated first in this paper are the fonnulas specified in present U.S. codes using the available data on the fundamental period of buildings "measured" from their motions recorded during eight California e~quakes, starting with the 1971 San Fernando earthquake and ending w.ith the 1994 Northridge earth~u~e. It 1S shown that current code fonnulas for estimating the fundamental penod of concrete shear wall bUi1dmgs are grossly inadequate. Subsequently, an improved fonnula is developed by calibr~ting a the.oretical fonnula, deriv~
using Dunkerley's method, against the measured period data through regress10n analys1s. A]so recommended IS a factor to limit the period calculated by a "rational" analysis. such as Rayleigh's method.
INTRODUCTION
The fundamental vibration period of a building appears in the equation specified in building codes to calculate the design base shear and lateral forces. Because this building property cannot be computed for a structure that is yet to be designed, building codes provide empirical formulas that depend on the building material [steel, reinforced concrete (Re), etc.), building type (frame. shear wall. etc.). and overall dimensions.
The empirical period formulas for concrete shear-wall (SW) buildings in the 1997 UBC ("Uniform" 1997) and the 1996 SEAOC blue book ("Recommended" 1996) were derived by modifying the ATC3-06 formulas ("Tentative" 1978) during development of the 1988 SEAOC blue book to more accurately reflect the configuration and material properties of these systems ("Recommended" 1988, Appendix 1E2b(1)-T). The period formulas in ATC3-06 ("Tentative" ]978) are based largely on motions of buildings recorded during the 1971 San Fernando earthquake. However, motions of many more buildings recorded during recent earthquakes. including the 1989 Loma Prieta and 1994 Northridge earthquakes, are now available. These recorded motions provide an opportunity to expand greatly the existing database on the fundamenta.1 vi~ration periods of buildings. To this end. the natural vlbr~tlon
periods of 21 buildings have been measured by system Identification methods applied to the motions of buildings recorded during the 1994 Northridge earthquake (Goel and Chopra 1997a). These data have been combined with similar data from the motions of buildings recorded during the 1971 San Fernando, 1984 Morgan Hill, 1986 Mt. Lewis and Palm Sprin~.
1987 Whittier, 1989 Loma Prieta, 1990 Upland, and 1991 S1erra Madre earthquakes.
The objective of this paper is to develop improved empirical formulas to estimate the fundamental vibration period of concrete SW buildings for use in equivalent lateral force analysis specified in building codes. Presented first is the expanded database for "measured" values of fundamental periods of SW buildings, against which the code formulas in present U.S. codes are evaluated; similar work on limited data sets has appeared previously (e.g., Arias and Husid 1962; Housner and Brady 1963; Cole et al. 1992; Li and Mau 1997). It is shown that current code formulas for estimating the fundamental period of concrete SW buildings are grossly inadequate. Subse-
I Asst Prof., Dept of Civ. and Envir. Engrg., California Polytechnic Stale Univ., San Luis Obispo, CA 93407.
2Johnson Prof., Dept. of Civ. Engrg., Univ. of California, Berkeley, CA 94720.
quently. an improved formula is developed by calibrating a theoretical formula, derived using Dunkerley's method, against the measured period data through regression analysis. Finally. a factor to limit the period calculated by a "rational" analysis. such as Rayleigh's method, is recommended.
PERIOD DATABASE
The data that are most useful. but hard to come by. are from structures shaken strongly but not deformed into the inelastic range. Such data are slow to accumulate because relatively few structures are installed with permanent accelerographs, and earthquakes causing strong motions of these instrumented buildings are infrequent. Thus, it is very important to investigate comprehensively the recorded motions when they do become available, such as during the 1994 Northridge earthquake. Unfortunately, this obviously important goal is not always accomplished, as indicated by the fact that the vibration properties of only a few of the buildings whose motions were recorded during post-1971 earthquakes have been determined.
u
Available data on the fundamental vibration period of buildings measured from their motions recorded during several California earthquakes have been collected (Goel and Chopra 1997a). This database contains data for 106 buildings, including 21 buildings that experienced peak ground acceleration.
go ~ 0.15g during the 1994 Northridge earthquake. The remaining data come from motions of buildings recorded during the 1971 San Fernando earthquake and subsequent earthquakes (Hart et al. 1975; Hart and Vasudevan 1975; MacVerry 1979; Cole et al. 1992; Werner 1992; Gates et al. 1994; Marshall et al. 1994; Gael and Chopra 1996, 1997a).
Shown in Table 1 is the subset of this database pertaining to 16 concrete SW buildings (27 data points); buildings subjected to peak ground acceleration. u ~ 0.15g are identified go
with an asterisk (*). "C" and "N" denote buildings instrumented by the California Strong Motion Instrumentation Program (CSMIP) and National Oceanic and Atmospheric Administration (NOAA) and "ATC" denotes one of the buildings included in the ATC3-06 report ("Tentative" 1978) for which the height and base dimensions were available from other sources, but these dimensions for other buildings could not be discerned from the plot presented in the ATC3-06 report. The number of data points exceeds the number of buildings, because the period of some buildings was determined from their motions recorded during more than one earthquake or was reported by more than one investigator for the same earthquake.
CODE FORMULAS
The empirical formula for the fundamental vibration ~er~od of concrete SW buildings specified in current U.S. bUlldmg codes NEHRP-94 ("NEHRP" 1994) SEAOC-96 ("Recom

TABLE 1. Period Data for Concrete SW Buildings
Peak Ground Acceleration Period T
Number (g) (sec)
Building ID of Height Longi- Trans- Longi- Trans- Width Length number Location number stories (ft) Earthquake tudinal verse tudinal verse (ft) (ft)
(1 ) (2) (3) (4) (5) (6) (7) (8) (9) (10) (11 ) (12)
1 Belmont C58262 2 28.0 Lorna Prieta 0.10 0.11 0.13 0.20 NA NA 2* Burbank C24385 10 88.0 Northridge 0.26 0.30 0.60 0.56 75.0 215.0 3* Burbank C24385 10 88.0 Whittier 0.22 0.26 0.57 0.51 75.0 215.0 4 Hayward C58488 4 50.0 Lorna Prieta 0.05 0.04 0.15 0.22 NA NA 5 Long Beach C14311 5 71.0 Whittier 0.10 0.10 0.17 0.34 81.0 205.0 6 Los Angeles ATC 3 12 159.0 San Fernando NA NA 1.15 MRF 60.0 161.0 7* Los Angeles C24468 8 127.0 Northridge 0.16 0.11 1.54 1.62 63.0 154.0 8* Los Angeles C24601 17 149.7 Northridge 0.26 0.19 1.18 1.05 80.0 227.0 9 Los Angeles C24601 17 149.7 Sierra Madre 0.07 0.06 1.00 1.00 80.0 227.0
10* Los Angeles N253-5 12 161.5 San Fernando 0.26 0.19 1.19 1.14 76.0 156.0 11* Los Angeles N253-5 12 161.5 San Fernando 0.26 0.19 1.07 1.13 76.0 156.0 12 Palm Desert C12284 4 50.2 Palm Spring 0.07 0.12 0.50 0.60 60.0 180.0 13 Pasadena N264-5 10 142.0 Lytle Creek 0.02 0.02 0.71 0.52 69.0 75.0 14* Pasadena N264-5 10 142.0 San Fernando 0.18 0.22 0.98 0.62 69.0 75.0 15* Pasadena N264-5 10 142.0 San Fernando 0.18 0.22 0.97 0.62 69.0 75.0 16 Piedmont C58334 3 36.0 Lorna Prieta 0.08 0.07 0.18 0.18 NA NA 17 Pleasant Hill C58348 3 40.6 Lorna Prieta 0.08 0.13 0.38 0.46 77.0 131.0 18 San Bruno C58394 9 104.0 Lorna Prieta 0.11 0.13 1.20 1.30 84.0 192.0 19 San Bruno C58394 9 104.0 Lorna Prieta 0.11 0.13 1.00 1.45 84.0 192.0 20 San Jose C57355 10 124.0 Lorna Prieta 0.09 0.11 MRF 0.75 82.0 190.0 21 San Jose C57355 10 124.0 Morgan Hill 0.06 0.06 MRF 0.61 82.0 190.0 22 San Jose C57355 10 124.0 Mount Lewis 0.03 0.03 MRF 0.61 82.0 190.0 23 San Jose C57356 10 96.0 Lorna Prieta 0.10 0.13 0.73 0.43 64.0 210.0 24 San Jose C57356 10 96.0 Lorna Prieta 0.10 0.13 0.70 0.42 64.0 210.0 25 San Jose C57356 10 96.0 Morgan Hill 0.06 0.06 0.65 0.43 64.0 210.0 26 San Jose C57356 10 96.0 Mount Lewis 0.04 0.04 0.63 0.41 64.0 210.0 27* Watsonville C47459 4 66.3 Lorna Prieta 0.39 0.28 0.24 0.35 71.0 75.0
Note: *Denotes building with ago ~ 0.15g; NA indicates data not available; MRF implies moment-resisting frames form the lateral load resisting system; number followed by "C" or "N" indicates the station number and by "ATC" indicates the building number in ATC3-06 report ("Tentative" 1978).
mended" 1996), and UBC-97 ("Uniform" 1997) is of the form
T= C,H 3/4 (1)
where H = the height of the building in feet above the base; and the numerical coefficient C, = 0.02. UBC-97 and SEAOC96 permit an alternative value for C, to be calculated from
C, =0.l/vA:: (2)
where A c , the combined effective area (in square feet) of the shear walls, is defined as
NW
Ac =2: Ai[0.2 + (D,/H)2]; Di/H:S 0.9 (3) i-I
in which Ai = the horizontal cross-sectional area (in square feet); D{ = the dimension in the direction under consideration (in feet) of the ith SW in the first story of the structure; and NW = the total number of shear walls. The value of DJH in (3) should not exceed 0.9.
ATC3-06 ("Tentative" 1978) and earlier versions of other U.S. codes specify a different formula
T= 0.05H (4)Vi5
where D = the dimension, in feet, of the building at its base in the direction under consideration.
UBC-97 and SEAOC-96 codes specify that the design base shear should be calculated from
v=cw (5)
in which W =the total seismic dead load; and C =the seismic coefficient defined as
Cv I 2.5CaC =- -; O.llCal:S C:S --I;RT R
0.8ZNJand for seismic zone 4 C~--
R (6)
in which coefficients Cv and Ca depend on the near-source factors, Nv and Na , respectively, along with the soil profile and the seismic zone factor Z; I = the importance factor; and R = the numerical coefficient representative of the inherent overstrength and global ductility capacity of the lateral-load resisting system. The upper limit of 2.5 Cal -:- R on C applies to very short period buildings, whereas the lower limit of O.llCal (or 0.8ZNJ -:- R for seismic zone 4) applies to very long period buildings. These limits imply that C becomes independent of the period for very short or very tall buildings. The upper limit existed, although in slightly different form, in previous versions of UBC and SEAOC blue book; however, the lower limit appeared only recently in UBC-97 and SEAOC-96.
The fundamental period T, calculated using the empirical formula (1) or (4), should be smaller than the "true" period to obtain a conservative estimate for the base shear. Therefore, code formulas are intentionally calibrated to underestimate the period by about 10-20% at first yield of the building ("Tentative" 1978; "Recommended" 1988).
The codes permit calculation of the period by established methods of mechanics (referred to as rational analyses in this paper), such as Rayleigh's method or computer-based eigenvalue analysis, but specify that the resulting value should not
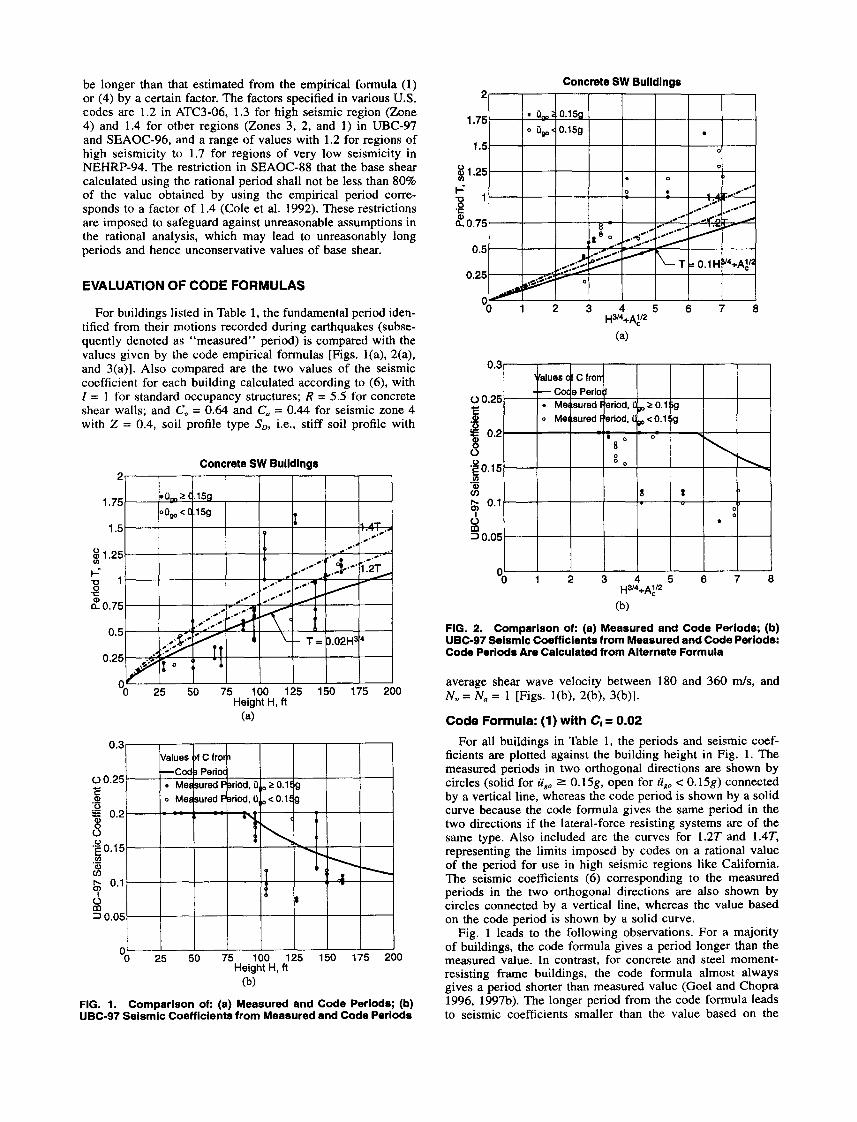
be longer than that estimated from the empirical formula (I) or (4) by a certain factor. The factors specified in various U.S. codes are 1.2 in ATC3-06, 1.3 for high seismic region (Zone 4) and 1.4 for other regions (Zones 3, 2, and I) in UBC-97 and SEAOC-96, and a range of values with 1.2 for regions of high seismicity to 1.7 for regions of very low seismicity in NEHRP-94. The restriction in SEAOC-88 that the base shear calculated using the rational period shall not be less than 80% of the value obtained by using the empirical period corresponds to a factor of 104 (Cole et al. 1992). These restrictions are imposed to safeguard against unreasonable assumptions in the rational analysis, which may lead to unreasonably long periods and hence unconservative values of base shear.
EVALUATION OF CODE FORMULAS
For buildings listed in Table I, the fundamental period identified from their motions recorded during earthquakes (subsequently denoted as "measured" period) is compared with the values given by the code empirical formulas [Figs. I(a), 2(a), and 3(a)]. Also compared are the two values of the seismic coefficient for each building calculated according to (6), with 1= 1 for standard occupancy structures; R = 5.5 for concrete shear walls; and Cv = 0.64 and Co = 0.44 for seismic zone 4 with Z = 004, soil profile type Sv, i.e., stiff soil profile with
Concrete SW Buildings
75 100 125 150 175 200 Height H, ft
(a)
.o_~( .150
oOgo < C.159 I ..,.
~.,
.~ ...... ",.
~.
.,. ..... .".,.... ........:}.-. 1.2~.~
"" .. ' ;..--.. ' .....,..,. ,.,.". .... ~
,;.:::31~ ...~.-~T ~ \... T= O.02H~4
.,;,~..
VI 0 '10.25
0.5
2
lil1.25 1Il
r: :g ~0.75
1.75
1.5
25 50
0.3 ~alues I C Iro ~
>--Cod~ Perio(UO.25 • MeE sured F~rlod, 0 10 ~ 0.1 9'E <Il o<O.Hgo MeEIsured F~rlod, 0'0 !E 02<3 . 1"-.·~0.15 ......... 1Il
'Q) l--. (/') r---Ii -' ~ 0.1 :1 •lD ::l 0.05
25 50 75 100 125 150 175 200 Height H, ft
(b)
FIG. 1. Comparison of: (a) Measured and Code Periods; (b) UBC-97 Seismic Coefficients from Measured and Code Periods
Concrete SW Buildings 2
1.75
1.5
lil1.25 1Il
r: :g ~0.75
0.5
0.25
• Q~ 0.150
o Ogo ( 0.159 • 0
0 . 0
....>..-::......~
0 . ......... ........
•<111""
......~
.,.............
--B • 8 0
."., ""~ ......
.....::::~ iJ"'"
~ :- ~T =0.1H 1I4+A~/~
~ ~:\~.
..... 0
2 6 7 8
0.3
UO.25 'E <Il '0 ~ 0.2
U
·~0.15 1Il
jJ G; 0.1
~ ::l 0.05
Blues ( C Iron
I-- COl a Parlo arlod, ('
arlod, (
• Me
o Ma sured
sured go ~ 0.1 go< 0.1
pg 9
• 0
8 0 o 0
0
"-. r-....... 8 I
0
• 0
2 6 7 8
FIG. 2. Comparison of: (a) Measured and Code Periods; (b) UBC·97 Seismic Coefficients from Measured and Code Periods: Code Periods Are Calculated from Alternate Formula
average shear wave velocity between 180 and 360 mis, and Nv = No = I [Figs. I(b), 2(b), 3(b)].
Code Formula: (1) with Cl = 0.02
For all buildings in Table I, the periods and seismic coefficients are plotted against the building height in Fig. I. The measured periods in two orthogonal directions are shown by circles (solid for ugo ~ 0.15g, open for Ugo < 0.15g) connected by a vertical line, whereas the code period is shown by a solid curve because the code formula gives the same period in the two directions if the lateral-force resisting systems are of the same type. Also included are the curves for 1.2T and IAT, representing the limits imposed by codes on a rational value of the period for use in high seismic regions like California. The seismic coefficients (6) corresponding to the measured periods in the two orthogonal directions are also shown by circles connected by a vertical line, whereas the value based on the code period is shown by a solid curve.
Fig. 1 leads to the following observations. For a majority of buildings, the code formula gives a period longer than the measured value. In contrast, for concrete and steel momentresisting frame buildings, the code formula almost always gives a period shorter than measured value (Goel and Chopra 1996, 1997b). The longer period from the code formula leads to seismic coefficients smaller than the value based on the

Concrete SW Buildings 2
• C",,~0.15g1.75
o Cgo < 0.15g • •1.5 0 1.21/" 0 " " ~ 1.25 0
• . .;'Ul
..- 0,.... ·'· ~ "8 '1::
" " ":/
~0.75 .0 . o ..~,.,•0.5 0 '-T=O 05H+D112
o "~ " 0.25 0
~ 5 10 15 20 25
H+D112 (a)
0.3 Valu s of C from
0.25 ()
-. Code Perlcd Measured erlod, ago ~ 0.15g
1:: 0 Measured erlod, ago < 0.15g
.~ 0.2 • 0 • ~ ~ 0
0 0.15 0
'E Ul
'CD en 0.1
0
v
~ ~ -0
~ ::::> ~
0 • 0.05
5 10 15 20 25 H+D112
(b)
FIG. 3. Comparison of: (a) Measured and Code Periods; (b) UBC-97 Seismic Coefficients from Measured and Code Periods: Code Periods Are Calculated from ATC3-06 Formula
measured period if the period falls outside the flat portion of the seismic coefficient spectrum; otherwise, the two periods lead to the same seismic coefficient. For most of the remaining buildings, the code formula gives a period much shorter than the measured value and a seismic coefficient much larger than the value based on the measured period. Because the code period for many buildings is longer than the measured period, the limits of 1.2T or I.4T for the period calculated from a rational analysis are obviously inappropriate.
The building height alone is not sufficient to estimate accurately the fundamental period of SW buildings because measured periods of buildings with similar heights can be very different, whereas they can be similar for buildings with very different heights. For example, in Table 1 the measured longitudinal periods of Buildings 4 and 12 of nearly equal heights differ by a factor of more than three; the heights of these buildings are 50 ft and 50.2 ft, whereas the periods are 0.15 sec and 0.50 sec, respectively. On the other hand, measured longitudinal periods of Buildings 13 and 23 are close even though Building 13 is 50% taller than Building 23; periods of these buildings are 0.71 sec and 0.73 sec, whereas the heights are 142 ft and 96 ft, respectively. The poor correlation between the building height and the measured period is also apparent from the significant scatter of the measured period data [Fig. l(a)].
Alternate Code Formula: (1) with C, from (2) and (3)
Table 2 lists a subset of nine buildings (17 data points) with their Ac values calculated from (3) using SW dimensions obtained from structural drawings; for details, see Appendix G of Goel and Chopra (1997a). These dimensions were not available for the remaining seven buildings in Table 1.
In Fig. 2 the alternate code formula for estimating the fundamental period is compared with the measured periods of the nine buildings. The code period is determined from (1)-(3) using the calculated value of A c and plotted against H 3I4 + VIC. This comparison shows that the alternate code formula almost always gives a value for the period that is much shorter than the measured periods and a value for the seismic coefficient that is much higher than from the measured periods. The measured periods of most buildings are longer than the code imposed limits of 1.2T and 1.4T on the period computed from a rational analysis. Although the code period formula gives a conservative value for the seismic coefficient, the degree of conservatism seems excessive for most buildings considered in this investigation.
ATC3-Q6 Formula
In Fig. 3, the ATC3-06 formula for estimating the fundamental period is compared with the measured periods of all buildings listed in Table I. The code period is determined from (4) using the Hand D dimensions of the building (Table 1) and plotted against H + YD. This comparison demonstrates that (4) significantly underestimates the period and considerably overestimates the seismic coefficient for many buildings and the ATC3-06 imposed limit of 1.2T is too restrictive.
The ratio H + Vl5 is not sufficient to estimate accurately the fundamental period of concrete SW buildings because measured periods of buildings with similar values of this ratio can be very different, whereas they can be similar for buildings with very different values of H + YD. For example, in Table 1 the measured transverse period of Building 18 and measured longitudinal period of building 27-two buildings with similar values of H + YD-differ by nearly a factor of five; H + YD = 7.51 and 7.87, and measured periods = 1.30 sec and 0.24 sec, respectively. On the other hand, the measured longitudinal and transverse periods of Building 9 are the same, equal to 1 sec, even though the values of H + YD in the two directions are 16.7 and 9.93. The poor correlation between the ratio H + YD and the measured periods is also apparent from a large scatter of the measured period data [Fig. 3(a)].
THEORETICAL FORMULAS
The observations in the preceding section clearly indicate that the current code formulas for estimating the fundamental period of concrete SW buildings are grossly inadequate. For this purpose, equations for the fundamental period are derived using established analytical procedures. Based on Dunkerley's method (Jacobsen and Ayre 1958, pages 119-120 and 502505; Veletsos and Yang 1977; Inman 1996, pages 442-449), the fundamental period of a cantilever, considering flexural and shear deformations, is
(7)
in which TF and Ts are the fundamental periods of pure-flexural and pure-shear cantilevers, respectively. For uniform cantilevers TF and Ts are given by (Jacobsen and Ayre 1958, pages 471-496; Timoshenko et al. 1974, pages 424-431; Chopra 1995, page 592)
T-~ ~ F - 3.516 'YEi H
2 (8)

TABLE 2 Measured Periods and Areas of Selected Concrete SW Buildings
Transverse
(9)
0.2019 0.2019 0.0416 0.1131 0.1131 0.0662 0.1579 0.0603 0.0228 0.0228 0.3309 0.3309 0.3309 0.2563 0.2563 0.2563 0.2563
Note: * Denotes bUlldmgs wIth it,. ~ 0.15 g; MRF Impltes moment-resIsting frames form the lateralload reslstmg system, number followed by
A. A. Measured Period (sq ft) (%)
Building 10 Height Longi- Trans- Long- Trans- Longinumber number (ft) tudinal verse tudinal verse tudinal
(1 ) (2) (3) (4) (5) (6) (7) (8)
1* C24385 88.0 0.60 0.56 83.5 92.1 0.1978 2* C24385 88.0 0.57 0.51 92.183.5 0.1978 3* C24468 127.0 1.54 1.62 13.8 34.2 0.0319 4* C24601 149.7 1.18 1.05 63.3 106.9 0.0765 5 C24601 149.7 1.00 1.00 63.3 106.9 0.0765
C12284 50.26 0.50 0.60 21.5 17.7 0.0646 C583347 36.0 0.18 0.18 26.2 26.2 0.1579
8 C58348 40.6 0.38 0.46 26.6 12.2 0.1346 C583949 104.0 1.20 1.30 21.5 22.2 0.0397 C5839410 104.0 1.00 1.45 21.5 22.2 0.0397
124.011 C57355 MRF 0.75 MRF 104.5 MRF 12 C57355 124.0 MRF 0.61 MRF 104.5 MRF
124.013 C57355 MRF 0.61 MRF 104.5 MRF C57356 96.014 0.73 0.43 60.7 84.5 0.2120
0.42 84.5 0.212015 C57356 96.0 0.70 60.7 16 C57356 96.0 60.7 84.5 0.21200.65 0.43 17 C57356 96.0 0.63 0.41 60.7 84.5 0.2120
indicates the station number.
Ts (9)=4 .Jf"o ~ H
In (8) and (9), m = mass per unit height; E = the modulus of elasticity; G = shear modulus; I = the section moment of inertia; A = section area; and K is the shape factor to account for nonuniform distribution of shear stresses (=5/6 for rectangular sections). Combining (7) to (9) and recognizing that G = E -: 2(1 + 11-), where the Poisson's ratio 11 = 0.2 for concrete, leads to
r;;1 T= 4 -y-;o VA. H (10)
with
(11)
where D is the plan dimension of the cantilever in the direction under consideration. Comparing (10) and (11) with (9) reveals that the fundamental period of a cantilever considering flexural and shear deformations may be computed by replacing the area A in (9) with the equivalent shear area A. given by (11).
The period T from (10) normalized by TF is plotted in Fig. 4 against the ratio H -:- D on a logarithmic scale. Also shown is the period of a pure-shear cantilever and of a pure-flexural cantilever. Eq. (10) approaches the period of a pure-shear cantilever (9) as H -:- D becomes small and the period of a pureflexural cantilever (8) for large values of H -:- D. For all practical purposes, the contribution of flexure can be neglected for SWs with H -:- D < 0.2, whereas the contribution of shear can be neglected for SWs with H -:- D > 5; the resulting error is less than 2%. However, both shear and flexural deformations should be included for shear walls with 0.2 :s; H -:- D :s; 5.
Eq. (\0), based on Dunkerley's method, provides a highly accurate value for the true fundamental period of a shear-flexural cantilever. This can be demonstrated by recognizing that the exact period is bounded by the periods obtained from Dunkerley's and Rayleigh's methods; Dunkerley's method gives a period longer than the exact value (Jacobsen and Ayre 1958, pages 113-120; Inman 1996, pages 442-449), whereas
.. "C
20
10
5
2
--
t- Dunl
- Rayl
!arley's Me
igh's Meth
~od
Pc!
'" ~ i?,.
~";l ~
~~
~ Flexural Cl ntilever
0.2 0.5 1 2 5 10 HID
FIG. 4. Fundamental Period of Cantilever Beams
Rayleigh's method provides a shorter period (Chopra 1995, page 554). Also shown in Fig. 4 is the period determined by Rayleigh's method using the deflected shape due to lateral forces varying linearly with height, considering both shear and flexural deformations; details are available in Appendix G of Goel and Chopra (1997a). The resulting period is very close to that obtained from (10), derived using Dunkerley's method; the difference between the two periods is no more than 3%. Since the exact period lies between the two approximate values, (10) errs by less than 3%.
Now consider a class of symmetric-plan buildings-symmetric in the lateral direction considered-with a lateral-force resisting system comprised of a number of uncoupled (Le., without coupling beams) SWs connected through rigid floor diaphragms. Assuming that the stiffness properties of each wall are uniform over its height, the equivalent shear area, A.. is given by a generalized version of (11) (details available in Goel and Chopra 1997a, Appendix G)
NW ( A)2 A, = (12)~ Z [1+ 08; (~:)']
where Ai' Hi' and Di are the area, height, and dimension in the

direction under consideration of the ith SW; and NW = the number of shear walls. With A. so defined, (10) is valid for a system of SWs of different height.
Eq. (10) is now expressed in a form convenient for buildings
1 T=40 --H (13)
KG vA:~ where p = average mass density, defined as the total building mass (=mH) divided by the total building volume (=AsH-As is the building plan area), i.e., p =mlAs; and A. = the equivalent shear area expressed as a percentage of As, i.e.,
_ A. A = 100- (14)
• As
Eq. (13) applies only to those buildings in which lateral load resistance is provided by uncoupled SWs. Theoretical formulas for the fundamental period of buildings with coupled SWs are available in Rutenberg (1975), and for buildings with a combination of SWs and moment-resisting frames in Heidebrecht and Stafford-Smith (1973) and Stafford-Smith and Crowe (1986). It seems that these formulas can not be simplified to the form of (13).
Sozen (1989) and Wallace and Moehle (1992) also presented a formula for the fundamental vibration period of SW buildings. Their formula was developed based on pure-flexural cantilever idealization of SW buildings and ignored the influence of shear deformations. Furthermore, the numerical constant in their formula was determined based on assumed material properties and effective member stiffness equal to one-half its initial value. In contrast, the formula developed in this paper (13) includes both flexural and shear deformations and the numerical constant is determined directly from regression analysis of measured period data as described in the following sections.
REGRESSION ANALYSIS METHOD
Although C = 40Vp/KG in (13) can be calculated from building properties, it is determined from regression analysis to account for variations in properties among various buildings and for differences between building behavior and its idealization. For this purpose, it is useful to write (13) as
_ 1 T=C--H (15)
vA: and recast it as
y = a + x (16)
in which y =10g(D; a = log(C); and x =10g(H + '\IX). The intercept a at x = 0 of the straight line in (16) was determined by minimizing the squared error between the measured and computed periods, and then C was back-calculated from the relationship a = 10g(C). The standard error of estimate is
2: [Yi - (a + Xi)]2
s~ = i=1 (17)(n - 2)
in which Yj =10g(Tj) is the observed value (with Ti =measured period) and (a + Xi) =10g(C) + 10g«H + VA:)j) is the computed value of the ith data; and n = the total number of data points. s. represents scatter in the data and approaches, for large n, the standard deviation of the measured period data from the best-fit equation.
This procedure leads to the value of CR for (15) to represent
the best-fit, in the least-squared sense, to the measured period data. However, for code applications the formula should provide a lower value of the period and this was obtained by lowering the best-fit line (16) by s. without changing its slope. Thus CL , the lower value of C, is computed from
(18)
C
Because s. approaches the standard deviation for a large number of samples and Y is lognormal, CL is the mean-minusone-standard deviation or 15.9 percentile value, implying that 15.9% of the measured periods would fall below the curve corresponding to CL (subsequently referred to as the best-fit 1<1 curve). If desired, CL corresponding to other nonexceedance probabilities may be selected. Additional details of the regression analysis method and the procedure to estimate
L are available elsewhere (Goel and Chopra 1997a, Appendix F).
As mentioned previously, codes also specify an upper limit on the period calculated by a rational analysis. This limit is established in this investigation by raising the best-fit line (16) by s. without changing its slope. Thus, Cu, the upper value of C corresponding to the upper limit, is computed from
10g(Cu) = log(CR) + s. (19)
Eq. (15) with Cu represents the best-fit + 1 <1 curve, which will be exceeded by 15.9% of the measured periods.
Regression analysis in the log-log space (16) is preferred over the direct regression on (15) because it permits convenient development of the best-fit - 1<1 and best-fit + 1<1 curves; both regression analyses give essentially identical values of CR'
RESULTS OF REGRESSION ANALYSIS
The formula for estimating the fundamental period of concrete SW buildings was obtained by calibrating the theoretical formula of (15) by regression analysis of the measured period data for the nine concrete SW buildings (17 data points) listed in Table 2. For each building, the equivalent area A. was calculated from (12) and (14) using dimensions from structural plans (Goel and Chopra 1997a, Appendix H); for SWs with dimensions varying over height, Ai and D i were taken as the values at the base. Regression analysis gives CR =0.0023 and CL = 0.0018. Using these values for C in (15) give TR and TL,
the best-fit and best-fit - 1<1 values of the period, respectively. These period values are plotted against H + VA: in Fig. 5,
together with the measured periods shown in circles; the mea-
Concrete SW BUildings 2
.0_ 0.1501.75 . V "" o Ogo 0.15g / .1.5
o .,.,.V3H+A1 2~TR = 0.00 0,·'/'~ 1.25 ,.
,/.".;. ..;.' ."
,..)/' ,...,: '8 'C / .'~0.75
l/v .' ,.,., ~ '- Tl = 0.001 H+Ak"
0.5 ,.°2.' ,.
0.25
V' 100 200 300 400 500 600 700 800
H+A~/2
FIG. 5. Results of Regression Analysis: All Buildings

Concrete SW Buildings 2 ,7,.
• a~ 0.1501.75 .'o Ogo 0.1 59 ~
•,.1.5 ,.,. 0 VN,12..~026Hu = O.
/ ~~ ~ 1.25
,,')'Ul V ,. •t-='
,. V,.~ ,.
8? 0.75 ~. ,. "" TL=O 00191-I+A~12,/ ./V
0.5 ,.,0'/Q' V
0.25
I/V.'
00 100 200 300 400 500 600 700 800 H+A ~12
FIG. 6. Results of Regression Analysis: BUildings with 0/10 ~
0.159
sured periods of a building in the two orthogonal directions are not joined by a vertical line because the ratio H + 'V"A: is different if the SW areas are not the same in the two directions. Fig. 5 permits the following observations. As expected, the measured period data falls above and below (more or less evenly) the best-fit curve. The best-fit equation correlates with measured periods much better (error of estimate Se = 0.143) than formulas (1-3) in UBC-97 (se = 0.546). It is apparent that the form of (15) includes many of the important parameters that influence the fundamental period of concrete SW buildings.
In passing, observe that the value of CR =0.0023 for concrete buildings with E = 3.1 X 10⁶ psi (21.4 X 10³ MPa) and J.L = 0.2 corresponds to p "'" 0.47 Ib-sec2/ft4 = 240 kg/m3 or unit weight = 15 pcf, implying approximately 10% solids and 90% voids in the building, which seem reasonable for many buildings.
The values of C determined from all available data should be modified to recognize that the period of a concrete building lengthens at moderate-to-high levels of ground shaking. Regression analysis of the data from buildings experiencing peak ground acceleration iigo 2: 0.15g (denoted with * in Table 2) gives
1 TI. = 0.0019 • IT H (20)
vA,
1 Tv =0.0026 • IT H (21)
vA,
Eqs. (20) and (21) are plotted in Fig. 6 with the measured period data. As expected, very few data fall above the curve for Tv or below the curve for TL , indicating that (20) is suitable for estimating, conservatively, the fundamental periods and (21) for limiting the period computed from rational analysis. Thus, the period from rational analysis should not be longer than 1.4TL ; the factor is determined as the ratio 0.0026 + 0.0019, rounded-off to one digit after the decimal point.
In Eq. (12) to calculate Ae for nonuniform SWs, A; and D; should be defined as the area and the dimension in the direction under consideration, respectively, at the base of the wall. To provide support for this recommendation, consider the building identified as C57356 in Table 2. The thickness of the shear walls in this 10-story building is 11 in. (30 cm) in the first story, 9 in. (23 cm) in second to fourth stories, 8 in. (20 cm) in fifth to eighth stories, and 7 in. (18 cm) in ninth and tenth stories. Calculating A, by using D; = 11 in. (at the base),
8 in. (at mid-height), and 7 in. (at the roof), and substituting in (20) gives period values 0.36 sec, 0.42 sec, and 0.45 sec, respectively. Although the mid-height value of D; gives the period value close to the measured period (0.41-0.43 sec, by different investigators), the base value of D; provides a shorter period, leading to a conservative value of base shear. This recommendation is consistent with the current codes ("Recommended" 1996; "Uniform" 1997).
CONCLUSIONS AND RECOMMENDATIONS
Based on the analysis of the available data for the fundamental vibration period of nine concrete SW buildings (17 data points), measured from their motions recorded during earthquakes, (20), with A, calculated from (12) and (14) using wall dimensions at the base, is recommended for conservatively estimating the fundamental period of concrete SW buildings. This formula provides the "best" fit of (15) to the available data; the fit is better than possible from formulas (1-3) in current U.S. codes. Furthermore, the period from rational analysis should not be allowed to exceed the value from the recommended equation by a factor larger than 1.4. Because these recommendations are developed based on data from buildings in California, they should be applied with discretion to buildings in less seismic regions of the United States or other parts of the world where building design practice is significantly different than in California.
Regression analyses that led to the recommended formulas should be repeated periodically on larger data sets. The database can be expanded by including buildings, other than those in Tables 1 and 2, whose motions recorded during past earthquakes have, so far, not been analyzed. Period data should also be developed for additional buildings when records of their motions during future earthquakes become available.
ACKNOWLEDGMENTS This research investigation is supported by the National Science Foun
dation under Grant CMS-9416265. The writers are grateful for this support. The writers also acknowledge the assistance provided by Anthony Shakal, Moh Huang, Bob Darragh, Gustavo Maldonado, and Praveen Malhotra of the California Strong Motion Instrumentation Program in obtaining recorded motions and structural plans and by Profs. S. T. Mau and J. L. Beck, and Dr. M. Celebi in implementing the system identification procedures. The valuable comments of the anonymous reviewers of the paper are also acknowledged.
APPEND~. REFERENCES Arias, A., and Husid, R. (1962). "Empirical formula for the computation
of natural periods of reinforced concrete buildings with shear walls." Reinsta del IDIEM, 39(3).
Chopra, A. K. (1995). Dynamics of structures: theory and applications to earthquake engineering. Prentice-Hall, Englewood Cliffs, N.J.
Cole, E. E., Tokas, C. V., and Meehan, J. F. (1992). "Analysis of recorded building data to verify or improve 1991 uniform building code (UBC) period of vibration formulas." Proc., SMIP92, Strong Motion Instrumentation Program, Division of Mines and Geology, California Department of Conservation, Sacramento, Calif., 6-1-6-12.
Gates, W. E, Hart, G. C., Gupta, S., and Srinivasan, M. (1994). "Evaluation of overturning forces of shear wall buildings." Proc., SMIP94, Strong Motion Instrumentation Program, Division of Mines and Geology, California Department of Conservation, Sacramento, Calif., 105-120.
Gcel, R. K., and Chopra, A. K. (1996). "Evaluation of code formulas for fundamental period of buildings." CD-ROM Proc., lIth World Conj. on Earthquake Engrg., Paper No. 1127, Elsevier Science Ltd., Oxford, U.K.
Goel, R. K., and Chopra, A. K. (l997a). "Vibration properties of buildings determined from recorded earthquake motions. Rep. No. VCRI EERC-971J4. Earthquake Engineering Research Center, Richmond, Calif.
Goel, R. K., and Chopra, A. K. (I 997b). "Period formulas for momentresisting frame buildings." J. Struct. Engrg., ASCE, 123(11), 14541461.
Hart, G. C., and Vasudevan, R. (1975). "Earthquake design of buildings: damping." J. Struct. Div., ASCE, 101(1), 11-30.

Hart, G. C., DiJulio, R. M., and Lew, M. (1975). "Torsional response of high-rise buildings." J. Struct. Div., ASCE, 101(2), 397-416.
Heidebrecht, A. C., and Stafford-Smith, B. (1973). "Approximate analysis of tall wall-frame structures." J. Struct. Div., ASCE, 99(2), 199221.
Housner, G. W., and Brady, A. G. (1963). "Natural periods of vibration of buildings." J. Engrg. Mech. Div., ASCE, 89(4), 31-65.
Inman, D. J. (1996). Engineering vibrations. Prentice-Hall, Inc., Englewood Cliffs, N.J.
Jacobsen, L. S., and Ayre, R. S. (1958). Engineering vibrations. McGrawHill, Inc., New York, N.Y.
Li, Y., and Mau, S. T. (1997). "Learning from recorded earthquake motion of buildings." J. Struct. Engrg., ASCE, 123(1), 62-69.
Marshall, R. D., Phan, L. T., and Celebi, M. (1994). "Full-scale measurement of building response to ambient vibration and the Lorna Prieta earthquake." Proc., 5th U.S. Nat. Con! of Earthquake Engrg., Vo\. II, Earthquake Engrg. Res. Inst., Oakland, Calif., 661-670.
McVerry, G. H. (1979). "Frequency domain identification of structural models from earthquake records." Rep No. EERL 79-02, Earthquake Engrg. Res. Lab., California Inst. of Techno\., Pasadena, Calif.
NEHRP recommended provisions for the development of seismic regulations for new buildings. (1994). Building Seismic Safety Council, Washington, D.C.
"Recommended lateral force requirements and commentary." (1988). Seismological Committee, Structural Engineers Association of California, San Francisco, Calif.
"Recommended lateral force requirements and commentary." (1996).
Seismological Committee, Structural Engineers Association of California, San Francisco, Calif.
Rutenberg, A. (1975). "Approximate natural frequencies for coupled shear walls." J. Earthquake Engrg. and Struct. Dyn., 4(1), 95-100.
Sozen, M. A. (1989). "Earthquake response of buildings with robust walls." Proc.. 5th Chilean Con! on Seismology and Earthquake Engrg., Assn. Chilean de Sismologia e Ingenieria Antisismica, Santiago, Chile.
Stafford-Smith, B., and Crowe, E. (1986). "Estimating periods of vibration of tall buildings." J. Struct. Engrg., ASCE, 112(5), 1005-1019.
"Tentative provisions for the development of seismic regulations for buildings." (1978). ATC3-06, App\. Techno\. Council, Palo Alto, Calif.
Timoshenko, S., Young, D. H., and Weaver, W., Jr. (1974). Vibration problems in engineering. John Wiley & Sons, Inc., New York, N.Y.
"Uniform building code." (1997). International Conference of Building Officials, Whittier, Calif.
Veletsos, A. S., and Yang, J. Y. (1977). "Earthquake response of liquid storage tanks." Advances in civil engineering through engineering mechanics. Proc.• Engrg. Mech. Div. Specialty Con!, Raleigh, N.C., ASCE, New York, N.Y., 1-24.
Wallace, 1. w., and Moehle, J. P. (1992). "Ductility and detailing requirements of bearing wall buildings." J. Struct. Engrg., ASCE, 118(6), 1625-1643.
Werner, S. D., Nisar, A., and Beck, J. L. (1992). "Assessment of UBC seismic design provisions using recorded building motion from the Morgan Hill, Mount Lewis, and Lorna Prieta earthquakes." Dames and Moore, Oakland, Calif.