performing arts in anew era - rand corporation provides ... · pdf fileiv the performing arts...
TRANSCRIPT

ThePerforming Arts
in aNew Era
Supported by The Pew Charitable Trusts
R
Kevin F. McCarthy | Arthur Brooks | Julia Lowell | Laura Zakaras

The research in this report was supported by the The Pew Charitable Trusts.
RAND is a nonprofit institution that helps improve policy and decisionmakingthrough research and analysis. RAND® is a registered trademark. RAND’spublications do not necessarily reflect the opinions or policies of its researchsponsors.
© Copyright 2001 RAND
All rights reserved. No part of this book may be reproduced in any form by anyelectronic or mechanical means (including photocopying, recording, orinformation storage and retrieval) without permission in writing from RAND.
Published 2001 by RAND1700 Main Street, P.O. Box 2138, Santa Monica, CA 90407-2138
1200 South Hayes Street, Arlington, VA 22202-5050201 North Craig Street, Suite 102, Pittsburgh, PA 15213
RAND URL: http://www.rand.org/To order RAND documents or to obtain additional information, contact
Distribution Services: Telephone: (310) 451-7002; Fax: (310) 451-6915;Email: [email protected]
Cover design by Eileen Delson La Russo
Library of Congress Cataloging-in-Publication Data
The performing arts in a new era / Kevin McCarthy ... [et al.].p. cm.
“MR-1367.”Includes bibliographical references.ISBN 0-8330-3041-81. Performing arts—United States. I. McCarthy, Kevin, 1945–
PN2266.5 .P475 2001791'.0973'09051—dc21
2001048134

iii
FOREWORD
The Pew Charitable Trusts commissioned The Performing Arts in a New Erafrom RAND in 1999 as part of a broad initiative aimed at increasing policy andfinancial support for nonprofit culture in the United States. The goal of thisstudy was to assist us in bringing new and useful information to the policy de-bate about the contributions and needs of the cultural sector at the national,state, and local levels.
The study was inspired in part by a pair of landmark reports on the performingarts published during the mid-1960s: The Performing Arts: Problems andProspects, the Rockefeller Panel Report on the Future of Theatre, Dance, Music inAmerica (1965); and the Twentieth Century Fund’s report, Performing Arts—TheEconomic Dilemma, by William J. Baumol and William G. Bowen (1966). Thesereports described the burgeoning landscape of the nonprofit professional per-forming arts in the United States, articulating their benefits to American societyand calling for a level of governmental and philanthropic support sufficient totheir needs. Both reports noted that it was appropriate, at a time when the in-dustrial economy of the United States had grown and prospered and the mate-rial needs of its citizens were by and large being met, for the nation to turnits attention to nonmaterial values—what would now be characterized asquality-of-life concerns—including the emotional, intellectual, and aestheticsatisfaction that the arts can provide. Indeed, in the 1960s, few Americans livingoutside the coastal cities had access to live professional performing arts experi-ences, and arts advocates urged that that situation be remedied.
How times have changed! Thanks in part to these two reports and to the expo-nential growth of both public arts agencies and arts philanthropy during the1950s, 1960s, and 1970s, the live, nonprofit professional performing arts grewand prospered along with the economy during the ensuing 35 years. Simultane-ously, the world of commercial culture experienced explosive growth as newmedia—cable television, videotape, and compact discs—joined the film andbroadcasting industries in distributing cultural products. Today American lifeis saturated with arts and cultural activity, and American commercial culture is

iv The Performing Arts in a New Era
a powerful—some think, too powerful—presence internationally. Now we arein the throes of yet another technological change, the rapid expansion of digitaltechnologies for the creation and distribution of culture, with unpredictableconsequences for the future of the live performing arts.
Broad social changes also expose the vulnerability beneath the apparent ro-bustness of the performing arts. Although the United States maintains its statusas the world’s most advanced industrial society, we are less optimistic than inthe mid-1960s about the imminent prospects of well-being for all our citizens,and we struggle to find solutions to an increasingly complex array of thorny so-cial problems. The arts, only one of many public goods, must compete for bothfinancial resources and the public’s attention with an ever-increasing array ofother social needs. Furthermore, now that the post–cold war era is more than adecade old, it has become clear that the arts no longer serve as a symbol ofnational identity and of the freedom and diversity of ideas that underpinned thefederal investment in the arts during much of the second half of the 20thcentury. In addition, the rapid diversification of the nation’s populace has bothenriched and fragmented our cultural landscape. The nonprofit arts,particularly the performing arts, once again face the possibility of insufficientresources, a threat that makes their future uncertain.
We commissioned this report on the cusp of the 21st century to provide poli-
cymakers, arts funders, and the performing arts community with concreteknowledge about the status of the performing arts in this changing environ-ment, and to give ourselves some guidance about how we might work togetherto respond to the new financial and policy challenges. One of the report’s manycontributions is its creation of a matrix describing the characteristics of theperforming arts system. In this matrix, artists, audiences, organizations, and fi-nancing of the performing arts are considered across three domains of activity:the commercial, professional nonprofit, and “volunteer” sectors (the last con-sisting of a combination of amateur or avocational activities and very-low-budget or grassroots professional activities supported by free or heavilydiscounted services). RAND has based its findings on often limited existing dataabout the performing arts. Even so, this methodology yields a more compre-hensive picture of the state of the performing arts in the United States than haspreviously been available.
Although the report provides a clearer understanding and analysis of existinginformation about the performing arts in the United States, it reveals morestarkly than before the continuing lack of reliable data. Two gaps are especiallynotable: First is the almost complete absence of detailed information about thevolunteer sector, making this very large arena of activity virtually invisible topolicymakers, philanthropies, and the media. Second is the lack of hard data onthe effect of digital technologies and the Internet on the performing arts.

Foreword v
Some of the findings of this study will verify perceptions among performingartists, managers and funders about current challenges and prospects for thefuture. It will not surprise those involved in the performing arts, for example,that financial pressures are greatest on midsized nonprofit organizations. Otherfindings and observations in the report may come as a surprise. Many may bestruck by the sheer number of Americans who engage in some kind of avoca-tional arts practice. The realignment of performing arts organizations, from asystem defined by the two poles of nonprofit and for-profit activity to one de-fined by organizational size, provides another surprise. And the finding that thelargest nonprofit performing arts organizations select programming, undertakemarketing activities, and operate in many ways that are indistinguishable fromcommercial entertainment corporations is certain to spark debate.
RAND’s most important recommendation is that those concerned about thewell-being of the performing arts in the United States focus greater attention onthe public purposes and benefits of the arts and bring greater resources to bearon stimulating demand for the arts. Because public and philanthropic arts pol-icy over the past half-century has concentrated more on building and strength-ening the supply of artists, organizations, and productions than on stimulatingthe public’s demand for the arts, this recommendation points toward aprofound policy shift.
No doubt these findings and recommendations will be discussed, critiqued, andmodified in the future. We hope that this study will make a substantive contri-bution to that policy debate and will thereby help ensure a strong and confidentfuture for the performing arts in America.
Marian A. GodfreyStephen Urice
The Pew Charitable TrustsJuly 2001


vii
PREFACE
America’s cultural life at the beginning of the 21st century is evolving and di-versifying in complex ways. This report is an attempt to describe a part of thatevolution: the world of the performing arts. It employs a system-wide perspec-tive by examining the full range of performing arts disciplines (theater, opera,dance, and music) in both their live and recorded forms. Because this study isan ambitious undertaking in a field where critical data are often missing, it in-cludes an assessment of the state of information on the performing arts and de-fines important concepts needed to analyze them.
This work was supported by The Pew Charitable Trusts as part of its cultural ini-tiative, “Optimizing America’s Cultural Resources.” One of the objectives of thisprogram is to help build research capability in the arts that will foster discussionand communication among cultural leaders, policymakers, journalists, artists,the philanthropic funding community, and the American public. We hope thisreport not only provides useful information about broad developments in theperforming arts, but also articulates a framework for analyzing and interpretingthe implications of these developments.


ix
CONTENTS
Foreword ................................................ iii
Preface .................................................. vii
Figures .................................................. xiii
Tables................................................... xv
Summary ................................................ xvii
Acknowledgments.......................................... xxvii
Chapter OneINTRODUCTION ....................................... 1Approach ............................................. 2Organization of the Report ................................ 4
Chapter TwoCONCEPTUAL FRAMEWORK .............................. 5What Are the Performing Arts?.............................. 5Key Dimensions of the Performing Arts System ................. 6
Art Form ............................................ 7Market Sector ........................................ 7Functional Components ................................ 9
Chapter ThreeHISTORICAL BACKGROUND .............................. 11A New Model of Organization .............................. 11New Methods of Funding ................................. 13Greater Diversity and Participation .......................... 14A Realignment in the Performing Arts System .................. 15
Chapter FourAUDIENCES FOR THE PERFORMING ARTS ................... 17Key Concepts .......................................... 17
Levels of Participation .................................. 18

x The Performing Arts in a New Era
Characteristics of Participants ............................ 19Factors That Influence Participation........................ 19
Sources of Data......................................... 19Current Patterns of Demand ............................... 20
Levels of Participation .................................. 20Who Participates? ..................................... 22Why Do They Participate? ............................... 25
Key Trends ............................................ 28More Attendees but Stable Rates of Attendance ............... 28Growing Participation Through the Media ................... 31Consumer Desire for Greater Flexibility ..................... 33
Future Issues........................................... 33Demographic Changes ................................. 33Economic Changes .................................... 34The Role of Technology ................................. 35
Chapter FiveARTISTS: CREATORS AND PERFORMERS ..................... 37Key Concepts .......................................... 38Data Sources........................................... 39Current Picture ......................................... 40
Artists’ Characteristics .................................. 40Employment ......................................... 41Career Dynamics ...................................... 43
Key Trends ............................................ 45Increasing Prominence of Superstars ....................... 45More Artists, Fewer Job Opportunities ...................... 46Intellectual Property Questions Created by New Technologies .... 48
Future Issues........................................... 48
Chapter SixCHARACTERISTICS OF PERFORMING ARTSORGANIZATIONS ....................................... 51Key Concepts .......................................... 52Sources of Data......................................... 56
Number of Organizations and Their Disciplines ............... 56Real Output.......................................... 58Programming ........................................ 59
Current Picture ......................................... 60The Live Performing Arts ................................ 60The Recorded Performing Arts ............................ 67
Key Trends ............................................ 70The Average Nonprofit Performing Group Is Getting Smaller; the
Average For-Profit Is Getting Bigger ...................... 70

Contents xi
Patterns of Growth Differ by Sector and Discipline ............. 71Nonprofit Performing Arts Venues Are Proliferating ............ 73
Future Issues........................................... 74Dynamism of Small, Volunteer-Sector Performers ............. 75Rapid Growth of the Performing Arts Infrastructure ............ 75Increasing Concentration of the Recorded Arts ................ 75Impact of the Internet .................................. 76
Chapter SevenFINANCIAL SITUATION OF PERFORMING ARTSORGANIZATIONS ....................................... 77Key Concepts .......................................... 78Data Sources........................................... 80Current Picture ......................................... 82
The Earnings Gap Is Still Substantial ....................... 82Contributed Income Has Been Making Up the Difference ........ 83
Key Trends ............................................ 85Direct Public Funding Declined Through Most of the 1990s....... 85Private Contributions Have Been Climbing, but Funding
Practices Are Changing ............................... 87Earned Income Has Been Stable and Costs Do Not Appear to Be
Rising ............................................ 89Nonprofit Performing Groups Remain Under Financial Pressure... 90For-Profit Firms Also Face Increasing Financial Pressures ........ 91Organizations Are Using Multiple Strategies to Deal with Financial
Pressures.......................................... 92Future Issues........................................... 103
Government Support................................... 103Private Philanthropy ................................... 104Diversification of Income Sources ......................... 104Emphasis on Earned Income ............................. 105
Chapter EightWHERE ARE THE PERFORMING ARTS HEADED? ............... 107A Vision of the Future .................................... 107Implications for the Performing Arts ......................... 110Considerations for Policy ................................. 114Recommendations for Future Research ....................... 120
Bibliography.............................................. 125


xiii
FIGURES
2.1. Classification of the Arts ............................... 7
4.1. Rates of Participation in the Arts, by Discipline .............. 23
4.2. Education as a Correlate of Attendance .................... 24
4.3. Explaining Participation Preferences ...................... 27
4.4. Gains in Attendance by Discipline, 1982–1997 ............... 28
4.5. Composition of Change in Attendance by Discipline, 1982–1997 .............................................. 30
4.6. Growth of Participation in the Arts Through the Media,1982–1997.......................................... 31
5.1. Proportion of All Artists Who Are Performing Artists ........... 41
5.2. Growth in the Number of Professional Artists, 1970–1990 ....... 46
6.1. Organizational Structure of the Professional PerformingArts Delivery System .................................. 52
6.2. Proportion of Nonprofit and For-Profit PerformingCompanies by Discipline, 1997 .......................... 61
6.3. Percentage of Nonprofit and For-Profit Performing GroupsWithin Revenue Classes, 1997 ........................... 62
6.4. Arts Presenters’ Programming Activity by Discipline, 1993 ...... 67
6.5. Changes in the Number and Revenue Size of PerformingOrganizations, 1982–1997 .............................. 71
6.6. Annual Increases in Numbers of Performing Organizationsby Discipline, 1982–1997 ............................... 72
6.7. Annual Change in Average Total Revenues for PerformingGroups by Discipline, 1982–1997 ......................... 73

xiv The Performing Arts in a New Era
6.8. Establishment of Performing Venues by Decade,as of 1993 .......................................... 74
7.1. Average Earnings Gap for Nonprofit Performing Groups,1997 .............................................. 82
7.2. Earned Income as a Percentage of Total Revenue, 1997 ........ 83
7.3. Sources of Revenue for Nonprofit Performing ArtsOrganizations, 1997................................... 84
7.4. Government Funding for the Arts, 1970–1999................ 85
7.5. Fiscal Year 2000 Budgets and Appropriations per Capita forArts Agencies at Three Levels of Government ................ 87
7.6. Philanthropic Giving to the Arts, 1977–1997 ................. 88
7.7. Earned Income as Percentage of Total Revenues,1977–1997.......................................... 89
7.8. Annual Percentage Changes in Average Real Expendituresof Nonprofit Performing Arts Companies, 1987–1997 .......... 90
7.9. Distribution of Performances for Broadway Plays, 1927–28and 1959–60 Seasons.................................. 98

xv
TABLES
4.1. Annual Participation Rates for Various Leisure-TimeActivities........................................... 21
5.1. Employment Characteristics of Performing ArtistsCompared with Other Professions ........................ 42
6.1. Total Revenues and Percentage of Revenues Held by the 4Largest and the 20 Largest Performing Companies, 1997........ 63
6.2. Membership of APAP by Category of PresentingOrganization, 1993 ................................... 66
6.3. Numbers of Recorded Arts Organizations by Activity, 1997 ...... 68
6.4. Percentage of Receipts by Largest Recorded Performing ArtsFirms, 1997......................................... 69


xvii
SUMMARY
Media coverage of the performing arts in America paints a contradictory pic-ture. On the one hand, the arts appear to be booming: the number of organiza-tions offering live performances continues to grow, Broadway plays and liveopera performances are bringing in record audiences, and the demand forcommercial recordings is stronger than ever. Other stories, however, focus ontheater groups, symphony orchestras, and dance companies that are cuttingcosts or closing their doors because they are unable to attract the audiences andcontributions needed to meet their expenses. How can these stories bereconciled? What are the overall trends affecting the performing arts in the lastfew decades, and what do they imply about the future of arts in America?
In this report, we address these questions by examining key trends in the per-forming arts since the 1970s. This study is the first of its kind to provide a com-prehensive overview of the performing arts. It synthesizes available data ontheater, opera, dance, and music, in both their live and recorded forms.Although most of the data are about the nonprofit performing arts—and thosedata have serious limitations—we also analyze the commercial performing arts(for example, the recording industry and Broadway theater) as well as thevolunteer sector, which consists of arts activities that are carried out primarilyby amateur and small community-oriented nonprofit groups. After a briefhistorical background, we focus on trends affecting four aspects of the arts—audiences, artists, arts organizations, and financing—both in the aggregate and,where the data allow, by discipline and sector. Because data limitations oftenpose limits on the analysis, we also assess the usefulness of available data ineach of these areas.
From this broad perspective, we see evidence of a fundamental shift in thestructure of the performing arts system. While the commercial recorded andbroadcast performing arts industry is growing more and more concentratedglobally, live performances are proliferating at the local level, typically in verysmall organizations with low operating budgets and a mix of paid and unpaidperformers and staff. At the same time, a few very large nonprofit as well as

xviii The Performing Arts in a New Era
commercial organizations are growing larger and staging more elaborate pro-ductions. Midsized nonprofit organizations, on the other hand, are facing thegreatest difficulty in attracting enough of the public to cover their costs. Manyof these organizations are likely to disappear.
HISTORICAL BACKGROUND
In the 19th century, the performing arts were provided to the American publicexclusively by commercial or amateur artists and organizations. Most perfor-mances were staged in large cities or by touring groups in smaller towns andoutlying areas by for-profit enterprises managed by individual owners, whomade little distinction between high and popular arts in terms of either pro-gramming or audiences. By the turn of the century, these organizations had be-gun to disappear in the face of new technologies—first recorded music, thenfilm, radio, and ultimately television. The diversion of a large base of customersaway from the live proprietary arts began the first major transformation of theperforming arts world: presentation of the live high arts within a new nonprofitsector, with the more popular arts, both live and recorded, falling largely intothe commercial sector.
By mid-century, the live professional performing arts were being provided pri-marily by a few elite nonprofit arts institutions centered in major metropolitanareas and supported by a handful of major patrons of the arts. But in the late1950s and early 1960s, changes in the structure of financial support for thearts—particularly the new financing technique of leveraged funding initiated bythe Ford Foundation—stimulated massive growth in the number and diversityof arts funders. This in turn led to a period of unprecedented expansion and ge-ographic dispersion of nonprofit arts organizations across the country.
Over the past two decades, however, while expansion has continued, there aresigns that growth from leveraged funding may not be sustainable. Further, thelive performing arts appear to be losing out as the American public increasinglychooses to experience the performing arts through recorded and broadcastmedia. The strategies that both nonprofit and for-profit performing arts organi-zations are adopting as a result of these developments are changing the shapeof the entire performing arts system, with implications for what will be per-formed and how it will be delivered in the future.
AUDIENCES
The number of Americans attending live performances and purchasingrecorded performances has been growing consistently over the years. The mostdramatic growth has been in the market for the non-live arts, both recorded

Summary xix
and broadcast performances. The popularity of media delivery can be at-tributed to several factors: the increasing quality of electronically reproducedsubstitutes for live performances, the rising direct and indirect costs of attend-ing a live performance, and an increasing preference among Americans forhome-based leisure activities.
But Americans have also been attending more live performances of all kinds.The most reliable data on attendance show very slight increases in attendanceover the 10 years from 1982 to 1992. More recent data from 1997—although lessreliable than the earlier data—show the number of people attending live perfor-mances going up by 4 percent (opera) to 16 percent (musicals) between 1992and 1997. Most of the growth in attendance since 1982 is the result of popula-tion growth and increasing education levels, not an increase in the percentageof the population that engages in the arts. This distinction is important becauseslower population growth and shifts in the composition of the population—both of which are expected in the future—may weaken attendance levels.
Several other sociodemographic trends are likely to further dampen demand forlive performances in the future. Although education levels are expected torise—a trend that should create more demand for the arts—Americans areplacing an increasing premium on flexibility in their leisure activities. Theyfavor art experiences and other leisure activities that allow them to choose whatthey want to do, when and where they want to do it. (This preference helps toexplain record levels of attendance at art museums.) Additionally, babyboomers will gradually be replaced by a younger generation that appears lessinclined to attend live performances and is more comfortable with enter-tainment provided through the Internet and other emerging technologies. Theuncertain status of arts education in public schools may also be a factor inreducing demand for the arts, although little research has been conducted inthis area.
ARTISTS
Overall, three broad trends characterize the population of artists. First, theirnumbers have been growing dramatically. The prodigious increase in bothnonprofit and commercial arts organizations between 1970 and 1990 led to adoubling in the number of self-proclaimed professional artists over that periodto 1.6 million, about 261,000 of whom are performing artists. The number ofamateur performing artists—those who pursue their craft as an avocation withno expectation of being paid for it—is also increasing and they are estimated tooutnumber professionals by a factor of 20 or 30 to 1.
Second, performing artists continue to dedicate themselves to their art despitethe fact that their pay and job security have scarcely improved since the 1970s.

xx The Performing Arts in a New Era
Performing artists, on average, earn considerably less, work fewer weeks a year,and face higher unemployment than other professionals with comparable edu-cation levels. The median annual salary of professional and technical workers in1989, for example, was 10 percent higher than the median salary of professionalactors and directors, and more than twice as high as the median salaries of mu-sicians, composers, and dancers. Moreover, these salary figures for artists in-clude non-arts income from the part-time jobs that artists, unlike otherprofessional workers, tend to hold when they are unable to find work in theirchosen profession.
Third, the presence of superstars continues to tilt the arts toward a select fewperformers. Technological advances have helped magnify small differences intalent and diffuse that information, while marketing efforts have focused in-creasingly on certain artists as “the best.” These developments tend to coalescedemand around a very few stars and drive their wages above everyone else’s inthe field. Like professional athletes, few performing artists make it to the top,but many are inspired by stories of those who do. Potentially, new technologiessuch as the Internet could give artists more control over their futures by allow-ing them to market themselves directly to audiences. But it seems more likelythat the importance of critics and marketers will increase, not decrease, in anInternet-driven entertainment world.
PERFORMING ARTS ORGANIZATIONS
The number of nonprofit performing arts organizations increased by over 80percent between 1982 and 1997, whereas the number of commercialperforming arts organizations increased by over 40 percent. At the same time,real revenues for the average nonprofit performing group have declined in alldisciplines except opera, suggesting that most of the new nonprofit organiza-tions are small. These small companies—especially those with annual revenuesunder $100,000—tend to emphasize local participation and rely heavily onunpaid labor.
Performing arts venues (where performances take place) have been constructedat a rapid pace in the past 30 years. According to 1993 data collected by theAssociation of Performing Arts Presenters, over one-third of all its memberestablishments were built between 1980 and 1993. Most of these organizationsare tax-exempt, and many receive strong financial support from localgovernments. Such expansion of the arts infrastructure probably reflects thegrowing emphasis on the economic benefits of the arts on the part of majorfinancers and local and state governments. Many theaters, symphony halls, andall-purpose performing arts centers, for example, are financed by communitydevelopment block grants. It is not clear, however, who will use these facilities

Summary xxi
and whether their day-to-day operations will be affordable to many performinggroups.
In contrast to the live performing arts, commercial organizations in therecording and broadcasting industries have been consolidating. These two in-dustries are now among the most concentrated in the United States, and theyare increasingly organized on a global scale.
FINANCES
The revenues of America’s nonprofit arts organizations fall into three main cat-egories: earned income (ticket sales, other business activities, and investmentincome), philanthropic contributions (from individuals, foundations, andbusinesses), and direct government subsidies. In the 20 years between 1977 and1997, as total average annual revenues for performing arts organizations rosesteadily, the percentage received from earned income, contributions, andgovernment remained remarkably steady. Despite anecdotes about empty seatsat live performances, aggregate data on earned income for nonprofitperforming groups do not show a clear downward trend in any of the art forms.The average percentage of total revenues that are earned varies by discipline,with dance companies at the low end with about 30 percent and theater groupsat the high end with about 60 percent. In the aggregate, performing groups areabout as dependent upon the market as they have been in the past, despiteintensive efforts at marketing and audience development, and despite sharprises in the cost of tickets. (Average ticket prices for orchestras, for example,increased by 70 percent between 1985 and 1995.)
On average, performing arts organizations receive only 5 percent of their rev-enues from government funding, according to 1997 data, and the level of gov-ernment subsidy has trended downward until recently. The main source of thedecline has been an almost 50 percent decrease in federal funding since theearly 1990s, but that decrease has been moderated by an increase in state andlocal appropriations. The result has been a shift in government funding fromthe federal to the state and increasingly the local level, with implications for theaverage size of grants, the characteristics of grant recipients, and the pro-gramming decisions of those recipients. In particular, state and local govern-ments tend to focus less on the arts per se and more on the social and economicbenefits to local communities in awarding grants.
In contrast, private contributions from individuals, corporations, and founda-tions increased steadily from 1977 to 1997. Although contributions from indi-viduals increased more than did any other single source of giving, particularlyfrom 1992 to 1997, there is evidence that this increase has come in the form ofmore smaller donations that require higher development costs. Funding from

xxii The Performing Arts in a New Era
corporations has also been growing, but corporate donors are increasinglyproviding support for targeted purposes rather than giving unrestricted grantsthat allow organizations more flexibility in using these resources.
Because systematic data are not available on artistic output—such as the num-ber of productions, performances, or admissions tickets sold—trends in real ex-penses averaged across organizations are difficult to interpret. It is impossibleto know, for example, whether the 2.2 percent annual increase in opera com-panies’ expenditures between 1987 and 1997 is due to increased costs per pro-duction or an increased number of productions per season. Similarly, the 2.8percent decline in symphony orchestras’ annual expenditures over the sameperiod could reflect greater efficiencies or a cutback on the length of theirseasons.
In fact, a good deal of case-study evidence suggests that performing arts organi-zations are using multiple strategies to deal with financial demands in an in-creasingly competitive leisure market. The authors describe some of the strate-gies for cutting costs, developing revenues, and financing performances thatvarious organizations are pursuing, and point out that the size of an organiza-tion's budget will often determine which strategies will be most effective. In aneffort to increase their revenues, for example, large nonprofits rely more onstar-studded blockbuster productions, midsized organizations on “warhorse”programming (traditional works loved by general audiences), and small com-mercial, nonprofit, and especially volunteer organizations more on niche mar-kets. Many large nonprofits have also adopted for-profit business models in or-der to stabilize revenues: as their productions grow larger and more elaborate,and the celebrity artists they feature more expensive, many large nonprofits areturning to the same revenue-enhancing and financing techniques that havelong been popular among for-profit firms, such as merchandising spin-offproducts and collaborating with financial partners in productions or facilityconstruction.
A VISION OF THE FUTURE
If trends observed in the past 20 years continue, a fundamental shift in the per-forming arts system will take place. Instead of a sharp demarcation between anonprofit sector producing the live high arts and a for-profit sector producingmass entertainment, major divisions in the future will be along the lines ofbig versus small arts organizations, or firms that cater to broad versus nichemarkets.
Big organizations—both commercial and nonprofit—will rely increasingly onmassive advertising and marketing campaigns promoting celebrity artists toattract large audiences. Although for-profit firms will still focus primarily on the

Summary xxiii
recorded arts (with the notable exception of Broadway), and nonprofits willcontinue live performances, distinctions between what is “popular art” andwhat is “high art” will continue to erode as both sets of organizations seek toproduce the next blockbuster. And as the rewards of success and the costs offailure climb, these large organizations will seek to minimize their risks bychoosing conservative programming and technology-intensive productionsdesigned to appeal to the largest possible audience.
At the other end of the scale, small performing arts organizations will be bothmore dynamic and more diverse than their larger counterparts. In the com-mercial sector, small firms will target niche markets within the recordedbranches of the performing arts. At times these firms will move into areas suchas classical recordings that have been abandoned by larger firms because theydo not provide the margins and volume that large firms require. Technologicalchanges such as the Internet and e-commerce will enable small for-profits toprovide more adventuresome programming that serves a wider variety ofsmaller, more specialized markets.
In the nonprofit and volunteer sectors, the growing number of small organiza-tions will have little in common with larger nonprofits in terms of program-ming, audience demographics, and the professional stature of most of theirartists. Small performing arts groups will focus on low-budget, low-tech liveproductions that rely heavily on volunteer labor. Many will cater to local andspecialized markets, particularly ethno-cultural communities and neighbor-hoods. Others will provide opportunities for hands-on participation fornonprofessional artists in traditional high-arts forms.
The biggest change suggested by these trends relates to the middle tier of non-profit arts organizations, particularly those opera companies, symphony or-chestras, ballet companies, and theater groups located outside of majormetropolitan areas. Likely reductions in demand, rising costs, and static or evendeclining funding streams will force many of these institutions either to becomelarger and more prestigious—which many will lack the resources to do—or tobecome smaller and more community-oriented, using local talent to keep costsdown and adapting programming to local audiences. Still others will simplyclose their doors, unable to reconcile conflicts among their various stake-holders.
IMPLICATIONS FOR THE ARTS
What will these trends mean for the vitality of the performing arts in the future?How are they likely to affect the quantity, quality, and availability of the arts, inparticular? The vision of the future we describe here suggests that the quantityof performances will increase in some areas and decrease in others, depending

xxiv The Performing Arts in a New Era
on whether they are live or recorded, and whether they involve the high, folk, orpopular arts. Professional live performances of the high arts, for example, willbe increasingly concentrated in big cities and provided by high-budgetnonprofit organizations that can support the cost of top-echelon performersand productions. Touring artists and performing groups will bring the liveprofessional arts to audiences in smaller cities and towns that are not able tosustain top-level performing arts.
The recorded and broadcast performing arts should continue to proliferate anddiversify. Advances in production, recording, and distribution technologies willallow Americans to choose among a wider variety of performances and artforms than they do today. Although the Internet’s ability to produce sustainedprofitability remains to be demonstrated, it is already reaching far-flung audi-ences and creating healthy markets for art forms that have previously been un-able to attract economically significant demand. In the future, niche arts mar-kets may be not only possible, but profitable.
Americans will also have increasing access to live performances in their owncommunities. Small professional nonprofit and for-profit performing groupswill be able to build and maintain comparatively small but loyal audiences whovalue their artistry and are willing to participate both as consumers and patronsof the arts. Small organizations in the volunteer sector will continue to providelow-budget productions of great cultural and artistic diversity performed largelyby artists who practice their craft as an avocation.
The effect of future changes on the quality of the arts could be more serious.Several trends are likely to make it more difficult for talented actors, composers,musicians, and dancers to mature artistically. If the polarization of artistic in-comes created by the superstar phenomenon continues to grow and the num-ber of both large and midsized arts organizations contracts, young artists willhave fewer opportunities to gain experience in their field. Moreover, the pres-sures on performing arts organizations to earn ever-greater revenues tend toproduce programming that appeals to mass audiences in both the large non-profit and the commercial worlds. As market categories with demonstrated suc-cess increasingly govern the selection of what gets performed and recorded,innovation is likely to be discouraged. Even the decentralized distributionsystem provided by the Internet poses its own obstacles: With so many artistsentering the scene, it becomes harder for artists of unusual talent to attract theattention of more than a small circle of admirers.
The effects of change on access to the arts will be mixed, as are the effects onquantity. Although live professional performances will decline in some parts ofthe country, community-based performances and recorded products will pro-liferate. Access will most likely hinge on future patterns of demand.

Summary xxv
CONSIDERATIONS FOR POLICY
How does our analysis of the performing arts help inform discussions of policy?The critical issue in arts policy is how current trends affect the broader publicinterest, and this issue has not been given adequate attention by the arts com-munity. Developing a policy-analytic capability for the arts today will require anew framework that is grounded in an understanding of the public interestsserved by the arts, the roles that government (versus others) could play in pro-moting those interests, and the strategies that government at every level has atits disposal.
We conclude by discussing each of these aspects of a policy framework andidentifying future research areas that would contribute to the development ofsuch a framework. Until recently, the policy debate has been too narrowlyfocused on supporting the production and performance of the arts—“supply”strategies—rather than stimulating public involvement in the arts—“demand”strategies. A new framework that puts the public benefits of the arts at thecenter of the discussion will require approaches designed to increase individualexposure, knowledge, and access to the arts. Future research should examinehow individual tastes for the arts are formed and how the public and privatebenefits of the arts can be identified and measured, so that policymakers canexplore more diversified and innovative approaches to promoting the arts inAmerican society.


xxvii
ACKNOWLEDGMENTS
This work could not have been conducted without the encouragement, guid-ance, and assistance of many people. We would like to give particular thanks toMarian Godfrey, Stephen Urice, and Shelley Feist of the Culture Program at ThePew Charitable Trusts for their support and advice throughout the researchprocess. We are also indebted to the arts researchers and cultural leaders whooffered us assistance in gathering information on the arts and who attendedseminar presentations of this work, including Kelly Barsdate, Elizabeth Boris,Tom Bradshaw, Ben Cameron, Joan Channick, Randy Cohen, Doug DeNatale,Paul DiMaggio, Ann Gray, Mark Hager, Frank Hodsoll, Maria Rosario Jackson,Joan Jeffri, William Luksetich, Jack McCauliffe, Tom Pollak, J. Mark Schuster,Joan Shigekawa, Holly Sidford, Andras Szanto, James Allen Smith, StevenTepper, Andrew Tyndall, and Margaret Wyszomirski. Many of these individualsalso offered thoughtful comments on earlier drafts of this report.
We also wish to thank the national arts service organizations for explaining theirdata collection efforts to us and, where feasible, providing us with data. In par-ticular we wish to thank Charles Olton, Jack McAuliffe, and Jan Wilson of theAmerican Symphony Orchestra League; John Munger of Dance/USA; JohnChurch, Betsy Cecchetti, and Stacey March of OPERA America; and BenCameron, Joan Channick, Chris Shuff, and Collette Carter of Theater Commu-nications Group. Roland Kushner provided tremendous assistance in gathering,compiling, and assessing these data.
Special thanks go to David Throsby of Macquarie University, Sydney, Australia,and our RAND colleague, C. R. Neu. Their thoughtful reviews occasioned manychanges that improved the clarity and accuracy of the report. And last but notleast, we would like to thank Renee Almassizadeh, Aimee Bower, Phil Devin,Lisa Jones, Tessa Kaganoff, Elizabeth Ondaatje, Lauren Sager, Roberta

xxviii The Performing Arts in a New Era
Shanman, and Lilah Shapiro for research support; and Lisa Lewis, MiriamPolon, David Bolhuis, and Eileen La Russo for production support.
The opinions expressed in this report are those of the authors and do notnecessarily reflect the views of The Pew Charitable Trusts.

1
Chapter One
INTRODUCTION
The best of times or the worst of times? Charles Dickens’ famous aphorismaptly describes the polarization of observers of American arts and culture at thedawn of the 21st century. To some, “mid-to-late twentieth century Westernculture . . . will go down in history as a fabulously creative and fertile epoch” inwhich “growth of the market has liberated artists, not only from the patron, butalso from the potential tyranny of mainstream market taste” (Cowen, 1998, p.8). To others, “high art in America is dying” because Americans do not properlyappreciate “the concept of a culture driven by art and inspiration rather than bythe cash register” (Brustein, 1992, 1995). At the heart of this debate are pro-found differences of opinion about the changes in the arts that have taken placeover the last two to three decades, particularly the increasing role of themarketplace in the delivery of the arts.
What is the nature of these changes, especially in the performing arts? On onehand, there is ample evidence that this is a period of extraordinary growth inAmerican arts activity, popular involvement, and international influence. Onthe other, newspapers regularly report that theaters, symphonies, and dancegroups are struggling financially, unable to attract the audiences and contribu-tions they need to meet their costs. How can these stories be reconciled? Whatdo the data tell us about key trends: attendance at live performances, consump-tion of recorded and broadcast performances, the supply and remuneration ofartists and performers, funding for the arts, and the financial condition of or-ganizations, both nonprofit and for-profit? Are some artistic disciplines andforms of arts consumption growing while others are declining? And what dothese trends suggest about the future of the performing arts?
The central purpose of this study is to address these questions. Using the dataand analysis available, we describe the performing arts today with an emphasison the forces of change that are likely to shape the performing arts in the future.We look at the entire system of the performing arts—including the nonprofitsector, the commercial market, and what we choose to call the volunteer sector,by which we mean arts activities that are carried out primarily by avocational

2 The Performing Arts in a New Era
and small community-oriented nonprofit groups—in order to identify how ac-tivities across the various parts of the system may be related. Such a systemsapproach is an important step in the evolution of the field of cultural policyanalysis. We must understand the boundaries of the system; the key dimen-sions along which it can be described; and the trends affecting public involve-ment in the arts, artists, arts organizations, and financing in all parts of thesystem before we can identify and assess alternative policies that might beconsidered in addressing these trends.
The main difficulty in conducting such an analysis is that the data needed toanswer such questions with confidence often do not exist. On the commercialside, for example, the recording industry releases almost no data on the costs ofits operations. Nor can we determine what the total annual revenues are fromrecorded music or from music and opera videos. Information on the nonprofitarts is much more plentiful, but the data often lack the adequate differentiationand systematic collection over time that are needed to analyze artistic productsand the audiences for different art forms. Because the data are fragmentary andincomplete, the literature on the art world suffers from several weaknesses:academic studies tend to be narrowly focused on areas where the data are plen-tiful; commentary for broader audiences tends to take on larger issues butusually provides only anecdotal evidence for support; and the field in generallacks a systematic framework for analyzing the data that do exist.
APPROACH
In view of these difficulties, we approached our task from the broadest possibleperspective. We wanted to understand how existing information describes theworld of the performing arts in the United States, where the gaps in informationare, and how trends in one part of the performing arts might be influencingtrends in other parts of the system.
We began with a literature review that included all datasets on the arts and allpolicy-relevant research studies over the last 20 years—not only about the per-forming arts but about the visual arts, literary arts, and media arts as well.1 Ex-amining information sources on such a wide range of topics on the arts helpedus create a framework with which to describe and analyze different parts of theperforming arts system (see Chapter Two).
The portrait of the performing arts in this report is largely a work of synthesis.Although we did some new empirical analysis of the data and drew conclusions
______________ 1The data sources and research studies cited in this report are limited to the performing arts. Thecompendium of sources including the performing, visual, literary, and media arts will be releasedseparately.

Introduction 3
from this analysis that are not widely recognized, our main purpose was to sys-tematize and synthesize work that has already been done on the arts. Lookingacross artistic disciplines, market sectors, and the different ways performancesare experienced (live, recorded, broadcast), we have connected many disparatepieces of information and analysis. In the process, we looked for common pat-terns among distinct studies, links among trends in the data from differentparts of the system, and relationships between these trends and the broad con-text of sociodemographic, economic, and technological change that influenceindividual attitudes toward the arts, the way Americans choose to spend theirleisure time, and the ways artistic performances are delivered to the public. Weacknowledge that there is a good deal of intuition and personal judgment insuch a synthesis. But the breadth of our approach has allowed us to identifyforces of change in the performing arts that would not have been visiblethrough a narrower lens.
In undertaking this research, we made no initial assumptions about the properrole of government in the arts or about the value of one kind of artistic expres-sion or experience over another. We have tried to avoid any type of advocacy forthe arts in order to conduct the kind of impartial empirical analysis that formsthe basis of sound policy. Our main purpose has been to improve understand-ing of the recent changes in the support structure for the performing arts andwhat they may mean for the future of the arts. Although we highlight several is-sues that we believe merit future policy consideration, we do not assess specificpolicy options for the arts.
Our research offers evidence of a fundamental shift in the structure of the liveperforming arts in the future. Specifically, we predict that the number of orga-nizations supplying live performances of theater, music, opera, and dance willcontract at the professional level and expand at the community level. Organiza-tions that produce live professional performances face particular problems inmany small and midsized cities across the country and could become increas-ingly concentrated in large metropolitan areas and important regional centersthat can support high-budget nonprofit organizations with top-echelon per-formers and productions. For many Americans, access to this level of perform-ing art will depend on touring productions. At the same time, Americans willhave greater access to small, low-budget productions of great cultural andartistic diversity performed largely by amateur artists (and professionals willingto perform for little or no pay) in their own communities. Also, as is true today,Americans will increasingly choose to experience the performing arts notthrough live performances but through recordings and broadcast media, thequality of which will continue to improve.
This future is far from certain, and some areas of the country may make a sus-tained commitment to maintaining their nonprofit cultural institutions. Many

4 The Performing Arts in a New Era
smaller and midsized cities, for example, look with understandable civic prideupon their local performing-arts organizations as important community assetsand have increased their financial support accordingly. Nevertheless, taken to-gether, the trends discussed in this report point to a growing polarization in thedelivery of both live and recorded arts into very large and small organizations.The implications of such a development for the vitality of the performing arts—and for the public good—should become part of the broader discussion of artspolicy in America.
ORGANIZATION OF THE REPORT
The next chapter describes the conceptual framework for our analysis. ChapterThree offers a brief history of the way in which the performing arts have beenprovided to the public from the late 19th century to the present, with emphasison the changing role of the marketplace in the arts. The next four chapters pro-vide our analysis of the audiences and other consumers of the performing arts(Chapter Four), performing artists (Chapter Five), the characteristics of per-forming arts organizations (Chapter Six), and the financial situation of those or-ganizations (Chapter Seven). Each of these chapters is structured in the sameway. First, we describe the key concepts that define any inquiry into the subject.For example, the chapter on audiences describes the various ways in whichpeople become involved in the arts, how that involvement can be measuredover time, and how changes in those measurements can be interpreted. Sec-ond, we describe the kind of data needed to analyze the subject adequately, andwe assess the quality of the data that exist. Finally, we present our analysis,starting with a description of the current state of affairs—such as the sociode-mographic characteristics of today’s audiences—and moving to a description ofthe main trends over the last 15 to 20 years and what they suggest for the future.
The final chapter synthesizes these trends, describes their implications for thefuture, and suggests the kinds of questions they pose for public policy in thearts. It also identifies where there are major gaps in our understanding of theperforming arts and suggests corresponding priorities for future research.

5
Chapter Two
CONCEPTUAL FRAMEWORK
We viewed this study as an opportunity to help build the foundation for policyanalysis in the arts. Our approach was to follow a familiar sequence of steps re-quired for policy analysis: (1) define the population of interest, (2) identify a keyset of analytical dimensions along which to describe that population, (3) usethose dimensions to describe the current state of affairs and trends, (4) identifythe dynamics behind those trends, (5) examine the range of policies that canaffect those trends, and (6) evaluate the costs and benefits of those policy op-tions. The last two activities are commonly recognized as the central tasks ofpolicy analysis. They cannot be performed, however, without first defining anddescribing the subject area being analyzed, both as it is now and as it has beenchanging. This task has yet to be accomplished for the arts.
For that reason, this analysis focuses on the early steps of the process, steps 1through 4, and offers a brief discussion of policy implications that arise fromthat analysis (step 5). In this chapter, we describe the first two steps of the pro-cess: how we defined the performing arts and the dimensions we used to ana-lyze them.
WHAT ARE THE PERFORMING ARTS?
The population of interest in this study was the entire system of production andconsumption of the performing arts. By the performing arts we mean theater,music, opera, and dance, from the traditional “high arts” to the popular arts, in-cluding live arts performed in all venues and non-live arts through all forms ofmass media: CDs and other recordings, radio, video, television, and the Inter-net. We have excluded the genre of film from our scope.1
______________ 1A related RAND study supported by the Rockefeller Foundation is examining the rise of the mediaarts, including independent film. That work is forthcoming.

6 The Performing Arts in a New Era
We refer to the “high,” “popular,” and “folk” arts in our analysis to describeparts of the performing arts market that are relatively distinct. Although we rec-ognize that these distinctions are easier to draw in broad strokes than in alltheir details, they do reflect important differences in how the performing artsare produced and distributed. The high arts are traditional art forms such asballet and symphonic music. The popular arts consist of art forms such as rockand roll music or musical theater that have attracted mass audiences in thecommercial marketplace. The folk arts range from gospel music to Khmer clas-sical dance and represent the traditional art and culture of the diverse ethniccommunities within the United States. Many live folk arts performances areproduced by amateur (i.e., unpaid) artists and small nonprofit performinggroups in the volunteer sector.
We do not mean to suggest by these terms, however, that certain art forms ortypes of participation are inherently more worthy than others. Although thedata on amateur activity are scanty and largely anecdotal because it tends totake place outside official organizations or in non-arts organizations such asschools and churches, such activity represents an extremely important part ofthe performing arts in America today. As the following description of our con-ceptual framework suggests, the different environments for the performingarts—the nonprofit, commercial, and volunteer sectors—need to be clearly de-lineated in order to identify how each is evolving.
KEY DIMENSIONS OF THE PERFORMING ARTS SYSTEM
How is such a vast network of related activity to be described? We needed aconceptual framework—a kind of multidimensional map—that could provide astructure for describing and analyzing all aspects of the performing arts systemand could help us classify all the information sources on the performing artsinto a coherent system. One grid on that map, of course, had to be the art formitself. The performing arts consist of multiple disciplines, each of which hasdifferent modes of production and involves different types of organizations.Another grid on the map is the one mentioned above: the sector of the economyin which the art is performed and produced. The same work of art can be pro-duced in different sectors of the market—through nonprofit, commercial, orvolunteer means—in a variety of forms. The third dimension, which has therichest potential for systems analysis, defines the key players in the process ofcreating the art and delivering it to audiences. These are audiences, artists, artsorganizations, and funders of the arts. All of these dimensions must be analyzedto get a full picture of the performing arts system.
Conceptual Framework 7
Art Form
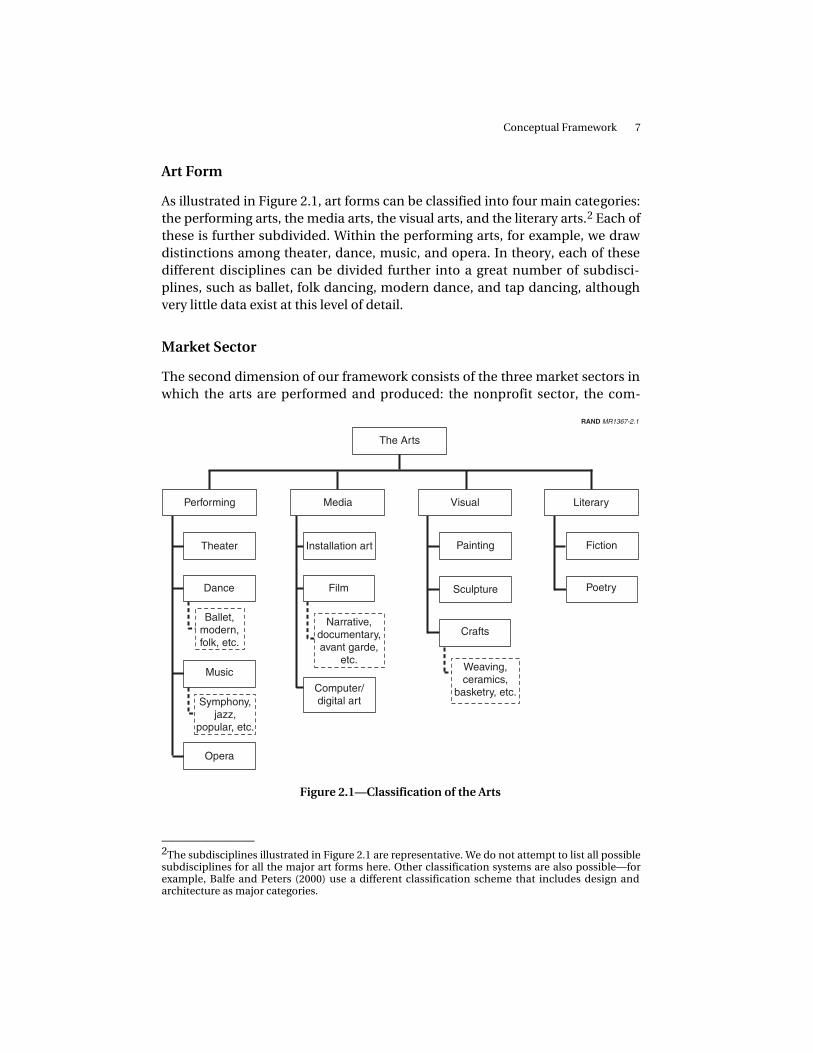
As illustrated in Figure 2.1, art forms can be classified into four main categories:the performing arts, the media arts, the visual arts, and the literary arts.2 Each ofthese is further subdivided. Within the performing arts, for example, we drawdistinctions among theater, dance, music, and opera. In theory, each of thesedifferent disciplines can be divided further into a great number of subdisci-plines, such as ballet, folk dancing, modern dance, and tap dancing, althoughvery little data exist at this level of detail.
Market Sector
The second dimension of our framework consists of the three market sectors inwhich the arts are performed and produced: the nonprofit sector, the com-
The Arts
Performing
Dance
Painting
Crafts
Sculpture
Fiction
Poetry
Ballet,modern,folk, etc.
Symphony, jazz,
popular, etc.
Weaving, ceramics,
basketry, etc.
Theater
Media
Film
Installation art
Computer/digital art
Opera
Music
LiteraryVisual
Narrative, documentary, avant garde,
etc.
RAND MR1367-2.1
Figure 2.1—Classification of the Arts
______________ 2The subdisciplines illustrated in Figure 2.1 are representative. We do not attempt to list all possiblesubdisciplines for all the major art forms here. Other classification systems are also possible—forexample, Balfe and Peters (2000) use a different classification scheme that includes design andarchitecture as major categories.

8 The Performing Arts in a New Era
mercial sector, and the volunteer sector. The nonprofit sector consists entirelyof arts organizations that have filed for formal nonprofit status under Section501(c)(3) of the Internal Revenue Code. Although these organizations benefitgreatly from contributions of volunteer and subsidized labor, they also dependheavily on philanthropic contributions, or “unearned” income, as well as onearnings from ticket receipts and other sources. In contrast to the profits thatdrive commercial organizations, nonprofit institutions are “mission-driven,” al-though the missions they pursue are diverse. Examples include Arena Stage inWashington D.C. and the Los Angeles Philharmonic.
Commercial organizations pay taxes, rely solely on the market for financial sol-vency, and define success in terms of market profitability. While examplesrange from Disney and Atlantic Records to Broadway theater and jazz night-clubs, most for-profit performing arts organizations are involved in the produc-tion and distribution of recorded artistic products rather than live perfor-mances.
Finally, the volunteer sector encompasses activities carried out by avocationalgroups such as church choirs, folk-art groups, and local rock bands, as well asby small nonprofit organizations that may have been formally incorporated astax-exempt organizations.3 In contrast to the nonprofit sector, volunteer sectorgroups rely more on volunteer labor than on monetary contributions to survive;they also tend to give more importance to enlisting and encouraging participa-tion from particular geographic, ethnic, or cultural communities. In fact, thisobjective is often their primary mission. An example is the Santa Monica Sym-phony Orchestra, an organization whose nucleus is made up of volunteer mu-sicians. The Santa Monica Symphony does not charge admission to the fourconcerts it presents in the local civic auditorium each season, and its revenuesaveraged less than $100,000 per year during the decade of the 1990s. Its primarymission is to serve the residents of Santa Monica and neighboring communi-ties.
Unfortunately, these distinctions among sectors are easier to draw in theorythan in practice. Both nonprofit organizations and volunteer groups are likelyto combine earnings, contributions, and volunteer labor to support their oper-
______________ 3As we define it, the “volunteer” sector of the arts includes many of the groups and activities typi-cally included in what arts researchers call the “unincorporated” sector, but not all. For example,while this category includes groups that are “small and organized informally, with little economicinterchange” as described in Peters and Cherbo (1998, p.116), it does not include the national artsservice organizations or arts organizations embedded within larger non-arts nonprofits—both ofwhich are sometimes included in definitions of the unincorporated sector (Peters and Cherbo,1998; Arthurs and Hodsoll, 1998). More important, our definition of the voluntary sector explicitlyincludes small organizations that are formally tax-exempt but rely primarily on volunteer labor.

Conceptual Framework 9
ations, making it difficult to know where to draw the line between “primarily”and “partly” dependent on one revenue source or another. There are also“hybrid” organizations that incorporate features of both the commercial andnonprofit sectors. For example, nonprofit organizations may set up profit-making subsidiaries, or a facility owned by local government may be used by anonprofit organization and run by volunteer labor. There are almost no data atall on organizations that file under the umbrella of non-arts nonprofit institu-tions, such as university theaters.
Regardless of how market orientation is defined, it is important to rememberthat any particular art form can be presented in any sector. Classical music, forexample, is offered in live performances by professional symphony orchestrasin the nonprofit sector, on CDs produced and sold by commercial firms, and inlive performances in the volunteer sector. Although the outcomes are all “higharts” experiences, they may differ in terms of their quality, accessibility, price,and audience. These differences are central to understanding the performingarts today.
Functional Components
By functional components of the performing arts system, we mean the classesof individuals and organizations that serve key functions in the complex pro-cess of creating and presenting the arts—artists, audiences, arts organizations,and funders. The process starts with the artist’s creation of the work to be per-formed and ends with the audience’s experience of the work. Between theartists and their audiences lies a vast array of organizations and individuals thatperform, present, record, and transmit works of art. Supporting these organiza-tions are the individuals, foundations, businesses, and government agenciesthat offer financial support to nonprofit organizations and, in some cases, in-vest financially in commercial arts firms. Taken together, all these entities makeup the performing arts system.
This classification system is useful because it facilitates analysis of the charac-teristics of the performing arts industry that make it similar to and differentfrom other industries. Such a breakdown also allows us to examine activitiesthat share the same function and therefore to make comparisons across artsforms and market sectors. For instance, composers and dancers can be bothartists and producers of art; for-profit Broadway theaters and nonprofit regionaltheater houses are both groups of presenters; thus their characteristics can bevalidly compared.
Using this conceptual framework, we are able to compare arts activities withinart form, market sector, and functional domains over time, and to consider how
10 The Performing Arts in a New Era
activities across the various dimensions may be related. For example, to answerthe question “how has the demand for classical music changed over the past 20years?” one might look at box office data for nonprofit symphony orchestras forthe period 1980 to 2000. Such an approach, however, would miss an importantfeature of the demand for classical music, which often reaches audiencesthrough recorded media such as tapes and CDs sold on the commercial marketor through broadcast media such as radio. Many classical music consumers, af-ter all, enjoy their art through all of these media. Understanding cross-disci-pline, cross-sector, and cross-function relationships is important for under-standing the American arts world at the beginning of the 21st century. Perhapseven more critical, it is essential for accurate forecasting of what is to come. Al-though we acknowledge that this framework is bound to describe the currentstructure of the arts better than it does the structure that will evolve in the fu-ture, it would be difficult to contemplate that future without using the termsthat best describe the present.

11
Chapter Three
HISTORICAL BACKGROUND
A brief review of the history of the performing arts in the United States providesa useful background for a discussion of more recent trends. This chapter re-views the evolution of the performing arts with a special focus on nonprofit or-ganizations and the unique institutional funding arrangements that haveevolved to support them.
In the 19th century, the performing arts were provided to the American publicexclusively by commercial or amateur artists and organizations. Unlike Europeduring this period, there was essentially no government support of the arts andvery little tradition of upper-class patronage. Most performing arts groups werefor-profit enterprises managed by individual owners. They made little distinc-tion between the high arts and popular arts in terms of either programming oraudiences and performed to mixed crowds that ranged from the workingclasses to the upper classes. These shows were generally performed in the largerurban centers, or by touring companies of musicians and actors in smallercities and towns. Apart from such commercial entertainment, a good deal ofamateur performance took place in private homes, particularly those of themiddle and upper classes. Musical literacy among Americans was relativelyhigh—especially among cultured young women—and performances for friendsand family were a popular form of evening entertainment (Butsch, 2000). Folk-art performances were generally restricted to amateur artists and organizationsbelonging to specific ethnic communities.
A NEW MODEL OF ORGANIZATION
In the first years of the 20th century, however, the commercial touring compa-nies began to decline. According to Baumol and Bowen (1966), there were 327theater companies at the turn of the century but fewer than 100 in 1915. By the1930s, only a few were left. The agent of this change was the emergence of thenew medium of movies. Many proprietary live performing arts organizations

12 The Performing Arts in a New Era
disappeared in the face of the new technologies—first film, then recorded mu-sic, radio, and ultimately television. This development marked the beginning ofa profound change in the delivery of the performing arts in America. As JohnKreidler writes, “Whereas broad-based audiences, comprised of both common-ers and educated, well-to-do elites had once attended proprietary productionsof Shakespeare, even in small towns and mining camps across the nation, in thetwentieth century, the commoners began to gravitate toward the movie housesand other new technologies, leaving only the elite to patronize an assortment ofproprietary high art” (Kreidler, 1996, p. 81).
The diversion of a large base of customers away from the live proprietary artsbegan the first major transformation of the performing arts world: the divisionof the popular, folk, and high arts that has defined the performing arts in Amer-ica for the past 100 years. As new recorded forms of arts and entertainmentdrew audiences away from the live popular arts, the remaining audiences—many of whom had a preference for the high arts—had to accept higher pricesto maintain the supply of the art forms they preferred. These increased pricesmostly took the form of donations or organizational subsidies rather than userfees. The result was a new model of arts organization: the subsidized nonprofitorganization. As Butsch (2000) and DiMaggio (1986) argue, the expanding eliteand middle classes also became increasingly unwilling to share their arts expe-rience with the “rowdy and disreputable” working classes. The new organiza-tional model provided them with a means to distinguish themselves throughtheir tastes in art.
The newly emergent nonprofits were supported initially by patrons among theaffluent urban elite who were willing to underwrite the establishment of non-profit institutions devoted to the high arts. Eventually, however, these organi-zations became too expensive for individuals alone to support and evolved intoorganizations run by a board of directors or trustees that provided funding andgeneral oversight of the financial health of the institution. By and large, the gov-ernment played little role in supporting these organizations or the arts moregenerally. The 1917 adoption of the income tax deduction for individual contri-butions to educational, health, and cultural organizations, which would laterprove a central element of government support for the arts, had little direct im-pact for at least another decade (Harris, 1995; Hall, 1987).1 The Depression-eraWPA arts programs, which at their peak employed thousands of artists, repre-sent a notable exception to this pattern. But these programs were short-livedand motivated primarily by humanitarian concerns for the unemployed.
______________
1This policy was extended to corporations in 1936.

Historical Background 13
NEW METHODS OF FUNDING
The next major transformation occurred in the late 1950s as America, theworld’s economic and political leader, began to seek comparable stature in thearts. The division of the performing arts world into a live nonprofit high-artssector, a live or recorded commercial popular sector, and a live unincorporatedfolk-arts sector was already firmly established. The live high arts were concen-trated in major metropolitan areas where they were produced by a few eliteinstitutions that catered to a predominantly affluent white audience. In the late1950s, the Ford Foundation, under the guidance of W. McNeil Lowry, its vicepresident for the arts, developed an ambitious scheme for the systematic ad-vancement of the entire arts field. Ford’s program had three principal goals: (1)to financially revitalize the major institutions through leveraged investmentsthat required matching support two to four times greater than the amountawarded by the Foundation; (2) to increase access to the high arts through theestablishment of new regional institutions that would disperse the high arts be-yond the city of New York and other major metropolitan centers, and (3) toprofessionalize the high arts by establishing conservatories and visual-artsschools to generate a skilled labor force for the increasing number of arts orga-nizations.
The concept of leveraged funding as a tactic for recruiting new donors was per-haps the most significant innovation in the evolution of the arts infrastructurein America, leading to the complex public-private partnerships that character-ize the sector today. Before Ford introduced this strategy, very few institutionsengaged in arts philanthropy. Following Ford’s leadership, however, hundredsof foundations and corporations became active supporters of the arts. The con-cept, which proved enormously successful for the next 30 years, was that theinitial grant would stimulate an ever-expanding base of funding from individu-als and institutional funders that would be able to supply the contributed in-come needed by the nonprofit arts economy to survive.
In 1960, the state of New York took the pioneering step of establishing a StateCouncil for the Arts (Netzer, 1978). The National Endowment for the Arts (NEA)was conceived at about the same time and was inaugurated in 1965. For the firsttime in U.S. history, the federal government assumed an active role in directlysupporting the arts. This reversal of the long-standing opposition to publicsupport for the arts was triggered by a combination of factors, including a desireto demonstrate to the world the value of U.S. culture (as a concomitant to ourmilitary and economic power), the acceptance of a broader government role insupporting social goals more generally, the work of arts advocacy groups thatlobbied for greater parity with science in the competition for federal support,and widespread belief that the arts and culture were important social assets that
14 The Performing Arts in a New Era
could not be sustained in the marketplace (Cherbo and Wyszomirski, 2000;Urice, 1992; Harris, 1995). Baumol and Bowen’s influential 1966 analysis of theperforming arts, which argued that the live performing arts could never entirelysupport themselves with earned income, provided an important intellectualfoundation for both public and private subsidy of the arts.
Relying on the leveraging strategy initiated by Ford, and motivated by similargoals of increasing access, financial viability, and professionalism, the NEA ini-tiated a program of direct support for artists and nonprofit arts institutions aswell as block grants to states. Within 15 years of the formation of the NEA, everystate had established an arts agency, which in turn spawned more than 3,000local arts councils, some of which were organized as units of local government,but most of which became private nonprofit organizations.
GREATER DIVERSITY AND PARTICIPATION
The transformation of the live performing arts sector—primarily the high arts—that was sparked by these developments took several forms: the number, geo-graphic dispersion, and diversity of nonprofit organizations increased severalfold; the amount of financial support for the nonprofit arts increased dramati-cally and came from an increasingly diverse array of sources; and the nonprofitform became the dominant organizational mode in supplying the live high artsto Americans.
This dramatic increase in the supply of nonprofit arts institutions also sparkedcorresponding increases in arts participation, which were not restricted to at-tendance but included a resurgence of amateur “hands-on” participation in allof the performing arts (Toffler, 1964). As was true of an earlier era, this surge inparticipation was supported by the social and economic changes under way inAmerica: increasing prosperity, rising education levels, expanded leisure time,and the arrival of the baby boomers on college campuses were the drivingforces behind the emergence of a new arts generation. The availability of newconservatories and college programs devoted to the development of artistsswelled the ranks of highly trained creators and performers, some of whom suc-ceeded as professionals but many of whom entered other careers and chose topursue their art as a leisure activity.
This growing market for the high arts, however, continued to come from arather narrow band of society—what Toffler (1964) refers to as the “comfortclasses.” The vast majority of Americans still sought their arts and entertain-ment from commercial sources, which continued to flourish by providing agrowing variety of popular products to expanding national and internationalmarkets. Indeed, continued technological advances increased the sophistica-tion and range of products the commercial sector produced and thus the com-

Historical Background 15
plexity of its delivery system. This expansion in scale and scope increased boththe costs and the rewards available in the commercial sector (Vogel, 1998).Folk-art forms also flourished but continued to be practiced by artists and smallgroups that operated primarily in the volunteer sector.
A REALIGNMENT IN THE PERFORMING ARTS SYSTEM
The next major realignment in the support structure for the arts appears to betaking place now, as a result of changes that have been occurring over the last10 to 15 years. In the past decade, the leveraged funding paradigm has proveddifficult to sustain. Political controversy has reduced federal funding of the arts.The economic recession of the early 1990s also affected private funding pat-terns as corporate sponsors moved away from unrestricted grants (Cobb, 1996)and foundations became increasingly concerned about the broader benefits oftheir grants (Renz and Lawrence, 1998). Although individual contributions rosethroughout the 1990s, such growth has institutional costs and may not be sus-tainable.
The stark distinctions that used to exist between the commercial, nonprofit,and volunteer sectors (and the implicit superiority of the nonprofit sector) arealso becoming blurred: organizational “hybrids” straddle both sectors andAmericans enjoy their arts experiences in many environments both within andoutside the marketplace. Rather than being viewed as separate and distinct,these three sectors are increasingly viewed as different elements of a diversifiedarts environment. Indeed, the different functions these sectors perform are in-creasingly considered complementary rather than competitive (DiMaggio,1991). Much attention is being paid to collaboration and the transfer of ideas,functions, and resources—including artists—across sectors. For example, thenonprofit sector is widely perceived as a training ground for artists and a sourceof research and development (R&D) for the commercial sector by providing atestbed for new works and new performers.
The policy concerns of these different sectors, although still distinguishable,have also begun to overlap in such areas as copyright, intellectual property,trade agreements, and a host of other issues raised by technological develop-ments and consolidations within the communications industry. At the sametime, the public debate on arts policy has shifted away from an exclusive focuson public funding for the nonprofit sector and toward a more general concernwith the public purposes of the arts and how each sector of the performing artsworld promotes those benefits (American Assembly, 1997). In the process, non-profit arts organizations have given greater priority to a broader set of missions,including more active public participation in all forms of the performing arts.

16 The Performing Arts in a New Era
In keeping with this broader, system-wide perspective toward the arts is a lesshierarchical view of their value. It is now more commonly assumed that apluralistic democratic society should foster artistic activities that reflect the in-terests and aesthetic tastes of the entire population rather than the culturalleadership of a particular group. Performing in amateur productions in localcommunity settings, for example, is now acknowledged by many to be as im-portant a form of participation as attending a top-quality professional perfor-mance.
These changes have their roots in the broad sociodemographic, economic, andpolitical forces that are transforming American society today, such as thegrowing diversity of the American population, shifts in cultural consumptionresulting from changing lifestyles, and a political climate that is promotingsmaller government and greater emphasis on privatization and market-oriented approaches for all types of organizations. How are these trends affect-ing the performing arts today? How are changes in demand and funding pat-terns affecting arts organizations and with what implications for availability andquality of the arts? The analysis we present in the following chapters will helpanswer these questions.
17
Chapter Four
AUDIENCES FOR THE PERFORMING ARTS
The future of the performing arts will be shaped by many factors, but perhapsnone is more important than the future structure of demand. As Chapter Threenoted, the size and shape of the market for the performing arts has changedover time—reflecting shifts in demand that are stimulated by technologicalchange as well as social, demographic, and economic trends in American soci-ety. This chapter focuses on the demand for performing arts today. After a briefdiscussion of concepts used to define and measure demand and the data avail-able, we address three questions: (1) What does the demand for the performingarts look like now? (2) How has that demand been changing? (3) What issuesare these changes likely to pose for the future?
KEY CONCEPTS
Public involvement in the performing arts takes several different forms. Indi-viduals may be involved as producers (at an amateur or professional level), asconsumers (by attending a live performance or listening or watching a recordedperformance), and as supporters (by donating time or money to arts organiza-tions) (Balfe and Peters, 2000). Although individuals who are involved in oneform may also be involved in another, demand for the performing arts is typi-cally gauged by examining patterns of consumption—which are most fre-quently measured in terms of participation in the performing arts.
Despite the fact that consumption of the performing arts is sometimes equatedwith attending a performance, people can in fact experience the performingarts in several different ways. Some people may be directly involved in a“hands-on” way by playing an instrument or singing in a choir.1 For others,consumption means attending a live performance. Still others listen to a
______________ 1We classify “hands-on” involvement here as a form of consumption rather than of production todistinguish between those who play an instrument as a hobby and those who perform in publicwhether on a paid or volunteer basis.

18 The Performing Arts in a New Era
recording or watch a play on television. These different forms of involvementare important because the empirical literature demonstrates that the level ofdemand for the performing arts differs, often dramatically, depending upon theart form and how individuals choose to experience it. Indeed, consumption ofthe performing arts through the media is more prevalent than attendance at liveperformances, and many more people participate through their attendancethan by engaging in the arts in a hands-on manner (NEA, 1998a; Americans forthe Arts, 1996).
The empirical literature on the performing arts routinely describes demandpatterns in terms of three different elements: the level of participation, thecharacteristics of participants, and the factors that influence participation.
Levels of Participation
Three different metrics are used to measure levels of participation:
• absolute level of consumption, typically measured in terms of the totalamount of participation, e.g., total attendance levels
• rate of participation during a given period, typically reported as a percent-age of the population (or subpopulations) who participate
• frequency of participation among those who actually participate, such asthe average number of performances attended in the last year.
These different measures are related because changes in the overall level ofconsumption can be expressed as the product of the number of participantsand the average frequency of participation. Moreover, changes in the numberof participants, when expressed as a participation rate, may be due either to achange in behavior (a higher participation rate) or to a change in the size orcomposition of the population.
In fact, changes in total consumption levels may be due to any one of four dif-ferent factors: changes in the size of the population, changes in the compositionof the population, changes in the rate of participation among specific sub-groups of the population, and changes in the frequency of participation for asubgroup. Understanding these distinctions is important because the conclu-sions one draws about how and why consumption patterns may be changingwill differ depending upon the mechanism that is driving the change.
Changes due to growth in the size or composition of the population do not rep-resent behavioral change but are by-products of broader population shifts. Butchanges due to participation rates indicate that the fraction of the populationparticipating in the arts has itself changed. Changes due to increasing fre-

Audiences for the Performing Arts 19
quency of participation suggest not that more people have become involved inthe arts but that current participants have changed their behavior. Because allthese factors are likely to come into play, it is useful to understand these dis-tinctions when attempting to understand changes in participation patterns.
Characteristics of Participants
In addition to understanding how levels of demand vary across forms of partic-ipation and discipline, it is also important to identify the sociodemographic andother characteristics associated with participation. Historically, education hasproven to be the single best predictor of participation in the high arts, butstudies have demonstrated that a variety of other attributes are also correlatedwith arts involvement (McCarthy et al., 2001).
Factors That Influence Participation
Finally, a number of factors influence patterns of demand in the aggregate. Al-though most empirical studies focus on who participates rather than why theyparticipate, the following factors have been used to explain changes in partici-pation patterns:
• sociodemographic changes, e.g., changes in the size and composition of thepopulation
• changes in tastes, e.g., preferences for the arts and art forms
• changes in such practical considerations as the supply of artistic events andproducts, their cost, the availability of leisure time, income levels, and dis-semination of information about the arts
• changes in the stock of individual experience with the arts (arts education,prior experience, knowledge).
SOURCES OF DATA
Two principal types of empirical data can be used to describe patterns of de-mand in the performing arts: survey data collected from representative samplesof the population and aggregate attendance data on arts consumption based onadministrative records. Survey data are collected in individual interviews andtypically include information on the extent and types of individual involvementas well as on the social and economic characteristics of the individuals who aresurveyed. The two major sources of these data are the Survey of Public Partici-pation in the Arts (SPPA) sponsored by the National Endowment for the Arts(NEA, 1998a) and the Harris poll surveys conducted for Americans for the Arts

20 The Performing Arts in a New Era
(Americans for the Arts, 1996). Each of these surveys has been conducted atmore or less regular intervals and can be used to describe how participationpatterns have been changing over time.
However, there are problems in estimating levels of participation using thesedata. Differences in questionnaire wording between the SPPA and Harris data,for example, limit the comparability of estimates between these two sources(Tepper, 1998, Robinson, 1989).2 Moreover, because neither survey identifiesthe sector in which individuals participate, it is impossible to estimate directlyhow participation rates vary among the commercial, nonprofit, and volunteersectors. Finally, changes in survey methods and a much higher refusal rate inthe most recent SPPA make it difficult to compare the estimates based on themost recent data with those from earlier surveys (NEA, 1998a).
Administrative data collected by the national arts service organizations (NSOs)provide another source of data on consumption patterns. These data, typicallycollected on an annual basis, contain aggregate attendance figures for specificart forms and can be used to monitor how attendance patterns for specific dis-ciplines change over time. Moreover, because membership in specific serviceagencies tends to be sector specific,3 these data can be used to estimate atten-dance separately for the commercial and nonprofit sectors—although generallynot for the volunteer sector.
However, there are several difficulties with these administrative data. First, theyare not generally publicly available. Second, the classifications used to presentthem often change, making it difficult to analyze trends over time and acrossdisciplines. Finally, because the data are provided on a voluntary basis by indi-vidual arts organizations, the number of organizations reporting often changes.Thus, it is impossible to distinguish whether changes in the aggregate atten-dance data are a result of changes in the number of organizations reporting orchanges in total attendance patterns.
CURRENT PATTERNS OF DEMAND
Levels of Participation
As the historical review suggested, the performing arts are a popular leisure-time activity in America. According to the most recent survey of arts participa-tion, about 42 percent of all Americans attended a performance in one of the
______________ 2The Harris polls, for example, ask whether individuals have ever participated in the arts, whereasthe SPPA asks about participation in the last year. In addition, the Harris data make no distinctionbetween levels of participation, whereas the SPPA data do.3That is, commercial and nonprofit organizations generally belong to different service agencies.
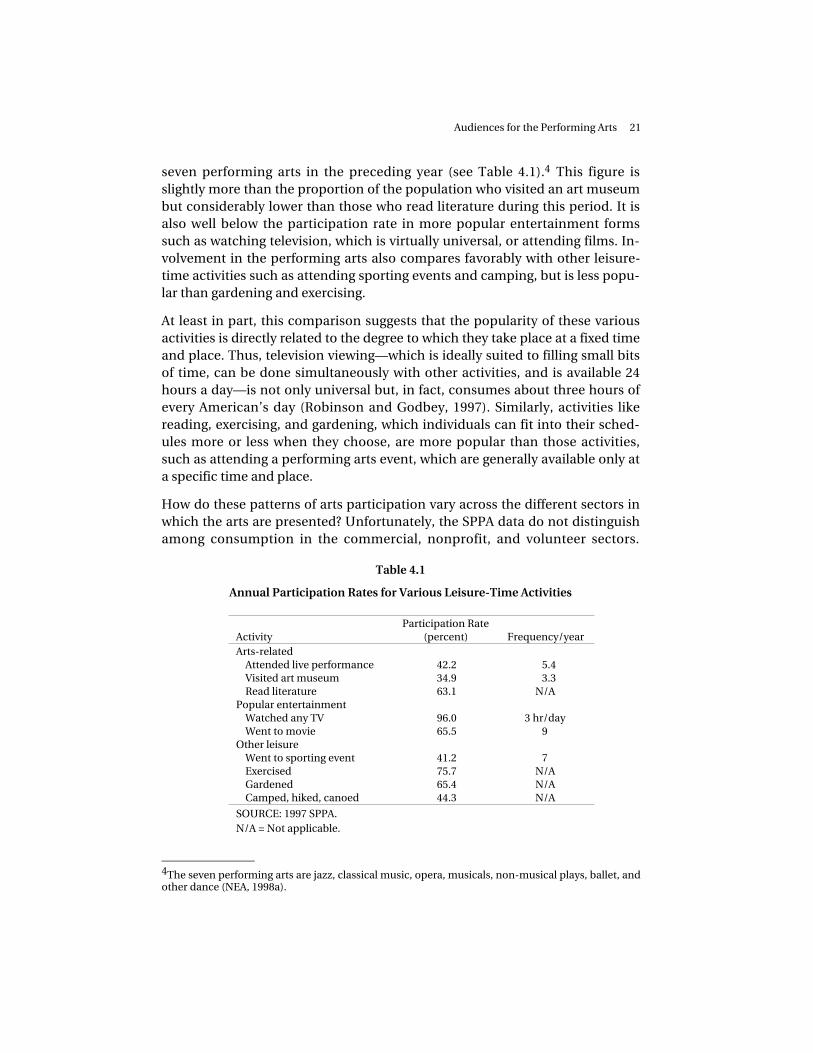
Audiences for the Performing Arts 21
seven performing arts in the preceding year (see Table 4.1).4 This figure isslightly more than the proportion of the population who visited an art museumbut considerably lower than those who read literature during this period. It isalso well below the participation rate in more popular entertainment formssuch as watching television, which is virtually universal, or attending films. In-volvement in the performing arts also compares favorably with other leisure-time activities such as attending sporting events and camping, but is less popu-lar than gardening and exercising.
At least in part, this comparison suggests that the popularity of these variousactivities is directly related to the degree to which they take place at a fixed timeand place. Thus, television viewing—which is ideally suited to filling small bitsof time, can be done simultaneously with other activities, and is available 24hours a day—is not only universal but, in fact, consumes about three hours ofevery American’s day (Robinson and Godbey, 1997). Similarly, activities likereading, exercising, and gardening, which individuals can fit into their sched-ules more or less when they choose, are more popular than those activities,such as attending a performing arts event, which are generally available only ata specific time and place.
How do these patterns of arts participation vary across the different sectors inwhich the arts are presented? Unfortunately, the SPPA data do not distinguishamong consumption in the commercial, nonprofit, and volunteer sectors.
Table 4.1
Annual Participation Rates for Various Leisure-Time Activities
ActivityParticipation Rate
(percent) Frequency/yearArts-related
Attended live performance 42.2 5.4Visited art museum 34.9 3.3Read literature 63.1 N/A
Popular entertainmentWatched any TV 96.0 3 hr/dayWent to movie 65.5 9
Other leisureWent to sporting event 41.2 7Exercised 75.7 N/AGardened 65.4 N/ACamped, hiked, canoed 44.3 N/A
SOURCE: 1997 SPPA.N/A = Not applicable.
______________ 4The seven performing arts are jazz, classical music, opera, musicals, non-musical plays, ballet, andother dance (NEA, 1998a).

22 The Performing Arts in a New Era
However, as we will demonstrate in Chapter Six, with the exception of theater,the live performing arts are principally distributed in the nonprofit sector,whereas the reproduced arts are principally distributed through the commer-cial sector. Moreover, hands-on involvement in the arts at an amateur levelprincipally takes place in the volunteer sector. Thus, sorting the reported levelsof participation in the SPPA by form of involvement may be suggestive as to thelevels of public participation by sector.
In this context, it is interesting to note that the 42 percent attendance rate inTable 4.1 compares with a participation rate of 78 percent of the populationwho listened or watched one of the seven performing arts in recorded form andthe 67 percent personal or hands-on participation rate.5 Moreover, the veryhigh participation rates for television viewing and going to movies reflect thefact that the commercial performing-arts market is substantially larger than thenonprofit high-arts market.
Patterns of consumption of the performing arts vary not only by form of partic-ipation but also by discipline. Indeed, as Figure 4.1 indicates, participation rates(in whatever form) are lowest for opera and ballet, intermediate for classicalmusic and jazz, and highest for theater and musicals. It is also interesting tonote here that although participation rates for the performing arts as a wholeexceed those for the visual arts, the participation rates for the visual arts for alltypes of involvement are higher than those for any single one of the performingarts.
Who Participates?
Education is by far the most powerful predictor of participation in the perform-ing arts. Individuals with higher levels of education—especially college andgraduate degrees—have much higher participation rates than others. This istrue for each of the different forms of participation (see Figure 4.2).6 The influ-ence of education on participation, however, is not equal across all forms ofparticipation. It is most pronounced among those who participate by attendingthe performing arts, somewhat less evident among those who participatethrough the media, and least pronounced among those who “do” art.
It is not entirely clear what drives this education effect. More highly educatedindividuals are more likely than others to have been exposed to the arts by
______________ 5The rate of personal participation is not limited to the performing arts but also includes such activ-ities as writing, painting, sewing, etc. Thus, it is not directly comparable with the attendance andmedia rates. All three of these rates are based on 1997 SPPA data (NEA, 1998a).6The effects of education on participation can also be observed across all disciplines (NEA, 1998a;Deveaux, 1994; Holak et al., 1986; Keegan, 1987; Lemmons, 1966).

Audiences for the Performing Arts 23
0
5
10
15
20
25
30
35
40
45
50
Discipline
Media
Attending
Doing
Opera Ballet Jazz Classicalmusic
Theater Musicals Visualarts
Par
ticip
atio
n ra
te (
%)
RAND MR1367-4.1
SOURCE: NEA, Survey of Public Participation in the Arts, 1997.
Figure 4.1—Rates of Participation in the Arts, by Discipline
family members during their childhood and to have taken courses in the artsduring their schooling. This early exposure to the arts is important because fa-miliarity and knowledge of the arts are directly related to participation rates(Orend and Keegan, 1996), as they are to most other types of leisure activity(Kelly and Freysinger, 2000). Indeed, Orend and Keegan find that arts apprecia-tion classes taken during college have an even stronger effect on subsequentparticipation than those taken earlier. Education also helps individuals developskill in dealing with the abstract—a skill that is useful for appreciating the arts(Toffler, 1964).7
However, because education seems to be more closely correlated with atten-dance than other forms of participation and attendance is the most social formof arts participation, more highly educated people may be more interested inthe social dimensions of participation than are others. This correlation may
______________ 7Another possible explanation for this education effect is that it is really a by-product of the higherincomes associated with higher education levels because participation rates also tend to increasewith income. However, studies indicate that after controlling for education, the association be-tween participation and income is substantially reduced, indicating that education rather than in-come is the more important factor (Robinson et al., 1985; Robinson, 1993).

24 The Performing Arts in a New Era
0
10
20
30
40
50
60
70
Doing Attending Media
Ann
ual p
artic
ipat
ion
rate
(%
)
Grade school
Some high school
High school graduate
Some college
College graduate
Graduate school
RAND MR1367-4.2
SOURCE: NEA, Survey of Public Participation in the Arts, 1997.
Figure 4.2—Education as a Correlate of Attendance
reflect a greater concern with the prestige attached to the arts or thedocumented tendency of the better educated to join a variety of associations oflike-minded individuals—in this case, arts appreciators (Putnam, 2000).
The findings for other socioeconomic factors are more ambiguous. While gen-der (more women than men participate) and age also matter, they are less im-portant than education. The effects of age, unlike education, appear to be mostpronounced for hands-on participation, which is much more prevalent atyounger ages (Peters and Cherbo, 1996). But rates of attendance and participa-tion through the media do not vary significantly with age, after controlling forother factors—except for those over age 65. Other factors (e.g., marital status,political ideology, religion, income, and race) are generally not important aftercontrolling for education.
In addition to sociodemographic variables, the literature also examines the re-lationship between participation and other background factors such as arts ed-ucation and exposure to the arts as a child (Bergonzi and Smith, 1996; Orendand Keegan, 1996). These factors have been shown to be strongly associatedwith increases in attendance at live performances and in listening or watchingrecorded performances, and in the frequency with which individuals are in-volved in both of these activities. Moreover, these effects appear to hold evenafter controlling for levels of education. Indeed, Orend and Keegan suggest that

Audiences for the Performing Arts 25
the effects of arts socialization (in the form of both arts education classes andmore general exposure to the arts) are particularly important in explainingdifferences in participation rates among the less well educated.
Finally, studies of the frequency with which the population participates in theperforming arts suggest that the distribution of participation is highly skewed: Arelatively small percentage of total attendees account for the vast majority of allvisits. Indeed, those involved with the arts can generally be sorted into threecategories: those who rarely, if ever, attend; those who infrequently attend; andthose who are frequent attenders.8
The literature offers two slightly different explanations for this phenomenon.The economics literature, for example, suggests that the more knowledgeablepeople are about the arts, the more likely they are to participate, because theygain more satisfaction from a given level of consumption than do people whoare less knowledgeable (Stigler and Becker, 1977). The leisure literature, on theother hand, tends to view this phenomenon more in psychological terms: Asmall fraction of the participants in leisure activities become serious“amateurs” for whom the activity becomes an end in itself (Stebbins, 1992). AsKelly and Freysinger (2000) point out, this phenomenon is common to a widerange of leisure activities in which there is a progression in commitment to theactivity. In either case, this phenomenon helps to explain why the term“addiction” is sometimes used to describe the attraction of art lovers to the arts.
Why Do They Participate?
To understand the motivations for participation, three questions must be ad-dressed. Why do people participate in the arts (rather than other leisure activi-ties)? Why do they choose to become involved in different ways (doing, attend-ing, or through the media)? And why do they choose specific art forms ordisciplines? Each of these questions addresses a different aspect of demand.The first relates to the overall level of demand and the others refer to the waysthat demand is distributed by form of participation (and thus sector) anddiscipline. Although a substantial literature addresses the first question, thelatter two questions are rarely addressed.
By and large, studies of participants’ motivations focus on the reasons individ-uals give for their decisions to attend or not attend performances (Ford, 1974;NEA, 1998a; Robinson, 1993). These studies highlight a variety of practical and
______________ 8The most comprehensive analysis of this phenomenon was conducted by Schuster (1991) for mu-seum attendance. However, it has also been noted by Robinson et al. (1985) and Robinson (1993)for the performing arts. Orend and Keegan (1996) report a similar distinction in their comparisonsof both attendance and participation through the media.

26 The Performing Arts in a New Era
contextual factors—e.g., costs, availability, information, scheduling—that driveindividual decisions but do not really explain why, in the aggregate, levels ofdemand change. Studies seeking to explain shifts in the overall level of demand,on the other hand, focus on factors that drive demand at the aggregate level.Four sets of factors, in particular, have been used to explain changes in overalldemand: changes in the size and composition of the population; changes inpeoples’ taste for the arts; changes in practical factors such as availability,income, prices, and time that affect individuals’ ability to pursue theirpreferences for the arts; and changes in the stock of knowledge about the arts.Such factors have been shown to affect participation in expected ways. Forexample, arts participation should increase as the population grows, aseducation levels increase, as the arts become more available or less expensiverelative to alternative leisure pursuits, and as more people have exposure to thearts as children or in school.
Understanding the dynamic behind changes in tastes is less straightforward be-cause it relates to a question that is not typically addressed in the literature:What are the underlying determinants of individual tastes? Individuals’ prefer-ences for the arts are typically assumed to be a function of their characteristics,such as education and income. Thus, changes in tastes are typically attributedto shifts in the composition of the population.
Even if we could predict the aggregate level of demand for the performing arts,however, we would not necessarily know how that demand will be distributedacross sectors or particular art forms. To answer these questions we need toknow why individuals choose to participate in the arts in different ways—an is-sue that has not been given much attention in the literature.
In considering the ways in which individuals choose to participate (and thusdemand by market sector), Kelly and Freysinger (2000) have suggested that itmay be useful to consider two different dimensions of individuals’ choices: Areparticipants seeking entertainment or fulfillment? Do they prefer to participatealone or with others? Although this framework has not been subject to empiri-cal testing, it suggests that combining these two dimensions can provide aframework for distinguishing among different types of art consumers (see Fig-ure 4.3). Among those who are primarily seeking entertainment, individualswho are self-focused will be inclined to participate through the media, whilethose who are looking for a social experience will be casual attendees. For thoseprimarily seeking enrichment, the self-focused participants will be inclined tohands-on participation, while those preferring to participate in groups will be“aficionado attendees.”
Consumers falling into a particular cell of this classification scheme are notprecluded from participating in the arts in other ways, since consumers whose

Audiences for the Performing Arts 27
RAND MR1367-4.3
HowEntertainment
Media
Attend(casual)
Self-focused
Social
Fulfillment
Doing
Attend(aficionado)
Why
Figure 4.3—Explaining Participation Preferences
primary mode of participation is through the media may also attend liveperformances, as will those who “do” art. Moreover, regardless of how theychoose to participate, individuals may choose from a wide variety of art forms,including both the high and the popular arts. This schema not only recognizesthat the motivations for participating in the arts differ but, by recognizing thatthese motivations will influence the form that participation takes, provides auseful device for segmenting that demand. Participation through the media orrecorded arts, for example, not only is the most popular form of participation, itis also most likely to occur in the commercial sector where the recorded arts aremost likely to be distributed. Participation by doing, on the other hand, is morelikely to occur in the volunteer sector.
The market for the live performing arts, which are typically produced in thenonprofit sector, consists of two distinct groups of consumers: those who arecasual attendees and those who are aficionados, or enthusiastic fans of the arts.The former differ from the latter not only in their motivations but also in theirnumbers, their knowledge of the arts, and, in all probability, their tastes. Theaficionados are the frequent attendees discussed above: a small and selectgroup who are likely to be knowledgeable and interested in a diverse array ofcontent and the aesthetics of the art experience. In contrast, the casualattendees are likely to be far more numerous, less interested in the art form perse, and more likely to be attracted to more traditional fare. By identifying howmotivations affect the structure of demand, this schema provides a basis forsuggesting why these patterns may change in the future.
Very little is known about why arts participants choose one art form over an-other. The literature on individual motivations indicates that interest in thematerial programmed is a relatively important factor in the decision to attendspecific performances (Ford Foundation, 1974), but this fact does not explainwhy individuals prefer one art form to another. An individual’s ability to tailorhis or her participation according to his or her own schedule and tastes, as wesuggested above, may also play a role. The fact that attendance at art museums

28 The Performing Arts in a New Era
is greater than attendance at any of the performing arts may in part be due tothis phenomenon. How relevant the programmed material is to the participantis also likely to play a role, but this connection has not been researched.
KEY TRENDS
More Attendees but Stable Rates of Attendance
Despite the fact that total attendance at live performances has been increasing,rates of attendance (the percentage of the population attending performances)have mostly been stable. The most recent SPPA data indicate, for example, thattotal attendance at live performances increased 4–16 percent between 1982and 1997 (see Figure 4.4).9 This increase is evident among all the liveperforming arts—although the extent of the increase differs. The vast majorityof the increase occurred between 1992 and 1997. However, changes in survey
0
2
4
6
8
10
12
14
16
18
Opera Ballet Jazz Classical music Theater Musicals
1982–1992
1982–1997
Discipline
Per
cent
age
chan
ge in
atte
ndan
ce
RAND MR1367-4.4
SOURCE: NEA, Survey of Public Participation in the Arts, 1982, 1992, 1997.
Figure 4.4—Gains in Attendance by Discipline, 1982–1997
______________ 9The estimates reported in this section are based on SPPA surveys. Participation is defined as “(1)attending a performance or visiting an art museum or gallery (attendance); (2) listening or watchingan arts performance or program on radio, television, video cassette or disk, phonograph record,tape recording, compact disk, or personal computer (participation via media); (3) performing art foroneself or in public or creating a work of art for oneself or for exhibition to the public (personal par-ticipation).” The attendance figures exclude elementary, middle, or high school performances. Re-spondents supply their own definitions of art and artistic disciplines (NEA, 1998a, p. 12).

Audiences for the Performing Arts 29
procedures and a much higher refusal rate in the 1997 survey cast the size ofthis increase into doubt—it is not clear how much of this increase is a result ofchanged survey procedures and how much represents true behavioral change(NEA, 1998a).10
Moreover, as we noted in the introduction to this chapter, increases in total at-tendance levels may be due to any one of four factors: changes in the size andcomposition of the population, changes in rate of participation, and changes inthe frequency of attendance among participants. Unfortunately, the frequencydata from the 1997 SPPA survey are not directly comparable with earlier data, sowe cannot determine how much of the change in total attendance results fromchanges in the frequency with which participants attended the live performingarts.
We can, however, identify the effects of population growth and increasing edu-cation levels on total attendance.11 As Figure 4.5 indicates, most of the increasein attendance between 1982 and 1997 was the result of population growth andincreasing education levels—not an increase in the rate at which people partic-ipate in the arts. Indeed, between 1982 and 1992, attendance ratios actuallywent down for all six of the disciplines examined.12 Thus, although total atten-dance has been rising, the rate of attendance at live performances has mostlybeen stable. If these trends continue, slower population growth and shifts in thecomposition of the population (both of which can be expected) could eventu-ally produce a drop in total attendance.
Increases in the supply and geographic availability of the live performing artshave also played a role in the absolute increase in attendance levels. As noted inthe prior section, the resurgence in the live performing arts initially triggered bythe Ford Foundation’s investment in the arts produced a dramatic increase inthe number and geographic dispersion of live arts performances.13
______________ 10Of these two factors, the increase in the refusal rate is probably the most important. The earlierSPPA surveys were administered as a supplement to a Crime Victimization Survey and this appearsto have elicited the cooperation of a broader cross-section of respondents, whereas the 1997 surveywas administered as a separate instrument and, as a result, appears to have resulted in a higher re-sponse rate by individuals who were arts participants.11In other words, changes in total attendance levels can be disaggregated into changes in the size ofthe total population, changes in the proportion of the population in particular educational cate-gories, and changes in the attendance rates within each of these educational categories.12That is, the changes in total arts attendance between 1982 and 1992 were due exclusively topopulation growth and increasing education levels; the rates at which different education groupsattended declined during this period.13The increase in the geographic distribution of the live performing arts is documented in NEA(1998a). The increase in the number of performances is discussed in general terms in Kreidler(1996). In addition, data reported by the various arts service organizations indicate that between1985 and 1995, the number of symphonic performances, for example, increased by 50 percent.

30 The Performing Arts in a New Era
0
5
10
15
20
25
30
35
Opera Ballet Jazz Classical music Theater Musicals Museums
Discipline
Participation rate
Composition of population
Size of population
Co
mp
osi
tion
of
cha
ng
e (
%)
RAND MR1367-4.5
SOURCE: NEA, Survey of Public Participation in the Arts, 1982 and 1997.
Figure 4.5—Composition of Change in Attendance by Discipline, 1982–1997
Why this increase in availability was not matched by a corresponding increasein attendance rates is not altogether clear. Among the potential contributingfactors are increasing competition from other leisure activities, increasing ticketprices, and changing leisure patterns, as we discuss later in this section.
Another possible factor, which has not been adequately researched, is arts edu-cation. As we have already noted, arts education seems to play a crucial role increating audiences for the arts. However, we have very little good informationon patterns of arts education and how they may have been changing. Arts edu-cation, for example, may take several different forms depending upon the pur-pose and level of the instruction. Although a good deal of artistic instructiontakes place in private lessons outside school, many elementary and secondaryschools provide music, dancing, and acting lessons as a way of introducing stu-dents to the arts. Some of those who take these lessons later pursue additionaltraining at higher levels on a vocational or avocational basis. In addition, manyschools and institutions of higher learning offer arts appreciation courses, andsome educational institutions train arts teachers. Although the SPPA (and otherparticipation surveys) provides information on individuals’ arts educationexperiences, very little systematic research appears to have been done on thesuppliers of arts education beyond studies of arts education in the primary andsecondary schools. The evidence that does exist suggests that although the fre-

Audiences for the Performing Arts 31
quency of arts education in the schools may have increased slightly between1962 and 1989, the amount of class time devoted to it has actually declined(Leonhard, 1991). It is also clear that school-based arts education programs aremuch more prevalent for music and the visual arts than they are for theater ordance—a factor that may contribute to the differential popularity of these artforms. We also know that arts education programs are much more prevalent inlarge schools than small schools. Unfortunately, we have no comprehensivedata on what has been happening to such programs since 1990.
Growing Participation Through the Media
In contrast to the stability of attendance rates, participation through the mediahas been increasing dramatically in practically every discipline. Figure 4.6shows the percentage point difference in media and live attendance rates in1982, 1992, and 1997. To take the example of classical music, the figure showsthat in 1982 participation through the media was 7 percentage points higherthan attendance rates; by 1997 that gap was over 25 percent—an increase ofnearly 20 percentage points. In all cases, media consumption has increased inthe 1992–1997 period. Although the trend from 1982 to 1992 is more ambigu-ous, it still tends to favor media participation.
–5
0
5
10
15
20
25
30
Opera Jazz Classical music Theater Musicals Visual arts
1982
1992
1997
Discipline
Per
cent
age
diffe
renc
e be
twee
n m
edia
and
atte
ndin
g
RAND MR1367-4.6
SOURCE: NEA, Survey of Public Participation in the Arts, 1982, 1992, and 1997.
Figure 4.6—Growth of Participation in the Arts Through the Media, 1982–1997

32 The Performing Arts in a New Era
Besides the obvious explanation that the quality of electronically reproducedsubstitutes for the performing arts has increased dramatically, we can also ex-plain this trend as a function of the rising relative price of attending a live per-formance. Two factors drive this price. The first is the direct cost of attending,e.g., ticket prices, transportation, and childcare. From 1980 to 1995, the realprice of entertainment services rose 28 percent more than did the ConsumerPrice Index. The second is the opportunity cost of attending the live performingarts, which is a time-intensive activity.
The opportunity costs of attending live performances might be greater thanwatching or listening to the same program through the media for three reasons.First, attending a live event typically includes preparation and travel time that arecorded performance does not. Second, individuals can often choose to expe-rience a recorded performance in more than one sitting. Finally, and probablymore important, unlike a live performance which takes place at a specific timeand place, individuals can often choose when and where they want to experi-ence a recorded performance.
Of course, a central question about the growing popularity of participationthrough the media is the degree to which individuals view recorded and liveperformances as substitutes. Certainly, many arts enthusiasts maintain thatthey are not comparable experiences despite improvements in recording tech-nology. Moreover, as we suggested above, watching or listening to a recordedperformance at home lacks the social dimension that motivates many individ-uals to attend live performances. Unfortunately, without a better understandingof why individuals choose to participate in the arts in one form rather than an-other, we cannot really answer that question.
We do know, however, that there is much less crossover among forms of partic-ipation than we might expect. Crossover effects in arts participation could comeabout in one of two ways: (1) a person who takes part in the arts through oneform of participation may be more inclined to take part through another form—e.g., if he participates through the media (say, watches a program on television),he may be more apt to attend a live arts performance; and (2) a person whoparticipates in a particular type of art may be more inclined to participate inanother—e.g., if she attends live symphony performances, she may be morelikely to attend musicals. In a major study of crossover effects in the arts, Love(1995) argues that crossover effects are more the exception than the rule—suggesting that these different forms of participation appeal to differentaudiences.14
______________ 14It should be noted, however, that the structure of these comparisons may have influenced thisresult. Love compared the percentage of people who participated in the more frequent activity(participation through the media) with those who also attended live performances and found a low

Audiences for the Performing Arts 33
Consumer Desire for Greater Flexibility
The two prior trends are symptomatic of a third: Americans appear to be plac-ing an increasing premium on flexibility in their consumption of the arts. Thatis, they will tend to favor art forms and modes of participation that allow themto determine what they consume, when they consume it, and how they con-sume it—sometimes referred to as “consumption by appointment.” Thus, me-dia consumption may well dominate attendance because it is more amenableto the individual’s schedule. Similarly, art forms that allow individuals to decideexactly what and how much they consume will be more popular than those thatdo not. This point is consistent with trends in live attendance from 1982 to 1997in different disciplines. The rate of growth of art museum attendance, for ex-ample, has outstripped that of all the performing arts throughout this period.
A major reason for this pattern may well be the changing availability of leisuretime in American society. Although the growth in leisure time that Americansenjoyed for much of the 20th century has reversed for some segments of thepopulation, it is unclear whether this is true for Americans in general. Robinsonand Godbey (1997), for example, argue that with a few notable exceptions,Americans have at least as much leisure time as in the past. Schor (1991) arguesthe reverse. Most observers agree, however, that as a result of irregular workingschedules the structure of free time has become increasingly fragmented—especially for the more highly educated who are the heaviest consumers of thearts. The perception of reduced leisure time and the increasingly home-centered focus of leisure activities have no doubt increased the competitionthat live performances face from other leisure-time pursuits (Putnam, 2000).
FUTURE ISSUES
The key question for the future is how demand will change, both in the aggre-gate and in terms of the different market segments we identified above.
Demographic Changes
Improvements in education levels that have marked the past 30 years can beexpected to continue, although in all likelihood at a slower rate. This trendbodes well for the performing arts. The aging of the population associated withthe maturation of the baby boomers may also play a role in influencing future
_______________________________________________________________________ correlation. The results might have been somewhat different had he focused on the percentage ofpeople in the less frequent activity (attending live performances) who also participated through themedia.

34 The Performing Arts in a New Era
patterns of demand, but its effects are less clear. Age can affect participationpatterns in two ways. First, participation patterns change as people get older.Age matters most for direct or hands-on participation, in which younger adultsare substantially more likely to participate than others (Peters and Cherbo,1996). Its effects on participation through the media and attendance at live per-formances are not particularly pronounced until after 65, when all forms ofparticipation drop markedly.
Second, behavior changes not only as people age but as they are replaced in thepopulation by younger cohorts. Some studies suggest that the rate of artsparticipation among the later cohorts of the baby boom is substantially lowerthan that of their parents (Peterson et al., 1999). If this pattern persists as thesecohorts approach middle age, it may not bode well for future participation inthe performing arts. A second cohort effect relates to the ways in which thepopulation will participate in the arts. Today’s youth, for example, are muchmore comfortable with computers, VCRs, and other technologies than are theirparents. When they reach the prime arts-consumption years, they will be morelikely than their predecessors to rely on the media and Web-based entertain-ment.
A third demographic change that we can expect will occur in the ethnic com-position of the population. Currently, close to 40 percent of America’s totalpopulation growth is attributable to immigration (McCarthy and Vernez, 1996).If this trend continues, as we anticipate, it will increase the ethnic diversifica-tion of the population. And although ethnicity is only one factor influencingartistic tastes, increasing ethnic diversification could spur demand for a greatervariety of art forms and styles by expanding existing markets and exposing thewider population to a greater variety of artistic styles, just as it has diversifiedAmerican cuisine.
Economic Changes
In addition to these demographic changes, rising income levels and changingleisure patterns can also be expected to affect the demand for the performingarts. Dramatic increases in women’s labor force participation and educationlevels, combined with recent improvements in productivity, have produced asustained rise in Americans’ disposable incomes. Ordinarily, one would expecthigher incomes to spur demand for art since rising incomes enable participantsto spend more on the arts. The net effects of rising incomes may, however, bepartly offset by the fact that as wage rates increase, people’s time becomes morevaluable and they tend to become more sensitive to how their leisure activitiesfit with their schedules and their available free time. This effect, referred to asthe opportunity costs of rising incomes, may well have less influence on overall

Audiences for the Performing Arts 35
demand than on how individuals choose to participate in the arts. The risingopportunity cost of time is likely to intensify the preference for flexible activitiesthat can be tailored to individual schedules and tastes. This phenomenonwould appear to favor consumption through the media rather than attendance.Indeed, if Americans’ leisure time continues to shrink and become more frag-mented, this trend will intensify.
The Role of Technology
Technology will also play a role in shaping future demand for the arts. Contin-ued advances in e-commerce and digital technology seem likely to affect futuredemand in two ways. First, they will allow individuals to increasingly personal-ize their consumption so that they can experience the kinds of art they want,when they want, and where they want. This may well mean a more individual-ized and self-focused approach to arts consumption, and therefore an increasein demand for niche markets. Indeed, the Internet and various forms of e-commerce will facilitate consumption tailored to individual tastes by promot-ing direct interchange both between artists and consumers (thus reducing de-pendence upon traditional retailers and live performing arts venues) andamong consumers who share an interest in specialized forms of art. The net ef-fect of these developments will be that the market for new products and typesof art will be increasingly freed from the geographic constraints imposed by theneed for market thresholds sufficient to support production and distribution.
In addition, continued technological advances seem certain to promote in-creases in arts participation both through the media and by direct involvementin creating art. The former effect will be spurred by improvements in reproduc-tion and transmission technologies that reduce the aesthetic disadvantages ofnon-live performances. The latter effect could be driven by new technologiesthat provide new ways, such as new media art forms, for individuals to createart themselves.
How these changes will affect the demand for the live performing arts is not al-together clear and may well depend upon the degree to which aesthetic versussocial factors drive future demand, and the extent to which the public viewsrecorded and live performances as substitutes. To the extent that audiences forlive performances are dominated by casual attendees who are seeking socialinteraction with others interested in the arts, demand for the live performingarts may hold up well. However, if the above factors drive demand, the marketfor new and innovative work could well decline.
In sum, the future could promise an increase in demand for the performingarts. But that increase will not necessarily be felt evenly across forms of partici-pation, sectors, or disciplines. A combination of social, economic, and techno-

36 The Performing Arts in a New Era
logical changes could well bring more benefit to consumption through the me-dia and direct involvement in the creative process. Moreover, these changesseem likely to facilitate the development of a variety of niche and specializedmarkets as individuals have the incentive and the means to tailor their con-sumption to their individual tastes, regardless of where they live or what isavailable in their local markets.

37
Chapter Five
ARTISTS: CREATORS AND PERFORMERS
In the performing arts, artists are either creators of works of art—such as com-posers, playwrights, and choreographers—or performers—such as musicians,conductors, actors, and directors. Sometimes they are both. Although they areat the core of the performing arts, artists are difficult to classify. For example,we don’t know exactly how to distinguish professional artists from those whopursue the performing arts on a part-time or avocational basis. Nor do we knowwhat roles these different types of artists play in the production of the perform-ing arts in its various sectors and with what consequences for the quality andamount of performing arts available to the public. Although we have good rea-sons to believe that a career in the performing arts differs from a career in otheroccupations (Alper and Wassall, 2000), we don’t really know how careers forartists in the commercial and nonprofit sectors differ or how much artists moveamong sectors. Some artistic talents may be more interchangeable between“high” and “popular” arts activity than others.
Over the last century, the artistic profession has been growing in both reputa-tion and population. Although performance was a respectable avocation for theleisure class before the 19th century, professional performing artists were oftenheld in low esteem. With the emergence of the popular film industry in the early20th century, however, actors and actresses experienced soaring popularity andincomes. While the cachet of the leisure-class amateur eroded, the stature ofprofessional performing artists began to rise, both in the commercial populararts and the nonprofit high arts. The Ford era brought heavy investments innew conservatories and other training programs from the 1960s to the 1980s,which allowed artists of all kinds to develop their talents more fully and to spe-cialize in specific disciplines and performance areas.
Increased professionalism, combined with changing marketing practices in thearts, has also promoted the emergence of superstar artists who have come to ri-val their counterparts in sports in terms of the salaries and prestige they garner.Although stardom is hardly a new phenomenon in the arts (Levine, 1988), thereach and rewards of stardom seem to be increasing (Frank and Cook, 1995).

38 The Performing Arts in a New Era
As we will show, the number of people who call themselves professional artistshas been growing for decades, despite the difficulties they often face in sustain-ing full-time employment in the arts. Although we have no systematic data onlevels of amateur participation in the arts for most of the 20th century, Toffler(1964) asserts the number of amateurs increased sharply during the 1950s, andmore recent participation data suggest that more people are taking up music,theater, and dance in their free time. Such trends are important to any discus-sion of artists because amateurs outnumber professionals by a factor of 20 or 30to 1,1 and thus play an important role in the delivery of the performing arts.
This chapter describes what we know about performing artists as a group andby discipline, first by clarifying the distinctions between professionals and ama-teurs and describing the data available on artists, then by describing the charac-teristics of artists and artistic employment and how they compare with otherprofessionals and careers. At the end of the chapter, we identify changes in theenvironment that are likely to affect performing artists in the future.
KEY CONCEPTS
As we suggested above, the initial challenge in analyzing performing artists is todefine who they are. In the data, they are characterized as belonging to two cat-egories: professionals and amateurs. But this simple dichotomy fails to capturethe range of careers in the arts that fall between full-time professionals andhobbyists. Most artistic careers are composites, consisting of paid arts work,unpaid arts work, and non-arts work (Throsby, 1996, Ruttenberg et al., 1978;Alper et al., 1996). As a result, the artistic labor force is notably fluid, with a largenumber of part-time employees who move between arts-related and non-arts-related employment. Therefore, defining professionals as those artists with full-time employment in the arts would be too restrictive.
Moreover, it is not always easy to delineate the difference between professionaland amateur activity. Some commentators use the term “professional” to indi-cate high standards of competence. Apart from the obvious difficulty ofmeasuring skill levels in the arts, this approach is less useful in a labor marketwhere there are so many highly trained artists working in multipleenvironments—including commercial, nonprofit, and volunteer settings—andwhere there are so many professional performances of mixed quality.
Because we are constrained by the way the data on artists are reported, we usethe term professional in this analysis to mean artists who pursue art as their vo-
______________ 1Estimates of amateur participation based on the General Social Survey put the ratio as 30:1. Thosebased on the SPPA suggest it may be closer to 20:1.

Artists: Creators and Performers 39
cation and amateurs as those who practice their art on an avocational basis.However, a more appropriate taxonomy of artistic careers would include afuller range of categories, including casual hobbyists, amateur aficionados,part-time professionals, full-time professionals, and superstars. The distinc-tions among these categories would be based on multiple criteria, includingartists’ educational qualifications, membership in credentialing bodies, incomeearned, amount of time devoted to performing, and peer acceptance.2
DATA SOURCES
Three types of data are needed to answer the questions we have posed in thischapter: information on (1) the characteristics of artists, (2) the institutions thatemploy them, and (3) the dynamics of their careers. Almost all the data avail-able on artists, however, fall into the first category. Data on career dynamicsand the experience of artists over time do not currently exist, and very little in-formation is available on the employment decisions or conditions of artists indifferent institutional settings.
Data collected on artists focus mostly on self-defined professional artists,particularly their sociodemographic and employment characteristics, althoughamateur activity is also captured in some survey data. Most of the informationon professional artists comes from one of three sources:
• the Decennial Census of Population, which includes a detailed battery ofquestions about individuals’ employment and sociodemographic charac-teristics3
• the monthly Current Population Survey (CPS), jointly sponsored by the Bu-reau of the Census and the Bureau of Labor Statistics, which fields a stan-dard battery of questions about employment to a much smaller nationalsample of the population
• regular studies commissioned by the NEA’s Research Division, which sup-plement Population Census data by providing more detail on artists’ em-ployment and earnings.
In each of these sources, professionals are identified as those who call them-selves professionals. There is no way to verify from the data whether those whoclaim to be professional artists actually earn income from their activity. Nor can
______________ 2We are indebted to David Throsby for his suggestions on the distinction among categories ofartists.3Data in this report come primarily from the 1990 Population Census. 2000 Population Census dataon occupations are not yet available at this writing.

40 The Performing Arts in a New Era
we tell what proportion of their income is derived from the arts. Therefore, wecan only speculate about the career dynamics of the profession based largely onthe collective accounts of individual artists.
The two major sources of information on amateurs are the General Social Sur-vey and the NEA’s Survey of Public Participation in the Arts. In both of thesesurveys, amateurs are identified by their responses to questions about theirleisure activities. Amateur performing artists are those who have created orperformed in an artistic production in their leisure time—whether in private orbefore a public audience.4 Because the questions do not ask respondents to de-scribe their degree of involvement in these activities, we cannot distinguish thecasual hobbyist from the professional who also engages in the arts as a leisureactivity.
CURRENT PICTURE
Artists’ Characteristics
Performing Artists Represent a Small Proportion of All Artists
The 1990 Census of Population counted 1.6 million artists, who constituted 1.3percent of the nation’s workforce. They are categorized into four broad types, asshown in Figure 5.1. The majority of those the Census includes within the artistcategory are graphic designers and architects—occupations that are not gen-erally involved in the creation of either popular or high arts. Performing artistsconstituted only 17 percent of all artists—considerably more than the numberof authors but fewer than the population of visual artists. Musicians and com-posers make up more than half of all performing artists, followed by actors anddirectors (39 percent) and dancers (8 percent).
Performing Artists Resemble Other Professional Workers
Census data also indicate that performing artists are, on average, about sixyears older, more likely to have a college degree, and more likely to be whitethan is the average American worker. However, these differences generally dis-appear when they are compared with all professional and technical workers—amore appropriate comparison given the comparable levels of education amongthese two groups (Throsby, 1994). One difference that does persist, however, isgender—whereas only 52 percent of professional and technical workers aremale, 60 percent of performing artists are men.
______________ 4The SPPA data suggest that the percentage of amateurs who perform in public varies substantiallyby discipline—from a high of 60 percent for ballet dancers to a low of 10 percent for those who playa classical instrument. No distinction is drawn between paid and free admissions (NEA, 1998a).

Artists: Creators and Performers 41
Other artists, including architects
and graphic designers:
55%(837,000)
Authors:6%
(91,000)
Performing artists:17%
(261,000)
Visual artists:22%
(344,000)
Dancers:8%
(20,880)
Musicians/composers:
53%(138,330)
Actors/directors:
39%(101,790)
RAND MR1367-5.1
Figure 5.1—Proportion of All Artists Who Are Performing Artists
We can also make selective comparisons between amateurs and professionalsin terms of their sociodemographic characteristics. In general, amateurs tend tobe somewhat older, better educated, more likely to be female, and less likely tobe white than are professionals. Although it is very difficult to compare theincomes of amateurs and professionals for the reasons cited above, the datashow that amateurs, not surprisingly, have incomes comparable with that of thegeneral population.5
Employment
Performing Artists Face More Difficult Employment Circumstances Than DoMost Other Professionals
As we noted above, analysis of artists’ employment circumstances is compli-cated by the fact that artists are typically employed—at least part-time—in non-arts jobs. About three-quarters of all artists hold non-arts jobs at least part ofthe time (Alper et al., 1996).6 Although we cannot determine how much of their
______________ 5These comparisons are based on computations from the U.S. Census and the General Social Sur-vey.6A 1977 survey of performing artists indicated that only one-third of those surveyed managed towork full-time in the arts (Ruttenberg et al., 1978).

42 The Performing Arts in a New Era
income is arts-related, it is nevertheless interesting to examine the data for dis-tinctions across disciplines and across professions (see Table 5.1).
Focusing first on performing artists, the data show that the average earnings ofactors and directors ($22,000) was more than twice as high as the earnings ofother performing artists. Actors and directors were employed more weeks out ofthe year than other performing artists but faced higher unemployment rates(13.2 percent). Musicians and composers earned substantially less ($10,000)and worked somewhat fewer weeks (48), but were less likely to be unemployed(4.0 percent). Dancers had the lowest annual earnings ($8,500), worked thefewest weeks (39), and experienced high unemployment rates (9.1 percent).7
When compared with authors, performing artists appear to be at a distinct dis-advantage. Authors earned more than actors and directors—the highest-paidperforming artists—while working about the same number of weeks and expe-riencing much lower unemployment. In comparison with workers in general,performing artists in the aggregate earn less, work fewer weeks, and face higherunemployment. The disadvantages performing artists experience in the laborforce are even more pronounced when artists are compared with professionaland technical workers, whose education levels are closer to theirs than they areto the labor force as a whole.
It should be noted here, however, that the employment profile of performingartists looks good compared with that of visual artists. A 1982 NEA reportdescribing the lives of visual artists in four major cities found that the medianannual income of artists from art sales, commissions, and grants or awards was$718, with only 8.5 percent earning over $10,000 (NEA, 1982a). Medianproduction costs, on the other hand, were $1,450, about twice the median
Table 5.1
Employment Characteristics of Performing Artists Compared with Other Professions
ProfessionMedian Annual
Wage (1989)
Median Weeks ofFull-Time Work
(2000)
Unemployment Rate(percent)
(2000)Musicians and composers $10,000 48 4.0Actors and directors $22,000 50 13.2Dancers $8,500 39 9.1Authors $23,000 49 2.3Professional and technical
workers $24,000 52 2.4All workers $22,000 52 6.7
SOURCES: Bureau of Labor Statistics, U.S. Census, Current Population Survey.
______________ 7These data are based on 1990 Population Census figures. The earnings figures are for 1989 (Alperand Wassall, 2000). See also Ellis and Beresford, 1994.

Artists: Creators and Performers 43
income. Over a quarter of visual artists reported earning nothing at all fromtheir art over a three-year period during which they had exhibited (Kreidler,1996).
Of course, the salary figures from the Census of Population data in Table 5.1reflect both arts and non-arts income, so they are not directly comparable withthe income figures cited in the NEA report. In fact, the incomes based on theCensus may tell us as much about the different types of jobs artists hold outsidethe arts as about the differences in what they earn from their artistic careers.Authors, for example, who work primarily in professional and educationservices, earn more than performing artists, who are more likely to work in low-skilled service industries (Throsby and Thompson, 1994).
These types of comparisons are often cited as the basis for the image of the“starving artist” that abounds in some circles. Filer (1986) disputes this portrait,noting that when all sources of income and spousal support are included, thedifferences in income between artists and other workers largely disappear. If,however, non-arts employment represents a form of underemployment forperforming artists because it is outside their chosen profession, then the un-employment comparisons reported above greatly underestimate the true extentof underemployment in the performing arts. It seems clear that artists need torely on multiple sources and types of employment to make ends meet.
This employment picture is drawn, of course, from the average experience ofperforming artists; as such, it does not tell us about the experience of individualartists. As we discuss later in this chapter, the presence of the superstars is astrong force in the arts labor market. Although these stars represent a tiny frac-tion of the entire professional workforce, they offer a powerful incentive for as-piring young artists to stay in the profession.
Career Dynamics
Careers in the Performing Arts Differ from Other Careers
A career in the performing arts differs from most other careers, especially pro-fessional and technical occupations. It is perhaps more like a career in profes-sional sports than it is like other professions. Although athletic and artistic ac-tivities are in most ways quite different, their career dynamics have a number ofsimilarities. First, the earnings of artists tend to peak early and decline morequickly than in other professions (Brooks, 1994).8 Second, artists’ employment,
______________ 8This phenomenon will vary somewhat for different types of artists. It is more likely to be apparentfor performers whose art is directly dependent upon their physical abilities, e.g., dancers. Its effects

44 The Performing Arts in a New Era
like that of athletes, is sporadic and fragmented. Most artists work in day jobsonly up to the point of securing subsistence. The data show that most perform-ers work for multiple employers during the year. One study (Ruttenberg et al.,1978) has shown that only one in five performing artists worked for the sameemployer throughout the year and some worked for as many as ten employers.Third, most artists leave their profession early—typically in their mid-thirties—as career mobility decreases (Menger, 1999). Fourth, musicians and certainother performers are vulnerable to injuries from repeated practice and perfor-mance; these injuries sometimes cut promising careers short. Fifth, many per-forming arts jobs and casting agencies are concentrated geographically, placingconstraints on artists seeking employment. For example, 70 percent of themembers of Actors Equity reside in New York and California. Finally, like ath-letes, very few artists make it big in their field but many are inspired by the suc-cess of superstars.
Those who enter the arts appear to be motivated by powerful incentives—a loveof the arts and the pleasure they derive from creation and performance. Artisticcareers may well offer greater non-monetary rewards, such as lifestyle and ful-fillment, than do other careers (Jeffri, 1998). Nevertheless, it is not surprisingthat many artists leave the profession at a relatively young age or decide topursue their interest in the arts on a part-time or amateur basis. Particularly asincome pressures increase with the demands of families and child-rearing,many young artists reassess their career choices and consider whether theywould be better off in a more stable career. As we will discuss in the nextchapter, because most performing arts organizations in the nonprofit andvolunteer sectors are very small and rely on heavily discounted or volunteerlabor for their existence, we predict a steady and growing demand for thoseperforming artists who are willing to perform outside professional ranks.
Formal Arts Education Plays a Distinctive Role
Another distinctive feature of a career in the performing arts is the relative im-portance of education and experience in career advancement. In most profes-sional careers, education plays a critical role in gaining access to jobs, and workexperience determines the rate of advancement (Economic Report of the Presi-dent, 1997). In the arts, despite the fact that formal education levels are compa-rable with those of other occupations, experience seems more important thaneducation both for finding employment and advancing in one’s career(Throsby, 1994).
_______________________________________________________________________ in artists’ earnings data will also be offset because less successful artists, and thus those with thelowest earnings, abandon their careers earliest.

Artists: Creators and Performers 45
This feature of artistic careers has created ambivalence within the arts policycommunity about the emphasis to place on training artists. From 1966 to 1981,the NEA made only token efforts toward educating artists. In 1982, however,then–NEA Chairman Frank Hodsoll made arts education a top agency priority.Hodsoll’s initiative had two components: first, to promote arts appreciation,especially in schools; and second, to develop programs to train artists and artseducators (Myers and Brooks, forthcoming). The latter initiative is most relevanthere. But given the importance of experience to advancement in artistic careers,it is not entirely clear how to achieve a balance between education and jobtraining within a traditional educational environment. Moreover, arts educatorshave complained that the NEA’s efforts rely too much on artists and too little onarts educators (Smith, 1992). In any case, charitable giving has tended to shyaway from most arts education programs, preferring instead to support artistsand performing groups. This led the Music Educators National Conference tocomplain that “. . . there has been no evidence that the corporate or foundationcommunities have particular interest in considering the traditional arts educa-tion community as a full partner in the national arts enterprise” (MusicEducators National Conference, 1986, p. 10).
KEY TRENDS
Increasing Prominence of Superstars
As we have noted above, there is tremendous variation in the wages of artists,with the rare superstar earning millions of dollars a year and the average artistmaking little more than the minimum wage. This phenomenon is referred to asa “superstar market.” Superstar markets exist in labor markets where small dif-ferences in ability lead to large differences in compensation. This occurs wheninformation about talent becomes so accurate—or marketing of a particularartist as “the best” so common—that demand coalesces around a very few stars,driving their wages far above those of everyone else in the field (Frank andCook, 1995; Rosen, 1982).
Although there is little empirical research on this phenomenon in the perform-ing arts, the anecdotal wisdom on this point is unambiguous: the performingarts are experiencing a polarization in earnings in which a few artists earn hugerewards while most artists earn very little. We suspect that there are two reasonsfor this development. First, technological advances in reproduction and distri-bution have dramatically expanded the market for successful artists and havealso made it possible to know the field and discern subtle differences in artisticability. Second, and perhaps more important, marketing efforts to build starpower have become ever more pervasive because the potential rewards of mar-ket success are so great.

46 The Performing Arts in a New Era
More Artists, Fewer Job Opportunities
Since 1970, the supply of professional artists has increased dramatically. Thispoint is documented in Figure 5.2, which depicts the increase in the number ofself-proclaimed professional artists (and their rising share of the labor force)between 1970 and 1990. The total number of artists approximately doubled overthis period. Corrected for growth in population, the increase was still over 40percent. Although the available evidence suggests that unemployment amongartists was lower than for the civilian workforce (5.3 percent versus 6.7 percentin 1991), and that the unemployment rate among artists fell by 0.7 percent from1983 to 1991, these comparisons, as we noted above, include all labor force ac-tivity by artists and thus may underestimate the true extent of unemploymentand underemployment in the performing arts. Indeed, the number of unem-ployed artists has increased over this period (Menger, 1999).
These data exclude the large number of individuals who are amateur com-posers, actors, performers, and dancers. What options exist for these individu-als and for the increasing number of professional artists? As we will show, thenumber of nonprofit arts organizations has expanded dramatically over the
200
0
400
600
800
1000
1200
1400
1600
1800
0
0.2
0.4
0.6
0.8
1.0
1.2
1.4
1.6
Number
Percentage
Tho
usan
ds o
f sel
f-de
scrib
ed p
rofe
ssio
nal a
rtis
ts
1970 1972 1974 1976 1978 1980 1982 1984 1986 1988 1990
SOURCE: U.S. Census, Current Population Survey.
Per
cent
age
of th
e la
bor
forc
e
RAND MR1367-5.2
Figure 5.2—Growth in the Number of Professional Artists, 1970–1990

Artists: Creators and Performers 47
past two decades—primarily as a result of a burgeoning of small organizations.We suspect, although we cannot document empirically, that many of theseperformers are working as volunteers or for heavily discounted wages in theseorganizations, many of which are in the volunteer sector.
As we have suggested throughout this chapter, the ability of performing artiststo practice their craft has generally been conditioned by the willingness of artsorganizations and producers to employ them. This situation reflects the tradi-tional structure of the performing arts in which producers and distributors in-tervene between artists and audiences by determining what arts will be pro-duced and how.
This situation has been changing as recent technological advances dramaticallyincrease artists’ access to modes of production. Specifically, the advent of theInternet, web-based e-commerce, and the dramatic improvements in repro-duction technology and broad-band transmission are making it easier for com-posers and musicians, for example, to produce their own recordings, identifyand reach potential audiences, and thus promote and distribute their materialwithout relying on established firms. These new technologies have lowered theentry barriers that producers traditionally imposed on composers and perform-ers, who can now produce and distribute their work on their own (Larson, 1997;Seabrook, 2000).
Although these changes may be most feasible in the short run for specializedniche markets, they offer at least the prospect of later expansion to wider, morepopular markets if they can first generate sufficient momentum in more spe-cialized niche markets. For example, several Internet services such as InterneTVmix artist-submitted performing arts material with standards and classics, cre-ating a venue that does not classify work according to preconceived levels offame or fortune.9
However, the very ease of entry provided by the new technology, which enablesmotivated individuals to gain access to artistic material they formerly could nothave found, may impose a new intermediary between artists and audiences. Asmore artists seek to avail themselves of this new technology, the very prolifera-tion of new artists and their products may overload audiences who find thatthey require intermediaries to alert them to the voices they want to hear. Tradi-tionally, record companies have served this function, focusing consumers’ at-tention on those artists and material that they believe will have the broadestmarket. If a new set of marketers increasingly substitutes for the traditional in-termediaries, it is not clear what criteria they will use to highlight specific artistsand what the implications will be for the type and quality of art.
______________ 9See http://www.internetv.com/.

48 The Performing Arts in a New Era
Intellectual Property Questions Created by New Technologies
Although new technologies such as the Internet are making it easier for someperforming artists—particularly musicians—to promote and distribute as wellas create and perform their own material, they are also reviving old questionsabout who should own the legal rights to creative intellectual property. Accord-ing to Litman (1996),
Our current copyright law is based on a model devised for print media, andexpanded with some difficulty to embrace a world that includes live, filmed andtaped performances, broadcast media, and most recently, digital media. Thatmuch is uncontroversial. The suitability of that model for new media is muchmore controversial.
Two examples from the music industry make this point. The first is the disputebetween the Recording Industry Association of America (RIAA) and the Internetfirm Napster involving Napster’s failure to pay royalties on music downloadedby fans. In addition to losses sustained by record companies, this case also in-volves a loss of command over the musical product by artists wishing to controldissemination of their work. In the second example, the recording industry hastried to argue that sound recordings should be considered “works for hire” andthus subject to a copyright term of 95 years (as opposed to the 35-year term thatobtains if musicians are legally judged to be the authors of their works) (Pareles,2000). The financial motive for this effort is that recent technological changesare making many older recordings more profitable than new releases. The legalsuccess of these cases so far has been mixed (Hamilton, 2000).
We suspect that this juxtaposition of new technology and intellectual propertylaw will present similar problems in the near future for composers, choreogra-phers, and playwrights.
FUTURE ISSUES
Two key issues stand out for the future. The first follows directly from the trendsjust described: the difficulties of a professional career path in the arts may drivemore talented artists to choose amateur involvement. As superstar markets be-come more pervasive—driving some wages up, but most down—and the supplyof artists outstrips demand at least at the top professional level, we envisionpotential professionals with more reasons to choose the avocational route(albeit, perhaps, after or because of an unsuccessful try at the professionalworld), and consequently a greater role for serious aficionados and semiprofes-sional performers.
Second, the next chapter points to changes in the demography of arts organiza-tions that may reduce the opportunities for artists to gain professional experi-

Artists: Creators and Performers 49
ence and mature in their careers. Midsized nonprofit organizations, in particu-lar, appear to be facing more serious financial pressures than either large orsmall organizations. If some of these organizations disappear, a vital trainingground for actors, ballet dancers, opera singers, and classical musicians willalso get smaller. In this case, graduates of the conservatory may be forced tochoose between taking a job in the “low-end” professional sector, wherestandards of production are far less professional, or switching careers andparticipating in their art as nonprofessionals.


51
Chapter Six
CHARACTERISTICS OF PERFORMING ARTSORGANIZATIONS
As we observed in Chapter Four, shifts in the demographic composition andleisure time preferences of Americans are changing the types of art that audi-ences most care about and the ways they wish to experience it. In the market forartists, although the superstar phenomenon is of long-standing duration, thegulf between the small group of extravagantly well-paid celebrity artists and themuch larger pool of professionally trained but frequently unemployed artistsappears to be widening.
This chapter examines the various types of organizations that decide what artgets produced, how it is produced, and by whom, thereby determining thesupply of the performing arts delivered to audiences and the supply of jobs forartists.1 We demonstrate that arts organizations range widely in terms of size,artistic and financial objectives, and the function they serve in bringing boththe live arts and the recorded arts to the public. After a brief introduction to keyorganizational types and the data available to analyze them, we offer a snapshotof performing arts organizations in America as they look today to answer thefollowing questions:
• How many performing arts organizations are there, and in which marketsectors do they operate?
• What do U.S. performing arts organizations look like in terms of discipline,geographic location, size, and function within the arts delivery system?
Then we describe the key trends that have been altering these characteristicsand their implications for the future.
______________ 1Although creative artists are, by definition, central to the creation of the performing arts, they gen-erally play a very small role in determining what art actually reaches audiences.

52 The Performing Arts in a New Era
KEY CONCEPTS
Arts organizations serve as key links in the chain that brings created works of artto audiences. As illustrated in Figure 6.1, they perform, present, reproduce, anddistribute the work of art to audiences. Performers, like creators, are at the coreof the creative process, providing content to presenters and reproducers. Dis-tributors take recorded-art content and deliver it to consumers; for simplicitywe include broadcasters in this category, as well as wholesale distributors andretailers. Performing and presenting organizations represent the “live” segmentand reproducers and distributors represent the “recorded” segment of the de-livery system.2 The numbered hexagons represent additional organizations thatact primarily as brokers: Hexagon 1 represents such organizations as musicpublishing companies; hexagons 2 and 3 represent such organizations asartists’ management agencies and promoters.
To illustrate, consider the case of symphonic music. The creator of a new sym-phonic work, the composer, assigns his or her copyright to the music publisher,represented by hexagon 1, which makes the music available to performers in re-turn for a royalty payment that it splits with the composer. The performer,
Reproducers
Creators
Performersand
PerformingGroups
Audiences
Presenters
Distributors
LIVE PERFORMING ARTS
RECORDED PERFORMINGARTS
Delivery System
1
2
3
= intermediaries
RAND MR1367-6.1
Figure 6.1—Organizational Structure of the Professional Performing ArtsDelivery System
______________ 2For simplicity, we treat each of these roles separately, but we recognize that individuals can oftenserve multiple roles in the system. A choreographer, for example, may serve as the creator of adance and also perform in the dance, and may also be the presenter.

Characteristics of Performing Arts Organizations 53
a symphony orchestra, performs the work in the local symphony hall orperforming arts center. If the orchestra owns or leases its local performancevenue, it acts as both performer and presenter for its hometown performances.In addition, the orchestra may hire a promoter, represented by hexagon 2, whosets up a concert tour with presenters at selected performance venues in othercities, states, or countries. The box office receipts from touring are split betweenpresenter, promoter, orchestra, and composer.
If the orchestra has a national (or more likely international) reputation, it mayalso sign a contract with a reproducer, the record company, to record the newsymphonic work. A management agency, represented by hexagon 3, may ormay not broker this transaction. The record company, if it is a major label, ownsits own recording studio, compact disc (CD) manufacturing plant, and whole-sale distribution network for classical CDs.3 The record company markets thenew release to retailers and radio broadcasters. Depending on the nature of thecontracts signed along the way, any profits from CD sales may be split betweenretailers, record company, orchestra, music publisher, and composer. Broad-casters pay royalties on the release based on its airtime; their revenues derivefrom advertisers, not record companies.4
In the high arts, the artistic emphasis of most performers is on live perfor-mance, which also generates the bulk of their earned revenues or receipts. Notcoincidentally, both the high arts and the live segment of the professional per-forming arts are dominated by nonprofit organizations, which rely on con-tributed as well as earned income to cover their costs. Although various theoriesseek to explain the predominance of nonprofit organizations in the live per-forming high arts (see, for example, Throsby and Withers, 1979; Hansmann,1981; and DiMaggio, 1982 and 1984), most are consistent with Baumol andBowen’s 1966 argument that the audiences are too small and fixed costs toohigh for professional live performances of ballet, opera, and symphonic musicto pay their own way. In fact, with the possible exception of theater, there isconsiderable evidence that professional live performance of the popular artsalso fails to pay its own way. In popular music, for example, live concert toursare generally loss leaders designed to leverage sales of recorded music andlicensed merchandise (Vogel, 1998).5
______________ 3Other recorded music formats include vinyl records and audio cassette tapes, but CDs now ac-count for almost 90 percent of recording sales. The newest music media formats, digital audio discsand super audio CDs, have yet to achieve wide consumer acceptance (RIAA, 2001).4For nonprofit broadcasters, sources of revenue are primarily sponsors and contributors.5Professional for-profit theater is itself a highly cyclical industry, and there have been frequent pe-riods in which Broadway barely appears to have survived financially. See, for example, Baumol andBowen (1966), Moore (1968), and NEA (1981).
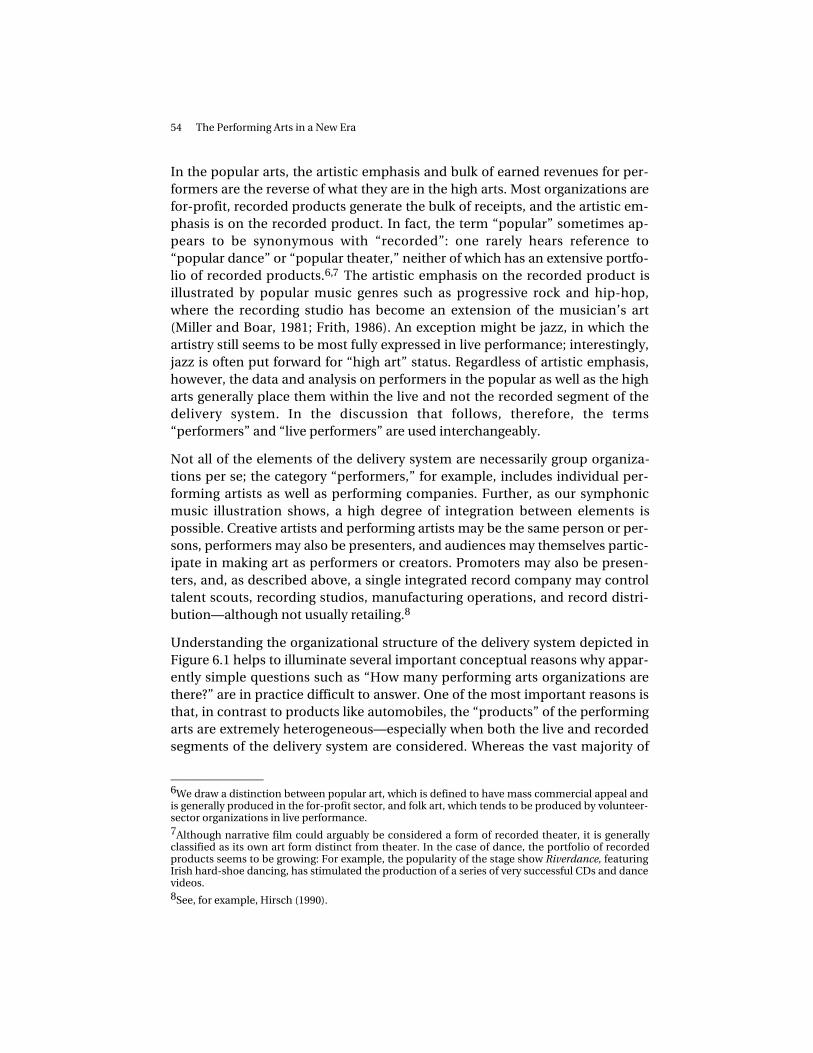
54 The Performing Arts in a New Era
In the popular arts, the artistic emphasis and bulk of earned revenues for per-formers are the reverse of what they are in the high arts. Most organizations arefor-profit, recorded products generate the bulk of receipts, and the artistic em-phasis is on the recorded product. In fact, the term “popular” sometimes ap-pears to be synonymous with “recorded”: one rarely hears reference to“popular dance” or “popular theater,” neither of which has an extensive portfo-lio of recorded products.6,7 The artistic emphasis on the recorded product isillustrated by popular music genres such as progressive rock and hip-hop,where the recording studio has become an extension of the musician’s art(Miller and Boar, 1981; Frith, 1986). An exception might be jazz, in which theartistry still seems to be most fully expressed in live performance; interestingly,jazz is often put forward for “high art” status. Regardless of artistic emphasis,however, the data and analysis on performers in the popular as well as the higharts generally place them within the live and not the recorded segment of thedelivery system. In the discussion that follows, therefore, the terms“performers” and “live performers” are used interchangeably.
Not all of the elements of the delivery system are necessarily group organiza-tions per se; the category “performers,” for example, includes individual per-forming artists as well as performing companies. Further, as our symphonicmusic illustration shows, a high degree of integration between elements ispossible. Creative artists and performing artists may be the same person or per-sons, performers may also be presenters, and audiences may themselves partic-ipate in making art as performers or creators. Promoters may also be presen-ters, and, as described above, a single integrated record company may controltalent scouts, recording studios, manufacturing operations, and record distri-bution—although not usually retailing.8
Understanding the organizational structure of the delivery system depicted inFigure 6.1 helps to illuminate several important conceptual reasons why appar-ently simple questions such as “How many performing arts organizations arethere?” are in practice difficult to answer. One of the most important reasons isthat, in contrast to products like automobiles, the “products” of the performingarts are extremely heterogeneous—especially when both the live and recordedsegments of the delivery system are considered. Whereas the vast majority of
______________ 6We draw a distinction between popular art, which is defined to have mass commercial appeal andis generally produced in the for-profit sector, and folk art, which tends to be produced by volunteer-sector organizations in live performance.7Although narrative film could arguably be considered a form of recorded theater, it is generallyclassified as its own art form distinct from theater. In the case of dance, the portfolio of recordedproducts seems to be growing: For example, the popularity of the stage show Riverdance, featuringIrish hard-shoe dancing, has stimulated the production of a series of very successful CDs and dancevideos.8See, for example, Hirsch (1990).

Characteristics of Performing Arts Organizations 55
automobiles have four wheels, an engine, and are purchased by consumers onshowroom floors, a symphonic music product, as illustrated above, may be aconcert performance presented to a live audience; a concert performancebroadcast over radio, television, or the Internet; a CD or audio cassette tapesold to consumers for home use; or a CD or tape broadcast over radio, televi-sion, or the Internet. Thus, in contrast to the firms that manufacture and dis-tribute automobiles, the firms that produce these different symphonic musicproducts fit not only within different industrial classifications, but also withinentirely different production classifications.9 The profound differences acrossfirms in both production technologies and industrial organization make it diffi-cult to combine the highly fragmented data on arts organizations into an overallpicture.
A related conceptual issue surrounding the arts delivery system is how to definean arts organization. While it seems clear that performers such as ballet oropera companies should be considered arts organizations, as we move furthertoward audiences in Figure 6.1, the connection between what the organizationactually does and “making art” becomes increasingly tenuous. Are distributorsof videotapes and CDs really “arts organizations”? Not in the sense of makingart. Nevertheless, these types of organizations are vital links in the organiza-tional chain bringing dance, music, opera, and theater to many people whorarely, if ever, attend live events. Any broad analysis of the performing artsworld must consider the role of distributors, if only to understand how newtechnologies such as the Internet are dramatically changing who the distribu-tors are, what they do, and which audiences they serve.
A third issue in the analysis of the performing arts is that the performing artsindustry, like the health and education industries, is made up of organizationsthat have, at least superficially, extremely different goals and objectives. In theauto industry, to use our previous example, the principal objective of every firmis to be profitable. This is also the principal objective of the taxable for-profitfirms in the performing arts industry. It is not, however, the principal objectiveof the many nonprofit and volunteer-sector organizations in the performingarts, which, as we noted above, mostly operate in the live-arts segment of thedelivery system. The primary operational goals of these organizations may beartistic excellence, artistic innovation, recognition and prestige, maximum au-dience size, maximum audience diversity, or maximum community participa-tion. Thus while financial, employment, and output measures are adequate for
______________ 9In fact, the distinction between firms in the performing arts based on tax status (nonprofit or tax-exempt versus for-profit or taxable) is less of a barrier to many types of analysis than the seconddistinction, based on product characteristics (for instance, manufactured good versus service).

56 The Performing Arts in a New Era
most analyses of the auto or entertainment industry, analyses of the performingarts world require data that are considerably more detailed.
In order to assess the implications of organizational change in the nonprofitperforming arts sector, ideally we would want to know something about themissions, programming, and primary audiences of the organizations involved,as well as having data on their finances, employment, and output. In fact, al-though it is still not enough, we do know considerably more about arts activitythat takes place within the nonprofit sector than we do about activity in the for-profit sector.10 Unfortunately this means we know less about certain artforms—such as jazz—that tend to be performed by unaffiliated individuals orfor-profit organizations than we do about other art forms—such as opera—thatare dominated by nonprofit groups. We know even less about other performingarts—such as folk music and dance—that are often practiced outside formalmarkets in the volunteer sector.
SOURCES OF DATA
Besides financial data, which we discuss in the next chapter, there are threetypes of data on the characteristics of performing arts organizations:
• data on the number and disciplinary focus of organizations
• data on output
• data on programming.
Only the first type is collected systematically and in enough detail to be usefulfor research purposes.
Number of Organizations and Their Disciplines
The U.S. Census Bureau’s Economic Census has been counting the number oftaxable and tax-exempt performing, presenting, reproducing, and distributingorganizations throughout the United States every five years since 1977. Unfor-tunately, the sampling methodology used overrepresents large employers(firms without paid employees, for example, are not sampled) and does not in-clude the arts activities of nonmarket or informal organizations, or the arts ac-tivities of organizations embedded within larger non-arts organizations such as
______________ 10This is because the disclosure requirements imposed by the federal government on nonprofitorganizations are far more comprehensive than the requirements imposed on for-profits.

Characteristics of Performing Arts Organizations 57
universities and local governments.11 Because so much live performing andpresenting activity seems to occur within the volunteer sector, performers andpresenters are more likely than reproducers or distributors to be undercountedby the Economic Census. As a result, the Economic Census data probably over-represent activity within traditional high art forms such as symphonic musicand ballet. This is because symphony orchestras and ballet companies tend tobe larger and more well-established than klezmer bands or Navajo dancetroupes, which tend to fall into the volunteer sector. According to estimates byPeters and Cherbo (1998), for example, almost 90 percent of chamber musicensembles were missed by the U.S. Census Bureau’s 1992 Census of Service In-dustries. Smith (1997) estimates that the number of uncounted nonprofits out-numbers the number that submit annual tax forms to the IRS by a factor of 8to 1. Another problem with the Economic Census has to do with its clas-sification system.12 Performing organizations for certain high art forms, such asopera, are assigned data categories of their own.
But organizations that perform within popular and nontraditional artistic sub-disciplines, such as country and western and Balinese gamelan music, arelumped together in single-code categories such as “Other music.” As a result,Economic Census data can be used to track the growth of opera companiesfrom 1977 to the present, for example, but they cannot be used to track thegrowth of country music bands or gamelan orchestras. Even worse, many artistswho have incorporated themselves but perform as individual acts are lumpedtogether with visual and literary artists in the category “Independent artists,writers, and performers.”13 Therefore, unless explicitly defined otherwise, in theanalysis that follows the term “performers” will refer to performing organi-zations, not individual artists who have incorporated as single proprietorships.
Problems of categorization also afflict the other functional links within the de-livery system. Presenters of the live performing arts are grouped together withall “Promoters of performing arts, sports, and similar events,” including thosewith and without their own facilities.
______________ 11Embedded organizations may or may not be counted as part of the population of arts organiza-tions; it depends on whether the U.S. Census Bureau considers them to be a performing arts “es-tablishment.” The Census Bureau defines an establishment as a single physical location wheremanufacturing or a service is performed. A firm is defined as a business organization (taxable ortax-exempt) consisting of one or more establishments under common ownership or control.12The North American Industrial Classification System (NAICS), adopted in the 1997 EconomicCensus, is a big improvement over the Standard Industrial Classification (SIC) system, which theold Census of Service Industries used from 1977 to 1992. Nevertheless, many organizations withinthe performing arts delivery system still do not fit well within the NAICS.13Individual musical artists producing nonclassical forms are included in the category, “Othermusic groups and artists.”

58 The Performing Arts in a New Era
With respect to distributors, there is no way to disaggregate the production anddistribution of performing arts products from the rest of their overall businessactivity. With respect to reproducers, there is no way to disaggregate their ac-tivities by art form, subdiscipline, or genre. So, for example, although EconomicCensus data may show us that the number of “integrated record productionand distribution” firms (that is, record companies) is growing, we have no wayof knowing what this might mean for, say, classical versus popular music.
A second source of data that identifies the number and disciplinary composi-tion of performing arts organizations (although the data are relevant only tononprofit arts organizations) is the Internal Revenue Service (IRS). Since themid-1980s, the IRS has been making its Business Master File (BMF) and annualReturn Transactions Files (RTFs)—more commonly known as the “Form 990data”—available through the Urban Institute’s National Center for CharitableStatistics. Both files are based on tax forms filed by tax-exempt charitable orga-nizations. In the performing arts, the relevant organizations have Section501(c)(3) status under the U.S. Tax Code. Unfortunately, the demise of 501(c)(3)arts organizations is rarely reflected in the BMF because organizations generallydo not tell the IRS when they go out of business. As a result, the BMF tends tooverstate the number of formal nonprofit performing arts organizations thatactually exist. On the other hand, the Form 990 data do not capture informationon arts organizations that fall below the $25,000 threshold revenue requirementfor filing Form 990 each year, so they tend to understate the number of verysmall nonprofits operating in the volunteer sector. Neither file contains data onarts organizations that are embedded within other non-arts nonprofit organi-zations. Nevertheless, the annual IRS data are more timely than the five-yearEconomic Census data, and the IRS’s adoption of the National Taxonomy of Ex-empt Entities (NTEE) coding scheme means that its data avoid many of theambiguities of the NAICS with respect to performing and presenting organiza-tions. Unfortunately, the NTEE-coded data are only available beginning in theearly 1990s.14
Real Output
Data on the real output of the live segment of the performing arts—number ofperformances, number of productions, number of admissions tickets pur-chased, or other “product” measures—are seriously lacking. In contrast torecorded music products, for example, where Economic Census data include
______________ 14The original NTEE coding system was developed by the National Center for Charitable Statistics(NCCS) and several major nonprofit organizations during the 1980s. The IRS itself first applied theNTEE system to the BMF in 1995, but Form 990 data have been retroactively coded by NCCS back to1992 (NCCS, 2001).

Characteristics of Performing Arts Organizations 59
estimates of the value of all prerecorded CDs, records, and tapes that have beenproduced and shipped within the United States, as well as the value of thosesitting in inventory, there are no census data on the total value of opera, dance,theater, or symphony orchestra performances, or on the value of seats that wereavailable (capacity) or filled (occupancy) for each performance. The only con-sistent sources for output data are the NSOs and industry associations, as wellas a few private organizations that regularly publish directories and periodicalscontaining information on individual productions and artists. Examplesinclude Musical America, published by Primedia Inc., and the periodicalsVariety and Daily Variety, which cover Broadway and the film industry.
Programming
Finally, with the notable exception of OPERA America, the NSOs for performinggroups provide very little in the way of consistent data over time on program-ming. Information from the NSO for presenters is only marginally better. Thelack of such data makes it extremely difficult to assess the implications of orga-nizational changes on programming within the performing arts delivery systemin any systematic way.
These holes in the data make it difficult to present an accurate and compre-hensive profile of performing arts organizations in the United States. In the livearts, we cannot precisely say how many organizations there are, where theyperform, or whether they are growing bigger or smaller. We do not know howmany modern dance performances or jazz festivals took place in any particularyear, or whether there were more or less that year than the year before. Beyondbroad disciplinary categorizations, we also do not know in what ways live artsorganizations may be changing their programming—for example, whether localperforming arts centers are choosing to present A Moon for the Misbegottenmore or less often than Oklahoma!. In the recorded arts, we often cannot isolatefirms’ performing arts activity from their other business activities, let aloneidentify activity within particular disciplinary genres over time.
Finally, it is true that all research is constrained by the sample characteristicsand classification systems of the available data. But because there are so fewsources for comprehensive, time-series data on performing arts organizations,broad analyses of the performing arts world are particularly constrained. In theanalysis that follows, the Economic Census is often the sole source of data wecan use to make comparisons across organizations that perform different func-tions within very different sectors of the economy. Therefore, it is important toacknowledge again the limitations imposed by this data source. It is biasedtoward middle- and big-budget organizations. It cannot be used to trackcharacteristics of a fixed set of organizations over time. And it is constrained by

60 The Performing Arts in a New Era
a classification system that generally does not make distinctions beyond themajor art forms such as theater and dance.
CURRENT PICTURE
In this section we analyze what the data tell us about the number, size, disci-pline, market sector, and geographic dispersion of arts organizations today,starting first with the performing groups and presenting organizations thatprovide live performances and then moving to the reproducers and distributorsthat provide recorded performances. Our analysis focuses on organizations thatare taxable and those that have formally incorporated themselves as tax-ex-empt, but note that the smallest of these nonprofits actually fall within the vol-unteer sector, as we define it.
The Live Performing Arts
Music and Theater Companies Are Most Prevalent
How many performing organizations are there in each of the major performingarts disciplines? According to data from the 1997 Economic Census, there wereover 8,000 companies that gave live performances in the United States, of whichjust under 40 percent were theater groups, 6 percent dance companies, 2 per-cent opera companies, 10 percent symphony or chamber music orchestras, and45 percent groups performing other forms of nonclassical music.15
The relative proportions of live performing arts companies in the nonprofit ver-sus for-profit sectors vary considerably by discipline, as shown in Figure 6.2.Whereas theater groups are roughly evenly split between the two sectors, themajority of dance companies and the vast majority of opera companies andclassical music organizations are organized on a nonprofit basis. In contrast,the vast majority of groups and artists in the “Other music” category, that is,those who do not perform classical instrumental music, are organized as for-profits, which is consistent with the many popular music genres includedwithin this category. (The much smaller number of nonprofit nonclassical mu-sic groups can reasonably be supposed to consist of the various choral, folk, and
______________ 15As defined by the Census Bureau, “Classical music organizations” here include symphony or-chestras, chamber ensembles, and other organizations that identify themselves as producers of in-strumental classical music. “Other music groups and artists” include dance or stage bands or or-chestras; jazz music groups; choral music groups; and folk, rock, soul, country and western, etc.,music groups—that is, all forms of music except classical instrumental music. For simplicity, we usethe term “classical” to refer to classical instrumental music.
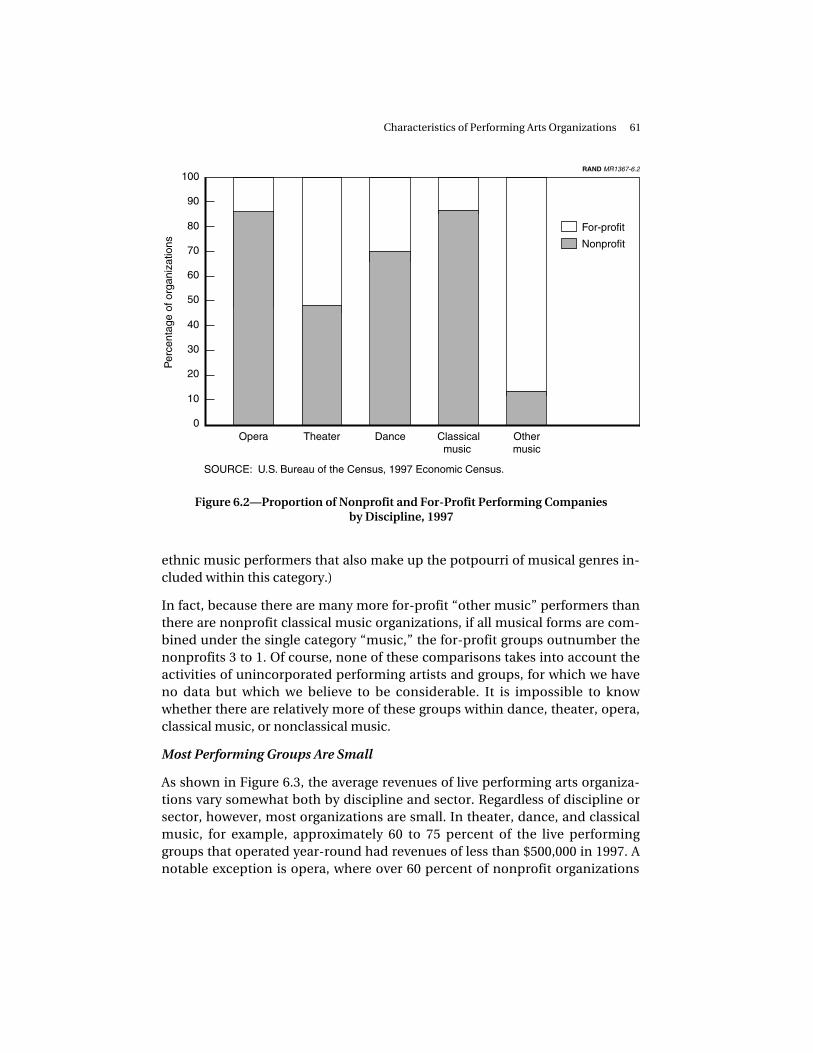
Characteristics of Performing Arts Organizations 61
0
10
20
30
40
50
60
70
80
90
100
Theater Dance Othermusic
Opera Classicalmusic
Per
cent
age
of o
rgan
izat
ions
For-profit
Nonprofit
SOURCE: U.S. Bureau of the Census, 1997 Economic Census.
RAND MR1367-6.2
Figure 6.2—Proportion of Nonprofit and For-Profit Performing Companiesby Discipline, 1997
ethnic music performers that also make up the potpourri of musical genres in-cluded within this category.)
In fact, because there are many more for-profit “other music” performers thanthere are nonprofit classical music organizations, if all musical forms are com-bined under the single category “music,” the for-profit groups outnumber thenonprofits 3 to 1. Of course, none of these comparisons takes into account theactivities of unincorporated performing artists and groups, for which we haveno data but which we believe to be considerable. It is impossible to knowwhether there are relatively more of these groups within dance, theater, opera,classical music, or nonclassical music.
Most Performing Groups Are Small
As shown in Figure 6.3, the average revenues of live performing arts organiza-tions vary somewhat both by discipline and sector. Regardless of discipline orsector, however, most organizations are small. In theater, dance, and classicalmusic, for example, approximately 60 to 75 percent of the live performinggroups that operated year-round had revenues of less than $500,000 in 1997. Anotable exception is opera, where over 60 percent of nonprofit organizations

62 The Performing Arts in a New Era
Per
cent
age
100
90
80
70
60
50
40
30
20
10
0Opera Theater Dance Classical
musicOthermusic
Revenues
Over $2.5M
$500K–$2.49M
Under $500K
Nonprofit
For-profit
RAND MR1367-6.3
SOURCE: U.S. Bureau of the Census, 1997 Economic Census.
Figure 6.3—Percentage of Nonprofit and For-Profit Performing Groups WithinRevenue Classes, 1997
had revenues greater than $500,000, and almost 30 percent had revenuesgreater than $2.5 million. This is probably due to the generally higher fixed costsof putting on an opera, which consequently require a higher matching revenuestream. In opera, as in dance and classical music (but not theater or “other mu-sic”), for-profit performers tended to be smaller than nonprofit organizations.
This may be because, in contrast to nonprofit performers who receive grantsand contributions, for-profit performers must rely primarily on box office re-ceipts from the relatively small audiences for these art forms.
The Market Concentration of Performing Companies Is Not High
As we might expect based on the large number of small-budget performing or-ganizations, the level of market concentration among most kinds of performinggroups is not high relative to other industries, including—as we shall see—therecorded segment of the performing arts. As shown in Table 6.1, opera, with thehighest average revenues and presumably the highest fixed costs of the four artforms represented in Economic Census data, also has the most concentratedindustry structure. This is consistent with mainstream economic theories about

Characteristics of Performing Arts Organizations 63
Table 6.1
Total Revenues and Percentage of Revenues Held by the 4 Largest and the20 Largest Performing Companies, 1997
4 largest companies 20 largest companiesTotal Revenues
($1,000s)Nonprofits(percent)
For-profits(percent)
Nonprofits(percent)
For-profits(percent)
Opera 593,608a 53.4 —a 80.4 —a
Theaterb 3,225,537 3.3 9.2 9.9 25.2Dance 432,690 16.7 11.8 38.6 20.2Classical music 1,078,228 18.0 0.9 50.3 2.3Other music 2,248,281 0.6 5.0 1.8 15.3
SOURCE: U.S. Bureau of the Census, 1997 Economic Census.aFor-profit data withheld to avoid disclosing data for individual companies.bDoes not include dinner theaters.
the relationship between fixed costs and industry structure: The higher the fixedcosts, the more difficult it is for new firms to enter the industry and take rev-enues away from existing firms. The four largest opera companies, all nonprof-its, received over half of the total revenues earned by nonprofit opera com-panies.
The least concentrated industry was “Other music,” where the top four for-profit groups earned just 5 percent, and the top four nonprofit groups less than1 percent, of combined nonprofit and for-profit revenues. This suggests verylow barriers to entry into the field of nonclassical music, which plausibly trans-lates into both a diversity of musical forms and competitive prices for musicalperformances. In fact, taken as a whole, the Economic Census data supportother, anecdotal data that paint a dynamic picture of the nonclassical musicfield in which specialized small, for-profit, and volunteer-sector musical groupsare reaching out to attract new audiences and new participants
Geographic Counts of Performing Groups Are Not Good Measures of Access tothe Arts
One of the most important issues in the organizational demography of the per-forming arts is whether potential audiences have access to live performances oftheater, dance, opera, and music. A frequently voiced concern is that Americansliving in small towns and rural areas have less access to the live arts than Ameri-cans in urban centers. To explore this issue, a common approach is to conductgeographic counts of performing organizations. However, as we argue below,such counts are not good measures of access to the arts.
Census data indicate that California and New York dominate the rest of thecountry in terms of total numbers of nonprofit and for-profit performing orga-nizations and in terms of these organizations’ revenues and receipts. However,because California and New York are also the first and third most populous

64 The Performing Arts in a New Era
states in the country, respectively, we would expect to find a preponderance ofperforming groups in these two states. Another and perhaps more appropriatemeasure of the relative access that residents of different states have to the liveperforming arts is the number of performing establishments per capita. Mea-sured this way, the story is quite different. In per capita terms, the District ofColumbia had by far the greatest concentration of nonprofit performing organi-zations, with 45 groups per million inhabitants; and Mississippi had the least,with just 6 groups per million inhabitants. On the for-profit side, Nevada domi-nates all others with 77 taxable performing acts per million inhabitants, whileNorth Dakota comes in last with fewer than 2 groups per million inhabitants.
Even when expressed in terms of groups per capita, however, these numbersprovide only a very rough guide to the geographic distribution of access to thelive performing arts, for two reasons. First, residence within a state does notnecessarily reflect geographic proximity to its live performing arts activity. Forexample, residents of northwestern Nevada do not necessarily benefit from thatstate’s abundance of for-profit performing organizations, which are heavilyconcentrated in Las Vegas. Similarly, residents of Southwestern Mississippi maywell find it easier to access the theaters and jazz clubs of New Orleans than resi-dents of northwestern Louisiana, whose closest cultural center is probablyDallas.
The second reason why the number of performing groups per capita is a veryrough measure of access is touring. In principle, touring could serve an impor-tant role in providing access to small and geographically isolated communitiesthat cannot support their own performing companies—as it historically hasdone. However, it could also simply serve to rotate performing groups througha set of communities that are already well-served at home. Unfortunately, Cen-sus data provide no information on the number of performing groups that tour,the share of revenues derived from touring, or the geographic distribution oftours, and so cannot be used to distinguish between these two alternatives.
Nonprofit Presenters, Key to Access, Are Located Throughout the Country
Another way to consider the question of access is to focus on the organizationsthat present the performing arts before live audiences. In fact, leaving aside thequestion of touring, it is important to know who the presenters are and wherethey are located, because many of the performing organizations describedabove do not operate their own presentation facilities. It takes presenters aswell as performers to deliver live art to audiences.
According to the 1997 Economic Census, about 1,000 U.S. promoters operatedperforming arts, sports, or other recreational facilities as independent estab-lishments in 1997, just under 400 of which were nonprofit. Unfortunately, theCensus data do not allow us to distinguish between performing arts venues and

Characteristics of Performing Arts Organizations 65
other types of recreational facilities—but in any case the distinction may not beimportant because many of these facilities are used for varied events. On net,however, the Census data almost certainly greatly underrepresent total num-bers of live performing arts presenters, because so many of them are embeddedwithin state and local governments or educational institutions.
A better source of data on arts presenters in the United States is the Associationof Performing Arts Presenters (APAP), which as of 1999 put its membership atroughly 1,600. According to a 1993 membership survey (APAP, 1995), approxi-mately 46 percent of respondents were independent nonprofit organizations,while another 38 percent were public or private educational institutions. Just1.2 percent of respondents were commercial for-profit organizations; a tiny 0.6percent were unincorporated. Note, however, that the APAP membership maynot be representative of all presenters—for example, for-profit theater housessuch as the Shubert and Jujamcyn chains are not members of APAP—so thesenumbers probably overestimate the relative proportion of nonprofit to for-profit organizations.
Interestingly, the geographic distribution of arts presenters revealed by the sur-vey is fairly even. Equal numbers of respondents were located in small citiesand large urban areas (36 percent), with smaller numbers located in rural areas(16 percent) and suburban areas (12 percent). The top three states representedwere California, New York, and Ohio, but regional disparities, when controlledfor population, were surprisingly low. This may reflect state and local govern-ment policies that have broadened access to the arts by supporting the creationof performing arts centers in regional hubs, small towns, and suburban neigh-borhoods across the country. It also reflects the important role played by highlygeographically dispersed educational institutions in sponsoring and presentingthe live performing arts.
Educational Institutions Are the Most Common Type of Presenter
Table 6.2, which offers a look at who the presenters are in terms of their organi-zational type rather than their tax status, shows that educational institutions arethe most prevalent organizational type (37 percent). Arts and civic centers (13percent) and local arts agencies (7 percent) are also well-represented in theAPAP membership.
The large number of presenters connected to educational institutions suggeststhat the policies of colleges and universities may strongly influence the ability oflive performing organizations to reach audiences. Many of the decisions aboutwhat gets performed and who performs it are being made by institutions thatdo not consider the performing arts central to their mission. In fact, more than40 percent of the survey respondents did not consider presenting arts programs

66 The Performing Arts in a New Era
Table 6.2
Membership of APAP by Category of Presenting Organization, 1993
Number PercentEducational institutions 188 37
Public or private college or university 179 36School or school district 9 1
Performing arts facilities 145 28Performance facility 69 14Arts or civic center 68 13Culturally specific center 8 1
Cultural series organizations 63 13Festival, fair, or cultural series 60 13Culturally specific arts organization 3 0Local arts agency 36 7Performing group/producer 11 2Museum, gallery, or library 7 2Othera 52 10
TOTAL 502 100
SOURCE: Association of Performing Arts Presenters (1995).NOTE: Percentages do not sum to 100 because some organizations areincluded in multiple categories.aThe category “Other” includes religious, business, union, and stateand federal government organizations.
to be central to their mission; rather, they considered the arts either distinctfrom or complementary to another mission. Many in this group were collegeand university presenters.
Music and Dance Programs Are Most Likely To Be Presented
In terms of programming activity, music, dance, theater, and opera/musicaltheater programs were most often reported by respondents to the APAP survey(see Figure 6.4). Musical programs were reported by 89 percent of respondents,76 percent reported dance programs, 71 percent reported theater programs,and 53 percent reported opera or musical theater programs. In terms of pro-gramming within art forms, popular genres such as rock and roll and jazz dom-inated musical programming, while modern and folk dance presentationsdominated dance programming. Interestingly, the survey suggests that ballet isrelatively more likely to be presented in small cities and rural areas, while thereverse is true for modern dance. APAP (1995) explains this in terms of compe-tition, arguing that urban areas are more likely to have their own professionalballet companies.16
______________ 16But urban areas are also more likely to have their own modern dance companies. An alternativeexplanation is that ballet is preferred to modern dance in more conservative rural communities.Relevant empirical evidence for this explanation, applied to opera, is presented in Pierce (2000).

Characteristics of Performing Arts Organizations 67
SOURCE: Association of Performing Arts Presenters, 1995.aIncludes musical theater.
RAND MR1367-6.4
Music
Dance
Theater
Operaa
Lectures/Speakers
Visual arts
Media arts
Interdisciplinary
Photography
Literary arts
Crafts
Folk arts
Design arts
0 80604020 100
Percentage of respondents (N = 446)
89
76
71
53
33
28
19
17
10
9
7
7
4
Figure 6.4—Arts Presenters’ Programming Activity by Discipline, 1993
The Recorded Performing Arts
We know far less about firms that produce and distribute the recorded perform-ing arts (a category that includes broadcast live arts) than we do about firmsthat perform and present live performing arts, for the reasons described above.However, based on definitions provided by the Census Bureau, we can identifyfour categories of organizations relevant to the production and distribution ofthe recorded performing arts:17
• firms primarily engaged in producing and distributing musical recordings,in publishing music, or in providing sound recording and related services
______________ 17Classification and definitions are based on the North American Industrial Classification System(NAICS), which is used in the 1997 Economic Census. A large category we do not consider here ismotion picture and video production and distribution, but (as noted above) we do not analyze thefilm industry here. The manufacture and distribution of musical instruments is also outside thescope of this analysis.

68 The Performing Arts in a New Era
• firms that operate radio or television studios and facilities for the pro-gramming and transmission of programming to the public, as well as dataon establishments that assemble television program material and transmitit over cable or satellite systems
• firms primarily engaged in the wholesale distribution of prerecorded CDs,audio or video tapes, and phonograph records
• firms primarily engaged in retailing new prerecorded audio and videotapes, CDs, and phonograph records.
Most Recorded Arts Organizations Are For-Profit
By far the majority of organizations that produce and distribute the recordedperforming arts are taxable. The 1997 Economic Census does not publish in-formation about nonprofit organizations within any of the classifications listedabove, but, for broadcasting at least, we can estimate the number of nonprofitorganizations on the basis of IRS data.18 As shown in Table 6.3, less than 20percent of broadcasting organizations were in the nonprofit sector.
Recorded Arts Firms Are Concentrated in New York and California
Geographically, the recording and broadcasting industries, like the live per-forming arts, are heavily concentrated in New York and Los Angeles, with amuch smaller center of activity in Nashville, Tennessee. However, because thedistribution networks for the products of these industries are nationwide, pro-duction location has very little effect on the geographic distribution of con-sumers. At least in urban areas, consumers in Hawaii and Florida have as muchaccess to CDs and television programming as consumers in California or New
Table 6.3
Numbers of Recorded Arts Organizations by Activity, 1997
Number ofFor-profits
Number ofNonprofits
Music recording and publishing 2,935 NABroadcasting 8,789 1,549Music wholesalers 1,418 NAMusic stores 8,158 NA
SOURCES: U.S. Bureau of the Census, 1997 Economic Census andNational Center for Charitable Statistics, 1998 Core File.
______________ 18These data are taken from Form 990s filed by nonprofit 501(c)(3) organizations with annual rev-enues greater than $25,000. In radio, for example, they therefore include most National Public Ra-dio affiliates, but do not include the student-run station at the local university.

Characteristics of Performing Arts Organizations 69
York.19 This is in contrast to the live performing arts, where production mustoccur in front of the audience, so that audience penetration is inversely corre-lated with geographic distance from production location. Further, as recordedarts products become smaller and more transportable and digital technologiesallow consumers to share content across a growing variety of media devices, thelocational freedom offered by the recorded arts is in growing contrast to the lo-cational constraints of the live arts.
Industry Concentration in the Recorded Arts Is High
What could be more of an issue—and possibly a concern—is the high degreeof industry concentration in the recording, music publishing, and televisionand cable broadcasting industries, suggesting that entry barriers are high andcompetition may be limited.20 Almost half of the total income earned bytelevision producers, for example, reflects the earnings of just four very largefirms (Table 6.4). Similarly, four firms earned fully two-thirds of the totalreceipts of all integrated record producers and distributors in 1997, and 20 firmsaccounted for almost 100 percent of the total.21 In May 2000, the U.S. FederalTrade Commission (FTC) reached an antitrust settlement with the five largestrecord companies—representing approximately 85 percent of all U.S. CD
Table 6.4
Percentage of Receipts by Largest Recorded Performing Arts Firms, 1997
Total receipts($1,000s)
4 largest firms(percent)
20 largest firms(percent)
Sound recordingRecord production only 182,369 20.4 48.1Integrated record production and
distribution 8,735,863 66.9 96.8Music publishing 1,368,407 48.5 73.0Recording studios 540,601 6.9 20.5
BroadcastingRadio broadcasting 10,648,134 22.7 42.2Television broadcasting 29,777,076 48.6 71.3Cable distribution 45,389,578 42.3 74.3
SOURCE: U.S. Bureau of the Census, 1997 Economic Census.
______________ 19In broadcasting there is still some issue about the influence of production location on pro-gramming (New York–based television producers may be more likely to showcase New York–basedartists and companies, for example) but as long as the industry is competitive, producers must be atleast somewhat responsive to their national consumer audience in order to stay profitable.20It is also worth noting that there has been considerable consolidation within these industriesboth nationally and internationally since the 1997 Economic Census was conducted.21More detailed analyses of the structure of the American popular music industry can be found inSanjek and Sanjek (1991); Scott (1999) discusses why companies in the music business tend tocluster together.

70 The Performing Arts in a New Era
sales—ordering them to discontinue their practice of coercing potentialdiscounters into maintaining minimum advertised prices for CDs (FTC, 2000).But more than high prices, the concern is that concentration in the recordedarts industry will limit innovation. Some studies have found this to be true inthe past (Peterson and Berger, 1996).
To summarize our points about the current picture of performing arts organi-zations: As of the late 1990s, available data suggest that the live performinggroups in the high arts are overwhelmingly organized as nonprofit organiza-tions, whereas groups that perform popular music are overwhelmingly for-profit. Performers are geographically concentrated in New York and California,but less so than the relative size of the populations of these two states mightpredict. Most performing organizations are small in terms of their revenues,and many rely primarily on voluntary labor from their communities, definingthem as volunteer-sector organizations. With the exception of opera, the barri-ers to entry for new firms are not terribly high. Presenting organizations alsooperate primarily in the nonprofit sector, but a large fraction of them are em-bedded within higher education institutions. In contrast, the recorded arts areoverwhelmingly for-profit, and are heavily concentrated both geographicallyand in terms of revenues.
KEY TRENDS
The Average Nonprofit Performing Group Is Getting Smaller; theAverage For-Profit Is Getting Bigger
Over the past two decades, the number of live performing organizations hasgrown significantly but their average revenues—at least in the nonprofit sec-tor—have not. As shown in Figure 6.5, the number of both nonprofit and for-profit performing groups increased between 1982 and 1997, but at very differentrates. Whereas the number of for-profit performers expanded by 44 percentover the 15-year period (an annual average increase of 3 percent), the numberof nonprofit performers increased approximately twice as fast (an annual aver-age increase of 6 percent). During this same period, the average revenue of for-profits measured in 1992 dollars grew by 13 percent (an annual average increaseof less than 1 percent), while average real revenues of nonprofits actually fell by7 percent (an annual average decline of 0.5 percent).
Because Census data over time represent a changing sample of performing or-ganizations, it is impossible to know whether declines in average revenues cal-culated from Census data imply declines for existing nonprofits or whether theyreflect the entrance of many smaller groups into the nonprofit live performingarts. Regardless, in aggregate terms the trend has been toward more but smaller

Characteristics of Performing Arts Organizations 71
Nonprofit
For-profit
Per
cent
age
chan
ge
–20
0
20
40
60
80
100
Number of organizations Average revenues
RAND MR1367-6.5
81%
44%
13%
–7%
SOURCE: U.S. Census Bureau, 1982 and 1997.
Figure 6.5—Changes in the Number and Revenue Size ofPerforming Organizations, 1982–1997
nonprofits and more but larger for-profits.22 Thus the relatively unconcentratednonprofit sector is becoming even less concentrated, while the alreadyconcentrated for-profit sector is becoming more so.
Patterns of Growth Differ by Sector and Discipline
Annual growth rates in numbers of organizations disguise a variety of experi-ences across disciplines over the 1982–1997 period, most evident in the cate-gory “other music,” where the number of nonprofit performers shot up by over9 percent (Figure 6.6). Increases in the numbers of nonprofit theater, dance,opera, and classical music performers were also significant, but less pro-nounced, ranging between 4.5 and 6 percent. On the for-profit side, there werefewer new organizations overall. The slow growth in the number of commercialdance groups is noticeable, but there were very few to begin with.
______________ 22It is possible that some or even all of the apparent trend in number and average size of revenuesof live performing arts nonprofits between 1982 and 1997 can be explained by improvements in theCensus Bureau’s ability to identify small nonprofit arts organizations. However, this would not ex-plain why the average real revenue for the growing number of for-profits is increasing.

72 The Performing Arts in a New Era
0
2
4
6
8
10
Opera Dance Othermusic
Classicalmusic
Theater
Per
cent
age
incr
ease
RAND MR1367-6.6
SOURCE: U.S. Census Bureau, 1998 Economic Census and 1982 Census of Service Industries.
For-profit
Nonprofit
Figure 6.6—Annual Increases in Numbers of Performing Organizationsby Discipline, 1982–1997
In terms of real revenue growth, illustrated in Figure 6.7, the fastest growingnonprofit category was opera, averaging almost 2 percent per year per com-pany. By the standards of most established industries, this was a healthy growthrate, confirming those who have claimed the existence of an “opera boom” overthe past 15 years.23 The discipline with the greatest decline was “other music,”which fell almost 4 percent per year per performing group. The extremelystrong growth in the number of nonprofit performing organizations, combinedwith declining budgets particularly in nonclassical music categories, maysuggest a new trend in the organizational dynamics of the performing artsworld: a proliferation of niche-market performers within the volunteer sectorwho have either just come into existence or had been previously operating un-seen because they were unincorporated.
In the for-profit sector only two of the disciplines actually experienced real rev-enue growth between 1982 and 1997: dance and nonclassical music. Of these,the more significant is the growth in average revenues of firms performing
______________ 23Unfortunately, opera data are not available for the for-profit sector because of Census Bureaurules against disclosure of proprietary information.

Characteristics of Performing Arts Organizations 73
Per
cent
age
chan
ge
–4
–2
0
2
4
6
8
Theater DanceOperaa Classicalmusic
Othermusic
SOURCE: U.S. Census Bureau, 1998 Economic Census and 1982 Census of Service Industries.
aData not available for the for-profit sector.
RAND MR1367-6.7
For-profit
Nonprofit
Figure 6.7—Annual Change in Average Total Revenues for Performing Groupsby Discipline, 1982–1997
nonclassical music, which increased at a rate of 1.4 percent.24 As we notedabove, the many musical groups within this category perform popular genreslike rock, soul, and country and western, which appeal to a large and diversifiedaudience. If these popular music firms are excluded from the for-profit total,the average change becomes negative (–0.3 percent) and the for-profit sectorlooks more like the nonprofit sector.
Nonprofit Performing Arts Venues Are Proliferating
Although consistent data over time on presenting organizations are lacking,formal and anecdotal evidence suggests that performing arts venues prolifer-ated in the 1970s, 1980s, and 1990s, especially in the nonprofit sector. For ex-ample, 1993 APAP data indicate that over one-third of all existing venues were
______________ 24This is because, as noted above, the number of for-profit dance groups is very small.

74 The Performing Arts in a New Era
SOURCE: Association of Performing Arts Presenters.
RAND MR1367-6.8
Before 1900
1900s
1910s
1920s
1930s
1940s
1950s
1960s
1970s
1980s
1990–1993
0 2015105 25
Percentage of all venues
Figure 6.8—Establishment of Performing Venues by Decade, as of 1993
built between 1980 and 1993 (Figure 6.8). One reason for the large numbers ofvenues built in recent years may be the growing emphasis placed by local andstate governments, which are the major financers of many of these perfor-mance venues, on the economic benefits of the arts. Community developmentblock grants, for example, are being used to finance the building of theaters,symphony halls, and all-purpose performing arts centers (Larson, 1997). Manyof these newer facilities may be replacements for older facilities that have falleninto disrepair through the years.
FUTURE ISSUES
The data on organizations within the performing arts delivery system, althoughimperfect, not only characterize those organizations in terms of how manythere are, how big they are, and what they do, they also point to what the deliv-ery system may look like in the future. These data, combined with case studyevidence and popular press accounts, suggest four trends that are particularlyworth noticing.

Characteristics of Performing Arts Organizations 75
Dynamism of Small, Volunteer-Sector Performers
The rapid growth of small, nonprofit, nonprofessional performing groups in allfields except opera suggests the growing vitality of community-based perform-ing arts in America. These groups, many of which have revenues well under$100,000, tend to emphasize local participation and rely heavily on volunteerlabor provided by local artists and administrators. Some are brand-new organi-zations, but others may have only recently incorporated as 501(c)(3) organiza-tions, and so are only now being included in official statistics. Almost by defini-tion, these groups do not feature big-budget productions or celebrity artists.
Music is the only discipline for which the data distinguish between high(classical) and popular or folk genres. Data from the “other music” category ofthe Economic Census suggest that many of the small musical groups that areproliferating do not perform classical music. Anecdotal evidence also suggests ahigh degree of nonclassical programming among other small performing artsgroups. According to data collected by the research firm NuStats, almost 50percent of organizations involved in folk arts activities had annual budgets un-der $100,000, and fully one-third had budgets under $50,000 (Peterson, 1996).
Rapid Growth of the Performing Arts Infrastructure
The large number of new performance venues reported by APAP membershipindicates that the performing arts infrastructure is still growing rapidly. But whowill use these facilities? Many of the government-sponsored venues, for exam-ple, are built with the expressed purpose of providing space for small artsgroups to perform but, ironically, many small groups cannot perform there be-cause the facilities were established as union houses and these low-budgetgroups cannot afford to pay union wages.25 In addition, once these facilities arebuilt, will they be able to afford their day-to-day operating costs? We touchupon this question in the next chapter.
Increasing Concentration of the Recorded Arts
The for-profit music and broadcasting industries are among the most concen-trated U.S. industries, and increasingly they are merging with each other. Forrecorded music, concentration is on a global scale: Of the current top four ma-jor record labels (in 1999 there were six), just one is an American company.
______________ 25We are indebted to Ben Cameron, Executive Director, Theatre Communications Group, forpointing this out. For a fuller discussion of the role that unions play in the performing arts, seeCaves (2000).

76 The Performing Arts in a New Era
Many analysts believe even more consolidation is in store, as the four majorscontinue to buy up midsized independents (Pollack, 2000).
What will this mean for consumers? No one knows for sure, and the growingrole of the Internet makes forecasting even more difficult. But past research onthe music business suggests there is an inverse relationship between the diver-sity of popular music offerings and the degree of corporate concentration in theindustry (Peterson and Berger, 1990, 1996). To the extent that this type of con-solidation limits competition and consumer choice, it is likely to raise antitrustissues for the commercial music sector.
Impact of the Internet
While increased concentration of the recorded arts industry could imply lesschoice and higher prices for consumers, in music (and soon maybe in otherperforming art forms as well) this tendency may be offset by musicians’ andconsumers’ use of the Internet. Popular press accounts suggest that the Internetis allowing both musicians and consumers to circumvent the record company“gatekeepers” that have largely controlled access to music in the past. One pos-sible implication of the decline in importance of record company gatekeepers isan increase in the influence of web-based critics who may or may not be inde-pendent of the record companies.
More immediately, while press accounts suggest record companies are comingto terms with music distribution over the Internet, independent distributorsand retailers of recorded music are losing out (Stroud, 2000). Recent legal ac-tions seem likely to do little to prevent these organizations from hemorrhagingeven more money. Will “bricks-and-mortar” music retailers go the way of thedodo? If so, what will it mean for consumers who are on the wrong side of thedigital divide?
Web-based technologies are also allowing once geographically restricted formsof art to reach new and far-flung audiences. For musical groups, the benefits ofthe Internet are particularly strong, because it allows audiences to actually lis-ten to their work and potentially even to buy it. But even for dance and theatergroups, the Internet can be an important clearinghouse, allowing them tocommunicate with potential audiences and helping to create a community ofsupport. Thus, at least potentially, the Internet is creating profitable opportuni-ties for small, niche-market for-profit arts organizations that had previouslybeen dependent upon their local ethnic and cultural communities for support.

77
Chapter Seven
FINANCIAL SITUATION OF PERFORMING ARTSORGANIZATIONS
How to finance the performing arts—particularly, how to finance live perfor-mances of nonprofit theater, ballet, opera, and classical music—has been an is-sue for performing arts enthusiasts since at least the early 20th century. Asnoted in Chapter Three, by the 1920s even the wealthiest individuals were un-able or unwilling to take on sole financial responsibility for such high-cost per-forming organizations as symphony orchestras and opera companies. This de-velopment led to the creation of today’s standard model for the nonprofitorganization, in which a board of directors or trustees is empowered to oversee,but not wholly support, the financial health of the institution.1 It was not untilBaumol and Bowen (1966), however, that the chronic nature of the problemprofessional live performing groups face in raising sufficient revenues to covercosts was widely recognized. Baumol and Bowen’s work, which argued that thelive performing arts, unlike the recorded popular arts, can never entirely sup-port themselves in the marketplace, was a primary motivation for increasedfunding of the NEA, the increases in foundation funding that followed the Fordinitiative, and, more generally, direct government funding for the arts.2
In the decades that followed Baumol and Bowen’s work, professional nonprofitperforming groups and presenters witnessed a dramatic increase both in theamounts and diversity of sources of contributed revenues. Direct federal sup-port has been a relatively small but significant part of the funding mix, leverag-ing private and state and local government support for the arts through a sys-tem of matching grants and grants-in-aid to states. Recently, however, aspointed out by Cherbo and Wyszomirski (2000), this system has begun to breakdown. The battle over continued funding of the NEA in the early 1990s provides
______________ 1See, for example, Levine (1988).2Baumol and Bowen (1966) did not distinguish between nonprofit and for-profit live performingorganizations in their analysis. In fact, many of their examples are taken from the for-profit Broad-way theater. Elsewhere, Baumol and Baumol implicitly argue in favor of government subsidies forBroadway (Baumol and Baumol, 1977; 1985b).

78 The Performing Arts in a New Era
vivid evidence of the controversy over government, and especially federal gov-ernment, funding of the arts.
In this chapter we take a detailed look at financing patterns in the performingarts. We concentrate our discussion on the professional nonprofit live perform-ing arts—in part because that sector’s financial problems are the subject ofgreatest policy concern, and in part because we have so little data on the for-profit live and recorded arts segments of the performing arts delivery system.Since voluntary-sector institutions receive most of their support in the form ofvolunteer labor and in-kind donations, finances have little relevance for themper se.
After a brief discussion of key concepts and data issues, we describe the aggre-gate financial portrait of performing arts organizations today and show howthat profile varies by discipline and how it is changing. To conclude, we discussthe strategies that both for-profit and nonprofit professional organizations havebeen using to address their financial pressures, and we identify some of the is-sues these strategies raise for the future.
KEY CONCEPTS
Whether they are part of the performing arts delivery system (and whether theyoperate in the live or the recorded segments of that system), there are severalbasic differences between the finances of for-profit and nonprofit institutions.As noted in the previous chapter, commercial firms are in business to make aprofit and rely for their revenues on market earnings. Nonprofit organizations,on the other hand, in exchange for tax-exempt status and its prohibition onprofit distribution, are organized to collect revenues from a wide variety ofearned and unearned income sources.3
For nonprofit as well as for-profit performing groups, earned income includesadmission (box office) receipts, touring and institutional fees as well as earningsfrom unrelated business activities (concessions, food sales, gifts shops, etc.),and investment income.4 For the recorded arts, product sales and advertisingslots substitute for admission receipts. Unearned income to the nonprofitsector consists of grants and contributions. These unearned revenues comefrom a variety of sources including federal, state, and local government,foundations, individuals, and businesses.
______________ 3We use the terms “unearned” and “contributed” income interchangeably.4Income from investments is often treated as a separate category because it typically representsearnings from endowment (and is thus a form of deferred charitable giving). For simplicity, we in-clude it here as earned income and note, as we will demonstrate, that it constitutes a very smallfraction of revenues.

Financial Situation of Performing Arts Organizations 79
In addition to their various forms of direct support, nonprofit organizationshave two other sources of indirect support. First, like unincorporated organiza-tions, they receive support in the form of volunteer labor and in-kind dona-tions. Although difficult to estimate, these noncash benefits may be substan-tial.5 Second, under Section 501 of the Internal Revenue Code, contributions to501(c)(3) nonprofit institutions are tax deductible. The government contribu-tion to the institution is therefore equal to the tax revenues forgone in theamount of the private contribution multiplied by the contributor’s tax rate. In-direct subsidies of this type include federal, state, and local taxes forgone fromdeductions to individual and corporate income taxes, and property gifts. Thisform of indirect government support far exceeds the amount of direct govern-ment support to the arts.6
The combination of public and private support for the nonprofit sector, includ-ing the nonprofit performing arts, is a uniquely American phenomenon thatcan best be described as a public-private partnership (Hall, 1987). A particularlystriking feature of the partnership is that the government’s indirect subsidy tononprofit institutions through the tax deductibility of contributions is targetedaccording to the wishes of individual donors rather than the government. Withrespect to the arts, this approach is in marked contrast to that of many Euro-pean countries, where government-directed support for the arts is a basic tenetof public policy (Schuster, 1994).
Despite these differences in the source of their revenues, both for-profit andnonprofit institutions must, over the long run, operate within the constraintsimposed by their total revenues. But whereas the expenditures of for-profit in-stitutions are constrained by their market earnings, the expenditures of non-profits are typically greater than their earned revenues. This difference, oftenreferred to as the “earnings gap” (or sometimes the “income gap”), is made upby the various forms of unearned income described above.
An important conceptual issue surrounding the earnings gap of nonprofit insti-tutions, including performing arts nonprofits, concerns the extent to which theyare able to reduce their expenditures without sacrificing their basic missions. Aswe discuss in greater detail below, whether the problem of the earnings gap inthe nonprofit performing arts is perceived to be severe depends greatly on theextent to which expenditures—and the underlying costs that drive them—areperceived to be under the control of the artistic directors and business man-agers of performing arts organizations. A second issue, which is primarily a data
______________ 5See, for example, Colonna (1995).6Schuster et al. (1983) estimate that indirect subsidies make up two-thirds of all government sup-port to the arts.

80 The Performing Arts in a New Era
issue, concerns the way that the gap is reported or calculated. Since nonprofitinstitutions have an incentive to manipulate the size of their earnings gaps inorder to motivate fundraising campaigns, accurate calculation of the gap is notalways straightforward. Nonetheless, nonprofit institutions are, over the long-run, subject to the same revenue constraints as for-profit institutions in deter-mining their total expenditures: i.e., their expenditures cannot exceed their rev-enues.
Finally, no analysis of the financial situation of performing arts organizationswould be complete without a reference to the “cost disease,” a theory put for-ward by Baumol and Bowen in their classic 1966 study of the economics of theperforming arts. In that work, they asserted that, because dance companies,theater groups, opera companies, and orchestras cannot use technology to sub-stitute for increasingly expensive artistic labor, over time performing groupswould see their costs per unit of output rising faster than the general price level.If, furthermore, performing groups are either unable or unwilling to raise ticketprices in tandem with these rising costs, their earnings gaps must grow largerover time.
DATA SOURCES
Ideally, tracking the finances of organizations within the performing arts deliv-ery system would require detailed information on earned revenues, unearnedrevenues, and expenditures. For earned revenues and expenditures, the sourcesare the same as those discussed in the previous chapter: the U.S. Census Bu-reau’s Economic Census, the IRS Form 990 data on nonprofit organizations,and the information collected by various NSOs and industry associations. Byand large, these sources contain considerably more information on revenuesthan expenditures. For unearned revenues, potential additional sources of in-formation are the surveys conducted by The Foundation Center (on charitablegiving by foundations), the AAFRC Trust for Philanthropy (on charitable givingby individuals, presented in the publication Giving USA), Independent Sector(for volunteering and charitable giving by individuals), Business Committee forthe Arts (on charitable giving by corporations), and various publications put outby the NEA, National Association of State Arts Agencies (NASAA), and Ameri-cans for the Arts (on grants provided by various levels of government). Unfortu-nately, only the NEA, NASAA, and Americans for the Arts separate performingarts data from data for other art forms, so we do not use the other sources here.

Financial Situation of Performing Arts Organizations 81
Before 1997, the Economic Census provided data on revenues plus annual andfirst quarter payroll for performing, presenting, reproducing, and distributingorganizations classified by tax status, location, and firm size. In addition to theproblems noted in the previous chapter, a major problem with using EconomicCensus data to track organizational finances is that, before 1997, they containno publicly available information on expenditures other than payroll expendi-tures.7 This means they cannot be used to calculate a time trend of the differ-ence between total expenditures and revenues. In addition, although the 1997Economic Census data on performing groups and presenters include revenuebreakdowns such as membership dues and fees, admissions, and shares of re-ceipts from concessions, before 1997 the revenue data consisted only of totalrevenues.
The IRS Form 990 data, based on tax forms filed by nonprofit organizations or-ganized under Section 501 of the tax code, contain annual data on earned andunearned revenues as well as limited expenditure data for nonprofits with grossreceipts in excess of $25,000. The Form 990 data provide considerable detail onthe various sources of revenues for nonprofits, although they do not separategovernment grants from private donations. Moreover, as described in ChapterSix, since the early 1990s the IRS has adopted a very useful and consistentscheme for classifying nonprofit organizations. Unfortunately, the IRS non-profit data suffer from two big drawbacks. First, as we noted earlier, compre-hensive coverage of arts organizations did not begin until the early 1990s. Sec-ond, because of their highly disaggregated nature, the data require a significantamount of processing before they are suitable for analysis.8
The NSOs and industry associations also collect financial information on theirmembers. Although industry organizations for for-profit firms provide verylimited expenditure data, associations of nonprofit performing and presentingfirms seem to be the best source of detailed expenditure data for this sector.However, all the caveats described in the previous chapter still apply: the in-formation collected and reported varies (often substantially) across associa-tions; coverage is limited to member institutions, which tend to be large andwell-established; data are generally not comparable over time; and publishedresults are reported at a high level of aggregation.
______________ 7However, the Census Bureau did put together a set of special tabulations from the 1987 Census forthe NEA, and some of this information is reported in Westat (1992). The 1987 total expendituresdata we report here derives from this source.8Data-entry errors or changes in the reporting or accounting procedures of individual organiza-tions, for example, can dramatically change calculations based on these data. These and other Form990 data issues are discussed in Froelich and Knoepfle (1996).

82 The Performing Arts in a New Era
CURRENT PICTURE
The Earnings Gap Is Still Substantial
As shown in Figure 7.1, Economic Census data indicate the earnings gap forprofessional nonprofit performing groups is still substantial.9 Opera companiesexperienced by far the largest disparity between earned income and expenses,averaging $1.6 million each in 1997, with classical music organizations a distantsecond, averaging under $600,000 each. Note, however, that the category ofclassical music includes both symphony orchestras and chamber music groups;if there were corresponding data on symphony orchestras alone we might find amuch higher average earnings gap. Other music groups, which include amedley of generally small folk and popular performers from the volunteersector, had the smallest average gaps at $78,000.
Tho
usan
ds o
f dol
lars
–1800
–1600
–800
–600
–400
–1400
–1200
–1000
–200
0
Theater DanceOpera Classicalmusic
Othermusic
SOURCE: U.S. Census Bureau, 1997 Economic Census.
RAND MR1367-7.1
Figure 7.1—Average Earnings Gap for Nonprofit Performing Groups, 1997
______________ 9These data include information on some volunteer-sector groups that have formally incorporatedas nonprofit organizations.

Financial Situation of Performing Arts Organizations 83
Contributed Income Has Been Making Up the Difference
Fortunately—and perhaps not coincidentally—most nonprofit performinggroups have managed to make up their earnings gaps through unearned in-come. How important is earned income to their total budgets? As Figure 7.2demonstrates, in 1997 it varied by discipline, ranging from well over 60 percentamong nonprofit theater organizations to just over 50 percent for opera com-panies, symphony orchestras, and chamber ensembles. However, the earnedincome percentages for opera companies and classical music groups in particu-lar reflect the income they received from endowments that benefited from thestrong U.S. stock market of the 1990s. If investment income is removed fromthe earned income calculation, the earned income percentages for opera andclassical music fall to just 44 and 45 percent, respectively.10 This suggests that
0
10
20
30
40
50
60
70
80
90
100
Per
cent
age
Theater DanceOpera Classicalmusic
Othermusic
SOURCE: U.S. Census Bureau, 1997 Economic Census.
RAND MR1367-7.2
Figure 7.2—Earned Income as a Percentage of Total Revenue, 1997
______________ 10Omitting investment income has much less impact on the earned income percentages for the-ater, dance, and other music companies, which fall by just 3, 1, and 1 percentage points, respec-tively.

84 The Performing Arts in a New Era
these organizations may be particularly vulnerable to sudden drops in the stockand other asset markets. In any case, with or without the inclusion of invest-ment income, these data suggest that nonprofit performing arts organizationscould not operate at their current scale without generous contributions fromsupporters.
Where, then, do nonprofit performing groups go to make up their earnings gap?As Figure 7.3 indicates, they rely on a diverse set of sources. The most importantof these are private contributions from individuals, which constitute 15 percentof total revenues. Revenues from corporate and foundation sources each rep-resent about 7 percent of the total. Interestingly, direct government supportconstitutes the smallest fraction, with the NEA contributing on average just 1percent, and other government sources (primarily state and local governments)contributing 4 percent of total revenues.
Earned income59%
Othergovernment
4%
Individuals15%
Foundations7%
Businesses7%
Other7%
NEA1%
SOURCE: U.S. Census Bureau, 1997 Economic Census.
RAND MR1367-7.3
Figure 7.3—Sources of Revenue for Nonprofit Performing ArtsOrganizations, 1997

Financial Situation of Performing Arts Organizations 85
KEY TRENDS
Direct Public Funding Declined Through Most of the 1990s
Direct government funding constitutes an important (although not the princi-pal) source of revenue for nonprofit performing groups. However, as shown inFigure 7.4, after correcting for inflation, federal arts funding has been trendingdownward since the mid-1970s, while state and local funding climbed until theearly 1990s. Since then, total government funding has been declining until re-cently. 11
More striking than the downward trend in federal funding is the clear shift in di-rect funding from the federal to the state level, and increasingly to the local
Mill
ions
of 1
999
dolla
rs
1400
1200
1000
800
600
400
200
01970 1974 1978 1982 1986 1990 1994 1998
State appropriationsNEA appropriations
Local funding
Total governmentfunding
RAND MR1367-7.4
SOURCES: IRS Form 990, Business Master File Sample, National Endowment for the Arts, National Association of State Arts Agencies, Americans for the Arts.
NOTES: Local and state appropriations do not include NEA block grants. Components do not sum to total government funding because of differences in estimation methodologies.
Figure 7.4—Government Funding for the Arts, 1970–1999
______________ 11Until recently, data on government funding for the arts have not been reported in a compre-hensive or systematic fashion. Thus, the data in Figure 7.4, which are based primarily on NEA re-ports, use different starting points.

86 The Performing Arts in a New Era
level. Grants from these different levels of government differ in average size, thecharacteristics of their recipients, and the rationales for which they are given.12
In particular, state and local governments tend to focus less on the arts per seand more on the social and economic benefits to local communities whenawarding grants.
The subject of decentralization of government funding is known in the eco-nomics literature as “fiscal federalism,” and has been popular for the last 20years in the United States (Oates, 1999). There are several instruments for carry-ing out policy in this area, including taxes, debt instruments (e.g., bonds), andintergovernmental grants such as block grants, which are a major component ofthe NEA’s annual budget.13 The movement toward devolution of decisionmak-ing and financing to lower levels of government is motivated by the belief thatlocal communities, which know local needs, can better use and administerfunds for cultural programs than can the federal government. The sensitivity ofstate and local government funding for the arts to their constituencies is sug-gested by the fact that state arts agencies make approximately six times as manygrants with less than twice as much money (DiMaggio, 1991). However, stateand local arts council budgets are highly volatile and tend to vary both with thestate of the economy and with the public’s perception of the relative merits ofvarious demands for taxpayer dollars (Brooks, 1997). To the extent that localarts organizations are reliant on local government funding, this situation maycreate substantial volatility in their budgets.
Indeed, comparisons of overall funding levels among the various levels of gov-ernment do not provide a clear enough picture of the impact of state and localgrants on local performing arts agencies because the populations these grantsare designed to serve differ dramatically. Figure 7.5 demonstrates this point bycomparing total funding and per capita funding for the arts from the NEA, theGeorgia Council for the Arts, and the Atlanta Bureau of Cultural Affairs. Al-though the budget of the NEA is nearly 100 times that of the Atlanta Bureau ofCultural Affairs, the arts funding per capita is ten times higher for the latter thanit is for the former. In other words, local government funding has greater fiscalimpact on local communities than does federal funding.
______________ 12The most detailed treatment of this issue is contained in DiMaggio (1991). Although DiMaggiosuggests that the difference in federal and state funding patterns and priorities is less pronouncedthan one might expect, his conclusions are based primarily on evidence from the 1980s.13In fiscal 2000, for example, 40 percent of the NEA’s $96.7 million budget was targeted for blockgrants.

Financial Situation of Performing Arts Organizations 87
$97.6
0
10
20
30
40
50
60
70
80
90
100
NationalEndowmentfor the Arts
$5.4
GeorgiaCouncil for
the Arts
$1.2
AtlantaBureau ofCulturalAffairs
Mill
ions
of d
olla
rs
NationalEndowmentfor the Arts
$0.36
GeorgiaCouncil for
the Arts
$0.69
AtlantaBureau ofCulturalAffairs
$3.00
0.00
0.50
1.00
1.50
2.00
2.50
3.00
3.50
Do
llars
pe
r ca
pita
SOURCES: NEA, Georgia Council for the Arts, and Atlanta Bureau of Cultural Affairs, 2000.
RAND MR1367-7.5
Figure 7.5—Fiscal Year 2000 Budgets and Appropriations per Capita for ArtsAgencies at Three Levels of Government
Private Contributions Have Been Climbing, butFunding Practices Are Changing
Private contributions from individuals, business, and foundations togetherconstitute the final source of unearned revenues for nonprofit arts organiza-tions. As shown earlier in Figure 7.3, contributions from individuals are thelargest of these sources—approximately twice the size of foundation grants andcontributions from business. As demonstrated in Figure 7.6, the average contri-bution from each of these sources has generally been increasing, although notwithout some interruptions. For example, contributions from these sourceswere relatively flat from 1987 through 1992, no doubt reflecting the moderaterecession during that period.
Contributions from individuals increased more than any other single source ofphilanthropic support, particularly between 1992 and 1997. Overall, however,common intuition among arts administrators is that these totals reflect greater

88 The Performing Arts in a New Era
Ave
rage
con
trib
utio
ns p
er o
rgan
izat
ion
(tho
usan
ds o
f 199
2 do
llars
)300
250
200
150
100
50
0
Other
Business
Foundation
Individual
1977 1982 1987 1992 1997
SOURCE: NEA (1998b, c, d); U.S. Bureau of the Census, 1997 Economic Census; and authors’ calculations.
RAND MR1367-7.6
Figure 7.6—Philanthropic Giving to the Arts, 1977–1997
numbers of small donations rather than increased donation amounts from in-dividual donors. Indeed, as generous individual patrons of the arts get older, thecharitable sector has become increasingly concerned about who will replacethem (Balfe, 1989). Arts organizations are also facing higher costs of fundraisingas they pursue a greater number of individual donors.
Financial support from corporations has generally been increasing, but theirfunding practices appear to be changing. Corporate donors have moved awayfrom unrestricted grants and are increasingly providing support in the form oftargeted categorical support—limiting the flexibility of the arts organizationsthat receive it (Useem, 1990; Cobb, 1996). Similarly, although support to arts or-ganizations from foundations has increased, foundations have also become in-creasingly focused on the effect of their grants on increasing access to the artsand on the broader benefits they provide (Renz and Lawrence, 1998).
In sum, although private philanthropy has played a critical role in sustainingthe nonprofit performing arts over the past two decades, changes in fundingpatterns at the individual, foundation, and corporate levels have increased thecosts of raising this money and placed new constraints on how nonprofit firmsmay use those funds.

Financial Situation of Performing Arts Organizations 89
Earned Income Has Been Stable and Costs Do Not Appear to Be Rising
Despite anecdotes about empty concert halls and unsold ballet tickets, aggre-gate trends in earned income for nonprofit performing groups display no clearlong-term trend. As shown in Figure 7.7, earned income as a percentage of totalrevenues for the nonprofit performing arts followed no clear upward or down-ward trend. By and large, this is also true for each of the four arts disciplines.
Although this comparison suggests that the earnings gap facing the professionalnonprofit performing arts sector has not been increasing, it also means that ithas not been shrinking. Thus, nonprofit organizations appear to be about asdependent upon contributed income as they have been in the past. Moreover,this is true despite intensive efforts at marketing and audience development,and despite sharp rises in the cost of tickets. Average ticket prices for symphonyorchestras, for example, increased 70 percent between 1985 and 1995.14
Unfortunately, Census data do not include information on numbers of perfor-mances or seats sold, so we cannot look at what has happened to per-unit costs
RAND MR1367-7.7
Per
cent
age
of to
tal r
even
ues
“ear
ned”
70
65
60
55
50
45
40
35
30
25
201977 1979 1981 1983 1985 1987 1989 1991 1993 1995 1997
Theater
All arts
Opera
Orchestra
Dance
SOURCES: U.S. Bureau of the Census (1977–1997), IRS Form 990 data (1991–1997), Business Master File sample (1986–1990).
Figure 7.7—Earned Income as Percentage of Total Revenues, 1977–1997
______________ 14This figure is based on data from the American Symphony Orchestra League.

90 The Performing Arts in a New Era
for the universe of live performing arts organizations during the 1990s. How-ever, as shown in Figure 7.8, changes in the average real total expenditures ofnonprofit performing companies (measured in 1992 dollars) varied consider-ably by discipline during the period 1987–1997.15 Nonprofit classical music or-ganizations, for example—mostly symphony orchestras—saw very large costdeclines, averaging almost 3 percent per year over the ten-year period. Operacompanies, on the other hand, saw their average costs rise by over 2 percent peryear. On net, movements in costs across these disciplines tended to cancel eachother out.
Nonprofit Performing Groups Remain Under Financial Pressure
Because the data presented in Figure 7.8 have not been adjusted to reflect out-put measures such as numbers of performances or attendees, positive or nega-tive changes could simply represent changes in output per company rather
Per
cent
age
chan
ge
–3
–2
–1
0
1
2
3
Theater DanceOpera Classicalmusic
Total
SOURCE: U.S. Census Bureau, 1998 Economic Census.
RAND MR1367-7.8
–0.4%
–0.8%
–2.8%
0.4%
2.2%
Figure 7.8—Annual Percentage Changes in Average Real Expenditures of NonprofitPerforming Arts Companies, 1987–1997
______________ 15Lack of data for the category “other music” precludes its inclusion here.

Financial Situation of Performing Arts Organizations 91
than changes in the cost of producing a fixed output, such as a performance.For example, the increase in average total expenditures of opera companiesportrayed in Figure 7.8 could reflect an increase in the number of performancesper opera company. Alternatively, average real expenses, like the changes in av-erage real revenues reported in the previous chapter, could reflect the entranceor exit of small, low-cost companies into and out of the field.16 Unfortunately, itis impossible to tell from existing data. In all likelihood, both of these factors—changes in output per company and changes in average company size—areoperating.
An important question raised by these data is to what extent nonprofit perform-ing companies can cut costs and still remain faithful to their artistic and othermissions. A related question is whether rising costs should be seen as a sign offinancial health or financial weakness. The key to both questions lies in thevarious strategies that performing companies have available to them in the faceof incipient cost escalations, earned revenue declines, changes in the magni-tude or focus of unearned revenues, or any combination of the three.
For-Profit Firms Also Face Increasing Financial Pressures
Up to now, our discussion in this chapter has focused on professional nonprofitlive performing groups. It is important to note, however, that for-profit firmsare also facing financial pressures. Although we lack systematic data on thesefirms, industry estimates suggest that for-profit firms involved in the produc-tion of the recorded arts have seen both the risks and the potential rewardsfrom projects soar (Vogel, 1998). Although the payoff from blockbuster hits hasbecome enormous, fewer projects in the commercial sector are earning enoughto cover their production, marketing, and distribution costs. Nine out of tencommercial recording projects, for example, fail to break even. Two-thirds ofcommercial films are money losers, as are 70 percent of all theater productions(Vogel, 1998). In the face of rapidly evolving technologies and global competi-tion, the shape of the commercial arts world is undergoing reconstruction asfirms merge and enter into joint production agreements. In music, for example,as we mentioned in the previous chapter, the traditional six major recording la-bels have now been reduced to four, and some analysts have predicted furthermergers are still to come in the next few years (Strauss, 2000).
______________ 16This interpretation, however, would seem to indicate that the nonprofit classical music industryhad the greatest number of new entrants, which is inconsistent with the evidence presented inChapter Six.

92 The Performing Arts in a New Era
Organizations Are Using Multiple Strategies to Deal with FinancialPressures
There is a good deal of evidence to demonstrate that the business managersand artistic directors of performing arts organizations—both for-profit andnonprofit—pursue a number of strategies to deal with financial pressures. Al-though we have no systematic data, many case studies of individual organiza-tions have documented these efforts, which include both cost-cutting andrevenue-enhancing strategies. In addition, a few recent studies also point to theadoption of creative new financing strategies.
On the cost side, strategies include:
1. Reducing real wage growth
2. Choosing productions or pieces that require fewer artists and/or fewerscene changes
3. Hiring fewer expensive guest artists
4. Avoiding newer works to avoid royalty payments to creators
5. Cutting rehearsal times
6. Developing productions in low-cost locations.
On the revenue side, strategies include:
7. Producing lavish programs featuring celebrity artists to attract large audi-ences (blockbusters)
8. Producing familiar, traditional programs (“warhorses”) designed to attractlarge audiences (the “Nutcracker” strategy)
9. Tying primary programming to sales of auxiliary products such as T-shirts,collectibles, etc.
10. Increasing the number of performances of the same production
11. Maximizing the audience per performance by increasing the size of per-formance venues
12. Targeting niche markets that have predictable, loyal audiences.
On the financing side, strategies include:
13. Productions jointly financed by firms in the for-profit and nonprofit sec-tors

Financial Situation of Performing Arts Organizations 93
14. Adoption by nonprofits of commercial financing techniques such as for-profit subsidiaries or charitable component mutual funds.17
In the next section, we describe several of these strategies and the kinds of or-ganizations that are most able to take advantage of them. As we point out, thesize of an organization’s budget often determines which strategies will be mosteffective. Midsized organizations, for example, tend to find it more difficult toreduce labor costs than large organizations do, for reasons we describe below.
In making size distinctions, however, we cannot be too precise. We cannot de-fine small, midsized, and large organizations based on arbitrary dividing linesbetween the sizes of their budgets, because such lines would differ over time,across disciplines and sectors, and across function within the performing artsdelivery system and across locations.18 Therefore, as a rough guide, for thisanalysis we define a midsized live performing organization as one that relies onpredominantly professional—that is, paid—artistic personnel and has a formal,paid administrative staff (probably including an artistic director and/or busi-ness manager, a development director, and various clerical workers), but is notin the very top ranks of its field. For example, with respect to the orchestra clas-sifications used by the American Symphony Orchestra League (ASOL), our cate-gory “midsized” would include most “regional,” “metropolitan,” and “urban”orchestras (with 1991 budgets of between approximately $650,000 and $8.5 mil-lion), whereas our category “small” would be the volunteer-sector orchestrasthat the ASOL calls “community” orchestras, and “large” would comprise“major” orchestras. A small recorded arts organization would be a firm that hasroughly 1 to 50 paid employees; a large firm would have over 500 paid employees.
Wage-Based Cost Control Strategies (Strategy 1) Disadvantage Midsized Per-forming Organizations. Baumol and Baumol (1985a) suggest that one commonstrategy for controlling cost growth in nonprofit performing companies is to cutthe real salaries of both artists and managers by allowing nominal salary in-creases to fall below the rate of inflation. In fact, during periods of high infla-tion, there is evidence that this approach has been widespread across bothnonprofit and for-profit organizations in service industries such as health andeducation. It has been less often used, presumably because it is less effective,when prices have been relatively stable.19
______________ 17These are mutual funds that would link personal investment with contributing to the arts. Forexamples of these and other financing techniques being explored by nonprofits, see Williams(1998).18Given differences in the cost of living, a $2 million budget in New York City might be regarded assmall, but the same budget in Fargo, North Dakota, would be considered large.19See, for example, Baumol (1996).

94 The Performing Arts in a New Era
In the performing arts, union contracts preclude many, if not most, large andmidsized performing companies from either reducing nominal wages or down-sizing union labor, so that financial pressures tend to fall most heavily on non-union personnel (at least initially). When this happens, large performing com-panies have an advantage over midsized ones, because they tend to have alarger volunteer base from which they can draw for administrative, and some-times also artistic, labor (Blau et al., 1986). Because large organizations tend tohave lengthier series of identical programs per season, they are also better ableto economize on artistic personnel costs by holding fewer expensive rehearsals(Schwarz, 1983)—although this strategy may work better in some disciplinesthan others. Small volunteer sector organizations, since they tend to rely heavilyon volunteers in the first place, are less likely to suffer escalating personnelcosts.
Reducing Production Size and Eliminating Guest Stars (Strategy 2) Is Likely ToShrink Audiences. Baumol and Baumol (1985a) provide some insight into the“shrinking the size of productions” strategy, showing that between 1946 andapproximately 1976, Broadway theater companies reduced the average cast sizefor nonmusical productions from 16 to 8. Unfortunately, we have no hard datato show whether this trend has continued, but we do have some supportiveanecdotal evidence.20 Dunn (1984), for example, describes how, during the re-cession of the early 1980s, some Broadway producers limited the size of bothcasts and crews and chose only to produce shows with minimal sets. Dunn alsodescribes the concessions made by the theatrical unions during this time,which included reductions in staffing as well as reductions in wage rates. Morerecently, Phillips (2001) argues that the very definition of a “large-cast” play inthe nonprofit theater has shrunk from approximately 30 to 35 actors in the1960s and 1970s to somewhere between 8 and 12 actors in the late 1990s.
The production-shrinking strategy is probably most common among mid-budget performing groups. Ironically, according to Phillips, most large-castplays are produced at low-cost, non-union theaters and performance spacesthat seat fewer than 100. The big-budget companies also put on bigproductions, with elaborate sets and large celebrity casts, in the expectationthat large audiences will allow revenues to outstrip costs. But although mid-budget companies, like big-budget groups, must cope with union payscales andsignificant administrative overhead costs, unlike their larger cousins they couldrisk bankruptcy with the commercial failure of a single big production.
______________ 20 For example, although the Theatre Communications Group publishes annual “season preview”listings of its members’ productions, no cast size information is provided. See Heilbrun (2001b) forreprint of data misprinted in original Baumol and Baumol (1985a) article.

Financial Situation of Performing Arts Organizations 95
Unfortunately, as we discussed in Chapter Four, minimalist approaches towardproductions may end up shrinking audiences by more than they shrink costs.
Only Big Budget Organizations Can Afford High-Cost Productions andCelebrity Artists (Strategy 7). In order to attract large audiences, organizationsmust spend heavily on advertising and promotion. They have found that thepresence of “bankable” stars greatly improves their chances of success bybringing with them preestablished audiences. In fact, our anecdotal evidencesuggests that both live and recorded arts organizations—if they have the bud-gets for it—are now choosing programming strategies featuring blockbusterproductions and star-studded casts (Pogrebin, 2000a and 2000b).
Of course, the origins of this strategy are not new: Prima donnas such as JennyLind and Adelina Patti were heavily and successfully promoted to Americanaudiences in the mid-19th century. But marketing campaigns and superstarsare expensive and getting more so, causing the breakeven point for profitabilityto rise. As a result, many for-profit firms have decided that bigger is better, andmerger and acquisition activity in the entertainment industry has exploded inthe mid- to late-1990s. Many nonprofit performing organizations are also be-ginning to face a situation in which they must either maximize the size of theiraudience or refocus their programming in order to survive.21
Although not yet evident in Economic Census data, one reason may be that un-certain funding streams, as described in a previous section of this chapter, areforcing nonprofit organizations to rely more than ever on earned income. An-other reason is that contributors, and particularly foundation and corporatecontributors, are increasingly looking for evidence of audience penetration as acondition for receiving the funding they do provide (Useem 1990; Renz andLawrence, 1998). But this increased reliance on the market bears a cost: moremoney spent on marketing, splashy shows, and star-studded programs. Thisstrategy in turn requires even bigger audiences to support the resulting cost in-creases, and so on—creating an upward spiral of audience and budget growth.Like the for-profit firms, in such an environment only the biggest firms cansurvive.
Increasing Reliance on Warhorse Programming (Strategy 8) Is a WidespreadRevenue-Building Strategy. One of the most frequently expressed chargesagainst performing companies, and especially mid-budget organizations, is thatincreasingly they are relying on “warhorse” programming—that is, traditionalworks beloved by general audiences—to increase their box office and please
______________ 21Audience or client size maximization is frequently posited to be a major objective of nonprofitfirms. See, for example, Newhouse (1970) and Hansmann (1981). Lange et al. (1986) provide limitedempirical evidence for this trend.

96 The Performing Arts in a New Era
contributors. From the perspective of those who place a high value on artisticinnovation this complaint is understandable, but the practice has been aroundfor a long time. A major reason is that, as we discussed in Chapter Four, a ma-jority of the people who attend live performances are “casual attendees” whoare much more likely to be attracted to traditional works than to more innova-tive fare. The question is whether underlying changes in the funding environ-ment, as well as in the sociodemographics of audiences, have caused compa-nies to rely more on warhorses than they used to.
In one of the few studies bearing on this issue, Pierce (2000) uses data on 64members of OPERA America to explore the impact of variations in local cultureand sources of contributed income on programmatic risk-taking and experi-mentation in opera. Using the frequency of an opera’s performance between1989 and 1994 as a measure of its risk, he finds that the relative wealth and edu-cational level of the local population is positively correlated with risk-taking.For instance, the wealthier and better educated the local community, the morelikely an opera company is to perform Wagner’s Siegfried rather than Puccini’sLa Boheme. Even more interesting, Pierce finds that federal government sup-port (from the NEA) is positively correlated with programmatic innovation,while local government support is even more strongly positively correlated withprogrammatic conservatism.
Pierce’s findings are consistent with the view that Americans’ interest in inno-vative programming should increase as they become wealthier and better edu-cated. However, his work also suggests that recent increases in state and localsupport for the arts, relative to federal support, may adversely impact artisticinnovation. Which effect is dominant? Research by Heilbrun (2001a) throwssome additional light on the matter. Heilbrun analyzes programming data fromthe growing OPERA America membership for selected years between the 1982–1983 and 1997–1998 seasons. Based on measures of the diversity of the aggre-gate opera repertory in each year (number of productions times number ofcompanies), Heilbrun finds evidence of a distinct decline in the diversity ofAmerican—but not Canadian—opera company repertory beginning in the1991–1992 season, and specifically a significant decline in the number of 20thcentury operas produced. Although several explanations are possible—and thetime period considered is rather short—Heilbrun’s results are consistent withthe view that American opera companies have been shifting their programmingtoward a more popular, less demanding repertory in response to changingfunding patterns. In Canada, where public support for opera is far more gener-ous, no such shift has occurred.22
______________ 22Rising production costs and the high cost of commercial failures may incline private investorsand perhaps even private donors to favor warhorse programs as well.

Financial Situation of Performing Arts Organizations 97
Replication Strategies of Performing Groups Have Had Mixed Success(Strategy 10). Increasing the number of performances of the same productioncan be seen as either a cost-cutting or revenue-enhancing strategy. If effective,it spreads the fixed costs of production over a larger revenue base. However, iffixed costs rise significantly as a result of the replication, the resulting costgrowth can swamp any positive increments to revenue.
A traditional way to pursue this strategy is to take the show on the road becausetouring enables companies to dip into their established repertoire withouthaving to develop new material. Indeed, touring has been a mainstay of alltypes of performing arts companies since colonial times (Butsch, 2000). How-ever, it by no means provides an automatic boost to net income.23 For example,although 75 percent of respondents to a 1990 survey conducted by ChamberMusic America reported some touring activity, just 55 percent claimed it hadbeen profitable for them. Another 12 percent reported that they had actuallylost money on the tour. According to the authors of the report, the biggest andbest-known ensembles were more likely to have profitable tours because theywere better able to market themselves to presenters and audiences (ChamberMusic America, 1992).
In a variation on this theme, Cowan (1987, p.24) refers to the growing popular-ity of the “second home” concept, whereby instead of or in addition to touring,a performing organization “produces a regular recurring schedule of perfor-mances in a location other than its home base and seeks an ongoing relation-ship with that community.” However, cities that are potential “second homes”generally prefer to host established companies with strong artistic reputations.And of course, the strategy doesn’t always work: One of the most famous com-panies to adopt this strategy, the Joffrey Ballet, experienced severe financialproblems in the early 1990s despite (or perhaps because of) part-time homes ithad established in New York and Los Angeles (Smith, 1995).
Broadway theaters have long relied on the economies of scale of a successfulrun to lower costs and achieve profitability, but the average size of the Broad-way audience used to be smaller. Moreover, as shown in Figure 7.9, the distri-bution of runs on Broadway has changed. During the 1920s slightly more than10 percent of productions folded immediately (after less than 10 performances);well over 75 percent fell into the middle range between 10 and 300 perfor-mances. Less than 5 percent were “smash hits” (plays that ran for more than300 performances), and none ran for more than 450 performances. By the1960s, however, there had been a substantial rise in the number of productions
______________ 23In fact, in many cases touring may not be perceived as a cost-reducing (or for that matter, rev-enue-enhancing) strategy, at least in the short-term. Many performing groups consider touring amatter of prestige—and of mission.

98 The Performing Arts in a New Era
Per
cent
of p
lays
100
90
80
70
60
50
40
30
20
10
00–10 10–50 50–100 100–200 200–300 300+
Number of performances
1927–28
1959–60
SOURCE: Moore (1968).
RAND MR1367-7.9
Figure 7.9—Distribution of Performances for Broadway Plays, 1927–28and 1959–60 Seasons
that attracted large audiences. Almost 25 percent of productions folded beforethey achieved 10 performances, but almost 20 percent ran for more than 300performances.
By the mid-1990s, the growing fixed costs of advertising had further exacer-bated Broadway’s tendency to divide between smash hits and outright flops.24
Vogel (1998) estimates that, as of approximately 1995, a play with running costsof $100,000 per week, average ticket prices of $30, and seating of 500 requiredan average capacity utilization of almost 85 percent (417 paying audiencemembers per performance) just to break even. This compares to a break-evencapacity of 55 percent estimated by Moore (1968) for the early 1960s. But de-spite the fact that the odds against seeing a positive return on investment arenow well over 2 to 1, individual investors and large entertainment companiescontinue to be attracted to Broadway. This is because, when shows are success-ful, they are very successful: According to Vogel (1998, pp. 382–383), as of
______________ 24The cost of putting on a Broadway production rose by approximately 100 percent between theearly 1980s and the mid-1990s (Vogel, 1998).

Financial Situation of Performing Arts Organizations 99
February 1989 the hit musical Cats, for example, had earned more than 11 timesits initial investment from its North American box office alone.
This boom-or-bust pattern is more evident in the recorded segment of the per-forming arts industry, for which increasing replication of the same product isalways a goal. For example, according to Denisoff (1975), in 1968 the averagepopular music album had to sell approximately 7,800 copies to break even. Bythe early 1980s, the number had risen to 100,000 copies (Garvin, 1981). Vogel(1998) estimates that, as of the 1990s, perhaps no more than 10 percent of allnew releases made money. But these 10 percent were generally profitableenough to offset the losses on the other 90 percent. Similarly, the high fixed op-erating costs for radio and especially television networks meant that the gain orloss of a few prime-time rating points could trigger either immense profits orimmense losses.
The strategy with perhaps the greatest potential for reducing per-unit costs andincreasing revenues for midsized and larger live performing arts firms is to in-crease the size of the performance venue. For many performing organizationsthis has apparently been achieved to great effect through electronic amplifica-tion, which is allowing both small groups and single artists to play to muchlarger halls. Again, although systematic data are missing, anecdotal evidenceabounds that audio technologies such as body microphones have becomecommon not only at large theaters (roughly 500 seats and up) but also at mid-sized theaters (200 to 500 seats).25 Even some opera houses and concert hallsare apparently beginning to succumb to the lure of electronically enhancedacoustics, which, according to some observers, American performing arts audi-ences are beginning both to expect and demand (Tommasini, 2000a).
Of course, the ultimate increase in size of “venue” involves either replicatingproductions through recorded media or broadcasting them live over radio ortelevision. Here music clearly has a great advantage over other art forms such astheater or dance. From the 1940s through to the 1980s, many of the most influ-ential advances in music recording technology—such as long playing records,hi-fidelity sound, magnetic tape, and digital recording—were developed in aneffort to capture the audio-dynamics of, and thus the audience for, live orches-tral music (Frith, 1986). But, at least in recent years, actual income from broad-casting and recording has been a relatively small contributor to the total rev-enues of most symphony orchestras. Data on 173 members of ASOL reveal thatbroadcasting and recording as a percentage of total income hovered around 2.2
______________ 25See, for example, Phillips (2001).

100 The Performing Arts in a New Era
percent between 1988 and 1990.26 For opera companies, per-company averagerevenue from broadcasting fell from 2.4 percent of total income during thedecade of the 1980s to just 0.1 percent of total income from 1990 to 1998(OPERA America, various years).
The outlook for the future is grim. According to von Rhein (2000), where oncethe market for recorded classical music contained six multinational recordinggiants, now there are only three, each of which is drastically cutting back itsclassical music divisions. The reason is their unprofitability: BMG Classics, forexample, a subdivision of the giant Bertelsmann media conglomerate, report-edly lost $6 million in 1999. In response to the cutbacks, some orchestras havetried to create their own labels, but they have generally not been successful inattracting consumers. In the case of opera, recordings of selected scenes andarias sung by individual opera stars have done quite well on the classical musiccharts, but opera companies have been forced to seek corporate sponsorship topay for recordings of entire operas (Johnson, 2000; Tommasini, 2000b).
Large Nonprofits Are Increasingly Adopting For-Profit Business Models ToStabilize Revenues (Strategies 9 and 13). As their productions grow larger andsplashier and as the celebrity artists that ornament these productions grow in-creasingly more expensive, many large nonprofits are exploring some of thesame revenue-enhancing and financing techniques that have long been popu-lar among for-profit firms from Hollywood producers to sports shoe manufac-turers. Merchandising, for example, has become big business. T-shirts and cof-fee mugs display not only the title of the latest show, but, for marquee compa-nies like the New York City Ballet, the name of the company itself. Like Reebokor Nike, New York City Ballet’s name has become an exploitable brand name,soon to be stamped on little girls’ leotards, shirts, and shorts sold across thecountry (Dance Magazine, 2001).
Large nonprofits are also becoming more creative with their financing. In the-ater, for example, many nonprofit regional and off-Broadway theaters now ac-cept “enhancement money” in return for acting as testing grounds for potentialfuture commercial runs.27 According to the President’s Committee on the Artsand Humanities (1997), 44 percent of the new plays produced on Broadway be-tween 1975 and 1995 originated in the nonprofit sector. Perhaps the mostprominent recent partnership between nonprofit theater and the for-profitworld—although not, in this case, Broadway—is the one between New York’sRoundabout Theater Company and American Airlines. American’s $8.5 million
______________ 26We recognize that these figures are averages across all symphonies and the returns to some es-pecially prominent orchestras may be somewhat higher because of their reputations.27Note that not every arrangement of this sort involves enhancement money.

Financial Situation of Performing Arts Organizations 101
payment helped to underwrite a $25 million refurbishment of Roundabout’snew 750-seat American Airlines Theater on West 42nd Street (Pogrebin, 2000aand 2000b). According to at least some observers, resident theaters’ pursuit ofBroadway-style success has resulted in minimal distinctions between nonprofitand for-profit programming, with both sides of the 501(c)(3) aisle now pursuingthe safe and familiar, rather than the artistically innovative and financially risky(Landesman, 2000; Brustein, 2000). Others, however, believe this trend to beless applicable to small nonprofits, which are more innovative in their pro-gramming.
For Small Commercial and Nonprofit Organizations, Niche Markets Are anAnswer, but Not for Midsized Groups (Strategy 12). Anecdotal evidence alsosuggests that the goal of large-scale replication of star-studded programs andproducts is moving beyond the reach of all but the largest organizations. Formany small for-profit and especially volunteer organizations, this is not a con-cern: Their programming strategies focus on niche rather than general audi-ences. In the for-profit recorded music sector, for example, small independentrecord producers and labels representing distinct musical styles commonly actas intermediaries between artists and the major record companies (Vogel,1998). Although most are still dependent on the major labels for their initial fi-nancing and for the manufacturing of CDs, the advent of Internet technologiesmay allow some of these firms (and many more individual artists) to circum-vent the majors by creating their own web-based rather than CD-based distri-bution systems. The Internet already is allowing them to market themselves andtheir artists directly to potential consumers scattered across the country—andacross the world (Vogel, 1998; Gomes, 2000).
Most volunteer-sector performing companies are even less able and generallyless interested than for-profits in competing for the superstars or creating theblockbusters that would put them in front of mass audiences. By definition,their performances and productions draw heavily on the large pool of low-paidor volunteer nonprofessional artists that live and work in their local communi-ties.28 They may or may not be incorporated as formal 501(c)(3) corporationsunder the U.S. Tax Code. By far the majority do not have their own permanentperformance spaces, and they tend to be heavily reliant on the artistic visionand management skills of individual founders (Jeffri, 1980; Bowles, 1992).
This is not to say, however, that volunteer-sector performing groups as a wholedo not want to grow, or that they do not want to reach beyond their currentniches to attract bigger audiences. But many are committed to experimental art
______________ 28As discussed in Chapter Five, the term “nonprofessional” simply describes artists whose primaryincomes do not come from the arts. It does not necessarily denote lack of professional training orartistic ability.

102 The Performing Arts in a New Era
forms or art forms that draw on a non-European ethnic or cultural heritage, andare strongly opposed to “mainstreaming” their programs in ways that might berequired to attract larger and more diversified audiences (Yoshitomi, 1991). Stillothers have tried to grow, or even have achieved some growth, only to be forcedto downsize again in response to the vagaries of funders and the market.
The field of modern dance provides a good example of the obstacles to growthfacing small performing groups that lack a potential audience that is easilyreached and economically significant.29 As described by Jeffri (1980), and webelieve it is still true today, most modern dance groups do not have the capitalto purchase or lease their own permanent performance spaces. Lack of a per-manent home limits their potential for earnings growth in at least two ways: Itmakes them heavily reliant on touring, which typically involves fixed contrac-tual fees for performances rather than box office ticket sales, and it restrictstheir ability to capitalize on a successful run because engagements are limited.Further, because modern dance companies are constantly on tour, they canfind it difficult to build local constituencies for their work. This in turn makes itdifficult to raise the capital necessary to establish a permanent performingspace. A vicious cycle is created.
However, as Jeffri and others have emphasized, an even worse situation may becreated when public and private funders “artificially” inflate small companies’budgets with large capital infusions. For example, according to Jeffri (1980, p.62), one of the implicit (or sometimes explicit) conditions for accepting gov-ernment funding is expansion of a company’s scale of operations, whether it isready, willing, or able to do so, and whether there is demand for its increasedoutput in the long term. Quoting from Siegel (1977) with respect to dance, Jeffrireports:
Dance is on a six-lane escalator with a two-lane road at the top. Since the ad-vent of government subsidy . . . all dance companies have been under pressureto expand their operations—to do more performances so they can reach moreaudience, which will produce bigger budgets and more employment fordancers.
Bowles (1992, p. 61) reports a similar phenomenon in the context of small, eth-nically specific arts organizations, which are “reaching maturity at a time whenfunding from all sources has leveled off or is undergoing severe cutbacks.” Re-sponses to a 1990 survey of more than 1700 such ethnically specific organiza-tions (including visual and multidisciplinary arts organizations) indicated thatmany were being forced to cut back on personnel as well as programs during
______________ 29The modifier “economically significant” is important here because lack of financial support doesnot necessarily imply lack of interest. This is especially relevant to organizations based in economi-cally disadvantaged communities.

Financial Situation of Performing Arts Organizations 103
the period because their earned and contributed income growth failed to catchup to cost growth.
In sum, focusing on niche markets can work well for small organizations whosecosts are also relatively low. With the advent of the Internet, recorded arts or-ganizations in particular may be able to expand their niche audiences beyondthe traditional limitations of geography and time. For live performing organiza-tions in the mid-budget range, however, the relatively high fixed costs associ-ated with administration and real estate mean they are quite vulnerable to evenshort-term shifts in earned or contributed income. To stabilize the earned in-come and perhaps also the contributed income components of their budgets,such organizations must either downsize in order to concentrate on niche mar-kets, or position themselves to become acknowledged regional, national, oreven global leaders, with the attendant increases in revenues and costs.30
FUTURE ISSUES
Despite data constraints that limit our analysis,31 the financial picture we havedrawn suggests that the earnings gap described by Baumol and Bowen over 30years ago remains a key feature of the nonprofit professional performing artsworld today. Indeed, judging by the stagnant levels of earned income as a per-centage of revenues—despite improved marketing and higher ticket prices—theaverage nonprofit performing arts organization remains highly vulnerable tothe whims of contributors—and increasingly, to the whims of the market.
Government Support
Looking to the future, we see several issues that bear watching with respect tothe finances and strategies of performing arts organizations. First, governmentsupport for the arts increasingly means state and municipal government sup-port. Although this shift may mean that government funding is more responsiveto the needs of local arts organizations, it may also mean increased volatility infunding and a more conservative approach to the art that is funded. An increasein artistic conservatism will affect all nonprofit professional performing organi-
______________ 30Melanie Beene and Associates (1988) perceptively analyze the case of a mid-budget performingorganization that failed to negotiate these two extremes: the Oakland Symphony. According to theauthors, a probable contributor to that orchestra’s eventual bankruptcy was its failure to establishitself as a distinct alternative to the much larger San Francisco Symphony across the bay—even as ittried to join the ranks of the nation’s major orchestras. Faced with an inflexible musicians’ union,stable or shrinking audiences, and large operating deficits from its attempt to create a multipurposeperforming arts center, the Oakland Symphony simply collapsed under its own weight.31These data constraints have limited the picture we are able to paint in two ways. First, they re-strict our ability to compare costs with revenues. Second, they limit our focus to the nonprofitsector.

104 The Performing Arts in a New Era
zations, whereas increased volatility will disproportionately affect midsized or-ganizations that have relatively high fixed costs and relatively poor potential foraudience expansion. The shift is also likely to mean less emphasis on the artsper se and more on their social and economic benefits to local communities.Whether this is good or bad depends on one’s views about the primary goalsand purposes of art.
Private Philanthropy
Second, private philanthropy has seen large increases over the past fewdecades. But, as with state and local funding, this expansion has implicationsfor programming. As artists and organizations increasingly rely on grantmakerssuch as corporate foundations for support, the art that reaches audiences mayincreasingly reflect the tastes and values of local communities and specificbenefactors. Once again, whether this is good or bad depends on one’s viewsabout the goals and purposes of art.
Private philanthropy does not exist in a vacuum: There is a substantial literaturethat suggests that government support for the arts may displace or crowd outprivate grants and donations to a greater or lesser extent (Steinberg, 1993). Al-though the relationship between private and public funding is complex,32 somestudies suggest that each dollar of public funding may crowd out between 10and 50 cents in private support (Brooks, 2000b, 2000c; Kingma, 1989). If thesefindings are correct, then private giving to nonprofit arts organizations in thefuture may well be stimulated if government support continues to fall in realterms but on less than a one-to-one basis. If government funding increases,however, private giving may decrease but total funding would go up.
Diversification of Income Sources
What seems clear from this discussion is that nonprofit institutions are likely tobe best served by diversifying their sources of contributed income, thus mini-mizing the effects of any one source on both the volatility of their budgets andthe freedom of their programming. How successful different types of nonprofitswill be in this endeavor may well depend upon their ability to be perceived asadding value to their communities. Many large, well-established, prestigiousorganizations have already created this perception. For smaller organizationsthat rely more on volunteer and in-kind contributions and may already beserving well-defined, if more limited audiences, cultivating this perception may
______________ 32Many government funding advocates, for example, believe that government funding is an effec-tive tool for leveraging private support (American Assembly, 1997).

Financial Situation of Performing Arts Organizations 105
be less important. For organizations in between, the prospects are less clear.They may well be forced to reconsider what audiences they are trying to reachand how.
Emphasis on Earned Income
Potentially even more significant, although difficult to isolate in the availabledata, is a fourth issue: nonprofit professional performing groups’ increasingemphasis on tickets sold and merchandise purchased in addition to the natureand quality of the art they produce. As described above, most of the revenue-enhancing strategies large and midsized groups are pursuing are designed toincrease earned, rather than contributed, income (although this may be a falsedichotomy because many institutional benefactors now require measurableaudience-building efforts as a precondition for giving). In any case, as thesenonprofit organizations rely more and more on the market to pay their bills, it isalmost inevitable that they will look more like for-profit organizations. Thiscould raise serious issues about the appropriate distinctions between tax-exempt nonprofits and taxable for-profits. It also has implications for the typeof art that will be produced.
For small professional nonprofits, audience focus will also be the rule, but notnecessarily in the bigger-is-better context. The departure of larger organizationsfor bigger pastures could give these groups an opportunity to build and retain acomparatively small but loyal set of followers who would value their uniqueartistic contributions and be willing to pay for them as both consumers and pa-trons of the arts. Technological developments such as the Internet may helpthese groups to establish and expand their niches. Without major efforts at artseducation, however, they will be unable to attract mass audiences unless theysignificantly alter their existing programming.
Finally, the prospects for midsized nonprofit institutions are not rosy. The de-clines and reorientations in public and private sector funding are likely to pushmany of them toward traditional programming and fairly mainstream artisticendeavors in order to build audiences and grow organizationally. However, be-cause most lack the resources to put on blockbusters, and because of thedownward trend in transportation and communication costs, it is not clear howwell they can compete with respect to world-famous and celebrity-heavy insti-tutions located in major metropolitan areas. Further, like all groups dedicatedto live performances, these institutions must also compete with recordedblockbusters of the past, which are steadily improving in quality and avail-ability.


107
Chapter Eight
WHERE ARE THE PERFORMING ARTS HEADED?
In the previous chapters we have described the current shape of the performingarts environment and identified major trends that bear watching in each of thefour domains of the performing arts world: audiences, artists, organizations,and financing. In this final chapter, we first present a picture of America’s fu-ture performing arts environment and then discuss what this might mean forthe quantity, quality, and availability of the performing arts. Next, we discusshow arts policy might be refocused in light of those developments. Finally, wesuggest what future research would help answer many of the unresolved issueswe have identified.
A VISION OF THE FUTURE
The art world we envision for the future remains highly segmented, but the di-visions are not the same as those that existed during most of the 20th century.Instead of a sharp demarcation between a nonprofit sector producing high artand a for-profit sector producing mass entertainment, the major divisions inthe future will be along the lines of big versus small arts organizations, andfirms that target broad versus niche markets.
Specifically, if current trends continue, we envision an arts environment that isincreasingly segmented into distinct sectors, each specializing in a particulartype of product or artistic experience, targeting a different market, andresponding to specific financial pressures. We describe these sectors below:
• A large commercial sector characterized by fewer but increasingly largerfirms catering to popular mass markets, often on a global scale. Faced withan environment in which the rewards of success and the costs of failure canbe enormous (and the latter outnumber the former by a significant margin),this sector will seek to minimize its risks by choosing conservative pro-gramming that relies on established stars and formats and is designed toappeal to the broadest possible audiences. It will continue to serve as the

108 The Performing Arts in a New Era
principal purveyor of popular entertainment for the mass market—a mar-ket that will continue to grow in response to population and incomegrowth.
• A small commercial sector characterized by small firms that target nichemarkets within the recorded branches of the performing arts. Often thesefirms will move into areas, such as classical recordings, that the large com-mercial firms have abandoned because they simply don’t provide the mar-gins and volume that larger for-profit firms require. The low costs of entryinto this sector, combined with technological changes (such as the Internetand e-commerce) that relax the traditional constraints of geographicallybased market thresholds, will also enable these firms to serve a wider varietyof smaller and more specialized markets. Indeed, lower entry costs and theability to serve spatially dispersed specialized markets will provide firmswithin this sector the opportunity to be more adventuresome in the varietyof programming they offer. Whether they will choose to do so may well de-pend upon their ability to identify and market to newly emerging special-ized submarkets for the performing arts.
• A small number of large nonprofits providing high-quality live performingarts in major metropolitan centers. Like their large commercial-sectorcounterparts (and for many of the same reasons), these organizations toowill seek to maximize their earned revenues from ticket sales and relatedbusiness income. They will rely on advertising and marketing campaignspromoting celebrity performers and traditional materials designed to attractthe broadest share of what appears to be a relatively stable market—thoseindividuals who can pay premium prices to attend the highest-quality liveperformances.
• A much larger number of small nonprofit performing arts organizationscatering to local and specialized markets, particularly ethno-cultural andspecialized markets. Although earnings constitute a small fraction of theseorganizations’ revenues, their low costs and access to contributed incomeand volunteer labor enable them to survive and, in some cases, prosper. Formany small and midsized communities, these organizations will providethe major source of live professional performing arts—even if they do notfeature the stars and grand productions that typify the large nonprofitsector.
• An even larger and growing number of amateur performing arts organiza-tions. These organizations fill what appears to be a growing segment of theperforming arts market—the demand for hands-on participation for avoca-tional artists. As is true of small nonprofit organizations, earnings are not animportant source of revenue for these institutions. Instead, they rely veryheavily on local volunteers, not only for contributed income but also for

Where Are the Performing Arts Headed? 109
performing and administrative labor. Because these organizations are pri-marily grass-roots organizations that are closely tied to their local commu-nities, they may also be supported by local governments. Their numberswill be closely tied to the future size of the market for hands-on participa-tion. Again, like their small nonprofit counterparts, these organizations willhave little in common with the larger nonprofits in terms of programming,audience demographics, or the professional status of their artists.
• A sizeable number of nonprofit presenting organizations that provide ac-cess to the live performing arts to residents outside major metropolitanareas. As we noted in Chapter Six, we do not know enough about theseorganizations because they are typically embedded within non-artsorganizations. But they are likely to become an increasingly importantsource of high-quality performing arts if, as we predict, the top-echelon livearts become concentrated in major metropolitan areas. University-basedpresenting organizations are likely to be especially important to the futureof the performing arts because they serve multiple functions within theperforming arts world. Not only are they major presenters, but they alsoplay significant roles in training new artists and fostering innovation in thecreation of new work.
The biggest challenge we foresee relates to the middle tier of nonprofit arts or-ganizations, particularly those opera companies, symphony orchestras, balletcompanies, and theater groups that service small and medium-sized citiesacross the country. The realities of aging audiences, escalating costs, and staticor even declining funding streams will force these organizations into a seriousrethinking of their primary mission, the audiences they want to reach, and theirorganizational structure. Some will choose to pursue increased local funding tokeep up professional standards, go for the smash hit and superstar marquee,and aspire to become regional or national brand-name institutions. Others mayopt to fill specialized niches based on particular kinds of programming that tar-get specialized markets. Still others will decide to focus on their immediatecommunity, using local talent to keep costs down and targeting programmingto encourage participation by local audiences. Finally, some will simply witheraway, unable to reconcile conflicts among their various stakeholders.
We currently have too little information on a number of issues to accuratelygauge how closely this profile will accord with the actual future. The shape ofchange within the commercial sectors, for example, may well hinge on howcritical intellectual property and e-commerce issues are resolved. Moreover,although middle-tier nonprofits face special challenges, they are often viewedby their communities as important civic assets. Thus, they may be able to gen-erate sufficient public and private funding to sustain their operations. Finally,our projection of future demand assumes that observable trends will continue.

110 The Performing Arts in a New Era
Given historical patterns of demand, this assumption appears to be reasonable.However, as we note below, policy interventions could increase future demandfor the arts.
It is important to remember that we have been describing the performing artssystem in very broad strokes and with highly aggregated data. Although such anapproach may bring out connections among different parts of the arts worldthat are not captured in more focused studies, it cannot account for the diver-sity and particularity of the experience of different artistic subcultures. Even ifsome of our predictions about demand and organizational demographics turnout to be valid for the performing arts as a whole, the arts in different parts ofthe country and in different disciplines and subdisciplines may evolve in theirown distinct way.
IMPLICATIONS FOR THE PERFORMING ARTS
We return to the question posed at the beginning of this report: Is the future wedescribe likely to be the best of times or the worst of times for the performingarts? Specifically, what are the likely effects on the quantity, quality, and avail-ability of the arts if performing arts organizations continue to specialize as wepredict?
As far as the quantity of artistic productions is concerned, the future looksbright. New and improved production, recording, and distribution technologieswill allow American audiences to continue to enjoy a wide variety of performingarts, both whenever and wherever they like. Most arts programming will still betargeted at mass audiences, but some observers argue that the widespreadpopularity of mass entertainment—not only in the United States, but aroundthe world—attests to its worth.
The number of professional-level live performances of the high arts, on theother hand, is likely to decline. It is not clear, however, whether this trend posesa threat to the public interest. If more people wanted to attend professional liveperformances in any community, the performers and presenters would not facefinancial problems there. This will surely be the case in major metropolitan ar-eas where large institutions will continue to offer productions that feature thebest that money and talent can offer. In addition, touring artists and performingarts companies will provide an opportunity for fans to attend live performancesin the many smaller cities and towns that would otherwise not be able to sus-tain top-level performing arts. And for those who are not able to attend the liveperformance, high-quality digital recordings will provide an improved, if stillimperfect, substitute for the live experience.

Where Are the Performing Arts Headed? 111
For Americans with less traditional artistic tastes, the future promises greateropportunities than ever before. The number of live performances in local com-munities is likely to grow. These will be mainly low-budget productions of greatcultural and artistic diversity performed by artists on a volunteer basis. Thenumber and range of non-live artistic productions should also increase as cabletelevision, satellite broadcasting, and the Internet knock down geographic bar-riers to audience development. The ability to reach far-flung audiences hascreated healthy markets for forms of art that had previously been unable to at-tract economically significant demand. Although the commercial success ofsuch ventures remains to be proven, it seems likely that in the future, niche artsmarkets will be not only possible but profitable. And for those who want to bedirectly involved in the creation of music, opera, theater, or dance, the prolif-eration of community-based groups will offer more and greater opportunitiesfor direct participation in the performing arts at the amateur level.
How the quality of the arts will be affected by changes in the performing artssystem is more difficult to analyze, primarily because quality is a subjective cri-terion. Still, it is an unavoidable issue when evaluating the continued vitality ofthe arts in America. The question of quality can be posed in at least two ways:First, will artists find sufficient opportunities to develop their skills within thefuture performing arts system? And second, will that system encourage thecreation of original works of enduring value?
The polarization of artists’ incomes (created by the superstar phenomenon),the greater concentration of large nonprofits, and a possible contraction in thenumber of midsized organizations are all trends that could reduce the oppor-tunities for talented young people to pursue professional careers in the per-forming arts. In particular, many observers view midsized arts organizations asa vital training ground for actors, ballet dancers, opera singers, and classicalmusicians, preparing them for the leap to the “big leagues.” If this middle tiercontracts, many aspiring young talents could be forced to take jobs in the smallnonprofit and volunteer sectors, where standards of production are far less pro-fessional.
These concerns, however, may be overblown. When a similar contraction of themiddle tier took place in professional sports, for example, the decline in the mi-nor league infrastructure was offset by the increasing importance of the uni-versity as a developer of young talent. A similar phenomenon could well occurwithin the performing arts.
The broader question about quality is whether the growing role of the market-place in the arts will make it more difficult for original works of enduring valueto be produced and performed. As we noted in Chapter One, opinion on thispoint is divided. On one hand, advocates for the market, such as Tyler Cowen

112 The Performing Arts in a New Era
(1998), assert that by serving a wide variety of tastes, market forces promote in-novation across artistic styles. In making this case, they point out that creativegeniuses like Shakespeare, Mozart, and Beethoven all had a broad popular fol-lowing in their day. On the other hand, commentators like Robert Brustein ofThe New Republic already bemoan the destructive effects of commercialism onAmerican theater: “The products of the non-profit theaters . . . have beengrowing almost indistinguishable from Broadway (and off-Broadway) in theirdependence on the box office and in the lowered ambitions of their work”(Brustein, 2000). The truth is, without more data on programming and institu-tional expenditures, it is very hard to determine the effects of the marketplaceon what is produced and performed.
One could argue that the new era will be able to avoid the tyranny of the major-ity because artists can now directly reach sophisticated niche audiencesthrough computer-mediated communications. But the highly decentralizednature of the Internet is likely to make it more difficult to reach the attention ofmore than a small circle of admirers.
Indeed, the major problem with such a decentralized distribution system maywell be a lack of quality control rather than a lack of quality per se. There willsimply be too much material available for consumers to distinguish works ofexceptional merit from all the others. To those convinced that the high artsform an aesthetic pinnacle, the new world of the arts that we envision will be in-ferior because popular tastes rather than true artistic excellence will becomethe primary arbiter of what does and does not get performed—in the nonprofitas well as the for-profit sector.
Once again, to the extent that midsized organizations offer centers of creativityand innovation, the potential decline of the middle tier could pose a particularthreat. The decline of the middle tier could eliminate the set of organizationsthat provide the R&D necessary for the continuing growth of creativity and in-novation in the arts. On the other hand, the niche markets served by growingnumbers of small nonprofit and for-profits could serve as incubators of inno-vation.
Ultimately, of course, the quality of a work of art can only be determined overtime. The historical evidence suggests that, during any given period, art of long-lasting value is rare and is often not recognized as exceptional either by thepublic or by critics at the time it is first produced. It is not unreasonable to as-sume that the same is true of our time. What is crucial, then, is not where a workis first performed but whether it is performed at all and thus has the opportunityto pass the test of time.
If exceptional works of art can find expression, then they will be judged, as allworks have been, by future generations. Where are such works likely to be per-

Where Are the Performing Arts Headed? 113
formed in the performing arts system of the future? The largest nonprofits, al-though they feature celebrity artists and grand productions, do not rely entirelyon traditional programming. Some of the largest nonprofits, such as theMetropolitan Opera and the New York City Ballet, offer some of the most so-phisticated and innovative programming in an effort to educate their audiencesand maintain their prestige as leading centers of the arts. It seems likely, how-ever, that such practices will remain the exception rather than the rule amongmost large nonprofits. In contrast, smaller for-profit and nonprofits catering tospecialized niche audiences—although not necessarily amateur organizations—may well be more daring in their programming if they can identify and marketto specialized niche markets. The key here is to identify such markets and theproducts that might appeal to them.
Once again, the university sector may play a critical role in making sure thatnew artistic voices are heard. Because universities, particularly in their researchand training (as opposed to their presenter) roles, are much less sensitive to thedemands of the market, they will be better able to foster innovation and cre-ativity. In other words, the university may increasingly serve the same basic re-search role in the arts that it has traditionally played in the natural sciences. Ac-cording to the natural sciences model, universities, supported by subsidiesfrom the public and private sectors, perform the basic research that is latersupported directly by the private sector after the applicability of the basic con-cepts has been demonstrated and a market established.
The final criterion for assessing the implications of current trends for the futureis how they will affect access to the performing arts. The most important loss ofaccess to live performances will be in those regions of the country that may losethe midsized organizations that now produce professional performances of thehigh arts. In other respects, however, availability of the performing arts is likelyto increase. Technological advances and the expansion of the small nonprofitand volunteer sectors will provide increasing numbers of productions of agrowing variety of creative works. Internet-based arts, however, will not in-crease access equally, since not all people have access to—or familiarity with—the new technologies that deliver these performances.
In discussing the quantity and availability of artistic productions, it is importantto recognize that over time supply will respond to increased demand. Thus, fu-ture public involvement in the performing arts will be constrained less by sup-ply of the arts than by public interest in the arts—that is, by demand. Indeed,the critical challenge for increasing all aspects of the supply of the arts(quantity, quality, and access) is stimulating greater demand for the arts.
How to address this challenge, however, is not altogether clear. Despite the bestefforts of scores of institutions and the investment of countless dollars, the

114 The Performing Arts in a New Era
profile of the average audience for live performances has changed very littleover time (Schuster, 1994). Moreover, there is a lack of systematic research onwhat influences people to take an interest in the arts. What we do know, how-ever, is that the more knowledgeable individuals are about the arts, the morelikely they are to participate. Indeed, demand for the arts, like that for otherleisure activities, increases with familiarity and experience (Kelly andFreysinger, 2000). This finding, however, begs the question of how to increasethe public’s involvement and familiarity with the arts. Again, the sparseness ofthe literature offers few definitive clues for how to accomplish this, beyondnoting that early exposure to the arts and to arts education at all levels of formaleducation can have a lasting effect on individual involvement with the arts. Artseducation can, of course, take several forms including arts appreciation, educat-ing people who teach art, and training artists. More attention should be given toarts education in all of its forms—particularly in locations where such educa-tion is largely undeveloped.
Another option is to attempt to build greater crossover between the public’s in-terests and involvement in the popular arts and the high arts. For example, al-though American teenagers (the dominant demographic groups targeted bymultimedia conglomerates) may have had only minimal exposure to theaterand classical music, they are much more likely to have purchased recordings ofpopular music and tickets to films. While it is not clear how to expand those ex-periences to the more traditional performing arts, it is clearly an issue thatshould be given more attention by arts organizations.1
CONSIDERATIONS FOR POLICY
The objective of this research was not only to improve our understanding ofhow the performing arts world operates and where it may be headed, but also toaddress what this understanding might mean for policy. The arts communityhas expressly recognized both the need to develop a policy-analytic capabilityfor the arts and the importance of articulating a clearer rationale for a govern-mental arts policy (American Assembly, 1997). Despite these developments,however, it is doubtful that an adequate framework now exists for setting policyin the arts. Policy, after all, is about choosing the appropriate actions to furtherpublic objectives. Thus, a policy framework should be based on a clear under-standing of the public interests involved, the roles that government (versusothers) could play in promoting those interests, and the strategies that govern-ment at every level has at its disposal. The following discussion develops thesepoints and offers some thoughts about the directions future policy might take.
______________ 1Moreover, as we noted in Chapter Four, crossover effects within the performing arts appear to belimited. However, as we also noted, more work needs to be done on this topic.

Where Are the Performing Arts Headed? 115
From a public policy perspective, the critical question raised by this analysis ishow future developments in the arts are likely to affect the broader public inter-est. This is a question that has not been given adequate attention by the artscommunity. Indeed, as the American Assembly acknowledges, the arts com-munity has traditionally viewed arts policy in terms of its impact on arts organi-zations and artists rather than on the American public. In response, the As-sembly has called for a much more explicit consideration of the public benefitsof the arts. We agree. As a first step, the arts community needs to devote effortto demonstrating why the arts should be considered an appropriate subject forpublic policy.
In this light, we suggest that the performing arts serve three essential functionsfor society:2
1. The arts serve as a source of entertainment, enrichment, and fulfillment forindividuals.
2. The arts serve as a vehicle for the preservation and transmission of culture.
3. The arts provide a variety of instrumental benefits for society. These benefitsexist at the individual, community, and national level.
The first category recognizes that one of the primary functions of the arts is thevalue they offer to individuals. Indeed, if there were no private demand for thearts, they would not exist. In this sense the arts are a private good that benefitsindividuals and, in turn, society. Second, the arts serve as a source of culture inthe sense that they incorporate “the best which has been thought and said inthe world” (Arnold, 1869). Access to the arts preserves and transmits this cultureand thus provides direct public benefits both for current and future genera-tions. Third, the arts provide a wide variety of instrumental or indirect benefitsat the individual, community, and national level that are of direct benefit tosociety in general. For example, at the individual level the arts may promote anopenness to new ideas and creativity as well as promoting competencies atschool and at work. At the community level, the arts can provide a variety ofeconomic and social benefits, such as increasing the level of economic activity,creating a more livable environment, and promoting a sense of communitypride. At the national level, the arts can promote an understanding of diversityand pluralism, reinforce national identity in our cultural products, and providea source of the nation’s exports.
______________ 2The societal interests we identify here include virtually all of the public purposes identified in theAmerican Assembly report, but we have classified them differently.

116 The Performing Arts in a New Era
These public benefits suggest that the public has a stake in what happens to thearts, and they thus provide a rationale for government policy. But articulatingthese potential benefits is only the first step. The arts community needs to beable to document them—something it has not yet systematically done. Too of-ten, advocates have either asserted their existence or accepted available esti-mates uncritically. As a result, it is difficult to evaluate and prioritize the variousbenefits claimed and to develop programs to promote them.
Recognizing that the government has a legitimate role in the arts still leaves twoimportant policy issues to address: first, the role government plays in promot-ing these interests and second, the strategies it employs to do so. In this context,it is important to recognize the unique nature of America’s public-private part-nership in support of the arts. Unlike the situation in many other countries, thearts in the United States are by and large provided in the private sector. Onlyrarely is the government directly involved in the production and distribution ofthe performing arts3 and, as we have demonstrated, government financing ofthe arts is a relatively minor component of total revenues. Indeed, the most im-portant government policy in providing financial support for the arts is the taxdeductibility of private charitable contributions—a policy through which indi-vidual donors rather than government officials make funding decisions. Thepublic’s long-standing resistance to direct government involvement in settingstandards for the arts suggests the ambivalence with which the public views adirect government role in the arts.
In a future environment in which the market will play an increasingly importantrole in determining what art gets produced and distributed, it is appropriate toask how the responsibility for policy should be divided between the public andprivate sectors. Schuster (1994) has suggested several roles the governmentmight play. First, government policy might be used to promote market effi-ciency—that is, to prevent the market from producing less than the “sociallyoptimal” amount of a good. Central to this efficiency argument is the economicprinciple that whenever social benefits exceed private benefits, the market, be-cause it focuses on the wants of individuals, underproduces such goods. Thisefficiency rationale is particularly relevant to the instrumental or indirect ben-efits of the arts, such as increasing the level of economic activity, creating amore livable environment, and promoting competencies at school and at work.It is also relevant to the transmission of culture because the desires of futuregenerations are unlikely to be considered by the market.
______________ 3Even where the government is directly involved in production, as is the case in government-ownedfacilities, the revenues that support those facilities are often jointly provided by public and privatesources.

Where Are the Performing Arts Headed? 117
A second role of government policy is to promote equal access to the arts. Is-sues of access can arise from several sources, including unequal geographic ac-cess to the arts, market neglect of the tastes of minority groups, problems aris-ing from poor education, or income disparities. To the extent that the marketfails to provide equal opportunities on any of these grounds, it creates an issueof equity that government policy, in principle, can address. Arguments for gov-ernment support of local arts institutions in small and midsized cities as amatter of civic pride are motivated, at least in part, by this objective.
A third role of government policy is to ensure that individuals have sufficientinformation to make their consumption choices. Government support for thedevelopment of the Internet and related protocols are examples of policies thatsupport this objective. In addition, enforcement of antitrust regulations, par-ticularly when they are designed to prevent the selective dissemination of in-formation by small groups of producers and distributors, also serve this pur-pose.4
A final role of government policy is to promote the arts because they are inher-ently good for society—a benefit that economists refer to as a “merit good.” Im-plicit in this argument is the notion that the arts promote the public welfare andthat the societal benefits of the arts are greater than the sum of the privatebenefits. Although difficult to measure, examples of such merit goods are the ef-fects of the arts in promoting an understanding of diversity and pluralism andexpressing a sense of national identity. Unlike other roles, which call for gov-ernment intervention only when the market fails to function properly, the meritgood argument asserts that the arts are intrinsically worthy of government sup-port. Judging the value of the arts relative to other merit goods, however, re-quires a much more careful assessment of the public benefits of the arts.
Within this framework, there is still a question about how the division of re-sponsibility for executing these roles should be divided among federal, state,and local governments. Some of these roles, such as implementing antitrustregulation and policies related to the Internet, clearly fall within the purview ofthe federal government. Others, such as those relating to public access and tothe arts’ instrumental benefits at the community and individual levels, may bemore appropriate for the state or local government. Because preferences forthese benefits differ from one part of the country to another, it seems reason-able from a political standpoint for decisions to be relegated to the level of gov-ernment that is closest to the region the policies will affect. Such a decentralizedapproach is also consistent with Americans’ ambivalence toward a single fed-
______________ 4We recognize that enforcement of antitrust regulations is often driven by other considerations.

118 The Performing Arts in a New Era
eral standard for the arts and their preference for decentralized governmentdecisionmaking.
The final element in a policy framework is a set of guidelines or strategies forchoosing among the policy tools available. These strategies can be distin-guished in two ways: whether they focus on the supply of or the demand for thearts and whether they affect behavior directly or indirectly. Policies that addressthe supply of the arts focus on influencing the quantity and quality of arts avail-able principally by affecting the behavior of the suppliers of art—that is, artistsand arts organizations. Policies that address demand, on the other hand, focuson increasing the access and exposure of consumers to the arts.
By and large, the focus of most arts policies since at least 1965 has been on sup-porting the supply of the arts (Chapman, 1992). This focus is reflected at thefederal level in the form of direct NEA grants to artists and arts organizationsand at the state and local levels both in support for local arts organizations andin the construction of venues to present the arts. However, policies designed toincrease the quantity and availability of the arts might be more appropriatelytargeted at demand. Indeed, if policy discussions are redirected to emphasizethe public benefits of the arts, then it seems appropriate to give more attentionto strategies aimed at stimulating demand. Both the private and instrumentalbenefits of the arts are contingent on getting individuals to become involved inthe arts—i.e., increasing the number and range of people who participate andincreasing the intensity of their participation.
The transmission and promotion of culture, on the other hand, involve not justincreasing public involvement with the arts but also ensuring that high-qualitywork is created and produced. If one believes that an increasing reliance on themarket and popular tastes will not support such creativity, a strategy that fo-cuses on artistic suppliers may be more effective. It is important to recognize,however, that such a supply-side approach inevitably generates public contro-versy about which organizations, artists, and content the government shouldsupport. Unlike the environment for the arts in much of Europe, the expendi-ture of public funds on the arts in America is often viewed as legitimate groundsfor criticizing and censoring artistic content.
Regardless of whether policies are focused on supply or demand, policymakersmust judge which strategies are most likely to achieve their objectives. In fact,policymakers have a wide variety of strategies, both direct and indirect, tochoose from. The most obvious example of a direct approach to support pro-duction of art is government grants to the arts; the most important example ofan indirect approach is the deductibility of charitable contributions that en-courage private donations to the arts. Although these two tools of governmentpolicy have received most of the attention of the arts community, there are

Where Are the Performing Arts Headed? 119
other approaches. Examples of direct strategies are government funding of artsvenues and enforcement of antitrust laws. Indirect strategies include copyrightand patent regulations that encourage artists to create new work by protectingtheir rights to control their work; support for public education, which promotesdemand for the arts; and support for development of the Internet as a platformfor the arts. These indirect approaches are more diverse, and many of their ef-fects may not be immediately apparent.
Choosing an appropriate strategy for policy, of course, requires an understand-ing of the objectives that policy is designed to achieve. Given the diversity ofparticipants and the multiplicity of interests that characterize the performingarts system, it will be a challenge for that community to agree on what the ob-jectives of arts policy should be. Consider, for example, that in describing trendsin the performing arts, we distinguished among consumers, artists, arts organi-zations, and funders and noted that each of these categories could be distin-guished in a variety of ways. Arts institutions themselves differ along multipledimensions—including discipline, sector, size, type, and mission. As in otherareas of American society, the risk is increasing Balkanization—becoming anation of niche markets and splintering interest groups—which makes itincreasingly difficult to articulate the common good.
Despite the absence of a policy framework and a clear set of policy goals, webelieve the analysis presented in this report offers a direction for arts policy—asubject to which we now turn. As we noted above, the central policy issue overthe past few decades has been the level of direct federal support for the arts. Webelieve this focus is misplaced. Although federal funding for the arts has clearsymbolic importance as a signal of the arts’ public legitimacy, it represents avery small (and shrinking) portion of performing arts organizations’ revenues.Second, the federal government’s indirect financial support for the arts throughthe deductibility of charitable contributions is much more important financiallythan its direct subsidies. Third, direct federal funding of the arts brings with itincreased pressures for artistic standards and cries of outrage from vocal citi-zens who are offended by specific works of art. Finally, battles over federalfunding have diverted energy and attention from other issues that are appro-priate to the new era of the performing arts we have delineated in this report.
We believe more attention should be given to policy strategies that focus onstimulating demand for the arts. This focus is consistent with the recognition ofthe need to emphasize the public benefits of the arts and with the increasingrole that public demand will play in determining what art gets produced anddistributed. Efforts to diversify and broaden arts audiences are also less likely tobe subject to the criticisms that have been raised about public subsidies goingto arts organizations whose consumers are, on average, more affluent than thepublic at large. Strategies that focus on stimulating demand are also more likely

120 The Performing Arts in a New Era
to increase the quantity, accessibility, and diversity of arts—that is, to expandthe market for the arts—than are policies directed largely at supply. Other im-portant issues—such as technological change, increasing concentration in thecommercial performing arts sector, uncertainty surrounding intellectual prop-erty laws, and a potential decline in employment opportunities for new artists—have been largely relegated to the periphery of policy discussions. It is time toaddress them more directly, formulate policy objectives, and assess policy op-tions. Finally, in an arts environment in which private actors will continue tohave a major role in determining the future course of events, governmentalstrategies that rely primarily on direct actions to shape private behavior maynot be adequate. Instead, we suggest that the arts policy community exploremore creative ways in which government policy can provide incentives that en-courage arts organizations and others to support innovative programming, tohire and train new artists, and to increase public involvement in their activities.All these issues will require future research and data collection, as we suggestbelow.
RECOMMENDATIONS FOR FUTURE RESEARCH
Throughout this report, we have emphasized the limitations of the data and re-search on the arts. Here we recommend specific areas in which further datacollection and research would be particularly useful. Given the relatively unde-veloped state of research on the arts (at least in comparison with such areas aseducation and health care), it is important to set priorities to focus resourceswhere they can be most effective.
We have called for more attention to policies that stimulate public involvementin the arts rather than focusing exclusively on promoting supply of the arts. Lit-tle research has been done, however, on how interest in the arts develops, ei-ther in general or in specific disciplines, or why people choose certain forms ofparticipation. Most studies of demand have been based on cross-sectional sur-veys of the national population and focus on estimating levels and correlates ofparticipation. Such studies fail to address the process through which tastes forart are formed or how those tastes can be influenced. We recommend future re-search in this area. It would be particularly useful to develop and test modelsthat explain how tastes for the arts are formed and how they change—and toconduct this research in such a way that it can help inform policy and help artspractitioners who are trying to extend the reach of artistic programs in theirown communities.5 Future research should also examine the role of educationin general, and arts education in particular, in the formation of artistic tastes.
______________ 5See McCarthy and Jinnett (2001) for a discussion of how increased understanding of the deci-sionmaking process can be used to influence participation behavior.

Where Are the Performing Arts Headed? 121
Our recommendation that arts policy focus more on addressing demand for thearts reflects the importance that we and others place on the public benefits ofthe arts. Despite recent efforts to articulate the importance of these benefits,however, no systematic study exists that documents what we know about thosebenefits or how they relate to arts participation behavior. As a result, it is diffi-cult to evaluate the benefits claimed by arts advocates, much less to drawlessons that will help design effective programs to promote these benefits. Whatis needed is a systematic analysis of the evidence that exists about the benefitsof the arts and how these benefits are related to patterns of arts participation.
As we suggested in Chapter Five, although artists are at the center of the cre-ative process, we probably know less about them than about any other part ofthe performing arts environment. For example, we know that a simple di-chotomy between artists who pursue their art on a vocational basis and thosefor whom it is an avocation greatly oversimplifies reality, but we do not haveenough information about artists’ career patterns, earnings, skill levels, andemployment conditions to make finer distinctions. We also know very littleabout how the institutions and sectors in which artists work affect theiremployment conditions and career patterns. As a result, although we know thatthe number of self-defined artists appears to be increasing and that more artistsappear to be pursuing their art on an avocational basis, we cannot make anydefinitive statements about what this might mean for artists’ employmentprospects or working conditions. Most important, we cannot assess what suchchanges imply for the quality, quantity, and availability of the performing arts.
The major constraint on improving our knowledge of these issues is the ab-sence of data. As we noted in Chapter Five, the basic source of data on artists isthe Decennial Census of Population. But Census data on artists rely on self-definition; fail to distinguish among work done as a performer, other arts-related employment, and non-arts employment; and contain very littleinformation about employers and virtually none on career dynamics. Althoughsome data exist on such issues, they are neither comprehensive nor systematic.We believe that this situation is unlikely to improve dramatically until betterdata are collected. In particular, we recommend that systematic employmentdata be collected that distinguish among the different categories ofemployment (performing, other arts-related, and non-arts) and describe insufficient detail the characteristics of employers to which the employmentconditions pertain. We also believe that longitudinal data are needed on suchelements of the career process as training and experience, career motivations,employment patterns, and institutional experience and how these factors havechanged over time.
In discussing how the characteristics and financing of arts organizations havebeen changing, we pointed out several gaps in our existing knowledge. We

122 The Performing Arts in a New Era
noted, for example, that the major sources of information on the organizationaland financial characteristics of arts organizations, namely, the Economic Cen-sus and IRS Form 990 data, are much more likely to capture large than smallnonprofit organizations and typically contain almost no information on organi-zations in the volunteer sector. This selectivity is particularly troubling with re-spect to the volunteer sector, which appears to be an order of magnitude largerthan the large nonprofit sector and is growing rapidly. A more accurate de-scription of the trends affecting the performing arts system will require a dedi-cated data-gathering effort focused on very small performing arts groups—especially those in the volunteer sector.6
A second major gap in our knowledge of arts organizations is the absence ofsystematic information about institutional expenditures. Although we are ableto determine the amount and sources of revenues for nonprofit organizationsover time, and thus determine that the earnings gap facing nonprofits appearsto be relatively stable, a more complete picture of their financial situation (aswell as that of the for-profit sector) requires information on expenditures. Infact, a true test of Baumol and Bowen’s cost disease hypothesis requires suchinformation. The absence of expenditure (and cost) data also hampers anydiscussion of the strategies nonprofit and for-profit firms are employing to dealwith changing financial pressures.
Although proprietary concerns limit the willingness of for-profit firms to dis-close more complete information about their revenues and expenditures, morecould and should be done to collect systematic information on nonprofit artsorganizations’ financial situation. Indeed, The Ford Foundation conducted asystematic study of a sample of arts organizations in the 1970s (The FordFoundation, 1974) and that study could be used as a model for future datagathering and research.
Finally, we recommend systematic collection of information on organizationalprogramming and output. As we noted in our discussion of the changing orga-nizational structure of the arts (Chapter Six), we were unable to determinewhether the declining average size of most nonprofit arts organizations is aproduct of the entry of new firms or reductions in size of existing firms. Simi-larly, in discussing changes in programming strategies of arts organizations, wewere forced to rely on anecdotal and specialized studies of existing institutionsrather than systematic data on actual programming. In this case, unlike several
______________ 6Important efforts are already under way in this area, such as the Unified Database of Arts Organi-zations, which is being constructed through the joint efforts of the Urban Institute’s NationalCenter for Charitable Statistics (NCCS), the NEA, and NASAA; and the National and Local Profiles ofCultural Support project, which is being cosponsored by The Pew Charitable Trusts, Americans forthe Arts, and the Arts Policy and Administration Program of Ohio State University.

Where Are the Performing Arts Headed? 123
others, the problem may stem less from the absence of such data than from theway existing data are collected and maintained by service organizations. Someservice organizations collect information on programming and output but gen-erally do not report that information. Although more systematic procedurescould be used in collecting and compiling such information, the organizationsinvolved will need to be convinced that there are benefits to doing so. We rec-ommend that this case be made.


125
BIBLIOGRAPHY
Alper, Neil O., and Gregory H. Wassall, More Than Once in a Blue Moon:Multiple Jobholdings by American Artists, National Endowment for the Arts,Santa Ana, CA: Seven Locks Press, 2000.
Alper, Neil O., Gregory H. Wassall, Joan Jeffri, et al., Artists in the Work Force:Employment and Earnings 1970 to 1990. NEA Research Division Report No.37, Washington, DC: National Endowment for the Arts, 1996.
American Assembly, The Arts and the Public Purpose, final report of the 92ndAmerican Assembly, American Assembly, Columbia University, New York,1997, pp. 64–70.
Americans for the Arts, “Highlights from a Nationwide Survey of the Attitudes ofthe American People Toward the Arts,” prepared for the American Councilfor the Arts, The National Assembly of Local Arts Agencies, conducted byLouis Harris, Vol. 7, 1996.
Arnold, Matthew, Culture and Anarchy: An Essay in Political and SocialCriticism (1869), edited with an introduction by J. Dover Wilson, Cambridge,UK: Cambridge University Press, 1960.
Arthurs, Alberta, and Frank Hodsoll, “The Importance of the Arts Sector: How ItRelates to the Public Sector,” Journal of Arts Management, Law, and Society,Summer 1998, pp. 102–108.
Association of Performing Arts Presenters, 1995 Profile of Member Organiza-tions, Washington, DC: APAP, 1995.
Balfe, Judith H., “The Baby-Boom Generation: Lost Patrons, Lost Audience?” InMargaret J. Wyszomirski and Pat Clubb, eds., The Cost of Culture: Patternsand Prospects of Private Arts Patronage, New York: ACA Books, 1989.
Balfe, Judith H., and Monnie Peters, “Public Involvement in the Arts,” in Joni M.Cherbo and Margaret J. Wyszomirski, eds., The Public Life of the Arts inAmerica, New Brunswick, NJ: Rutgers University Press, 2000, pp. 81–107.

126 The Performing Arts in a New Era
Baumol, William J., “Children of the Performing Arts, the Economic Dilemma:The Climbing Costs of Health Care and Education,” Journal of Cultural Eco-nomics, Vol. 20, 1996, pp. 183–206.
Baumol, William, and Hilda Baumol, “The Future of One Theater and the CostDisease of the Arts,” in M. A. Hendon, J. F. Richardson, and W. S. Hendon,Bach and the Box: The Implications of Television on the Performing Arts,Akron, OH: The Association for Cultural Economics, 1985a.
Baumol, William, and Hilda Baumol, “On the Cost Disease and Its True PolicyImplications for the Performing Arts,” in D. Greenaway and G. K. Shaw, eds.,Public Choice, Public Finance, and Public Policy: Essays in Honor of Alan Pea-cock, London: Basil Blackwell, 1985b.
Baumol, William, and Hilda Baumol, The Impact of the Broadway Theatre on theEconomy of New York City: A Study for the League of New York Theatres andProducers, New York: League of New York Theatres and Producers, 1977.
Baumol, William J., and William G. Bowen, Performing Arts—The EconomicDilemma: A Study of Problems Common to Theater, Opera, Music, and Dance,New York: The Twentieth Century Fund, 1966.
Beene, Melanie, and Associates, Autopsy of an Orchestra: An Analysis of FactorsContributing to the Bankruptcy of the Oakland Symphony Orchestra Associa-tion, San Anselmo, CA: Melanie Beene, January 1988.
Bergonzi, Louis, and Julia Smith, Effects of Arts Education on Participation in theArts, Washington, DC: National Endowment for the Arts, 1996.
Blau, Judith R., L. Newman, and Joseph E. Schwartz, “Internal Economics ofScale in Performing Arts Organizations,” Journal of Cultural Economics, Vol.10, No. 1, June 1986, pp. 63–75.
Bowles, Eleanor, Cultural Centers of Color: Report on a National Survey, Wash-ington, DC: National Endowment for the Arts, 1992.
Brooks, Arthur C., “The ‘Income Gap’ and the Health of the Arts Nonprofits: Ar-guments, Evidence, and Strategies,” Nonprofit Management and Leadership,Vol. 10, No. 3, 2000a.
Brooks, Arthur C., “Is There a Dark Side to Government Support for Non-profits?” Public Administration Review, Vol. 60, No. 3, 2000b, pp. 211–218.
Brooks, Arthur C., “Government Subsidies Taking Toll on Nonprofits’ PrivateDonations,” Atlanta Journal-Constitution, July 2, 2000c, p. B4.
Brooks, Arthur C., Economic Strategies for Orchestras, Evanston, IL: SymphonyOrchestra Institute, March 1997.

Bibliography 127
Brooks, Arthur C., Concert Fee Determination: A Game-Theoretic Approach,Boca Raton, FL: Florida Atlantic University (Master’s Thesis), 1994.
Brustein, Robert, “Requiem,” The New Republic, March 27, 2000.
Brustein, Robert, “The Death of the Collective Ideal,” The New Republic,September 11, 1993. http://www.tnr.com/091800.html.
Brustein, Robert, “The War on the Arts,” The New Republic, Vol. 207, September7, 1992, pp. 11–12.
Butsch, Richard, The Making of American Audiences: From Stage to Television,1750–1990, Cambridge, UK: Cambridge University Press, 2000.
Carter, Bill, “At T.V. Bazaar, U.S. Companies Look to Buy, Not Just Sell,” TheNew York Times, October 9, 2000.
Caves, Richard F., Creative Industries, Cambridge, MA: Harvard UniversityPress, 2000.
Chamber Music America, Chamber Music in America: Status of the NationalChamber Music Field, A Working Paper, New York: Chamber Music America,1992.
Chapman, Laura, “Arts Education as a Political Issue: The Federal Legacy,” inRalph A Smith and Ronald Berman, eds., Public Policy and the Aesthetic In-terest: Critical Essays on Defining Cultural and Educational Relations, Ur-bana, IL: University of Illinois Press, 1992, pp. 119–136.
Chartrand, Harry H., “Copyright C.P.U.: Creators, Proprietors, and Users,”Journal of Arts Management, Law, and Society, Vol. 30, No. 3, Fall 2000, pp.209–240.
Cherbo, Joni M., Creative Synergy: Commercial and Nonprofit Live Theater inAmerica, Ohio State University Arts Policy and Administration ProgramWorking Paper No. 3, April 1999.
Cherbo, Joni M., and Margaret J. Wyszomirski, “Mapping the Public Life of theArts in America,” in Joni M. Cherbo and Margaret J. Wyszomirski, eds., ThePublic Life of the Arts in America, New Brunswick, NJ: Rutgers UniversityPress, 2000.
Cheskin, Irving W., “The ‘Taxpaying’ Theater: How Has It Fared During Infla-tion?” in Hilda Baumol and William J. Baumol, eds., Inflation and thePerforming Arts, New York: New York University Press, 1984.
Cobb, Nina K., Looking Ahead: Private Sector Giving to the Arts and the Hu-manities, Washington, DC: President’s Committee on the Arts and the Hu-manities, 1996.

128 The Performing Arts in a New Era
Colonna, Carl M., “The Economic Contribution of Volunteerism Toward theValue of Our Cultural Inventory,” Journal of Cultural Economics, Vol. 19, No.4, 1995, pp. 341–350.
Cowan, C. Lynn, “Second Homes: Multiple Bases for Performing Arts Organiza-tions,” Journal of Arts Management, Law, and Society, Vol. 17, No. 1, 1987, pp.23–36.
Cowen, Tyler, In Praise of Commercial Culture, Cambridge, MA: Harvard Uni-versity Press, 1998.
Dance Magazine. See “Pas de Deux: Capezio, NYCB.”
Denisoff, Serge R., The Popular Record Industry, New Brunswick, NJ: Transac-tion Books, 1975.
Deveaux, Scott, Jazz in America: Who’s Listening? Washington, DC: NationalEndowment of the Arts, 1994.
DiMaggio, Paul J., “Decentralization of Arts Funding from the Federal Govern-ment to the States,” in Stephen Benedict, ed., Public Money and the Muse: Es-says on Government Funding for the Arts, New York: W. W. Norton Company,1991.
DiMaggio, Paul J., “Cultural Entrepreneurship in 19th Century Boston,” in PaulJ. DiMaggio, ed., Nonprofit Enterprise in the Arts: Studies in Mission andConstraint, New York: Oxford University Press, 1986.
DiMaggio, Paul J., “The Nonprofit Instrument and the Influence of the Market-place on Policies in the Arts,” in The Arts and Public Policy in the UnitedStates, Prentice-Hall for The American Assembly, Englewood Cliffs, NJ:Columbia University, 1984.
DiMaggio, Paul J., “Cultural Entrepreneurship in Nineteenth-Century Boston,”in Media, Culture and Society, Vol. 4, 1982, pp. 33–50.
Donnat, Oliver, Les Amateurs: Enquete sur les activities artistiques des Francais,Paris: Documentation Francaise, 1996.
Dunn, Donald H., “Unions Are Losing Their Star Billing on Broadway,” BusinessWeek, November 26, 1984, p. 62.
Economic Report of the President, Inequality of Economic Rewards, Washing-ton, DC: United States Government Printing Office, 1997, pp. 163–188.
Ellis, Diane C., and John C. Beresford, Trends in Artists’ Occupations: 1970–1990,Washington, DC: NEA Research Division, 1994.
Feist, Andrew, and Robert Hutchison, Amateur Arts in the UK, London: PolicyStudies Institute, 1991.

Bibliography 129
Filer, Randall K., “The ‘Starving Artist’—Myth or Reality? Earnings of Artists inthe United States,” Journal of Political Economy, Vol. 94, No. 1, February1986, pp. 56–75.
The Ford Foundation, The Finances of the Performing Arts, New York: FordFoundation, Vols. 1 and 2, 1974.
Fowler, Charles, “The New Arts Education,” College Music Symposium, Vol. 16,1976, pp. 19–24.
Frank, Robert H., and Philip J. Cook, The Winner-Take-All Society: How Moreand More Americans Compete for Ever Fewer and Bigger Prizes, EncouragingEconomic Waste, Income Inequality, and an Impoverished Cultural Life, NewYork: Free Press, 1995.
Frith, Simon, “Art Versus Technology—The Strange Case of Popular Music,”Media, Culture and Society, Vol. 8, No. 3, 1986, pp. 263–279.
Froelich, Karen A., and Terry W. Knoepfle, “IRS 990 Data: Fact or Fiction?” Non-profit and Voluntary Sector Quarterly, Vol. 25, No. 1, March 1996, pp. 40–53.
Garvin, David A., “Blockbusters: The Economics of Mass Entertainment,” Jour-nal of Cultural Economics, Vol. 5, No. 1, June 1981, pp. 1–20.
Gomes, Lee, “MP3 Is Transforming the Way Bands Build a Following; and theWay Record Companies Find Talent,” The Wall Street Journal, March 20,2000, p. R14.
Hall, Peter D., “A Historical Overview of the Private Nonprofit Sector,” in WalterW. Powell, ed., The Nonprofit Sector: A Research Handbook, New Haven, CT:Yale University Press, 1987.
Hamilton, Marci, “The Story Behind the MP3.com Judgement,” Findlaw’s LegalCommentary, November 23, 2000.
Hansmann, Henry, “Economic Theories of Nonprofit Organizations,” in WalterW. Powell, ed., The Nonprofit Sector: A Research Handbook, New Haven, CT:Yale University Press, 1987.
Hansmann, Henry, “Nonprofit Enterprise in the Performing Arts,” Bell Journalof Economics, Vol. 12, No. 2, 1981, pp. 341–361.
Harris, Neil, Public Subsidies and American Art, Seattle, WA: Grantmakers in theArts, October 1995.
Heilbrun, James, “Empirical Evidence of a Decline in Repertory DiversityAmong American Opera Companies 1991/92 to 1997/98,” Journal of CulturalEconomics, Vol. 25, 2001a, pp. 63–72.

130 The Performing Arts in a New Era
Heilbrun, James, “A Correction to Hilda and William Baumol’s Paper ‘TheFuture of One Theater and the Cost Disease of the Arts,’” Journal of CulturalEconomics, Vol. 25, 2001b, pp. 149–150.
Heilbrun, James, and Charles M. Gray, The Economics of Art and Culture: AnAmerican Perspective, Cambridge, UK: Cambridge University Press, 1993.
Hirsch, Paul, M., “Processing Fads and Fashions: An Organization-Set Analysisof Cultural Industry Systems,” in Simon Frith and Andrew Goodwin, eds., OnRecord: Rock, Pop, and the Written Word, New York: Routledge, 1990.Originally published in 1972.
Holak, Susan L., et al., “Analyzing Opera Attendance: The Relative Impact ofManagerial and Environmental Variables,” Empirical Studies of the Arts, Vol.4, No. 2, 1986.
Jeffri, Joan, Information on Artists 2, New York: Research Center for Arts andCulture, Columbia University, 1998.
Jeffri, Joan, The Emerging Arts: Management, Survival, and Growth, New York:Praeger Publishers, 1980.
Johnson, Lawrence B., “St Louis Symphony Orchestra: Accord Despite a FiscalSour Note,” The New York Times, October 15, 2000.
Kartunnen, Sari, Professionalisation Through Social Closure in the Arts, paperpresented to the International Sociological Association, 1998.
Keegan, Carol, Public Participation in Classical Ballet: A Special Analysis of theBallet Data Collected in the 1982 and 1985 Surveys of Public Participation inthe Arts, Washington, DC: National Endowment for the Arts, 1987.
Kelly, John R., and Valeria J. Freysinger, 21st Century Leisure: Current Issues,Boston: Allyn & Bacon, 2000.
Kingma, B. R., “An Accurate Measure of the Crowd-Out Effect, Income Effect,and Price Effect for Charitable Contributions,” Journal of Political Economy,Vol. 97, 1989, pp. 1197–1207.
Kozinn, Allan, “Classical Concerts and Recordings Seek Audience on the Web,”New York Times, June 13, 2000.
Kreidler, John, “Leverage Lost: The Nonprofit Arts in the Post-Ford Era,” Journalof Arts Management, Law, and Society, Vol. 26, No. 2, 1996, pp. 79–100.
Landesman, Rocco, “Broadway: Devil or Angel for Nonprofit Theater? A VitalMovement Has Lost Its Way,” The New York Times, June 4, 2000.
Lange, Mark D., William A. Luksetich, and Philip Jacobs, “Managerial Objectivesof Symphony Orchestras,” Managerial and Decision Economics, Vol. 7, 1986,pp. 273–278.

Bibliography 131
Larson, Gary O., American Canvas: An Arts Legacy for Our Communities, Wash-ington, DC: Office of Policy, Research and Technology, National Endowmentfor the Arts, 1997.
Lemmons, Jack R., American Dance 1992: Who’s Watching? Who’s Dancing?Washington, DC: National Endowment for the Arts, 1966.
Leonhard, Charles, Status of Arts Education in American Public Schools, Wash-ington, DC: National Endowment for the Arts, 1991.
Levine, Lawrence W., Highbrow/Lowbrow: The Emergence of Cultural Hierarchyin America, Cambridge, MA: Harvard University Press, 1988.
Litman, Jessica, “Revising Copyright Law for the Information Age,” OregonLaw Review, Vol. 75, No. 19, 1996. http://wwwsecure.law.cornell.edu/commentary/intelpro/litrvtxt.htm.
Love, Jeffrey, Patterns of Multiple Participation in the Arts: An Analysis of 1982,1985, and 1992 SPPA Data, Washington, DC: National Endowment for theArts, 1995.
McCarthy, Kevin F., and Kimberly Jinnett, A New Framework for BuildingParticipation in the Arts, Santa Monica, CA: RAND, MR-1323-WRDF, 2001.
McCarthy, Kevin F., Elizabeth H. Ondaatje, and Laura Zakaras, Guide to the Lit-erature on Participation in the Arts, Santa Monica, CA: RAND, MR-1322-WRDF, 2001.
McCarthy, Kevin F., and Georges Vernez, The Costs of Immigration to Taxpayers:Analytical and Policy Issues, Santa Monica, CA: RAND, MR-705-FF/IF, 1996.
Menger, Pierre-Michel, “Artistic Labor Markets and Careers,” American Reviewof Sociology, Vol. 25, 1999.
Midgette, Anne, “For Singers, a New American Way,” The New York Times, July2, 2000.
Miller, Russell, and Roger Boar, The Incredible Music Machine, London: QuartetBooks Limited, 1981.
Moore, Thomas G., The Economics of the American Theater, Durham, NC: DukeUniversity Press, 1968.
Music Educators National Conference, “K–12 Arts Education in the UnitedStates: Present Context,” Future Needs, 1986, p. 10.
Myers, David E., and Arthur C. Brooks, “Policy Issues Connecting Music Educa-tion and Arts Education,” in Richard J. Colwell and Carol P. Richardson, eds.,Second Handbook of Research on Music Teaching and Learning, London:Oxford University Press (forthcoming).

132 The Performing Arts in a New Era
National Center for Charitable Statistics, Guide to Using NCCS Data, availableon the web at http://nccs.urban.org/guide.htm/, 2001.
National Endowment for the Arts, 1997 Survey of Public Participation in theArts, NEA Research Division Report No. 39, Washington, DC: National En-dowment for the Arts, 1998a.
National Endowment for the Arts, Theaters Report 22% Growth in EconomicCensus: 1987–1992, NEA Research Division Note No. 66, Washington, D.C.:NEA, 1998b.
National Endowment for the Arts, Dance Organizations Report 43% Growth inEconomic Census: 1987–1992, NEA Research Division Note No. 67, Wash-ington, D.C.: NEA, May 1998c.
National Endowment for the Arts, Classical Music Organizations Report 22%Growth in Economic Census:1987–1992, NEA Research Division Note No. 68,Washington, D.C.: NEA, May 1998d.
National Endowment for the Arts, Visual Artists in Houston, Minneapolis,Washington, and San Francisco: Earnings and Exhibition Opportunities, NEAResearch Division Report No. 18, Washington, DC: National Endowment forthe Arts, 1982a.
National Endowment for the Arts, Artist Employment and Unemployment:1971–1980, NEA Research Division Report No. 16, Washington, DC: NationalEndowment for the Arts, 1982b.
National Endowment for the Arts, Conditions and Needs of the ProfessionalAmerican Theater, NEA Research Division Report No. 11, Washington, DC:National Endowment for the Arts, 1981.
Netzer, Dick, “The Subsidized Muse,” Cambridge University Press, 1978.
Newhouse, Joseph, “Toward a Theory of Nonprofit Institutions: An EconomicModel of a Hospital,” American Economic Review, Vol. 60, March 1970, pp.64–74.
Oates, Wallace E., “An Essay on Fiscal Federalism,” Journal of Economic Litera-ture, Vol. 37, September 1999, pp. 1120–1149.
OPERA America, Annual Field Report, Washington, DC: OPERA America, vari-ous years.
Orend, Richard J., and Carol Keegan, Education and Arts Participation: A Studyof Arts Socialization and Current Arts-Related Activities Using 1982 and 1992SPPA Data, National Endowment for the Arts, Washington, DC: 1996.
Pareles, Jon, “Musicians Take Copyright Issue to Congress,” The New YorkTimes, May 25, 2000.

Bibliography 133
“Pas de Deux: Capezio, NYCB,” Dance Magazine, February 2001, p. 47.
Peters, Monnie, and J. M. Cherbo, “The Missing Sector: The UnincorporatedArts,” Journal of Arts Management, Law, and Society, Vol. 28, No. 2, 1998, pp.115–128.
Peters, Monnie, and Joni Maya Cherbo, Americans’ Personal Participation in theArts: 1992, A Monograph Describing the Data from the Survey of Public Partic-ipation in the Arts, Washington, DC: National Endowment for the Arts, 1996.
Peterson, Elizabeth, The Changing Faces of Tradition: A Report on the Folk andTraditional Arts in the United States, NEA Research Division Report No. 38,Washington, DC: National Endowment for the Arts, 1996.
Peterson, Richard A., and David G. Berger, “Reply: Measuring Industry Concen-tration, Diversity and Innovation in Popular Music,” American SociologicalReview, Vol. 61, No. 1, February 1996, pp. 175–178.
Peterson, Richard A., and David G. Berger, “Cycles in Symbol Production: TheCase of Popular Music,” in Simon Frith and Andrew Goodwin, eds., OnRecord: Rock, Pop, and the Written Word, New York: Routledge, 1990.Reprinted from 1975 article.
Peterson, Richard A., Roger M. Kern, and Pamela C. Hull, “Age and ArtsParticipation: 1982–1997,” National Endowment for the Arts, NEA ResearchDivision Report No. 42, 1999.
Peterson, Richard A., Darren E. Sherkat, Judith H. Balfe, and Rolf Meyersohn,Age and Arts Participation, with a Focus on the Baby Boom Cohort, NEA Re-search Division Report No. 34, Washington, DC: National Endowment for theArts, 1996.
Phillips, Michael, “More Than Four Actors Need Not Apply,” Los Angeles Times,Calendar Section, March 11, 2001, p. 7.
Pierce, J. Lamar, “Programmatic Risk-Taking by American Opera Companies,”Journal of Cultural Economics, Vol. 24, No. 1, February 2000, pp. 45–63.
Pincus, Andrew L., Tanglewood: The Clash Between Tradition and Change,Boston: Northeastern University Press, 1998.
Pogrebin, Robin, “Theater for Fun and Profit: Producers’ Two Camps RemainUneasy Allies,” The New York Times, June 15, 2000a.
Pogrebin, Robin, “A Roundabout Journey to Glamour,” The New York Times,July 27, 2000b.
Pollack, Andrew, “Time-Warner to Acquire Control of EMI Music,” The NewYork Times, January 24, 2000.

134 The Performing Arts in a New Era
President’s Committee on the Arts and Humanities, Creative America, Washing-ton, DC: President’s Committee on the Arts and Humanities, 1997.
Putnam, Robert, Bowling Alone: The Collapse and Revival of American Com-munity, New York: Simon and Schuster, 2000.
Recording Industry Association of America (RIAA), “Recording IndustryReleases 2000 Manufacturers’ Shipments and Value Report,” February 16,2001. http://www.riaa.com/pdf/year_end_2000.pdf.
Renz, Loren, and Steven Lawrence, Arts Funding: An Update on FoundationTrends, Third Edition, New York: The Foundation Center, 1998.
Robinson, John P., Arts Participation in America: 1982–1992, Washington, DC:National Endowment for the Arts, 1993.
Robinson, John P., “A Review: Survey Organization Differences in EstimatingPublic Participation in the Arts,” Public Opinion Quarterly, Vol. 52, No. 3,1989.
Robinson, John P., and Geoffrey Godbey, Time for Life: The Surprising WaysAmericans Use Their Time, University Park, PA: Pennsylvania State UniversityPress, 1997.
Robinson, John P., et al., Public Participation in the Arts: Final Report on the1982 Survey, Washington, DC: National Endowment for the Arts, 1985.
Rosen, Sherwin, “The Economics of Superstars,” American Economic Review,Vol. 71, No. 5, 1982, pp. 845–858.
Ruttenberg, Friedman, Kilgallon, Gutchess & Associates, Survey of Employment,Underemployment and Unemployment in the Performing Arts Human Re-sources Institute, AFL-CIO, 1977, 1978.
Sanjek, Russell, and David Sanjek, American Popular Music Business in the 20thCentury, New York: Oxford University Press, 1991.
Schor, Juliet, The Overworked American: The Unexpected Decline of Leisure,New York: Basic Books, 1991.
Schuster, J. Mark, “Arguing for Government Support of the Arts: An AmericanView,” in The Arts in the World Economy, Hanover, NH: University Press ofNew England for Salzburg Seminar, 1994.
Schuster, J. Mark, The Audience for American Art Museums, NEA Research Divi-sion Report No. 23, Washington, DC: National Endowment for the Arts, 1991.
Schuster, J. Mark, Alan L. Feld, and Michael O’Hare, Patrons Despite Them-selves: Taxpayers and Arts Policy, New York: New York University Press, 1983.

Bibliography 135
Schwarz, Samuel, “Differential Economies and a Decreasing Share of ArtisticPersonnel Costs,” Journal of Cultural Economics, Vol. 7, No. 1, June 1983, pp.27–31.
Scott, A. J., “The U.S. Recorded Music Industry: On the Relations Between Or-ganization, Location, and Creativity in the Cultural Economy,” Environmentand Planning, Vol. 31, No. 11, 1999.
Seabrook, John, Nobrow: The Culture of Marketing, The Marketing of Culture,New York: Alfred A. Knopf, 2000.
Siegel, Marcia B., “The Flimsy Vault,” Hudson Review, July 1977, p. 251.
Smith, David Horton, “The Rest of the Nonprofit Sector: Grassroots Associa-tions as the Dark Matter Ignored in Prevailing ‘Flat Earth’ Maps of the Sec-tor,” Nonprofit and Voluntary Sector Quarterly, Vol. 26, No. 2, June 1997.
Smith, Ralph A., “Policy for Arts Education: Whither the Schools, Whither thePublic and Private Sectors,” in R. A. Smith and R. Berman, eds., Public Policyand the Aesthetic Interest: Critical Essays on Defining Cultural and Educa-tional Relations, Urbana, IL: University of Illinois Press, 1992, pp. 137–152.
Smith, Sid, “Chicago’s Very Own Joffrey Ballet Launches Its New Era with‘Nutcracker’ Staging in Washington,” The Chicago Tribune, December 8,1995.
Stebbins, Robert, Amateurs, Professionals, and Serious Leisure, Montreal:McGill-Queens University Press, 1992.
Steinberg, Richard, “On the Financial Structure of the US Non-Profit Sector,”Voluntas, Vol. 4, No. 2, 1993, pp. 199–204.
Stigler, George J., and Gary S. Becker, “De Gustibus Non Est Disputandum,”American Economic Review, Vol. 67, No. 2, 1977, pp. 76–90.
Strauss, Neil, “Music Mergers Herald a Shift to the Internet,” The New YorkTimes, January 26, 2000.
Stroud, Michael, “A Music Industry Death Knell?” Wired, January 11, 2000.
Tepper, Steven J., Making Sense of the Numbers: Estimating Arts Participation inAmerica,” Princeton University, Working Paper No. 4, 1998.
“The New NEA Arts-in-Education Program,” Arts Education Policy Review, Vol.88, No. 2, 1986, pp. 25–33.
Throsby, C. David, “Disaggregated Earnings Functions of Artists,” in VictorGinsburgh and Pierre-Michel Menger, eds., Economics of the Arts: SelectedEssays, Amsterdam: Elsevier Science BV, 1996.

136 The Performing Arts in a New Era
Throsby, C. David, “The Production and Consumption of the Arts: A View ofCultural Economics,” Journal of Economic Literature, Vol. 32, March 1994.
Throsby, C. David, and B. Thompson, But What Do You Do for a Living? A NewEconomic Study of Australian Artists, Redfern, Australia: Australia Council forthe Arts, 1994.
Throsby, C. David, and Glenn A. Withers, The Economics of the Performing Arts,New York: St. Martin’s Press, 1979.
Toffler, Alvin, The Culture Consumers: A Study of Art and Affluence in America,New York: St. Martin’s Press, 1964.
Tommasini, Anthony, “Inspiring a Turnaround at the Opera,” The New YorkTimes, May 16, 2000a.
Tommasini, Anthony, “Decline of the Full Recorded Opera,” The New YorkTimes, January 5, 2000b.
Urice, John K., “The Future of the State Arts Agency Movement in the 1990s:Decline and Effect,” Journal of Arts Management, Law (and Society), Vol. 22,No. 1, Spring 1992, pp. 19–32.
U.S. Department of Commerce, Bureau of the Census, Census of Service Indus-tries, various years.
U.S. Department of Labor, Bureau of Labor Statistics, Current Population Sur-vey, various months.
U.S. Federal Trade Commission, Record Companies Settle FTC Charges ofRestraining Competition in CD Music Market, Press Release, May 10, 2000.http://www.ftc.gov/opa/2000/05/cdpres.htm.
Useem, Michael, “Corporate Support for Culture and the Arts,” In Margaret J.Wyszomirski and Pat Clubb, eds., The Cost of Culture: Patterns and Prospectsof Private Arts Patronage, New York: ACA Books, 1990.
Vogel, Harold L., Entertainment Industry Economics: A Guide for FinancialAnalysis, 4th ed., Cambridge, UK: Cambridge University Press, 1998.
von Rhein, John, “Classical Music No Longer Fits in a Profit-Driven CynicalRecord Industry,” The Chicago Tribune, May 18, 2000.
Westat, Inc., 1992 Addendum to the 1989 Sourcebook of Arts Statistics, Washing-ton, DC: National Endowment for the Arts, May 1992.
Williams, Caroline, Financing Techniques for Nonprofit Organizations: Borrow-ing from the For-Profit Sector, Washington, DC: President’s Commission forthe Arts and Humanities, 1998.

Bibliography 137
Yoshitomi, Gerald, “Cultural Equity Part 2: Cultural Democracy,” in S. Benedict,ed., Public Money and the Muse, New York: W. W. Norton for the AmericanAssembly, 1991, pp. 195–215.
