performanceofultrawidebandwirelesstagsfor on … · · 2018-04-05loss was modeled as a function...
TRANSCRIPT
Hindawi Publishing CorporationInternational Journal of Antennas and PropagationVolume 2012, Article ID 232564, 10 pagesdoi:10.1155/2012/232564
Research Article
Performance of Ultrawideband Wireless Tags forOn-Body Radio Channel Characterisation
Mohammad Monirujjaman Khan,1, 2 Qammer H. Abbasi,1 Akram Alomainy,1 and Yang Hao1
1 School of Electronic Engineering and Computer Science, Queen Mary University of London, London E1 4NS, UK2 Department of Electrical and Electronic Engineering, American International University-Bangladesh, Dhaka 1213, Bangladesh
Correspondence should be addressed to Mohammad Monirujjaman Khan, [email protected]
Received 16 February 2012; Accepted 21 June 2012
Academic Editor: C. Aanandan
Copyright © 2012 Mohammad Monirujjaman Khan et al. This is an open access article distributed under the Creative CommonsAttribution License, which permits unrestricted use, distribution, and reproduction in any medium, provided the original work isproperly cited.
Experimental characterisation of on-body radio channel for ultrawideband (UWB) wireless active tags is reported in this paper.The aim of this study is to investigate the performance of the commercially available wireless tags on the UWB on-body radiochannel characterisation. Measurement campaigns are performed in the chamber and in an indoor environment. Statisticalpath loss parameters of nine different on-body radio channels for static and dynamic cases are shown and analyzed. Resultsdemonstrated that lognormal distribution provides the best fits for on-body propagation channels path loss model. The pathloss was modeled as a function of distance for 34 different receiver locations for propagation along the front part of the body. Areduction of 11.46% path loss exponent is noticed in case of indoor environment as compared to anechoic chamber. In addition,path loss exponent is also extracted for different body parts (trunk, arms, and legs). Second-order channel parameters as fadeprobability (FP), level crossing rate (LCR), and average fade duration (AFD) are also investigated.
1. Introduction
Ultrawideband (UWB) communication is an exciting andinnovative technology that has attracted much attention andexperienced considerable growth in the past few years due toits distinctive characteristics. It is a low-power, high data ratetechnology that minimizes multipath interference due to latetime-of-arrival. Its low-power requirement due to controlover duty cycle allows longer battery life and also introducesgreen radio system. One of the most potential areas of UWBapplications is the body-centric wireless networks wherevarious units/sensors are scattered on/around the humanbody to measure specified physiological data that is, patientmonitoring for healthcare applications [1–3].
In the past few years researchers have been thoroughlyinvestigating narrowband and ultrawideband on-body radiochannels. In [4–7], on-body radio channel characterisationwas presented at the unlicensed frequency band of 2.45 GHz.UWB on-body radio channel characterisation and systemlevel modelling for body-centric wireless networks havebeen presented extensively in the open literature [2, 8–20].
In [8–20], UWB on-body propagation channels have beencharacterized, and their behaviour has been investigatedin indoor and chamber for standstill, various posturedand dynamic human body based on different antennas.Most UWB on-body channel measurements are performedusing two standalone antennas and cables connecting toa vector network or spectrum analyzer which is more acontrolled environment and restrictive; however, in reallife scenarios potential UWB body-centric wireless networkneeds to be integrated with compact sensors and providesefficient and reliable communication channels. Critical issuesremain with regards to indoor propagations, radio channelcharacterization, and human body effect which they needto be addressed before the concept can be deployed forcommercial applications.
In this paper, measurement campaigns were performedin the chamber and indoor environment using commerciallyavailable UWB wearable active tags and reader. The mainaim of this study is to investigate the performance of thecommercially available wireless tags on the UWB on-bodyradio channel characterization. Nine different on-body radio

2 International Journal of Antennas and Propagation
channels are investigated and the effects of the body move-ments on the path loss are analysed. Second-order statisticsfor three different on-body links are investigated. The resultsreported here provide information on optimum sensorlocations on the body considering efficient and reliablecommunication links for various applications, for example,healthcare and performance monitoring.
The rest of the paper is organised as follows: Section 2illustrates the measurement settings, and it briefly introducesthe UWB tags, Sections 3 and 4 present the measurementresults and on-body radio channel parameters and modellingaspects, and finally Section 5 draws the main conclusion ofthe presented study.
2. Measurement Settings
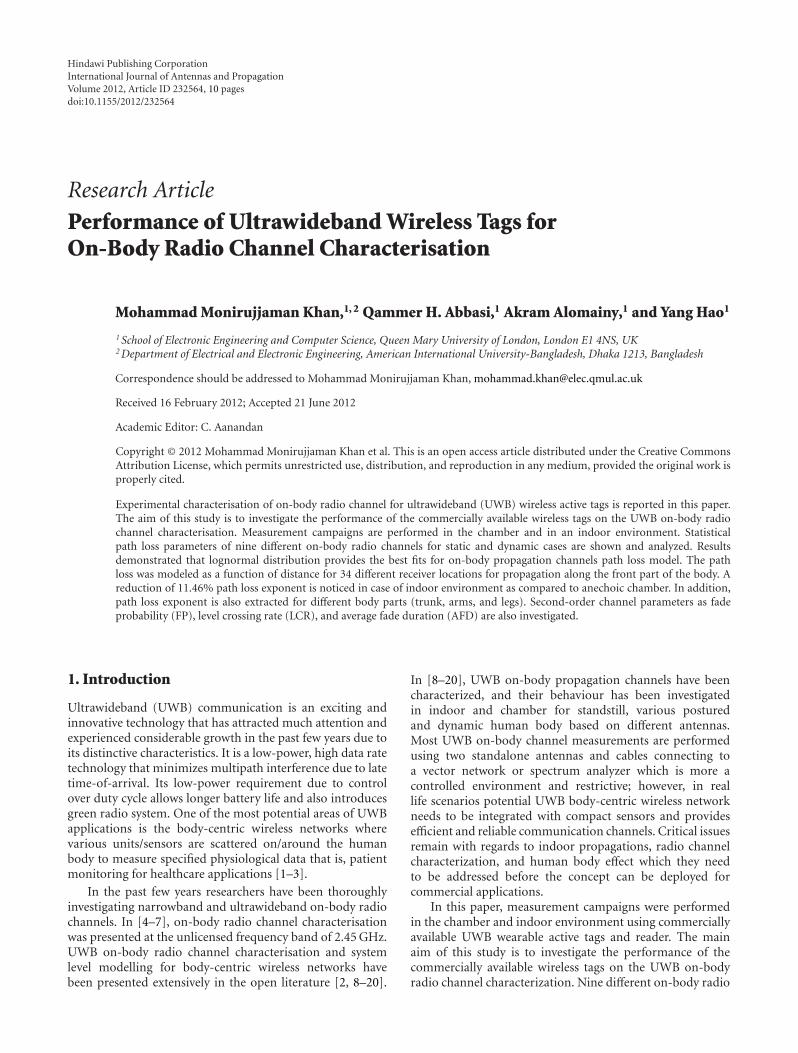
Measurement campaigns were performed using UWB wear-able active tags and reader provided by time domain PLUS[21]. For this measurement purpose, a real human subjectwas used. The test subject was an adult male of mass90 Kg, height 1.68 meter, and chest circumference 114 cm.Nine different ultrawideband wireless active transmitter tagswere attached at different locations on the human body:left/right chest, left/right thigh, left wrist, left/right ankle, leftelbow, and left ear, as shown in Figure 1, while the UWBantenna connected with the reader was placed on the leftwaist of the human subject for tag’s signal reception. Twomeasurement scenarios are considered: static and dynamichuman body. For static case, subject was standing still fora period of 60 seconds wearing nine tags on the bodyand, for the movement case, the subject was walking 5steps ahead and 5 steps back, starting with the left leg andright arm as a normal walking speed. For the dynamiccase, the measurement duration was again 60 seconds whilethe subject was doing the same walking movement for themeasurement duration. Location-based software was used tosave the tags transmission ID, received signal strength (RSSI),and time of arrival data from the reader. The UWB tags arebattery powered, and the duration of the battery life is fouryears since the tags only transmit UWB pulses every onesecond. The tag’s transmit power is −13.01 dBm which isaround 40 dB less than mobile phone transmit power. Theoperating frequency of the tags used for this measurement is5.9∼7.25 GHz with a centre frequency of 6.6 GHz. The UWBtag is small and durable, with a plastic housing that allows itto be attached to assets or people. The dimension of the tag is(13 mm × 36 mm × 33 mm) and the weight is 0.74 oz (22 g).Figures 2(a), 2(b), and 2(c) show the UWB tag encasedinside the plastic housing, the bottom view of the tag withoutplastic housing, and the top view of the tag showing the tagantenna [21]. The free space and on-body radiation patternsof the tag antenna at 6.6 GHz are measured in the anechoicchamber. The on-body radiation patterns are measured byplacing the tag antenna on the same test subject as mentionedearlier. Figures 3(a) and 3(b) show comparison of free spaceand on-body radiation patterns (XY and YZ planes) at6.6 GHz of the tag antenna. The tag antenna has monopole-like radiation patterns. When the tag is mounted on the body,the radiation pattern is omnidirectional over the surface (XZ
T1T2
Transmitter tag
(Tx) position
T3T4
T6T7
T5
T8
T9
Left chestRight chest
Left elbow
Left wrist
Left thighRight thigh
Left ankleRight ankle
Left ear
Receiver (Rx)antennaposition
20 cm
Figure 1: On-body measurement settings showing the receiverantenna is on the left waist, and nine transmitter tags are ondifferent locations of the body (nine static and dynamic channelscases analysed).
plane) of the body (test subject) and the elevation plane (YZ)radiation pattern is directed towards off the body directionwith a null in the main beam.
The measurement was first performed in the anechoicchamber to eliminate multipath reflections from surround-ing environment and then repeated in the Body-CentricWireless Sensor Lab at Queen Mary University of Londonto consider the effect of the indoor environment on the on-body radio propagation channels. Figure 4 shows the dimen-sions and geometry of the Body-Centric Wireless Sensor Lab.The total area of the lab is 45 m2 which includes a meetingarea, treadmill machine, workstations, and a hospital bedfor healthcare applications. The measured Received SignalStrength Indicator (RSSI) level for each transmitter tag isrecorded over the measurement duration of 60 seconds foreach different location.
3. UWB On-Body Radio Channel Parameters
3.1. On-Body Radio Channel Characterisation. In this work,the path loss for nine different on-body channels wascalculated from the measured RSSI for each transmitter tag.The cumulative distribution function (CDF) of the path loss
International Journal of Antennas and Propagation 3
(a) (b)
(c)
Figure 2: (a) UWB active transmitter tag encased inside the plastic housing, (b) tag without plastic housing and bottom view, and (c) topview of the tag showing the transmitter tag antenna.
variations both in the chamber and indoor environmentfor static and dynamic scenarios of nine different on-bodyradio channels is compared to well-known distributions asNormal, Lognormal, Nakagami, Rayleigh, Weibull, Gamma,and Rician adopting the Akaike criteria and on the basisof the tested results, lognormal distribution provides thebest fits to these measured results (Figure 5). The Akaikeinformation criteria is a method widely used to evaluate thegoodness of a statistical fit [3, 22]. The second-order AIC(AICc) is defined as
AICc = −2 ln(L) + 2k +2k(k + 1)n− K − 1
, (1)
where L is the maximised likelihood, K is the number ofparameters estimated for that distribution, and n is the num-ber of samples of the experiment. The seven distributionsmentioned above are all two parameter distributions (K =2) except the Rayleigh (K = 1). In this measurement, thesample size is (n = 60).
The maximised log likelihood has been obtained fromthe MATLAB estimates. The Akaike information criteria canbe used as a relative measure such that the model with the
lowest AIC means better statistical model and the criterion isused to classify models from the best to worse; to facilitatethis process, the relative AIC is considered and results arenormalized to the lowest value obtained
Δi = AICc −min(AICc). (2)
A zero value indicates the best fitness. Comparison ofdifferent distributions adopting AKAI information criteria isshown in Table 1.
Figures 6 and 7 show a comparison of the measuredaverage path loss (μ) and standard deviation (σ) of the fittedlognormal distribution that are applied to model the pathloss variations for the nine on-body radio channels, for thestatic and walking scenarios, respectively.
In the chamber, for both standing and walking cases,the highest path loss is noticed for the receiver to left-ear link, while the lowest is the receiver to left-thigh link(Figure 6). For the reader to left-ear link the communicationdistance between the reader antenna and the transmittertag is larger; in addition, due to the different orientationof the tag located on the left ear, non-line-of-sight (NLOS)

4 International Journal of Antennas and Propagation
0 dBi
30
210
60
240
90
270
120
300
150
330
180 0
Free space On-body
−40
−30
−20
−10
(a) XZ plane
0 dBi30
210
60
240
90270
120
300
150
330
180
0
Free space On-body
−40
−30
−20
−10
Z
Y
X
(b) YZ plane
Figure 3: Measured free space and on-body radiation patterns at 6.6 GHz of the tags (a) XZ plane and (b) YZ plane.
Table 1: Comparison of different distributions adopting AKAI information criteria for nine on-body links measured in the chamber andindoor.
Tag position Scenario Normal Lognormal Gamma Nakagami Rayleigh Rician Weibull
L. chestChamber 0.286 0 0.080 0.176 324.69 0.276 11.12
Indoor 0.892 0 0.282 0.282 313.88 0.884 16.74
R. chestChamber 0.010 0.078 0.040 0.016 323.22 0 5.268
Indoor 0.398 0.390 0 0.190 296.31 0.390 12.68
L. thighChamber 1.490 0 0.474 0.970 292.15 1.48 24.48
Indoor 0.474 0 0.140 0.2980 310.63 0.470 16.40
R. thighChamber 0.994 1.102 1.312 1.142 249.58 0.984 0
Indoor 0.008 0.420 0.260 0.130 290.26 0 5.450
L. wristChamber 0.530 0 0.120 0.290 203.40 0.520 8.530
Indoor 0.022 0.160 0.060 0 188.38 0.012 1.700
L. ankleChamber 0.830 0 0.240 0.520 264.01 0.820 15.25
Indoor 2.010 0 0.63 1.30 234.93 2.00 17.37
R. ankleChamber 0.490 0 0.110 0.260 220.40 0.480 9.160
Indoor 0.290 0 0.056 0.142 155.34 0.280 3.780
L. elbowChamber 0.820 0 0.250 0.514 241.55 0.812 9.270
Indoor 0.086 0.014 0 0.014 219.99 0.076 3.232
L. earChamber 0.010 0 0.050 0.0220 288.55 0.096 7.952
Indoor 0.706 0 0.210 0.4420 250.102 0.696 13.576
communications exist, which cause the highest path lossvalue for this channel. For this case (the receiver to left-earlink) due to different orientation of the tag located on theleft ear, the polarization mismatch occurs between the tagand the reader which also causes the higher path loss value
for this link. For the left-thigh link, there are a clear line-of-sight (LOS) communication and the lowest communicationdistance between the reader and the transmitter tag.
In the indoor environment due to reflecting area andcontributions of multipath reflection the right chest and

International Journal of Antennas and Propagation 5
Transmitter antenna attached on human candidate
Receiver antenna attached on human candidate
Treadmill
machine
Human candidate
DoorPillar Window
Hospitalbed
Shelves
Meeting table
Drawers
Work station
8.4 m
4 m
3.17 m
3.4
m
7.9
m
Body centric wireless sensor lab,Queen Mary University of London
Total size: 153 m2
Figure 4: Dimensions and geometry of the Body-Centric Wireless Sensor Lab (housed within the Department of Electronic engineering,Queen Mary University of London, London, UK) where the indoor on-body radio propagation measurements for the presented work areperformed.
left-ear (for static case) and right thigh and chest channels(for movement cases) experience the highest path loss value,while the left thigh channel experiences the lowest. Mostof the on-body channels experience higher path loss valuewhen measurements are made in the chamber, due to thenonreflecting environment. The average path loss of all ninechannels in the chamber, for static and walking cases, is81.44 dB and 80.68 dB, whereas 79.22 dB and 80.00 dB arefound in the indoor environment, respectively.
The variation of the path loss for the nine different on-body channels is also compared for standing and walkingcases, to study the trend of the changes of path loss for eachchannel in these two different scenarios. For the two differentscenarios (i.e., standing and walking) a maximum of 8.23 dBand 6.88 dB variation of average path loss of a channel isnoticed, which occurred for the left wrist channel both inindoor environment and chamber, respectively (Figure 6).During walking scenarios, the tag located on the wrist movesbetween LOS and NLOS communications scenarios, andthe communication distance between the receiver and the
transmitter is also changed greatly, causing the path loss datato vary the most with respect to the standing case for thischannel.
The highest standard deviation (σ) value for the dynamiccase is noticed for the left wrist and right ankle channels,which are considered the least stable (data spread the mostfrom the average path loss) channels, whereas the lowest isnoticed for the left thigh and chest channels; these channelsare considered the most stable (see Figure 7). Movement ofthe human body has the highest effect on the wrist and anklechannels and the least on chest and left thigh channels. Incomparison to the chamber, the standard deviation value isfound to be higher in the indoor environment due to theeffects from the indoor reflecting multipath environment.
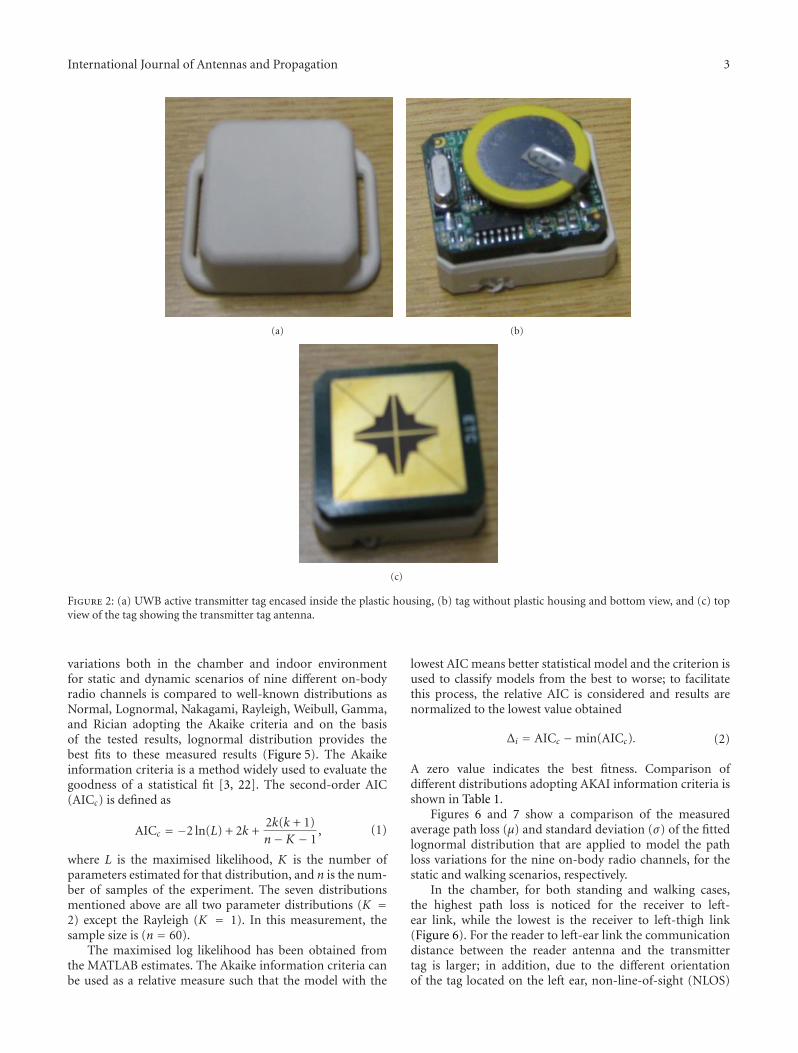
3.2. Path Loss versus Distance. Measurements were alsoperformed in order to investigate the propagation along thefront part of the whole body; see Figure 8. The same testsubject was used for this case as was used for the previouscase. The receiver antenna connected to the reader was placed

6 International Journal of Antennas and Propagation
72 74 76 78 80 82 84 86 880
0.1
0.2
0.3
0.4
0.5
0.6
0.7
0.8
0.9
1
Path loss (dB)
Cu
mu
lati
ve p
roba
bilit
y
Left wrist chamber Lognormal fitLeft wrist sensor lab Lognormal fitLeft ankle chamber Lognormal fitLeft ankle sensor lab Lognormal fit
Figure 5: Cumulative distribution function of the left wrist and leftankle on-body radio channels when subject was walking measuredin the chamber and in indoor environment.
1 2 3 4 5 6 7 8 96062646668707274767880828486889092
Tags position on the body
Path
loss
(dB
)
Standing (chamber) Standing (indoor)
Walking (chamber) Walking (indoor)
L.ear
L.chest
R.chest
L.thigh
R.thigh
L.wristL.ankle
R.ankle
L.elbow
Figure 6: Comparison of average path loss of nine UWB on-bodyradio channels for standing and walking scenarios measured in thechamber and in indoor.
Table 2: Path loss parameters for whole body and different bodyparts.
ChannelsBody parts Chamber Indoor
γ PLdB(d0) σ γ PLdB(d0) σ
All body 2.53 68 6.01 2.24 67 5.11
Trunk 3.48 66 2.07 2.85 65.8 2.12
Arms 3.46 64 4.35 2.84 65.7 2.19
Legs 2.89 58.3 5.46 2.66 59 6.47
on the left waist, while the transmitter tags were placed on34 different locations on the front part of the body (trunk,
1 2 3 4 5 6 7 8 90
1
2
3
4
5
6
Tags position on the body
L.ear
L.elbow
R.ankle
L.ankle
L.wrist
R.thigh
L.chestR.chestL.thigh
Standing (chamber) Standing (indoor)
Walking (chamber) Walking (indoor)
Stan
dard
dev
iati
on (
s)
Figure 7: Comparison of standard deviation (σ) of nine differenton-body radio channels for standing and walking scenarios mea-sured in the chamber and indoor.
arms, legs, and head). In this case, during the measurement,the subject was standing still for 60 seconds, and, the datawere saved for that period of time for each transmitter taglocation.
It is well known that the average received signal decreaseslogarithmically with distance (for both indoor and outdoorenvironments).
The path loss can be modeled as a linear function ofthe logarithmic distance between transmitter and receiver asexplained in [23],
PLdB(d) = PLdB(d0) + 10γ log(d
d0
)+ Xσ , (3)
where d is the distance between transmitter and receiver, d0
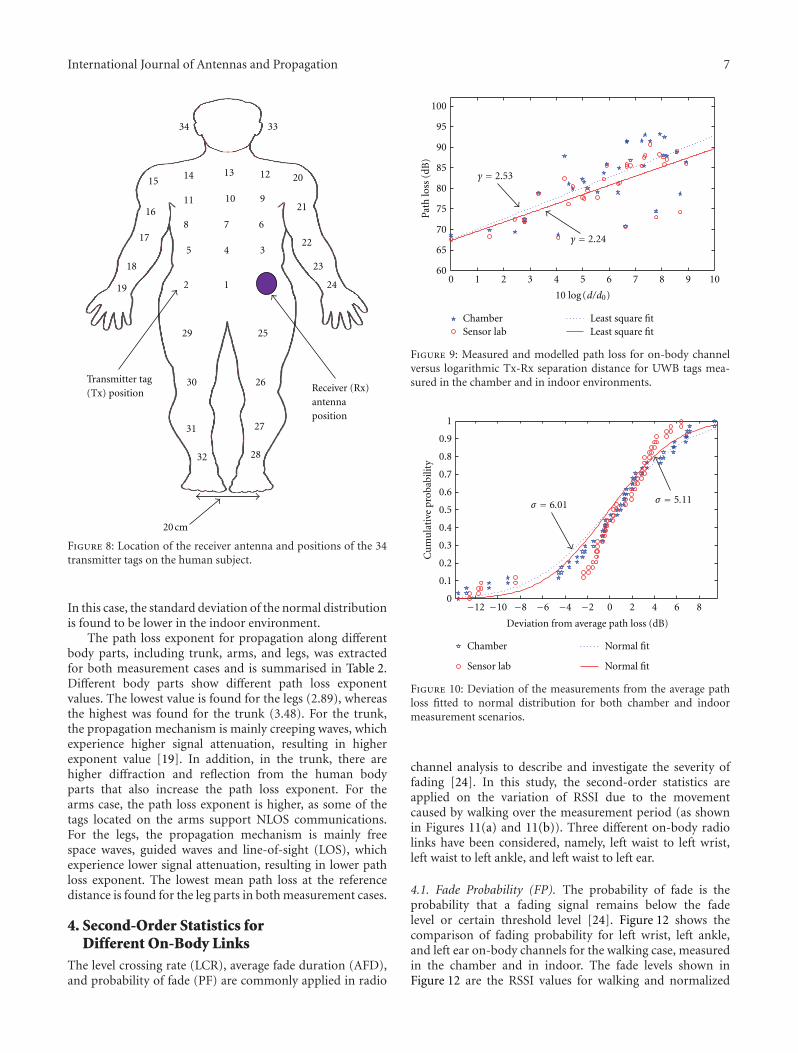
is a reference distance set in measurement (in this study it isset to 10 cm), PLdB(d0) is the path loss value at the referencedistance, and Xσ is the shadowing fading. The parameter γis the path loss exponent that indicates the rate at which thepath loss increases with distance. This parameter γ dependson the structure of environment (chamber or indoor) butalso on the type of trajectory (trunk or legs).
A least-square fit technique was performed on themeasured path loss for the 34 different transmitter locations,(Figure 8) to extract the path loss exponent. Figure 9 showsthe measured value and modelled path loss for on-bodychannels versus logarithmic Tx-Rx separation distance. Thepath loss exponent was found to be 2.52 in the chamber and2.24 in indoor (Table 2). In the indoor environment, the pathloss exponent was found to be lower. When measurementsare performed indoors, the reflections from surroundingsscatters increase the received power, causing reduction in thepath loss exponent. A reduction of 11.46% was noticed inindoor compared to the chamber.
Xσ is a zero mean, normal distributed statistical variable,and is introduced to consider the deviation of the measure-ments from the calculated average path loss. Figure 10 showsthe deviation of measurements from the average path lossfitted to a normal distribution for both measurement cases.
International Journal of Antennas and Propagation 7
9
13
12
345
678
1011
121415
16
17
18
19
20
21
22
23
24
25
26
27
28
29
30
31
32
3334
Receiver (Rx)antennaposition
Transmitter tag(Tx) position
20 cm
Figure 8: Location of the receiver antenna and positions of the 34transmitter tags on the human subject.
In this case, the standard deviation of the normal distributionis found to be lower in the indoor environment.
The path loss exponent for propagation along differentbody parts, including trunk, arms, and legs, was extractedfor both measurement cases and is summarised in Table 2.Different body parts show different path loss exponentvalues. The lowest value is found for the legs (2.89), whereasthe highest was found for the trunk (3.48). For the trunk,the propagation mechanism is mainly creeping waves, whichexperience higher signal attenuation, resulting in higherexponent value [19]. In addition, in the trunk, there arehigher diffraction and reflection from the human bodyparts that also increase the path loss exponent. For thearms case, the path loss exponent is higher, as some of thetags located on the arms support NLOS communications.For the legs, the propagation mechanism is mainly freespace waves, guided waves and line-of-sight (LOS), whichexperience lower signal attenuation, resulting in lower pathloss exponent. The lowest mean path loss at the referencedistance is found for the leg parts in both measurement cases.
4. Second-Order Statistics forDifferent On-Body Links
The level crossing rate (LCR), average fade duration (AFD),and probability of fade (PF) are commonly applied in radio
0 1 2 3 4 5 6 7 8 9 1060
65
70
75
80
85
90
95
100
Path
loss
(dB
)
Chamber Least square fitSensor lab Least square fit
γ = 2.53
γ = 2.24
10 log (d/d0)
Figure 9: Measured and modelled path loss for on-body channelversus logarithmic Tx-Rx separation distance for UWB tags mea-sured in the chamber and in indoor environments.
0
0.1
0.2
0.3
0.4
0.5
0.6
0.7
0.8
0.9
1
Deviation from average path loss (dB)
Cu
mu
lati
ve p
roba
bilit
y
Chamber Normal fit
Sensor lab Normal fit
−12 −10 −8 −6 −4 −2 0 2 4 6 8
σ = 6.01 σ = 5.11
Figure 10: Deviation of the measurements from the average pathloss fitted to normal distribution for both chamber and indoormeasurement scenarios.
channel analysis to describe and investigate the severity offading [24]. In this study, the second-order statistics areapplied on the variation of RSSI due to the movementcaused by walking over the measurement period (as shownin Figures 11(a) and 11(b)). Three different on-body radiolinks have been considered, namely, left waist to left wrist,left waist to left ankle, and left waist to left ear.
4.1. Fade Probability (FP). The probability of fade is theprobability that a fading signal remains below the fadelevel or certain threshold level [24]. Figure 12 shows thecomparison of fading probability for left wrist, left ankle,and left ear on-body channels for the walking case, measuredin the chamber and in indoor. The fade levels shown inFigure 12 are the RSSI values for walking and normalized

8 International Journal of Antennas and Propagation
0 10 20 30 40 50 60
Time (s)
RSS
I (d
Bm
)
Left wristLeft ankleLeft ear
−110
−105
−100
−95
−90
−85
−80
(a) Chamber
0 10 20 30 40 50 60
Time (s)
RSS
I (d
Bm
)
Left wristLeft ankleLeft ear
−110
−105
−100
−95
−90
−85
−80
(b) Indoor
Figure 11: Comparison of RSSI level for three different on-body channels as left wrist, left ankle, and left ear when human subject waswalking 5 steps ahead and 5 steps backward measured in the (a) chamber, (b) indoor.
1 3 5 7 9 100
0.1
0.2
0.3
0.4
0.5
0.6
0.7
0.8
0.9
1
Fade level (dB)
Pro
babi
lity
Left wrist chamber Left wrist sensor labLeft ankle chamber Left ankle sensor labLeft ear chamber Left ear sensor lab
−15 −13 −11 −9 −7 −5 −3 −1
Figure 12: Comparison of fading probability (FP) for threedifferent on-body channels as left wrist, left ankle, and left earwhen subject was walking 5 steps ahead and back measured in thechamber and in indoor environment.
by the corresponding medians, and for the total fade levelthe increment of 0.01 dB is considered. The maximum fadelevel is noticed for the wrist and ankle channels, whereas thelowest is at the ear link. Comparing the two environments,the fade level is higher indoors for the left ear and anklechannels but lower for the wrist channel, which can be theeffects of the multipath scattering environment in indoor.The fading probability at −3 dB fade level is found to behigher for all three different on-body links in indoor. At−3 dB fade depth, the fade probability of these three channelsis between 7% and 27% in the chamber, while in indoor, it
1 3 5 7 9 100
0.05
0.1
0.15
0.2
0.25
0.3
0.35
Fade level (dB)
Left wrist chamber Left wrist sensor labLeft ankle chamber Left ankle sensor labLeft ear chamber Left ear sensor lab
−15 −13 −11 −9 −7 −5 −3 −1
LCR
(s−
1)
Figure 13: Comparison of level crossing rate (LCR) for three on-body channels as left wrist, left ankle, and left ear when subject waswalking 5 steps ahead and back measured in the chamber and inindoor environment.
is between 12% and 33%. Out of these three channels, thefade probability at −3 dB is noticed higher for the left wristchannel, with a value of 33% measured in indoor, while thelowest is for the left ear channel, with a value of 7% measuredin the chamber. Changing measurement environment doesnot change the fade probability for left ear link at −3 dBfade depth but which has higher effects for ankle and wristchannels.
4.2. Level Crossing Rate (LCR). The level crossing rate (LCR)for a signal is the number of crossings of the signal withrespect to a given threshold or specified fade level in the

International Journal of Antennas and Propagation 9
1 3 5 7 9 10
Fade level (dB)
Left wrist chamber Left wrist sensor labLeft ankle chamber Left ankle sensor labLeft ear chamber Left ear sensor lab
−15 −13 −11 −9 −7 −5 −3 −1
AFD
(S)
100
101
102
Figure 14: Comparison of average fade duration for three on-bodychannels as left wrist, left ankle, and left ear when subject waswalking measured in the chamber and indoor environment.
positive going direction in a unit of time [24]. Figure 13shows a comparison of the level crossing rate for the threeconsidered links when the subject was walking. At a specifiedfade depth of −3 dB for the walking case, the LCR forthese three on-body channels is mostly found to be higherin indoor. At −3 dB fade depth, the LCR in the chamberfor these three channels is in the range of 0.05 s−1–0.25s−1 while it is 0.07 s−1–28 s−1 in the indoor environments.Both in the chamber and indoor environments, the highestLCR value at −3 dB fade depth is noticed for wrist channelwhereas the lowest is for ear channel. The LCR for the anklelink varies greatly in between the chamber and the indoorenvironments.
4.3. Average Fade Duration (AFD). The average fade dura-tion is the average duration of time during which the fadingsignal remains below the specified fade level [24]. Figure 14shows comparison of average fade duration for three dif-ferent on-body channels, that is, as wrist, ankle, and earmeasured in the chamber and in indoor for walking humansubject. The AFDs characteristically increase with decreasingof fade depth.
For walking case, the left ankle channel has the highestAFD with the value of 1.9 seconds at the fade depth of −3 dBin the chamber. At−3 dB fade depth, the AFD is higher in theindoor environment for wrist and ear channels, while lowerfor the ankle. The AFD for all three channels is in the rangeof 1.1–1.9 seconds.
5. Conclusion
UWB on-body radio propagation channel measurementswere performed using ultrawideband (UWB) wireless tagsand reader in the chamber and indoor environments. Ninedifferent UWB on-body radio channels were investigated for
static and movement scenarios. Results demonstrated thatlognormal distribution provides the best fits for on-bodypropagation channels path loss model. In this study, leftthigh link shows the lowest path loss, whereas the left earand right chest show the highest. The study shows that dueto different scenarios (i.e., standing and walking) an on-body link experiences up to 8.23 dB variations in path loss.Path loss exponent for individual body parts is extracted,where the lowest path loss exponent and the path loss at thereference distance are noticed for the legs part. Second-orderchannel parameters as (LCR), (FP), and (AFD) for three on-body links are investigated. Results and analysis showed thatat a specified fade depth of −3 dB, the fade probability, levelcrossing rate, and average fade duration are found mostlyhigher in the indoor as compared to chamber.
Acknowledgments
The authors would like to thank John Dupuy and SanjoyMazumdar for their help and assistance with the mea-surements. Many thanks to Yuri Nechayev (University ofBirmingham) for his fruitful discussions.
References
[1] P. S. Hall and Y. Hao, Antennas and Propagation For Body-Centric Wireless Communications, Artech House, Norwood,Mass, USA, 2006.
[2] J. Foerester, E. Green, S. Somayazulu, and D. Leeper, “Ultra-wideband for short- or medium-range wireless communica-tions,” Intel Technology Journal, vol. Q2, 2001.
[3] A. Fort, C. Desset, P. de Doncker, P. Wambacq, and L. vanBiesen, “An ultra-wideband body area propagation channelmodel—from statistics to implementation,” IEEE Transactionson Microwave Theory and Techniques, vol. 54, no. 4, pp. 1820–1826, 2006.
[4] Z. H. Hu, Y. I. Nechayev, P. S. Hall, C. C. Constantinou, andY. Hao, “Measurements and statistical analysis of on-bodychannel fading at 2.45 GHz,” IEEE Antennas and WirelessPropagation Letters, vol. 6, pp. 612–615, 2007.
[5] A. Alomainy, Y. Hao, A. Owadally et al., “Statistical analysisand performance evaluation for on-body radio propagationwith microstrip patch antennas,” IEEE Transactions on Anten-nas and Propagation, vol. 55, no. 1, pp. 245–248, 2007.
[6] S. L. Cotton, G. A. Conway, and W. G. Scanlon, “A time-domain approach to the analysis and modeling of on-bodypropagation characteristics using synchronized measurementsat 2.45 GHz,” IEEE Transactions on Antennas and Propagation,vol. 57, no. 4, pp. 943–955, 2009.
[7] Y. I. Nechayev, Z. H. Hu, and P. S. Hall, “Short-term and long-term fading of on-body transmission channels at 2.45 GHz,”in Proceedings of the Loughborough Antennas and PropagationConference (LAPC’09), pp. 657–660, Loughborough, UK,November 2009.
[8] A. Fort, C. Desset, J. Ryckaert, P. de Doncker, L. van Biesen,and P. Wambacq, “Characterization of the ultra widebandbody area propagation channel,” in Proceedings of the IEEEInternational Conference on Ultra-Wideband (ICU’05), pp. 22–27, September 2005.
[9] A. Alomainy, Y. Hao, X. Hu, C. G. Parini, and P. S. Hall, “UWBon-body radio propagation and system modelling for wireless

10 International Journal of Antennas and Propagation
body-centric networks,” IEE Proceedings: Communications,vol. 153, no. 1, pp. 107–114, 2006.
[10] Q. H. Abbasi, A. Sani, A. Alomainy, and Y. Hao, “On-bodyradio channel characterization and system-level modeling formultiband OFDM ultra-wideband body-centric wireless net-work,” IEEE Transactions on Microwave Theory and Techniques,vol. 58, no. 12, pp. 3485–3492, 2010.
[11] Q. Wang and J. Wang, “Performance of on-body chest-to-waist UWB communication link,” IEEE Microwave and Wire-less Components Letters, vol. 19, no. 2, pp. 119–121, 2009.
[12] Q. Wang, T. Tayamachi, I. Kimura, and J. Wang, “An on-bodychannel model for UWB body area communications for vari-ous postures,” IEEE Transactions on Antennas and Propagation,vol. 57, no. 4, pp. 991–998, 2009.
[13] A. Sani and Y. Hao, “Modeling of path loss for ultrawideband body-centric wireless communications,” in Proceedingsof the International Conference on Electromagnetics in AdvancedApplications (ICEAA’09), pp. 998–1001, Turin, Italy, Septem-ber 2009.
[14] T. Zasowski, F. Althaus, M. Stager A, Wittneben, and G.Troster, “UWB for noninvasive wireless body area networks:channel measurements and results,” in Proceedings of the IEEEConference on Ultra Wideband Systems and Technologies, pp.285–289, November 2003.
[15] A. Alomainy, Y. Hao, C. G. Parini, and P. S. Hall, “Comparisonbetween two different antennas for UWB on-body propaga-tion measurements,” IEEE Antennas and Wireless PropagationLetters, vol. 4, no. 1, pp. 31–34, 2005.
[16] Q. H. Abbasi, A. Sani, A. Alomainy, and Y. Hao, “Arm move-ments effect on ultra wideband on-body propagation channelsand radio systems,” in Proceedings of the LoughboroughAntennas and Propagation Conference (LAPC’09), pp. 261–264,Loughborough, UK, November 2009.
[17] A. Alomainy, Q. H. Abbasi, A. Sani, and Y. Hao, “System-levelmodelling of optimal ultra wideband body-centric wirelessnetwork,” in Proceedings of the Asia Pacific Microwave Confer-ence 2009 (APMC’09), pp. 2188–2191, Singapore, December2009.
[18] A. Sani, G. Palikaras, A. Alomainy, and Y. Hao, “Time domainUWB radio channel characterisation for body-centric wirelesscommunications in indoor environment,” in Proceedings ofthe IET Seminar on Wideband and Ultrawideband Systems andTechnologies: Evaluating Current Research and Development,no. 12352, November 2008.
[19] A. Sani, A. Alomainy, and Y. Hao, “Effect of the indoor envi-ronment on the UWB on-body radio propagation channel,”in Proceedings of the 3rd European Conference on Antennas andPropagation (EuCAP’09), pp. 455–458, March 2009.
[20] A. Alomainy, A. Sani, A. Rahman, J. G. Santas, and Y. Hao,“Transient characteristics of wearable antennas and radiopropagation channels for ultrawideband body-centric wirelesscommunications,” IEEE Transactions on Antennas and Propa-gation, vol. 57, no. 4, pp. 875–884, 2009.
[21] Plus Asset Tag, Reader and SFF Antenna Datasheet/TimeDomain, 2009, http://www.timedomain.com/.
[22] K. P. Burnham and D. R. Anderson, Model Selection and Mul-timodel Inference: A Practical Information-Theoretic Approach,Springer, New York, NY, USA, 2002.
[23] S. S. Gassemzadeh, R. Jana, C. W. Rice, W. Turin, and V.Tarohk, “A statistical path loss model for in-home UWBchannels,” in IEEE Conference on Ultra Wideband Systems andTechnologies, pp. 59–64, 2002.
[24] W. C. Y. Lee, Mobile Communications Engineering, Mc-Graw-Hill, New York, NY, USA, 1998.

International Journal of
AerospaceEngineeringHindawi Publishing Corporationhttp://www.hindawi.com Volume 2010
RoboticsJournal of
Hindawi Publishing Corporationhttp://www.hindawi.com Volume 2014
Hindawi Publishing Corporationhttp://www.hindawi.com Volume 2014
Active and Passive Electronic Components
Control Scienceand Engineering
Journal of
Hindawi Publishing Corporationhttp://www.hindawi.com Volume 2014
International Journal of
RotatingMachinery
Hindawi Publishing Corporationhttp://www.hindawi.com Volume 2014
Hindawi Publishing Corporation http://www.hindawi.com
Journal ofEngineeringVolume 2014
Submit your manuscripts athttp://www.hindawi.com
VLSI Design
Hindawi Publishing Corporationhttp://www.hindawi.com Volume 2014
Hindawi Publishing Corporationhttp://www.hindawi.com Volume 2014
Shock and Vibration
Hindawi Publishing Corporationhttp://www.hindawi.com Volume 2014
Civil EngineeringAdvances in
Acoustics and VibrationAdvances in
Hindawi Publishing Corporationhttp://www.hindawi.com Volume 2014
Hindawi Publishing Corporationhttp://www.hindawi.com Volume 2014
Electrical and Computer Engineering
Journal of
Advances inOptoElectronics
Hindawi Publishing Corporation http://www.hindawi.com
Volume 2014
The Scientific World JournalHindawi Publishing Corporation http://www.hindawi.com Volume 2014
SensorsJournal of
Hindawi Publishing Corporationhttp://www.hindawi.com Volume 2014
Modelling & Simulation in EngineeringHindawi Publishing Corporation http://www.hindawi.com Volume 2014
Hindawi Publishing Corporationhttp://www.hindawi.com Volume 2014
Chemical EngineeringInternational Journal of Antennas and
Propagation
International Journal of
Hindawi Publishing Corporationhttp://www.hindawi.com Volume 2014
Hindawi Publishing Corporationhttp://www.hindawi.com Volume 2014
Navigation and Observation
International Journal of
Hindawi Publishing Corporationhttp://www.hindawi.com Volume 2014
DistributedSensor Networks
International Journal of