performance tuning and troubleshooting in container platforms€¦ · manoj pillai, red hat...
TRANSCRIPT

Background● Red Hat Performance and Scale Engineering: Gluster
Solutions○ Driving performance improvements
■ e.g. FOSDEM 2018 performance track talk on optimizing gluster for flash
○ Configuration Recommendations○ Troubleshooting user performance cases
● Evolution from stand-alone to solutions○ Need to adapt expertise in gluster stand-alone
troubleshooting to, e.g., troubleshooting performance of persistent storage in Openshift Container Platform

Gluster Overview
● Scale-out distributed storage system● Aggregates storage across servers to provide a
unified namespace● Modular and extensible architecture● Layered on disk file systems that support extended
attributes● Client-server model

Gluster Architecture
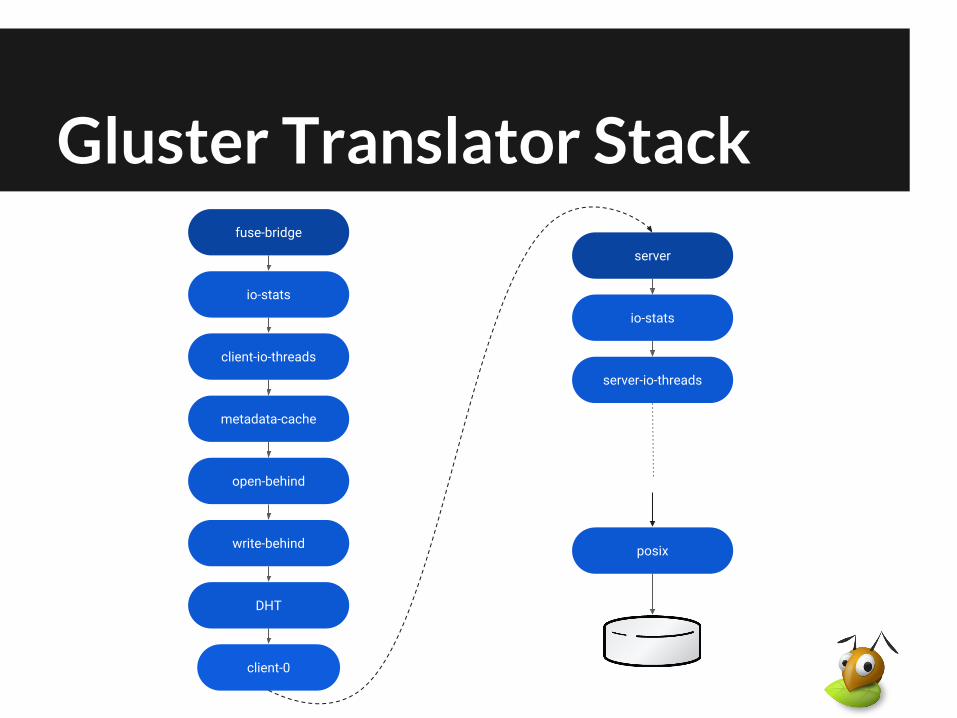
fuse-bridge
client-io-threads
io-stats
client-0
open-behind
write-behind
DHT
metadata-cache
server
server-io-threads
io-stats
posix
Gluster Translator Stack

Gluster: Persistent Storage for Containers
● Integration with Openshift Container Platform, based on k8s and docker○ Known in this incarnation as Openshift Container
Storage, OCS, RHOCS● Storageclasses for file and block storage

OCS Architecture
● Persistent Storage for Openshift Container Platform

OCS Pods
● Container images for OCS pods based on Red Hat Gluster Storage
● Specify Openshift nodes with storage:
[glusterfs]c04-h05-6048r glusterfs_devices='[ "/dev/nvme0n1" ]'c04-h09-6048r glusterfs_devices='[ "/dev/nvme0n1" ]'c04-h13-6048r glusterfs_devices='[ "/dev/nvme0n1" ]'

Gluster Performance Troubleshooting
● Common Problems○ CPU utilization of threads/thread pools (client
and server-side)○ Network saturation (client and server-side)○ Device (brick) saturation (server-side)
● Less commonly observed○ Overall CPU saturation, swap, page reclamation,
dirty data buildup etc. (client and server-side)

Gluster Client Troubleshooting● Client-side threads/thread-pools CPU saturated
○ Fuse-reader thread○ Client epoll threads
● Seen in output of top command (by thread, top -bH)
PID USER PR NI VIRT RES SHR S %CPU %MEM TIME+ COMMAND
25276 root 20 0 611728 27228 3828 R 99.4 0.1 3:08.66 glusterfs
25272 root 20 0 611728 27228 3828 R 43.1 0.1 1:30.54 glusterfs
25273 root 20 0 611728 27228 3828 S 42.8 0.1 1:30.20 glusterfs
25551 root 20 0 544576 258916 258196 S 32.5 0.5 0:10.65 fio
25602 root 20 0 545408 2032 516 S 9.6 0.0 0:02.52 fio
25603 root 20 0 545412 2036 520 S 9.2 0.0 0:02.54 fio

Gluster Client Troubleshooting● Network saturation
○ Seen in output of: sar -n DEV ○ Gluster-native protocol implements most
functionality in client-side “translators”■ Replica-3 implies application writes x3
05:25:27 AM IFACE rxpck/s txpck/s rxkB/s txkB/s rxcmp/s txcmp/s rxmcst/s05:25:37 AM lo 4.00 4.00 0.41 0.41 0.00 0.00 0.0005:25:37 AM em3 0.00 0.00 0.00 0.00 0.00 0.00 0.0005:25:37 AM em1 1.60 0.00 0.10 0.00 0.00 0.00 0.0005:25:37 AM em4 0.00 0.00 0.00 0.00 0.00 0.00 0.0005:25:37 AM em2 0.00 0.00 0.00 0.00 0.00 0.00 0.0005:25:37 AM p1p1 27935.10 141800.00 4712.82 1217299.38 0.00 0.00 0.0005:25:37 AM p1p2 0.00 0.00 0.00 0.00 0.00 0.00 0.00

Gluster Server Troubleshooting● Server-side thread pools for epoll, similar to client-side● Network saturation, similar to client-side● In addition, block device saturation (particularly with
HDDs)○ Seen in output of sar or iostat command
Device: rrqm/s wrqm/s r/s w/s rkB/s wkB/s avgrq-sz avgqu-sz
nvme0n1 0.00 0.10 0.00 25750.50 0.00 206051.65 16.00 0.39
await r_await w_await svctm %util
0.02 0.00 0.02 0.01 33.46
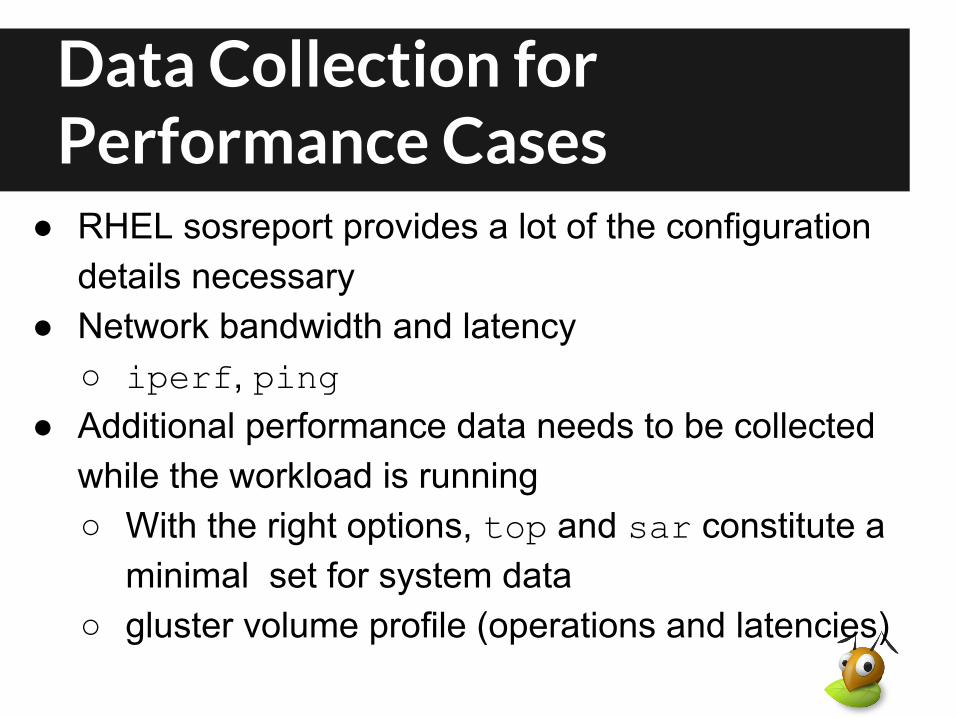
Data Collection for Performance Cases
● RHEL sosreport provides a lot of the configuration details necessary
● Network bandwidth and latency○ iperf, ping
● Additional performance data needs to be collected while the workload is running○ With the right options, top and sar constitute a
minimal set for system data○ gluster volume profile (operations and latencies)

Troubleshooting in Container Environments
● Many of the concerns with gluster stand-alone are valid with container storage as well○ Thread/thread-pool CPU saturation○ Block device saturation○ Network saturation
● Relevant system data can be obtained by monitoring nodes where the application and gluster pods are running.

fio Test Observations
● Test:○ fio running within Openshift pod with PV from
gluster storage○ Sequential write and Random write test:
■ fio --name=writetest --ioengine=sync --rw=write --direct=0 --create_on_open=1
--end_fsync=1 --bs=128k --directory=/mnt/glusterfs --filename_format=f.\$jobnum.\$filenum --filesize=8g --size=8g --numjobs=4
■ fio --name=randomwrite --ioengine=libaio --iodepth=8 --rw=randwrite
--direct=1 --end_fsync=1 --bs=4k --directory=/mnt/glusterfs --filename_format=f.\$jobnum.\$filenum --filesize=8g --size=8g --time_based=1 --runtime=120 --numjobs=4

fio Test Observations● Monitoring on openshift node where fio pod is running
shows gluster fuse thread bottlenecked during random
write PID USER PR NI VIRT RES SHR S %CPU %MEM TIME+ COMMAND
22866 root 20 0 614160 25164 4028 R 97.9 0.0 4:22.34 glusterfuseproc
22863 root 20 0 614160 25164 4028 R 57.0 0.0 3:45.74 glusterepoll1
22862 root 20 0 614160 25164 4028 R 56.9 0.0 3:45.59 glusterepoll0
21087 root 20 0 510788 1264 408 S 2.7 0.0 0:00.64 fio
21090 root 20 0 510800 1268 412 S 2.6 0.0 0:00.63 fio
21088 root 20 0 510792 1256 400 S 2.5 0.0 0:00.59 fio
21089 root 20 0 510796 1288 432 S 2.5 0.0 0:00.65 fio
101 root 20 0 0 0 0 S 1.1 0.0 0:01.04 ksoftirqd/18
17281 root 20 0 3681076 112840 39756 S 0.6 0.2 13:04.90 hyperkube

fio Test Observations● Monitoring on openshift node where OCS pod is running
shows no thread bottleneck on this test
PID USER PR NI VIRT RES SHR S %CPU %MEM TIME+ COMMAND
50537 root 20 0 8126624 131588 4420 S 10.3 0.0 1:28.59 glusterepoll5
57167 root 20 0 8126624 131588 4420 R 9.9 0.0 1:26.05 glusterepoll0
53149 root 20 0 8126624 131588 4420 S 9.7 0.0 0:54.17 glusterepoll6
39575 root 20 0 8126624 131588 4420 S 7.2 0.0 1:24.48 glusterepoll4
53635 root 20 0 8126624 131588 4420 S 6.0 0.0 0:04.24 glusteriotwr4

fio Test Observations● Monitoring on openshift node where OCS pod is running
shows no device saturation on this test
06:31:43 AM DEV tps rd_sec/s wr_sec/s avgrq-sz avgqu-sz await svctm %util
06:31:53 AM nvme1n1 0.00 0.00 0.00 0.00 0.00 0.00 0.00 0.00
06:31:53 AM nvme0n1 7653.90 0.00 61305.60 8.01 0.09 0.01 0.01 9.05
06:31:53 AM sda 5.50 0.00 132.60 24.11 0.04 6.85 4.87 2.68
06:31:53 AM sdb 5.50 0.00 132.60 24.11 0.04 7.15 5.16 2.84

Gluster Profile Information
● gluster volume profile command provides per-brick IO statistics for each file operation during an interval○ Stats include number of calls, min, max and average
latency per fop, etc○ Very useful in performance troubleshooting
● gluster volume profile can be got from OCS pod. Can require some correlating between application pod and OCS pod volume list.

Additional Recommendations
● Separate network possible for gluster traffic during OCS setup○ 10GbE or higher recommended

Future Work● Gluster: reduce need for tuning
○ Reduce lock contention; set higher defaults for thread pool sizes
○ Auto-scaling of thread pools● Expertise in dealing with the more complex problems
related to overcommit of resources in Container environments.

Acknowledgements● Special thanks to:
○ Neha Berry (OCS QE): OCS/OCP installation troubleshooting
○ Shekhar Berry (Perf Engg.): OCS fio test setup○ Elvir Kuric (Perf. Engg.)

Thanks!!