performance track could improve program design and management … · · 2015-11-20office of...
TRANSCRIPT

OFFICE OF INSPECTOR GENERAL
Catalyst for Improving the Environment
Evaluation Report
Performance Track Could Improve Program Design and Management to Ensure Value
Report No. 2007-P-00013
March 29, 2007

Report Contributors: Jerri Dorsey Gabrielle Fekete Elizabeth Grossman Jeffrey Harris
Kathlene Butler Martini
Abbreviations
APG Annual Performance Goal APR Annual Performance Report CAA Clean Air Act CR Compliance Ratio CWA Clean Water Act ECHO Enforcement and Compliance History Online EMS Environmental Management System EPA U.S. Environmental Protection Agency FTE Full Time Equivalent GPRA Government Performance and Results Act MACT Maximum Achievable Control Technology MMBTU Million Metric British Thermal Units NAICS North American Industrial Classification System NOV Notice of Violation OECA Office of Enforcement and Compliance Assurance OIG Office of the Inspector General OMB Office of Management and Budget OPEI Office of Policy, Economics, and Innovation OTIS Online Tracking Information System PART Program Assessment Rating Tool RCRA Resource Conservation and Recovery Act SNC Significant Noncompliance SV Significant Violation TRI Toxics Release Inventory VOC Volatile Organic Compound

U.S. Environmental Protection Agency 2007-P-00013
Office of Inspector General March 29, 2007
At a GlanceCatalyst for Improving the Environment
Why We Did This Review
We initiated this review to evaluate how the U.S. Environmental Protection Agency’s (EPA’s) National Environmental Performance Track program (Performance Track) achieves EPA goals. We specifically sought to determine how Performance Track contributes to achieving environmental goals, how well it recognizes and encourages environmental leadership, and how the program tracks member performance.
Background
Performance Track is a public-private partnership that encourages member facilities to improve the environment through using environmental management systems, local public outreach, and public reporting for results. EPA designed Performance Track to recognize and encourage facilities that demonstrate strong environmental performance beyond current requirements.
For further information, contact our Office of Congressional and Public Liaison at (202) 566-2391.
To view the full report, click on the following link: www.epa.gov/oig/reports/2007/ 20070329-2007-P-00013.pdf
Performance Track Could Improve Program Design and Management to Ensure Value What We Found
We found that Performance Track did not have clear plans that connected activities with its goals, and did not have performance measures that show if it achieves anticipated results. The program tied an EPA goal to member commitments, and did not meet the goal because members did not make sufficient progress toward their commitments. These implementation challenges detracted from EPA’s anticipated results (only 2 of 30 sampled Performance Track members met all of their environmental improvement commitments). In addition, members did not have access to some program benefits.
In assessing members’ leadership using independent criteria, we found that most Performance Track members’ compliance and toxic release records were better than average, but some were not. Although most members showed leadership and environmental progress, the presence of underperforming facilities in this leadership program reduces the integrity and value of the brand.
What We Recommend
We recommend that EPA design a comprehensive strategic plan to connect activities with goals and to encourage staff and management to focus on program goals and member commitments. We recommend that the program measure and report on performance related to activities and goals. EPA should also maintain centralized databases for compliance screening and program member information so that it can readily demonstrate that members meet program criteria. We recommend that EPA encourage member facilities to set and achieve commitments so that the public has a clear idea of what results members will actually produce. We also recommend that EPA include assessing member leadership in compliance and toxic releases in the program criteria. EPA can use these data to track members’ progress, define top performance, and establish and modify criteria and performance measures.
In its response, EPA disagreed with how the program should be evaluated and the extent to which it has succeeded, to date. However, EPA agreed with all of our recommendations for improvement. They also suggested technical corrections. We made changes as appropriate. Appendix A provides EPA’s response to the draft report and our comments.

UNITED STATES ENVIRONMENTAL PROTECTION AGENCY WASHINGTON, D.C. 20460
OFFICE OF INSPECTOR GENERAL
March 29, 2007
MEMORANDUM
SUBJECT: Performance Track Could Improve Program Design and Management to Ensure Value Report No. 2007-P-00013
FROM: Wade T. Najjum Assistant Inspector General for Program Evaluation
TO: Brian Mannix Associate Administrator, Office of Policy, Economics, and Innovation
This is our report on the subject evaluation conducted by the Office of Inspector General (OIG) of the U.S. Environmental Protection Agency (EPA). This report contains findings that describe the problems the OIG has identified and corrective actions the OIG recommends. This report represents the opinion of the OIG and does not necessarily represent the final EPA position. Final determinations on matters in this report will be made by EPA managers in accordance with established resolution procedures.
The estimated cost of this report – calculated by multiplying the project’s staff days by the applicable daily full cost billing rates in effect at the time – is $228,571.
Action Required
In accordance with EPA Manual 2750, you are required to provide a written response to this report within 90 calendar days. You should include a corrective action plan for agreed-upon actions, including milestone dates. We have no objections to the further release of this report to the public. This report will be available at http://www.epa.gov/oig .
If you or your staff has any questions, please contact me at (202) 566-0832 or [email protected]; or Jeffrey Harris, Product Line Director, at (202) 566-0831 or [email protected].

Performance Track Could Improve Program Design and Management to Ensure Value
Table of Contents Chapters
1 Introduction ........................................................................................................... 1
Purpose .......................................................................................................... 1 Background .................................................................................................... 1 Scope and Methodology................................................................................. 2 Prior Reviews ................................................................................................. 3
2 Performance Track Created to Recognize Top Environmental Performers .... 4
Performance Track Design............................................................................. 4 Performance Track Implementation .............................................................. 6 Performance Track Membership .................................................................... 7 Program Performance Measurement and Reporting...................................... 9 Summary ........................................................................................................ 10
3 Performance Track Design Not Clearly Linked to Intended Outcomes ........... 11
Program Does Not Clearly Link Mission, Vision, Goals and Measures ......... 11 Conclusion...................................................................................................... 13
Recommendations ......................................................................................... 14 Agency Response and OIG Evaluation.......................................................... 14
4 Performance Track Does Not Generally Fulfill its Value Proposition .............. 15
Not All Members Met Criteria or Achieved Environmental Results ................ 15 Program Has Achieved Less Than Half of GPRA Targets ............................. 19 Members Lack Access to Some Incentives.................................................... 21 Conclusion...................................................................................................... 21
Recommendations ......................................................................................... 22 Agency Response and OIG Evaluation.......................................................... 22
5 Some Members Exceed Sector Average for Noncompliance and Toxic Releases .............................................................................................. 23
Program Equates Membership with Leadership............................................. 23 Most Members Are Top Performers ............................................................... 24 Some Facilities Had More Compliance Problems than Their Peers............... 24 Some Facilities Released More Toxic Chemicals than Their Peers............... 25 Summary ........................................................................................................ 25 Conclusions.................................................................................................... 26
Recommendations ......................................................................................... 27 Agency Response and OIG Evaluation.......................................................... 27
Status of Recommendations and Potential Monetary Benefits................................. 28

Performance Track Could Improve Program Design and Management to Ensure Value
Appendices A Agency Response and OIG Evaluation ............................................................... 29
B Detailed Scope and Methodology........................................................................ 39
C Performance Track Criteria .................................................................................. 44
D Incentives and Rewards to Participation ............................................................ 45
E Performance Track Commitments....................................................................... 46
F Detailed Program Logic Model............................................................................. 48
G Data Analysis Results: Charts ............................................................................. 49
Figure G.1: Commitment achievement for Performance Track (PT) facilities ......... 49 Figure G.2: Commitments achieved at cycle completion for PT facilities................ 49 Figure G.3: Change in materials use for PT facilities ............................................. 50 Figure G.4: Comparative compliance for sample facilities that did not
outperform their sectors ...................................................................... 50
H Distribution ............................................................................................................ 51

Chapter 1Introduction
Purpose
As part of a U.S. Environmental Protection Agency (EPA) Office of Inspector General (OIG) evaluation agenda to assess a new approach to environmental protection, we initiated this review to evaluate how effectively Performance Track achieves its environmental goals. Specifically, we sought to determine:
1. How does Performance Track contribute to achieving EPA’s goal: Improve environmental performance through pollution prevention and innovation?
2. How well does Performance Track accomplish its program goal: To recognize and encourage top environmental performers, and track program performance?
Background
Over the last few years, the EPA has worked to develop new types of environmental solutions. EPA initiated Performance Track in 2000 as part of a “reinvention” effort in the Agency designed to develop new methods for achieving environmental and public health protection goals. Performance Track recognizes top environmental performance among participating U.S. facilities, both public and private.
EPA’s assumption for reinvention programs was that environmental protection initiatives that promoted both stewardship and compliance with environmental requirements would have the greatest potential for solving environmental problems. In a 1999 document outlining the concept of a performance track, EPA explained this concept:
It’s helpful to think of…a bell curve along a performance spectrum. At one end, we have companies acting as environmental leaders, adding business value and gaining competitive advantages along the way; they are setting standards of excellence that will define future business practices for themselves and their peers. In the middle, we have the “main streamers”—businesses, industries, and other regulated parties that typically meet requirements, but
1

do little else. And then there are those that have been left behind, who do not meet the most basic environmental standards.1
In this document, EPA described a performance track as a method for rewarding those facilities that were environmental leaders, or “top performers.” EPA assumed that bench-marking leaders’ practices would guide others to make improvements. That is, EPA expected that a program that identified, encouraged, and rewarded top performers would have a ripple effect as nonmembers emulated members, fostering overall benefits that exceed member achievements. Moreover, the Agency anticipated that recognizing facilities as leaders would encourage them to perform beyond compliance, continuously improving their environmental results. EPA anticipated that rewarding continuous improvement could improve the relationship between EPA and the regulated community leading to innovation, changes in EPA’s methods for protecting the environment, and results.
EPA highlights Performance Track as a model for partnership programs, referring to it as the “gold standard” among its partnership programs. For example, in its 2006 National Program Guidance, EPA describes Performance Track as its “flagship innovation program for recognizing and rewarding top-performing facilities that consistently exceed regulatory requirements, address unregulated environmental issues, and produce measurable environmental results.”
Scope and Methodology
This review assesses the performance of the Performance Track program on the basis of two fundamental program goals where data are available and results have been reported. The first comes from EPA’s Fiscal Year 2005 Strategic Plan: Improve environmental performance through pollution prevention and innovation. 2 The second, from the July 2000 Federal Register notice starting the program, defined the objective of Performance Track as, To recognize and encourage top environmental performers, those who go beyond compliance with regulatory requirements to attain levels of environmental performance and management that benefit people, communities, and the environment.3 This review does not attempt to evaluate the validity of EPA’s concept described above in part because the Agency has yet to report on many of the anticipated benefits of the concept behind Performance Track. For example the Agency does not report on the ripple effect on nonmembers, any change in relationships between the Agency and the regulated community, or innovation stemming from continuous improvement.
1 U. S. Environmental Protection Agency, Office of the Administrator, Aiming for Excellence, EPA100-R-99-006, 1999, p.5. 2 U. S. Environmental Protection Agency, Fiscal Year 2005 Environmental and Financial Progress Report, 2005, EPA190-R-05-001. Strategic Objective 5.2, Annual Performance Goal 5.4, p. 156. 3 Program Description of National Environmental Achievement Track, Federal Register: July 6, 2000 (Volume 65,Number 30), pp. 41655-41663.
2

To determine how Performance Track contributed to EPA’s goals, we reviewed Performance Track background, program management documents, and applicable EPA budget and performance documents. We reviewed applicable Performance Track policies, procedures, and practices, and discussed them with program management. We developed a program logic model with input from Performance Track representatives. We also analyzed EPA’s 2001-2005 reports on program members’ progress. We supplemented our analysis by meeting with Headquarters and regional EPA personnel, and external stakeholders, including program members, nonmembers, and former members. We examined management controls as they related to our objectives.
We analyzed a randomly selected sample of 40 member facilities to determine if they met their Performance Track commitments, and how much progress they made. In order to demonstrate if these facilities represented “top performers,” we compared the sample facilities’ compliance records and toxic releases with those of their sectors. We compiled compliance information from EPA databases and verified individual facility data for sample members with regional EPA enforcement and compliance data stewards.
We performed our evaluation in accordance with Government Auditing Standards, issued by the Comptroller General of the United States. We performed our field work from August 2006 through November 2006.
Appendix B includes additional details about our scope and methodology.
Prior Reviews
Performance Track has not been evaluated by EPA OIG or the Government Accountability Office. Nor has Performance Track received an Office of Management and Budget Program Assessment Rating Tool review. In 2006, Harvard University completed an EPA-funded assessment of Performance Track membership, cited herein as Coglianese and Nash. The study answered the question: why do businesses join Performance Track?4 They found that members have a distinct tendency to value external recognition, and that EPA accepted members with better environmental records than applicants that they rejected. However, Coglianese and Nash also determined that the prospect of Performance Track membership did not necessarily motivate facilities to improve their environmental performance, nor did the study find that the members’ environmental performance exceeded comparable facilities that did not apply for membership.
4 Coglianese, Cary and Jennifer Nash. Beyond Compliance: Business Decision Making and the U.S. EPA’s Performance Track Program. Regulatory Policy Program Report RPP-10, 2006. Cambridge, MA: Mossavar-Rahmani Center for Business and Government, John F. Kennedy School of Government, Harvard University, pp. 5-8.
3

Chapter 2Performance Track Created to Recognize
Top Environmental Performers EPA created Performance Track to attempt a new model for achieving environmental protection goals.5 EPA wanted Performance Track to foster broad-based outcomes like innovation, improved methods for environmental protection, and results beyond compliance. 6 EPA would achieve the benefits of the program by recognizing and encouraging top environmental performers. EPA defined top performers as those that used Environmental Management Systems (EMSs) 7, were involved in their communities, complied with environmental statutes, and to continuous environmental improvement.
Performance Track Design
EPA designed Performance Track as a public-private partnership. EPA established four membership criteria by which they accept facilities into the program and thereby define environmental leadership, or “top environmental performers”: (1) use of an EMS, (2) public outreach, (3) sustained regulatory compliance, and (4) evidence of continued environmental improvement (see Figure 2.1). Performance Track staff stress that these four elements serve not only as the criteria for membership in Performance Track but also as the program’s definition for “leadership.”
According to EPA, the program criteria identify facilities that meet high standards of performance in both regulated (compliance) and unregulated (beyond compliance) areas. Appendix C provides details
Figure 2.1. Performance Track Criteria
1. 2. Environmental Public Outreach Management System (EMS)
3. Regulatory Compliance
4. Commitment to
Continuous Environmental Improvement
Source: Performance Track Website.
on how Performance Track applies these criteria to assess applications.
5 www.epa.gov/performancetrack . 6 According to EPA, environmental performance beyond compliance includes activities that reduce impacts belowlevels permitted by regulations as well as activities unrelated to regulations. 7 An EMS is a set of processes and practices that enables an organization to reduce its environmental impacts and increase its operating efficiency.
4

Value Proposition
In designing a partnership program, EPA’s Office of Partnership Programs recommends that EPA offer incentives to members in exchange for the required environmental commitments. EPA describes this as the “value proposition.” 8
Figure 2.2 describes the Performance Track value proposition: members achieve environmental results that benefit the public; in return, Performance Track offers regulatory and administrative incentives to members.
Figure 2.2. Performance Track Value Proposition
Members pledge environmental performance:
In return, members receive incentives and rewards: 9
• Meet established compliance and EMS criteria.
• Public outreach, including identifying and responding to community concerns, and informing the community about environmental performance.
• Select 2-4 areas for environmental improvement from a list of beyond compliance activities and make 3-year public commitments for improvement.
• Report on their annual progress to EPA and the public.
• Recognition from EPA as environmental stewards.
• Networking opportunities. • Low priority for routine inspections. • Green investment opportunities. • Extended hazardous waste
accumulation time (RCRA 180 Day Incentive).
• Reduced reporting frequency for air sources (MACT Reporting Incentive).
Source: Performance Track Website.
In our opinion, a key incentive in the Performance Track value proposition is that members are eligible to receive a low priority for routine EPA and State inspections. EPA offered this incentive because it anticipated that facilities that demonstrated sustained regulatory compliance would require fewer inspections. This offers an additional potential benefit to EPA in that EPA could use enforcement resources to conduct inspections at higher risk, nonmember facilities whose compliance records have not received the same scrutiny.
8 Research has shown that increased incentives for participants in voluntary programs come with higher requirements from the Agency. This situation leads to greater scrutiny for the participants and, therefore, fewer facilities participating in partnership programs with higher demands on participation. Thus, voluntary programs must balance requirements with incentives.9 Appendix D describes incentives in more detail.
5
Performance Track Implementation
Program resources for Fiscal Year 2006 included approximately 28 full time equivalent staff (FTEs)10, and $2.2 million in funding for grant and contract work.11 The program receives applications twice a year from private and public U.S. facilities. Applicants range from relatively unregulated groups, like facilities designed for recreation and entertainment, to facilities subject to a larger set of environmental statutes, such as producers of chemical products.
Performance Track Process
The premise underlying Performance Track is that recognition and encouragement of top performers will result in previously unrealized environmental benefits. Therefore, the program emphasizes recruitment, screening, and reporting by member facilities.
1. Application Solicitation
The program accepts applications from facilities twice each year, in the spring and fall. Performance Track staff and contractors encourage likely candidates to apply to the program through a targeted membership campaign involving phone calls, mailing campaigns, trade association conference presentations, and other activities. However, EPA welcomes any facility to submit an application.
2. Application Review, Commitment Setting, and Member Selection
Once a facility submits an application, Performance Track staff and contractors review the application materials and assess the facility’s evidence that it exhibits the four criteria described previously. The program typically accepts approximately 75 percent of applications.
Performance Track staff work with applicants as they set their 3-year “beyond compliance” environmental commitments. Performance Track staff emphasize that they encourage facilities to set commitments that will represent a significant challenge and may not be met, or “stretch” goals. Each facility selects two to four commitments based on its size and the type of commitments it chooses.12 Once EPA and facilities agree on these, EPA may accept the facility for membership. Performance Track posts accepted member applications on the EPA Website.
10 Eighteen in headquarters, 7 to 10 FTEs in EPA regional offices, according to program management. 11 The program operated contracts that could not exceed $7 million per year, but estimated that it spent $2.3 million total in contract and grant spending each year. 12 See Appendix E for a list of commitments made by sample facilities.
6

3. Member Performance Reporting
Performance Track members submit annual reports to EPA describing their progress in achieving environmental commitments.13 EPA assesses performance reports, and requests additional information when necessary. EPA compiles acceptable annual facility reports into an annual performance document for the public. This document describes aggregate member progress for the previous calendar year. As of fall 2006, EPA produced four annual reports presenting aggregate progress for members in 2001 through 2004. Performance Track presents each facility’s annual reports and overall program progress reports on the EPA Website.14
4. Member Renewal
After completion of their 3-year commitment cycle, members can choose to renew their Performance Track membership as long as they are in good standing. To be in good standing, a member must continue to meet the program criteria of sustained compliance, fully implemented environmental management system (EMS), and commitment to public outreach; and demonstrate a good faith effort in working towards its performance commitments. To apply for renewal, facilities commit to two to four new stretch goals for their new 3-year membership cycles.
5. Member Removal
According to the Performance Track Program Guide, failure to make any progress or a decline in overall facility performance can lead to removal from the program. However, the Program Guide also emphasizes that failure to meet commitments does not constitute grounds for removal from the program because the commitments represent stretch goals.
Performance Track Membership
EPA began accepting applications for membership in 2001, choosing 226 facilities in the first round. The program grew as facilities applied, were accepted, renewed their membership, or withdrew from the program. As of November 3, 2006, Performance Track included members from 17 different sectors. Figure 2.3 shows the distribution of members among sectors.
13The program did not validate self-reports, but EPA exempts facility annual data from its performance report when Performance Track staff are not confident in the numbers. They said that the number of facility results excluded from aggregation was “higher than they would like it to be.” 14 The program office supplied the raw data for 2005 for the purpose of this review.
7

Figure 2.3. Membership Distribution by Sector
Wood Products, Paper, and Arts, Recreation, and
Transportation Equipment Chemical Productsand Supplies
Textile Products
Rubber and Plastics Products
Entertainment
Metal Products Miscellaneous Manufacturing
Printing
Miscellaneous Non-manufacturing
Wholesale, Retail, and Shipping
Electronic and Electrical Research and Education Equipment
Pharmaceutical Products Energy, Utilities, and Sanitary Services
Machinery Equipment
Medical Equipment and Supplies
Mining and Construction
Source: Performance Track database
As shown in Figure 2.4 below, as of January 10, 2007, 755 facilities had applied for membership in Performance Track, and 417 applicants were active program members. 15 Sixty-two facilities chose not to renew their membership for reasons ranging from facility management changes to not seeing enough value in the program. Performance Track had asked 45 facilities to leave the program: 20 facilities because they did not submit reports and 25 because their EMS did not comply with program criteria. Forty-eight facilities left the program voluntarily due to facility changes, not seeing enough value in the program, and other unspecified reasons. EPA denied renewal to 16 facilities for failure to meet program requirements. EPA did not accept the remaining 165 applicants for membership because they did not meet the program criteria.
15 According to Coglianese and Nash, EPA estimated that 5,000 U.S. facilities met at least some of the basic criteria for membership, p. 3.
8

Figure 2.4. Disposition of Performance Track Applicants through January 2007
Active, 417
Did not apply for
Unknown/inactive, 2
Not accepted, 165
Renewal not accepted, 16
Left on own, 48
EPA asked to leave, 45
renewal, 62
755 total applicants
Source: Performance Track database.
Program Performance Measurement and Reporting
The Government Performance and Results Act of 1993 (GPRA) requires Federal agencies to prepare performance plans containing annual performance goals and measures to help them manage for results. EPA’s strategic plan outlines the Agency’s five long-term goals. To fulfill its five strategic goals, the plan includes a series of more specific goals in the form of objectives and sub-objectives. Each of these objectives has associated performance measures designed to demonstrate progress in achieving the objective and, eventually, the strategic goal.
Performance Track reports on its performance in two ways. First, the EPA annual GPRA report shows progress toward program goals that are based on member commitments. Performance Track established its Annual Performance Goal (APG) under EPA GPRA goal 5 in 2005: Improve environmental performance through pollution prevention and innovation. To achieve this goal, the program planned to achieve reductions in six resource areas: water use, energy use, solid waste, air emissions, water discharge and material use. This APG related to one of the four Performance Track criteria: beyond compliance achievements. Second, as described previously in this chapter, EPA issued public annual progress reports showing members’ collective progress toward environmental commitments and highlighting specific success stories. EPA considers Performance Track a model for partnership programs based on the commitments
9

members make and by highlighting progress on selected commitments; we discuss this concept in detail in Chapter 4.
Summary
EPA created Performance Track under the premise that recognizing and encouraging top performers would foster beneficial outcomes such as innovation, improved methods for environmental protection, and results beyond compliance. EPA established four criteria for membership, and defined those facilities accepted for membership as “top environmental performers.” EPA reports on progress members make toward environmental commitments, and based on these results, EPA highlights Performance Track as a model for partnership programs.
10

Chapter 3Performance Track Design Not
Clearly Linked to Intended Outcomes
In creating the Performance Track program, EPA did not establish links between recognizing and encouraging top environmental performers and achieving ambitious outcomes such as innovation, improved methods for environmental protection, and results beyond compliance. The absence of a comprehensive, cohesive strategic plan led to the pursuit of multiple, overlapping objectives, and a lack of performance information related to the program mission, vision, and goals.
Program Does Not Clearly Link Mission, Vision, Goals, and Measures
Successful programs have a strategic planning process that clearly links goals with well-defined strategies, action plans, and performance measures. In the case of Performance Track, a strategic plan should demonstrate how the value proposition, the program design, and activities would lead to broader outcomes like innovation, improved methods for environmental protection, and results beyond compliance. In reviewing the key guidance documents for Performance Track, we found that the program does not have a comprehensive and integrated set of plans for leveraging the recognition of top performers to achieve the program’s ultimate objectives.
The program presented five internal planning documents: (1) strategic plan; (2) logic model; (3) vision document; (4) goals and measures document; and (5) a division budget. However, these documents do not collectively provide a way to link the vision with the process. For example, according to program staff, both the strategic plan and logic model were outdated and unused. While the vision document describes the 5-year vision for Performance Track, the document does not include statements about achieving environmental results or continuous improvement from program participants.
Figure 3.1 compares the program mission statement, vision statement, strategic plan goals, and annual performance goals. Together, these documents describe a related set of objectives and expectations; however, they do not clearly articulate how EPA will employ the tools and techniques in the program design to achieve program goals or how to achieve the benefits anticipated by the program. For example, program guidance does not describe:
• How “continuous improvement” is defined, monitored, and what options might be employed when it is not achieved.
• The options for achieving annual performance goals: i.e., increase number of members, preference for larger facilities, change goals to measures of environmental efficiency rather than impacts.
11

• How to determine the innovation facilitated by Performance Track, its contribution to improved environmental performance, and whether it is shared.
• How transformed relationships between members and EPA will lead to tangible regulatory efficiencies and improved environmental benefits.
• How to determine if member results are attributable to the program.
Figure 3.1. Comparison of Performance Track Program Mission Statement, Vision Statement, Strategic Plan Goals, and Annual Performance Goals
Mission Statement Vision Statement Strategic Plan Goals 2003-2008
2006 Annual Performance Goals
Improve environmental performance
Transform relationships (between the regulators and the regulated community)
Encourage innovations (through networking, regulatory changes, and fostering a culture of continuous improvement)
Incorporation of performance track into regulatory policies and processes
Linkages with State/Federal programs and policies
A learning community and process for continuous improvement
Awareness and reputation value
An engine for environmental policy innovation
Encourage continuous improvements in environmental performance
Increase program applicants
Expand ownership of the program with key stakeholders
Increase the business value for members
Enable EPA and States to use their enforcement and regulatory resources more effectively
Reduce 3.5 billion gallons of water use; 15,500,000 Million Metric British Thermal Units (MMBTU) of energy use; 1,000 tons of materials use; 440,000 tons of solid waste; 66,000 tons of air releases; 12,400 tons of water discharges
Source: Performance Track internal documents.
Together, these documents address only portions of the value proposition. The documents describe internal goals and targets for increasing the business value of the program (e.g., members taking advantage of at least one incentive and States where incentives are available to members). These documents show that EPA measured whether it offered incentives to members. However, the documents do not address the member portion of the value proposition, represented by the four program criteria:
12

(1) Criterion 1, EMS: EPA did not include EMS-related goals or measures.16
(2) Criterion 2, Public Outreach: EPA did not collect more than basic information on public interaction for facilities, and did not include this element among goals and targets.
(3) Criterion 3, Compliance: EPA did not include member compliance measurement or tracking in these planning documents.
(4) Criterion 4, Beyond Compliance: The program included member commitments, but not member-beyond-compliance achievements in its internal planning.
The absence of a comprehensive, cohesive, strategic plan for Performance Track also led to the pursuit of multiple, overlapping objectives within the program. We observed that 6 years after the start of the program, program management and staff did not focus their efforts on achieving one goal, or a set of consensus program goals. Instead, they articulated several different goals and objectives for the program. Though many of these relate to program goals or objectives described elsewhere, it was not clear that program efforts would move the program in the direction of any clear outcome.
As part of our evaluation, we developed a logic model in coordination with the program staff. The model depicts how program activities would lead to anticipated outcomes. The model includes internal goals, outputs, the program’s GPRA goal as an intermediate outcome, and the EPA mission as an end outcome.17 Appendix F demonstrates the consensus logic model. The model reflects the challenges the program faces in focusing on a clear program objective. The model describes six intermediate program outcomes ranging from reduced environmental footprints to changing environmental protection methods.
Conclusion
EPA had hoped to achieve ambitious goals through Performance Track. However, EPA did not develop a strategic plan to link actions and results to the strategic vision. EPA cannot show how its program can lead to the desired outcomes. Establishing performance measures to assess progress and effectiveness allows EPA to better manage its program to achieve the results it desires. If program staff and management share a common objective and understanding of the program design and goals, staff will better understand how their activities contribute to achieving program goals.
16 Though not included in planning documents, EPA did assess EMSs during site visits. 17 EPA’s mission: to protect human health and the environment.
13

Recommendations
The Associate Administrator for Policy, Economics, and Innovation should:
3-1 Confirm and clarify the National Environmental Performance Track mission and vision.
3-2 Clearly communicate the defined program objective to EPA, Performance Track program staff, the public, nongovernmental organizations, and the regulated community, ensuring that each group understands its purpose in helping achieve the program objective.
3-3 Refine, prioritize, and periodically revisit a program logic model or business model for demonstrating how Performance Track will achieve its goals. This model should demonstrate links from mission, vision, and goals to operations and performance measure to gauge effectiveness so that the program can be managed for success.
3-4 Design a comprehensive, strategic program plan to connect activities with goals and to encourage staff and management to focus on program goals and member commitments.
3-5 Based on key program design elements and outcomes, develop a suite of performance measures so that program staff and management can easily track progress. Based on how the program design is modified, develop and report on the following:
3-5.1 Four program criteria to measure how well members meet and continue to meet the standards set for entry.
3-5.2 Outcome measures that describe if/how the program members contribute to outcomes such as innovation and collaboration, and that show if the program is leading toward performance-based changes in environmental protection.
Agency Response and OIG Evaluation
The Agency concurred with the recommendations in Chapter 3. Appendix A provides the full text of their response.
14

Chapter 4Performance Track Does Not Generally
Fulfill its Value Proposition The program design focused on a value proposition: facilities demonstrate environmental performance by committing to the four program criteria; in return, EPA offers incentives. However, the program cannot demonstrate that members achieve environmental results in three of four program criteria areas: EMS implementation, public interaction, and compliance. Also, members cannot take advantage of some incentives.
In the absence of a means to capture many of the anticipated benefits of Performance Track, the program collects and reports on cumulative “beyond compliance” environmental performance for members, and reports these as their contribution to EPA goals. However, most members do not achieve all of the commitments they set under Performance Track, and these results cannot, in fact, be attributed to program participation.
As a result, these implementation challenges threaten the integrity of the Performance Track brand.
Not All Members Met Criteria or Achieved Environmental Results
EPA selects members based on the four program criteria (see Chapter 2). We looked at information the program collected for each criterion to determine what impact members had at present. Our analysis shows that most members do not make the environmental progress anticipated when they set commitments.
(1) Environmental Management System (EMS) Implementation
As members of Performance Track, facilities must implement an EMS. Performance Track conducts site visits at approximately 10 percent of member facilities each year. During initial site visits, EPA frequently found that facilities did not have adequate EMSs in place. As a result, EPA modified the program to address weak EMSs:
• EPA focused site visits on facilities that did not receive independent EMS assessments,
• EPA revised the site visit protocol, • EPA added a new entry criterion requiring independent assessment for
EMSs, • EPA created a site visit training course, and
15

• Twenty-five facilities withdrew from the program (through September 2004).
The program did not otherwise measure or report on how EMS implementation led to achieving program goals or environmental results.
(2) Public Outreach
The program did not measure, report, or otherwise focus attention on how members interact with the public or if this criterion contributes to achieving program goals or environmental results.
(3) Sustained Regulatory Compliance
As of August 3, 2006, EPA had not asked any facility to leave the program because of compliance violations. EPA expects that a vigorous performance- and compliance-focused EMS will identify instances of actual or potential noncompliance for prompt correction. The program noted that, in general, Performance Track facilities would be rewarded for their self-identification, correction, and prompt disclosure of violations through penalty mitigation under EPA's Audit Policy. Its 2003 strategic plan explained this concept, saying “a credible system of self-auditing and self-correction, combined with independent audits, makes traditional inspections largely unnecessary for program members.”
According to Performance Track, EPA’s Office of Enforcement and Compliance Assurance (OECA) has information about self-reported violations, but Performance Track did not track self-disclosures from member facilities except in cases where the facility reported the disclosure directly to the Performance Track staff. As a result, the program could not differentiate self-disclosed compliance violations from those uncovered by a regulatory inspection.
Compliance databases present additional information, such as enforcement actions and penalties. Program criteria prohibit facilities with three or more significant violations, but Performance Track guidance encourages staff to consider other compliance issues during the application process. We assessed the information in EPA’s internal compliance database for all Performance Track facilities as of November 6, 2006, to see if significant violations provided an accurate picture of compliance. We found that 20 Performance Track facilities listed in the compliance database (4 percent) had current significant violations.18
Some of these facilities may not have qualified for membership if their applications were pending at the time of our assessment.
18 This compliance database, OTIS, showed 500 Performance Track facilities, though Performance Track listed only 417 members at the time. This discrepancy was due to different facility tracking methods. We calculated percentages based on 500 facilities, total.
16

Some facilities did not have current significant violations, but other compliance issues called their leadership qualities into question. These indicators show that 126 facilities (approximately 25 percent) received notices of violation within the past 5 years, 54 (approximately 10 percent) received formal enforcement actions in the past 5 years, and EPA levied noncompliance penalties at 40 facilities (approximately 8 percent). EPA collected $5,999,011 in noncompliance penalties at these Performance Track facilities over the past 5 years. For example,
• One member facility showed a 2005 corporate enforcement action with a total compliance action cost of $265 million for violating the new source performance standard. Though the facility did not have any current significant violations, its record showed 14 quarters of noncompliance with air and water regulations over the past 3 years, one informal enforcement action, and seven formal enforcement actions over the past 5 years.
• Another member facility showed one current significant violation, but seven quarters of noncompliance with air and water regulations over the past 3 years, one informal enforcement action, and 20 formal enforcement actions over the past 5 years.
Notably, quarters of noncompliance (an indicator not included in Performance Track compliance screens) and significant violations tie together closely. We found that 133 facilities (approximately 27 percent) did not comply with an aspect of environmental regulation for one or more quarters (for the 3 years ending in November 2006). As quarters of noncompliance rose, facilities accrued significant violations. Figure 4.1 shows this relationship.
Figure 4.1. Quarters of Noncompliance and Significant Violations
Quarters of Noncompliance # Facilities
# Facilities with Significant Violations
# % # % of SVs 0 367 73 0 0 1-4 66 13 0 0 5-8 27 5.4 6 30 9-12 31 6.2 9 45 13-21 9 1.8 5 25
TOTAL 500 20 Source: OTIS database and OIG analysis.
Thirteen percent of facilities had more than 1 year of noncompliance (five or more quarters of noncompliance), and these same facilities show all of the significant violations among Performance Track facilities. This statistic indicates that Performance Track could track quarters of noncompliance to indicate if facilities might incur significant violations in the future.
17

The program cited problems with EPA compliance tracking databases, saying that additional research could negate violations apparent in the database in many cases. The program staff and contractors conducted compliance screens and responded to OIG inquiries about compliance problems by conducting extensive inquiries into the reported incidents with EPA regions, States, and the facilities themselves. Rather than placing the burden of proof on facilities, the program used EPA time and resources to verify EPA databases. Because Performance Track did not rely on compliance databases, the public may believe that Performance Track members did not comply with an aspect of environmental regulation.
Compliance Record Keeping
As part of our program evaluation, we selected a random sample of 40 Performance Track facilities for detailed analyses. We found evidence of applicant compliance screens for 34 of the 40 facilities in our sample.19 This evidence came in the form of emails and handwritten notes indicating the results of compliance screens for facilities’ applications.
Coglianese and Nash also reported incomplete electronic comment forms, including information related to facilities’ compliance records, on Performance Track applications. Incomplete records could result in the facility’s compliance status not being registered, even when it is a deciding factor in the process.20
We found that as of November 2006, EPA had developed a systematic method for documenting and retaining compliance screens for Performance Track members.
(4) Member Environmental Commitments
We analyzed 40 randomly selected member facilities to see how they accomplished their environmental commitments. The sample facilities averaged a 16 percent improvement over their baselines for Performance Track commitments as of the conclusion of this evaluation.21 These results indicate that member facilities achieved environmental results related to their commitments that improved their previous performance.
However, for the 30 facilities we assessed who had completed a 3-year commitment cycle, only 2 met all commitments. (See Appendix G, Figures G.1 and G.2.) The other 28 facilities most commonly met half of their commitments. Performance Track staff encouraged members to set stretch commitments, and explained that they did not intend for members to achieve these commitments,
19 Compliance screens should summarize the history of Federal and State enforcement actions taken against a company or facility due to not complying with environmental statutes and regulations. 20 Coglianese and Nash, p. 87. 21 Performance on environmental commitments ranged from a 57 percent decline below baselines to a 100 percentimprovement over baselines. The median was an 11 percent improvement.
18

just for them to make progress. Accordingly, few members met their commitments. Thirteen percent (5 of 40) reported environmental conditions declined below their baselines from entry into the program to the present.
Performance Track conducted an internal assessment of commitment achievement for seven commitment areas for facilities completing a commitment cycle in 2003, 2004, and 2005.22 The program found that facilities came close to achieving commitments in aggregate. However, Performance Track also found that, on average, 46 percent of facilities that made these commitments did not achieve them. Program staff noted that this disparity was possible because aggregate results could be skewed by one facility’s performance. Facilities in our analysis varied widely in performance on commitments.
Program Has Achieved Less Than Half of GPRA Targets
Performance Track’s GPRA APG related to one of the four Performance Track criteria: beyond compliance achievements. The program did not report on results related to the other three program criteria. EPA set six targets for the Performance Track GPRA goal, drawing on data from facility commitments. Achieving the APG depends on facilities making progress toward achieving key commitments. As Figure 4.2 demonstrates, the program did not achieve its goal for 2005— the program did not meet five of the six targets. For three of the six targets comprising the goal, conditions worsened. For two of the six, conditions improved, but the program did not achieve the target. In 2006, the program made progress over baseline for all, and achieved three of six targets, but still did not meet its overall GPRA goal.
22 The program selected seven commitments for analysis: (1) water use, (2) energy use, (3) hazardous materials use, (4) hazardous waste, (5) nonhazardous materials, (6) nonhazardous waste, and (7) volatile organic compounds.
19

Figure 4.2. Performance Track Targets in EPA’s Strategic Plan for Fiscal Years 2005 through 2008
Reduced water use (million gal)
Reduced energy use (MMBTU)
Reduced solid waste (tons)
Reduced air emissions (tons)
Reduced water discharge (tons)
Reduced materials use (tons)
2005 goal 600 2.5 200,000 6,000 10,000 15,000 2005 actual* 528 -22.0 -22,000 7,700 7,700 -150,000 2006 goal 900 7 300,000 35,000 10,000 20,000
2006 actual* 1,700 4.3 48,200 24,400 16,903 24,719
2007 goal 1,100 8.4 360,000 42,000 10,000 20,000 2008 goal 1,500 3.3 450,000 10,000 19,000 26,000
* Targets met are highlighted in green; targets not met are highlighted in red
Sources: U.S. EPA Fiscal Years 2005 and 2006 Annual Performance Reports and Performance Track documents.
In assessing why the program did not achieve its Fiscal Year 2005 targets, we looked at program annual progress reports. Reports for Fiscal Years 2001 through 2005, and data from Performance Track from Fiscal Year 2005, show that members’ material use increased for the past 2 years (Fiscal Years 2003 and 2004 data), as demonstrated by Appendix G, Figure G.3. Energy use also increased for Fiscal Year 2004, rather than declining as predicted by the program GPRA goal.23
Performance Track does not present program trends in its reports and can not show whether program results improve or decline from year to year, or determine why members do not meet their commitments.
As described in Chapter 3, the program did not set internal targets for meeting its EPA goals, so it did not track members’ progress toward achieving key commitments. The program’s internal target that related to environmental results “increase number of member commitments” did not measure whether members achieved the commitments they set.
Although EPA defined one program outcome as reducing the overall environmental footprints of member facilities, Performance Track cannot gauge changes in facilities’ overall environmental improvement because they only report on their predefined commitments. Stakeholders said that because members report on only their two to four commitments, EPA and the public cannot tell if another aspect of facility maintenance declined. Thus, EPA cannot tell if facilities made overall environmental improvements, or rather improved in one area and faltered in others. By measuring other aspects related to a facility’s overall environmental
23 We did not compare FY2006 APR results with program documents because Performance Track data for FY 2006 were not yet available.
20

improvement, the program could better show how facility participation in Performance Track leads to environmental improvements.24
Members Lack Access to Some Incentives
EPA recognizes that members do not have access to some of the incentives designed as rewards for participation. Federal statutes give most States the authorities related to Performance Track incentives. States issue permits and conduct the majority of facility inspections under the statutes.25 No State grants all four major incentives to program members. Two States, Colorado and Pennsylvania, grant all incentives except the low priority for routine inspections.
In the draft report for this evaluation, we referred to a Performance Track document shown on its Website for the duration of the evaluation. This chart demonstrated how few States offer Performance Track incentives. Subsequent to our draft report, Performance Track removed this chart from its Website and notified us that the chart was incomplete.
Performance Track staff and stakeholders commonly mention low routine inspection priority as a problem for compliance monitoring: without regular inspections, they ask, how can EPA know if Performance Track members maintain satisfactory compliance records? However, Performance Track previously reported that only 11 of 57 States and territories employed this incentive. As a result, although Federal inspections declined at member facilities, State inspections largely did not.
Because some program incentives are not widely available, Performance Track members generally receive only EPA’s “seal of approval” as a reward to participating in the program. EPA has found that Performance Track members see EPA collaboration and recognition as the most valuable reasons to participate in the program. According to biannual Performance Track member surveys, EPA offers valuable “brand” recognition. Coglianese and Nash found that the facilities Performance Track attracts are looking for recognition: they already actively cultivate an identity of environmental responsibility and leadership, value recognition, and actively seek to engage regulators and communities.26
Conclusion
Performance Track did not measure and report on members’ adherence to all four program criteria, or describe whether meeting these criteria led to achieving environmental results. The program criteria do not require assessing key
24 According to EPA, aggregate results were heavily impacted by large facilities. However, as noted in Chapter 4 of this report, we found that few facilities met all environmental commitments, regardless of facility size. 25 These statutes include the Resource Conservation and Recovery Act (RCRA), the Clean Water Act (CWA), and the Maximum Achievable Control Technology (MACT) portion of the Clean Air Act (CAA). 26 Coglianese and Nash, p. 5.
21

compliance information that show whether an applicant has a sustained record of regulatory compliance. The program’s EPA goal is based on member commitments. However, EPA did not focus on making progress toward those goals. By developing a comprehensive performance measurement and reporting system, the program could better determine which activities worked to help achieve environmental goals, and refocus on successful activities. To meet its GPRA goals and maximize environmental results from the program, Performance Track will need to encourage members to set and achieve ambitious goals.
Recommendations
The Associate Administrator for Policy, Economics, and Innovation should:
4-1 Maintain a centralized database for compliance screening information and decisions on Performance Track members.
4-2 Encourage member facilities to set and achieve commitments so that the public has a clear idea of what members will actually achieve.
4-3 Based on the definition of Performance Track program objective and the logic model developed from this objective, determine whether EPA should collect additional data from program members.
Agency Response and OIG Evaluation
The Agency concurred with the recommendations in Chapter 4. Appendix A provides the full text of their response.
The Agency noted that three program criteria, EMS implementation, public interaction, and compliance, do not have a direct connection with environmental results. In response, we want to emphasize that Chapters 3 and 4 describe the importance of demonstrating that the program design, as well as its mission, vision, and measures, should all logically lead to environmental results.
22

Chapter 5Some Members Exceed Sector Average for
Noncompliance and Toxic Releases EPA expected that the Performance Track program would foster outcomes like innovation, improved methods for environmental protection, and results beyond compliance. When the program began, the Agency outlined it as a program to “recognize and encourage top environmental performers,” and continues to use this description in its public documents and statements. Because EPA cannot demonstrate how it may achieve these ambitious outcomes, such as innovative solutions and changed relationships, we set out to determine how well the program achieves its stated objective: recognizing top environmental performers.
Our analysis shows that most members demonstrate “top performance,” beyond the average for their peers, for two environmental indicators: compliance and toxic releases. However, some facilities had more compliance problems or released more pounds of toxic substances than the average for their peers. The presence of underperforming facilities reduces the integrity and value of the Performance Track brand.
Program Equates Membership with Leadership
Program staff and management said that compliance with the four program criteria indicated that members were “leaders.” Coglianese and Nash found that program members differed from nonmembers in that they acted as “joiners,” so equating membership with leadership may mean that members only differ from nonmembers in that they chose to apply.27 There is no evidence that members differ materially from nonmembers in environmental performance. In fact, EPA has not compared member facilities with their peers for environmental performance indicators to determine if members lead in their sectors.28
Coglianese and Nash concluded that EPA does not determine if Performance Track members are better performers than nonmembers. The study said:
Despite some Agency claims that Performance Track is designed to recognize “top” environmental facilities, the application and admissions process do not directly address whether members’ performance is better than other comparable facilities that have not applied to the program—nor even whether their progress is in other ways significant.29
27 Coglianese and Nash, p. 5.28 For a new program aspect, the “Corporate Leader” designation, EPA compared company compliance with sector compliance, but it did not use this method on a facility by facility basis for the “Performance Track” designation. 29 Coglianese and Nash, p. 14.
23

In an effort to compile available information about members’ and comparable facilities’ environmental performance, we developed an approach using public environmental performance data on regulatory compliance and toxic releases. Performance Track compliance screening guidance encourages staff to consider both of these aspects when reviewing applicants.30 We analyzed a random sample of 40 member facilities and compared their performance with that of their sectors.31 By comparing member performance with average sector performance, we could determine if a facility led or fell behind its sector average for these two indicators. This analysis provides a rough indication of comparative environmental performance.32
Most Members Are Top Performers
In our analysis, we found that most sample members outperformed their sectors for compliance and toxic releases as reported to EPA’s Toxics Release Inventory (TRI). 33 Twenty-two of 35 facilities (63 percent) had no compliance problems and outperformed their sector peers in every measure of compliance.34 We also found that at 14 of 27 facilities reporting toxic releases (52 percent), toxic emissions declined since the facility joined the Performance Track program. In 2003, 22 of 27 sample facilities (81 percent) reported fewer toxic releases than their peers in their industrial business sectors. Facilities exhibiting this leadership performance came from all Performance Track sectors included in our analysis, and represented all size classes defined by the program.
Some Facilities Had More Compliance Problems than Their Peers
Thirteen of the 35 facilities that had received an inspection (37 percent) had more compliance problems than their sector average for one or more compliance measures. These facilities represented 9 of the 14 sectors included in our sample. Appendix G, Figure G.4 summarizes compliance problems uncovered in the sample.
As mentioned previously, 5 of the 40 facilities in our sample had not received an inspection within the past five years. Two of these facilities were classified as nonmanufacturing facilities, but of the other three, two are chemical plants, and one is an electronics facility. As a result, EPA accepted and retained these
30 Many studies look to toxic releases as an indicator of environmental performance. These include Coglianese and Nash, the American Chemistry Council, and the Environmental Council of the States. 31 We defined sectors by the North American Industrial Classification System (NAICS) code for a facility. When a facility reported under more than one NAICS code to Performance Track, we calculated a composite sector that used all NAICS codes cited.32 See Appendix B, Detailed Scope and Methodology, for additional details. 33 During our analysis, the most recent TRI data available were for 2003. 34 Five of the 40 facilities had never been inspected, and so were excluded from our compliance analysis.
24

facilities as members with no information about their compliance with environmental regulations.
Some Facilities Released More Toxic Chemicals than Their Peers
Based on 2003 toxic releases, some Performance Track facilities do not outperform their sectors. Five of 27 (19 percent) facilities in our sample reporting to TRI released more toxic pollutants than their sector average for 2003.35 We also found that 4 of 27 (15 percent) of the facilities in our sample increased their reported toxic emissions after joining Performance Track.36 These facilities increased their toxic emissions by an average of 587,257 lbs per facility despite committing to the Performance Track program.
Summary
Four facilities exceeded their sectors for both compliance problems and toxic releases. This result provides insight into member environmental performance, indicating that while program criteria may deem an applicant a top performer, this designation may not hold true when the facility is compared with other facilities in its sector. Figure 5.1 describes compliance and toxic release issues for the four facilities that underperformed in both compliance and toxic releases.
35 Program members tend to be larger facilities, which may mean that they emit more toxic pollution than smaller facilities. However, our sample included multiple facilities in the same Performance Track sector, and facilities varied in size. Some large facilities emitted more toxic releases than their sector, while others emitted less. 36 At 7 of the 27 facilities, toxic releases remained unchanged (26 percent).
25

Figure 5.1. Sample Facilities with Both More Compliance Issues and More Toxic Releases Than Sector Peers
Compliance Toxic Releases Facility 1: Rubber and Plastics Products
1 qtr. of noncompliance (RCRA) 2 notices of violation (CWA, RCRA)
Emitted 204,397 lbs. (231%) more toxic chemicals than sector average in 2003
Facility 2: Transportation Equipment and Supplies
9 qtrs. of noncompliance (CWA) 1 notice of violation (RCRA)
84% transferred offsite, emitted 16% more toxic chemicals than sector average
Facility 3: Chemical Products
1 qtr. of noncompliance (CWA) 4 notices of violation (CAA)
39,593 lbs. increase in toxic releases since program entry 72% transferred offsite, emitted 12% more toxic chemicals than sector average
Facility 4: Wood Products, Paper, and Printing
4 qtrs. of noncompliance (1 CWA, 3 CAA) 4 notices of violation (1 CWA, 3 CAA) 3 formal enforcement actions (CAA) 1 penalty for $15,000 (CAA)
447,475 lbs. increase in toxic releases since program entry; Facility has introduced 9 new toxic chemicals since 1996, emitted 194% more toxic chemicals than sector average
Source: OTIS and OIG analysis.
EPA does not assess or track members’ performance as compared with their peers and has not removed any for poor performance in either regulatory compliance or toxic emissions.
Conclusions
Our analysis shows that Performance Track has recognized many above average environmental performers among its members. The majority of facilities in our sample outperformed their sectors averages in both compliance and toxic releases—regardless of facility size or sector—which demonstrates leadership within the sector. However, we also found member facilities with more compliance problems or more toxic releases than their sector averages.
In Chapter 2, we described how EPA created and designed Performance Track and EPA’s broad vision for the program. In Chapter 3, we discussed how Performance Track needs a cohesive strategic plan to link its vision with its activities and measures for program progress. In Chapter 4, we discussed how EPA needs to see how the design is working – that is, whether membership
26

criteria lead to program results, and whether members receive incentives. In this chapter, we discussed how, although many members do perform above average, Performance Track does not know if its members are “top performers,” despite public claims to the contrary.
Taken together, the results from this evaluation demonstrate that EPA could modify the program design and improve program management to know if the Performance Track model succeeds in “recognizing and encouraging top environmental performers,” or in fostering innovation, improved methods for environmental protection, and results beyond compliance. Currently, recognition by and collaboration with EPA are the incentives members value most. This means that Performance Track offers a valuable brand of recognition. Issuing this recognition to underachievers does not maintain the value of the brand.
Recommendations
The Associate Administrator for Policy, Economics, and Innovation should:
5-1 Track member environmental performance in independent databases to:
5-1.1 Refine criteria by which it defines “top environmental performer.”
5-1.2 Establish criteria for removing members from the program when compliance or toxic releases change—independent of sector-wide changes.
5-1.3 Show if facility performance changes as they join and progress through the program.
Agency Response and OIG Evaluation
The Agency concurred with the recommendations in Chapter 5. Appendix A provides the full text of their response.
27

Status of Recommendations and Potential Monetary Benefits
POTENTIAL MONETARY RECOMMENDATIONS BENEFITS (in $000s) 3
Planned Rec. No.
Page No. Subject Status1 Action Official
Completion Date 2
Claimed Amount
Agreed To Amount
3-1 14 Confirm and clarify program vision O Associate Administrator OPEI
3-2 14 Clearly communicate objective O Associate Administrator OPEI
3-3 14 Refine, prioritize, and revisit program model O Associate Administrator OPEI
3-4 14 Design a comprehensive strategic program plan O Associate Administrator OPEI
3-5 14 Develop and implement suite of performance O Associate Administrator OPEI measures
4-1 22 Maintain centralized application and compliance O Associate Administrator OPEI screen database
4-2 22 Encourage members to set and achieve O Associate Administrator OPEI commitments
4-3 22 Consider collecting additional information from O Associate Administrator OPEI program members
5-1 27 Track member environmental performance O Associate Administrator OPEI
1 O = recommendation is open with agreed-to corrective actions pending;C = recommendation is closed with all agreed-to actions completed;U = recommendation is undecided with resolution efforts in progress.
2 In accordance with EPA Manual 2750, the Agency is required to provide a written response to this report within 90 calendar days that will include a corrective actions plan for agreed upon actions, including milestone dates.
3 Identification of potential monetary benefits was not an objective of this evaluation.
28

Appendix A
Agency Response and OIG Comments MEMORANDUM
SUBJECT: OPEI Response to Draft Evaluation Report: Performance Track Could Improve Program Design and Management to Ensure Value Assignment Number: 2006-1317
FROM: Brian F. Mannix Associate Administrator
TO: Jeffrey Harris Director for Program Evaluation, Cross-Media Issues
Thank you for the opportunity to comment on the Draft Evaluation Report issued by the Office of the Inspector General on February 13, 2007, regarding the National Environmental Performance Track program. We appreciate the time and effort your team invested in this project. We are proud that after five years of securing environmental results, we can undergo this level of scrutiny and confirm what we knew to be true – Performance Track members lead their peers in environmental performance. We concur with the recommendations you made for improving the Performance Track program as well. In particular, we appreciate your recommendations to sharpen our definition of goals and objectives; to create a more realistic process for linking our programmatic goals with EPA’s strategic goals; to more effectively use EPA databases to evaluate member qualifications; and to create better intermediate measures of program results. We also acknowledge the challenges you faced in evaluating a relatively new beyond-compliance program -- the difficulties of how to best measure leadership, the complexities of analyzing compliance data, and the limitations of Toxics Release Inventory (TRI) data.
My comments first provide some clarifications of the Performance Track business model. Following that are our more detailed comments on this draft of the report and our response to each of your recommendations. A list of remaining factual issues that require attention is attached as an appendix.
OIG Response:
EPA agreed with all our recommendations for program improvement. While EPA took issue with some aspects of our evaluation methodology and conclusions about the program, the response recognized improvements could be made.
29

The Performance Track Model
Performance Track was launched in June 2000 to recognize and encourage continuous improvements in environmental performance that go beyond existing legal requirements. It reflects the ideas emerging from a number of expert advisory bodies in the 1990s, among them the President’s Council for Sustainable Development, the National Academy of Public Administration, and the Aspen Institute. It also reflects trends in Europe and Japan, where partnership programs increasingly are being linked with regulatory programs to achieve better environmental results on a range of issues.
Performance Track is designed to complement the environmental returns that are realized through regulation. In addition to augmenting our regulatory strategies, however, it also is aimed at making them more effective, by encouraging government resources to be used more efficiently and enabling strong performers to be more innovative and results-oriented. Growing experience from existing state performance-based programs and from around the world support the view that partnership programs offer a valuable means of improving environmental results, particularly when governments need to respond to new and emerging issues. In fact, the Inspector General released a report in November of 2006 stating this very premise as its title: Partnership Programs May Expand EPA’s Influence.
Performance Track’s business model is based on one that is used in many innovative and high-performing business organizations, in which they set ambitious, “stretch” goals and determine how best to achieve them. Working closely with state agencies, EPA encourages Performance Track members to aim high. Members set between two and four environmental goals that go beyond their legal obligations, and they report annually on their progress. Under this model, the measure of success is not so much the percentage of goals that are achieved but the environmental improvements that are realized. The draft report highlights the fact that only two of the 30 facilities in its sample had achieved all four of their commitments – a result that would be plainly unacceptable if these were floor requirements imposed by regulation. In fact, however, these are voluntary stretch goals that are intended to elicit an extraordinary level of effort. Just as companies set, but do not always meet, ambitious public targets for corporate earnings, Performance Track members set public targets for environmental performance that present a challenge. Altogether, the 30 facilities in the Inspector General’s sample met or exceeded half of their 118 public goals, which is an indication of significant success.
In terms of the actual environmental gain that is achieved, the program has been able to document significant improvements, many of which are noted later in these comments. EPA is careful not to attribute these solely to participation in the program because many other factors also encourage environmentally responsible behavior. However, we have been able to document anecdotally that program members have added new goals, strengthened their commitment to existing goals, and enhanced their environmental management systems and public outreach in order to establish and maintain their Performance Track qualifications. We currently are designing a survey instrument for collecting more systematic data on these program effects.
30
Long-Term Potential of Performance Track
Although most of the attention has been focused on the near-term environmental results, the longer-term potential of the Performance Track model is even more promising. Performance Track offers a valuable platform for EPA, state environmental agencies, Performance Track members, and local organizations to work collaboratively to achieve results. For example, the State of Colorado and EPA’s Denver Regional Office are collaborating with a Performance Track member and three Publicly Owned Treatment Works within the Cache la Poudre River watershed to develop a proposal to coordinate their effluent and ambient monitoring. The State encouraged the facility to form a stakeholder group to develop the proposal and to also form a watershed committee. This coordination provides for a better understanding of the health of their watershed and a greater efficiency in the use of monitoring resources. The State has proposed a policy that provides a framework for allowing reductions in effluent monitoring frequencies and encouraging these types of innovative approaches to protect Colorado watersheds.
Performance Track also fosters collaboration between regions, states, member facilities, and EPA through its implementation of challenge commitments, which address priority problems identified by EPA and local communities. Challenge commitments require that facilities commit to a specific, high level of performance toward EPA-defined environmental priorities and count as two of the four commitments. (Small facilities are still required to make two commitments.) Performance Track partnered with EPA's Office of Water to offer a challenge commitment in water use reduction, with the Office of Solid Waste and Emergency Response to create a challenge commitment in Priority Chemicals reduction, and most recently worked with EPA's Office of Air and Radiation to launch a challenge commitment in energy use reduction.
Additionally, Performance Track fosters collaboration and innovation through the Corporate Leader designation, which recognizes companies that have a substantial number of facilities participating in the Performance Track program and that are committed to environmental excellence at the corporate level. These companies are focusing on Product Sustainability Reviews that include Life-Cycle Assessments in order to affect new and existing product designs, conducting environmental assessments of their suppliers in order to reinforce their commitment to sustainability, and increasing their reliance on renewable energy sources, among many other commitments.
Program Recognition and Commitment to Continuous Improvement
The value of the Performance Track business model and EPA’s implementation of it has been recognized by external groups. In 2006, the Kennedy School of Government selected Performance Track as one of the top 50 innovations in American government for its effectiveness, significance, and potential for replication. The prestigious awards are given to the most creative, forward-thinking, results-driven government programs at the federal, state, county, and city levels. Out of a pool of more than 1,000 applicants, Performance Track was one of only 13 federal programs to be recognized. A recent study of partnership programs by Prakash and Potoski found Performance Track to be among the most rigorous of such programs around the world. When compared to other partnership programs, and even many regulatory
31

programs, the quality of our measurement and our ability to track trends over time has few peers.
EPA welcomes suggestions for improving Performance Track, protecting its brand value, realizing its potential for improving environmental results, and transforming relationships over the long term. We agree that there are challenges in measuring the institutional and innovation effects of the program, in maintaining accurate and up-to-date data on member performance outside of their Performance Track goals, and in integrating the program with the existing regulatory system. Building on the support of the Harvard study, we plan to continue engaging national and international experts to help us meet these challenges in the years ahead.
Performance Track’s Response to Some Issues in the Draft Evaluation Report
While Performance Track concurs with all of the Inspector General’s recommendations for improvement, we would like to respond to some of the issues raised in this report, namely, how we track member results, how we set our Government Performance and Results Act (GPRA) goals, how compliance information is analyzed, and how we analyze members’ TRI information.
Performance Track Focuses on Member Results
Tracking member performance and results is a major focus of the Performance Track program. Members are required to submit a lengthy annual performance report each year. If they do not submit their reports, they are removed from the program. EPA posts all member applications and their annual performance reports online at www.epa.gov/performancetrack/members. Member results are clearly a focus across each of Performance Track’s internal planning documents, including through our mission, vision, strategic plan, annual performance goals, and logic model. We track member trends internally and also have presented trend analysis and performance data analysis in each of our four program reports to date, which are available on the Performance Track Website at www.epa.gov/performancetrack/pubs.htm.
While the Draft Evaluation Report concludes that, based on its sample, most Performance Track members lead their peers in environmental performance, it also asserts that Performance Track could not demonstrate that members achieve environmental results in three of four program criteria areas: environmental management system (EMS) implementation, public interaction, and compliance. This point is misleading. It assumes that these criteria have a direct cause and effect relationship with environmental results. In fact, they are criteria facilities must meet in order to be accepted into Performance Track. The program analyzes the actual environmental results of its members through the fourth criterion – continuous improvement and the associated performance goals. It would not make sense to use the other three program criteria as a proxy for actual environmental results.
32

OIG Response:
In its comments, EPA says, “If [members] do not submit their [progress] reports, they are removed from the program.” We found that this was not true in all cases. We pointed out these instances to Performance Track, and they promptly corrected the instances we found.
EPA also says, “It would not make sense to use the other three program criteria as a proxy for actual environmental results.” To clarify, the implication of logic modeling is not to show that each aspect of the program has a direct effect on environmental outcomes, but rather to show how each aspect of the program should be logically connected to program results.
As part of their commitment to continuous improvement, members typically set four environmental goals (small facilities set two). To date, Performance Track members have collectively made more than 1,500 commitments to benefit the environment. They have reduced their water use by 3.5 billion gallons, greenhouse gas emissions by 97,000 metric tons of carbon dioxide equivalent, nitrogen oxide emissions by 6,000 tons, sulfur oxide emissions by 17,000 tons, hazardous waste generation by 133,000 tons, and conserved more than 14,000 acres of land.
The Draft Evaluation Report notes that its sample of 40 members achieved a 16-percent average level of actual environmental improvement during their three-year membership term. The average level of actual improvement varies by environmental indicator. For example, for the entire membership, the average level of actual energy use reduction is about eight percent while the average level of hazardous materials use reduction is about 40 percent. We are including a graph below that demonstrates the level of environmental improvement by members who completed their three-year term of participation in 2003, 2004, and 2005. The graph presents both the actual, absolute percent-improvement in each category and the normalized percent-improvement. Normalized improvements take into account changes in production or other activity levels at the facility.
33
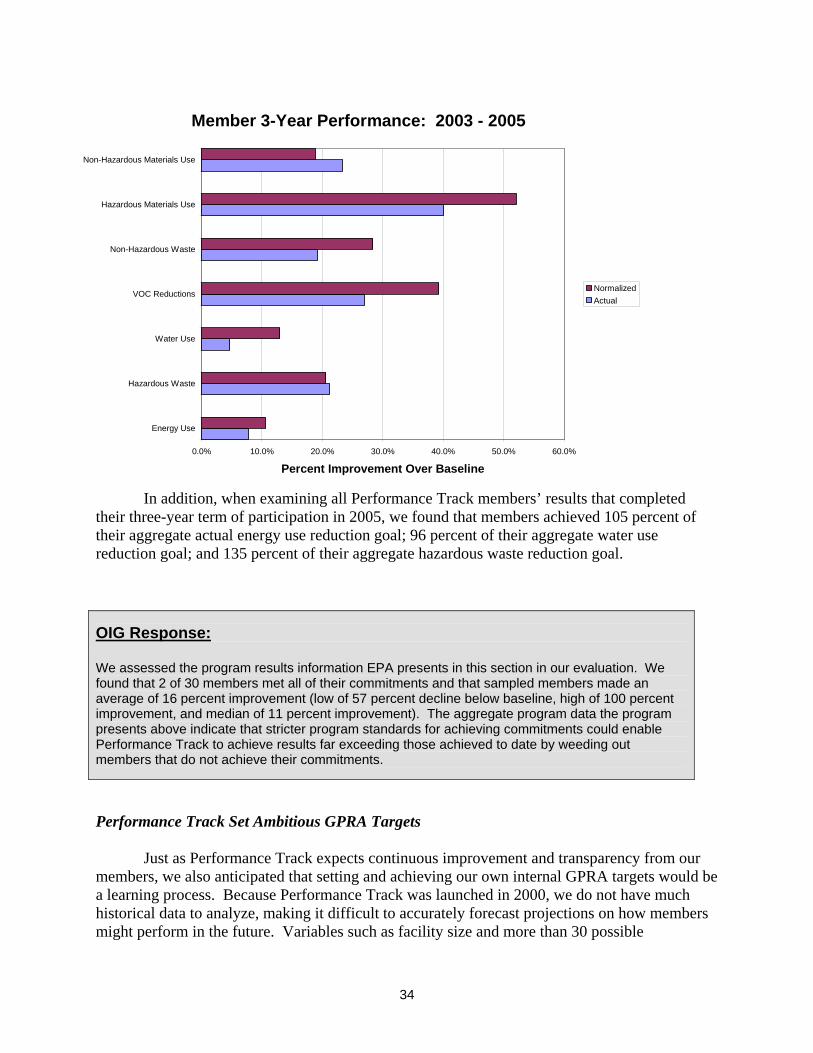
Member 3-Year Performance: 2003 - 2005
Non-Hazardous Materials Use
Hazardous Materials Use
Non-Hazardous Waste
Normalized VOC Reductions
Actual
Water Use
Hazardous Waste
Energy Use
0.0% 10.0% 20.0% 30.0% 40.0% 50.0% 60.0%
Percent Improvement Over Baseline
In addition, when examining all Performance Track members’ results that completed their three-year term of participation in 2005, we found that members achieved 105 percent of their aggregate actual energy use reduction goal; 96 percent of their aggregate water use reduction goal; and 135 percent of their aggregate hazardous waste reduction goal.
OIG Response:
We assessed the program results information EPA presents in this section in our evaluation. We found that 2 of 30 members met all of their commitments and that sampled members made an average of 16 percent improvement (low of 57 percent decline below baseline, high of 100 percent improvement, and median of 11 percent improvement). The aggregate program data the program presents above indicate that stricter program standards for achieving commitments could enable Performance Track to achieve results far exceeding those achieved to date by weeding out members that do not achieve their commitments.
Performance Track Set Ambitious GPRA Targets
Just as Performance Track expects continuous improvement and transparency from our members, we also anticipated that setting and achieving our own internal GPRA targets would be a learning process. Because Performance Track was launched in 2000, we do not have much historical data to analyze, making it difficult to accurately forecast projections on how members might perform in the future. Variables such as facility size and more than 30 possible
34

environmental goals from which members could choose also make it difficult to project future member results. It is important to highlight that although Performance Track did not achieve all of the aggressive GPRA targets it set for itself in Fiscal Year 2005, all progress made was voluntary, beyond-compliance, and benefited the nation’s air, water, and land. Additionally, in Fiscal Year 2006, members collectively made environmental improvements in all six regulated and unregulated areas: water use, energy use, material use, solid waste generation, discharges to water, and air releases.
In its discussion of the GPRA targets, the Draft Evaluation Report states that only one of the six conditions improved when in fact, Performance Track members made beyond-compliance improvements for three of the six targets for Fiscal Year 2005. The Draft Evaluation Report also states that material use increased for Fiscal Years 2003, 2004, and 2005, and energy use increased in Fiscal Years 2004 and 2005, when in fact, members’ material use decreased in 2003 and their energy use decreased in 2003 and 2004.
OIG Response:
In its response, EPA points out differences in performance reporting data. For Fiscal Year 2005, we present data showing that the program achieved one of six targets. Both the draft and final reports recognize that the program made progress in three of six targets; overall, it did not achieve four of six targets. For Fiscal Year 2006, we replaced preliminary data received from the program during the evaluation with finalized data presented in EPA’s Fiscal Year 2006 Annual Performance Report, which is now publicly available. As a result, we show that the program met three of six targets in Fiscal Year 2006.
Performance Track’s Analysis of Compliance Information
When they apply to the program, Performance Track members undergo a thorough compliance screening review, which includes an assessment of information housed in EPA databases, consultation with regional offices, state environmental officials, and the U.S. Department of Justice. Performance Track adheres to compliance screening guidelines that were developed for all EPA partnership programs in collaboration with EPA’s Office of Enforcement and Compliance Assurance (OECA). We also assess the compliance status of members on a regular basis while they are in the program and when they re-apply for membership at the end of three years.
Performance Track members are required to maintain a record of sustained compliance. It is important to note, however, that Performance Track’s acceptance criteria do not require a record with zero violations. Consistent with Agency compliance screening guidelines for partnership programs, EPA has the discretion to allow facilities into the program if screening reveals recent enforcement activity, so long as their overall compliance record is strong, any issues were addressed quickly and responsibly, EPA and state enforcement officials agree that the applicant is a strong environmental performer, and the facility meets the other criteria for membership. For Performance Track, this includes allowing up to two significant violations in a three-year period.
35

The Draft Evaluation Report’s analysis of the compliance history of all Performance Track facilities found that 73 percent had no reported non-compliance, certainly an indication that members in general are maintaining strong compliance records. Indeed, based on a more in-depth analysis of 40 facilities, the Draft Evaluation Report concludes that most of the sample facilities outperform their peers with respect to their compliance records.
In its analysis of all Performance Track facilities, the Draft Evaluation Report found that four percent had significant violations reported in their records. As stated above, in reviewing the compliance history of applicants, we use the compliance databases as a starting point. After verifying these data, we consult with regional and state staff, and we allow for up to two significant violations in the past three years. Therefore, the Draft Evaluation Report’s implication that these facilities may not have qualified for membership is incorrect. All of these facilities did pass our compliance screening criteria at the time of application.
The Draft Evaluation Report presents misleading information about a Performance Track facility that was subject to civil penalties and associated compliance cots. The fine and compliance costs attributed to the Performance Track facility by the Draft Evaluation Report were, in fact, the total costs for seven facilities included in this enforcement action. The Performance Track facility continues to meet the program’s compliance criteria.
OIG Response:
In responding to drafts for this evaluation, EPA parsed the details of our analyses to determine if flaws and inaccuracies in the databases we used could account for our results. However, we used publicly available data, which showed what information the public can access to determine the success of this program. The burden of proving that applicants are “true” leaders and disproving any data discrepancies in EPA’s databases should fall upon the applicants in this program, not on EPA’s staff.
In addition, as shown in our Scope and Methodology, we verified compliance data for the Performance Track members in our sample by checking with EPA regional data stewards. We did not verify compliance data for the sectors with which we compared Performance Track members. For this reason, it is our opinion that Performance Track members’ data used in this evaluation have a higher level of accuracy than the data for sector averages.
In response to EPA’s comments, we verified the penalty referenced herein with OECA and changed the report to indicate that this was a corporate and not a facility penalty.
Performance Track’s Assessment of Toxics Release Inventory Information
The Draft Evaluation Report concluded from its sample of 40 Performance Track members that most members outperform their sectors for toxic releases. In the spring of 2006, EPA began evaluating the TRI releases of new applicants and renewing members. When Performance Track has researched apparent TRI increases in the past, it has often been the case that the apparent increases were a product of changes in reporting methodology or changes in production levels. A pattern of releases that suggests an actual deterioration in performance would cause us to re-evaluate that facility’s qualifications.
36

Moreover, one of the four facilities in the Inspector General’s sample reported an increase of over 1.5 million pounds in 2004. However, when EPA inquired about the reason for the increase, the facility stated that it was a reporting error, and that the 2004 releases, after correction, would be in line with the previous year. This would significantly decrease the average toxic release increase cited by the Draft Evaluation Report.
OIG Response:
In its response, EPA says that there was a 2004 TRI reporting error included in our analysis. We used 2003 TRI data in our analysis. As stated in our scope and methodology, we conducted our fieldwork using data available for August through November 2006. See response to compliance comments in previous section. The same general comments apply to TRI data, which are publicly available. In addition, EPA has a formal correction process that allows facilities to report inaccurate TRI data.
Performance Track Concurs with Draft Evaluation Report’s Recommendations
3-1. Confirm and Clarify National Environmental Performance Track Mission and Vision.
Concur. We will integrate our planning documents and update our vision statement. We have adopted a statement of core purpose and core values as a basis for integration.
3-2. Clearly communicate the defined program objective to EPA, Performance Track staff, the public, non-governmental organizations, and the regulated community, ensuring that each group understands the program objective.
Concur. We are reviewing our public materials and ensuring that core objectives are communicated clearly and consistently to these audiences.
3-3. Refine, prioritize, and periodically revisit a program logic model or business model for demonstrating how Performance Track will achieve its goals.
Concur. Our original logic model was developed in 2005, updated and expanded in 2006, and periodically will be revised and updated.
3-4. Design a comprehensive strategic program plan to connect activities with goals and to encourage staff and management to focus on program goals and member commitments.
Concur. We plan to refine our statement of program goals and to develop a more explicit set of linkages between those goals, member commitments, and program results.
3-5. Based on key program design elements and outcomes, develop a suite of performance measures so that program staff and management can easily track progress. Based on how the program design is modified, develop and report on the following:
3-5.1 Four program criteria to measure how well members meet and continue to meet the standards set for entry.
37

Concur. We will continue to use the Annual Performance Reports, site visits with a sample of members annually, summaries presented in the annual Progress Report, renewal applications, and regular screening of members against the compliance criteria to monitor whether members continue to meet the eligibility criteria.
3-5.2 Outcome measures that describe if/how the program members contribute to outcomes such as innovation and collaboration, and that show if the program is leading toward performance-based changes in environmental protection.
Concur. This is a challenging issue that is at the cutting edge of program evaluation. We are consulting with experts for advice and are testing survey approaches to obtain better information from members on these measurement issues.
4-1. Maintain a centralized database for compliance screening information and decisions on Performance Track members.
Concur. Performance Track began using a centralized database for compliance screening in January of 2006, and we continue to enhance the program’s database.
4-2. Encourage member facilities to set and achieve commitments so that the public has a clear idea of what members actually will achieve.
38

Appendix B
Detailed Scope and Methodology We conducted this evaluation from June through October 2006. We performed our evaluation in accordance with Government Auditing Standards, issued by the Comptroller General of the United States.
We drew criteria from the Government Performance and Results Act, the Office of Management and Budget (OMB) Program Assessment Rating Tool (PART), EPA program management guidance, and meetings with Performance Track management.
We examined management controls and program performance measurement as they related to our objectives.
We used Microsoft Excel for all calculations, figures, and graphs.
Scope Limitations
For this evaluation, we did not address • State programs • Member characteristics • Incentives—quality, implementation, or potential impacts • Public outreach aspects • Quality of EMSs at facilities • Performance Track site visits
We also did not assess the validity of commitments or baselines, nor did we compare commitments with sectors to determine if facilities set commitments related to their most important environmental impacts. Performance Track staff told us that they worked with facilities to encourage setting commitments related to Environmental Management System “significant aspects.”
We could not compare Performance Track member progress with nonmember progress because there is no reporting requirement for nonregulatory issues. Therefore, we could not determine if facilities associated with Performance Track were more likely to make improvements.
Sample Selection
On August 3, 2006, we compiled a list of the 385 Performance Track members at that time using the Performance Track Online database. 37 We eliminated 1 of the 17 sectors from our sample, “arts, recreation, and entertainment,” because it did not have as many compliance requirements
37The Performance Track program accepted new members during the course of our evaluation. Membership also fluctuates regularly based on withdrawals. Because Performance Track added a new class of members in October, as of November 3, 2006, the program had 417 members.
39

as the others, and we planned to compare compliance. This left 357 members to sample from in 16 sectors, and led to selecting a sample including 40 members. The sample represents 11 percent of members and gives a 95 percent confidence and a 15 percent margin of error. Our randomly selected sample covered 14 sectors; it did not include “machinery equipment” or “textile products.”
Distribution of OIG Performance Track Sample by Sector
POPULATION SAMPLE
sector #
members % #
members % 1 chemical products 48 13.4 6 15.0 2 electronic and electrical equipment 49 13.7 7 17.5 3 energy, utilities, and sanitary service 14 3.9 1 2.5 4 machinery equipment 9 2.5 0 0.0 5 medical equipment and supplies 23 6.4 2 5.0 6 metal products 20 5.6 2 5.0 7 mining and construction 6 1.7 1 2.5 8 miscellaneous manufacturing 9 2.5 2 5.0 9 miscellaneous nonmanufacturing 32 9.0 2 5.0 10 pharmaceutical products 30 8.4 5 12.5 11 research and education 19 5.3 3 7.5 12 rubber and plastics 26 7.3 3 7.5 13 textile products 5 1.4 0 0.0 14 transportation equipment and supplies 28 7.8 4 10.0 15 wholesale retail and shipping 6 1.7 1 2.5 16 wood products, paper, and printing 33 9.2 1 2.5
Total 357 100 40 100
Source: OIG and Performance Track database.
Database Verification
Performance Track staff provided us with access to the Performance Track databases so that we could retrieve information about commitments and accomplishments for individual facilities. We compiled information on the accuracy of the Performance Track database, and determined that it would provide sufficient accuracy for our evaluation.
OECA staff provided us with access and advice for using EPA's Online Tracking Information System (OTIS) to retrieve compliance data for sectors and for individual facilities. They recommended that we validate facility data with regional data stewards to ensure that they were accurate for our analysis. Because we could not check data for all members of sectors used for comparison, our data may demonstrate accuracy bias in favor of sample members. We retrieved data on sample facilities from OTIS between September 25 and 29, 2006, and asked each region
40

to validate the results from the data pull. Based on their responses, we modified two of our facility records, in both cases we reduced “quarters of noncompliance.”
Sample Analysis
We chose two EPA databases that provide environmental information on facility and industrial sector bases: OTIS, available to the public through the ECHO database; and the Toxic Release Inventory database (TRI), also available to the public. By comparing results for a Performance Track facility with the average results for its sector, we could demonstrate if a facility led or fell behind its sector average for compliance and toxic releases.38
We looked to compliance records to show if Performance Track facilities outperform their sectors for regulatory compliance. Performance Track facilities vary widely from concession stands to a petroleum refinery. EPA designed the program so that all types of facilities could become members. In assessing facility compliance, we used average sector compliance as a benchmark so that we did not compare across different facility types.
Toxic releases provide the public with information about facilities’ toxic emissions. While not illegal, toxic releases indicate environmental risk at a facility. Coglianese and Nash used toxic release data in assessing Performance Track facilities. They found that more than half of active members had a high relative risk for pounds of toxic releases.39 We compared members’ releases with those of their sectors, on average, for 2003, the most recent data year available. We also compared members’ toxic releases from year to year, marking their entrance to the Performance Track program to determine if Performance Track membership influenced toxic releases. 40
To collect and analyze facility data in our sample, each facility was accessed in the Performance Track Online database by member identification number, and each year's Annual Performance Report was used to document the following information:
• Commitment • Actual measurements • Cycle (one or two) • Normalized measurements • Baseline year • Normalizing factors (if applicable) • Measurement units • Beyond compliance index = (baseline actual -• Reporting year reporting year actual)/(baseline actual) • Baseline • Commitment achievement = third year of • Performance commitment/target reporting actual - performance commitment
38 Our analysis did not account for the number of inspections per facility. A Performance Track assessment indicated that member facilities were inspected slightly more frequently than nonmember facilities. Our analysis showed that most members in our sample (28 of 40) had been inspected more recently, 5 sample members had never been inspected, and in 7 cases, sectors, on average, were inspected more frequently than member facilities. This difference did not lead to a difference in compliance information for these facilities. 39 Coglianese and Nash, p. 16. 40 We collected information on toxic releases from EPA’s Toxics Release Inventory, which could only provide sector-wide data for 2003. We compiled current sector compliance data using EPA’s Online Tracking Information System. EPA’s Office of Enforcement and Compliance Assurance maintains this database monthly. These enforcement data were current as of September 1, 2006.
41

If there was more than one iteration of the same year's reporting, we used the most recent report (e.g., third of three reports).
The following items from the facility's most recent Annual Performance Report:
• Member ID • Parent company • Facility name • NAICS code • Facility type • ISO 14001 (yes/no) • Facility size (as broken down by
Performance Track)
To collect and summarize enforcement and compliance data for individual facilities (sample members), we entered the facility name into the "multimedia" search in OTIS. We collected the following information from OTIS (time frames represent the period of data reported in OTIS):
• Days since last inspection • Formal enforcement actions in past 5 • Number of statutes the facility is subject years
to (including minor sources) • Penalties in past 5 years • Quarters of noncompliance in past 3 • TRI releases for 2003
years • Change in TRI releases for 1996 • Current significant violations through 2004 (period of data • Number of onsite inspections in past 5 provided in OTIS)
years • Change in the number of chemicals • Number of informal enforcement actions reported from 1996 through 2004
(notices of violation) in past 5 years • TRI releases for 1996 through 2004
To summarize enforcement and compliance data for sectors, we entered NAICS codes into the multimedia search in OTIS. For facilities listing more than one NAICS code, we entered all NAICS codes present to compile a composite sector. We calculated the average number of regulations per facility by dividing the total number of entries by the number of unique facility IDs. We calculated the average days since an inspection by dividing the column for “days since last inspection” by the number of facilities. We used this same method to calculate the averages for the following:
• Quarters of noncompliance • Formal enforcement actions • Current SNC • Penalties. • Informal enforcement actions
For 2003 TRI releases, we also calculated the average for facilities that reported in that year and used this average for comparison with sample facilities.
We calculated a TRI ratio to compare facilities with their industrial sectors by dividing the facility's 2003 TRI emissions by the average TRI emissions for their composite sector.
We calculated commitment achievement and percent improvement over baselines for all sample facilities. The program moved to a “normalizing” scheme, by which facilities could choose a
42

unit of operations (as in unit of production) for adjusting their data reports. Each facility could choose a different factor for each commitment. The effect was to obscure actual pollution trend data, so we did not use “normalized” data for our analysis, with one exception: when a facility set a goal based on a “normalization factor,” we used normalized numbers to determine if the facility met its goal.
Overall Performance Track Members Analysis
To determine how Performance Track members, at large, performed on regulatory compliance, we used the OTIS database to select all Performance Track facilities on October 18, 2006. This search provided 500 facilities. We calculated the average days since an inspection by dividing the column for “days since last inspection” by the number of facilities, and noted how many facilities had never received an inspection. We used this same method to calculate the averages for the following:
• Quarters of noncompliance • Formal enforcement actions • Current SNC • Penalties • Informal enforcement actions • TRI releases for 2003
We subsequently compared this list of facilities with the list of Performance Track facilities in the Performance Track membership database on the same date. We compared facility names, addresses, cities, and zip codes to match OTIS-listed facilities with Performance Track member database facilities to determine what facilities composed the discrepancy between the databases.
43

Appendix C
Performance Track Criteria 1. 2.
Environmental Management System Public Outreach
The facility must adopt and implement an The facility must conduct public outreach and environmental management system (EMS) that performance reporting: includes the elements specified: 1. Identify and respond to community concerns 1. Written environmental policy 2. Inform the community of important matters 2. Written environmental plan 3. Report on facility EMS and performance 3. Implementation and operation plans commitments 4. Checking and corrective action 5. Management review
3. 4. Regulatory Compliance Environmental Performance Beyond
ComplianceThe facility must demonstrate a record of sustained compliance with environmental The facility must demonstrate specific past requirements; prohibitions for environmental achievements: 1. Environmentally-related criminal conviction 1. Past achievements (small facilities 1, large
or plea within past 5 years facilities 2) (a "small facility" is one with 2. Environmentally-related criminal conviction fewer than 50 employees)
or plea for an employee within past 5 years 2. Future commitments (small facilities 2, larger 3. Ongoing criminal investigation/prosecution facilities 4)
of corporation, corporate officer, or 3. Challenge commitments (count for two employee at the same facility for violations "future commitments" of environmental law a. Region I: reducing greenhouse gas
4. Three or more significant violations at the emissions by 5 percent facility in the past 3 years b. Region II: reducing energy use or mobile
5. Unresolved, unaddressed Significant Non- source air emissions by 10 percent or Compliance (SNC) or Significant Violations reducing non-mobile source air (SV) at the facility emissions by 20 percent
6. Planned but not yet filed judicial or c. Region VI: reduce their Nitrogen Oxide administrative action at the facility. (NOx) emissions or Volatile Organic
7. Ongoing EPA- or State-initiated litigation at Compound (VOC) releases by 15 the facility percent
8. Situation where a facility is not in 4. Membership in other EPA partnership compliance with the schedule and terms of programs helps the applicant an order or decree
9. Significant noncompliance overview specific to the related program office (Air, RCRA, Water)
Source: Performance Track document, Performance Track Program Guide.
44

Appendix D
Incentives and Rewards to Participation
Incentive Description Low Priority for Routine Inspections Performance Track facilities are deemed a low
priority for routine inspections by EPA. Extended Hazardous Waste Accumulation Time (Resource Conservation and Recovery Act [RCRA] 180-Day Incentive)
This incentive allows large quantity generators of hazardous waste who are Performance Track members up to 180 days, and in some cases 270 days, to accumulate their hazardous waste without a RCRA permit or interim status.
Reduced Reporting Frequency for Air Sources (Maximum Achievable Control Technology [MACT] Reporting Incentive)
This incentive reduces and simplifies the frequency of reports required under the MACT provisions of the Clean Air Act such that semi-annual reports may be submitted annually.
Water Incentives EPA encourages States to provide more favorable terms to Performance Track facilities in their Clean Water State Revolving Fund programs.
Reward Description EPA Recognition Press releases, letters to elected officials, trade
journal articles, and other EPA-generated recognition for participation.
Networking With other Performance Track facilities, though conferences, regular conference calls, facility events
Green Investing Four investment firms used Performance Track membership as an indicator of corporate responsibility.
Source: EPA Performance Track Website, www.epa.gov/performancetrack/benefits/index.htm.
45

Appendix E
Performance Track Commitments*
Commitment Category Indicator
Times selected by sample facilities
1 Waste Waste, nonhazardous 42 2 Energy Use Total (nontransportation) energy use by fuel type 37 3 Water Use Total water used 34 4
Waste Hazardous waste generation, broken down by management method (total or specific) 29
5 Material Use Materials used (total or specific) 16 6 Air Emissions Total Greenhouse Gases 12 7 Material Procurement Recycled content (total or specific) 10 8 Material Use Hazardous materials used (total or specific) 10 9 Land and Habitat Land and habitat conservation and restoration 10 10
Air Emissions Volatile Organic Compounds (VOCs, total or specific) 8
11 Air Emissions Nitrogen Oxides (NOx) 7 12 Air Emissions Air toxics (Total or specific) 5 13 Discharges to Water Biological Oxygen Demand (BOD) 5 14 Material Procurement Hazardous/toxic components (total or specific) 3 15 Accidental Releases Accidental Releases 3 16 Suppliers' Environmental
Performance Packaging materials 2 17 Energy Use Transportation energy use (total or specific) 2 18 Discharges to Water Toxics (total or specific) 2 19
Discharges to Water
Chemical Oxygen Demand (COD), Biological Oxygen Demand (BOD), and Total Suspended Solids (TSS) 1
20 Material Use Ozone depleting substances used (total or specific) 1 21 Material Use Total packaging materials used 1 22 Air Emissions Sulfur Oxides (SOx) 1 23 Air Emissions Odor 1 24 Discharges to Water Total suspended solids (TSS) 1 25 Noise Noise 1 26 Selective Catalytic Reduction (SCR)
Catalyst 1 27 Air Emissions Carbon Oxides (CO) 0
46
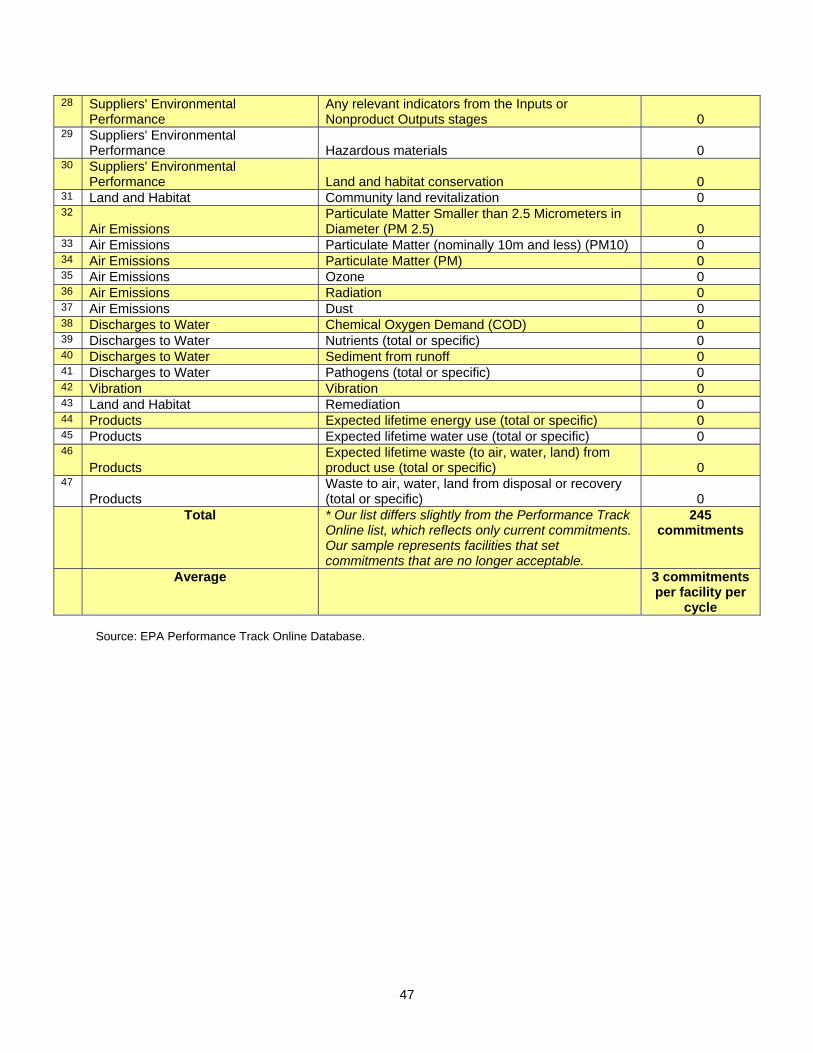
28 Suppliers' Environmental Performance
Any relevant indicators from the Inputs or Nonproduct Outputs stages 0
29 Suppliers' Environmental Performance Hazardous materials 0
30 Suppliers' Environmental Performance Land and habitat conservation 0
31 Land and Habitat Community land revitalization 0 32
Air Emissions Particulate Matter Smaller than 2.5 Micrometers in Diameter (PM 2.5) 0
33 Air Emissions Particulate Matter (nominally 10m and less) (PM10) 0 34 Air Emissions Particulate Matter (PM) 0 35 Air Emissions Ozone 0 36 Air Emissions Radiation 0 37 Air Emissions Dust 0 38 Discharges to Water Chemical Oxygen Demand (COD) 0 39 Discharges to Water Nutrients (total or specific) 0 40 Discharges to Water Sediment from runoff 0 41 Discharges to Water Pathogens (total or specific) 0 42 Vibration Vibration 0 43 Land and Habitat Remediation 0 44 Products Expected lifetime energy use (total or specific) 0 45 Products Expected lifetime water use (total or specific) 0 46
Products Expected lifetime waste (to air, water, land) from product use (total or specific) 0
47
Products Waste to air, water, land from disposal or recovery (total or specific) 0
Total * Our list differs slightly from the Performance Track Online list, which reflects only current commitments. Our sample represents facilities that set commitments that are no longer acceptable.
245 commitments
Average 3 commitments per facility per
cycle
Source: EPA Performance Track Online Database.
47

Appendix F Detailed Program Logic Model
48
INPUTS ACTIVITIES* OUTPUTS* SHORT TERM OUTCOMES EPA END OUTCOMES (Agency Goals)
Extramural budget: $2.3 million/year#
Staff: 27-29 FTE
19 headquarters 7-10 Regions
Members: 417 as of 10/12/06
1. Increased membership and expanded ownership of program
4. States & EPA have institutionalized PT
3. Membership yields greater business value
Improved human health and environment (ecosystems)
#EPA Goal 5.4: Improve Environmental Performance Through Pollution Prevention and Innovation
5. Well-managed & effective program
Increased collaboration between EPA and high-performing companies and other stakeholders
EPA and state agencies become more dynamic & flexible in solving env. problems
Incorporation into Agency/ State regulations & guidance
2. Measurable member environmental improvements
Create conditions under which innovative solutions can be achieved
INTERMEDIATE OUTCOMES
Site visits
Annual Performance Reporting & Review 1. Member results analysis & reporting Annual report (# correct APRs rec’d) 2. Maintain env. reporting framework
Active partnerships with NGOs
More members & corporate leaders
Increased number of member commitments & env results
Publicly available member environmental results
Feedback from members
More meaningful Incentives are available to more
Increase firms using PT membership for socially-responsible investing
Increased # of state MOAs & grants
Increased # state programs similar to PT
Member survey & PTrack Hotline
Outreach to & work w/ States
Incentives Development & Improvement (# incentives, # members using each)
Work with stakeholders (# mtgs, # stakeholder suggests adopted)
Collaboration with EPA Program Offices -Incorporate PT in PPA / NPM
Recognition Provide Recognition to members (#events, awards, certif, etc.)
Membership 1. Publicize program & members (# publicity events) 2. Member recruitment (# applications) 3. Application & renewal review (facility & corporate leaders) (# reviews) 4. Monitor Member Compliance (# members in compliance, # out, Resolution)
Members motivated to improve environment
Ensure high quality members
Joint initiatives (chall. Commts, ambient monitoring, etc.)
Reduced environmental footprint of members & potential members
Enable EPA and State environmental agencies to achieve better environmental
Recog. of env. leadership
Public awareness of value of PT Brand
More businesses qualify for PT by improving their env.

Appendix G Data Analysis Results
Figure G.1: Commitment achievement for Performance Track facilities.
Commitment Achievement by Facility
sam
ple
mem
ber
30 29 28 27 26 25 24 23 22 21 20 19 18 17 16 15 14 13 12 11 10 9 8 7 6 5 4 3 2 1
0.00 0.25 0.50 0.75 1.00
achievement ratio
Figure G.2: Commitments achieved at cycle completion for Performance Track facilities.
Commitment Achievement
Air toxics (Total or specific)
COD, BOD, and TSS
Total suspended solids
SOx
Waste, nonhazardous
NOx
Hazardous waste generation, broken down by management method(Total or specific)
Total water used
Materials used (Total or specific)
VOCs (Total or specific)
Total (non-transportation) energy use by fuel type
Total GHGs
Hazardous materials used (Total or specific)
Accidental Releases
BOD
Land and habitat restoration
Recycled content (Total or specific)
Toxics (Total or specific)
0.000 0.250 0.500 0.750 1.000
achievement ratio
49

Figure G.3: Change in materials use for Performance Track facilities for program years 1-5, 2001 through 2005 results (tons).
150000
100000
50000
0 1
-50000
-100000
2 3 4 5
-150000
Figure G.4: Comparative compliance for sample facilities that did not outperform their sectors.
1 2
3
4
5
6
7
8
9
10 11
12
13
Primary Sector Miscellaneous ManufacturingChemical Products Wholesale, Retail, and Shipping Electronic and Electrical Equipment Research and Education Pharmaceutical Products Pharmaceutical Products Transportation Equipment and Supplies Transportation Equipment and Supplies Rubber and Plastics Products Chemical Products Wood Products, Paper, and Printing Research and Education
Quarters of noncompliance
Sample Member
Sector average
0.00 1.17 0.00 4.90
0.00 3.10
0.00 0.96
0.00 1.00
4.00 2.17
6.00 2.26
9.00 1.74
12.00 2.30
1.00 3.00 1.00 2.90
4.00 3.70
9.00 4.45
Significant violations
Sample Member
Sector average
0.00 0.02 0.00 0.23
0.00 0.09
0.00 0.02
0.00 0.04
0.00 0.08
0.00 0.08
0.00 0.13
0.00 0.12
0.00 0.13 0.00 0.12
0.00 0.14
0.00 0.39
Notices of violation Sample Member
Sector average
1.00 0.28 0.00 1.35
1.00 0.18
0.00 0.29
1.00 0.33
1.00 0.59
1.00 0.58
1.00 0.59
0.00 0.60
2.00 0.80 4.00 0.85
4.00 1.04
4.00 1.32
Enforcement actions
Sample Member
Sector average
0.00 0.12 1.00 0.76
0.00 0.18
1.00 0.08
0.00 0.14
0.00 0.34
0.00 0.34
0.00 0.37
0.00 0.30
0.00 0.41 0.00 0.48
3.00 0.67
0.00 0.41 Source for Appendix G: Office of the Inspector General, data from TRI and OTIS.
50

Appendix H
Distribution Administrator Deputy Administrator Audit Followup Coordinator, Office of the Administrator Agency Followup Official, Chief Financial Officer Agency Followup Coordinator Associate Administrator for Congressional and Intergovernmental Relations Associate Administrator for Public Affairs Acting General Counsel Acting Inspector General
51