performance tests for road aggregates and alternative materials
TRANSCRIPT

Performance Tests for Road Aggregates and Alternative Materials
Dr Greg Arnold, Pavespec Ltd
Dr Sabine Werkmeister, University of Canterbury
David Alabaster, Transit New Zealand Land Transport New Zealand Research Report 335

ISBN 978-0-478-30942-3 ISSN 1177-0600
© 2008, Land Transport New Zealand
PO Box 2840, 44 Victoria St, Wellington, New Zealand Telephone 64-4 894 5400; Facsimile 64-4 894 6100 Email: [email protected] Website: www.landtransport.govt.nz
Arnold, G., Werkemeister, S., Alabaster, D. 2008. Performance tests for road aggregates and alternative materials. Land Transport New Zealand Research Report 335. 102 pp.
Keywords: aggregates, deformation, New Zealand, performance specifications, recycled materials, repeated load triaxial, road surfacing, rutting, strain, stress, testing

An important note for the reader
Land Transport New Zealand is a crown entity established under the Land Transport Management Act 2003. The objective of Land Transport New Zealand is to allocate resources and to undertake its functions in a way that contributes to an integrated, safe, responsive and sustainable land transport system. Each year, Land Transport New Zealand invests a portion of its funds on research that contributes to this objective. This report is the final stage of a project commissioned by Transfund New Zealand before 2004, and is published by Land Transport New Zealand. While this report is believed to be correct at the time of its preparation, Land Transport New Zealand, and its employees and agents involved in its preparation and publication, cannot accept any liability for its contents or for any consequences arising from its use. People using the contents of the document, whether directly or indirectly, should apply and rely on their own skill and judgement. They should not rely on its contents in isolation from other sources of advice and information. If necessary, they should seek appropriate legal or other expert advice in relation to their own circumstances, and to the use of this report. The material contained in this report is the output of research and should not be construed in any way as policy adopted by Land Transport New Zealand but may be used in the formulation of future policy.

Abbreviations ARRB Australian Road Research Board CAPTIF Canterbury Accelerated Testing Indoor Facility CBR California Bearing Ratio ESA Equivalent Standard Axles FEM Finite Element Modelling LVDT Linear Variable Differential Transformer MDD Maximum Dry Density OMC Optimum Moisture Content RLT Repeated Load Triaxial

5
Contents
Executive summary......................................................................................................................7 Abstract ....................................................................................................................................8 1 Introduction ......................................................................................................................9 2 Background................................................................................................................... 11 3 Repeated load triaxial testing ....................................................................................... 12
3.1 What is RLT testing?............................................................................................... 12 3.2 Simplified Arnold/Nottingham test procedure and analysis .......................................... 13 3.3 Rut depth prediction with the Arnold/Nottingham method ........................................... 15
3.3.1 Methodology..................................................................................................... 15 3.3.2 Step 1: extrapolation and conversion to individual results ...................................... 15 3.3.3 Step 2: permanent strain rates and associates stress ............................................ 18 3.3.4 Step 3: equation parameters to predict permanent strain rate from stress ............... 18 3.3.5 Step 4: Finite element modelling to calculate stress and deformation ...................... 20 3.3.6 Use of the analysis method ................................................................................ 22
3.4 RLT testing methods used ....................................................................................... 22 3.5 ARRB RLT test method and analysis ......................................................................... 24
3.5.1 The method...................................................................................................... 24 3.5.2 ARRB/AUSTROADS simple categorisation analysis method...................................... 25 3.5.3 ARRB/AUSTROADS assessment based on deformation life ...................................... 27
4 RLT tests performed in this research ............................................................................ 29 4.1 Materials tested ..................................................................................................... 29 4.2 Sample preparation and target density and moisture content ...................................... 30 4.3 Results: RLT Arnold Test Method 1 (four stages)........................................................ 32 4.4 Results: ARRB/AUSTROADS method ......................................................................... 34
5 Analysis of the RLT tests............................................................................................... 35 5.1 Arnold/Nottingham method ..................................................................................... 35 5.2 The simplified ARRB method.................................................................................... 40 5.3 The complex ARRB method ..................................................................................... 42 5.4 Comparison........................................................................................................... 48
6 Development of a new simple RLT test method and analysis ........................................ 50 6.1 Introduction .......................................................................................................... 50 6.2 Six-stage RLT test.................................................................................................. 50 6.3 Results of the new six-stage RLT test ....................................................................... 52 6.4 Material classification from RLT tests ........................................................................ 59
7 Discussion and conclusions........................................................................................... 61 7.1 Discussion............................................................................................................. 61 7.2 Conclusions ........................................................................................................... 61
8 References .................................................................................................................... 62
Appendices ............................................................................................................................. 65

6

7
Executive summary
Surface rutting is of greatest concern for the thin-surfaced unbound granular
pavements that are common in New Zealand. Hence, a key parameter that
governs pavement longevity is the granular materials’ resistance to rutting
within the pavement. Thus, any alternative pavement materials used will be
required to resist rutting from within (i.e. resistance to deformation). In
existing TNZ specifications, more focus has been placed on limits determined
by a range of empirical performance tests (such as grading, broken faces,
crushing resistance, amount of fines, etc.) rather than a direct measure of
deformation resistance. It is unlikely that waste materials or mixtures of
waste and aggregate will meet the requirements of the specification and thus
their use is disallowed. However, these alternative pavement materials may,
in fact, be resistant to deformation and perform adequately in the pavement.
An opportunity to minimise waste in landfill and reduce the consumption of
raw materials may be missed.
The repeated load triaxial (RLT) apparatus (a device that applies repetitive
loading to simulate vehicle loading) was investigated as a suitable test for
use in basecourse specifications. The aim was to develop a test that could
determine a traffic loading limit for an aggregate used in the base/top layer
of the pavement. Ten different aggregates were tested using three different
testing methodologies and analysis methods. The first RLT test method
trialled required 4 stress stages with 50 000 load cycles applied for each
stage. This method found that the testing stresses applied were too high and
many early failures resulted; thus the results could not be analysed to rank
the materials. The second method used an AUSTROADS method which
applied three test stress stages at 10 000 load cycles per stage. However,
the AUSTROADS method showed a poor fit to the estimated traffic loading
limit based on anecdotal evidence of the performance of aggregates used in
actual roads (R2 of 0.1 and a mean error of 3 million ESA).
During this research project, undertaken in 2005/2006, a new six-stage RLT
test was developed with the aim of introducing lower testing stresses so that
most materials would survive at least four of the six stages of the test. RLT
tests from subsequent research projects and commercial tests were analysed
to predict rutting within a pavement profile tested at Transit New Zealand’s
accelerated pavement testing facility, CAPTIF. The results showed a good
ranking with 13 out of 14 analyses predicting the same performance (either
poor, average or good) as expected, based on actual performance at CAPTIF
and in the road from anecdotal evidence. It was found that a relationship
between average slope in the RLT test from 25 000 to 50 000 of all six stages
could be related to a traffic loading limit, which was recommended for use in
specifications.

PERFORMANCE TESTS FOR ROADING AGGREGATES AND ALTERNATIVE MATERIALS
8
Abstract
Aggregates used as base materials in thin-surfaced granular pavements
common to New Zealand contribute at least half the wheeltrack rutting and
roughness seen at the surface. Currently, no reliable cost-effective measure
of an aggregate’s resistance to rutting in specifications exists. Several test
methods using the repeated load triaxial (RLT) apparatus were investigated
for use in specifications for basecourse aggregates. Rut depth prediction
methods and pavement finite modelling were applied to the RLT results to
determine traffic loading limits for the aggregates tested. It was found that
the average slope from the six-stage RLT test was the best predictor of traffic
loading limit and this test was recommended for use in basecourse
specifications.

1 Introduction
9
1 Introduction
Road controlling authorities are progressively moving towards minimal use of traditional
aggregates and are using alternative aggregates (including marginal and recycled
materials) instead. Because of this, the need for improved, more accurate, cost-effective
methods to predict the performance of alternative pavement materials is increasing. A
drawback to using alternative and waste materials is their performance in the road is
unknown and difficult to assess. This is of particular concern when considering the use of
alternative and waste materials in New Zealand pavements, as they typically consist of a
thin surface overlying unbound granular materials.
Surface rutting is of greatest concern for the thin-surfaced unbound granular pavements
that are common in New Zealand. Hence, a key parameter that governs pavement
longevity is the granular materials’ resistance to rutting within the pavement layer. Any
alternative pavement materials used will be required to resist rutting from within (i.e.
resistance to deformation). In existing TNZ specifications, more focus has been placed on
limits determined by a range of empirical performance tests (such as grading, broken
faces, crushing resistance, amount of fines etc) than on a direct measure of deformation
resistance. It is therefore unlikely that waste materials or mixtures of waste and
aggregate will meet the requirements of the specification and thus their use is disallowed.
However, these alternative pavement materials may, in fact, be resistant to deformation
and perform adequately in the pavement. Thus an opportunity to minimise waste in
landfill and reduce the consumption of raw materials is missed.
Over recent years, a disproportionate number of new pavements have failed with
unacceptable rutting within the first few years of construction. A recurring theme of these
failures is that all the rutting occurs within the top 200 mm of aggregate. Traffic volumes,
meanwhile, are higher than ever before (in the past ten years, the volume of heavy
commercial vehicles has doubled). Research at Canterbury Accelerated Pavement Testing
Indoor Facility (CAPTIF) has also shown up to 70% of rutting can be determined to occur
in the top unbound granular layers (Arnold et al. 2001). Nearly half the rutting was
attributed to the sub-base layer in the American Association of State Highway Officials
road test (Benkelman 1962). Results at CAPTIF also showed that increasing the granular
pavement depth did not increase the pavement life obtained (i.e. number of wheel passes
required to form a 20 mm rut). However, it was shown that the type of granular material
used did have an affect on pavement life. Rounded aggregates had the lowest life, while a
lightly cemented recycled crushed concrete aggregate had twice the life of premium virgin
aggregates.
The current specification for basecourse aggregate (TNZ M/4 (Transit 2006)), owing to its
empirical/recipe approach to selecting aggregates, cannot distinguish differences in
performance between aggregate types. Furthermore, it is expected that a modified
aggregate with small quantities of cement or lime will provide superior performance in
terms of rut resistance in wet conditions to that of traditional TNZ M/4 compliant
PERFORMANCE TESTS FOR ROADING AGGREGATES AND ALTERNATIVE MATERIALS
10
aggregates where premature failures have occurred in the past. Anecdotal evidence of
this has been found in Northland, where a modified local GAP 65 aggregate, which did not
comply with TNZ M/4, was found to solve the rutting problems that were occurring with
traditional M/4 aggregates. The Transfield PSMC01 contract on State Highway 3 also
came to the same conclusion. Current methods of design do not recognise the superior
rut resistance of a local modified material which is not affected by moisture. Currently,
project specific specifications are required to use local modified aggregate. Thus, local
modified aggregates that could solve the rutting problems of traditional M/4 aggregates
are generally not used.
The outputs of this research project are a repeated load triaxial (RLT) test procedure and
associated analysis to predict the magnitude of rutting and allowable design loading.
Thiswill enable us to:
• reduce the number of early rutting failures in new pavements through the selection
of aggregates based on performance testing using the RLT apparatus and
associated analysis;
• develop a performance test using the RLT apparatus and associated analysis to
enable a traffic loading limit to be determined for use in aggregate specifications;
• enable the use of aggregates modified with cement through calculation of their
expected performance (traffic loading limit) from RLT testing; and
• enable the use of waste materials and previously discarded aggregates in
appropriate traffic and environmental conditions determined from performance
testing using the RLT apparatus.

2 Background
11
2 Background
ARRB Transport Research Ltd, in collaboration with Transit New Zealand, conducted the
2004/2005 Transfund Project 930 ‘Predicting In-Service Performance of Alternative
Pavement Materials’ to develop a practical method using laboratory RLT testing for
predicting the performance of alternative unbound pavement materials, including recycled
materials (Vuong & Arnold 2006). Research comparing RLT predictions against rut depth
measured in accelerated pavement tests (e.g. CAPTIF) has shown that this method can
correctly predict the performance of unbound pavement materials. Prior to introducing a
new RLT test into material specifications, field validation was required by conducting RLT
tests on a range of New Zealand aggregates of known performance (anecdotal or
otherwise). Hence, this research project was initiated with the following objectives:
• to trial, validate and refine the practical RLT test developed in Vuong & Arnold 2006
on materials currently used on New Zealand roads with known performance;
• to trial and validate the practical RLT test method into Transit’s policy (TNZ M/22)
as a means of categorising materials in terms of low, medium and high traffic, and
either wet or dry conditions;
• to evaluate the RLT test method to quantify the benefits of modifying/stabilising an
aggregate in terms of increasing number of wheel loads to reach a certain rut
depth; and
• to implement a test procedure that allows alternative materials (which includes
aggregates, marginal materials, stabilised materials, those from recycled sources
etc) to be used in the pavement with appropriate limits to the level of traffic and
moisture condition.

PERFORMANCE TESTS FOR ROADING AGGREGATES AND ALTERNATIVE MATERIALS
12
3 Repeated load triaxial testing
3.1 What is RLT testing?
The RLT apparatus applies repetitive loading on cylindrical materials for a range of
specified stress conditions; the output is deformation (shortening of the cylindrical
sample) versus number of load cycles (usually 50 000) for a particular set of stress
conditions. Multi-stage permanent strain RLT tests are used to obtain deformation curves
for a range of stress conditions to develop models for predicting rutting. Figures 3.1 and
3.2 detail the RLT setup and typical output from a multi-stage permanent strain RLT test.
Resilient modulus information can also be obtained for pavement design in CIRCLY and
Finite Element Models (FEMs).
Figure 3.1 RLT apparatus and setup at the CAPTIF facility.

3 Repeated load triaxial testing
13
Figure 3.2 Typical output from a permanent strain RLT test.
3.2 Simplified Arnold/Nottingham test procedure and analysis
A simplified version of the method developed by Arnold (2004) is one method used in this
study to interpret the results and to predict the rut depth in a pavement. It is referred to
as the simplified Arnold method because only one RLT test is needed, as opposed to three
RLT tests, as in the original Arnold method.
The first step is to develop a mathematical relationship between stress (both vertical and
horizontal) and permanent strain rate (slope of each deformation curves (Figure 3.2 and
3.3), e.g. % deformation per million load cycles).

PERFORMANCE TESTS FOR ROADING AGGREGATES AND ALTERNATIVE MATERIALS
14
εp_rate= e(a) e(bp) e(cq) - e(a) e(bp)
Where: a, b, c are constants; e = natural log number (2.718…)ε p
_ra
te
0.00
0.20
0.40
0.60
0.80
1.00
1.20
1.40
1.60
1.80
2.00
0.00 0.20 0.40 0.60 0.80
Princ ipal stress difference, q (MPa)
Perm
anent
stra
in r
ate
(%
/million)
(25k t
o 1
00k)
0.075
0.150
0.250
0.075
0.150
0.250
Mean principal stress, p
(MPa)
σ3
σ1σ3 = σ2cell pressure
σ3
σ1
σ2q = σ1 – σ3p = 1/3(σ1+σ2+σ3)
Figure 3.3 Fitting the permanent strain rate mathematical relationship to the RLT test results (shown in Figure 3.2).
Vuong & Arnold 2006 found that one RLT test at four different stress stages was required
to obtain enough points for the mathematical relationship shown in Figure 3.3. This
simplified Arnold RLT test procedure is detailed in Table 3.1 and was the RLT test method
initially used for testing aggregates for this study. Recently, the number of stress stages
tested was increased to six to include stresses at lower levels so that data from weaker
aggregates could be obtained. A seventh stress stage was trialled but later discarded as it
was a low stress level, causing virtually no deformation; it did, however, improve the
model predictions. It was found that using the four-stage test (Table 3.1), the weaker
aggregates (usually those that were saturated) would fail after the first or second stage in
the initial testing regime. The new stress levels used are detailed in Table 3.2.
Table 3.1 RLT testing stresses – (RLT Test Method 1).
RLT testing stress stage A B C D Deviator stress - q (kPa) (cyclic vertical stress)
180.0 270.0 330.0 420.0
Mean stress - p (kPa) 150.0 150.0 250.0 250.0 Cell pressure, σ3 (kPa) 90.0 60.0 140.0 110.0 Major principal vertical stress, σ1 (kPa)
270.0 330.0 470.0 530.0
Cyclic vertical loading speed
Haversine at 4 Hz
Number of loads (N) 50 000 Data recorded and reported electronically in Microsoft Excel
Permanent strain versus load cycles and resilient modulus versus load cycles
p = mean principal stress (1/3*(σ1 + 2*σ3) q = principal stress difference (σ1 - σ3)

3 Repeated load triaxial testing
15
Table 3.2 RLT testing stresses for six-stage test – (RLT Test Method 2).
RLT testing stress stage A B C D E F Deviator stress - q (kPa) (cyclic vertical stress)
90.0 100.0 100.0 180.0 330.0 420.0
Mean stress - p (kPa) 150.0 100.0 75.0 150.0 250.0 250.0 Cell pressure, σ3 (kPa) 120.0 66.7 41.7 90.0 140.0 110.0 Major principal vertical stress, σ1 (kPa) 210.0 166.7 141.7 270.0 470.0 530.0
Cyclic vertical loading speed Haversine at 4 Hz Number of loads (N) 50 000 Data recorded and reported electronically in Microsoft Excel
Permanent strain versus load cycles and resilient modulus versus load cycles
3.3 Rut depth prediction with the Arnold/Nottingham method
3.3.1 Methodology
The method used to predict rutting is reported in Arnold (2004). The following is a
summary of the steps involved in order to predict the rutting of a 300 mm deep pavement
at CAPTIF.
3.3.2 Step 1: extrapolation and conversion to individual results
The first step in rut depth prediction is to extrapolate the RLT results and individualise the
RLT results to one test per stress stage. A power law model (y=k1xk2) was used to
extrapolate the results to 500 000 load cycles from the 50 000 load cycles. From 500 000
load cycles onwards, a linear extrapolation following the same deformation rate that was
seen from 100 000 to 500 000 were used. The linear extrapolation is considered a
conservative approach and follows the same trend typically found in CAPTIF tests.
Another assumption used to extrapolate the results relates to adding on an incremental
permanent strain value to each new stress stage, being the permanent strain value at
10 000 load cycles for the previous load cycle. Figure 3.4 illustrates a typical extrapolation
method used.
Figure 3.4 Example of the extrapolation method used with the Arnold/Nottingham method.
Stress stage C – extrapolation
0.00
0.02
0.04
0.06
0.08
0.10
0 0.5 1 1.5 2
Load cycles (millions)
Perm
anen
t st
rain
%
Stress stage C – extrapolation
0.00
0.02
0.04
0.06
0.08
0.10
0 0.02 0.04 0.06 0.08 0.1 Load cycles (millions)
Perm
anen
t st
rain
%
Grey – actual Black - extrapolation

PERFORMANCE TESTS FOR ROADING AGGREGATES AND ALTERNATIVE MATERIALS
16
Assuming an additional 10 000 load cycles to achieve the initial deformation at the start
of each stage was based on a simplistic approach to the Australian Road Research Board
(ARRB) method (Vuong & Arnold 2006). Vuong & Arnold determined the initial load cycles
based on an iteration approach to determine the value that gave the best fit using the
mathematical model to extrapolate the deformations. Trialling Vuong and Arnold’s
approach required many iterations and was difficult to apply and hence, an assumed
10 000 load cycles were applied for the Arnold method. Furthermore, the 10 000 load
cycles were based on the point where the deformation curve begins to flatten and
stabilise, as observed in the RLT test (see Figure 3.5).
Figure 3.5 Transforming a multi-stage test result into a single stage.
Gidel et al. (2001) assumed that each new loading stage starts at nil deformation as if it
were a single stage test. The only argument against this approach is the amount of initial
deformation calculated is under-estimated, as found by Arnold (2004). Furthermore, Gidel
et al. have not validated their approach with accelerated pavement test data.
Finally, as the initial deformations in a multi-stage test are likely to be more prone to
error because of the influence of sample preparation/compaction, the Arnold method
separates the initial deformation after 25 000 load cycles from the long-term rate of
deformation in the calculation of rutting. It was found by doing this that the key criteria in
classifying the performance of an aggregate was the long-term rate of deformation; the
initial deformation showed a large scatter in the modelling and it could be ignored without
affecting the overall ranking of an aggregate’s performance (Arnold 2004). Also the initial
amount of rutting is insignificant for design traffic loadings greater than 5 million
Equivalent Standard Axles (ESA) as shown in Figure 3.6.
0
0.05
0.1
0.15
0.2
0.25
0.3
0 10 000 20 000 30 000 40 000 50 000 60 000 70 000 80 000 90 000 100 000 110 000 120 000 130 000 140 000
Number of load cycles
Perm
an
en
t st
rain
(%
)
Stage B Stage C
A
B
C
B'
C'
150 000
Stage A

3 Repeated load triaxial testing
17
Figure 3.6 Rut depth predicted for the CAPTIF 4 (70%OMC#2) aggregate.
Rut depth for CAPTIF 4 (70%OMC#2) (Total both subgrade and aggregate)
0
5
10
15
20
25
0 0.5 1 1.5 2 2.5 3 3.5 4 4.5 5
N (millions)
Rut
dep
th (
mm
)
Rut depth for CAPTIF 4 (70%OMC#2) (aggregate only - 0.9 mm/1M rutting rate)
0
5
10
15
20
25
0 5 10 15 20
N (millions)
Rut
dep
th (
mm
)

PERFORMANCE TESTS FOR ROADING AGGREGATES AND ALTERNATIVE MATERIALS
18
3.3.3 Step 2: permanent strain rates and associates stress
From the extrapolated RLT results, permanent strain rates and associated stresses are
determined (Table 3.3 is an example of results from one of the aggregates tested, CAPTIF
4 70%OMC #2).
Table 3.3 Permanent strain rates and associated stresses for the RLT Test Method 2.
Stress (MPa) Magnitude % Slope %/million load cycles
p q First 25k 25k to 50k 50k to 100k 100k to 500k
0.150 0.180 0.063 0.337 0.169 0.049
0.150 0.270 0.117 0.486 0.269 0.093
0.250 0.330 0.131 0.231 0.123 0.039
0.250 0.420 0.162 0.747 0.559 0.326
p = mean principal stress (1/3*(σ1 + 2*σ3) q = principal stress difference (σ1 - σ3)
3.3.4 Step 3: equation parameters to predict permanent strain rate from stress
Equation 1 taken from Arnold (2004) is used to determine the permanent strain rate for
any stress not tested. Parameters a, b and c are determined by using the solver in
Microsoft Excel to the actual measured and extrapolated values in the RLT test listed in
Table 3.3.
εp(rate or magn) = e(a) e(bp) e(cq) - e(a) e(bp)
= e(a) e(bp) (e(cq) – 1) Equation 1
Where:
e = 2.718282;
εp(rate or magn) = secant permanent strain rate or just permanent strain magnitude;
a, b & c = constants obtained by regression analysis fitted to the measured RLT data;
p = mean principal stress (MPa); and
q = mean principal stress difference (MPa).
An example of the using Equation 1 to fit the measured data is detailed in Figure 3.7.

3 Repeated load triaxial testing
19
Figure 3.7 Example of fitting permanent strain rate equation to the RLT data in Table 3.3.
Parameters a, b and c for Equation 1 for one of the aggregates tested are listed in
Table 3.4.
Table 3.4 Parameters a, b and c (Equation 1) for one of the aggregates tested (CAPTIF 4 70%OMC #2).
Model parameters (Arnold, 2004) εrate = e(a) e(bp) e(cq) - e(a) e(bp)
Mean error εrate
a b c εrate (%/million)
εmgn (25k) -3.195 -15.361 12.552 0.026
εrate (25k-50k) -1.864 -15.000 12.684 0.048
εrate (50k-100k) -2.906 -15.000 14.310 0.030
εrate (100k-500k) -4.214 -15.000 16.293 0.022
PERFORMANCE TESTS FOR ROADING AGGREGATES AND ALTERNATIVE MATERIALS
20
Granular material
Captif Subgrade
300 mm
1200 mm
550 kPa
C
C
3.3.5 Step 4: Finite element modelling to calculate stress and deformation
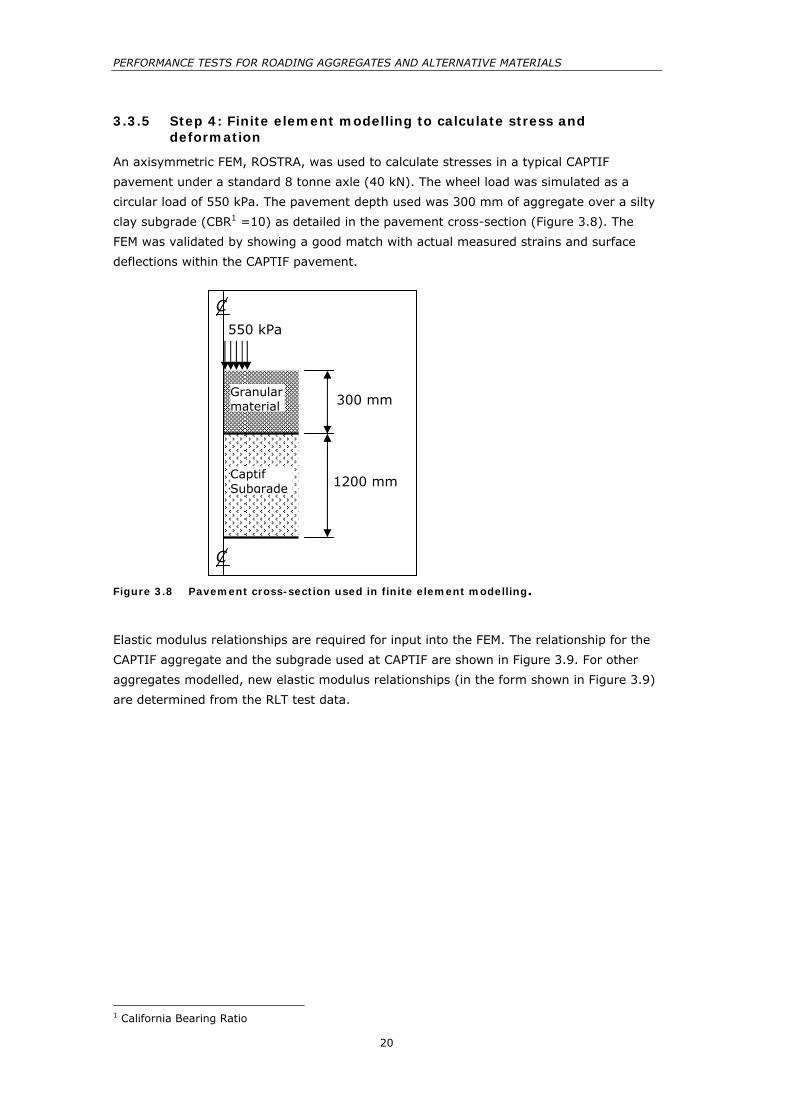
An axisymmetric FEM, ROSTRA, was used to calculate stresses in a typical CAPTIF
pavement under a standard 8 tonne axle (40 kN). The wheel load was simulated as a
circular load of 550 kPa. The pavement depth used was 300 mm of aggregate over a silty
clay subgrade (CBR1 =10) as detailed in the pavement cross-section (Figure 3.8). The
FEM was validated by showing a good match with actual measured strains and surface
deflections within the CAPTIF pavement. Figure 3.8 Pavement cross-section used in finite element modelling.
Elastic modulus relationships are required for input into the FEM. The relationship for the
CAPTIF aggregate and the subgrade used at CAPTIF are shown in Figure 3.9. For other
aggregates modelled, new elastic modulus relationships (in the form shown in Figure 3.9)
are determined from the RLT test data.
1 California Bearing Ratio

3 Repeated load triaxial testing
21
Figure 3.9 Elastic modulus relationships used in the FEM.
Running the FEM results in stresses under the wheel which are then imported into a
spreadsheet to calculate the permanent strain from Equation 1 with parameters from
Table 3.4. Table 3.5 details the results of the FEM and rut depth calculations for the
CAPTIF aggregate ‘CAPTIF 4, 70%OMC #2’ and the subgrade. Figure 3.6 illustrates the
result of the rut depth predictions.
Table 3.5 FEM and rut depth prediction for CAPTIF 4 aggregate 70%OMC#2 for CAPTIF cross-section.
Total pavement
Aggregate only
Rut depth (mm) after 1 million wheel passes
(ESA) (mm)
ESA to get 25 mm rut (Million ESA)
ESA to get 10 mm rut in aggregate. (Million ESA)
Long-term rate of rutting within
aggregate (mm per million ESA)
Total: 7.2 Aggregate: 1.5 Subgrade: 5.7
2.99 10.00 0.9

PERFORMANCE TESTS FOR ROADING AGGREGATES AND ALTERNATIVE MATERIALS
22
3.3.6 Use of the analysis method
The rut depth prediction method developed by Arnold determines two key parameters for
the assessment of an aggregate’s performance, being the long-term rate of rutting and
the number of heavy axle passes until rutting within the aggregate achieves 10 mm.
These rutting performance values will be used to compare aggregates to rank their
performance and for validating a more simplified analysis approach.
In the example shown in the first column of Table 3.5, the aggregate contributes to 21%
of the total rut depth in the CAPTIF pavement. One of the reasons for this is because the
aggregate tested in the RLT apparatus showed very low deformation and would rank as
one the best quality unbound aggregates tested from New Zealand. Another reason is the
difficulty in determining the initial amount of rutting/deformation from multi-staged tests,
as this value needs to be assumed. Also, the RLT test will consistently give lower
deformations than those which occur in a pavement because of the inability to rotate the
principal stresses and cyclic confining stress caused by an arriving and passing wheel
load, as detailed in Arnold’s thesis (2004). Hence, because of the difference between the
RLT test and real-life pavements, the analysis proposed is a tool to rank the performance
of granular materials based on the long-term rate of rutting for use in material
specifications rather as than an absolute predictor of pavement rut depth.
3.4 RLT testing methods used
The RLT testing methods adopted in this study are based on theapproaches developed by
Transit New Zealand (TNZ M/22 (Transit 2008)), AUSTROADS (Vuong 2000, Vuong &
Brimble 2000) and Nottingham University (Arnold 2004). These are summarised in
Table 3.6.
Generally, the test methods have different requirements for key features, such as:
• RLT testing equipment (triaxial cell, measurement devices, software),
• sample preparation methods (e.g. dynamic and vibratory compaction), and
• testing procedures (load pulse, stress levels, number of loading cycles, drained or
undrained).
In view of the great diversity of testing requirements for unbound granular materials, it is
considered necessary to conduct inter-laboratory precision studies to assess the
limitations of the testing method and standardise the testing requirements for practical
use. Currently, only the AUSTROADS RLT testing method has been subjected to inter-
laboratory precision studies (Vuong et al. 1998) for standardisation purpose, whereas
other test methods have not.
Different test methods also produce different test results and require different assessment
methods as discussed below.

3 Repeated load triaxial testing
23
Table 3.6 Summary of earlier RLT testing methods (from Vuong & Arnold 2006).
Features TNZ M/22 (Appendix A)
AUSTROADS (Appendix B)
Nottingham University (Appendix C)
Material size Maximum particle size in the range of 20–40 mm
Maximum particle size not exceeding 19 mm
Maximum particle size in the range of 20–40 mm
Sample size 150 mm diameter and 300 mm length
100 mm diameter and 200 mm length
150 mm diameter and 300 mm length
Sample preparation
Vibratory Hammer Compaction test in NZS 4402 (Standards New Zealand 1986)
Dynamic compaction methods Vibrating compaction test method (BS 1377-4: 1990 (British Standards Institution 1990))
Target density 95% Vibratory MDD (Maximum Dry Density) (TNZ B/2:2005)
Field dry density as specified by AUSTROADS Members
Field dry density
Moisture condition
Fully saturated condition or optimum moisture content (OMC)
Field moisture content as specified by AUSTROADS Members
Field moisture content
1-Dl RLT test apparatus (vertical loading pulse)
No specifications Trapezoidal pulse with 0.2 second load and 1.8 second rest (pneumatic equipment)
Sinusoidal pulse at 5 times a second (5 Hz) (hydraulic equipment)
Triaxial cell and instrumentation
No specifications Strict specifications of loading friction and loading piston-top cap connections when using external load cell and external displacement transducers
Using internal load cell and on-sample displacement transducers
Drainage condition
Undrained Drained Drained
Stress conditions for permanent strain testing
Single stage with a deviator stress of 425 kPa and a confining stress of 125 kPa
3 stages on one specimen with constant confining stress of 50 kPa and increasing deviator stresses being selected based on the vertical position of the material in the pavement (base, upper sub-base and lower sub-base)
21 stages using 3 specimens, viz. 7 stages per specimen with constant mean stresses and increasing shear stresses
Stress conditions for resilient modulus testing
As above 64 stress stages to cover stress levels at various positions in the pavement
As above
Number of specimens required
1 specimen per target density and moisture condition
1 specimen per target density and moisture condition
3 specimens per target density and moisture condition
Number of loading cycles
50 000 cycles of a specified stress level
10 000 cycles per stress stage 50 000 cycles per specified stress level
Stress and strain measurement methods
No specific measurement requirements for stress, strain and pore pressure
External load cell (for non-friction triaxial cell) and whole-sample strain measured with 2 LVDT*s mounted between loading caps
Internal load cell and on-sample strain measured at sample mid-half using studs embedded in the specimen at two opposite locations
Interpretation of test results
Trend of permanent strain rate with loading cycles
Individualisation of data for each stress stage by taking into account permanent strain developed in previous loading stages using a load equivalency rule
Individualisation of data for each stress stage by ignoring permanent strain developed in previous loading stages
Assessment criteria
Use decreasing permanent strain rate as pass-fail criterion
Simple assessment methods based on material behaviour, deformation life and design base deformation.
Compare predicted rut depth with design rut depth
Other assessment methods required
Minimum soaked CBR requirement of 80%
– –
* Linear Variable Differential Transformer

PERFORMANCE TESTS FOR ROADING AGGREGATES AND ALTERNATIVE MATERIALS
24
3.5 ARRB RLT test method and analysis
3.5.1 The method
AUSTROADS/ARRB Material Assessment was developed at ARRB (Vuong 2000) in
conjunction with the 2000 AUSTROADS simplified RLT test method (Vuong & Brimble
2000) so that the RLT permanent strain test results obtained with this test method can be
used to predict in-service performance.
The method was developed from using a FEM computer program (VMOD-PAVE) to predict
stresses in sprayed seal surfacing on granular pavements under an axle load of 40 kN on
a single wheel. This enabled the representative stress levels (or design stresses) to be
selected for the base, upper sub-base and lower sub-base. In addition, two other stress
levels, one below and one above the design stress level, were also selected to determine
the stress-dependent permanent strain characteristics for the assessment of the base
deformation caused by underloading or overloading.
The AUSTROADS column in Table 3.6 details the ARRB/AUSTROADS permanent strain test
while Table 3.7 lists the required values of vertical deviator stress (σd) and static confining
stress (σ3) for Stages 1, 2 and 3 for RLT testing of aggregates.
Table 3.7 Stress levels for ARRB/AUSTROADS permanent strain testing.
Permanent deformation stress levels Base Upper sub-base Lower sub-base Stress
stage number
σ3 (kPa)
σd (kPa)
σ3 (kPa)
σd (kPa)
σ3 (kPa)
σd (kPa)
1 50 350 50 250 50 150 2 50 450 50 350 50 250 3 50 550 50 450 50 350
Figure 3.10 shows typical results obtained from permanent strain testing using the
AUSTROADS standard RLT test method APRG 00/33 (Vuong & Brimble 2000) for a
granular base material to be used at depth of 0–150 mm below the surface. Referring to
Figure 3.10, three loading stages were applied to the single specimen compacted to
specified density and moisture condition, each involving 10 000 cycles at a stress condition
of specified dynamic deviator stress and static confining stress as given in Table 3.7.

3 Repeated load triaxial testing
25
Figure 3.10 Typical results obtained from permanent deformation testing using the AUSTROADS/ARRB method.
3.5.2 ARRB/AUSTROADS simple categorisation analysis method.
The results of the three-stage permanent strain test as shown in Figure 3.10 can be used
to derive the basic material behaviour, deformation life and design base deformation
using three simple assessment methods (Vuong 2000) as briefly described below.
In principle, the material performance can be judged based on three basic material
behaviour modes that can exhibit at a given loading stress as follows:
• Stable behaviour is defined as a decreasing permanent strain rate and a decreasing
to constant resilient strain with increasing loading cycles.
• Unstable behaviour is defined as a decreasing to constant permanent strain rate
and a constant to increasing resilient strain with increasing loading cycles.
• Failure behaviour is defined as a constant to increasing rate of permanent strain
and an increasing resilient strain with increasing loading cycles, or when the total
permanent strain reaches a nominal failure strain observed in the static triaxial
shear test (say in the range of 15 000–20 000 microstrain).
Table 3.8 summarises the proposed behavioural requirements that a material should
exhibit in a three-stage permanent strain test, and these tests can be used to select a
base material for use in different pavement classes subjected to light, medium and heavy
traffic. Referring to Table 3.8:
• For pavements subjected to light traffic (<106 ESA), it is considered appropriate to
allow a constant deformation rate in the base layer at the design stress level under
a 40 kN wheel load (Stage 2). In this case, the basecourse is considered to have
0
2000
4000
6000
8000
10 000
12 000
14 000
0 5000 10 000 15 000 20 000 25 000 30 000
Loading cycles (N)
Str
ain
(m
icro
stra
in)
Permanent strain – ext Permanent strain – int Resilient strain – ext
Resilient strain – int
Stage 1: 50 kPa static confining stress and 350 kPa dynamic deviator stress
Stage 2: 50 kPa static confining pressure and 450 kPa dynamic deviator stress
Stage 3: 50 kPa static confining pressure and 550 kPa deviator stress

PERFORMANCE TESTS FOR ROADING AGGREGATES AND ALTERNATIVE MATERIALS
26
passed if the results of permanent strain RLT testing show that the basecourse
material exhibits stable behaviour in Stage 1 and unstable behaviour in Stage 2.
• For pavements subjected to medium traffic(106–107 ESA), where potential for
higher traffic loads exists, it is considered appropriate to allow a decreasing
deformation rate in the base layer at the critical stress level under a 40 kN wheel
load (Stage 2). In this case, the base material is considered to have passed if the
results of permanent strain RLT testing show that the base material exhibits stable
behaviour in Stage 2 and may exhibit failure in Stage 3.
• For pavements subjected to heavy traffic, the stresses in the pavement should
reach the stresses in Stage 3. It is considered appropriate to allow a decreasing
deformation rate in the base layer at the stress level in Stage 3. In this case, the
base material is considered to have passed if the results of permanent strain RLT
testing show that the base material exhibits stable behaviour in Stage 2 and
unstable behaviour in Stage 3.
Table 3.8 Requirements of material behaviour for granular bases (Vuong 2000).
Loading stress (kPa) Behaviour requirements of granular
bases Stage
Static confining Dynamic deviator
<106 ESA 106–107 ESA >107 ESA
Stage 1 50 350 Stable Stable Stable Stage 2* 50 450 Unstable Stable Stable Stage 3 50 550 Failed Unstable to
failed Stable to unstable
*Design stress level
A similar procedure is used for the assessment of upper sub-base and lower sub-base
materials. In addition, the resilient moduli are also compared for material ranking.
This assessment method is simple and is suitable for the purpose of material ranking in
specifications. However, the results in this research aim to validate the procedure with
field performance data for pavement conditions in Australia and New Zealand.

3 Repeated load triaxial testing
27
3.5.3 ARRB/AUSTROADS assessment based on deformation life
Material performance can also be judged based on the number of loading cycles at a given
loading stress required to reach a failure condition or deformation limit. This method
involves curve fitting and extrapolation to determine the number of loading cycles
required at each stage to reach a nominal permanent strain limit for failure, e.g. 15 000
microstrain. Full details of this analysis method are given in Vuong & Arnold (2006).
In this case, a curve fitting procedure is used to determine the relationship between
permanent strain and loading cycles for different stress levels applied in the three-stage
loading test. From these relationships, the number of loading cycles required to reach a
nominal failure strain (e.g. 15 000 microstrain) can be calculated and plotted against the
applied stress, as shown in Figure 3.11. Referring to Figure 3.11, the loading cycles
required to reach failure at the design stress in Stage 2 (or design deformation life), and
deformation lives for other stress levels outside the tested stress range (by means of
extrapolation) can be used in material assessment.
Figure 3.11 Example of the relationship between granular base deformation life and stress level.
Figure 3.12 also shows the proposed requirements of minimum deformation life (Vuong
2000), which can be used to select materials for use in different pavement classes
subjected to different design lives. Referring to Figure 3.12, each line of minimum
deformation life is defined by the minimum design deformation life at the critical design
stress in Stage 2 and strength limits (stress that causes failure in one cycle). It was
considered appropriate to use:
• the minimum design deformation life at the critical design stress as the criterion for
terminal rut depths; and
• the minimum strength limit as the criterion for protection against overloading, viz.
low strength base materials (minimum strength = 600 kPa) being used in low-
traffic local roads (105 ESA) and high strength base materials (strengths >800 kPa)
used in high class heavy-duty roads (>107 ESA).
1.E+00 1.E+01 1.E+02 1.E+03 1.E+04 1.E+05 1.E+06 1.E+07 1.E+08 1.E+09 1.E+10 1.E+11 1.E+12 1.E+13 1.E+14 1.E+15 1.E+16
200.0 300.0 400.0 500.0 600.0 700.0 800.0 Repeated deviator stress (kPa)
Nu
mb
er
of
cycl
es
to f
ail
ure Estimated
maximum designtraffic
Estimated strength
Design stress

PERFORMANCE TESTS FOR ROADING AGGREGATES AND ALTERNATIVE MATERIALS
28
In this case, the basecourse is considered to have passed for a specific pavement design
life if the results of permanent strain RLT testing show that the basecourse material has
greater deformation lives for the three loading stages than the required minimum
deformation lives (i.e. on the right-hand side of each curve for the design life concerned).
Examples of two materials, A and B, are also shown in Figure 3.12. Material A is
considered to have a better performance than Material B, as the results of the permanent
strain RLT testing show that Material A produces higher deformation lives for all stress
levels. In addition, based on the proposed requirements of minimum deformation life,
Material A is considered suitable for pavements with a design traffic of <107 ESA; Material
B is suitable for pavements with a design traffic of <106 ESA.
Figure 3.12 Boundaries of deformation life and strength for different pavement classes.
This method is more versatile than the assessment method based on material behaviour
(see Chapter 3.5.2) as it can be used for a designated pavement design life. This
assessment method is used on the RLT results for several New Zealand aggregates tested
of known field performance in this study to validate the method.
1.E+00
1.E+01
1.E+02
1.E+03
1.E+04
1.E+05
1.E+06
1.E+07
1.E+08
1.E+09
1.E+10
200.0 300.0 400.0 500.0 600.0 700.0 800.0 900.0 1000.0
Repeated deviator stress (kPa)
Nu
mb
er
of
cycl
es
to f
ail
ure
Material A Material B
108 ESAs
107 ESAs
106 ESAs
105 ESAs
Design stress

4 RLT tests performed in this research
29
4 RLT tests performed in this research
4.1 Materials tested
Both the Arnold and ARRB method were trialled on ten different basecourse aggregates
sourced throughout New Zealand. The aggregates conformed to TNZ M/4 (Transit 2006)
specification. The aggregates investigated came from different sources:
• Stevensons Drury Quarry;
• Pound Road Quarry as used in accelerated pavement tests at CAPTIF (Greywacke: 3
materials):
- AP40 (CAPTIF 1),
- AP40 + 5% silty clay fines (CAPTIF 2),
- AP20 (CAPTIF 4);
• Poplar Lane Quarry;
• Hunua Quarry (GAP40);
• Oreti River Quarry;
• Waitakere Quarry;
• Tauhara Quarry (dacite);
• Cement modified basecourse aggregate.
Results are referred to as Materials 1, 2, 3… in a different order from the above to keep
the results confidential. This is because of the possible sensitivity of the results and
because further analysis and tests are yet to be conducted before any conclusions
regarding the actual performance of the aggregates are obtained.
Materials that have some anecdotal evidence of field performance were selected for these
tests. Field performance results of Materials 1, 2 and 4 are estimated in Table 4.1 below.
Estimates of traffic loading limits were based on the assumption that a good aggregate
should provide adequate performance between 8 and 15 million ESA. Poor aggregates
only last up to 1 million ESA, based on materials that have been involved in early
pavement failures.
Table 4.1 Material confidential ID and estimated rutting performance.

PERFORMANCE TESTS FOR ROADING AGGREGATES AND ALTERNATIVE MATERIALS
30
Material #
Rutting performance
Estimated traffic loading limit when
wet (million ESA)
Estimated traffic loading limit
when dry (million ESA)
Remarks
1 Good 8 15 CAPTIF 1 – TNZ M/4 AP40; Greywacke – material from CAPTIF tests
2 Poor when wet 1 10 CAPTIF 2 – TNZ M/4 AP40; Greywacke + 5% silty clay fines – material from CAPTIF tests
3 Good 8 15 CAPTIF 4 – TNZ M/4 AP20; Greywacke – material from CAPTIF tests
4 Good 10 15 Hard stone with good control on shape and grading at the quarry
5 Poor 1 5 Involved in early pavement rutting failure
6 Poor 1 5 Involved in early pavement rutting failure
7 Average 3 6 No reported performance
8 Poor when wet 1 8 Involved in early pavement rutting failure
9 Average 3 6 No reported performance
10 Good 10 15 Material #8 modified with cement – should give good performance
4.2 Sample preparation and target density and moisture content
Both the Arnold and ARRB RLT test methodologies were conducted on all the aggregates
at a dry condition (70% OMC, referred to as dry) and repeated in a nearly saturated
condition (100% OMC, referred to as wet) (Table 4.2). The target dry density was 95% of
MDD (Maximum Dry Density), which is the same as the minimum allowable density in the
TNZ B/2 specification for basecourse construction (Transit 2005). Despite these targets, it
was often difficult to obtain the target density and moisture content. For most aggregates
tested in the wet condition, the water leaked out of the specimen during RLT testing and
the final moisture content was much less than the original 100% OMC used in compaction
of the specimen. RLT samples are compacted for one minute using a vibrating hammer
complying with NZS 4402: Test 4.1.3 (Standards New Zealand 1986) with a surcharge
weight of 25 kg in 5 layers in a split mould 150 mm diameter and 300mm in length.
Figure 4.1 shows a picture of the method of compaction used.

4 RLT tests performed in this research
31
Table 4.2 RLT Target density and moisture content values.
Repeated load triaxial testing
RLT Test per aggregate: Dry Wet
Target OMC: % of OMCa
70 100
Target degree of compaction: % of MDDb
95 95
a OMC = Optimum moisture content (NZS 4402: Test 4.1.3). b MDD = Maximum dry density from Vibrating Hammer Compaction Test (NZS 4402: Test4.1.3)
Figure 4.1 Equipment used for compacting RLT test specimens.
Tests were only conducted once in the RLT apparatus because of time and funding
constraints. However, the repeatability of the RLT test results should be the subject of a
separate study.
PERFORMANCE TESTS FOR ROADING AGGREGATES AND ALTERNATIVE MATERIALS
32
4.3 Results: RLT Arnold Test Method 1 (four stages)
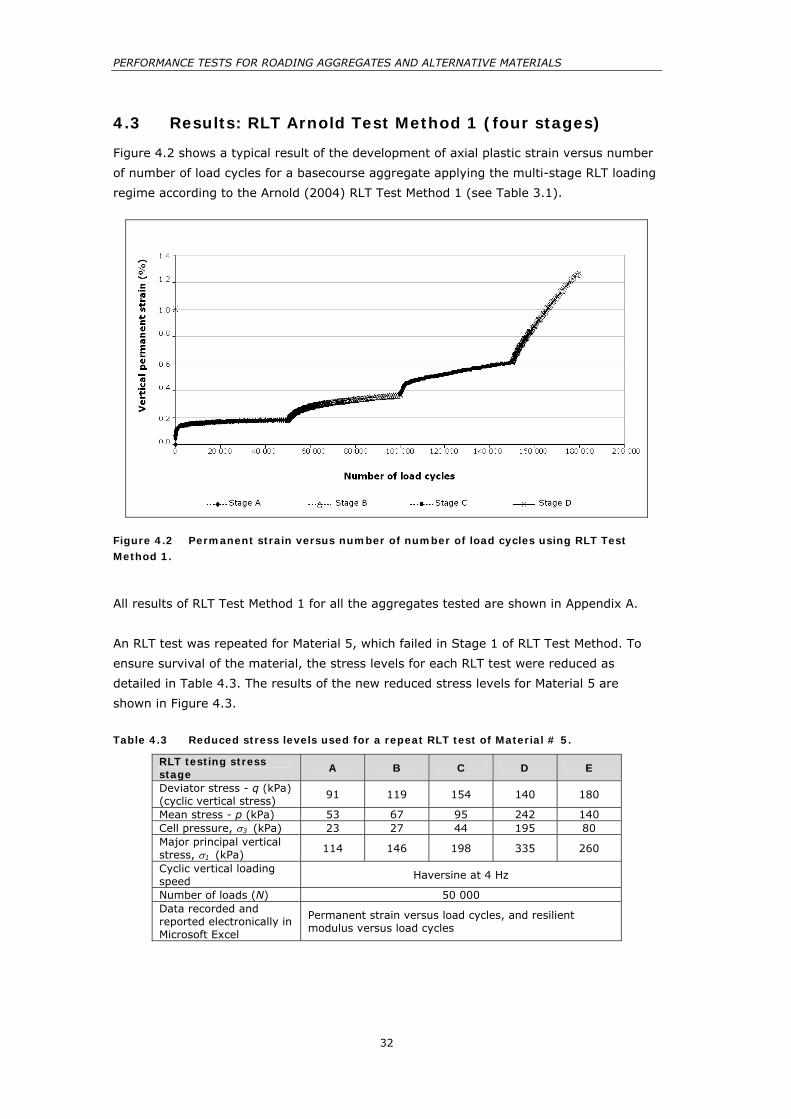
Figure 4.2 shows a typical result of the development of axial plastic strain versus number
of number of load cycles for a basecourse aggregate applying the multi-stage RLT loading
regime according to the Arnold (2004) RLT Test Method 1 (see Table 3.1).
Figure 4.2 Permanent strain versus number of number of load cycles using RLT Test Method 1.
All results of RLT Test Method 1 for all the aggregates tested are shown in Appendix A.
An RLT test was repeated for Material 5, which failed in Stage 1 of RLT Test Method. To
ensure survival of the material, the stress levels for each RLT test were reduced as
detailed in Table 4.3. The results of the new reduced stress levels for Material 5 are
shown in Figure 4.3.
Table 4.3 Reduced stress levels used for a repeat RLT test of Material # 5.
RLT testing stress stage
A B C D E
Deviator stress - q (kPa) (cyclic vertical stress)
91 119 154 140 180
Mean stress - p (kPa) 53 67 95 242 140 Cell pressure, σ3 (kPa) 23 27 44 195 80 Major principal vertical stress, σ1 (kPa) 114 146 198 335 260
Cyclic vertical loading speed
Haversine at 4 Hz
Number of loads (N) 50 000 Data recorded and reported electronically in Microsoft Excel
Permanent strain versus load cycles, and resilient modulus versus load cycles

4 RLT tests performed in this research
33
Figure 4.3 Test 5c - Material 5 (reduced stress levels);Dry: 93% MDD, 68% OMC.

PERFORMANCE TESTS FOR ROADING AGGREGATES AND ALTERNATIVE MATERIALS
34
4.4 Results: ARRB/AUSTROADS method
Opus Central Laboratories in Lower Hutt tested Materials 4 to 10 using the proposed
ARRB/AUSTROADS three-stage RLT test (detailed in Chapter 3.5). The raw results of this
testing are shown in Appendix B with an example shown in Figure 4.4. Both permanent
and resilient strains from the RLT tests are used in the assessment procedure.
Figure 4.4 Example of RLT test results using the ARRB/AUSTROADS method.
Material # 4 (dry)
0.000
0.020
0.040
0.060
0.080
0.100
0.120
0.140
0.160
0.180
0.200
0 5000 10 000 15 000 20 000 25 000 30 000 35 000
Perm
anen
t st
rain
(%
)
Load cycles (N)
Material # 4 (wet)
0.000
0.020
0.040
0.060
0.080
0.100
0.120
0.140
0.160
0.180
0.200
0 5000 10 000 15 000 20 000 25 000 30 000 35 000 Load cycles (N)
Perm
anen
t st
rain
(%
)
Material # 4 (dry)
0
200
400
600
800
1000
1200
0 5000 10 000 15 000 20 000 25 000 30 000 35 000
Load cycles (N)
Res
ilien
t st
rain
(10
-6)
Material # 4 (wet)
0
200
400
600
800
1000
1200
0 5000 10 000 15 000 20 000 25 000 30 000 35 000
Load cycles (N)
Res
ilien
t st
rain
(10
-6)
Material # 4 (dry)
0
100
200
300
400
500
600
700
800
0 5000 10 000 15 000 20 000 25 000 30 000 35 000 Load cycles (N)
Res
ilien
t m
odulu
s (M
Pa)
Material # 4 (wet)
0 100 200 300 400 500 600 700 800
0 5000 10 000 15 000 20 000 25 000 30 000 35 000 Load cycles (N)
Res
ilien
t m
odulu
s (M
Pa)
5 Analysis of the RLT tests
35
5 Analysis of the RLT tests
5.1 Arnold/Nottingham method
Results of the RLT testing reported in Chapter 4.4 were analysed to predict rutting in a
granular pavement used at CAPTIF using the methodology detailed in Chapter 3.4.
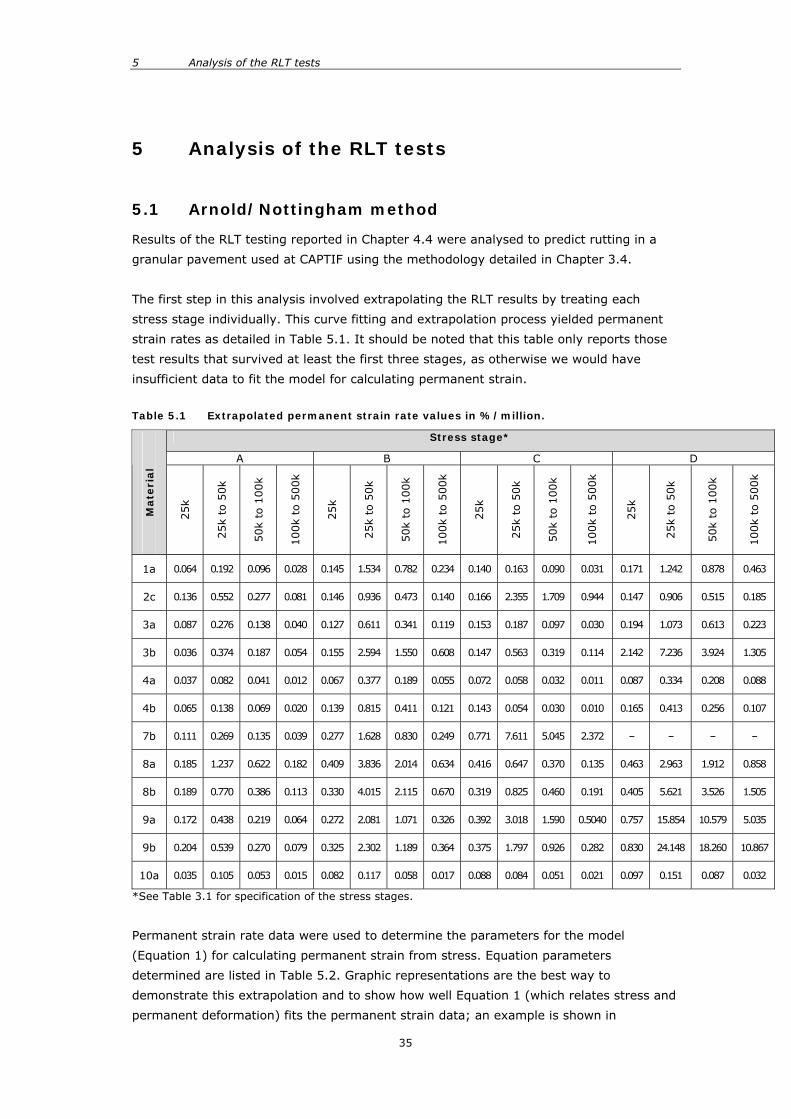
The first step in this analysis involved extrapolating the RLT results by treating each
stress stage individually. This curve fitting and extrapolation process yielded permanent
strain rates as detailed in Table 5.1. It should be noted that this table only reports those
test results that survived at least the first three stages, as otherwise we would have
insufficient data to fit the model for calculating permanent strain.
Table 5.1 Extrapolated permanent strain rate values in %/million.
Stress stage*
A B C D
Mate
rial
25k
25k
to 5
0k
50k
to 1
00k
100k
to 5
00k
25k
25k
to 5
0k
50k
to 1
00k
100k
to 5
00k
25k
25k
to 5
0k
50k
to 1
00k
100k
to 5
00k
25k
25k
to 5
0k
50k
to 1
00k
100k
to 5
00k
1a 0.064 0.192 0.096 0.028 0.145 1.534 0.782 0.234 0.140 0.163 0.090 0.031 0.171 1.242 0.878 0.463
2c 0.136 0.552 0.277 0.081 0.146 0.936 0.473 0.140 0.166 2.355 1.709 0.944 0.147 0.906 0.515 0.185
3a 0.087 0.276 0.138 0.040 0.127 0.611 0.341 0.119 0.153 0.187 0.097 0.030 0.194 1.073 0.613 0.223
3b 0.036 0.374 0.187 0.054 0.155 2.594 1.550 0.608 0.147 0.563 0.319 0.114 2.142 7.236 3.924 1.305
4a 0.037 0.082 0.041 0.012 0.067 0.377 0.189 0.055 0.072 0.058 0.032 0.011 0.087 0.334 0.208 0.088
4b 0.065 0.138 0.069 0.020 0.139 0.815 0.411 0.121 0.143 0.054 0.030 0.010 0.165 0.413 0.256 0.107
7b 0.111 0.269 0.135 0.039 0.277 1.628 0.830 0.249 0.771 7.611 5.045 2.372 – – – –
8a 0.185 1.237 0.622 0.182 0.409 3.836 2.014 0.634 0.416 0.647 0.370 0.135 0.463 2.963 1.912 0.858
8b 0.189 0.770 0.386 0.113 0.330 4.015 2.115 0.670 0.319 0.825 0.460 0.191 0.405 5.621 3.526 1.505
9a 0.172 0.438 0.219 0.064 0.272 2.081 1.071 0.326 0.392 3.018 1.590 0.5040 0.757 15.854 10.579 5.035
9b 0.204 0.539 0.270 0.079 0.325 2.302 1.189 0.364 0.375 1.797 0.926 0.282 0.830 24.148 18.260 10.867
10a 0.035 0.105 0.053 0.015 0.082 0.117 0.058 0.017 0.088 0.084 0.051 0.021 0.097 0.151 0.087 0.032
*See Table 3.1 for specification of the stress stages.
Permanent strain rate data were used to determine the parameters for the model
(Equation 1) for calculating permanent strain from stress. Equation parameters
determined are listed in Table 5.2. Graphic representations are the best way to
demonstrate this extrapolation and to show how well Equation 1 (which relates stress and
permanent deformation) fits the permanent strain data; an example is shown in
PERFORMANCE TESTS FOR ROADING AGGREGATES AND ALTERNATIVE MATERIALS
36
Figures 5.1 and 5.2, while the full results are detailed in Appendix C. It can be seen that,
generally, Equation 1 fits the data well, although some errors have appeared with
materials that failed or nearly failed with high deformations. Specimens near failure are
unstable and it is expected that the fit would be poor (Arnold 2004).
Rut depth predictions are shown in Table 5.3 using the Arnold/Nottingham method
(Arnold 2004) for a CAPTIF pavement 300 mm deep (see Chapter 3.3 for a description).
The best performing material is the cement modified material (Material 10), while the
worst are those materials with no result – they did not complete the test – and Material 2,
to which fines were deliberately added. Rutting in Material 1 is higher than expected, as
this performs well during CAPTIF tests. Material 1 was consequently retested at a later
date using new improved testing stresses (Table 3.1), where it was predicted to be a
good material with a long-term rutting rate of 0.9 mm/million ESA.

5 Analysis of the RLT tests
37
Figure 5.1 Extrapolation of RLT results for Test 1a using the Arnold method.
Stress Stage C – extrapolation
0.00
0.10
0.20
0.30
0.40
0 0.5 1 1.5 2Load cycles (millions)
Perm
anen
t st
rain
%
Stress Stage C – extrapolation
0.00
0.05
0.10
0.15
0.20
0.25
0 0.02 0.04 0.06 0.08 0.1 Load cycles (millions)
Perm
anen
t st
rain
%
Stress Stage A – extrapolation
0.00
0.05
0.10
0.15
0.20
0 0.5 1 1.5 2Load cycles (millions)
Perm
anen
t st
rain
%
Stress Stage A – extrapolation
0.00
0.02
0.04
0.06
0.08
0.10
0 0.02 0.04 0.06 0.08 0.1 Load cycles (millions)
Perm
anen
t st
rain
%
Stress Stage B – extrapolation
0.00
0.20
0.40
0.60
0.80
1.00
0 0.5 1 1.5 2Load cycles (millions)
Perm
anen
t st
rain
%
Stress Stage B – extrapolation
0.00 0.10 0.20 0.30 0.40 0.50 0.60
0 0.02 0.04 0.06 0.08 0.1 Load cycles (millions)
Perm
anen
t st
rain
%
Stress stage D – extrapolation
0.00
0.20
0.40
0.60
0.80
1.00
0 0.5 1 1.5 2 Load cycles (millions)
Perm
anen
t st
rain
%
Stress stage D – extrapolation
0.00 0.10 0.20 0.30 0.40 0.50
0 0.02 0.04 0.06 0.08 0.1 Load cycles (millions)
Perm
anen
t st
rain
%

PERFORMANCE TESTS FOR ROADING AGGREGATES AND ALTERNATIVE MATERIALS
38
Figure 5.2 Quality of fit between measured/extrapolated permanent strain rates and Equation 1.

5 Analysis of the RLT tests
39
%
mea
n er
ror
0.0
05
0.1
43
0.0
10
0.0
05
0.0
05
0.0
12
0.1
20
0.0
38
0.0
01
0.0
15
0.0
00
12.5
61
c
25.2
18
25.6
88
14.0
24
23.1
95
14.2
63.
17.9
86
16.8
21
18.6
55
19.3
29
13.9
67
16.5
58
5.3
18
b
-31.
021
-10.
000
-15.
000
-30.
656
-15.
000
-25.
000
-3.0
56
-24.
581
-23.
056
-5.0
00
-20.
000
-2.9
39
100k
to 5
00k
%/m
illio
n
per
man
ent
stra
in r
ate
a
-3.6
07
-3.0
41
-3.6
39
-2.1
60
-4.4
75
-3.5
40
-5.4
64
-1.5
63
-2.0
17
-4.0
35
-2.4
70
-4.1
79
%
mea
n
erro
r
0.0
35
0.3
43
0.0
34
0.0
00
0.0
19
0.0
11
0.4
74
0.0
62
0.0
24
0.0
24
1.8
63
0.0
00
c
23.0
34
17.3
03
14.3
56
23.2
90
9.24
1
16.7
62
19.7
21
18.1
06
18.2
36
14.2
89
14.4
57
2.77
0
b
-35.
087
-10.
000
-15.
000
-29.
804
-15.
000
-30.
000
-15.
000
-26.
856
-26.
763
-5.0
00
-11.
281
-3.5
57
50k
to 1
00k
%/m
illio
n
per
manen
t st
rain
rat
e
a
-1.2
00
-1.1
03
-2.6
80
-1.3
78
-1.8
24
-0.9
03
-2.5
83
0.0
00
-3.6
x 10-6
-2.9
93
-2.0
18
-1.9
41
%
mea
n
erro
r
0.0
44
0.2
71
0.0
06
0.0
27
0.0
57
0.0
08
0.0
00
0.2
06
0.1
50
0.0
27
0.1
41
0.0
00
c
21.2
59
25.5
29
8.19
9
21.5
31
19.3
18
18.8
01
19.7
21
23.0
80
17.0
24
14.2
94
8.94
9
5.88
0
b
-35.
248
-10.
000
-17.
239
-30.
214
-15.
000
-35.
000
-15.
000
-30.
377
-20.
773
-5.0
00
-9.4
24
-6.8
70
25k
to 5
0k
%/m
illio
n
per
manen
t st
rain
rat
e
a
-0.0
19
-2.2
80
-0.0
05
0.32
5
-3.3
97
-0.0
25
-2.5
83
-0.1
61
-8 x 10⁻⁵
-2.3
54
-0.0
75
-1.7
98
%
mea
n
erro
r
0.0
03
0.0
95
0.0
49
0.0
01
0.0
14
0.0
21
0.1
66
0.0
22
0.0
08
0.0
34
0.0
82
0.0
10
c
10.5
54
2.3
22
12.8
42
16.7
28
10.6
91
10816
11.0
55
10.7
80
4.6
26
11.7
44
12.2
10
7.0
65
b
-7.0
00
-10.
000
-15.
140
-10.
659
-15.
000
-12.
853
-14.
777
-5.2
45
-4.6
86
-5.0
00
-15.
059
-9.4
78
Eq
uati
on
para
mete
rs
25k
% p
erm
anen
t st
rain
rate
a
-3.6
72
-0.0
01
-2.3
17
-4.7
69
-3.2
80
-2.9
13
-2.0
02
-2.9
16
-1.1
99
-3.6
81
-2.1
25
-2.7
64
Mat
eria
l
1a 2c
3a
3b
4a
4b
7b
8a
8b
9a
9b
10a
Tab
le 5
.2
Eq
uati
on
para
mete
rs f
or
perm
an
en
t st
rain
rate
calc
ula
tio
n

PERFORMANCE TESTS FOR ROADING AGGREGATES AND ALTERNATIVE MATERIALS
40
Table 5.3 Rut depth prediction using the Arnold/Nottingham method.
Total pavement
Aggregate only
Material %OMC %MDD Test ESA to get 25 mm rut (millions)
ESA to get 10 mm rut in
aggregate (millions)
Long-term rate of
rutting within aggregate (mm/million
ESA)
Ranking
1 65 94 1a 1.26 0.58 7.0 8
2 68 94 2c 0.09 0.06 419.4 12
3 63 96 3a 2.77 8.38 0.9 3
3 85 96 3b 0.73 0.33 19.7 11
4 71 92 4a 3.53 24.27 0.4 2
4 95 92 4b 2.17 2.42 2.0 4
7 56 93 7b 1.65 1.26 6.1 7
8 72 90 8a 0.74 0.19 14.1 10
8 80 94 8b 1.07 0.52 10.5 9
9 70 90 9a 2.78 3.82 2.2 5
9 82 89 9b 1.99 1.95 3.9 6
10 66 90 10a 3.58 100.27 0.1 1
5.2 The simplified ARRB method
Chapter 3.5 describes the ARRB method of assessment, which assesses permanent
deformation and resilient strains at each of the three loading stages as shown in
Figures 5.2–5.2. The permanent deformation and associated resilient strain at each stage
is judged as being either:
• Stable behaviour, defined as a decreasing permanent strain rate and a decreasing
to constant resilient strain with increasing loading cycles;
• Unstable behaviour, defined as a decreasing to constant permanent strain rate
and a constant to increasing resilient strain with increasing loading cycles; or
• Failure, defined as a constant to increasing rate of permanent strain and an
increasing resilient strain with increasing loading cycles, or when the total
permanent strain reaches a nominal failure strain, as observed in a static triaxial
shear test (e.g. in the range of 1.5–2.0%).
Based on these criteria and the results shown in the Appendices, a permanent
deformation behaviour category has been applied to each loading stage for each material
tested. Actual permanent strain rates and resilient strain rates were assessed as either
decreasing or increasing with the aid of a spreadsheet. From this analysis, a traffic loading
limit based on the ARRB assessment method detailed in Table 3.7 has been calculated
and reported in Table 5.4.

5 Analysis of the RLT tests
41
Table 5.4 RLT results for the simplified ARRB/AUSTROADS assessment method.
Loading stage (static confining = 50 kPa) Material 1 (350 kPa) 2 (450 kPa) 3 (550 kPa)
Traffic limit Expected performance*
4 (dry) Stable Unstable Stable <106 ESA Good 4 (wet) Stable Stable Stable >107 ESA Good 5 (dry) Unstable Unstable Unstable Not suitable
for a base layer
Poor
5 (wet) Stable Stable Unstable 106–107 Poor 6 (dry) Stable Unstable Unstable <106 ESA Poor 6 (wet) Stable Stable Stable >107 ESA Poor 7 (dry) Stable Unstable Unstable <106 ESA Average 7 (wet) Unstable Stable Unstable Not suitable
for a base layer
Average
8 (dry) Stable Stable Unstable 106–107 Average 8 (wet) Unstable Unstable Stable Not suitable
for a base layer
Poor
9 (dry) Stable Unstable Unstable <106 ESA Average 9 (wet) Unstable Unstable Stable Not suitable
for a base layer
Average
10 (dry) Stable Stable Unstable 106–107 Good 10 (wet) Stable Stable Stable >107 ESA Good
* (refer to Table 4.1)
The results from Table 5.4 appear to be an inaccurate reflection of the expected
performance of the basecourses. Some anomalies also appear in the results: for example,
Materials 5, 6 and 10 perform better with a higher traffic loading limit when wet. Another
anomaly is that Materials 8 and 9, when wet, were unstable in the first two lower stress
stages but were stable in the final (third) stage.

PERFORMANCE TESTS FOR ROADING AGGREGATES AND ALTERNATIVE MATERIALS
42
5.3 The complex ARRB method
The complex ARRB method requires curve fitting and extrapolation of the RLT permanent
strain data to a failure criterion of 1.5% as described in Chapter 3.5.3. Criteria for the
curve fitting are described in Appendix A and these were applied to the RLT data. These
criteria were formulated into Microsoft Excel to minimise the curve fitting errors. It was
found that many iterations were required in order to satisfy the criteria given in
Appendix A. Figures 5.3 and 5.4 show the results of fitting curves to the RLT data (Figures
3.6 and 3.10). The extrapolations of those curves to obtain traffic loading limits at the
failure criterion of 1.5% are shown in Table 5.3, and Figures 5.5 and 5.6. Data in Figures
5.3–5.6 have been taken from Vuong & Arnold 2006.
Table 5.5 Traffic loading limits and strength values from extrapolation of RLT results.
Load cycles to reach failure
Material
1 (350 kPa)
R 2 (450 kPa)
R 3 (550 kPa)
R Strength (kPa)
R
4 (dry) 3.9E+24 1 1.3E+20 1 1.7E+12 6 705 14
4 (wet) 2.6E+13 9 2.5E+11 9 9.1E+09 9 1241 6
5 (dry) 6.4E+07 11 5.6E+06 11 3.0E+05 11 981 11
5 (wet) 2.1E+05 13 2.3E+04 13 4.8E+03 13 1090 8
6 (dry) 1.2E+07 12 1.7E+05 12 1.5E+04 12 941 12
6 (wet) 8.2E+04 14 6.8E+03 14 1.6E+03 14 1054 9
7 (dry) 2.4E+19 5 4.5E+17 4 4.3E+15 3 1324 5
7 (wet) 5.4E+23 2 1.0E+20 2 3.2E+14 5 814 13
8 (dry) 1.8E+18 6 7.0E+16 5 5.3E+15 2 1951 1
8 (wet) 1.7E+17 7 9.6E+13 7 1.2E+12 7 1178 7
9 (dry) 3.4E+19 4 1.8E+16 6 6.0E+14 4 1543 3
9 (wet) 1.9E+13 10 8.3E+10 10 1.0E+09 10 1023 10
10 (dry) 5.2E+20 3 1.5E+19 3 6.3E+17 1 1830 2
10 (wet) 9.3E+13 8 3.1E+11 8 1.5E+10 8 1329 4
Notes to Table 5.5: a Permanent strain = 1.5% b R = Ranking; 1 being the best or highest load cycles or highest strength
5 Analysis of the RLT tests
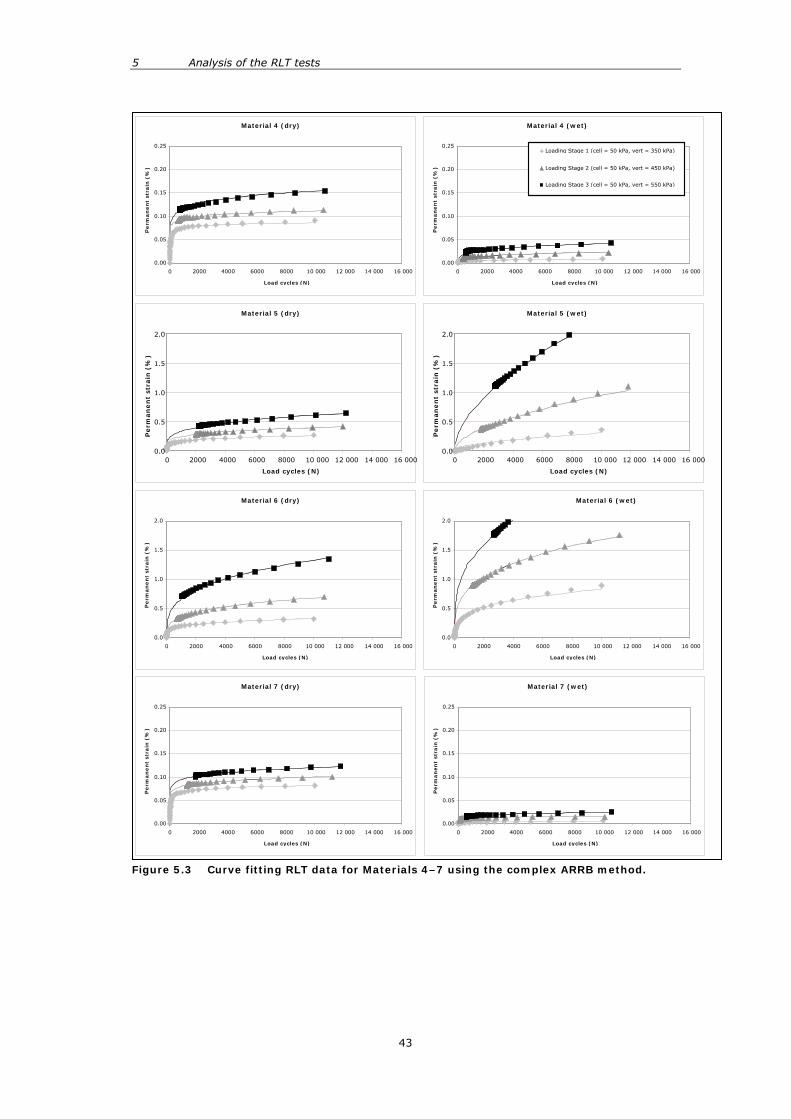
43
Figure 5.3 Curve fitting RLT data for Materials 4–7 using the complex ARRB method.
Material 6 (wet)
Material 4 (dry)
0.00
0.05
0.10
0.15
0.20
0.25
0 2000 4000 6000 8000 10 000 12 000 14 000 16 000
Load cycles (N)
Perm
an
en
t st
rain
(%
)
Material 4 (wet)
0.00
0.05
0.10
0.15
0.20
0.25
0 2000 4000 6000 8000 10 000 12 000 14 000 16 000
Load cycles (N)
Perm
an
en
t st
rain
(%
)
Material 5 (dry)
0.0
0.5
1.0
1.5
2.0
0 2000 4000 6000 8000 10 000 12 000 14 000 16 000 Load cycles (N)
Perm
an
en
t st
rain
(%
)
Material 5 (wet)
0.0
0.5
1.0
1.5
2.0
0 2000 4000 6000 8000 10 000 12 000 14 000 16 000 Load cycles (N)
Perm
an
en
t st
rain
(%
)
Material 6 (dry)
0.0
0.5
1.0
1.5
2.0
0 2000 4000 6000 8000 10 000 12 000 14 000 16 000
Load cycles (N)
Perm
an
en
t st
rain
(%
)
0.0
0.5
1.0
1.5
2.0
0 2000 4000 6000 8000 10 000 12 000 14 000 16 000
Load cycles (N)
Perm
an
en
t st
rain
(%
)
Material 7 (dry)
0.00
0.05
0.10
0.15
0.20
0.25
0 2000 4000 6000 8000 10 000 12 000 14 000 16 000
Load cycles (N)
Perm
an
en
t st
rain
(%
)
Material 7 (wet)
0.00
0.05
0.10
0.15
0.20
0.25
0 2000 4000 6000 8000 10 000 12 000 14 000 16 000
Load cycles (N)
Perm
an
en
t st
rain
(%
)
Loading Stage 1 (cell = 50 kPa, vert = 350 kPa)
Loading Stage 2 (cell = 50 kPa, vert = 450 kPa)
Loading Stage 3 (cell = 50 kPa, vert = 550 kPa)

PERFORMANCE TESTS FOR ROADING AGGREGATES AND ALTERNATIVE MATERIALS
44
Figure 5.4 Curve fitting RLT data for Materials 8–10 using the complex ARRB method.
Material 8 (dry)
0.00
0.05
0.10
0.15
0.20
0.25
0 2000 4000 6000 8000 10 000 12 000 14 000 16 000
Load cycles (N)
Perm
an
en
t st
rain
(%
) Material 8 (wet)
0.00
0.05
0.10
0.15
0.20
0.25
0 2000 4000 6000 8000 10 000 12 000 14 000 16 000
Load cycles (N)
Perm
an
en
t st
rain
(%
)
Material 9 (wet)
0.00
0.05
0.10
0.15
0.20
0.25
0 2000 4000 6000 8000 10 000 12 000 14 000 16 000
Load cycles (N)
Perm
an
en
t st
rain
(%
)
Material 9 (dry)
0.00
0.05
0.10
0.15
0.20
0.25
0 2000 4000 6000 8000 10 000 12 000 14 000 16 000
Load cycles (N)
Perm
an
en
t st
rain
(%
)
Material 10 (wet)
0.00
0.05
0.10
0.15
0.20
0.25
0 2000 4000 6000 8000 10 000 12 000 14 000 16 000
Load cycles (N)
Perm
an
en
t st
rain
(%
)
Material 10 (dry)
0.00
0.05
0.10
0.15
0.20
0.25
0 2000 4000 6000 8000 10 000 12 000 14 000 16 000
Load cycles (N)
Perm
an
en
t st
rain
(%
)
Loading Stage 1 (cell = 50 kPa, vert = 350 kPa)
Loading Stage 2 (cell = 50 kPa, vert = 450 kPa)
Loading Stage 3 (cell = 50 kPa, vert = 550 kPa)

5 Analysis of the RLT tests
45
Figure 5.5: Traffic loading limits to reach failure criteria of 1.5% for Materials 4–7 using the complex ARRB method (Appendix A).
Note: grey squares represent points derived from RLT test results (Figures 5.3 and 5.4) while the black diamond and dashed line represent the extrapolation.
Material 4 (dry)
1.0E+001.0E+031.0E+061.0E+091.0E+121.0E+151.0E+181.0E+211.0E+241.0E+271.0E+30
0 500 1000 1500 2000
Repeated deviator stress (kPa)
Nu
mb
er
of
cycl
es
to f
ailu
re (
N)
Material 4 (wet)
1.0E+001.0E+031.0E+061.0E+091.0E+121.0E+151.0E+181.0E+211.0E+241.0E+271.0E+30
0 500 1000 1500 2000 Repeated deviator stress (kPa)
Nu
mb
er
of
cycl
es
to f
ailu
re (
N)
Material 5 (7dry)
1.0E+001.0E+031.0E+061.0E+091.0E+121.0E+151.0E+181.0E+211.0E+241.0E+271.0E+30
0 500 1000 1500 2000
Repeated deviator stress (kPa)
Nu
mb
er
of
cycl
es
to f
ailu
re (
N)
Material 5 (wet)
1.0E+001.0E+031.0E+061.0E+091.0E+121.0E+151.0E+181.0E+211.0E+241.0E+271.0E+30
0 500 1000 1500 2000 Repeated deviator stress (kPa)
Nu
mb
er
of
cycl
es
to f
ailu
re (
N)
Material 6 (dry)
1.0E+001.0E+031.0E+061.0E+091.0E+121.0E+151.0E+181.0E+211.0E+241.0E+271.0E+30
0 500 1000 1500 2000
Repeated deviator stress (kPa)
Nu
mb
er
of
cycl
es
to f
ailu
re (
N)
Material 6 (wet)
1.0E+001.0E+031.0E+061.0E+091.0E+121.0E+151.0E+181.0E+211.0E+241.0E+271.0E+30
0 500 1000 1500 2000 Repeated deviator stress (kPa)
Nu
mb
er
of
cycl
es
to f
ailu
re (
N)
Material 7 (dry)
1.0E+001.0E+031.0E+061.0E+091.0E+121.0E+151.0E+181.0E+211.0E+241.0E+271.0E+30
0 500 1000 1500 2000
Repeated deviator stress (kPa)
Nu
mb
er
of
cycl
es
to f
ailu
re (
N)
Material 7 (wet)
1.0E+001.0E+031.0E+061.0E+091.0E+121.0E+151.0E+181.0E+211.0E+241.0E+271.0E+30
0 500 1000 1500 2000 Repeated deviator stress (kPa)
Nu
mb
er
of
cycl
es
to f
ailu
re (
N)

PERFORMANCE TESTS FOR ROADING AGGREGATES AND ALTERNATIVE MATERIALS
46
Figure 5.6 Traffic loading limits to reach failure criteria of 1.5% for Materials 8–10 using the complex ARRB method (Appendix A).
Note: grey squares represent points derived from RLT test results (Figures 5.3 and 5.4) while the black diamond and dashed line represent the extrapolation.
The strength value (i.e. deviator stress needed to cause failure at one load cycle, Figures
5.5 and 5.6) was compared with estimated Traffic Loading Limit (Table 4.1) as plotted in
Figure 5.7. These results show that the strength value is a poor predictor of performance
with a R2 of 0.1 and a mean error of 3.4 million ESA around the best fit line (Figure 5.7).
This was especially the case for Material 5, which had the highest deformations in the RLT
test but had an average ‘strength value’ of around 1000 kPa.
Material 8 (dry)
1.0E+001.0E+031.0E+061.0E+091.0E+121.0E+151.0E+181.0E+211.0E+241.0E+271.0E+30
0 500 1000 1500 2000
Repeated deviator stress (kPa)
Nu
mb
er
of
cycl
es
to f
ailu
re (
N)
Material 8 (wet)
1.0E+001.0E+031.0E+061.0E+091.0E+121.0E+151.0E+181.0E+211.0E+241.0E+271.0E+30
0 500 1000 1500 2000
Repeated deviator stress (kPa)
Nu
mb
er
of
cycl
es
to f
ailu
re (
N)
Material 9 (dry)
1.0E+001.0E+031.0E+061.0E+091.0E+121.0E+151.0E+181.0E+211.0E+241.0E+271.0E+30
0 500 1000 1500 2000
Repeated deviator stress (kPa)
Nu
mb
er
of
cycl
es
to f
ailu
re (
N)
Material 9 (wet)
1.0E+001.0E+031.0E+061.0E+091.0E+121.0E+151.0E+181.0E+211.0E+241.0E+271.0E+30
0 500 1000 1500 2000
Repeated deviator stress (kPa)
Nu
mb
er
of
cycl
es
to f
ailu
re (
N)
Material 10 (dry)
1.0E+001.0E+031.0E+061.0E+091.0E+121.0E+151.0E+181.0E+211.0E+241.0E+271.0E+30
0 500 1000 1500 2000
Repeated deviator stress (kPa)
Nu
mb
er
of
cycl
es
to f
ailu
re (
N)
Material 10 (wet)
1.0E+001.0E+031.0E+061.0E+091.0E+121.0E+151.0E+181.0E+211.0E+241.0E+271.0E+30
0 500 1000 1500 2000
Repeated deviator stress (kPa)
Nu
mb
er
of
cycl
es
to f
ailu
re (
N)

5 Analysis of the RLT tests
47
Figure 5.7 Comparison of the strength value using the ARRB method and the estimated traffic loading limit (given in Table 4.1).
y = 0.0041x + 1.3929R 2 = 0.0966
0
5
10
15
0 500 1000 1500 2000 2500
Strength value, kPa (ARRB method) Est
imate
d t
raff
ic lo
ad
ing
lim
it (
millio
n E
SA
)
(Tab
le 4
.1)

PERFORMANCE TESTS FOR ROADING AGGREGATES AND ALTERNATIVE MATERIALS
48
5.4 Comparison
The three methods used for RLT testing and analysis were compared to the anecdotal
evidence of expected material performance. Table 5.6 shows how the materials’
performance was ranked according to the three methods. Materials that failed during the
RLT testing using the Arnold method were ranked on how quickly they failed in the
observed RLT results (Figure 4.3). Ranking of the expected performance was based on
knowledge of pavements that have and have not failed in the past using the aggregate in
question. In ranking the expected performance, it was assumed that a saturated
aggregate will perform worse than a dry aggregate.
Table 5.6 Material performance rankings using the three methods of RLT analysis and testing, and observed performance.
Material Arnold (Table 5.3)
Complex ARRB (Stage 3 – Table 5.5)
Simplified ARRB (Table 5.4)
Ranking based on
performance* 4 (dry) 3 6 7 3
4 (wet) 4 9 2 4
5 (dry) 13 11 14 13
5 (wet) 14 13 6 14
6 (dry) 11 12 10 11
6 (wet) 12 14 3 12
7 (dry) 9 3 9 7
7 (wet) 10 5 12 8
8 (dry) 7 2 5 9
8 (wet) 8 7 13 10
9 (dry) 5 4 8 5
9 (wet) 6 10 11 6
10 (dry) 1 1 4 1
10 (wet) 2 8 1 2
* 1 = best; 14 = worst
Table 5.6 shows that the Arnold method matches the expected field performance more
closely, while the ARRB methods are poor predictors of performance. A simpler method of
ranking a material’s performance was also applied based on traffic loading limits, shown
in Table 5.7. This simple method of ranking shows an improvement to the ARRB methods
but the Arnold method is still the best.

5 Analysis of the RLT tests
49
Table 5.7 Material performance grouping using the three methods of RLT analysis and testing and observed performance.
Method Material
Arnold Stage 3: complex ARRB
Simplified ARRB Ranking based on performance
4 (dry) Good Good Poor Good 4 (wet) Average Good Good Average 5 (dry) Poor Poor Poor Poor 5 (wet) Poor Poor Average Poor 6 (dry) Poor Poor Poor Poor 6 (wet) Poor Poor Good Poor 7 (dry) Average Good Poor Average 7 (wet) Poor Good Poor Poor 8 (dry) Poor Good Average Average 8 (wet) Poor Good Poor Poor 9 (dry) Average Good Poor Average 9 (wet) Average Good Poor Average 10 (dry) Not tested Good Average Good 10 (wet) Good Good Good Good
Good = N >107 ESA Average = 106< N <107 Poor = N <106

PERFORMANCE TESTS FOR ROADING AGGREGATES AND ALTERNATIVE MATERIALS
50
6 Development of a new simple RLT test method and analysis
6.1 Introduction
Since the RLT testing for this research, many other tests have been conducted for private
companies and Transit New Zealand regions. The aim of these tests was to determine if
the aggregates tested in the RLT test carried any risks of early permanent failure. For this
commercial testing, it was important that enough information was obtained from the RLT
test for predicting performance. However, results from the four-stage Arnold method
(Table 3.1) in this research showed a large number of early failures. Therefore, more
testing stages at lower stress levels were added to the test to develop a six-stage RLT
test (Table 3.2). The same method of rut depth prediction was used for the six-stage RLT
tests. A better fit to the model relating permanent strain rate to stress was possible with
the new six-stage RLT test, compared with the four-stage RLT test. Furthermore, fewer
early failures occurred, which is probably because the lower stress stages condition the
sample in preparation for the higher stress levels.
This chapter details the new six-stage RLT test procedure and compares the Arnold/
Nottingham rut depth prediction method using finite element modelling with parameters
from the RLT test such as slope and magnitude. The aim is to develop a simple
assessment method of the RLT test results that could be put into specifications.
6.2 Six-stage RLT test
The new six-stage testing stresses (Table 3.2) chosen for the RLT test were based on
covering the full spectra of stresses within a pavement. Actual stresses within the
pavement are complicated by the fact that unbound granular materials cannot sustain
tensile horizontal forces and will yield under compactive forces. This yielding deforms the
aggregate both downwards and horizontally. The horizontal movement is resisted by the
surrounding compacted aggregate and, therefore, residual horizontal confining stresses
are built up.
The coefficient of lateral earth pressure at rest is considered an appropriate value to use
for estimating the amount of residual stresses present in a granular material located in a
pavement. For granular pavement materials, the cohesion may be nil and the friction
angle is 50 degrees (Arnold 2004). This results in the coefficient of lateral earth pressure
at rest having a value of 0.23 (Equation 2). Granular materials are located relatively near
the surface, e.g. 200 mm deep. Based on a density of 2400 kg/m3, the overburden stress
would be 5 kPa. Thus, the horizontal residual stress at rest works out to be approximately
1.2 kPa. However, adding 550 kPa (for example) vertical stress from compaction and
initial traffic loading, the horizontal residual stress at rest is approximately 128 kPa.

6 Development of a new simple RLT test method and analysis
51
'0 sin1 φK −= Equation 2
An FEM, ROSTRA, was used to calculate stresses directly under a circular load of 4.1
tonnes (i.e. half the standard axle load of 8.2 tonnes)
Another factor in determining the testing stresses was the proximity to the shear failure
line. Figure 6.1 shows the approximate position of the shear failure lines along with the
stress conditions for the various RLT methodologies discussed in this report. Applying a
128 kPa residual stress results in a stress distribution directly under the wheel of an
8.2 tonne dual-tyred axle in line with the new six-stage stress path RLT test.
Figure 6.1 Stress conditions for the RLT tests.
RLT stress conditions
0
50
100
150
200
250
300
350
400
450
500
550
600
0 50 100 150 200 250 300 350 400 450 500 p (kPa)
q (
kP
a)
Final six-stage RLT test Initial seven-stage RLT test ARRB three-stage RLT testArnold four-stage RLT test Shear failure line (marginal material) Shear failure line (good material) Stresses within pavement

PERFORMANCE TESTS FOR ROADING AGGREGATES AND ALTERNATIVE MATERIALS
52
6.3 Results of the new six-stage RLT test
Many materials have since been tested using the new six-stage RLT test on a commercial
basis. As they are commercially funded tests, their identity is kept anonymous. Also, the
performance in the field is not always known. Despite this, the results are useful in terms
of comparing the predictions using the Arnold/Nottingham method and finite element
modelling of a CAPTIF pavement with simple parameters from the test such as the slope
from 25k to 50k in each stage. If an appropriate relationship can be found between
predictions and a simple parameter then this can be used in a specification. Tests are
labelled as Materials 11 to 23 to remain anonymous.
Two values were obtained from the RLT test at each loading stage; these are the secant
permanent strain rate from 25k to 50k cycles, and the magnitude of permanent strain at
25k load cycles. The loading count was zeroed for each stage but the permanent strain
magnitude remained cumulative, as shown in Figures 6.2 and 6.3. Table 6.1 lists the
results of 23 RLT tests using the six-stage RLT test. Results show the predictions from the
Arnold/Nottingham rut depth modelling along with the basic parameters obtained from
the RLT test of total permanent strain at 25k (i.e. all stages summed) and the average
slope from 25k to 50k for each stage. In addition, the slope of the last stage was included
and a value considering both cumulative permanent strain at 25k and the average slope.
The aim was to determine a simple parameter from the RLT test that could be used to
predict the rutting within a granular material or a traffic loading limit.
The aggregate rutting rates and each RLT test result parameter were plotted to find
relationships and how well they fitted. Traffic loading limits to achieve a 10 mm rut within
the aggregate were also plotted against the various RLT parameters. Results are shown in
Table 6.1. Interestingly, the use of the cumulative permanent strain value at 25k did not
help the predictions and it was found the average slope was the best parameter to use. A
relationship showing the mean traffic loading limit (N) with an average slope and traffic
loading limit was found as shown in Figure 6.6 and Equation 3.
N = 19.5e(-1.3Savg) Equation 3
Where:
N = Traffic loading limit in millions of ESA over a 25-year design period;
e = natural logarithm number 2.71;
Savg = Average slope from 25k to 50k load cycles from the six-stage RLT test in units of
%/million.

6 Development of a new simple RLT test method and analysis
53
Figure 6.2 Determining slope from 25k to 50k and deformation at 25k from RLT test results for Stages A and B.
Note: the equation in the Stage A diagram m was included to show how the slope was calculated.
Cumulative permanent strain versus load cycles
0 0.1 0.2 0.3 0.4 0.5 0.6 0.7 0.8 0.9
1
0 50 000 100 000 150 000 200 000 250 000 300 000
Number of load cycles
Perm
an
en
t st
rain
(%
)
Stage A Stage B Stage C Stage D Stage E Stage F
Cumulative permanent strain versus load cycles
0 0.1 0.2 0.3 0.4 0.5 0.6 0.7 0.8 0.9
1
0 10 000 20 000 30 000 40 000 50 000
Number of load cycles
Perm
anen
t st
rain
(%
)
Stage A
P25k
Slope, 25k to 50k, %/1M=(P50k - P25k )/(0.050–0.025)
P50k
Cumulative permanent strain versus load cycles
0 0.1
0.2
0.3
0.4
0.5
0.6
0.7
0.8
0.9
1
0 10 000 20 000 30 000 40 000 50 000
Number of load cycles
Perm
anen
t st
rain
(%
)
Stage B

PERFORMANCE TESTS FOR ROADING AGGREGATES AND ALTERNATIVE MATERIALS
54
Figure 6.3 Determining slope from 25k to 50k and deformation at 25k from RLT test results for Stages C to E.
Note: the equation in the Stage F diagram was included to show how the slope was calculated.
Cumulative permanent strain versus load cycles
0
0.1
0.2
0.3
0.4
0.5
0.6
0.7
0.8
0.9
1
0 10 000 20 000 30 000 40 000 50 000
Number of load cycles
Perm
anen
t st
rain
(%
)
Stage C
Cumulative permanent strain versus load cycles
0
0.1
0.2
0.3
0.4
0.5
0.6
0.7
0.8
0.9
1
0 10 000 20 000 30000 40 000 50 000
Number of load cycles
Perm
anen
t st
rain
(%
)Stage D
Cumulative permanent strain versus load cycles
0
0.1
0.2
0.3
0.4
0.5
0.6
0.7
0.8
0.9
1
0 10 000 20 000 30 000 40 000 50 000
Number of load cycles
Perm
anen
t st
rain
(%
)
Stage E
Cumulative permanent strain versus load cycles
0
0.1 0.2 0.3 0.4 0.5 0.6 0.7 0.8 0.9
1
0 10 000 20 000 30 000 40 000 50 000
Number of load cycles
Perm
anen
t st
rain
(%
)
Stage F
P 25k
P 50k
Slope, 25k to 50k, %/1M =(P 50k - P 25k)/(0.050-0.025)

6 Development of a new simple RLT test method and analysis
55
Table 6.1 RLT test results along with associated rut depth predictions.
CAPTIF pavement, 300 mm aggregate over 10 CBR subgrade Total
pavement Aggregate only
Test
ESA to get 25 mm rut (million
ESA)
ESA to get 10 mm rut
in aggregate.
(million ESA)
Long-term rate of rutting
within aggregate (mm per million ESA)
Resilient modulus (MPA) (top of
pavement)
Cumulative total first
25k
Average slope 25k to
50k
Last stage slope
Cum 25k +average
Slope
1 1.10 0.63 10.2 263 0.70 2.21 8.76 2.90 2 3.42 28.60 0.3 760 0.75 0.19 0.47 0.94 3 3.01 10.01 0.9 362 0.23 0.59 2.40 0.82 4 3.00 8.38 1.0 745 0.31 0.20 0.37 0.51 5 3.13 13.56 0.7 475 0.53 1.14 5.37 1.67 6 3.51 22.06 0.4 580 0.27 0.24 0.52 0.51 7 3.33 24.66 0.4 672 0.65 0.18 0.43 0.83 8 0.02 0.01 20.5 259 2.25 6.22 14.76 8.46 9 1.81 1.90 4.1 262 0.58 1.46 5.71 2.04 10 3.37 24.66 0.4 913 0.24 0.09 0.17 0.33 11 0.95 0.60 17.8 238 0.63 2.62 11.61 3.25 12 3.16 12.06 0.7 730 0.66 0.19 0.37 0.85 13 3.19 10.41 0.7 882 1.87 0.59 1.16 2.46 14 2.74 5.02 1.8 874 1.21 0.29 0.52 1.49 15 3.18 10.36 0.7 882 1.87 0.59 1.16 2.46 16 2.71 5.50 1.3 708 0.91 0.39 0.89 1.30 17 3.49 37.16 0.3 741 0.60 0.21 0.42 0.81 18 1.80 1.78 4.0 248 0.84 2.72 12.17 3.57 19 2.78 6.61 1.1 708 1.04 0.25 0.54 1.29 20 0.30 0.02 28.7 239 0.79 3.53 18.26 4.31 21 3.23 11.68 0.8 786 0.63 0.25 0.89 0.88 22 2.07 2.93 2.6 254 0.66 1.48 5.01 2.15 23 3.05 12.94 0.6 761 0.75 0.22 0.43 0.98

PERFORMANCE TESTS FOR ROADING AGGREGATES AND ALTERNATIVE MATERIALS
56
Figure 6.4 Relationships between slope and cumulative permanent strain from RLT tests with rate of rutting predictions from modelling.
Average slope versus rut depth rate (mm/1M ESA)
y = 2.6827x1.0438
R2 = 0.8259
0.0 2.0 4.0 6.0 8.0
10.012.0
14.0
16.0
18.0
20.0
0.00 1.00 2.00 3.00 4.00 5.00 6.00 7.00
Average slope (25k to 50k, mm/million ESA)
Rat
e of ru
ttin
g (
mm
/1M
ESA)
Average slope versus rut depth rate (mm/1M ESA)
y = 2.6827x1.0438
R2 = 0.8259
0.0 0.5 1.0 1.5 2.0 2.5 3.0 3.5 4.0 4.5 5.0
0.00 0.50 1.00 1.50 2.00
Average slope (25k to 50k, mm/million ESA)
Rat
e of ru
ttin
g (
mm
/1M
ESA)
Last stage slope versus rut depth rate (mm/1M ESA)
y = 1.0112x0.8472
R2 = 0.7901
0.0 5.0
10.0
15.0
20.0
25.0
30.0
35.0
0.00 5.00 10.00 15.00
20.00
Last stage slope (25k to 50k, mm/million ESA)
Rat
e of ru
ttin
g (
mm
/1M
ESA)
Last stage slope versus rut depth rate (mm/1M ESA)
y = 1.0112x0.8472
R 2 = 0.7901
0.0 0.5 1.0 1.5 2.0 2.5 3.0 3.5 4.0 4.5 5.0
0.00 0.50 1.00 1.50 2.00
Last stage slope (25k to 50k, mm/million ESA)
Rat
e of ru
ttin
g (
mm
/1M
ESA)
Average last two stages slope versus rut depth rate (mm/1M ESA)
y = 1.362x0.9003
R2 = 0.803
0.0
5.0
10.0
15.0
20.0
25.0
30.0
35.0
0.00 2.00 4.00 6.00 8.00 10.00 12.00
Average last two stages slope (25k to 50k, mm/million ESA)
Rat
e of ru
ttin
g (
mm
/1M
ESA)
Average last two stages slope versus rut depth rate (mm/1M ESA)
y = 1.362x0.9003
R2 = 0.803
0.00.51.01.52.02.53.03.54.04.55.0
0.00 0.50 1.00 1.50 2.00
Average last two stages slope (25k to 50k, mm/million ESA)
Rat
e of ru
ttin
g (
mm
/1M
ESA)
Cumulative @25k + average slope (25k to 50k) versus rut depth rate (mm/1M ESA)
y = 0.8593x1.4631
R 2 = 0.7323
0.0
5.0
10.0
15.0
20.0
25.0
30.0
35.0
0.00 2.00 4.00 6.00 8.00 10.00
Cumulative 25k + average slope (%)
Rat
e of ru
ttin
g (
mm
/1M
ESA)
Cumulative @25k + average slope (25k to 50k) versus rut depth rate (mm/1M ESA)
y = 0.8593x1.4631
R2 = 0.7323
0.00.51.01.52.02.53.03.54.04.55.0
0.00 0.50 1.00 1.50 2.00
Cumulative 25k + average slope (%/million)
Rat
e of ru
ttin
g (
mm
/1M
ESA)

6 Development of a new simple RLT test method and analysis
57
Figure 6.5 Relationships between slope and cumulative permanent strain from RLT tests with traffic loading limit from modelling.
Average slope versus traffic loading limit
y = 22.605e-1.3855x
R 2 = 0.8449
0 2 4 6 8
10 12 14 16 18 20
0.00 1.00 2.00 3.00 4.00 5.00 6.00 7.00 Average slope (25k to 50k, mm/million ESA)
Num
ber
of Lo
ads
for
10 m
m r
ut
within
aggre
gat
e (m
illio
n E
SA)
Last stage slope versus traffic loading limit
y = 6.9574x-1.1416
R 2 = 0.6767
0 2 4 6 8
10 12 14 16 18 20
0.00 5.00 10.00 15.00 20.00Last stage slope (25k to 50k, mm/million ESA) N
um
ber
of lo
ads
for
a 10 m
m r
ut
within
aggre
gat
e (m
illio
n E
SA)
Average last two stages slope v. traffic loading limit
y = 4.6548x1.2203
R 2 = 0.6958
0 2 4 6 8
10 12 14 16 18 20
0.00 2.00 4.00 6.00 8.00 10.00 12.00 Average last two stages slope (25k to 50k, mm/million ESA)
Num
ber
of lo
ads
for
10 m
m r
ut
within
aggre
gat
e (m
illio
n E
SA)
Average slope versus traffic loading limit
y = 1.8247x-1.4398 R 2 = 0.7411
0 2 4 6 8
10 12 14 16 18 20
0.00 0.50 1.00 1.50 2.00Average slope (25k to 50k, mm/million ESA)
Num
ber
of lo
ads
for
10 m
m r
ut
within
aggre
gat
e (m
illio
n E
SA)
Last stage slope versus traffic loading limit
y = 6.9574x-1.1416
R 2 = 0.6767
0 2 4 6 8
10 12 14 16 18 20
0.00 0.50 1.00 1.50 2.00Last stage slope (25k to 50k, mm/million ESA) N
um
ber
of lo
ads
for
a 10 m
m r
ut
within
aggre
gat
e (m
illio
n E
SA)
Average last two stages slope v. traffic loading limit
y = 4.6548x-1.2203
R 2 = 0.6958
0 2 4 6 8
10 12 14 16 18 20
0.00 0.50 1.00 1.50 2.00
Average last two stages slope (25k to 50k, mm/million ESA)
Num
ber
of lo
ads
for
10 m
m
rut
Cumulative @25k + average slope (25k to 50k) v. traffic loading limit
y = 8.9194x-2.0791
R 2 = 0.6974
0 2 4 6 8
10 12 14 16 18 20
0.00 2.00 4.00 6.00 8.00 10.00 Cumulative + average slope (25k to 50k, %/1M)
Num
ber
of lo
ads
for
10 m
m r
ut
within
aggre
gat
e (m
illio
n E
SA)
Cumulative @25k + average slope (25k to 50k) v. traffic loading limit
y = 8.9194x-2.0791
R2 = 0.6974
0 2 4 6 8
10 12 14 16 18 20
0.00 1.00 2.00 3.00 4.00Cumulative + average slope (25k to 50k, %/1M)
Num
ber
of lo
ads
for
10 m
m r
ut
within
aggre
gat
e (m
illio
n E
SA)

PERFORMANCE TESTS FOR ROADING AGGREGATES AND ALTERNATIVE MATERIALS
58
Figure 6.6 Relationships between average slope from six-stage RLT tests with traffic loading limit from modelling.
Further trend analysis was undertaken by considering both the mean and standard
deviation of the slopes in the six-stage RLT test. Results of this analysis did not improve
the correlation, as shown in Figure 6.7. The reason for this is that the data points with a
low slope (on the left-hand side in Figure 6.7) all had a low standard deviation which,
when added, did not shift the points to the right far enough to influence the correlation.
Therefore, only the average slope should be used in order to keep the analysis simple.
y = 19.48e -1.3365x
R 2 = 0.8736
y = 10.941e-1.6506x
0
2
4
6
8
10
12
14
0.00 1.00 2.00 3.00 4.00 Average slope RLT data (25k to 50k, %/million)N
, fo
r ru
ttin
g f
ailu
re w
ithin
aggre
gat
e (m
illio
n E
SA)
Average
Lower 99th percentile

6 Development of a new simple RLT test method and analysis
59
Figure 6.7 Relationships between average slope plus standard deviation in the six-stage RLT tests v. traffic loading limit predicted by modelling.
6.4 Material classification from RLT tests
In considering an appropriate classification system, we should be careful not to exclude
existing aggregates in use where there have been no reported incidences of failures. At
this preliminary stage, limits should not be introduced that require all highly trafficked
roads to use a modified/cemented aggregate. Although technically all natural aggregates
rut internally, for the best quality aggregates, this rutting will be managed by resurfacing.
Therefore, a classification system is developed based on the relationship between average
RLT slope for the six-stage RLT test (Table 3.2) and traffic loading limit based on the
average values (Figure 6..6). The equation to use for classification in terms of design
traffic loading limit is:
N = 19.5e(-1.34Savg) Equation 3
Where:
N = Traffic loading limit in millions of ESA over a 25-year design period,
e = natural logarithm number 2.718282,
Savg = Average slope from 25k to 50k load cycles of all the six-stages in the RLT test in
units of %/million.
Equation 3 yielded the following average slope ranges in relation to traffic loading limits
(Table 6.2). These traffic loading limits will apply for both dry (70% OMC) and wet (100%
OMC) conditions. Generally, however, a wet test result would be required for the highest
trafficked roads to ensure the least risk of early failure.
= 0.87
y = 19.42e -0.58x
R2
0
2
4
6
8
10
12
14
0.00 1.00 2.00 3.00 4.00
Average slope RLT data (25k to 50k, %/million) ES
A t
o r
each
ru
ttin
g f
ailu
re w
ith
in a
gg
reg
ate
(m
illi
on
s)
Mean + standard deviation
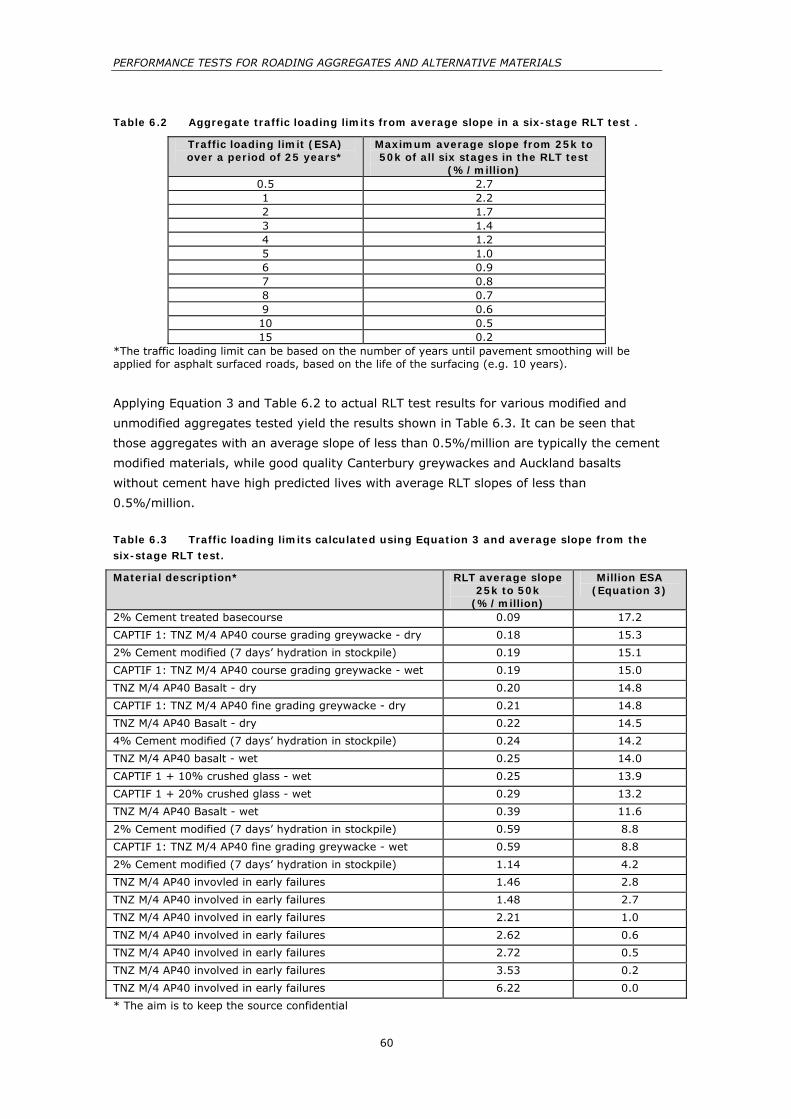
PERFORMANCE TESTS FOR ROADING AGGREGATES AND ALTERNATIVE MATERIALS
60
Table 6.2 Aggregate traffic loading limits from average slope in a six-stage RLT test .
Traffic loading limit (ESA) over a period of 25 years*
Maximum average slope from 25k to 50k of all six stages in the RLT test
(%/million) 0.5 2.7 1 2.2 2 1.7 3 1.4 4 1.2 5 1.0 6 0.9 7 0.8 8 0.7 9 0.6 10 0.5 15 0.2
*The traffic loading limit can be based on the number of years until pavement smoothing will be applied for asphalt surfaced roads, based on the life of the surfacing (e.g. 10 years).
Applying Equation 3 and Table 6.2 to actual RLT test results for various modified and
unmodified aggregates tested yield the results shown in Table 6.3. It can be seen that
those aggregates with an average slope of less than 0.5%/million are typically the cement
modified materials, while good quality Canterbury greywackes and Auckland basalts
without cement have high predicted lives with average RLT slopes of less than
0.5%/million.
Table 6.3 Traffic loading limits calculated using Equation 3 and average slope from the six-stage RLT test.
Material description* RLT average slope 25k to 50k
(%/million)
Million ESA (Equation 3)
2% Cement treated basecourse 0.09 17.2
CAPTIF 1: TNZ M/4 AP40 course grading greywacke - dry 0.18 15.3
2% Cement modified (7 days’ hydration in stockpile) 0.19 15.1
CAPTIF 1: TNZ M/4 AP40 course grading greywacke - wet 0.19 15.0
TNZ M/4 AP40 Basalt - dry 0.20 14.8
CAPTIF 1: TNZ M/4 AP40 fine grading greywacke - dry 0.21 14.8
TNZ M/4 AP40 Basalt - dry 0.22 14.5
4% Cement modified (7 days’ hydration in stockpile) 0.24 14.2
TNZ M/4 AP40 basalt - wet 0.25 14.0
CAPTIF 1 + 10% crushed glass - wet 0.25 13.9
CAPTIF 1 + 20% crushed glass - wet 0.29 13.2
TNZ M/4 AP40 Basalt - wet 0.39 11.6
2% Cement modified (7 days’ hydration in stockpile) 0.59 8.8
CAPTIF 1: TNZ M/4 AP40 fine grading greywacke - wet 0.59 8.8
2% Cement modified (7 days’ hydration in stockpile) 1.14 4.2
TNZ M/4 AP40 invovled in early failures 1.46 2.8
TNZ M/4 AP40 involved in early failures 1.48 2.7
TNZ M/4 AP40 involved in early failures 2.21 1.0
TNZ M/4 AP40 involved in early failures 2.62 0.6
TNZ M/4 AP40 involved in early failures 2.72 0.5
TNZ M/4 AP40 involved in early failures 3.53 0.2
TNZ M/4 AP40 involved in early failures 6.22 0.0
* The aim is to keep the source confidential

7 Discussion
61
7 Discussion and conclusions
7.1 Discussion
The classification procedure developed was based on rut depth prediction using the
Arnold/Nottingham method (Arnold 2004) that was validated against CAPTIF tests. Many
assumptions have been made in this procedure and these have been applied consistently
to all the six-stage RLT tests conducted so that the materials’ predicted performances can
be compared. This consistent process has meant the materials tested could be ranked,
and if an assumption is changed in the rut depth prediction method then it is expected
that a similar ranking would result. For specification purposes, a simplified means of RLT
test method analysis was developed. It was found that average slope gave the best
predictor of traffic loading limits and that the cumulative permanent strain achieved in the
first 25 000 load cycles did not improve the result. This is a good result as, usually, the
first 25 000 load cycles in each stage are prone to differences in compaction and sample
preparation. Testing results will be more repeatable by using the slope in the later part of
the test from 25 000–50 000 load cycles.
The rut depth prediction method developed by Arnold/Nottingham should not altogether
be excluded now that a simple method of analysis has been developed. Using the rut
depth prediction method may achieve a higher life than that approximated using the
average slope only, as the full shape of the curve is considered in extrapolation.
A soundness check on Table 6.2 as detailed in Table 6.3 shows that good quality M/4
basecourses, which are the cement modified aggregates, basalts and Canterbury
greywackes, have design traffic loading limits greater than eight million ESA. This gives
confidence in the limits chosen, as they will not rule out the use of these good quality
aggregates on highly trafficked roads.
7.2 Conclusions
This research project undertook many RLT tests on a range of aggregates used in New
Zealand on an initial four-stage RLT test and using the AUSTROADS method. Further RLT
tests were undertaken using a new six-stage RLT test funded commercially and for other
research projects. It was found that the new six-stage RLT test was the best predictor of
pavement rutting and is recommended for use in specifications for determining a traffic
loading limit based on average slope. The AUSTROADS test method did not rank the
materials’ performances as expected and was therefore not regarded as suitable. The
initial four-stage RLT test was also considered unsuitable because it failed good quality
aggregates that were expected to pass early in the testing process.

PERFORMANCE TESTS FOR ROADING AGGREGATES AND ALTERNATIVE MATERIALS
62
8 References
Arnold, G., Alabaster, D.J., Steven, B.D. 2001. Prediction of pavement performance from
repeat load triaxial tests on granular materials. Transfund New Zealand Research Report
214. Wellington: Transfund New Zealand.
Arnold, G. 2004. Rutting of Granular Pavements. PhD Thesis, University of Nottingham,
Nottingham, UK.
Benkleman, A.C. 1962. Structural deterioration of test pavements: flexible. Highway
Research Board Special Report 73. Washington: Highway Research Board.
British Standards Institution. 1990. Methods of test for soils for civil engineering
purposes. General requirements and sample preparation. BS 1377-1:1990. London:
British Standards Institution. 38 pp.
Gidel G., Hornych P., Chauvin J.J., Breysse D., Denis A. 2001. Nouvelle approche pour
l’étude des déformations permanentes des graves non traitées à l’appareil triaxial à
chargements répétés. [New approach for the study of permanent deformation behaviour
of unbound granular material on the repeated load triaxial apparatus] Bulletin des LPC
n°233 : pp 5–21.
Standards New Zealand. 1986.Methods of testing soils for civil engineering purposes.
New Zealand Standard NZS 4402:1986. Wellington: Standards Association of
New Zealand.
Transit. 2005. TNZ B/2. 2005. Specification for construction of unbound granular
pavement layers. Transit New Zealand, Wellington.
Transit. 2006. TNZ M/4. 2006. Specification for Basecourse Aggregate. Transit
New Zealand, Wellington, New Zealand.
Transit. 2008. M/22: Guide to the evaluation of unbound road base and sub-base
aggregates (provisional). http://www.transit.govt.nz/technical/specifications.jsp
Vuong. B.T. 2000. Technical basis in the development of the AUSTROADS Repeated Load
Triaxial Test Method (APRG 00/33) and assessment method of granular materials. ARRB
Transport Research Ltd. Working Document (Unpublished).
Vuong, B. Arnold, G. 2006. Predicting in-service performance of alternative pavement
materials. Land Transport New Zealand Research Report 304. Wellington: Land Transport
New Zealand. 179 pp.

63
Vuong. B.T., Brimble, R. 2000. AUSTROADS repeated load triaxial test method –
determination of permanent deformation and resilient modulus characteristics of unbound
granular materials under drained conditions. APRG 00/33 (MA) June. Sydney:
AUSTROADS.
Vuong, B.T., Brimble, R., Yeo, R., Sinadinos, C. 1998. Some aspects in the development
of the standard repeated load triaxial testing equipment and test procedures for
characterisation of unbound granular materials. Pp 178–204 in ARRB Transport Research
Ltd Conference, 19th, 1998, Sydney, New South Wales, Australia,(Session C).

PERFORMANCE TESTS FOR ROADING AGGREGATES AND ALTERNATIVE MATERIALS
64