performance study of using flooding in industrial wireless sensor networks
TRANSCRIPT
Improving landfill monitoring programswith the aid of geoelectrical - imaging techniquesand geographical information systems Master’s Thesis in the Master Degree Programme, Civil Engineering
KEVIN HINE
Department of Civil and Environmental Engineering Division of GeoEngineering Engineering Geology Research GroupCHALMERS UNIVERSITY OF TECHNOLOGYGöteborg, Sweden 2005Master’s Thesis 2005:22
Performance Study of using Flooding inIndustrial Wireless Sensor NetworksMaster of Science Thesis in Communication Engineering
Filip Bara¢
Chalmers University of Technology
Department of Computer Science and Engineering
Gothenburg, Sweden, September 2011

The Author grants to Chalmers University of Technology and University of Gothenburg the non-exclusive right to publish the Work electronically and in a non-commercial purpose make it accessible on the Internet. The Author warrants that he/she is the author to the Work, and warrants that the Work does not contain text, pictures or other material that violates copyright law. The Author shall, when transferring the rights of the Work to a third party (for example a publisher or a company), acknowledge the third party about this agreement. If the Author has signed a copyright agreement with a third party regarding the Work, the Author warrants hereby that he/she has obtained any necessary permission from this third party to let Chalmers University of Technology and University of Gothenburg store the Work electronically and make it accessible on the Internet. PERFORMANCE STUDY OF USING FLOODING IN INDUSTRIAL WIRELESS SENSOR NETWORKS FILIP BARAĆ © FILIP BARAĆ, September 2011. Examiner: ELAD MICHAEL SCHILLER Chalmers University of Technology University of Gothenburg Department of Computer Science and Engineering SE-412 96 Göteborg Sweden Telephone + 46 (0)31-772 1000 [Cover: An example configuration of a WirelessHART network] Department of Computer Science and Engineering Göteborg, Sweden, September 2011


Abstract
The applications of Industrial Wireless Sensor Networks (IWSN) for Process Automa-tion (PA) are time-critical and subject to strict requirements in terms of end-to-enddelay and reliability of data delivery. A notable shortcoming of the existing wirelessindustrial communication standards is the existence of overcomplicated routing proto-cols, whose adequacy for the intended applications is questionable [4]. The aim of thisthesis is to evaluate a very well known data dissemination concept of �ooding in anindustrial setting, to address the viability of exploiting �ooding and discover the con-sequent constraints and bene�ts for IWSN applications. The vanilla �ooding conceptis recycled by introducing a number of modi�cations to de�ne a location-based routingprotocol, whose performance is then evaluated in the QualNet simulation environment[2]. The simulation results of all scenarios observed show that this lightweight approachis able to meet stringent performance requirements for networks of considerable sizes.Furthermore, it is shown that this solution signi�cantly outperforms a number of con-ventional WSN routing protocols in all categories of interest.
Keywords: Industrial Wireless Sensor Networks, Flooding, latency, packet deliveryratio, WirelessHART.

Acknowledgements
My gratitude goes to Mikael Gidlund, for the support and drive he provided throughoutmy work at ABB and Johan Åkerberg, for his precious feedbacks about programmingissues and real world requirements. I also thank them both for so many useful lessonsabout the scienti�c and industrial community and for not letting me lose the gripon real-world requirements. Having them as supervisors at ABB Corporate Researchmeant a lot.I thank Elad Michael Schiller, my examiner from Chalmers University of Technologyfor the time, support and great deal of understanding and pragmatism that he hasdemonstrated.Finally, I am grateful to my loving parents. Their pride and happiness is my greatestreward.

Contents
List of �gures
List of tables
List of acronyms
1 INTRODUCTION 11.1 Aim and Scope of the Thesis . . . . . . . . . . . . . . . . . . . . . . . . 11.2 Method . . . . . . . . . . . . . . . . . . . . . . . . . . . . . . . . . . . . 11.3 Problem Statement . . . . . . . . . . . . . . . . . . . . . . . . . . . . . . 1
1.3.1 Academia vs. Industry . . . . . . . . . . . . . . . . . . . . . . . . 31.4 Main Contributions . . . . . . . . . . . . . . . . . . . . . . . . . . . . . . 41.5 Outline . . . . . . . . . . . . . . . . . . . . . . . . . . . . . . . . . . . . 4
2 BACKGROUND THEORY AND PREVIOUS WORK 62.1 Basics of IWSN and WirelessHART . . . . . . . . . . . . . . . . . . . . . 62.2 Generic �ooding . . . . . . . . . . . . . . . . . . . . . . . . . . . . . . . 72.3 Flooding-based routing protocols . . . . . . . . . . . . . . . . . . . . . . 8
2.3.1 The existing �ooding-based approaches for conventional WSNs . 82.3.2 Stateless Weight Routing . . . . . . . . . . . . . . . . . . . . . . 13
2.4 Conclusions of State-Of-The-Art literature study . . . . . . . . . . . . . 13
3 THE PROPOSED LIGHTWEIGHT SOLUTION 153.1 Properties of the proposed �ooding-based approach . . . . . . . . . . . . 153.2 TDMA scheduling support and mathematical constraint on maximum
network size . . . . . . . . . . . . . . . . . . . . . . . . . . . . . . . . . . 163.3 The forwarding criteria . . . . . . . . . . . . . . . . . . . . . . . . . . . . 18
4 SIMULATION SETUP 214.1 Simulation parameters . . . . . . . . . . . . . . . . . . . . . . . . . . . . 214.2 Implementation . . . . . . . . . . . . . . . . . . . . . . . . . . . . . . . . 234.3 Simulation scenarios . . . . . . . . . . . . . . . . . . . . . . . . . . . . . 234.4 The in�uence of Rayleigh fading and SNR-based reception model . . . . 244.5 Evaluation criteria . . . . . . . . . . . . . . . . . . . . . . . . . . . . . . 254.6 Delimitations and assumptions . . . . . . . . . . . . . . . . . . . . . . . 26
5 SIMULATION RESULTS 275.1 Scenario A: Average end-to-end delay evaluation . . . . . . . . . . . . . 275.2 Scenario B: Robustness to node failure . . . . . . . . . . . . . . . . . . . 285.3 Scenario C: Robustness to severe channel conditions . . . . . . . . . . . 295.4 Scenario D: Constraints in terms of node population size . . . . . . . . . 305.5 Scenario E: Complexity comparison . . . . . . . . . . . . . . . . . . . . . 325.6 Scenario F: Energy consumption . . . . . . . . . . . . . . . . . . . . . . 32
6 CONCLUSION 346.1 Future work . . . . . . . . . . . . . . . . . . . . . . . . . . . . . . . . . . 35
7 PUBLICATION 36
Appendix A 43

Appendix B 43
References 49

List of Figures
1 An example con�guration of a WirelessHART network . . . . . . . . . . 72 Di�erent �ooding based approaches . . . . . . . . . . . . . . . . . . . . . 103 θ - transmission virtual aperture of the node ∆ . . . . . . . . . . . . . . 124 Sequence of transmissions for the network in Figure 11 . . . . . . . . . . 185 Dependency of PDR on Rayleigh fading model used . . . . . . . . . . . 256 Packet delivery ratios for Scenario B (node failure) . . . . . . . . . . . . 297 Average end-to-end delay as a function of network size . . . . . . . . . . 318 Normalized energy consumption in Transmit mode . . . . . . . . . . . . 339 Normalized energy consumption in Receive mode . . . . . . . . . . . . . 3310 Normalized energy consumption in Idle mode . . . . . . . . . . . . . . . 3311 IWSN model for Scenario A1 . . . . . . . . . . . . . . . . . . . . . . . . 4412 IWSN model for Scenario A2 . . . . . . . . . . . . . . . . . . . . . . . . 4413 IWSN model for Scenario B . . . . . . . . . . . . . . . . . . . . . . . . . 4514 IWSN model for Scenario C1 . . . . . . . . . . . . . . . . . . . . . . . . 4515 IWSN model for Scenario C2 . . . . . . . . . . . . . . . . . . . . . . . . 4616 IWSN model for Scenario C3 . . . . . . . . . . . . . . . . . . . . . . . . 46

List of Tables
1 Typical Requirements for Industrial Wireless Sensor and Actuator Net-works in the Process Automation Domain [4] . . . . . . . . . . . . . . . 5
2 The summary of simulation parameters . . . . . . . . . . . . . . . . . . . 233 The number of sent packets by every node for di�erent values of Tcbr . . 274 Average end-to-end delays and PDRs for fading-free scenarios . . . . . . 285 Recovery times for node failure scenario . . . . . . . . . . . . . . . . . . 296 Average end-to-end delays and PDRs for di�erent scenarios under Rayleigh
fading . . . . . . . . . . . . . . . . . . . . . . . . . . . . . . . . . . . . . 307 Maximum network sizes and average end-to-end delays for the proposed
approach . . . . . . . . . . . . . . . . . . . . . . . . . . . . . . . . . . . . 318 Normalized number of events executed for various routing protocols . . 32

List of acronyms
ACK Acknowledgment
AES Advanced Encryption System
AODV Ad hoc On-Demand Distance Vector routing
BER Bit Error Rate
CBR Constant Bit Rate
CSMA/CA Carrier Sense Multiple Access/Collision Avoidance
DSR Dynamic Source Routing
DYMO Dynamic MANET On-demand routing
IP Internet Protocol
IWSN Industrial Wireless Sensor Network
LAR1 Location-Aided Routing version 1
MAC Medium Access Control
OLSR Optimized Link State routing
PA Process Automation
PDR Packet Delivery Ratio
PHY Physical layer
QoS Quality of Service
RSS Received Signal Strength
SNR Signal-to-Noise-Ratio
STAR Source Tree Adaptive Routing
TDMA Time Division Multiple Access
TTL Time To Live
TCP Transmission Control Protocol
UDP User Datagram Protocol
WirelessHART Wireless Highway Addressable Remote Transducer
ZRP Zone Routing Protocol

1 INTRODUCTION
1.1 Aim and Scope of the Thesis
The purpose of this work is to address one of Achilles' heels of the existing IWSNstandards - real-time data delivery, i.e. average end-to-end delay. The task is toinvestigate the feasibility of implementing �ooding in IWSNs, to pinpoint the possibletrade-o�s involved and to estimate the maximum network sizes that can support theo�ered tra�c load, with respect to the timing and reliability constraints. The proposedapproach is cross-layer, and all considerations are con�ned to uplink data dissemination.
1.2 Method
The �rst stage of the project is a comprehensive State-of-the-art literature study, withthe aim to examine already proposed solutions for real-time data delivery in IWSNs,focusing on �ooding-based and lightweight methods. The second phase is de�ning alightweight routing protocol with the desired properties, followed by its implementationin the QualNet simulation environment [2]. The proposed solution is then assessedwith respect to the de�ned performance requirements and compared with a number ofexisting routing protocols for ad-hoc networks, in a variety of scenarios.
1.3 Problem Statement
Industrial Wireless Sensor Networks (IWSN) for Process Automation (PA) are slowlyreplacing their wired counterparts. Although the penetration rate of IWSN is only sev-eral percent today, the introduction of IWSNs has taken the properties of a trend andattracts considerable attention. A recently conducted survey by ON World corporationhas shown that more than half out of 105 industrial end users questioned are planningto deploy IWSN solutions over the next 18 months [41].
The main motivation for development of wireless control standards is cost reduction- the deployment costs of wired sensor networks for PA are immense, especially foro�-shore installations. According to [28], wiring and installation can make up to 90%of the device cost. Another advantage of IWSNs is their ease of deployment; if the needemerges (e.g. if an industrial process is chronically misbehaving), an ad-hoc WirelessSensor Network (WSN) can be easily set up.
1
The role of an IWSN is to continuously report sensor data and deliver it in real time, inorder to stabilize the unstable processes and maximize the production rate. In IWSNs,the data tra�c represents the sensor readings and control information from the con-troller to sensors and actuators. QoS in the IWSN sense translates to reliable datadelivery within the prede�ned deadlines [25]. Typical performance requirements arelisted in Table 1. They are application-speci�c and can only be presented in the formof a range of values.
However, the advantages of wireless control have not been fully exploited. Park etal. [30] identify a dichotomy in the design of existing standards, arguing that processengineers have authored the application software, while the communication engineerswere responsible for the communication aspect. This, they claim, gave rise to a lack offull-picture understanding of challenges and constraints, resulting in suboptimal solu-tions.
A notable shortcoming of current wireless industrial communication standards is theexistence of overcomplicated routing protocols, whose adequacy for intended applica-tions is questionable [4]. The existing industrial communication standards, such asWirelessHART [1] use conventional routing protocols, which rely on routing tables andgraphs and some kind of routing infrastructure, i.e. control message exchange. IWSNcommunication is multihop, and distributed routing algorithms are highly preferable.Data dissemination techniques used in today's industrial communication are inadequatein several aspects:
• Path recalculation: channel conditions vary quite rapidly in industrial environ-ments, due to the presence of good electrical conductors, moving objects andradio interference [20]. In such a setting, link failures are frequent, so routingpaths have time-limited validity. A broken link can trigger a tedious system re-covery process, which leads to routing path recalculation and, consequently, longintervals of IWSN's unavailability [5]. The use of routing tables, which requirebuilding and continuous maintenance is an obstacle to �exibility.
• Control message overhead: the exchange of routing tables and messages usedfor network self-recovery or node-discovery poses a signi�cant communicationoverhead.
• Packet retransmissions: transport layer protocols running on top of ACK-basedrouting protocols initiate retransmissions in case of unsuccessful packet delivery.Having in mind the high dynamics of the observed processes, the data acquired byretransmissions is most probably outdated. Common sense suggests that, insteadof resending an old piece of data, transmission of a newer measurement shouldtake place.
Thus, it is reasonable to assume that a lightweight, no-frills routing protocol couldeliminate some or all of these inadequacies. Flooding is the most rudimentary routingtechnique, where every node in the network broadcasts all the packets that it receivesor generates. The most obvious advantage of such an approach is its utter simplicity.There would be no need for exchanging control messages between the nodes and in caseof link failures the routing paths would not have to be recalculated. Node failures wouldrequire no reaction from the network layer, so the transition to the new constellation
2

would be seamless.
Another signi�cant advantage of �ooding over conventional routing protocols is thatthe data is delivered via multiple paths, which enhances redundancy and reliability.The routing information exchange in �ooding is virtually non-existent, which leavesmore tra�c capacity for the actual data tra�c. However, the number of multiple pathsshould be limited, in order to avoid the network congestion - one of the major causesof increased latency. The key is to limit the physical scope of forwarding and �nd thedelicate balance between tra�c load, speed and reliability of delivery.
1.3.1 Academia vs. Industry
One can identify numerous discrepancies between the academic approach to routing inconventional WSNs and the requirements of IWSN communication, set by the indus-trial community. Some of these di�erences are listed below, not necessarily in the orderof signi�cance.
Network size - the academic community quite often considers WSNs consisting ofhundreds and even thousands of nodes. In an industrial environment, a more realisticdeployment is a number of smaller, physically distributed networks consisting of tens ofnodes. Each of these networks has an Access Point, which the sensor nodes deliver theirmeasurements to, and which is connected to the Network Manager via a fast backbone.Having in mind that the maximum throughput in WirelessHART is 250 kbit/s [1], itis unlikely that hundreds of nodes could communicate via such channel, while meetingthe strict deadlines listed in Table 1. Smaller IWSN deployments can greatly simplifyrouting and reduce the maximum number of hops in the network.
Energy consumption - the existing routing protocols often aim at optimizing theperformance with respect to the energy consumption, while sacri�cing latency. How-ever, in an industrial environment, su�cient power supply is often readily available[19], and IWSN nodes are usually not battery-powered.
Downlink - the actuators are no less important than sensors in IWSN. Their jobis to act upon the unacceptable behavior of the process and this downlink commu-nication between the Network Manager and the actuators must be reliable and fast.WirelessHART standard de�nes a best-e�ort downlink, which is not acceptable in thissetting. This issue and its potential solution have been thoroughly discussed in [3].The issue of downlink is beyond the scope of this Thesis.
Node placement and spatial redundancy - contrary to generic WSNs, the nodeplacement in IWSN is deterministic and aimed at observing particular physical phe-nomena. Unlike in WSNs, each IWSN sensor measurement is unique and cannot bereplaced by data from another sensor.
Centralized architecture - IWSNs are centralized systems, supervised by the Net-work Manager, as opposed to conventional WSNs which are usually self-con�gurable[18].
3
1.4 Main Contributions
The main contributions of this work are:
• Starting from the generic form of �ooding, a number of modi�cations is proposedin order to make it utilizable for uplink in IWSN applications.
• The performance of the proposed solution is evaluated in a WirelessHART-likenetwork using a discrete-event simulator and it is shown that, if appropriatelymodi�ed, �ooding can be used as a data distribution technique in IWSNs.
• An analytical expression is given for the maximum feasible network sizes, withrespect to the adopted evaluation criteria. The validity of the formula is thenveri�ed by experimental results.
Parts of this work are summarized and published in [8].
1.5 Outline
Section 1 (this section) describes the purpose and scope of this Thesis, as well as terms,abbreviations and acronyms used. It places the problem into the industrial setting andpinpoints the discrepancies between the academic and industrial approach to WSN, aswell as some shortcomings of the existing WirelessHART standard. Finally, it highlightsthe contributions of this Thesis. Section 2 discusses the data dissemination paradigmin IWSN and presents the previous work in the area.
Section 3 discusses the proposed solution in depth. Section 4 presents the QualNet sim-ulation environment and motivates the selection of simulation parameters. Section 5contains the simulation scenarios and the results obtained.
Section 6 summarizes the conclusions of this Thesis. The conference paper derived fromthis work, which is to appear in IECON '11, is appended in Section 7. Appendices Aand B contain some experiences from using QualNet, as well as node placement in thescenarios used throughout this work. The �nal section references the source material.
4

Table
1:TypicalRequirem
ents
forIndustrialWirelessSensorandActuatorNetworksin
theProcess
AutomationDomain
[4]
SensorNetwork
Applica-
tions
Delay
Range
Battery
Lifetime
Update
Frequency
Security
level
Monitoring
and
supervi-
sion
Vibration
sensor
s100m
3years
sec-days
low
Pressuresensor
ms
100m
3years
1sec
low
Tem
perature
sensor
s100m
3years
5sec
low
Gas
detectionsensor
ms
100m
3years
1sec
low
Closedloopcontrol
Controlvalve
ms
100m
>5years
10−
500ms
medium
Pressuresensor
ms
100m
>5years
10−
500ms
medium
Tem
perature
sensor
ms
100m
>5years
500ms
medium
Flowsensor
ms
100m
>5years
10−
500ms
medium
Torquesensor
ms
100m
>5years
10−
500ms
medium
Variablespeeddrive
ms
100m
>5years
10−
500ms
medium
InterlockingandControl
Proximitysensor
ms
100m
>5years
10−
250ms
medium
Motor
ms
100m
>5years
10−
250ms
medium
Valve
ms
100m
>5years
10−
250ms
medium
Protectionrelays
ms
100m
>5years
10−
250ms
medium
5

2 BACKGROUND THEORY AND PREVIOUS WORK
The maximum transmission power in WSN is limited due to wireless network coexis-tence and human safety reasons. WSNs usually cover areas signi�cantly larger thanthe maximum transmission range, so sensor data delivery must be accomplished viamultihop communication, where routing protocols de�ne the behavior and mutual co-operation of the nodes. Data dissemination in IWSN is signi�cantly di�erent fromconventional communication networks [6]: the communication paradigm on the uplink(sensor to sink) communication is many-to-one, so-called convergecast.
Two major performance measures in IWSN are end-to-end delay and packet deliveryratio (PDR), which quantify the speed and reliability of data delivery. However, thevalue of average end-to-end packet delay is insu�cient for assessing the IWSN per-formance, because jitter value excursions can be large, causing delivery of outdatedmeasurements, although the average delay value might be in the acceptable limits.IWSN applications are time-critical and it is necessary to determine the upper boundof the delay.
2.1 Basics of IWSN and WirelessHART
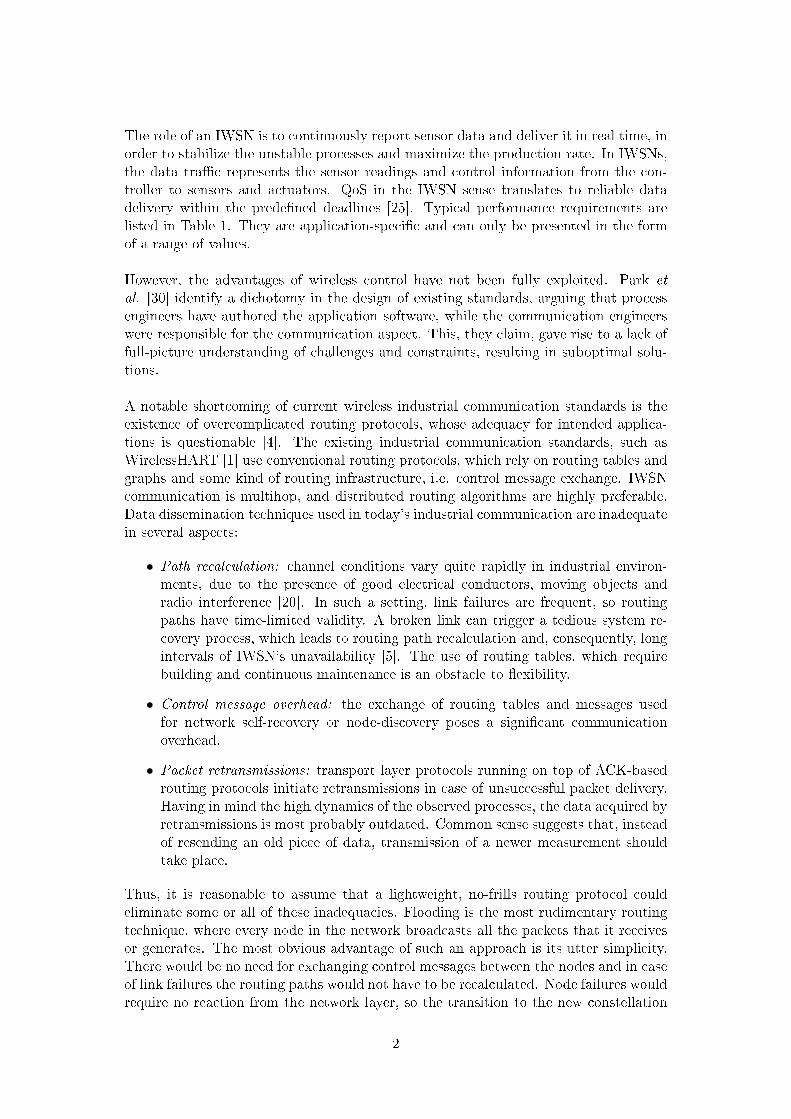
WirelessHART standard, de�ned by the HART Foundation in September 2007, is the�rst standard for wireless control and process measurement [3]. The relevant entitiesin a WirelessHART network are [1, 34]:
• Field devices: Sensors and Actuators, whose role is to monitor the industrialprocess and act upon its behavior, respectively; some �eld devices only act asrouters.
• Gateway: a single device that serves as a bond between the wireless network(which comprises �eld devices) and the Network Manager.
• Access Point: a part of the Gateway, in charge of immediate communication withthe wireless network; also referred to as sink.
• Network Manager: a part of the Gateway device, responsible for con�gurationand maintenance of the wireless network, as well as the crucial communicationissues, such as scheduling and routing.
6

Figure 1: An example con�guration of a WirelessHART network
• Security Manager: manages session keys and prevents possible attacks on thenetwork by using 128-bit AES encryption.
• Adapters: enable communication between the wired �eld devices via wirelessnetwork.
• Handheld devices: devices operated by the factory personnel; used for diagnosticsand maintenance.
WirelessHART adopts IEEE 802.15.4-2006 standard at the Physical layer, with trans-mission frequency in the 2.4 GHz Industrial Scienti�c Medical band. The data rates ofup to 250 kbit/s are supported, and the system operates on one of 16 possible channelsat a time. WirelessHART de�nes its own MAC layer [34] which is Time Division Mul-tiple Access - based, but the frame format is in accordance with IEEE 802.15.4-2006standard. Time is divided into superframes consisting of 10 ms timeslots. The Net-work Manager grants the �eld devices permission to send or receive, by assigning thema number of timeslots. Dedicated timeslots are reserved for particular transmitters, asopposed to shared slots, whose assignment is CSMA/CA contention-based. Frequencyhopping is performed at every timeslot. In order to increase the robustness of thesystem, Direct Sequence Spread Spectrum technique is employed as well. The remain-ing layers in WirelessHART protocol stack are Network, Transport and Applicationlayer. The observed industrial process is sampled typically every 10 - 500 ms and themeasurements are reported to the Controller via Access Points.
2.2 Generic �ooding
Flooding is a data dissemination technique, where a node forwards the message it hasreceived to all of its neighbors, except to the one it received the message from. Itis the simplest data forwarding technique, and its generic form exhibits a number ofdrawbacks [42, 29]:
• Implosion: multiple copies of the same packet are delivered to the sink, becausea node might receive and forward the same packet twice, or a packet may travelmultiple paths, getting replicated at every intermediate node.
7

• Broadcast storm [38]: �ooding can produce extreme amounts of redundant tra�c,due to the exponential rise in number of packets in the network after every hop.The network overload can be avoided by selective dropping of packets, but someredundancy should still remain, due to its positive e�ect on reliability.
• Endless packet wandering: due to a lack of propagation directivity, a packet canwander around the network for a long time, never reaching the destination andoccupying precious network resources. This issue can be solved by limiting theTime To Live (TTL) value in the packet or by introducing the delivery deadlines.
• Resource blindness: this shortcoming refers to the excessive consumption of tra�cresources and energy.
Due to previously mentioned reasons, �ooding is rarely used as a way of conveyinginformation per se in WSN. Instead, it is most often used for route discovery and setupand in the network initialization phase [43]. Watteyne et al. [40] claim that classical�ooding is unsuitable for convergecast, which is the communication paradigm in IWSNand argue that �ooding has latency issues, since �nding the optimum routing path isusually not its primary objective.
The simplicity of �ooding is non-disputable - it is an infrastructure-less, aggressive datadissemination technique. However, it requires re�nement in order to exploit its potentialadvantages. There exist routing protocols which are based on �ooding approaches andaim at removing the �ooding overhead and improving energy e�ciency. The consequenttra�c load reduction leads to reduction of end-to-end delay as well.
2.3 Flooding-based routing protocols
2.3.1 The existing �ooding-based approaches for conventional WSNs
This subsection gathers the �ndings of State-Of-The-Art literature study of �ooding-based routing protocols for WSN. The majority of solutions eliminates broadcast stormsin one of the three following ways:
1. Randomizing the packet forwarding decision - the message is forwarded only toa subset of neighbors, chosen via a probabilistic algorithm. This is the propertyof Probabilistic approaches [14], illustrated in Figure 2(a).
2. Calculating the back-o� time based on some parameter, e.g RSS of the receivedpacket or the distance traveled during the previous hop [37, 22] :
tbackoff ∼1
f(RSS, distance)(1)
This approach is depicted in Figure 2(b).
3. Threshold-based approaches compare e.g. the RSS or the distance traveled duringthe previous hop to a threshold, as depicted in Figure 2(c). A node shall forwardthe packet only if the value of RSS is below a certain value or if the previoushop is located more than a certain distance away. This distance is the radiusof the red arc in Figure 2(c), and only the nodes outside the arc are allowed toretransmit the packet coming from the node located in teh center of the arc. The
8

Algorithm 1 The algorithm of threshold-based approaches
1: Receive(packet)2: if (((RSS ≤ threshold) ∨ (d(previous, current) ≥ threshold)) = TRUE) then3: forward(packet)4: else5: discard(packet)6: end if7: Go to waiting mode
RSS in this sense is considered a distance indicator, meaning that its value isinversely proportional to the distance traveled during the previous hop.
The use of �ooding is frequently encountered in the WSN literature, and the conclu-sions are presented in Subsection 2.4.
Intanagonwiwat et al. [21] show that asynchronous CSMA/CA �ooding exhibits highlatency, but argue that �ooding with TDMA on the MAC layer should perform faster,due to absence of collisions and random back-o� delays. Lu and Whitehouse [26] pro-pose an asynchronous �ooding strategy, named Flash Flooding, and show that thistechnique approaches the theoretical lower latency bound, outperforming traditionallatency approaches by 80%. This approach requires changes on the Physical and MAClayers and is not applicable in the sphere of interest of this work, which must employTDMA on the MAC layer.
Gossiping [14] is an attempt to address the �ooding overhead problem at the expenseof increased delay. The forwarding node will pass the packet to a randomly selectedsubset of neighbors. Gossiping shows bimodal behavior, meaning that, for forwardingprobabilities below a certain threshold, the gossiping dies out. Li et al. [13] claimthat this threshold is between 0.6 and 0.8, for a su�ciently large network. Haas et al.[13] claim that gossiping sets up routes that are 10-15% longer than the ones found by�ooding, for di�erent gossip probabilities.
Flossiping [44] was proposed in order to achieve a zero-overhead resource-aware routing.It operates in two modes. In the gossiping mode, the sending node randomly selectsa neighbor to deliver its packet to. Other neighbors receive the packet as well, andthey all generate a random value, which, when compared to a prede�ned threshold inthe packet header, will decide whether they will retransmit the packet or discard it.These neighbors are said to be in the �ooding mode. By adjusting the threshold valuebetween 0 and 1, Flossiping can scale to either single-branch gossiping or �ooding. Themain advantage is its scalability and the compromise between the power e�ciency ofgossiping and reduced delay of �ooding.
Graded Back-o� Flooding [37] is a distance-based �ooding strategy. It is a cross-layersolution, where the smaller forwarding back-o� times (i.e. MAC priority) are givento the packets coming from senders further away. If the same message is heard by anode more than once, it is discarded. The distance is determined by measuring theRSS, which is not a reliable indicator, due to its intensive variations in an industrialenvironment.
9

(a) Probabilistic approach
(b) Distance-based approach
(c) Threshold-based approach
Figure 2: Di�erent �ooding based approaches
10

Wang et al. in [39] �nd the best retransmission candidate as the one whose retransmis-sion would cover the largest, yet uncovered, area. This is a time-consuming procedurewith high latency, and it is not convergecast, but broadcast in nature. Most impor-tantly, it is blind - there are no guarantees that there will be any nodes in the newfootprint.
Li et al. [13] suggest a hybrid of routing and �ooding technique. The fundamentalassumption is that single-path routing is unreliable and that �ooding is redundant.Hence, the message is �rst �ooded across a certain region of the network, resulting inseveral nodes coming in the possession of it. These nodes then use some conventionalrouting protocol to deliver the message to the sink along multiple paths. This protocolis primarily designed for WSN of hundreds and thousands of nodes where packets makequite long journeys. IWSNs are usually 2-3 hop mesh networks, and there is probablyno time or space to shift between the two techniques during such a short journey.
Jeong et al. [22] propose a cross-layer counter-based �ooding modi�cation, where thedistance between sender and receiver is found from the received signal strength andthen used to calculate the retransmission back-o� time, which is inversely proportionalto the signal strength. This way, the priority is given to the transmissions that reachfarthest from the source. A counter is used for duplicates of received packets and theback-o� time will be directly proportional to it. One drawback of this scheme is thelack of synchronization, because the MAC layer of WirelessHART is TDMA-based andonly a few slots are up for grabs. Furthermore, as previously mentioned, RSS is anunreliable measure due to its fast variation, which can result in inaccurate relativelocation estimate. Finally, this is a broadcast protocol and duplicate transmissions tothe same node do not �t well with the strict timing requirements.
Baghaie et al. [7] propose Fast Flooding with Cooperative Transmissions, where nodescombine signals from di�erent senders at the Physical layer, claiming that the �oodingtime scales only logarithmically with the network size. The results show that this tech-nique delivers data faster than conventional �ooding. The authors suggest no constrainton the physical scope of �ooding, which can congest the network. Furthermore, theprotocol was designed for broadcast, which does not correspond to the IWSN paradigmof convergecast.
Single Gossiping with Directional Flooding (SGDF) [42] de�nes an initialization phaseaimed at setting up gradients from the sink to the every node in the network. Gradientis equivalent to hop count, it tells about the distance to the sink and is used to �nd theshortest path. The sink broadcasts a hello message containing a threshold value andthe gradient set to 1. Nodes receive this message, save the threshold and examine thegradient. A node receiving a hello message compares the gradient value in the messagewith its own. If the former is smaller, new gradient is being saved, the gradient value inhello message is incremented and it is forwarded further; otherwise, the hello messageis discarded. The data source combines elements of gossiping and �ooding in orderto propagate the information. First it determines the set of potential next-hop nodesusing a directional �ooding criterion, and chooses the next hop in the gossip-like way.Namely, source polls its neighbors prior to transmission, and randomly selects thenext hop among the neighbors with smaller gradient. If no neighbors have a smallergradient, one with equal gradient is randomly selected. Otherwise, source randomlychooses any neighbor for next hop. The non-selected nodes generate a random value
11

and compare it with previously mentioned threshold. If the generated value is smallerthan threshold, the node enters directional �ooding mode, where it forwards the dataonly to the neighbors with smaller gradient. By varying the threshold value from 0to 1, SGDF can be scaled from pure gossiping to directional �ooding. This impliesa trade-o� between small overhead of gossiping and high delivery ratio of directional�ooding. If p(i) and R(i) are packet overhead and packet delivery ratio, for threshold i,respectively, then for the given distribution of weighting factor x, the optimal thresholdTh is:
Th = xR(1.0)−R(i)
R(1.0)−R(0)+ (1− x)
p(i)− p(0)
p(1.0)− p(0)(2)
A potential drawback is that hello message can go too far in one round of hops dueto varying channel conditions, providing a too optimistic hop distance. The results ofsimulations show that SGDF exhibits slightly higher delay than �ooding, for value ofx between 0.4 and 0.6. This protocol is inadequate for industrial control applicationsdue to its complexity and increased latency, caused by polling.
Farivar et al. propose Directed Flooding [11], where nodes are allowed to rebroadcastonly if they are located inside the directional virtual aperture of the sender, concen-trated around the straight line that connects source and the sink.
Figure 3: θ - transmission virtual aperture of the node ∆
In Figure 3, nodes α and β are in the transmission aperture of node ∆, whose initialsize is φ. Aperture size θ can be chosen as:
θ = nφ± φ
2, n = 0,±1± 2, ...; |θ| ≤ π (3)
Every neighboring node can determine by itself whether it is inside the aperture usingthe following criterion and information about sender coordinates and aperture size:
θ − φ
2≤ arctan(
Xcurrent −Xprevious
Ycurrent − Yprevious) ≤ θ +
φ
2(4)
If the condition is satis�ed, node retransmits the packet and waits for acknowledgments.If it does not receive any, it rotates the aperture clockwise by a prede�ned angle. Theprocess repeats, and if still no acknowledgments arrive, the aperture is mirrored aroundangle θ=0. Duplicated packets are discarded. A shortcoming of this protocol are the
12

retransmissions, which, as previously mentioned, are an undesired feature in real-timedata dissemination.
Directed Flooding with Self-Pruning [12] is an enhancement of Directed �ooding. Thisapproach further reduces �ooding redundancy by introducing additional criteria forrebroadcast. Namely, a node checks whether the packet was retransmitted before,whether it is outdated, and whether there exists su�cient energy for retransmission.If the packet passes all these checks, a random assessment delay is introduced, duringwhich, if no acknowledgments for the packet are heard, packet ultimately gets resent.Purposely increasing the delay in a time-critical application such as wireless industrialcontrol is far from desired.
2.3.2 Stateless Weight Routing
Soyturk and Altilar [35] propose a concept of weights in the routing process. Theysuggest that a node's weight can be calculated from node's position (relative to thesink), and parameters such as link quality between the current and the potential nexthop or current tra�c conditions and congestion. Every intermediate node inserts itsown weight and destination's weight into the packet (weight of the sink is zero) andbroadcasts it. The receiving node compares these values with its own weight anddecides whether to rebroadcast or drop the packet. The goal is to forward the packettowards the node with a smaller weight than sender's, whereas the sink is assigned theweight equal to zero. The weight of node k is:
wk = flocation(k) + flink(k) + ftraffic(k) (5)
This approach gives the possibility of optimizing on certain network parameters, byincluding them into the weight formula. The second term of the equation refers to thenode-speci�c parameters, such as Link Quality Indicator between the current and thepotential next hop. The third term can include network parameters, such as currenttra�c conditions and available space in node bu�ers. Additionally, a threshold can beintroduced to create the minimum value of the weight di�erence that will be su�cientfor broadcast. This way, the number of retransmitters is reduced - the nodes closer tothe sender have smaller chances of being chosen for rebroadcast and only the biggestcontributors will be allowed to retransmit.
2.4 Conclusions of State-Of-The-Art literature study
The presented approaches refer to conventional WSNs and, as such, are inadequate forIWSN applications for several reasons:
• Network size: as previously mentioned, ordinary WSNs can contain up to severalhundreds and thousands of nodes, while IWSNs are most often limited to tens ofnodes. The majority of routing protocols mentioned in this section are designedfor conventional WSNs and some of the directed �ooding/gossiping protocols havevery sophisticated �ood direction/next hop selection mechanisms whose conse-quent bene�ts could not come to the fore in a small sensor population such asIWSN. Industrial WSN deployments are usually 2- or 3- hop networks.
13

• Randomness: randomness in the forwarding decision-making is unacceptable, be-cause industrial control applications require deterministic latency and reliabledelivery.
• Coverage: almost all of the presented �ooding-based solutions aim at coverage,rather than convergecast, which is the case with IWSN.
Only certain aspects of the solutions presented above are utilizable for IWSN applica-tions. In particular, the location-based concept of SWR and threshold-based principleare used in de�ning the proposed solution. The extracted value of the literature studyhas to do with the ways to reduce and control �ooding tra�c, as well as location-basedforwarding criteria.
14

3 THE PROPOSED LIGHTWEIGHT SOLUTION
3.1 Properties of the proposed �ooding-based approach
The proposed lightweight solution has virtually no control message exchange nor rout-ing infrastructure, in order to minimize the tra�c overhead and increase the e�ciencyof tra�c resources. Furthermore, there is no heavy burden of path recalculation trig-gered by link failures. Algorithm of the proposed solution is shown below, preceded byits formal description. The key features of the proposed solution are:
• A distributed routing algorithm: each intermediate node independently de-cides whether to retransmit or discard the received packet. All the informationnecessary for making the forwarding decision is extracted or derived from thecontent of data packets.
• Location-based protocol: it is assumed that nodes are aware of their physicalwhereabouts and are able to compute their own distance to the sink dk. If wede�ne (xk, yk, zk) as the Cartesian coordinates of the node k, its distance to thesink is:
dk = flocation(k) = (xk − xsink)2 + (yk − ysink)2 + (zk − zsink)2 (6)
As previously stated, node placement in IWSN is deterministic and �xed, sothere is no need to implement complex positioning algorithms. The positioncan be determined externally (by the operator) and downloaded into the node'smemory. Each packet contains the coordinates of its previous hop, and thisinformation is used in order to provide constant advancement towards the sink.The position of the sink is adopted as the center of the Cartesian coordinatesystem, and all coordinates are de�ned with respect to this point.
• Duplicate packet handling: every transmitted packet contains an (i, s) pair,where i stands for the source node address and s is the unique application payloadidenti�er, called the sequence number. The i parameter unambiguously identi�esthe originating node, while s is unique for every piece of data sent by that node.Every node should manage a container to store (i, s) pairs of seen packets. Upon
15

reception of a packet, its (i, s) pair is extracted and examined. If the packet wasreceived before, it is discarded.
• Handling of outdated packets: a deadline equal to the sensor refresh rate isintroduced. Each node compares the age of incoming packet with the deadline,and if the packet is outdated, it is discarded. This feature is introduced in order tofree up tra�c resources from old packets. The packet generation time is insertedinto every piece of data at the generating node, so it is available to every recipientof the packet in question.
• TTL limitation: IWSN deployments consist of several dozens of nodes. Theoutliers in IWSNs are usually not more than 3 hops away from the sink and theTTL �eld of data packets should be set with respect to the network topologyfor two reasons; �rstly, since the number of packets grows rapidly with eachhop, network congestion will occur quite fast, unless packet lifetime is limited.Secondly, as previously mentioned, the IWSN sensor measurements get outdatedafter certain time, and delivery of outdated packets is meaningless. Hence, TTLvalue in the IP header is limited to 2 or 3.
• Cross-layer support: the considerations of this work are not fully con�nedto the Network layer and the routing protocol. In order to further enhance theperformance of the proposed solution, a simple TDMA scheduling principle is uti-lized: the nodes that lie one hop away from the sink are assigned more timeslotsfor transmission, because they serve as both sources and forwarders of networktra�c. This will be explained in more detail in Subsection 3.2.
3.2 TDMA scheduling support and mathematical constraint on max-
imum network size
The MAC layer protocol assumed in this work is TDMA with timeslot duration ofTslot = 10 ms, in order to converge to WirelessHART protocol stack. In TDMA net-works, the time is divided into slots, and only one node may transmit during oneparticular slot. The number of receiving nodes during a timeslot is arbitrary. In con-ventional battery-powered WSNs, nodes go to idle state for as long as possible and areactivated only when they are scheduled for listening/transmitting. IWSNs do not havethis constraint, so the number of listening nodes within a timeslot is not limited.
The timeslots are grouped into superframes. We assume that TDMA networks operatein cycles and duration of a cycle is equal to the superframe duration - during one cycle,each sensor reports its measurement at least once. A certain number of nodes is placedmore than one hop away from the sink, which they can reach via a number of forwardingnodes. One of the evaluation criteria (which will be de�ned in Subsection 4.5) imposesa deadline on the end-to-end delay, meaning that all the packets with end-to-end delaylarger than sensor refresh rate are deemed as outdated. This constraint is shown belowand the values involved stand for end-to-end delay Te2e and sensor refresh rate Tcbr,respectively:
Te2e ≤ Tcbr (7)
16

The following assumptions hold for the considerations below:
• Networks with maximum two hops in radius are considered: the outliers are atmost two hops away from the sink.
• All sensors have equal refresh rates - they send out measurements at equal inter-vals.
Since the duration of one superframe equals the duration of one cycle (in which everynode will send its reading to the sink at least once), the following condition must beful�lled as well:
Tcbr ≥ Tsuperframe = Tslot × nslots (8)
In the above inequality, nslots is the total number of slots in one superframe. The times-lots are delegated to particular nodes and each node must have at least one guaranteedtimeslot. The nodes in the �rst tier (i.e. nodes that are one hop away from the sink)must be assigned additional timeslots, because they must deliver their own readingand forward readings of their neighbors in the second tier. The number of additionalslots is equal to the number of second-tier neighbors that ful�ll the forwarding condi-tions, de�ned in Subsection 3.3. Finally, if we de�ne the following variables: nnodes -the number of nodes in the network; n1st, n2nd - the number of nodes in the �rst andsecond tier, respectively; xi - the number of �rst-tier neighbors of a second-tier node i,whose forwarding conditions are ful�lled by node i, then the following condition mustbe satis�ed:
nslots =TcbrTslot
≥ nnodes +∑
i,2ndtier
xi (9)
This is equivalent to:
nnodes ≤TcbrTslot
−∑
i,2ndtier
xi (10)
In other words, the maximum number of nodes that a network can serve (under thepreviously de�ned assumptions), depends on the sensor refresh rate, timeslot durationand the number of forwarders for all second-tier nodes. The summation in equation 10equals the sum of �rst-tier forwarders for all second-tier nodes i.e. the total number oftimeslots within one cycle that must be allocated for forwarding.
Previous considerations are related to the total number of nodes that can be scheduledfor the given number of slots (i.e. given Tcbr). Another issue is the order of transmis-sions, whereas in this work a simple algorithm is applied: �rst-tier nodes are �rst givenchannel access (i.e. granted permission to transmit), in the clockwise direction, startingfrom an arbitrary �rst-tier node. After all �rst-tier nodes have transmitted, the slotsare assigned to the second-tier nodes, whereas each second-tier node transmission isfollowed by mi slots, where mi is the number of �rst-tier neighbors of node i. Thisway, an immediate delivery of data from the second tier to the sink is accomplished.The order of transmissions during one cycle for the network from Figure 11, is shownin Figure 4.
17

Figure 4: Sequence of transmissions for the network in Figure 11
3.3 The forwarding criteria
Whether or not a received packet will be rebroadcast depends solely on the �ve for-warding conditions, which all must hold in order for the retransmission to take place.The pseudocode of the proposed approach is shown below, followed by the de�nitionof all �ve forwarding conditions.
Algorithm 2 The proposed solution
1: Receive a packet (i, s)2: if (C1 ∧ C2 ∧ C3 ∧ C4 ∧ C5 = TRUE) then3: insert (i, s) in table4: forward(i, s)5: else6: discard(i, s)7: end if8: Go to waiting mode
Condition C1 states that a received packet will be considered for forwarding if its ageTage is not more than the refresh rate Tcbr of its originating sensor:
Tage ≤ Tcbr (11)
The justi�cation of this condition is related to one of the two evaluation criteria pre-sented in Subsection 4.5.
Condition C2 holds true for an (i, s) pair if the output of function unseen(i, s) islogical TRUE, i.e. if a pair (i, s) does not already exist in the container of seen (i, s)pairs:
C2 = unseen(i, s) (12)
18

Nodes have limited memory resources, and the table of seen packets can grow verylarge. Therefore, in a real-world implementation, each entry should be �ushed aftertime Tcbr, in order to economize memory. After this time, the arrival of a packet whoseentry has been already �ushed will be handled by Condition C1, i.e. it will be dis-carded, because it will be older than Tcbr.
Condition C3 allows a packet to be considered for forwarding only if its previous hopis a node that lays farther from the sink than the current node, i.e. if:
dprevious > dcurrent (13)
This condition provides constant advancement of a packet towards the sink. The dis-tance from the sink d is de�ned in Subsection 3.1.
Condition C4 holds true if the previous hop of the packet was a node located morethan one hop away from the sink, i.e. the nodes that have the sink within their rangedo not need forwarding support.
Condition C5 implies that if d(previous, current) is the mutual distance between theprevious and current hop, the packet can be forwarded only if this distance is smallerthan the adopted value of threshold:
d(previous, current) < threshold (14)
The value of threshold is a parameter proprietary to each forwarding node, which willconsider a packet for forwarding only if it comes from a node that is less than thresholdmeters away. By varying this value, a node can reduce or increase the number of neigh-bors whose packets it considers for forwarding (all �ve conditions must hold for theforwarding to occur). Every node k has a number of neighbors. If we label as friendsall the neighbors which, from the perspective of node k, ful�ll conditions C3, C4 andC5, then the number of TDMA timeslots that will be assigned to node k must be equalto the number of its friends, incremented by one. As previously explained in Subsec-tion 3.2, this is because node k must transmit its own data and forward the data fromall of its friends, which should be supported by an appropriate number of dedicatedtimeslots.
This, somewhat contradictory condition C5, can be motivated as follows. The proposedapproach, albeit being lightweight, is built upon a location-based hierarchy, in conjunc-tion with scheduling. The existence of �ve forwarding conditions makes it possible tolimit the number of forwarders, and, for a given value of threshold, the number offorwarders is deterministic. In other words, the number of friends of a given node is�xed and it can be changed only by modifying the forwarding criteria. In order forthe deadlines to be met and to avoid network congestion, the output bu�ers in the for-warding nodes must perform as sustainably leaky buckets, meaning that their outputbu�er queues must not grow over time. This is possible only if a forwarder has beenassigned enough slots in order to serve all nodes that, from its own perspective, ful�llall �ve forwarding conditions. Rayleigh fading can cause both extension and contrac-tion of the transmission range. If we consider a network without condition C5, then,due to Rayleigh fading, a packet can reach too far in one hop and end up at a node
19

which does not have enough slots to serve all nodes that, from its own perspective,ful�ll the four conditions. This will trigger a domino e�ect, i.e. piling up of packetsin queues, network congestion and deadline misses. Therefore, condition C5 will pre-vent this by maintaining the balance between the number of packets that should beforwarded within one cycle and the number of available timeslots. This is the rationalebehind the decision to discard the packets that come from too far away. The IWSNtopology is deterministic and �xed, and the value of threshold should be downloadedto all the nodes in the initialization phase and adjusted in accordance with networkconditions.
20

4 SIMULATION SETUP
The proposed �ooding-based algorithm is evaluated by using the QualNet 5.0 discreteevent network simulator. Additionally, it is compared to a number of ad-hoc WSNrouting protocols that already exist in QualNet library. This comparison has an il-lustrative purpose for Scenarios A-D, whereas the only relevant benchmarks in thesesetups are the evaluation criteria de�ned in Subsection 4.5. However, the performanceof the proposed approach relative to other routing protocols is relevant in Scenarios Eand F.
4.1 Simulation parameters
The simulations are executed on a WirelessHART-like protocol stack, with all therelevant WirelessHART features retained, hopefully without a loss of generality. Theprotocol stack is shown in Table 2, composed with the intention to converge to theactual protocol stack of WirelessHART, subject to availability of models in QualNetprotocol library. This work is a proof of concept, and it is not necessary to entirelyreplicate the WirelessHART protocol stack. However, using TDMA on the MAC layeris essential, due to the considerable in�uence of scheduling on latency. The nodes areplaced within a 100 x 100 m area, with a centrally located sink node. This is feasiblein practice, because, although there exists zero degrees of freedom in node placement,sinks can be freely positioned in any number. During the simulation, the nodes areinstructed to periodically send measurements to the sink. The most important featuresof every layer in the simulation are explained below.
• Propagation environment: A common setting for IWSNs is a spacious pro-duction hall, with plenty of metallic surfaces, constant object movement, and,quite often, non-line-of-sight communication between the sensor nodes. The pa-rameters of wireless channel dynamics are selected in order to emulate the realisticsetting as much as possible:
� Pathloss model: Street Microcell model [36], which calculates the path-lossbetween transmitter-receiver pairs that are located in adjacent streets in anurban canyon. The essential di�erence between pathloss models in QualNetis the achievable transmission range. In particular, Street Microcell modelallows the range of roughly 50 m for output power of 10 dBm. Any other
21

pathloss model could have achieved this range with appropriate scaling ofoutput power. Since output power in WirelessHART is limited between -10and 10 dBm, a pathloss model that achieves transmission range relevant tothe network size is chosen.
� Shadowing model: Lognormal shadowing model [32], which uses a lognor-mal distribution for the shadowing value. It represents the slow variations ofreceived signal power against the distance between transmitter and receiver.
� Fading model: Rayleigh fading model [33], which is a statistical model torepresent the fast variation of signal amplitude at the receiver. In wirelesscommunications, Rayleigh fading models the situation when there is no lineof sight between the transmitter and receiver, which is quite often the casein realistic scenarios.
• Physical layer: The IEEE 802.15.4 Physical layer model is part of WirelessHARTstack. This model and TDMA MAC layer model in QualNet library are notcompatible. Hence, the Abstract model is used on the Physical layer. This isa generic PHY model which can be used to simulate di�erent Physical layersand it is modulation-agnostic. Abstract model simulates a Physical layer thatis capable of carrier sensing and is able to work with both BER-based and SNRthreshold-based reception models. The PHY Abstract model does not refer toany particular type of modulation. However, the BER-based reception modelrequires user-generated BER tables. This gives way to emulating the desiredPhysical layer by obtaining the tables for the desired type of modulation and allthe adherent Physical layer parameters. In the simulations, SNR-based receptionmodel is used, with WirelessHART-compatible reception threshold and receiversensitivity (-85 and -95 dBm, respectively). The antennas used are omnidirec-tional.
• MAC layer: QualNet TDMA MAC layer model is used, with the timeslot dura-tion set to (WirelessHART-compatible) 10 ms. The superframe duration dependson the number of nodes and their constellation, as previously described. The ex-act scheduling sequence is de�ned in a separate .tdma �le.
• Network layer: Network layer is IP-based, which is not a feature of Wire-lessHART. IP is chosen in order to facilitate the implementation, since it pro-vides an addressing scheme. The routing protocols used for comparison with theproposed approach will di�er between scenarios.
• Transport layer: UDP protocol is used on the Transport layer. UDP is preferredover TCP because delivery of a new process measurement is more sensible thanthe retransmission of an old one, as previously explained in Subsection 1.3.
• Application layer: The process sampling and delivery of sensor readings aremodeled by a Constant Bit Rate (CBR) application. The sensor refresh ratedepends on a scenario, and is varied between 250 ms and 1000 ms. The payloadof the application is 32 bytes. Every packet generated by the CBR applicationhas a unique identi�er, called the sequence number. This parameter, togetherwith the source address (added at the network layer) uniquely identi�es everypacket in the network. This feature is exploited in order to reduce the �oodingtra�c by discarding already seen packets.
22

Table 2: The summary of simulation parameters
Simulation parameters
Layer Parameter Value
Physical
Physical layer model Abstract PHYReception model SNR-basedData rate 250 kbpsOutput power 10 dBmFrequency 2.4 GHzAntenna type OmnidirectionalChannel Model Street Microcell model [36]Shadowing Model LognormalFading Model Rayleigh fadingMean transmission range 50 m
MACTimeslot duration 10 msSuperframe duration Depends on the number of nodes
NetworkNetwork protocol IPRouting protocol The proposed solution
Transport Transport protocol UDP
ApplicationPayload size 32 bytesRefresh rate 250-1000 ms
4.2 Implementation
QualNet simulator is written in C language. The implementation of the proposed rout-ing protocol included writing a C program that performs the testing of a packet againstthe �ve forwarding criteria, as well as incorporating it into the QualNet hierarchy. Theintegration of the new protocol was conducted by following the steps suggested byQualNet 5.0 Programmers Guide [2]. For the purpose of debugging and collection ofstatistics, the reserved word printfof the C language was extensively exploited.
4.3 Simulation scenarios
The performance of the proposed algorithm and several routing protocols is tested ina number of di�erent scenarios, each with the purpose of assessing a di�erent perfor-mance aspect. All the results presented for the proposed approach are obtained whilesimultaneously satisfying both evaluation criteria de�ned in Subsection 4.5.
• Scenario A: Average end-to-end delay evaluation. The setups from Fig-ure 11 and Figure 12 were simulated under fading-free propagation conditions, inorder to isolate the problem and focus on generic speed-comparison of the pro-tocols. The nodes have a refresh rate of Tcbr = 250 ms and the measurable ofinterest in this scenario is end-to-end delay Te2e.
• Scenario B: Robustness to node failure. Conventional routing protocolsreact to link failures via recovery mechanisms that include route recalculation.This can be a time-consuming process. In this scenario, the node 13 in Figure 13is shut down at a certain time-point in the simulation, in order to assess therecovery speed of the evaluated protocol. The speed of recovery is evaluated byobserving the packet delivery ratio and the time necessary to establish a newroute.
23

• Scenario C: Robustness to severe channel conditions. The scenarios fromFigure 14, 15 and 16 are exposed to Rayleigh fading and the corresponding la-tencies and PDRs are observed. The Rayleigh fading model used is de�ned inSubsection 4.1.
• Scenario D: Maximum feasible node populations. The goal of this scenariois to investigate the maximum acceptable network sizes, with respect to evaluationcriteria de�ned in Subsection 4.5. The assumption is that 75% of the nodesshould be in the �rst tier and 25% in the second. Furthermore, the topologiesare composed in such a way that nodes located 2 hops away from the sink havetwo neighbors within range.
• Scenario E: Complexity comparison. There are two types of events in Qual-Net: packet events and timer events. Packet events represent exchange of datapackets between layers or nodes. Packet events also model the communicationbetween di�erent entities at the same layer. Actions at Network layer trigger anumber of operations at other layers of the node as well as in other nodes inthe network. These operations translate into operations in hardware or networktra�c. In this setup, the complexity of the proposed approach is estimated byobserving the number of operations executed in the network and a comparisonto other WSN routing protocols is made. Since the numbers as such are notillustrative, they are normalized by the number of events in the scenario when�ooding-based approach is used and compared with corresponding observablesof other routing protocols examined. The number of operations on the Networklayer alone could have been observed, but since the events on Network layer trig-ger operations on all layers it is more sensible to observe the overall number ofoperations and events in the network.
• Scenario F: Energy consumption. One drawback of �ooding frequently en-countered in the literature is resource blindness, de�ned in Subsection 2.2. Oneaspect of resource blindness in �ooding is the excessive energy consumption. En-ergy consumption at each node is estimated using the Generic battery modelfrom QualNet Wireless Model Library, and it is observed for the proposed so-lution and several other WSN routing protocols for Transmit, Receive and Idlemodes. For comparison purposes, the results shown on the �gures are normalizedwith respect to energy consumption of the proposed solution.
4.4 The in�uence of Rayleigh fading and SNR-based reception model
The quanti�cation of Rayleigh fading is shown in Figure 5. This graph is obtained bymeasuring the PDR of a point-to-point transmission after placing two sensor nodes atdi�erent distances. Rayleigh fading is implemented following the references of [32]. Foreach packet received, the fading attenuation is obtained using a table lookup indexedby time. The lookup table contains a long trace of zero mean, unit variance Gaussiandistributed in-phase and quadrature components.
The use of SNR-based reception model at the Physical layer implies that a whole packetis lost if its RSS does not exceed the reception threshold. This mechanism emulates slowRayleigh fading, where entire packets are lost. In the simulations, the RSS �uctuatesin the range between -57 ÷ - 84 dBm, which is similar to the values experienced in areal-life case study presented in [5].
24

Figure 5: Dependency of PDR on Rayleigh fading model used
4.5 Evaluation criteria
IWSN should deliver sensor readings within the prede�ned time-frames and with ahigh level of reliability. The performance in Scenarios A-D is evaluated via two distinctobservables:
• End-to-end delay, de�ned as the time that a packet spends traveling between theApplication layers of the sending node and the sink. It mainly consists of queuingtime in the bu�ers of intermediate nodes, and, to a lesser extent, of the processingtime in the nodes along the route to sink.
• Packet delivery ratio, which is the quotient of the cumulate number of packetssent by Application layers of all the nodes in the network, and the number ofpackets received in the sink during the simulation. The proposed solution providesdelivery of multiple instances of the same packet to the sink, but each packet willbe counted exactly once i.e. the time of arrival of the �rst copy is considered incalculation of average end-to-end delay.
These observables are crucial in time-critical applications, it is possible to measurethem in QualNet and they will be used as input for the following evaluation criteria ofinterest:
Latency requirement: real-time data delivery is of vital importance in IWSNs. Inthis model, the sensing devices transmit measurements to the sink at regular intervals.Sensor measurements in process automation have very limited time-validity. There-fore, it is essential that the sink is aware of a particular process sample before a newone is made. The evaluation criterion in this case translates to Te2e ≤ Tcbr, wherethe variables compared stand for end-to-end delay Te2e and sensor refresh rate Tcbr,respectively. Non-compliance with this rule leads to deadline misses and unnecessaryoccupation of network resources, which can eventually lead to congestion.
Delay-limited capacity: this evaluation criterion combines capacity and outage prob-ability and is expressed in the form of (m, k)-�rm deadlines ([16, 17]), where the loss of
25

at most m out of k consecutive packets is deemed acceptable. In this work, the valuesof m = 2 and k = 3 are adopted. In layman terms, this means that a loss of three ormore subsequent packets is a showstopper.
4.6 Delimitations and assumptions
Network topologies with maximum of two hops and equal sampling rate for all sensorsare assumed. The three-hop network case can be derived, and it will reduce the maxi-mum number of nodes in the network, because a packet from a third-tier requires moreforwarders, so more slots will have to be allocated for forwarding, in order to achieve atimely delivery.
Assessment of the proposed solution against the two evaluation criteria is of the utter-most importance in this Thesis, whereas the comparison with the selected benchmarkad-hoc WSN protocols has an illustrative purpose for Scenarios A-D.
TDMA is chosen as the medium access technique, in accordance with the Data Linklayer speci�cation of WirelessHART. Although this technique is usually avoided byauthors, it provides deterministic performance in terms of average end-to-end delayand removes the possibility of packet collisions, which makes it suitable for IWSNapplications.
26

5 SIMULATION RESULTS
All results obtained for the proposed �ooding-based solution implicitly satisfy the twoevaluation criteria de�ned in Subsection 4.5. In particular, all packets whose traveltime is used in calculation of average end-to-end delay and packet delivery ratio havearrived to sink within the deadline and with the desired degree of reliability. This is thereason why end-to-end delay is quanti�ed through its average value, and not throughits distribution or con�dence intervals - outdated packets are discarded on-the-�y inthe intermediate nodes and do not participate in collection of �nal statistics. Sincemultiple copies of a packet may arrive to the sink, only the arrival time of the �rstcopy is taken into consideration. The simulation time is 300 seconds for every scenario,whereas the number of sent packets depends on sensor refresh rate Tcbr, as shown inTable 3.
Table 3: The number of sent packets by every node for di�erent values of Tcbr
Refresh rate Number of packets sent per node
0.25 sec 11960.5 sec 5980.75 sec 3991 sec 299
5.1 Scenario A: Average end-to-end delay evaluation
Average end-to-end delays are measured in the 17-node network from Figure 11 andthe 33-node network from Figure 12. Apart from the proposed approach, the followingrouting protocols are considered: AODV [31], DSR [23], DYMO [9], LAR1 [24], ZRP[15], STAR [27] and OLSRv2Niigata [10].
The underlying MAC protocol is TDMA, with the scheduling that allows the maximumnumber of nodes to be included in the network for the given sensor refresh rates (250 msand 500 ms). In other words, tra�c load is pushed to the upper bound for congestion-free network operation, in accordance with the considerations from Subsection 3.2.
27

The measured average end-to-end delays and packet delivery ratios presented in Ta-ble 4 clearly indicate that, with the exception of the proposed solution, none of theexamined protocols can cope with this amount of tra�c load and satisfy the evaluationcriteria from Subsection 4.5. The average end-to-end delays for the proposed solutionare 64% below the deadline, while other routing protocols perform poorly, with averageend-to-end delays signi�cantly above the deadline.
The results for Scenario A1 and A2 are presented for 8 and 4 di�erent routing pro-tocols, respectively. The reason is that only 4 routing protocols could cope with thepopulation size and refresh rate of Scenario A2.
Table 4: Average end-to-end delays and PDRs for fading-free scenarios
Routing protocol Scenario Refresh rate Average end-to-end delay PDR
Proposed solution A1 0.25 sec 0.091 sec 100%AODV A1 0.25 sec 7.178 sec 97.46%DYMO A1 0.25 sec 6.623 sec 97.32%DSR A1 0.25 sec 9.402 sec 96.38%ZRP A1 0.25 sec 49.403 sec 67.3%LAR1 A1 0.25 sec 4.352 sec 98.58%
OLSRv2 Niigata A1 0.25 sec 17.458 sec 87.35%STAR A1 0.25 sec 11.412 sec 92.38%
Proposed solution A2 0.5 sec 0.168 sec 100%AODV A2 0.5 sec 95.477 sec 63.65%DYMO A2 0.5 sec 63.014 sec 72.87%DSR A2 0.5 sec 32.986 sec 83.95%
5.2 Scenario B: Robustness to node failure
In this scenario, node 5 from Figure 13 loses one of its neighbors, namely node 13. Theproposed approach exploits two paths in parallel to deliver data from node 5 to thesink (via nodes 13 and 15), and the failure of one path will not cause interruptions indata delivery. Conventional routing protocols using node 13 to deliver data from node5 will take certain time to recalculate the routing paths and shift them to node 15.This a�ects the number of packets delivered within the expected time-frame and over-all latency. From the perspective of a unicast routing protocol, this is a trivial scenario,because the failing node 5 has only two neighbors, and the procedure of establishinga new path should be quite straightforward, compared to the situation when there aremany neighbors to choose from.
The PDRs are presented in Figure 6 and values of recovery time, de�ned as the timebetween a node failure and reestablishment of the route via an alternative path, areshown in Table 5. The proposed approach exhibits 100% PDR, whereas its closestfollower, Bellman Ford routing, delivers around 97% of packets and other protocolslagging behind by roughly 10%. The node failure scenario has shown that �ooding
28

adjusts smoothly to node failure, without any transitional periods. This does not holdfor other protocols examined.
Figure 6: Packet delivery ratios for Scenario B (node failure)
Table 5: Recovery times for node failure scenario
Routing protocol Recovery time
Proposed solution 0 secBellman Ford 113 sec
AODV ≥ simulation timeDSR 297 sec
DYMO 305 sec
5.3 Scenario C: Robustness to severe channel conditions
The networks from Figures 14, 15 and 16 with 16, 33 and 50 nodes and refresh ratesof 250, 500 and 750 ms, are exposed to Rayleigh fading. The proposed solution hasproven to be superior in terms of robustness to Rayleigh fading, compared to otherprotocols examined, exhibiting almost identical average end-to-end delay as in the caseof fading-free scenarios, while the packet delivery ratio drops to around 80%, regardlessof the network size. A common feature of Scenarios C1, C2 and C3 is the fact thatsecond-tier nodes have two �rst-tier neighbors. Similarly to Scenario A, the networkscomprise the maximum number of nodes that can support their respective refresh rates.
The results show that performance of other routing protocols deteriorates signi�cantlywith the increase of network size and is far from satisfying the timing and reliabilityconstraints. Similarly to Scenario B, the good PDR of the proposed solution stemsfrom the multipath data delivery. The results are presented in Table 6.
29

Table 6: Average end-to-end delays and PDRs for di�erent scenarios under Rayleigh fading
Routing protocol Scenario Refresh rate Average end-to-end delay PDR
Proposed solution C1 0.25 sec 0.088 sec 83.64%AODV C1 0.25 sec 12.290 sec 71.38%DYMO C1 0.25 sec 9.650 sec 71.47%DSR C1 0.25 sec 7.675 sec 69.28%ZRP C1 0.25 sec 51.228 sec 44.38%LAR1 C1 0.25 sec 12.234 sec 70.53%
OLSRv2 Niigata C1 0.25 sec 20.251 sec 55.86%STAR C1 0.25 sec 18.518 sec 27.50%
Proposed solution C2 0.5 sec 0.183 sec 82.25%AODV C2 0.5 sec 130.390 sec 36.40%DYMO C2 0.5 sec 64.570 sec 55.28%DSR C2 0.5 sec 40.651 sec 63.27%LAR1 C2 0.5 sec 3.576 sec 11.98%
Proposed solution C3 0.75 sec 0.366 sec 81.95%DYMO C3 0.75 sec 75.820 sec 11.27%DSR C3 0.75 sec 120.940 sec 37.75%IERP C3 0.75 sec 47.580 sec 46.20%
5.4 Scenario D: Constraints in terms of node population size
The aim of this scenario is to investigate the feasible network sizes for the o�ered tra�cload, with respect to the evaluation criteria from Subsection 4.5. Figure 7 shows thedependency of latency on network population size. The observed networks have a sen-sor refresh rate and deadline of Tcbr = 1 sec and 75% nodes located one hop away fromthe sink. According to the results, the proposed solution allows the use of larger net-works than all other protocols, with respect to the latency constraint. AODV, DYMOand DSR can meet the demands of the two evaluation criteria only for networks of upto 20-25 nodes, whereas the average end-to-end delays exhibited by the �ooding-basedapproach stay well below the deadline throughout the observed range of network sizes.The latency curve of the �ooding-based approach has a constant slope, while the la-tencies of other routing protocols explode around the 18-node mark.
In order to assess the proposed solution in terms of feasible network sizes with respectto the evaluation criteria, the bounds of maximum node populations are investigated.The results in Table 7 illustrate the maximum node populations that can satisfy theTe2e ≤ Tcbr and (2, 3)-�rm deadline criteria. These results are obtained under thefollowing set of assumptions:
• Sensor refresh rates of 0.25, 0.5, 0.75 and 1 sec.
• 75% of nodes are located within one hop away from the sink.
• Second-tier nodes have exactly two �rst-tier neighbors.
• The networks satisfy the Te2e ≤ Tcbr and (2, 3)-�rm deadline criteria
30

Figure 7: Average end-to-end delay as a function of network size
The numbers in Table 7 can be justi�ed with the help of conclusions of Subsection 3.2.For example, for Tcbr = 750 ms, the following equalities hold:
nslots =TcbrTslot
=750ms
10ms= 75 (15)
nslots = nnodes × 0.75 + nnodes × 0.25 + 0.25× 2 (16)
nnodes =nslots
0.75 + 0.25 + 2× 0.25=
75
1.5= 50 (17)
The �rst, second and third term in the Equation 16 refer to 75% of nodes in the �rsttier, 25% of nodes in the second tier and average number of �rst-tier forwarders forevery second-tier node (two). Their sum equals the required number of timeslots in thesuperframe, in order to meet the latency constraint.
The feasible network sizes are su�cient for the majority of IWSN applications. Theneed for a larger network can be satis�ed by deploying additional sinks, thus partition-ing the overall node population into clusters. Furthermore, a number of routers, nodesthat will not generate, but only forward the tra�c, can be deployed.
Table 7: Maximum network sizes and average end-to-end delays for the proposed approach
Refresh rate Maximum network size Average end-to-end delay
0.25 sec 16 nodes 0.091 sec0.5 sec 33 nodes 0.168 sec0.75 sec 50 nodes 0.356 sec1 sec 65 nodes 0.457 sec
31

5.5 Scenario E: Complexity comparison
The complexities of di�erent routing protocols are observed on the network from Fig-ure 14. As previously motivated, the number of intra-simulation events executed foreach routing protocol is normalized by dividing with the corresponding observable inthe case of the proposed solution. Although the complexity of routing protocols iscompared, the observable is the total number of events in the network, rather than thenumber of events on the network layer. The reason for this is that actions of the Net-work layer trigger events on other layers. Hence, it is necessary to observe occurrenceson all layers in order to make a fair comparison of complexities.
The results can be found in Table 8. According to the results, the increase in the totalnumber of operations in the network with respect to other protocols is not more than10%.
Table 8: Normalized number of events executed for various routing protocols
Routing protocol Scenario Normalized number of events executed
Proposed solution C1 1.0000AODV C1 0.9296DSR C1 0.9324
DYMO C1 0.9255LAR1 C1 0.9192STAR C1 0.9736ZRP C1 0.9840
5.6 Scenario F: Energy consumption
The presented measurements of energy consumption are cumulative and normalized,i.e. the numbers refer to overall energy consumption in the network, which is normal-ized with respect to the consumption of the proposed �ooding approach. The networkof interest is shown on Figure 14.
Contrary to the widespread opinion, the proposed �ooding-based approach has only amoderate increase of energy consumption of roughly 10%, with respect to the majorityof other routing protocols compared. The proposed �ooding approach consumes up to15% more energy in Transmit and Receive mode compared to AODV, DSR, DYMO,OLSR and ZRP protocols and about 2.5% less energy than LAR1. In the idle mode, the�ooding-based approach is an average consumer of energy among the routing protocolsobserved. The energy consumption ratios for the transmit, receive and idle mode aredepicted below.
32

Figure 8: Normalized energy consumption in Transmit mode
Figure 9: Normalized energy consumption in Receive mode
Figure 10: Normalized energy consumption in Idle mode
33
6 CONCLUSION
The aim of this work is to de�ne a lightweight routing �ooding-based routing protocolwith properties required by wireless control applications and test it against the ade-quate evaluation criteria. The simulation results show that the proposed �ooding-basedsolution can be e�ciently used for this purpose under certain conditions and limita-tions. The most important drawback of �ooding is the excessive amount of tra�c thatit creates and the consequent network congestion. Starting from the generic form of�ooding, several modi�cations are introduced in order to reduce the tra�c redundancy,while preserving the good properties of �ooding, which were the initial motivation forconsidering it as a data dissemination technique in IWSN.
The use of TDMA provides greater control of the speed of data delivery and determin-istic latency. However, due to timing and reliability constraints de�ned in Section 4.5,the number of slots in a superframe is limited and their allocation to particular nodesis the key factor in meeting these constraints. This is correlated to the node placementproblem, where the number of neighbors of second-tier nodes determines the numberof timeslots dedicated to forwarding. Since the node placement is deterministic andstrictly de�ned by the customer, with insigni�cant degree of freedom, the term neighborcan be abstracted via the term friend and variable threshold, as explained in Subsec-tion 3.3 and Subsection 4.6. The main conclusions are summarized below:
• The proposed routing protocol delivers data faster and more reliable than otherprotocols examined in both Rayleigh fading and fading-free conditions.
• Transition in the case of link or node failure is seamless and no additional timefor recovery is necessary, the tra�c �ow is uninterrupted, albeit packet loss.
• The proposed approach does not exhibit a drastic increase neither in energyconsumption nor complexity, compared to other protocols. The complexity isestimated via the number of events executed during the simulations.
• Feasible network sizes depend on node placement and particularly on the numberof neighbors of nodes which lie more than one hop away from the sink.
• The only overhead of this protocol is sending of the node coordinates. The repre-sentation of coordinates requires roughly centimeter precision and this overhead
34

is in the order of several bytes. On solution is to transfer this burden to nodememory, where the nodes could learn and map their neighbor's coordinates tothe respective node ID's.
• In case of di�erent refresh rates in the network, additional overhead of severalbits is necessary: in order for the receiving node to assess the aging of the packet,the sender can use these bits to inform the potential forwarders about its refreshrate.
6.1 Future work
Further improvements should target increasing the feasible network sizes, as well asexploiting more of the information that is already available to the nodes. Some of thepointers for future development of the concept are:
• Exploitation of Channel State Information: utilizing the knowledge about one ofthe most important disruption factors in IWSN will results in better adaptivityof the network to the dynamic propagation conditions.
• Development of dynamic scheduling: scheduling is one of the key aspects of theproposed solution,
• Data aggregation: integrating the sensor readings from multiple nodes into asingle packet will free up a number of timeslots within one superframe and increasethe upper limit on network size.
• Incorporation of downlink: monitoring is just one of IWSN applications. In orderto diversify the range of applications, downlink should be incorporated into theproposed solution, for delivery of commands to the actuators.
35

7 PUBLICATION
36

A Lightweight Routing Protocol for IndustrialWireless Sensor and Actuator Networks
Filip BaracDepartment of Information Technology and Media
Mid Sweden UniversityEmail: [email protected]
Johan AkerbergABB AB
Corporate ResearchEmail: [email protected]
Mikael GidlundABB AB
Corporate ResearchEmail: [email protected]
Abstract—The applications of Industrial Wireless Sensor andActuator Networks are time-critical and information must bedelivered within the predefined deadlines with a considerable dealof reliability. A notable shortcoming of the existing wireless indus-trial communication standards is the existence of overcomplicatedrouting protocols, whose adequacy for the intended applicationsis questionable [1]. This paper evaluates the potentials of floodingas a data dissemination technique in IWSANs. The concept offlooding is recycled by introducing minimal modifications to itsgeneric form and compared with a number of existing WSNprotocols, in a variety of scenarios. The simulation results ofall scenarios observed show that our lightweight approach isable to meet stringent performance requirements for networksof considerable sizes. Furthermore, it is shown that this solutionsignificantly outperforms a number of conventional WSN routingprotocols in all categories of interest.
I. INTRODUCTION
Industrial Wireless Sensor and Actuator Networks(IWSANs) for process automation are slowly replacing theirwired counterparts, resulting in easier deployment, flexibilityand cost reduction. According to [2], wiring and installationcan make up to 90% of the device cost.
The causa sui of IWSANs is to report sensor readingsand deliver actuator data in real time, in order to stabilizethe unstable processes and maximize the production rate. Therequired latencies are application-specific, and range from theorder of tens of milliseconds for e.g. pressure sensors, upto several seconds for temperature sensors [1]. Sadly, theadvantages of wireless control have not been fully exploited.Park et al. [3] identify a dichotomy in the design of existingIWSANs, arguing that process engineers have authored theapplication software, while the communication engineers wereresponsible for the communication aspect. This, they claim,gave rise to a lack of full-picture understanding of challengesand constraints, resulting in suboptimal solutions.
The existing industrial communication standards, such asWirelessHART [4] use conventional routing protocols, whichrely on routing tables and graphs and some kind of routinginfrastructure, i.e. control message exchange. IWSAN com-munication is multihop, and distributed routing algorithmsare highly preferable. However, data dissemination techniquesused in today’s industrial communication are inadequate inseveral aspects:
• Path recalculation: In a rapidly changing radio propaga-tion environment, the link failures are frequent, so routingpaths have time-limited validity. A broken link can triggera tedious system recovery process, which leads to routingpath recalculation and, consequently, long intervals ofIWSAN’s unavailability.
• Control message overhead: The exchange of routingtables and messages used for network self-recovery ornode-discovery poses a significant overhead.
• Energy consumption: The existing routing protocols oftenaim at optimizing the performance with respect to theenergy consumption, while sacrificing latency. However,in an industrial environment, sufficient power supply isoften readily available [5], and IWSAN nodes are usuallynot battery-powered.
• Packet retransmissions: Transport layer protocols runningon top of ACK-based routing protocols initiate retrans-missions in case of unsuccessful packet delivery. Havingin mind the high dynamics of the observed processes,the data acquired by retransmissions is most probablyoutdated. Common sense suggests that, instead of re-sending an old piece of data, transmission of a newermeasurement should take place.
Thus, it is reasonable to assume that a lightweight, no-frillsrouting protocol could eliminate some or all of these inade-quacies. Flooding is the most rudimentary routing technique,where every node in the network broadcasts all the packets thatit receives or generates. Vanilla flooding can cause numerousproblems in a wireless sensor network, but, as it will be shownlater, its good inherent properties can be exploited after certainmodifications.
A. Related Work
Flooding and its variations are used in conventional Wire-less Sensor Networks (WSN), which have less strict timingrequirements and a number of essential differences, comparedto IWSANs. WSN topology in some applications is random,while in IWSANs it is strictly deterministic. Furthermore, thenumber of nodes in a WSN can range up to several hundredsand even thousands, while IWSANs sensor/actuator popula-tions comprise several dozens of nodes. These differencesdisqualify the most of conventional WSN routing protocolswhen it comes to IWSAN applications.

Gossiping and Flossiping [6] (and references therein) areflooding-based routing approaches that attempt to avoid thedrawbacks of flooding by randomizing the selection of re-transmitters, which is unacceptable in an IWSAN setting.Graded Back-off Flooding [7] favors the biggest contributorsin terms of one-hop transmission range by allowing themto have smaller back-off times, while Directed Floodingwith Self-Pruning [8] also takes the remaining energy intoconsideration. Farivar et al. propose Directed Flooding [9],allowing the nodes to rebroadcast only if they are locatedinside the directional virtual aperture of the sender, situatedaround the straight line that connects source and the sink.Whitehouse et al. [10] propose a flooding-based approachthat does not fit into the framework of existing industrialcommunication solutions, because it aims at coverage andproposes medium access techniques that do not adhere to DataLink layer specifications of the existing standards.
Although the listed approaches exploit the paradigm offlooding, they do not correspond to the expectations of datadelivery in IWSANs for several reasons. Probabilistic versionsof flooding introduce the stochasticity in data delivery, whichis inadequate for real-time applications. Furthermore, whileflooding in conventional WSNs is usually used for broadcastand aims at coverage, IWSAN uplink delivery paradigm isconvergecast. Finally, some of these flooding-based protocolssuggest sophisticated and very complex forwarding criteria,whose benefits can only come to the fore in a denselypopulated WSN, where packets make long journeys. On theother hand, IWSANs are usually 2- or 3-hop mesh networks.
B. Main Contributions
The main contributions of this Paper are:• We explain how flooding can overcome the aforemen-
tioned problems and propose a number of modificationsto flooding in order to make it utilizable for uplink inIWSAN applications.
• We evaluate the performance of the proposed solution ina WirelessHART-like network using a discrete-event sim-ulator and show that, if appropriately modified, floodingcan be used as a data distribution technique in IWSANs.
• Based on the simulation results, we set boundaries onfeasible network size with respect to constraints in termsof latency and reliability.
The remainder of the Paper is structured as follows. InSection II we introduce basic information regarding genericflooding. Section III presents our flooding-based solution.Sections IV and V provide details of the simulated scenariosand discuss the results obtained, followed by Section VI,where we summarize our conclusions.
II. EXPLOITING FLOODING IN IWSANS
A. The drawbacks of generic flooding
Flooding is a data dissemination technique, where a nodetransmits or forwards a packet to all of its neighbors. It isthe simplest data forwarding technique, and its generic formexhibits a number of drawbacks ( [11], [12]):
• Implosion: Duplicated packets are delivered to the sink,because multiple copies of a packet travel over differentpaths.
• Broadcast storm: Flooding can produce extreme amountsof redundant traffic, since the number of packets in thenetwork grows exponentially after every hop.
• Endless packet wandering: Due to lack of propagationdirectivity, a packet may circulate around the network fora long time, thus occupying precious network resources.
B. Potentials of flooding in IWSANs
The main benefit of flooding is its utter simplicity. There isno need for exchanging control messages between the nodesand in case of link failures the routing paths do not have tobe recalculated. Node failures require no reaction from thenetwork layer, so there exists a smooth transition to the newconstellation. Another significant advantage of flooding overconventional routing protocols is that the data is deliveredvia multiple paths, enhancing redundancy and reliability. Therouting information exchange in flooding is virtually non-existent, which leaves more traffic capacity for the actualdata traffic. However, the number of multiple paths shouldbe controlled, in order to avoid the network congestion - oneof the major causes of latency. The key is to limit the physicalscope of forwarding and find the delicate balance between thetraffic load, speed and reliability of delivery.
III. THE PROPOSED FLOODING ALGORITHM
A. Flooding design principles for IWSANs
Starting from the generic form of flooding, a number ofmodifications is introduced, in order to reduce the amountof traffic, while preserving its good properties. This sectiondefines and explains main properties of the proposed approach.
A distributed routing algorithm: Each intermediate nodeindependently decides whether to retransmit or discard thereceived packet. All the information necessary for making theforwarding decision is extracted or derived from the contentof data packets, so there are no control messages.
Handling of duplicates: Every packet contains a unique(i, s) pair, where i stands for the source node address and ssignifies the unique application payload identifier. The i pa-rameter unambiguously identifies the originating node, whiles is unique for every piece of data sent by that node. Everynode should manage a container to store (i, s) pairs of seenpackets. Upon reception of a packet, its (i, s) pair is extractedand examined. Duplicates are discarded.
Handling of outdated packets: Packet age is checked atevery hop, with respect to the evaluation criteria that will beintroduced in one of the following sections. Outdated packetsare discarded. The outliers in IWSANs are usually not morethan 3 hops away from the sink and the Time-To-Live (TTL)field of data packets should be set with respect to the networktopology.
Location-based protocol: A packet must progress towardsthe sink at every hop. In Stateless Weight Routing [13], the au-thors introduce the concept of node weight. Every intermediate

node inserts its weight into the packet and broadcasts it further.The receiving node compares this value with its own weightand decides whether to rebroadcast or drop the packet. Thegoal is to forward the packet towards the node with a smallerweight than sender’s, whereas the sink is assigned the weightequal to zero. Weight wk of node k should be a superpositionof factors such as node positions relative to the sink, currenttraffic load in the network, or channel state information:
wk = flocation(k) + ftraffic(k) + flink(k) (1)
In this Paper the weights are calculated exclusively fromthe node’s coordinates, i.e. it equals the first term in theabove equation. If we define xk, yk and zk as the Cartesiancoordinates of the node k, the total weight of node k is:
wk = (xk − xsink)2 + (yk − ysink)
2 + (zk − zsink)2 (2)
The inserted coordinates represent the only overhead of theproposed solution, which totals several bytes, depending onthe desired precision.
Cross-layer support: The considerations in this Paper arenot entirely confined to the Network layer and the routingprotocols. In order to further enhance the performance of ourapproach, a simple TDMA scheduling principle is utilized:the nodes which serve as both sources and forwarders ofnetwork traffic are assigned more timeslots for transmissionthan other nodes.
B. Evaluation criteria
IWSAN should deliver sensor readings within the prede-fined time-frames and with a high level of reliability. Theperformance of our approach is evaluated through two distinctobservables: 1. End-to-end delay, defined as the time apacket spends traveling between the Application layers of itsoriginator and the sink. It mainly consists of queuing time inthe buffers of intermediate nodes, and, to a lesser extent, ofin-node processing time along the route to sink; 2. Packetdelivery ratio,i.e. the quotient of the cumulate number ofpackets sent by Application layers of all the nodes in thenetwork, and the number of packets received in the sinkduring the simulation. Flooding provides delivery of multipleinstances of the same packet to the sink, but each packet willbe counted exactly once i.e. the time of arrival of the first copyshall be considered in calculation of average end-to-end delay.We employ these observables to define two evaluation criteriaof interest.
Latency requirement: In our model, the sensing devicestransmit measurements to the sink at regular intervals. Sensormeasurements in process automation have very limited time-validity. Therefore, it is essential that the sink is aware of aparticular measurement before a new one is made. The eval-uation criterion in this case translates to Te2e ≤ Tcbr, wherethe variables compared stand for end-to-end delay Te2e andsensor refresh rate Tcbr, respectively. Non-compliance withthis rule leads to deadline misses and unnecessary occupationof network resources, which can eventually lead to congestion.
Delay-limited capacity: This evaluation criterion combinescapacity and outage probability and is expressed in the formof (m, k)-firm deadlines [14] (and references therein), wherethe loss of at most m out of k consecutive packets is deemedacceptable. We have adopted the values of m = 2 and k = 3.
C. Forwarding criteria
The five forwarding criteria are the heart of our flooding-based approach, and all must hold in order for a packet to beforwarded.
Condition C1 states that packet will be considered forforwarding if its age Tage is not more than the refresh rateof its originating sensor, Tcbr:
Tage ≤ Tcbr (3)
Condition C2 holds true for an (i, s) pair if the output ofthe function unseen(i, s) is logical TRUE, i.e. if a pair (i, s)does not already exist in the container of seen (i, s) pairs:
C1 = unseen(i, s) (4)
Every entry (i, s) should be flushed from the container afterTcbr, in order to economize memory resources of the node.After this time, the arrival of a packet whose entry has beenalready flushed will be handled by condition C1, i.e. it willbe discarded, because it will be older than Tcbr.
Condition C3 allows a packet to be considered for forward-ing only if its previous hop is a node that lays farther fromthe sink than the current node, that is if:
wprevious > wcurrent (5)
Condition C4 holds true if the previous hop of the packetwas a node located more than one hop away from the sink,i.e. nodes that have the sink within their range do not needforwarding support.
Condition C5 implies that if d(previous, current) is themutual distance between the previous and current hop, thepacket can be forwarded only if this distance is smaller thanthe adopted value of threshold:
d(previous, current) < threshold (6)
The value of threshold is a parameter proprietary to eachforwarding node, which will consider a packet for forwardingonly if it comes from a node that is less than threshold metersaway. By varying this value, a node can reduce or increase thenumber of neighbors whose packets it considers for forwarding(all five conditions must hold for the forwarding to occur).Every node k has a number of neighbors. If we label asfriends all the neighbors which, from the perspective of nodek, fulfill conditions C3, C4 and C5, then the number of TDMAtimeslots that will be assigned to node k must be equal to thenumber of its friends, incremented by one. The explanationis that node k must transmit its own data and forward thedata from all of its friends, which should be supported by anappropriate number of dedicated timeslots.

This, somewhat contradictory condition, can be motivatedas follows. Our approach, albeit being lightweight, isbuilt upon a location-based hierarchy, in conjunction withscheduling. The existence of five forwarding conditionsmakes it possible to limit the number of forwarders, and,for a given value of threshold, the number of forwardersis deterministic. In other words, the number of friends of agiven nodes is fixed and it can be changed only by modifyingthe forwarding criteria. In order for the deadlines to bemet and to avoid network congestion, the output buffersin the forwarding nodes must perform as sustainably leakybuckets, meaning that their output buffer queues must notgrow over time. This is possible only if a forwarder has beenassigned enough slots in order to serve all nodes that, fromits own perspective, fulfill all five forwarding conditions.Rayleigh fading can cause both extension and contractionof the transmission range. If we consider a network withoutcondition C5, then, due to Rayleigh fading, a packet canreach too far in one hop and end up at a node which doesnot have enough slots to serve all nodes that, from its ownperspective, fulfill the four conditions. This will trigger adomino effect i.e piling up of packets in queues, networkcongestion and deadline misses. Therefore, condition C5 willprevent this by maintaining the balance between the numberof packets that should be forwarded within one cycle and thenumber of available timeslots. This is the rationale behind thedecision to discard the packets that come from too far away.The IWSAN topology is deterministic and fixed, and thevalue of threshold should be downloaded to all the nodesin the initialization phase and adjusted in accordance withnetwork conditions.
Algorithm 1 Proposed solution1: Receive a packet (i, s)2: if (C1 ∧ C2 ∧ C3 ∧ C4 ∧ C5 = TRUE) then3: insert (i, s) in table4: forward(i, s)5: else6: discard(i, s)7: end if8: Go to waiting mode
IV. SIMULATIONS
The proposed solution is analyzed in QualNet discrete eventsimulator on networks placed within a 100 x 100 m area,with a centrally located sink node. This is feasible in practice,because, although there exists zero degrees of freedom in nodeplacement, sinks can be freely positioned in any number. Thesimulations are time-constrained to 10 minutes, meaning thatthe nodes are instructed to periodically send measurementsthroughout the duration of the experiment. The protocol stackis is shown in Table I, composed with the intention to convergeto the actual protocol stack of WirelessHART, subject toavailability of models in QualNet protocol library.
TABLE ITHE SIMULATION PARAMETERS
Parameter Description
Application Layer CBR applicationTransport Layer UDPNetwork Layer Proposed approach
MAC Layer TDMA with 10 ms timeslotsPhysical Layer Abstract PHY, SNR-based reception modelChannel Model Street Microcell [15] with Rayleigh fading
Payload size 32/76 bytes@APPL/PHY layerTransmit power 10 dBm
Fig. 1. Network model 1
A. Simulation Scenarios
Our proposed algorithm and several routing protocols aretested against four different scenarios.
Scenario A: End-to-end delay evaluation. The setup fromFig. 1 is simulated under fading-free propagation conditions, inorder to isolate the latency issue and focus on generic speedcomparison of protocols. The nodes have a refresh rate ofTcbr = 250 ms and the measurable of interest in this scenariois the average end-to-end delay Te2e.
Scenario B: Robustness to node failure. Conventional rout-ing protocols react to node failures via recovery mecha-nisms that include route recalculation, which can be a time-consuming process. In this scenario, the node 23 in Fig. 1 isshut down at a certain time-point in the simulation, in order toassess the robustness of the routing protocol in question. Thespeed of recovery is evaluated by observing the packet deliveryratio (PDR) and the time necessary to establish a new route.
Fig. 2. Network model 2

Scenario C: Robustness to severe channel conditions. Thenetwork from Fig. 2 with the refresh rate and deadline ofTcbr = 500 ms is exposed to Rayleigh fading. Average end-to-end delay and corresponding PDRs are observed.
Scenario D: Constraints in terms of node population size.This scenario investigates the maximum feasible network sizesthe with respect to Te2e ≤ Tcbr and (2, 3)-firm deadlinecriteria. The assumptions are that 75% of the nodes are onehop away from the sink and that remaining 25% are two hopsaway and have at least two neighbors within range. This wasachieved by adjusting the value of threshold.
B. Assumptions and Delimitations
Assessment of the proposed solution against the two eval-uation criteria is of the uttermost importance in this Paper,whereas the comparison with the selected benchmark ad-hocWSN protocols has an illustrative purpose.
TDMA is chosen as the medium access technique, in accor-dance to the Data Link layer specification of WirelessHART.Although this technique is usually avoided by authors, itprovides deterministic performance in terms of average end-to-end delay and removes the possibility of packet collisions,which makes it suitable for IWSAN applications.
The SNR-based reception model at the Physical layer im-plies that a whole packet is lost if its RSS does not exceed thereception threshold. This mechanism emulates slow Rayleighfading, where entire packets are lost. In the simulations, theRSS fluctuates in the range between -57 ÷ - 84 dBm, whichis similar to the values from a real-life case study presentedin [16].
V. SIMULATION RESULTS
Our solution outperforms the other routing protocols in allscenarios of interest and meets both Te2e ≤ Tcbr and (2, 3)-firm deadline requirements for all results presented in thissection. This is the reason why end-to-end delay is quantifiedthrough its average value, and not through its distribution orconfidence intervals - outdated packets are discarded on-the-flyin the intermediate nodes and do not participate in collectionof final statistics.
A. Scenario A
Table II shows average end-to-end delays observed in Net-work model 1 for sensor refresh rate of Tcbr = 250 ms.Our utterly lightweight routing protocol meets both evaluationcriteria, with latency which is 74% below the deadline, whilethe conventional routing protocols cannot cope with the giventraffic load, resulting in much higher latencies.
B. Scenario B
In Scenario B, node 5 from Fig. 1 loses one of its neighbors,namely node 23. Our approach exploits two paths in parallelto deliver data from node 5 to the sink (via nodes 23 and19), and the failure of one path will not cause interruptions indata delivery. Conventional routing protocols using node 23 todeliver data from node 5 will take certain time to recalculate
TABLE IIAVERAGE END-TO-END DELAYS FOR THE NETWORK FROM FIG. 1 AND
Tcbr = 250 MS (I.E. 1024 BITS/S/NODE)
Routing protocol Average end-to-end delay
Proposed solution 91 msAODV 7178 msDYMO 6623 ms
DSR 9402 msLAR1 4352 ms
OLSRv2 Niigata 17458 msSTAR 11412 ms
the routing path and shift it to node 19, which will affect thelatency. From the perspective of a unicast routing protocol,this is a trivial scenario, because the failing node 23 has onlytwo neighbors, and the procedure of establishing a new pathshould be quite straightforward. The recovery times, definedas the time between a node failure and reestablishment ofthe route via an alternative path, are shown in Table III. Thecorresponding PDRs are presented in Fig. 3. Our approachachieves 100% PDR, whereas its closest follower, DSR, de-livers around 91%. The results suggest that our solution hasa seamless transition in the event of topology change, whichdoes not hold for other protocols examined.
TABLE IIIRECOVERY TIMES FOR VARIOUS ROUTING PROTOCOLS
Routing protocol Recovery time
Proposed solution 0 secAODV ≥ simulation timeDSR 297 sec
DYMO 305 sec
C. Scenario CFig. 3 presents PDRs of routing protocols in Network model
2 under Street Microcell propagation model [15] combinedwith Rayleigh fading. For Tcbr = 500 ms our approachexhibits PDR of 84.28%, the highest of all protocols observed.Average end-to-end delay of the proposed solution is wellbelow the 500 ms deadline, as shown in Table IV. Similarly toScenario B, the good performance stems from the redundancyof multipath.
Fig. 3. Packet delivery ratios of Scenarios B and C

TABLE IVAVERAGE END-TO-END DELAYS FOR SCENARIO C (RAYLEIGH FADING)
Routing protocol Average end-to-end delay
Proposed solution 183 msAODV 183030 msDSR 48173 ms
DYMO 68025 ms
D. Scenario D
Fig. 4 shows the dependency of latency on network popula-tion size. The observed networks have a sensor refresh rate ofTcbr = 1 sec and 75% nodes located one hop away from thesink. The simulation results indicate that our solution allowsthe use of larger networks than all other protocols, with respectto the latency constraint. According to the results, AODV,DYMO and DSR can meet the demands of the two evaluationcriteria only for networks of up to 20-25 nodes, whereas theaverage end-to-end delays exhibited by our approach stay wellbelow the deadline throughout the observed range of networksizes. The latency curve of our solution has a constant slope,while the latencies of other routing protocols explode aroundthe 18-node mark.
In order to further assess the performance of our solution,we have determined the maximum network sizes that it cansupport for sensor refresh rates of 250, 500, 750 and 1000 ms.The networks are built up iteratively, following the previouslydefined 75%-25% assumption. The results in Table V illustratethe maximum node populations that can satisfy the Te2e ≤Tcbr and (2, 3)-firm deadline criteria. The feasible networksizes are sufficient for the majority of IWSAN applications.The need for a larger network can be satisfied by deployingadditional sinks, thus partitioning the overall node populationinto smaller entities.
Fig. 4. Average end-to-end delay as a function of network size
VI. CONCLUSIONS AND FUTURE WORK
In this Paper we show that flooding can be efficiently usedfor data dissemination in IWSANs, under certain conditionsand minimal modifications. The simulation results suggest thatour approach is capable of delivering data faster and moreefficiently than the other routing protocols examined, withsignificantly less complexity. The latency is highly correlated
TABLE VFEASIBLE NETWORK SIZES AND CORRESPONDING AVERAGE END-TO-END
DELAYS FOR THE PROPOSED SOLUTION
Refresh rate Maximum network size Average end-to-end delay
250 ms 16 nodes 91 ms500 ms 33 nodes 183 ms750 ms 50 nodes 356 ms1000 ms 65 nodes 457 ms
with topology size and sensor refresh rate, and networkscomprising up to several dozens of nodes can meet the timingand reliability requirements, which is sufficient and relevantfor real-world IWSAN deployments.
The future work in this area should consider further en-hancements of the proposed solution, such as optimization ofscheduling, data aggregation and further development of theweight concept, to name a few.
REFERENCES
[1] J. Akerberg, M. Gidlund, and M. Bjorkman, “Future research challengesin wireless sensor and actuator networks targeting industrial automa-tion,” in to appear in 9th IEEE International Conference on IndustrialInformatics (INDIN ’11), 2011.
[2] P. Nenninger and M. Ulrich, “Harvest time,” ABB review, vol. 1, pp. 47–51, 2011.
[3] P. Park, C. Fischione, A. Bonivento, K. Johansson, and A. Sangiovanni-Vincent, “Breath: An adaptive protocol for industrial control applicationsusing wireless sensor networks,” Mobile Computing, IEEE Transactionson, vol. PP, no. 99, p. 1, 2010.
[4] (2010) Hart 7 specification. [Online]. Available: http://www.hartcomm.org/
[5] A. Herms, M. Schulze, J. Kaiser, and E. Nett, “Exploiting pub-lish/subscribe communication in wireless mesh networks for industrialscenarios,” in Emerging Technologies and Factory Automation, 2008.ETFA 2008. IEEE International Conference on, 2008, pp. 648 –655.
[6] K. Akkaya and M. Younis, “A survey on routing protocols for wirelesssensor networks,” Ad Hoc Networks, vol. 3, no. 3, pp. 325 – 349, 2005.
[7] Z. Tang and Q. Hu, “A cross-layer flooding strategy for wirelesssensor networks,” in Industrial and Information Systems (IIS), 2010 2ndInternational Conference on, vol. 2, 2010, pp. 377 –380.
[8] J. Gao, Y. Xu, and X. Li, “Directed flooding with self-pruning inwireless sensor networks,” in Integration Technology, 2007. ICIT ’07.IEEE International Conference on, 2007, pp. 619 –622.
[9] R. Farivar, M. Fazeli, and S. Miremadi, “Directed flooding: a fault-tolerant routing protocol for wireless sensor networks,” in SystemsCommunications, 2005. Proceedings, 2005, pp. 395 – 399.
[10] J. Lu and K. Whitehouse, “Flash flooding: Exploiting the capture effectfor rapid flooding in wireless sensor networks,” in INFOCOM 2009,IEEE, 2009, pp. 2491 –2499.
[11] I. F. Akyildiz, W. Su, Y. Sankarasubramaniam, and E. Cayirci, “Wirelesssensor networks: a survey,” Computer Networks, vol. 38, pp. 393–422,2002.
[12] L. Oberg and Y. Xu, “Prioritizing bad links for fast and efficient floodingin wireless sensor networks,” in Sensor Technologies and Applications,2007. SensorComm 2007. International Conference on, pp. 118 –126.
[13] M. Soyturk and D. Altilar, “Source-initiated geographical data flowfor wireless ad hoc and sensor networks,” in Wireless and MicrowaveTechnology Conference. WAMICON ’06. IEEE Annual, pp. 1–5.
[14] M. Hamsaoui and P. Ramanathan, “Evaluating dynamic failure proba-bility for streams with (m, k)-firm deadlines,” Computers, IEEE Trans-actions on, vol. 46, no. 12, pp. 1325 –1337, Dec 1997.
[15] T. Rappaport, Wireless Communications: Principles and Practice,2nd ed. Upper Saddle River, NJ, USA: Prentice Hall PTR, 2001.
[16] J. Akerberg, M. Gidlund, M. Bjorkman, and F. Reichenbach, “Mea-surements on an industrial wirelesshart network supporting profisafe: Acase study.”

APPENDIX A: Some experiences from using QualNet 5.0
Physical-MAC layer compatibility issues in QualNet
QualNet 5.0 does not support interoperability of 802.15.4 Physical and TDMA MAClayer. The solution is to use the Abstract Physical layer model, which is compatiblewith TDMA. Abstract PHY comes in two reception modes: SNR-based and BER-based. Both models require the user to de�ne the reception sensitivity and receptionthreshold. In the case of SNR-based model, the received signal with RSS below receptionsensitivity will not be detected. Additionally, for a packet to be correctly received, itsRSS must be above the reception threshold as well. BER-based model enables theuser to provide BER tables that will de�ne BER for a given SNR. In this work, SNR-based model is used, with the values of reception sensitivity and reception thresholdcorresponding to the ones that WirelessHART prescribes.
Average end-to-end delay calculation in QualNet
QualNet calculates the average end-to-end delay in a rather unusual way, by summingup average delays for all the nodes in the network. In order to obtain the averageend-to-end delay in the network as de�ned previously in this Thesis, one must dividethe end-to-end delay provided by QualNet with the number of nodes in the network,excluding the sink.
APPENDIX B: IWSN topologies used in scenarios
43

Figure 11: IWSN model for Scenario A1
Figure 12: IWSN model for Scenario A2
44

Figure 13: IWSN model for Scenario B
Figure 14: IWSN model for Scenario C1
45

Figure 15: IWSN model for Scenario C2
Figure 16: IWSN model for Scenario C3
46

References
[1] Hart 7 speci�cation, http://www.hartcomm.org/, 2010.
[2] Scalable network technologies, http://www.scalable-networks.com, 2010.
[3] Åkerberg J., Gidlund M., Neander J., Lennvall T., and Bjorkman M. Deterministicdownlink transmission in wirelesshart networks enabling wireless control applica-tions. In IECON 2010 - 36th Annual Conference on IEEE Industrial ElectronicsSociety, pages 2120 �2125, 2010.
[4] Johan Åkerberg, Mikael Gidlund, and Mats Björkman. Future research challengesin wireless sensor and actuator networks targeting industrial automation. In 9thIEEE International Conference on Industrial Informatics (INDIN), July 2011.
[5] Johan Åkerberg, Frank Reichenbach, Mikael Gidlund, and Mats Björkman. Mea-surements on an industrial wireless hart network supporting pro�safe: A casestudy. In The 16th IEEE International Conference on Emerging Technology andFactory Automation (ETFA), September 2011.
[6] Kemal Akkaya and Mohamed Younis. A survey on routing protocols for wirelesssensor networks. Ad Hoc Networks, 3(3):325 � 349, 2005.
[7] A.M. Baghaie and B. Krishnamachari. Fast �ooding using cooperative transmis-sions in wireless networks. In Communications, 2009. ICC '09. IEEE InternationalConference on, pages 1 �5, 2009.
[8] Filip Bara¢, Johan Åkerberg, and Mikael Gidlund. A lightweight routing protocolfor industrial wireless sensor and actuator networks. In 37th Annual Conferenceof IEEE Industrial Electronics Society, November 2011.
[9] I. Chakeres, E. Belding-royer, and C. Perkins. Dynamic manet on-demand (dymo)routing. 2005.
[10] Thomas Clausen, Philippe Jacquet, Anis Laouiti, Pascale Minet, Paul Muh-lethaler, and Amir Qayyum. Optimized link state routing protocol. 2002.
[11] R. Farivar, M. Fazeli, and S.G. Miremadi. Directed �ooding: a fault-tolerantrouting protocol for wireless sensor networks. In Systems Communications, 2005.Proceedings, pages 395 � 399, 2005.
[12] Jianliang Gao, Yongjun Xu, and Xiaowei Li. Directed �ooding with self-pruningin wireless sensor networks. In Integration Technology, 2007. ICIT '07. IEEEInternational Conference on, pages 619 �622, 2007.
[13] Z.J. Haas, J.Y. Halpern, and Li Li. Gossip-based ad hoc routing. In INFOCOM2002. Twenty-First Annual Joint Conference of the IEEE Computer and Commu-nications Societies. Proceedings. IEEE, 2002.
[14] Z.J. Haas, J.Y. Halpern, and Li Li. Gossip-based ad hoc routing. Networking,IEEE/ACM Transactions on, 14(3):479 �491, 2006.
[15] Zygmunt Haas. A new routing protocol for the recon�gurable wireless networks.pages 562�566, 1997.
47

[16] M. Hamdaoui and P. Ramanathan. A dynamic priority assignment techniquefor streams with (m, k)-�rm deadlines. Computers, IEEE Transactions on,44(12):1443 �1451, Dec 1995.
[17] M. Hamsaoui and P. Ramanathan. Evaluating dynamic failure probabilityfor streams with (m, k)-�rm deadlines. Computers, IEEE Transactions on,46(12):1325 �1337, Dec 1997.
[18] Tian He, J.A. Stankovic, Chenyang Lu, and T. Abdelzaher. Speed: a statelessprotocol for real-time communication in sensor networks. In Distributed ComputingSystems, 2003. Proceedings. 23rd International Conference on, pages 46 � 55, May2003.
[19] A. Herms, M. Schulze, J. Kaiser, and E. Nett. Exploiting publish/subscribe com-munication in wireless mesh networks for industrial scenarios. In Emerging Tech-nologies and Factory Automation, 2008. ETFA 2008. IEEE International Confer-ence on, pages 648 �655, 2008.
[20] J.P. Hespanha, P. Naghshtabrizi, and Yonggang Xu. A survey of recent results innetworked control systems. Proceedings of the IEEE, 95(1):138 �162, 2007.
[21] C. Intanagonwiwat, R. Govindan, D. Estrin, J. Heidemann, and F. Silva. Directeddi�usion for wireless sensor networking. Networking, IEEE/ACM Transactionson, 11(1):2 � 16, February 2003.
[22] Hyo-Cheol Jeong, Ki-Deok Kwon, and Younghwan Yoo. Cross-layer counter-based�ooding without location information in wireless sensor networks. In InformationTechnology: New Generations (ITNG), 2010 Seventh International Conference on,pages 840 �845, 2010.
[23] David B. Johnson and David A. Maltz. Dynamic source routing in ad hoc wirelessnetworks. IEEE Transactions on Mobile Computing, 1996.
[24] Young-Bae Ko and Nitin H. Vaidya. Location-aided routing (lar) in mobile ad hocnetworks. Wirel. Netw., 6:307�321, July 2000.
[25] Yanjun Li, Chung Shue Chen, Ye-Qiong Song, Zhi Wang, and Youxian Sun. En-hancing real-time delivery in wireless sensor networks with two-hop information.Industrial Informatics, IEEE Transactions on, 5(2):113 �122, May 2009.
[26] Jiakang Lu and K. Whitehouse. Flash �ooding: Exploiting the capture e�ect forrapid �ooding in wireless sensor networks. In INFOCOM 2009, IEEE, pages 2491�2499, 2009.
[27] J. J. Garcia luna aceves and Marcelo Spohn. Source-tree routing in wireless net-works. In International Conference on Network Protocols, pages 273�282, 1999.
[28] P. Nenninger and M. Ulrich. Harvest time. ABB review, 1:47 �51, 2011.
[29] L. Oberg and Youzhi Xu. Prioritizing bad links for fast and e�cient �ooding inwireless sensor networks. In Sensor Technologies and Applications, 2007. Sensor-Comm 2007. International Conference on, pages 118 �126, 2007.
[30] P. Park, C. Fischione, A. Bonivento, K. Johansson, and A. Sangiovanni-Vincent.Breath: An adaptive protocol for industrial control applications using wirelesssensor networks. Mobile Computing, IEEE Transactions on, 2010.
48

[31] C.E. Perkins and E.M. Royer. Ad-hoc on-demand distance vector routing. InMobile Computing Systems and Applications, 1999. Proceedings. WMCSA '99.Second IEEE Workshop on, pages 90 �100, February 1999.
[32] Theodore Rappaport. Wireless Communications: Principles and Practice. Pren-tice Hall PTR, Upper Saddle River, NJ, USA, 2nd edition, 2001.
[33] Bernard Sklar. Rayleigh fading channels in mobile digital communication systemsPart I: Characterization. IEEE Communications Magazine, 35(7), 1997.
[34] Jianping Song, Song Han, A.K. Mok, Deji Chen, M. Lucas, and M. Nixon. Wire-lesshart: Applying wireless technology in real-time industrial process control. InReal-Time and Embedded Technology and Applications Symposium, 2008. RTAS'08. IEEE, pages 377 �386, 2008.
[35] M. Soyturk and D.T. Altilar. Source-initiated geographical data �ow for wirelessad hoc and sensor networks. In Wireless and Microwave Technology Conference,2006. WAMICON '06. IEEE Annual, pages 1 �5, 2006.
[36] Gordon L. Stuber. Principles of Mobile Communication. Kluwer Academic Pub-lishers, Norwell, MA, USA, 1st edition, 1996.
[37] Zhenzhou Tang and Qian Hu. A cross-layer �ooding strategy for wireless sensornetworks. In Industrial and Information Systems (IIS), 2010 2nd InternationalConference on, volume 2, pages 377 �380, 2010.
[38] Yu-Chee Tseng, Sze-Yao Ni, Yuh-Shyan Chen, and Jang-Ping Sheu. The broadcaststorm problem in a mobile ad hoc network. Wireless Networks.
[39] Xiaodong Wang, Jun Yin, Qi Zhang, and D.P. Agrawal. A cross-layer approachfor e�cient �ooding in wireless sensor networks. In Wireless Communications andNetworking Conference, 2005 IEEE, volume 3, pages 1812 � 1817 Vol. 3, 2005.
[40] T. Watteyne, A. Molinaro, M. Richichi, and M. Dohler. From manet to ietf rollstandardization: A paradigm shift in wsn routing protocols. CommunicationsSurveys Tutorials, IEEE, 2010.
[41] ON World. Industrial wireless sensor networks: A market dynamics report ,http://www.onworld.com/smartindustries/index.html, 2010.
[42] Wei Yen, Ching-Wei Chen, and Cheng hsiang Yang. Single gossiping with direc-tional �ooding routing protocol in wireless sensor networks. In Industrial Elec-tronics and Applications, 2008. ICIEA 2008. 3rd IEEE Conference on, pages 1604�1609, 2008.
[43] Y. Zhang and M. Fromherz. Constrained �ooding: a robust and e�cient routingframework for wireless sensor networks. In Advanced Information Networking andApplications, 2006. AINA 2006. 20th International Conference on, volume 1, page6 pp., 2006.
[44] Yuecheng Zhang and Liang Cheng. Flossiping: a new routing protocol for wirelesssensor networks. In Networking, Sensing and Control, 2004 IEEE InternationalConference on, 2004.
49