performance scorecards for operations & maintenance
TRANSCRIPT
Standards
Certification
Education & Training
Publishing
Conferences & Exhibits
Performance Scorecards for Operations & Maintenance
Alex Bates, [email protected]
Agenda
• Performance Optimization– Manufacturing KPIs
– Gap Analysis
– Scorecards
• Data Collection– How to do it, how not to do it
• Business Intelligence– Overview
– Hierarchies
• O&M Metrics
• Scorecard Tools

Performance Scorecards - History
• Finance – Budgeting– Finance has been Scorecarding for Years by defining budget targets– From the Corporate level down to each cost center, track:
– Actual– Budget– Forecast (updated throughout year)
• Manufacturing – Operations & Maintenance– Only recently has tracking actual vs target performance in such a
systematic fashion been applied to other departments in manufacturing
– Another new trend: scorecards being used by plant personnel, notjust executives
– Enabler for Continuous Improvement initiatives– E.g following DMAIC Model

Measure & Manage Results
• Corporate– Asset or capital-based metrics link performance to shareholder value, such
as RONA and ROCE
• Production Effectiveness– For example, OEE and Cost per Unit Production (Ton, MW, barrel, etc)
• Equipment Reliability and Work Process Effectiveness– Measured by MTBF for equipment reliability; ratio of unplanned to planned
work; inventory turn rates to measure storehouse effectiveness
• Program Effectiveness– For example, defects identified prior to failure indicate effectiveness of
programs; track program results through scorecards

Gap Analysis
• Find areas where biggest performance gaps (between current level and industry best practices) – should be first step in
improvement program “find lowest hanging fruit”
• Separate Gap Analysis for Areas:– Availability
– Yield
– Quality
– Cost
• Example: chemical facility high in Quality and Yield, should focus on improvement in
Availability and Cost
Scorecarding Background
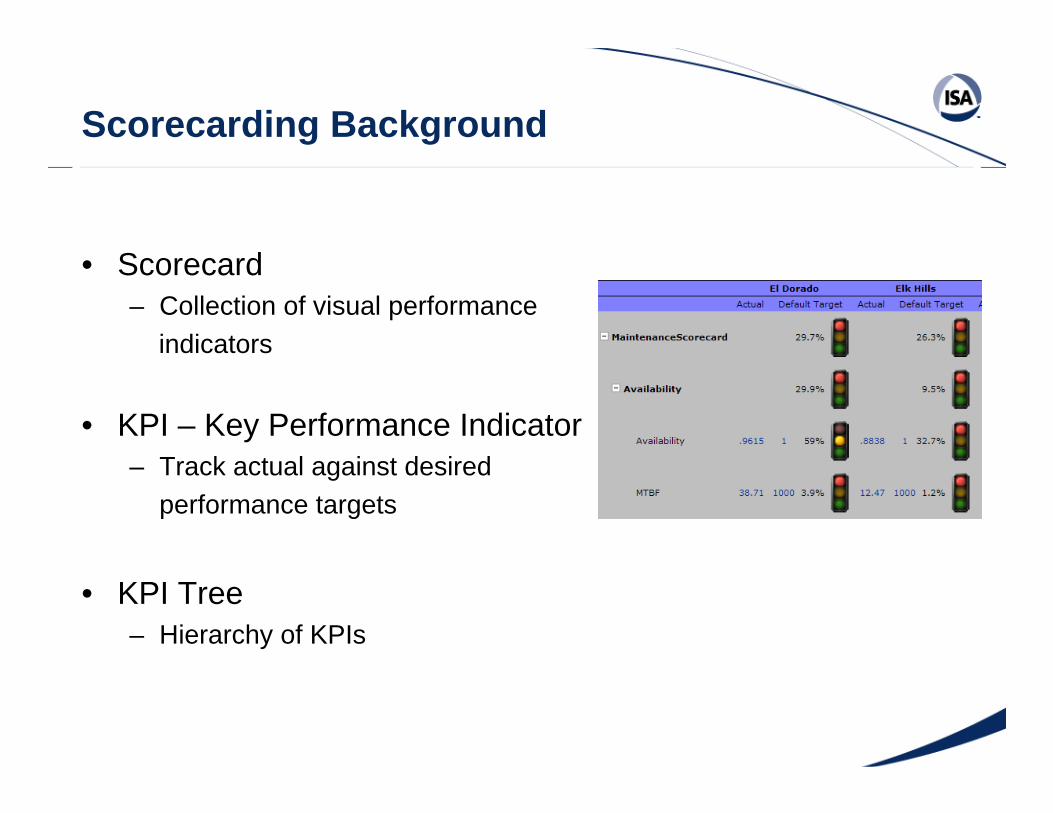
• Scorecard– Collection of visual performance
indicators
• KPI – Key Performance Indicator– Track actual against desired
performance targets
• KPI Tree– Hierarchy of KPIs

Balanced Scorecard Overview
• Continuous Improvement methodology– Translate strategy into execution
• Traditional view balances • performance across
– Financial– Customer– Internal Business Processes– Learning & Growth
• How does this apply to manufacturers?– Need more focused views of performance– Break out Operations, Maintenance, Reliability

The Wrong Way to Collect the Data
Periodic & On-lineCondition Monitoring
Systems
SCADA,Plant Historians
Asset Health,Predictive
Maintenance
EAM MES ERP
•Old Approach: Proprietary Integration Nightmare
The Right Way to Collect the Data
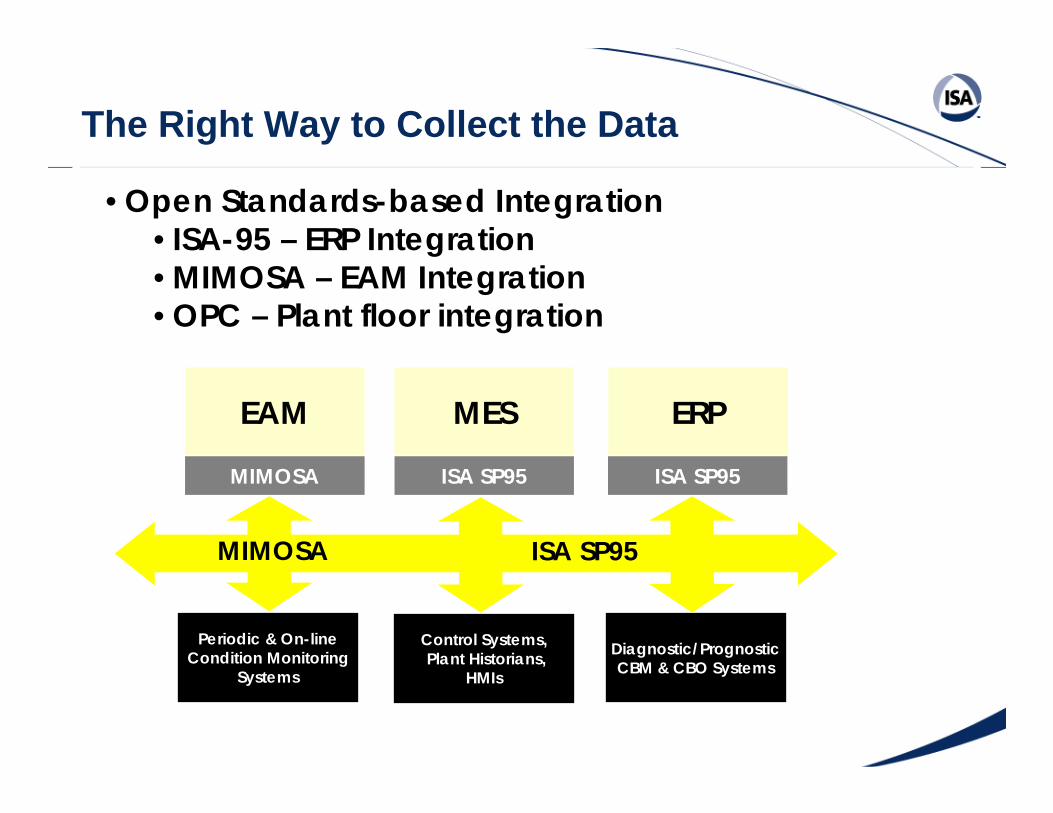
•Open Standards-based Integration•ISA-95 – ERP Integration•MIMOSA – EAM Integration•OPC – Plant floor integration
Periodic & On-lineCondition Monitoring
SystemsDiagnostic/PrognosticCBM & CBO Systems
EAM
Control Systems,Plant Historians,
HMIs
ERP
ISA SP95
MES
ISA SP95MIMOSA
MIMOSA ISA SP95
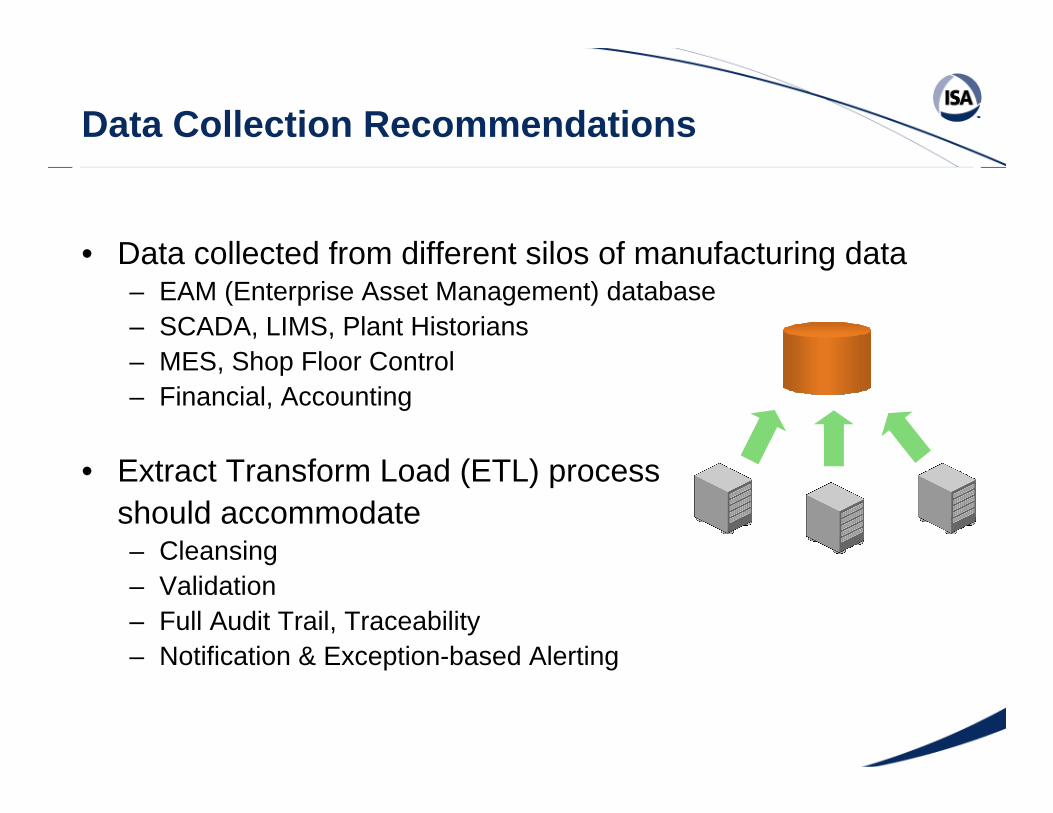
• Data collected from different silos of manufacturing data– EAM (Enterprise Asset Management) database– SCADA, LIMS, Plant Historians– MES, Shop Floor Control– Financial, Accounting
• Extract Transform Load (ETL) process should accommodate– Cleansing– Validation– Full Audit Trail, Traceability– Notification & Exception-based Alerting
Data Collection Recommendations
EAMSCADA
OTHER

Business Intelligence – Enabler for Scorecarding
• Traditional Database – Optimized for structured data storage, retrieval– Structured into Tables, Rows
• OLAP Database– Optimized for interactive analysis– Data is summarized into multi-dimensional views
and hierarchies– Allows for very intuitive analysis by end users– Enables drill-down through pre-defined hierarchies– Example Hierarchies
– Time [Year, Month, Day]– Geography [Country, State, City, ZipCode]– Plant [Plant, Area, Production Unit, Equipment]
Example: Microsoft Analysis Services

Manufacturing Scorecards – Prior Work
• Reliability Scorecard – John Mitchell
• Maintenance Scorecard – Daryl Mather
• RCM Scorecard – Jack Nicolas– Reliability-Centered Maintenance
• Operations Scorecard – Producer Value Model – John Mitchell– Goes from corporate manufacturing metrics down to low level
equipment and quality metrics

Producer Value Model
• Producer - entity for which you can calculate – Cost of materials
– Price of finished goods
• Example – each unit in multi-unit power plant, chemical plant, or oil refinery
• Producer Value Model – simplified Income Statement – Top Tier - EVA (after tax profit – cost of capital), RONA, ROCE
– Middle Tier – production process including OEE, conversion cost
– Bottom Tier – O&M metrics, materials, energy

Producer Value Model Diagram
Conversion Cost (actual)
Interest rateNet Assets X
Income fromFinished Goods
Cost of Raw Materials Taxes After Tax
Operating Profit= Cost of Capital =EVA
Administrative Operations
Operations & Maintenance, O & M
Safety,Environmental
Utilities;electric, water
Price ofFinished Goods
ProductionYield
._. = TPE
Conversion Cost (objective)
Production Rate (actual)
Production Rate (objective)
Availability(actual)
Availability(objective)
Quality(actual)
Quality(objective)
OEEOEE
ConversionCosts
ValueCost Maintenance Waste Disposal
Market Conditions
= RONA, ROCE

Maintenance & Reliability KPIs
• KPIs Frequently used in Maintenance & Reliability– Availability
– Utilization
– Mean Time Between Failure (MTBF)
• Aggregation Techniques– Can be calculated for low level equipment, and rolled all the way up
to Plant level
– Aggregation types include Sum, Average, Weighted Average, Average Over Time, Min, Max, Count

KPI Hierarchy: Strategic to Tactical KPIs
Metric ClassMetric Class
Asset / CapitalAsset / Capital
Industry PerformanceIndustry Performance
Operating EffectivenessOperating Effectiveness
Reliability ManagementReliability Management
Work Process EfficiencyWork Process Efficiency
Program EffectivenessProgram Effectiveness
StrategicStrategic
OperatingOperating
EffectivenessEffectiveness
RONA, ROCE, ROERONA, ROCE, ROE
ExamplesExamples
Cost as a % of CAV/RAV, EDC,Cost as a % of CAV/RAV, EDC,Manufacturing Cost per UnitManufacturing Cost per Unit
OEE, Asset Utilization, COPQOEE, Asset Utilization, COPQ
MTBF, MTTF, MTTRMTBF, MTTF, MTTR
Planned to Total Work,Planned to Total Work,Overtime as % Total Hours,Overtime as % Total Hours,
Storehouse Stock EffectivenessStorehouse Stock Effectiveness
Faults Detected Prior to Failure,Faults Detected Prior to Failure,Avoided CostAvoided Cost

Scorecard Tools
• Enable rapid rollout of KPI hierarchies• Can create separate scorecards for each department
– Operations– Maintenance– Reliability– Finance
• Integrate with Business Intelligence foundation– Enables KPIs to be linked to BI Hierarchies– Example Hierarchies
– Time [Year, Month, Day]– Geography [Country, State, City, Zip Code]– Plant [Plant, Area, Production Unit, Equipment]
– Example Rollout: – Set Plant availability targets, equipment availability is automatically
rolled up to Plant by BI system– Can drill down from Plant to analyze problems

Scorecard Tools
• Question: how do we go from a collection of different KPIs into Departmental and Corporate performance indicators?– How can “roll up” different KPIs such as OEE, Availability,
MTBF?
• Answer: weighted average– Scorecard tools enable users to weight individual KPIs according
to their relative importance– Scores are normalized on a percentage basis– KPIs roll up to Departmental Indicators (Operations,
Maintenance, Reliability, Finance), and finally up to Corporate indicators
Summary
• What one does not measure, one cannot improve
• Scorecarding is key component of Continuous Improvement
• Visual performance dashboards help keep accountability, provide leading indicators of future performance
• Rigorous tracking of performance targets is no longer just a Budgeting task, also being applied to Operations & Maintenance
• Significant returns can be achieved with focus on identifying performance gaps, greatest opportunities for improvement
www.mtelligence.net