performance scalability enhancements in sap adaptive...
TRANSCRIPT

PERFORMANCE SCALABILITY ENHANCEMENTS IN SAP ADAPTIVE SERVER® ENTERPRISE A DISCUSSION ON SCALABILITY ENHANCEMENTS IN SAP ASE 16.0

PERFORMANCE SCALABILITY ENHANCEMENTS IN SAP ADAPTIVE SERVER® ENTERPRISE
TABLE OF CONTENTS WHAT IS SCALABILITY AND WHY DOES IT MATTER? ........................................................................... 3
The example of logical locks ................................................................................................................... 3
Logical Locks vs. Physical Locks............................................................................................................. 4 IMPROVING SCALABILITY ........................................................................................................................ 5
Reducing Contention............................................................................................................................... 5 Decomposing locks ...............................................................................................................................................................................6 Optimizing codepath .............................................................................................................................................................................6 Make the resource local ........................................................................................................................................................................6 Use non-locking mechanisms ...............................................................................................................................................................7
Hardware Optimization ............................................................................................................................ 9 NEW FEATURES IN SAP ASE 16 ............................................................................................................. 10 TRANSACTION LOGGING ....................................................................................................................... 11
Transaction Log Scalability ................................................................................................................... 11 Background .......................................................................................................................................... 12
Buffer Pinning ....................................................................................................................................... 12
Buffer Unpinning ................................................................................................................................... 13 ASE 16.0: ULC Queue .......................................................................................................................... 15
Impact on Configuration & Tuning ......................................................................................................... 16 PROCEDURE CACHE .............................................................................................................................. 18
Procedure Cache & Engine Local Cache............................................................................................... 18
ASE 16.0 Engine Local Cache .............................................................................................................. 18 Procedure Cache Sizing and ELC Size ............................................................................................................................................ 19 ELC & Large Chunk Allocations ........................................................................................................................................................ 20
LOCK MANAGER ..................................................................................................................................... 22
Table Intent Lock Optimization .............................................................................................................. 22
ELC Transfer Optimization .................................................................................................................... 22 Other Locking Optimizations ................................................................................................................. 23
META-DATA MANAGEMENT ................................................................................................................... 24
Meta-data Descriptors ........................................................................................................................... 24 Caching systypes and sysdatabases in meta-data................................................................................. 24
DATA ACCESS ......................................................................................................................................... 25 SCALING REAL-WORLD APPLICATIONS WITH SAP ASE 16 ................................................................ 26
2

PERFORMANCE SCALABILITY ENHANCEMENTS IN SAP ADAPTIVE SERVER® ENTERPRISE
WHAT IS SCALABILITY AND WHY DOES IT MATTER? In the world of database administration, a core skillset that many practitioners claim is “Performance & Tuning”. While the later often infers skills at configuring the database for optimal performance, the former suggests skills at extracting the fastest possible response time or the highest possible throughput given the existing application environment. A skilled DBA can improve the performance of an application by an order of magnitude, for example through something as simple as adding an index.
While performance is important, the ability to grow and adapt the database is even more important. Grow to match new hardware, more users, and more workload. Adapt to manage workload changes, changing use patterns, and new software and hardware features. This ability is known as “scalability”. There are many definitions for scalability, some based on measuring throughput, others on response time. Some definitions focus on horizontal scalability while others vertical scalability. Regardless of the academic definition, from a practical viewpoint scalability is the capability to gracefully manage more workload by adding resources, e.g. processors, or the ability to perform the same workload faster with added resources without degradation.
While theoretically adding more hardware should always improve performance by adding additional capacity, we have all witnessed situations in which adding hardware acerbated the problem and performance plummeted. Why does this happen?
Let’s picture a scenario where the workload increases and we move the application database from an eight core platform to an eighty core platform. It could be due to a wider rollout of the application(s), a merger, new functionality reaching more users, or new opportunities leveraging increased application support. In short, there are a number of reasons why the workload could increase.
So what can happen?
Obviously, as we attempt to scale the application, we could run into a new resource shortage. For instance, IO bandwidth may be insufficient. Then we either decrease the amount of bandwidth needed or increase the amount of that resource. Often times, resource saturation can be resolved by adding the resource needed so long as the hardware has the available capacity such as open slots or there are faster hardware components to replace the component that is the bottleneck. Such solutions are simple - and merely require the capital budget.
But what if the application or the database cannot use all the resources we provide? What if the database is able to use only, say 16 of those 80 fast cores? Why can that be?
THE EXAMPLE OF LOGICAL LOCKS As database professionals we immediately identify one potential culprit: lock conflicts. Given the application and database design too many users/connections need to update the same data, so while one is writing all others are waiting. The need for managing concurrent access to data is obvious to us. We understand the need for writers to lock when INSERTing, UPDATEing and DELETEing. We also understand that if an application is reading the data, we have to prevent concurrent attempts to modify the data to prevent the reader from reading partially modified data.
So how do we resolve this? Can we add any resource to work past this contention? No. In fact, adding resources in such situations often times increases the contention leading to even more severe degradation. A fact that we all understand is that lock contention is a function of concurrency - and by increasing the concurrency, we also increase the probability of contention.
So, then, how can we leverage the 80 cores we now have at our disposal? The answer is that we need to resolve the contention in some way or another:
• Change from allpage locking to data-only locking. • Modify physical database design. • Modify logical database design.
In short we understand that before we can scale this application up, we need to resolve the logical lock contention – there is no resource shortage, but resource contention on shared resources.
3

PERFORMANCE SCALABILITY ENHANCEMENTS IN SAP ADAPTIVE SERVER® ENTERPRISE
LOGICAL LOCKS VS. PHYSICAL LOCKS Similarly, all applications, including relational database management systems (RDBMS), running on multiple cores must also protect shared resources in memory. For example, reading a page from disk into memory and adding that page to the data cache MRU-LRU chain means updating shared resources in memory, namely adding the page in the data cache hashtable for addressing and the chain for managing the page lifespan in cache. In SAP ASE, there are logical locks (page, row, table locks) that control concurrent access to application data as well as physical locks (lock bits, semaphores, spinlocks) that control concurrent access to internal resources (cache hashtables). Other examples of physical locks in ASE include:
MASS bit - Most systems today implement Direct Memory Access (DMA) for writing memory contents directly to storage - without creating additional copies. In order to do so, it is critical that applications protect the memory region being written to disk from changing until the write operation completes. In ASE, this control mechanism is the MASS bit.
Log semaphore - in order to serialize the transactions written to the transaction log, a logical lock in the form of a semaphore is used to control write access to the end of the transaction log.
Spinlocks - in the earlier example, when adding a page to the cache, a process needs to grab the appropriate spinlock protecting the cache hashtable.
In the same manner as applications can run into logical lock contention, application can also run into physical lock contention. Each of these physical locks has different characteristics and behave differently when under contention and exhibit different symptoms of contention. However, in all cases, the end result of such contention is the same - a decrease in scalability - and often a dramatically exponential decrease as contention increases.
4

PERFORMANCE SCALABILITY ENHANCEMENTS IN SAP ADAPTIVE SERVER® ENTERPRISE
IMPROVING SCALABILITY Two of the most common methods for improving scalability are to reduce contention between concurrent users as well as optimizing for hardware environment.
REDUCING CONTENTION Whenever concurrent access to a single shared resource is necessary, there needs to be a method to control who has access at which times. Since the 1960’s, mutual exclusion has been the subject within computer science of managing concurrent access to shared resources. The codepath that access a shared resource is called a critical section and must be managed to avoid code executing on different processors (or interrupt handlers) to interfere. In some languages there are high-level constructs to do this automatically, e.g. “synchronized” in Java. In other cases users must build on logical constructs such as “spinlock” and “semaphore”, which, in turn, are built on more basic mechanisms.
The basic and underlying mechanisms are hardware instructions that allow guaranteed atomic writes to a particular piece of memory. So there are assembler instructions and function calls users can use that are guaranteed to be atomic. If users (callers) continuously try to acquire a locked resource, i.e. spins in a while-loop, then the logical construct is a spinlock. If users (callers) that fail to acquire the locked resource sleep in a queue, awoken in order, then the logical construct is a semaphore. One of the key differences between a semaphore and a spinlock is the amount of time expected before the resource is acquired. If the amount of time could be quite long - a semaphore is used. If the amount of time is expected to be a few CPU cycles, then a spinlock is used.
The underlying hardware instructions raise memory barriers to ensure the atomicity of the operation. The barrier guarantees one core access to that particular memory address and therefore involves core-to-core, and, in case of NUMA, socket-to-socket communications. For software developers it is essential to protect shared resources, but also to design structures and code path so that these memory barriers are raised as little as possible.
Lock conflicts on a semaphore behave as a logical lock conflict, i.e. users (callers) go to sleep while waiting for their turn. In ASE terminology, this is called a “wait event” and the process is put on the sleep queue. This means waiters do not use CPU. However, waiting for a lock can be a scalability bottleneck. For example, we all are aware of the lack of scalability of key sequence assignment using a single key assignment table and SQL such as update key_table set key=key+1. DBMS options such as identity, etc. were invented as a means of eliminating such common scalability issues induced by logical locks.
In addition to the degree of contention, another factor in the impact on scalability is the duration of the contention. For example, both the MASS bit and the Transaction Log semaphore result in the processes waiting on them to be put to sleep. How long the waiting processes sleep is a function of the unit of work and who can unlock the semaphore. For example, in the case of the log semaphore, blocked processes have to wait until the owner of the lock releases the lock. The rationale is simple - the owner may not have yet completed all the operations in the current unit of work. For example, if the server is configured with an 8 page user log cache (ULC) but the log is bound to a 2 page buffer pool, it may take multiple log buffer allocations and transfers to flush a user’s ULC to the primary log cache when their transaction commits. The process flushing the ULC will hold the log semaphore the entire time rather than attempting to reacquire it with each 2 page transfer. In that sense, only the owning process of a semaphore knows when the unit of work is done. By contrast, when a disk write occurs - whether triggered by a checkpoint, the housekeeper, or a wash marker - the write is complete as soon as the OS responds with a write success status. Consequently, the process that polls for IO completion (e.g. the disk IO task) can clear the MASS bit without waiting for the original process needing to be rescheduled on the CPU. In either case, contention on the resource does not impact CPU - but it does decrease the individual process response time and overall system throughput. For example, if the disk writes for the log device took 1ms each, it would be impossible for the application to achieve faster than 1000 transactions per second as each transaction would serialize on the log semaphore which would need to be held pending the disk write - which takes 1ms. In addition, attempts to have sub-millisecond response time for OLTP transactions would be frustrated by the disk I/O speed of the log writes.
5

PERFORMANCE SCALABILITY ENHANCEMENTS IN SAP ADAPTIVE SERVER® ENTERPRISE
Both of the above operations are fairly lengthy - mostly due to the slowness of physical IO - a latency often measured in multiple milliseconds. As a result, as mentioned, blocked processes are put on the sleep queue. However, changing memory can often be measured in nanoseconds - not milliseconds, not microseconds - but nanoseconds - over 100,000 times faster than disk I/O. Keep in mind that a process context switch involves changing memory - e.g. swapping the current processes stack and status registers for a different one - and then swapping them back when the first process needs to run again. This context switch can take a few microseconds. Note that a process’ stack is likely considerably larger than say a single hashbucket entry in a cache hashtable. Consequently, putting a process to sleep simply to change memory would require two much larger memory changes and considerable latency. Since putting a process to sleep and then waking it up is an expensive operation requiring memory structures to be swapped, rather than sleeping while waiting to change memory, blocked processes instead “spin”. By this we mean that they constantly check in a tight loop until the spinlock becomes available. The more concurrent users attempting to modify the same memory region, the more processes “spinning” consuming CPU. As a result, as we are all aware, even modest contention of 20% can result in significant increase in CPU consumption often to the extent of saturating the machine forcing other users to sleep waiting for access to the CPU.
So while contention on semaphores and latches means less CPU utilization - but longer response times/less throughput, contention on spinlocks means more CPU contention - which slows response time and reduces throughput. In order to improve scalability, these contention issues not only need to be resolved, but avoided so that future processing is not impacted by the same scalability bottleneck. Tuning logical lock contention is sometimes as easy as leveraging some SAP ASE feature, sometimes require physical database re-design, sometimes require application changes. But how does one tune physical lock contention?
The principal measures are to ensure that as little as possible is locked and that the lock is held as short time as possible. In terms of software development this translates into:
1) Decomposing locks 2) Optimizing codepath
Then there is the all too obvious alternative, to not lock at all! If we use a shared resource, don’t we have to lock? Well, if the resource is no longer shared? Or if we used basic underlying mechanisms directly, bypassing the logical constructs on top? So for software development there are two more alternatives.
3) Make the resource local 4) Use non-locking mechanisms
Let’s take a closer look at these mechanisms and move from a development view to a database professional view!
Decomposing locks SAP ASE since long provides many features for decomposing physical locks: cache partitions and spinlock ratios on lock hashtables are but two examples. In short it means that instead of locking a lot of memory or many objects with one lock, more locks are used to lock smaller pieces of memory or few objects.
This, in turn, means more DBMS threads can work concurrently, with less interference and contention, i.e. improved performance and scalability. However, there is a requirement to ensure that a process only acquires one such lock at a time. For example, consider cache spinlocks. If a process attempts to acquire more than one cache spinlock, it could lead to internal deadlocks between processes that have acquired particular spinlocks, but then desire to acquire the other processes spinlock.
Optimizing codepath
Obviously this is mostly a development aspect of mutual exclusion. Some topic or aspects concern us database professionals such as ensuring good IO service time and throughput for log IO operations so the log semaphore is held for shorter periods of time.
Make the resource local Shared resources accessed concurrently are at the core of scalability. From our earlier discussion, remember that DBMS implementations such as identity (or sequence objects) were implemented to eliminate
6

PERFORMANCE SCALABILITY ENHANCEMENTS IN SAP ADAPTIVE SERVER® ENTERPRISE
the common scalability bottleneck of the traditional update key_table set key=key+1. However, an identity column is still a single resource and needs to be locked during modification. While this can be done via a physical lock and much faster than the update’s logical lock, it still is a source of contention that limits scalability. To counteract this problem, ASE implemented the “identity grab size” parameter in which each engine would grab a block of numbers from the identity structure rather than just one. Subsequent assignments from processes running on that engine would simply assign a value from that locally cached block of numbers - thus eliminating contention.
Other shared resources can be distributed similarly. For example, a memory pool or a list of available locks could be divided up into global pool and multiple local pools for each engine. During local processing, the engine simply uses the available resource in the local pool. If the local pool is exhausted, the engine requests an additional allotment from the global pool. However, there is still an issue - what happens if both the local pool and global pool are exhausted? Remember, there may still be unused resources in other engines local caches. As a result, the requestor notifies all of the other engines to return unused allocations (especially those above the normal configuration) back to the global pool and then re-attempts to allocate from the global pool. With exception of this synchronization when the global pool is exhausted, the use of a local cache makes the DBMS threads more independent of one another, with less contention and interference, resulting in improved scalability.
SAP ASE has a feature called engine local cache (ELC) for just this purpose. Memory pages, free lock lists, etc. are copied to the engine local cache.
Use non-locking mechanisms To understand non-locking mechanisms we need to get more technical. Above there are discussions on “underlying basic mechanisms” on which physical locks are built. The physical locks being for example spinlocks and semaphores. But what are these “underlying basic mechanisms”?
First we need to understand the concept of “atomic” operations. According to Wikipedia, “atomic operations” is defined as:
In concurrent programming, an operation (or set of operations) is atomic, linearizable, indivisible or uninterruptible if it appears to the rest of the system to occur instantaneously. Atomicity is a guarantee of isolation from concurrent processes. Additionally, atomic operations commonly have a succeed-or-fail definition — they either successfully change the state of the system, or have no apparent effect. Atomicity is commonly enforced by mutual exclusion, whether at the hardware level building on a cache coherency protocol, or the software level using semaphores or locks. Thus, an atomic operation does not actually occur instantaneously.
As noted earlier, many of the current high order languages implement low-level synchronization routines, some of which can be used without locking the resource. The three main types of the latter are test-and-set, compare-and-swap, and fetch-and-add. Both these provide atomic operations and can be used to build higher level physical locks.
Test-and-set is a fairly simple instruction that writes a given value to a memory location and returns the old value. Typically the value written is a “1”, which typically is used to indicate that the lock is locked. If the returned value was zero, then the lock was unlocked and the user (caller) has now locked it. Thus one can view a spinlock as:
// as long as the lock was locked, try to lock it. while (test_and_set(lock) == 1);
Compare-and-swap can appear to do the same, but it gives developers the additional ability to control the old value. To implement a counter with test-and-set, developers would have to lock the actual counter before reading the old value, adding to it and then writing it back before releasing the lock. With compare-and-swap there’s the opportunity to read and write in one fell swoop.
int compare_and_swap (int* reg, int oldval, int newval) { ATOMIC(); int old_reg_val = *reg;
7

PERFORMANCE SCALABILITY ENHANCEMENTS IN SAP ADAPTIVE SERVER® ENTERPRISE
if (old_reg_val == oldval) *reg = newval; END_ATOMIC(); return old_reg_val; }
Compare-and-swap (aka CAS) is extremely important. In order to track performance metrics, shared counters often need to be updated on internal object descriptors. In addition, there are keep counts and other counters that track which objects and databases are in use at any point in time. In the past, these objects often were accessed via spinlocks - some of which were reported via Object Spinlock Contention and Index Spinlock Contention and somewhat tunable via the various associated spinlock ratios.
Updating the keep count using spinlocks looks like this:
1. Acquire spinlock. 2. Update keep count. 3. Release spinlock.
Updating the keep count without using spinlocks looks like this:
1. Update keep count using atomic operation (compare-and-swap)
In the case of spinlocks the memory barrier is raised in steps (1) and (3), and while the spinlock is acquired all other threads attempting to acquire the same spinlock will spin. This long period of time increases contention, especially on boxes with high CPU counts due to the socket-to-socket calls required by the memory barrier. There are CAS functions for incrementing various numeric datatypes and for various simple operations like AND, OR and XOR.
The impact of this change can be significant. Consider a typical OLTP application today which is experiencing 10000 inserts per second into a transaction table. If each of these inserts is a single query, then 10000 times per second, in the past, ASE 15.x would
1. grab the spinlock on the object descriptor (DES) 2. update the keep count on the DES 3. release the spinlock 4. execute the query 5. grab the spinlock on the DES 6. decrement the keep count 7. release the spinlock 8. grab the spinlock for the index descriptor for each index used for the query 9. increment the monitoring counters 10.release the spinlock
Quite simply, a single query execution of 10000 inserts per second could translate into 30000 spinlock grabs or more. For example, an insert into a table with 5 indices would require updating 5 index descriptors. In ASE 16, these spinlock grabs are eliminated by using Compare And Swap (CAS) functions to update keep counts and monitoring counters.
However, CAS cannot be used for everything. If we take a use case like lock manager it is manipulating a doubly linked list of locks hanging off the lock hash table. Acquiring a lock means inserting an item in the linked list, presumably at the end, updating the former last item and the header (relinking to the new last item). Releasing a lock means deleting an item from an arbitrary position in the linked list and updating its neighbours. With a spinlock ratio of 1 (one) this means that a lock object can only be manipulated by one user at a time since that spinlock protects all items in the linked list hanging off that lock object in the hashtable.
But it’s easy to conclude that there are operations on a single lockobject that can be performed concurrently: inserting a new item at the end, and deleting an object in the middle. Here Transactional Memory (TSX) plays a role. Encapsulating the lock hashtable manipulation within transactional memory control commands means that if there’s no conflict then the insert item at end and delete item from middle both go through
8

PERFORMANCE SCALABILITY ENHANCEMENTS IN SAP ADAPTIVE SERVER® ENTERPRISE
concurrently. In case of conflict, one operation is aborted and it’s up to the developer to either re-issue the commands or revert to using spinlocks. Support for transactional memory is being considered for a later release of ASE 16.
The third non-locking mechanism is fetch-and-add (aka fetch-increment). Fetch-and-add is an atomic instruction that reads from a memory location, unconditionally writes a new value (the old value plus one or other value), and returns the old value. An example of such an algorithm is:
<< atomic >> function FetchAndAdd(address location, int l) { int value := *location *location := value + l return value }
In addition to software techniques, often CPU architectures include such instructions to provide improved parallelism with multi-processor configurations. Some of the earliest implementations of compare-and-swap were in the IBM 370 processors as early as the 1970’s. Later, it was implemented in x86 architectures as CMPXCHG. In addition, fetch-and-add was implemented in the early 8086 chips, providing an assembly language interface that could then be exposed to C or other high order languages quite easily.
HARDWARE OPTIMIZATION This technique offers considerable gains as moving the execution flow closer to the hardware can leverage the hardware’s faster execution. However, it also requires a lot of specialization for different hardware platforms as not all vendors may implement the same features. In addition, with the pace of hardware development, such optimizations may be obsolete even before the software that leverages it gets to market and is adopted by customers. As a result, general purpose software developers tend to add hardware optimizations only for mainstream trends or when critical bottlenecks seemingly can’t be resolved efficiently otherwise.
For example, in the above discussion on using non-locking mechanisms, it was mentioned that x86 CPU architectures included the CMPXCHG instruction. Optimizing for x86 then might include linking in an assembly language or machine code module that calls this instruction - which would be orders of magnitude faster than the comparative C code execution path. However, such an optimization would only be usable on x86 ports of the software - and not usable for IBM Power™ processors or Oracle SPARC™ processors. Another example is Transactional Memory, which provides memory writes (and reads) as atomic operations vs. having to first lock the memory location. While many vendors support different implementations of this, for the Intel x86 family, this was first introduced by Intel in the Haswell processor in 2013 using the Transactional Synchronization Extensions. While utilizing this feature could speed up certain operations, it also would limit the software to only processors that supported that hardware extension - even within the Intel x86 family. As a result, hardware bought as recently as 2 years ago would be obsolete.
9

PERFORMANCE SCALABILITY ENHANCEMENTS IN SAP ADAPTIVE SERVER® ENTERPRISE
NEW FEATURES IN SAP ASE 16 New hardware platforms raises the ceiling for off-the-shelf capacity and at the same time brings new challenges: More cores per die, more threads per core and per-core memory with non-uniform memory access (NUMA). SAP ASE has always been in the frontlines of high-performance applications and has demonstrated its capability for scaling for the largest of platforms. Now it is time to take the next step: and as we shall see, it is not only a matter increasing the max number of engines to 1,024 but much more.
SAP ASE 16 addresses these challenges for real-world applications with new features in these key areas:
• Transaction logging. • Procedure cache concurrency. • Lock management. • Meta-data management. • Data Access.
Within each of these areas, specific bottlenecks were identified after extensive testing and instrumentation by the ASE Performance Engineering team together with the respective engineering group based on key customer applications. The results have been impressive as ASE 16 scales linearly on 80 cores. Planned projects in later releases will address some of the remaining bottlenecks that should allow even greater scalability.
10

PERFORMANCE SCALABILITY ENHANCEMENTS IN SAP ADAPTIVE SERVER® ENTERPRISE
TRANSACTION LOGGING A general requirement for an RDBMS is that it upholds the ACID properties for transactions:
• Atomicity is the requirement that a transaction never commits in part. That is, either all changes done by the transaction are in the database, or none of them are
• Durability is the requirement that the effects of a committed transaction are durable. That is, after a system crashes, the changes made by the transaction should remain in the database
In SAP ASE, these properties are enabled by using a transaction log, in addition to other mechanisms. It provides the means to undo changes to the database when a transaction rolls back, thereby ensuring atomicity. The transaction log is flushed to disk when a transaction completes, thereby ensuring that even after a system crash, the database can be recovered using the log records stored within it, to ensure that committed transactions have their changes in the database while uncommitted changes have none of their changes in the database. In addition to data modifications, the transaction log is also accessed during other operations, including:
• Data modifications as a result of inserts, updates and deletes • Space allocations during minimally logged bulk operations • Backward scans during transaction rollbacks to identify all the records that need to be reverted
back to the pre-modified state • On trigger firings to create the inserted and deleted virtual tables. • During checkpoint operations to determine if the number of records exceed the recovery interval
and thus should trigger physical writes of dirty pages • Transaction log dumps • Deferred operations (e.g. update with join/insert select) in which the records to be modified are
first logged and then modified. • Commit processing
As a result, any form of bottleneck can impact application scalability significantly. Over the years, ASE has added a number of features to address different scalability bottlenecks. In ASE 16, the key feature is the reduction of log contention caused by user log caches (ULC) flushed due to buffer unpin operations.
TRANSACTION LOG SCALABILITY In order that a database can be recovered, the changes recorded in the log (log records) must be applied to the database in the order that the changes were made at runtime1. This requires an ordered log; one which records the changes in the order that they happened. The simplest means of having an ordered log is to have a single log, in which log records are added to the end of the log as changes are being made to the database. The log is flushed to disk when a transaction commits as part of the commit to ensure the durability of transactions.
In SAP ASE, for each database, there is a single log to which log records are appended by transactions. Access to the end of the log must be done via a semaphore to ensure that only one transaction at any one time is appending log records. As was mentioned earlier when discussing physical lock contention, whenever the log semaphore is locked by a transaction that is logging its log records, other concurrent transactions that want to append their log records are blocked. Thus the requirements for a scalable transaction log sub-system are essentially that:
• A single log is used and the critical section, during which the log is locked, is kept to a minimum. The activities that might occur during the critical section include: Appending of log records
1 This is a simplification that is not entirely true. Changes must be applied to each page in the order that they occurred.
11

PERFORMANCE SCALABILITY ENHANCEMENTS IN SAP ADAPTIVE SERVER® ENTERPRISE
Maintenance of the log (such as extending the log when necessary) Flushing of the log to disk when a transaction completes2
For a scalable system, the amount of time spent on all these activities within the critical section, should be kept to a minimum: • Or, that the log is parallelized in some way to allow concurrent access, while still maintaining the
ability to maintain ordered log records. It is likely that parallel access through log semaphore decomposition will still result in concurrency, though less than in the non-parallel case. Thus the size of the critical section, even in the parallel case, is important to scalability.
BACKGROUND Prior to System 11 in the mid-1990’s, each time a process modified a data row, it first updated the transaction log. This is critical in Write-Ahead Logging based DBMS’s such as ASE as the order in which records appear in the transaction log affect recovery. For example, the well-established rule for recovery is to compare the page timestamp with the log record timestamp. If the page timestamp is less than the log record timestamp, then the system was shut down before the page was written to disk and the transaction needs to be “rolled forward”. On the other hand, if the page timestamp is greater than the log record timestamp, then it can safely be assumed that the modifications in the log record are already on disk as well as possibly subsequent changes and therefore we can skip rolling forward the changes. Since each user process modified the transaction log with each data modification, this correct sequencing of transaction logging was guaranteed.
However, it was a high source of contention. If a transaction modified 10 rows, it would grab the log semaphore 10 times. With any form of concurrency, the contention on the log semaphore became severely inhibiting. As a result, in System 11, ASE added Private Log Caches (PLC) - aka User Log Caches (ULC). The ULC was a configurable size of private cache in which a user process would record uncommitted log records for pending data modifications until either the transaction committed or the ULC size was exceeded. When this happened, the process would grab the log semaphore and perform a ULC flush of the contents of the ULC as a single log append operation vs. grabbing the log semaphore with each modification. This significantly reduced the log semaphore contention as most database transactions affect more than a single row.
BUFFER PINNING Unfortunately, the implement the ULC added a new wrinkle. Pages in data cache could be written to disk in several instances:
• The page reached the data cache wash marker • The checkpoint process scheduled an I/O on the page due to recovery interval • The housekeeper wash task was able to schedule an I/O on the dirty page
The problem is that as long as the log records were only in memory in the ULC, it was imperative in order to preserve the fundamentals of write-ahead logging that the modified data page was not written to disk until the log was flushed to disk. Otherwise, for example, a data modification could be written to disk for an uncommitted transaction at the time of a system crash. On recovery, there would be the modification from that uncommitted transaction - but no log record from which to perform a transaction rollback.
The solution was found in the concept of buffer pinning. Buffer pinning is common to most DBMS’s and data caching in general. Generically, each buffer in a DBMS cache has a buffer pin count and a dirty bit. The buffer pin count is the number of times the buffer is pinned but not released. As a result, write-ahead logging
2 Flushing of the log in ASE actually happens without the semaphore being held, but logging activity by other transactions is prevented through other (isolation) mechanisms. Keeping the flushing of the log to a minimum is still vital.
12

PERFORMANCE SCALABILITY ENHANCEMENTS IN SAP ADAPTIVE SERVER® ENTERPRISE
could be now enforced by ensuring that the checkpoint, housekeeper wash and wash marker didn’t schedule any I/O’s on pages with a non-zero buffer pin count. This could be illustrated as:
Figure 1 : B uf fer P inning
In the above diagram, SPIDS 1, 2, 4, and 8 each are active. SPIDS 4 & 8 have open transactions with data modifications and as a result buffer pinning of the appropriate pages in the data cache. Once their transactions commit and are safely logged in the transaction log, the buffer pinning is released and the appropriate page buffer pin counts are decremented. If the buffer pin count is now 0, the checkpoint, housekeeper wash or normal wash could schedule an I/O and write the datapage to disk.
Buffer pinning also provided a resolution to another common problem - rollback speed. Because each SPID had to keep track of which buffer memory addresses they would need to decrement the buffer pin count on, if there was a rollback, the pages could be found much more quickly than with a typical cache scan.
BUFFER UNPINNING As with all performance features, eventually time and technology move forward to a point where the very optimization introduced to solve a problem is now the source of a new problem. In the late 1990’s, ASE introduced data only locking (DOL) in two forms: datarow (aka row level locking) and datapage locking. This caused a problem with the previous ULC implementation.
Under allpage locking, if two users wanted to modify different rows on the same page, the first user who acquired the lock would simply block the other user. As a result, there never could be a situation in which two ULC caches referred to the same page. Under DOL locking this was possible for both index pages (datapage locking) as well as data pages (data rows locking). Consider the following illustration:
13

PERFORMANCE SCALABILITY ENHANCEMENTS IN SAP ADAPTIVE SERVER® ENTERPRISE
Figure 2 : C oncurrent T ransact ions on Same Page
Now we have a potential recovery issue. Normally, Bob’s ULC would be flushed first as his transaction has committed. Consider the following sequence:
1) Jane inserts row 1 - page timestamp is now T1 2) Bob inserts row 2 - page timestamp is now T3 3) Bob commits at T4 and his ULC is flushed to disk 4) Jane commits at T7 and her ULC is flushed to disk 5) System crashes at T8 without the datapage being flushed to disk
Because of the crash without flushing the page, the page timestamp is somewhere in the past - say T-5. Now - consider the recovery sequence:
1) Recovery hits Bob’s row first - checks page timestamp (which is less) - rolls forward the insert and updates the page timestamp to T3 (Bob’s original update log record time).
2) Recovery hits Jane’s row second - checks page timestamp - notes that T3 is greater than T1 and skips the insert.
Some might think the solution is simple - merely ignore updating the timestamp of the page on recovery. While that sounds simple, if it worked, in the above case, Bob’s row 2 would now be row 1 on the page and Jane’s row 1 would be row 2. Now, we have a possible problem with index page pointers which consist of a page and row id. Remember, data pages and index pages are flushed to disk independently by the checkpoint or wash markers - consequently on recovery the DBMS has to fix any index pointers for transactions that are rolled forward or back. Net result is that it is important that changes made to each page in ASE are logged in the correct sequence
In order to ensure the correct sequencing of log records, a concept of buffer unpinning was implemented. When buffer unpin occurs, the first transactions log records are flushed to disk before the second user is able to implement buffer pinning. This can be illustrated as:
14
PERFORMANCE SCALABILITY ENHANCEMENTS IN SAP ADAPTIVE SERVER® ENTERPRISE
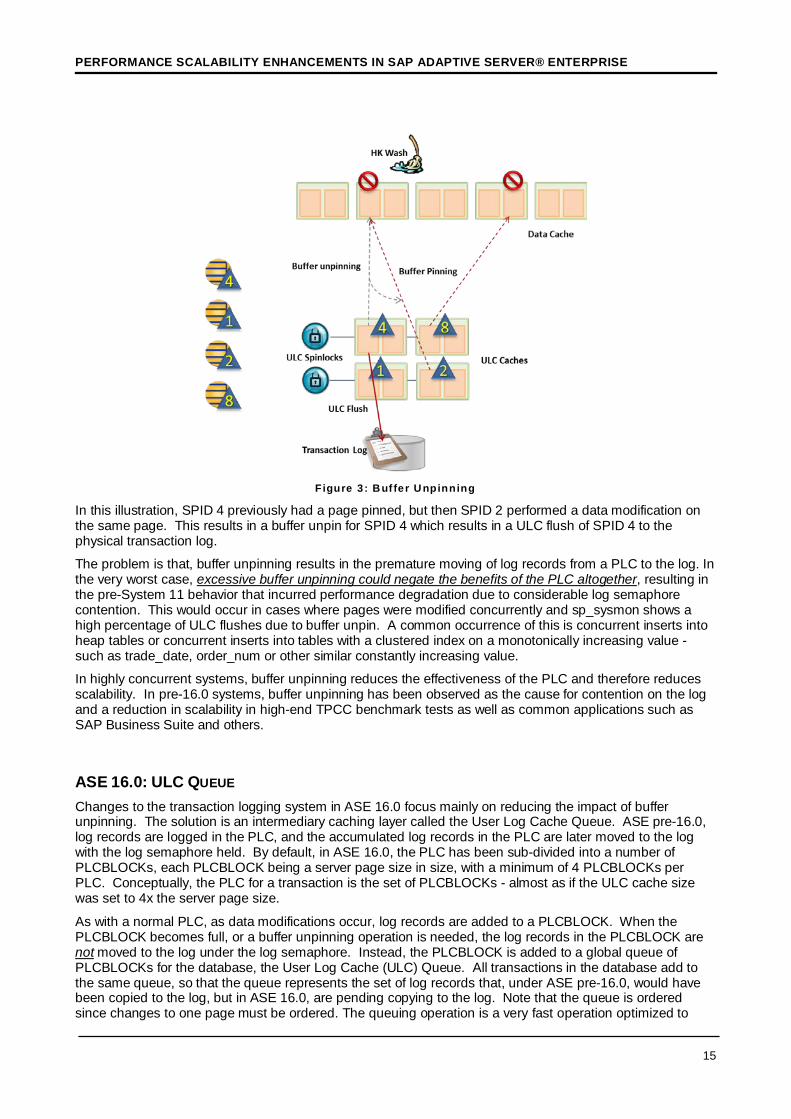
Figure 3 : B uf fer U npinning
In this illustration, SPID 4 previously had a page pinned, but then SPID 2 performed a data modification on the same page. This results in a buffer unpin for SPID 4 which results in a ULC flush of SPID 4 to the physical transaction log.
The problem is that, buffer unpinning results in the premature moving of log records from a PLC to the log. In the very worst case, excessive buffer unpinning could negate the benefits of the PLC altogether, resulting in the pre-System 11 behavior that incurred performance degradation due to considerable log semaphore contention. This would occur in cases where pages were modified concurrently and sp_sysmon shows a high percentage of ULC flushes due to buffer unpin. A common occurrence of this is concurrent inserts into heap tables or concurrent inserts into tables with a clustered index on a monotonically increasing value - such as trade_date, order_num or other similar constantly increasing value.
In highly concurrent systems, buffer unpinning reduces the effectiveness of the PLC and therefore reduces scalability. In pre-16.0 systems, buffer unpinning has been observed as the cause for contention on the log and a reduction in scalability in high-end TPCC benchmark tests as well as common applications such as SAP Business Suite and others.
ASE 16.0: ULC QUEUE Changes to the transaction logging system in ASE 16.0 focus mainly on reducing the impact of buffer unpinning. The solution is an intermediary caching layer called the User Log Cache Queue. ASE pre-16.0, log records are logged in the PLC, and the accumulated log records in the PLC are later moved to the log with the log semaphore held. By default, in ASE 16.0, the PLC has been sub-divided into a number of PLCBLOCKs, each PLCBLOCK being a server page size in size, with a minimum of 4 PLCBLOCKs per PLC. Conceptually, the PLC for a transaction is the set of PLCBLOCKs - almost as if the ULC cache size was set to 4x the server page size.
As with a normal PLC, as data modifications occur, log records are added to a PLCBLOCK. When the PLCBLOCK becomes full, or a buffer unpinning operation is needed, the log records in the PLCBLOCK are not moved to the log under the log semaphore. Instead, the PLCBLOCK is added to a global queue of PLCBLOCKs for the database, the User Log Cache (ULC) Queue. All transactions in the database add to the same queue, so that the queue represents the set of log records that, under ASE pre-16.0, would have been copied to the log, but in ASE 16.0, are pending copying to the log. Note that the queue is ordered since changes to one page must be ordered. The queuing operation is a very fast operation optimized to
15

PERFORMANCE SCALABILITY ENHANCEMENTS IN SAP ADAPTIVE SERVER® ENTERPRISE
avoid contention. So now the next PLCBLOCK in the session’s ULC is the active and that session can continue its work, and the log records are in the PLCBLOCK queued with other blocks awaiting flush to log.
It is important to note that the ULC Queue doesn’t contain the log records themselves, but rather the list of PLCBLOCKs and the sequence in which they need to be flushed to the transaction log. Certain operations, such as transaction completion, ensure that all the log records from all the queued PLCBLOCKs are moved to the log under the log semaphore, including the PLCBLOCK that contains the (just logged) log record to end the transaction. Effectively therefore, a transaction that is forced to have its log records physically in the log, will also move the log records from other transactions (from their queued PLCBLOCKs) into the log at the same time, on their behalf.
When a transaction commits then it needs to flush all its log records to the log and then to disk. This is done by first queuing its PLCBLOCK with the commit in the queue, then flush the queue from its start up to and including the PLCBLOCK that has the commit.
What we can observe in the SAP ASE 16 solution are:
The concept of PLCBLOCKs and the ULC queue is enabled by default in ASE 16. It can be disabled by setting the server configuration ‘user log cache queue size’ to 0 - and reenabled by setting the value to 1. Note that ‘user log cache queue size’ does not actually infer a size as the name suggests, but rather whether the ULC queue is enabled.
It should be clear that the scheme:
• Takes the PLC concept a stage further, by ensuring the copying of even more log records (those from many transactions), under the single acquisition of the log semaphore. The average cost of acquiring the log semaphore per log record is even smaller than the pre-16.0 case
• A buffer unpinning operation now simply becomes the queuing of the PLCBLOCK for the transaction, into the global ULC queue. The log records in the PLC need not be moved to the log under the log semaphore. The impact of buffer unpinning to scalability is therefore greatly reduced.
• Log ordering is still maintained by virtue of the fact that the queue acts as a global conduit for all PLCBLOCKs. Clearly the global queue becomes a single point of contention as PLCBLOCKs are added to this queue. However, this is done under a very lightweight spinlock, and the length of the critical section in doing this is very small.
• All aspects of ACID and recoverability are solid and maintained. • The potential point of contention, the log semaphore, is taken out only once per flush of many
log records, this increased efficiency, decreased contention and improved scalability.
A smaller change in ASE 16.0 that is yet to be finalized is in reducing the size of the critical section that the log semaphore is held by pre-allocating the log. Some degree of log maintenance is done while the log semaphore is held, notably, the allocation of new space to the log (extending the log). Log allocation is done on an extent (8 page) basis. That is, when a PLC is having its log records moved to the log, if there is insufficient space in the log, an additional extent worth of log pages is allocated to the log to accommodate these log records. Looking for the space to use can be a costly business. Log pre-allocation is done by a task that wants to acquire the log semaphore, but is unable because another task is currently holding it. Rather than simply wasting its time waiting for the semaphore, it pre-allocates more extents for the log. The amount of pre-allocation done is limited to allocating extents on the same allocation unit as the current end-of-log, as well as the allocation unit that follows this. The pre-allocation of extents is therefore done concurrently with a transaction that has the log semaphore held, and reduces the need for any transaction to perform log allocations while holding the log semaphore.
IMPACT ON CONFIGURATION & TUNING Prior to ASE 16.0, the ULC flush copied the log records to the log cache and then initiated physical writes to disk. The overall process resembled the following:
16

PERFORMANCE SCALABILITY ENHANCEMENTS IN SAP ADAPTIVE SERVER® ENTERPRISE
Figure 4 : U LC Flush - pre -ASE 16.0
As a result, the common performance and tuning configuration tips were to:
• Configure the user log cache size large enough to cover most common transaction sizes • Configure the log I/O size to be the size of the ULC cache • Configure a buffer pool in the cache the log was bound to of the same size as the log I/O size • Set the session tempdb log cache size to 32768 or higher to avoid log writes in tempdb
In ASE 16.0, this changes only slightly to:
• Configure the user log cache size to DEFAULT or 4 or higher. If DEFAULT, ASE will use 4. • Configure the user log queue cache size to 1. If the user log cache size is not DEFAULT or
greater than 3, this will fail. • Retain the existing log I/O size configuration (e.g. 2x pool) as previous, along with the same the
sp_logiosize setting and the log cache buffer pool size. • Retain the session tempdb log cache size as previous
Note that the key factor as always is that the sp_logiosize setting and the log cache buffer pool sizing are the most critical to be aligned. As with pre-16.0 ASE, you can configure the ULC size to be higher than the sp_logiosize with little impact if any on performance. A ULC flush of a larger ULC size simply does multiple transfers from the ULC cache to the primary log cache. Essentially, that will be the case with ULC queuing - a ULC flush from a commit might transfer up to 4 PLCBLOCKs from the current user’s ULC plus some possible number of individual PLCBLOCKs from other user’s ULC caches that are queued in the UCL queue. However, if buffer unpinning doesn’t happen, the ULC flush will still only flush the ULC.
These new features do not in any sense risk recoverability. The features are made for real-work applications, and real-world applications need recoverability. So SAP ASE 16, with these features of course continues to uphold the ACID requirements for transactions and recoverability. Despite the changes, Write-Ahead Logging is fully maintained - the only difference is that rather than a ULC buffer unpin causing a log flush, instead it is queued temporarily until the next transaction commits. Note that it is any transaction - so a transaction that has modified other tables but has not modified the table that the buffer unpin occurred on, will still flush the ULC queue.
17

PERFORMANCE SCALABILITY ENHANCEMENTS IN SAP ADAPTIVE SERVER® ENTERPRISE
PROCEDURE CACHE Earlier, one of the ways we discussed on how to reduce contention was the concept of making the resource local. Consider a normal application using heap memory allocating memory from the operating system. In such a case, each allocation needs to grab a mutex on the global memory pool - which can result in contention. In most operating systems, the heap space for each process is managed separately and the OS reserves or pre-allocates chunks of memory in advance - reducing the number of requests from the global pool. However, in the case of multi-threaded applications, this often still results in contention. As a result, some OS’s - such as AIX - provide the ability to divide a process’s heap memory pool into multiple pools and use some algorithm such as round-robin to assign the process’s threads among the pools.
PROCEDURE CACHE & ENGINE LOCAL CACHE While ASE allocates all of its memory up-front in the shared memory segments, it has a similar problem with respect to memory allocation and in particular procedure cache. Procedure cache is not only used for keeping compiled stored procedures. It is also used e.g. by the optimizer during compilation - both for loading index statistics for costing and for holding query plans during costing as well as the final query execution plan - and for various memory requests involving sorts, fully prepared statements, cursors, subquery caching, etc. In short, it is used by every request, potentially in multiple ways. In addition, requests from procedure cache often were in different sizes - for example, to load a stored procedure into proc cache, the engine might request multiple 16KB chunks. For other allocations such as fully prepared statements or cursors state might only be requesting single or a few 2KB chunks. With such diverse use and with ever-increasing performance requirements, contention for allocating procedure cache can be quite large.
SAP ASE has since long implemented various optimizations for local caching, including an Engine Local Cache (ELC). In ASE, the ELC is a memory are private to each engine that has been used to hold free procedure cache memory blocks, free locks from the global free lock pool, disk I/O structures and other common global resources to avoid having to access the global pool and the possibility of contention. The problem was that in previous releases the ELC was not exposed to the DBA as a configurable cache - except for the notion of the identity grab size configuration parameter. Items such as disk I/O structures, free locks and procedure cache were simply pre-allocated among the engines based on internal formulas. These allocations worked well on chips from 10 years ago - but with today’s faster CPU’s, the ELC was exhausted much quicker resulting in contention on the global pool on newer systems.
One important aspect to consider about local caches vs. global pools is that if one process exhausts its local cache and there are no more resources in the global pool, the server has to request all of the engines to give up some of their resources back to the global pool. This is a very expensive operation. As a result, many of the formulas for allocating resources to local caches were quite conservative - and in the case of procedure cache in particular, it was frequently unable to service all the requests from a single query resulting in high contention on the global pool.
Note also that the Engine Local Cache contains only free resources - e.g. in the case of procedure cache, currently unused procedure cache buffers. Once a session on the engine uses the buffer - for example loads a procedure from disk - the proc buffers are then linked into the structure for “in use” or “active” in the global procedure cache. If an engine frees up proc cache via removing old procs from cache or similar activities, those newly freed buffers are added to that engines ELC. This is important as at a steady state, there likely isn’t too many free procedure buffers at any point in time - consequently before a new procedure can be loaded from disk, the engine will have to age an old proc (or other resource) out of cache and can quickly re-use those procedure buffers without having to transfer them back to the global pool and re-request them.
ASE 16.0 ENGINE LOCAL CACHE Version 16 improves the Engine Local Cache (ELC) in several ways:
• The procedure cache memory set aside in ELC is configurable through the parameter ‘engine local cache percent’, which is 50% by default - twice the previous unconfigurable value.
18
PERFORMANCE SCALABILITY ENHANCEMENTS IN SAP ADAPTIVE SERVER® ENTERPRISE
• The procedure cache in ELC can be used by all sizes of memory requests. This is configurable through the parameter ‘enable large chunk elc’, which is enabled by default.
• Procedure cache allocation sizes are automatically tuned. This is configurable through the parameter ‘large allocation auto tune’, which is enabled by default.
This means that SAP ASE 16 out-of-the-box decreases the impact of contention on procedure cache by moving more free resources local. Furthermore, it provides the means to increase the private size of the procedure cache to further increase scalability.
Procedure Cache Sizing and ELC Size Note that when configuring the ‘engine local cache percent’ - that percentage needs to be divided by the number of engines to determine how much cache each engine receives.
engine proc cache ELC = procedure cache size free * engine local cache percent / number of engines
For example, assume we have a 4GB procedure cache free, are running with 16 engines and the default ‘engine local cache percent’ of 50%. Each engine would then have 4096MB * 0.5 / 16 = 2048MB / 16 = 128MB of procedure cache in the ELC. However, a server with only 1GB of procedure cache free and 60 engines would only have 1024MB * 0.5 / 60 = ~8.5MB of proc cache in each engine’s ELC. Although 50% seems like a lot, the previous setting was 25% - essentially the change is a doubling of the cache and making it configurable.
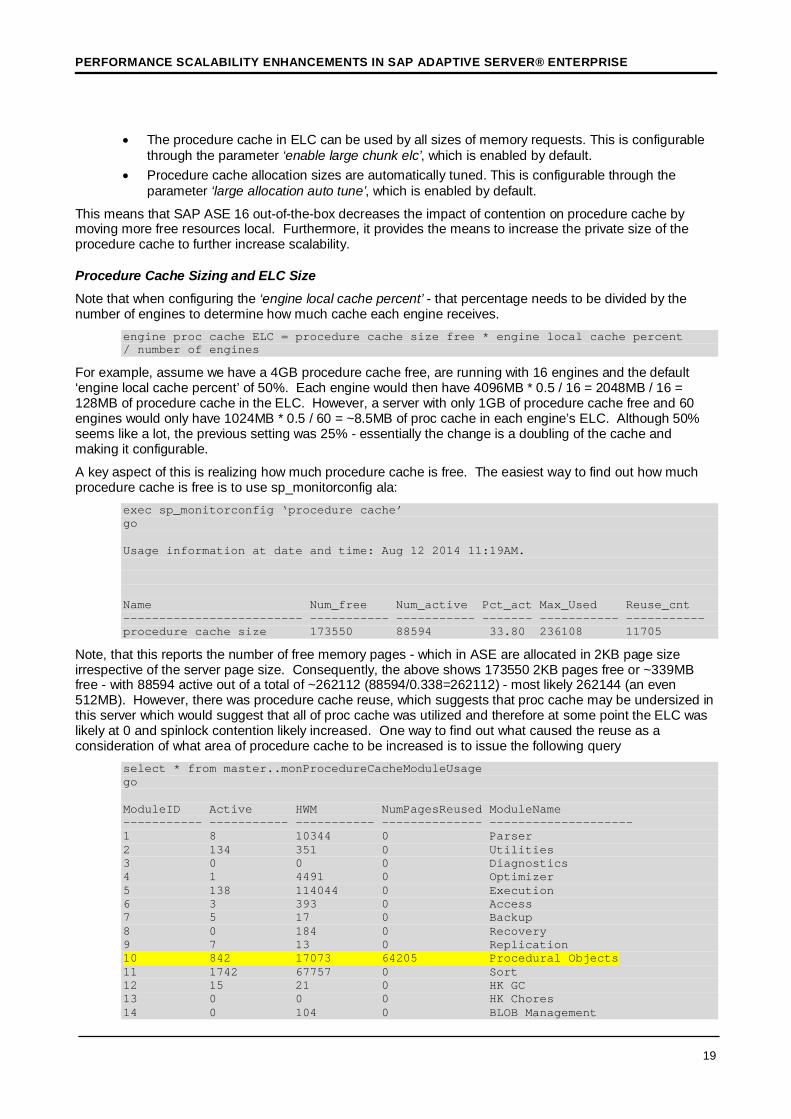
A key aspect of this is realizing how much procedure cache is free. The easiest way to find out how much procedure cache is free is to use sp_monitorconfig ala:
exec sp_monitorconfig ‘procedure cache’ go Usage information at date and time: Aug 12 2014 11:19AM. Name Num_free Num_active Pct_act Max_Used Reuse_cnt ------------------------- ----------- ----------- ------- ----------- ----------- procedure cache size 173550 88594 33.80 236108 11705
Note, that this reports the number of free memory pages - which in ASE are allocated in 2KB page size irrespective of the server page size. Consequently, the above shows 173550 2KB pages free or ~339MB free - with 88594 active out of a total of ~262112 (88594/0.338=262112) - most likely 262144 (an even 512MB). However, there was procedure cache reuse, which suggests that proc cache may be undersized in this server which would suggest that all of proc cache was utilized and therefore at some point the ELC was likely at 0 and spinlock contention likely increased. One way to find out what caused the reuse as a consideration of what area of procedure cache to be increased is to issue the following query
select * from master..monProcedureCacheModuleUsage go ModuleID Active HWM NumPagesReused ModuleName ----------- ----------- ----------- -------------- -------------------- 1 8 10344 0 Parser 2 134 351 0 Utilities 3 0 0 0 Diagnostics 4 1 4491 0 Optimizer 5 138 114044 0 Execution 6 3 393 0 Access 7 5 17 0 Backup 8 0 184 0 Recovery 9 7 13 0 Replication 10 842 17073 64205 Procedural Objects 11 1742 67757 0 Sort 12 15 21 0 HK GC 13 0 0 0 HK Chores 14 0 104 0 BLOB Management
19

PERFORMANCE SCALABILITY ENHANCEMENTS IN SAP ADAPTIVE SERVER® ENTERPRISE
15 2377 2379 0 Partition Conditions 16 1 1 0 Pdes Local HashTab 17 5560 33492 126 Statement Cache 18 3 10 0 CIS 19 0 3 0 Frame Management 20 0 0 0 AuxBuf Management 21 0 0 0 Network 22 2724 2724 0 Procmem Control 23 2249 2249 0 Data change 24 31104 166221 748221 Dynamic SQL 25 0 0 0 Cluster Threshold 26 2 2 0 Multiple Temporary 27 0 0 0 Workload Manager 28 0 0 0 Transaction 29 0 0 0 Cluster Membership Service (29 rows)Execution time: 0.029 seconds
From this we can see that the statement cache is likely slightly undersized and either the number of concurrent executions of the statements is fairly high - or applications are using a lot of fully prepared statements as the ‘Dynamic SQL’ has the highest incidence of reuse. One way to be sure to fit all the requirements would be to take the sum() of the HWM value ala:
select sum(HWM) as 'HWM sum', max(NumPagesReused) as 'max Reused' from master..monProcedureCacheModuleUsage go HWM sum max Reused ----------- ----------- 421873 748221
In order to provide some free pages to be used for the ELC, we would likely want to configure the procedure cache size to be an even 1GB or 524288 pages. Using our HWM as an upper bounds, this would leave ~100000 pages free to be distributed for ELC usage. One aspect to consider is that both the Parser and Query Optimization use a total of ~15000 pages on this system. While this represents concurrent usage, if sizing based off of worst case, we could assume that this was due to a single query needing that much procedure cache for optimization. To reduce the likelihood that query parsing and optimization would impact the global pool, it suggests that the number of free pages should be at least that many per engine. So, 100000 free pages would provide enough ELC for ~6 engines on the above system. If the system was configured for 12 engines, we might need to increase procedure cache further to accommodate it - or we could simply configure and monitor for both the spinlock contention, cache consumption and reuse.
In addition, it might be helpful to analyze whether the turnover in Dynamic SQL is due to high concurrency on specific statements or whether it is simply due to a large number of prepared statements that have been created by applications but not dropped. Some applications, such as SAP’s Business Suite, maintain a configurable cache of the number of fully prepared statements that any single connection or application server instance can have at any point of time. Reducing this configuration value may also decrease the procedure cache demands and minimizing the exhaustion of free pages and ELC.
It is also useful to keep in mind that for query optimization, the amount of resources any query could use is limited by the configuration value ‘max resource granularity’, which by default is set to 10%. This limits the amount of memory that the optimizer can use from proc cache - which in the above example is actually fairly low (<5000 pages). If instead of Dynamic SQL being the large consumer, if the query optimizer was the largest consumer, one option might be to reduce the ‘max resource granularity’ to reduce overall procedure cache consumption during query optimization, which in turn would reduce the likelihood of exhausting the local ELC and global pool allocations.
ELC & Large Chunk Allocations The configuration ‘enable large chunk elc’ is used to allow applications to allocate large chunks of procedure cache at a time vs. using small 2KB chunks. From our earlier discussion, remember that some proc cache allocations might only need a 2KB allocation - e.g. cursor control memory or prepared statements. Other queries that involve sorts or subquery caching, etc. could use larger allocations depending upon the amount
20

PERFORMANCE SCALABILITY ENHANCEMENTS IN SAP ADAPTIVE SERVER® ENTERPRISE
of data involved. As mentioned, using larger allocations in those cases reduced the number of spinlock grabs and therefore improved concurrency. Since this is coming from the ELC itself, in this case it doesn’t decrease contention on spinlocks - but it does improve the efficiency of queries that use large amount of proc cache by reducing the number of allocations.
The ‘large allocation auto tune’ configuration parameter also should be explained. In this case, we are not referring to the ELC, but rather the global procedure cache pool. When a query begins execution, the amount of proc cache needed for sorts, or subquery cache are not known. As a result, ASE begins by using small allocations of 2KB chunks. As the amount of data being sorted or more rows are materialized from the subquery, ASE automatically starts increasing the allocations to larger 16KB chunks. This differs from previous releases in which certain procedure cache allocations always used small allocations, while others always tried larger allocations (and sometimes wasted space leading to procedure cache fragmentation). By using larger chunks, this can reduce the procedure cache spinlock contention as it reduces the number of times the cache spinlock is grabbed.
21
PERFORMANCE SCALABILITY ENHANCEMENTS IN SAP ADAPTIVE SERVER® ENTERPRISE
LOCK MANAGER One example of a code path that is very frequently traversed is logical locking. As part of reading the content of an index or data page, SAP ASE checks if there are locks held (making some assumptions on settings and configuration). So the lock manager is always in the limelight.
At the same time as the lock manager is a frequently traversed code path, it is also a key part of logical consistency and it has many features. Combining these seemingly conflicting requirements, clearly changes must be thoroughly worked through.
TABLE INTENT LOCK OPTIMIZATION As SAP ASE reads rows, it checks that the appropriate locks are requested or held. One such check is to ensure we maintain the intent lock at the table level. If you recall, ASE places either a shared intent lock or an exclusive intent lock at the table level for queries in order to protect concurrent users from attempts to escalate to exclusive table locks (for instance). For intent locks, we essentially have two choices:
• Acquire the intent lock at the beginning of the query and hold it for the entire query, or… • Acquire the intent lock at when needed and check to make sure it is there
While the former case might sound like the best choice in light of the problems, the problem with it is that in cases of subqueries or multiple table joins, the intent lock might be held a lot longer than necessary - resulting in contention with lock escalation.
In ASE, this was accomplished by checking prior to each lock being grabbed to see if the appropriate intent lock was held - and if not, acquiring the appropriate intent lock on the table. However, this means we check the table lock hashtable for every row, which leads to contention on the table lock hashtable during very high workloads. Since the code is traversed so frequently there are a few special cases implemented for the most frequent use cases. Optimizing for some special cases introduced minimal amount of instructions while removing a fair share of superfluous double-checks for intent locks.
ELC TRANSFER OPTIMIZATION Most are familiar with the concept of the lock hash chains and lock hash spinlock ratios and the configurations with respect to keeping the lock hash chains short to speed lock search times. But these structures guard existing locks. There also is a global pool of free locks. While the search path for existing locks can use CPU due to comparisons, the contention on gathering spinlocks on the global free lock list to get a new lock structure can also have a significant performance impact.
As with procedure cache, ASE always had free lock list in the Engine Local Cache in an attempt to reduce the contention on the global pool. In ASE pre-16.0, the number of locks that was divided among the engines was set at 10% of the total number of free locks.
-- ASE pre-16.0 free lock list ELC = number of free locks * 0.1 / number of engines
So, with a typical setting for custom applications of 500,000 locks and assuming 20 engines, the net result would be 500000 * 0.1 / 20 = 50000 / 20 = 2500 - assuming all the locks were free. Now, consider the typical batch process the runs at night that performs data archiving and commits in batches of 10000. In order to simply process this one query, the engine would have to go to the global lock pool a large number of times. And as is common with such processing, often there are concurrent processes doing similar actions on other tables or within the same table but on a different range of rows.
In the above example, it might appear as if the engine would only need to go to the global pool 4 times - as in a total of 10000 locks and a lock pool of 2500 - but it isn’t that simple. First, the engine doesn’t know the final number of rows that will be locked. Secondly, the total number of locks might not be available in one large chunk - or at least until other engines return locks to the global pool. Consequently, as the engines need additional locks, the locks are transferred in blocks. When the query completes, the free locks greater than the ELC size would be transferred back to the global pool.
22

PERFORMANCE SCALABILITY ENHANCEMENTS IN SAP ADAPTIVE SERVER® ENTERPRISE
Analyzing transfers between an engine’s ELC and other engines or the global pool lead to optimized transfer of locks: firstly how locks are grabbed from other engines or the global pool (for instance a transaction has consumed much more than was in the ELC), and secondly locks are retained or returned. In addition, the number of locks that are divided among the engines’ ELCs was increased to 50% instead of the previously 10%. As a result, the new free lock list ELC size is computed by:
-- ASE 16.0 free lock list ELC = number of locks * 0.5 / number of engines
Using our earlier example of 500,000 locks and 20 engines, the net result would be 500000 * 0.5 / 20 = 250000 / 20 = 12500 - more than enough to satisfy our 10000 row commit frequency of our batch jobs.
As with procedure cache, the free lock ELC can be monitored loosely by using sp_monitorconfig: sp_monitorconfig 'number of locks' go Usage information at date and time: Aug 12 2014 12:49PM. Name Num_free Num_active Pct_act Max_Used Reuse_cnt ------------------------- ----------- ----------- ------- ----------- ----------- number of locks 982390 17610 1.76 148815 0
Once again, we consider the number of free locks and the average transaction size. If the average transaction size during batch operations is 10000 rows as mentioned earlier, and we have 12 engines, then we would like to see at least 120000 locks free
The improved transfers of locks are coupled with an increase in the number of locks that are divided among the engines’ ELCs provide better performance and scalability by:
• Causing fewer stalls due to low number of locks in ELCs. • Causing fewer stalls due to slow transfers of locks to ELCs. • Causing less spinlock contention by more efficient transfers of locks to ELCs. • Improving performance by a faster code path.
OTHER LOCKING OPTIMIZATIONS Outside of these scalability features, SAP ASE 16 also improves deadlock checking, lock promotion performance and lock verification. Lock promotion now adapts frequency of lock promotion requests given the past success and lock verification now bypasses a few special cases where checks are not needed, thus decreasing contention and improving performance.
23

PERFORMANCE SCALABILITY ENHANCEMENTS IN SAP ADAPTIVE SERVER® ENTERPRISE
META-DATA MANAGEMENT Meta-data is data about data. In the case of an RDBMS we most closely associate this to system tables. This can lead to spinlock and other scalability issues at a number of levels including:
• Increased cache contention as system tables are loaded into default (or other named) data cache for meta-data not retained in the descriptors.
• Increased spinlock contention on object descriptors for meta-data maintenance
ASE 16 improved meta-data management by improving management of descriptors as well as increasing the amount of system table data in the meta-data cache and descriptor handling
META-DATA DESCRIPTORS At the same time there need to be more meta-data, and this is kept in structures like GAM, OAM and various descriptors. These descriptors are in memory, instantiated from system tables and other on-disk structures. The descriptors thus serve dual duty, partly to manage meta-data, partly to cache data in memory and thus provide a shorter and more efficient codepath. Example descriptors are object descriptors (DES), index descriptors (IDES) and partition descriptors (PDES). Note that all tables and indexes have PDES since all allocated space belongs to a partition and all tables and indexes have at least one partition. In addition, LOB-columns such as text, image or java, have IDES as the text chain is allocated using an index ID of 255 - even if the all the LOB column values fit in-row as the there is nothing to limit the LOB column from expanding to an off-row sized value.
In-memory structures are, of course, shared resources and must thus be protected. Different mechanisms are used for different structures: address locks, spinlocks and latches.
Combining high transaction rates with very large number of partitions can lead to contention on IDES and PDES due to how SAP ASE searched these. The code around this is now optimized to include this use case, with the bucket-level spinlocks protecting the hashtable, and to cache index partition IDs for both LOB columns and for the first 12 indexes. This latter improvement reduces the need to access the sysindexes and syspartitions tables during query parsing and compilation when object names need resolved to the corresponding IDs.
CACHING SYSTYPES AND SYSDATABASES IN META-DATA Temporary tables provide a mechanism to build operations step by step in SQL. But with XOLTP-level transaction rates even creating temporary tables can cause contention in unexpected places. At create table-time SAP ASE looks up datatypes in the system table systypes. With extreme rates of table creation these look-ups can cause logical lock contention, latch contention and even spinlock contention on the data cache that holds systypes. With version 16, SAP ASE caches most of the system datatypes in in-memory structures thus bypassing system table look-ups and the potential contention that can follow at extreme rates, further improving scalability for these workloads.
Another scenario is cross-database operations of various kinds. One scenario is where SAP ASE looks up database meta-data in the system table sysdatabases to id-to-name (and vice versa) inquiries as well as questions like “is this a temporary database?” “a proxy database?”. By caching this meta-data in the in-memory structures scalability improves in the same manner as described above for creating temporary tables. However, even caching meta-data can prove insufficient! Sessions get the database time stamp (DBTS) from the same in-memory meta-data structure. And with extreme transaction rates the contention can start hurt scalability. But since different pieces of data is accessed for different purposes, they can be protected by separate physical locks allowing concurrent access to the same structure, but not to the same fields. Improved concurrency means improved scalability, in this case for complex applications with cross-database transactions and queries.
24

PERFORMANCE SCALABILITY ENHANCEMENTS IN SAP ADAPTIVE SERVER® ENTERPRISE
DATA ACCESS3 This is another case that with XOLTP-level transaction rates even a single page can become a bottleneck, in this case an index root page. When SAP ASE traverses an index, it starts with its root page. Index pages are not locked with logical locks, to avoid this overhead, but physical locks are still needed to ensure the physical consistency. The data cache spinlock is used while a session updates an in-memory structure (the buffer header) to indicate the page is in used.
When access rates are extreme, the request rate causes contention on the cache spinlock, thus limiting scalability and consuming excessive CPU. The strategy adopted here is to use a lockfree mechanism instead of the cache spinlock. Now there is a flag (counter) in the buffer header that shows the index root is being traversed, and this counter is incremented using the atomic instruction Compare-And-Swap (CAS). This instruction is guaranteed to be atomic and allows for vastly increased concurrency, and thereby scalability.
3 Note that this feature is, at the time of writing, expected to be available starting with SP01 and will require configuration.
25
PERFORMANCE SCALABILITY ENHANCEMENTS IN SAP ADAPTIVE SERVER® ENTERPRISE
SCALING REAL-WORLD APPLICATIONS WITH SAP ASE 16 SAP ASE 16 brings many new features, some of them rather advanced. So what does this mean?
Well, firstly, almost everything delivered for scalability in SAP ASE 16 is either invisible or enabled by default. Version 16 will scale further out of the box. This is in accordance to the unsurpassably low Total Cost of Ownership (TCO) the RDBMS has offered throughout its history.
Secondly, the changes are for real-world complex applications, be that cross-database queries or transactions, or complex transactions that create numerous temporary tables.
Lastly, the features take SAP ASE’s capacity for eXtreme OLTP (XOLTP) even further, improving both latencies and scalability.
26

© 2014 SAP SE. All rights reserved.
SAP, R/3, SAP NetWeaver, Duet, PartnerEdge, ByDesign, SAPBusinessObjects Explorer, StreamWork, SAP HANA, and other SAPproducts and services mentioned herein as well as their respectivelogos are trademarks or registered trademarks of SAP SE in Germanyand other countries.
Business Objects and the Business Objects logo, BusinessObjects,Crystal Reports, Crystal Decisions, Web Intelligence, Xcelsius, andother Business Objects products and services mentioned herein aswell as their respective logos are trademarks or registered trademarksof Business Objects Software Ltd. Business Objects is an SAPcompany.
Sybase and Adaptive Server, iAnywhere, Sybase 365, SQLAnywhere, and other Sybase products and services mentioned hereinas well as their respective logos are trademarks or registeredtrademarks of Sybase Inc. Sybase is an SAP company.
Crossgate, m@gic EDDY, B2B 360°, and B2B 360° Services areregistered trademarks of Crossgate AG in Germany and othercountries. Crossgate is an SAP company.
All other product and service names mentioned are the trademarks oftheir respective companies. Data contained in this document servesinformational purposes only. National product specifications may vary.
These materials are subject to change without notice. These materialsare provided by SAP SE and its affiliated companies ("SAP Group")for informational purposes only, without representation or warranty ofany kind, and SAP Group shall not be liable for errors or omissionswith respect to the materials. The only warranties for SAP Groupproducts and services are those that are set forth in the expresswarranty statements accompanying such products and services, ifany. Nothing herein should be construed as constituting an additionalwarranty.
www.sap.com