performance review of commodity
TRANSCRIPT
Performance Review of Commodity TURMERIC 1. Background
a. Brief about the commodity such as sample picture, lifecycle and various varieties/grade of
the commodity found in India
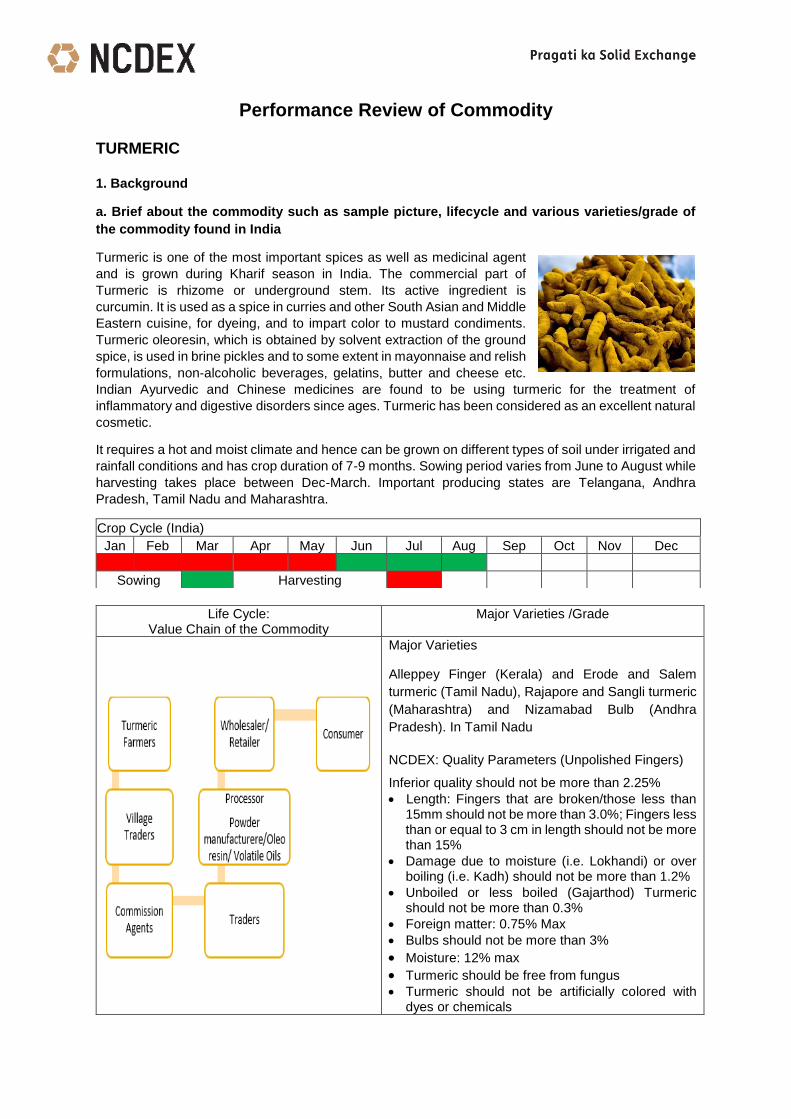
Turmeric is one of the most important spices as well as medicinal agent
and is grown during Kharif season in India. The commercial part of
Turmeric is rhizome or underground stem. Its active ingredient is
curcumin. It is used as a spice in curries and other South Asian and Middle
Eastern cuisine, for dyeing, and to impart color to mustard condiments.
Turmeric oleoresin, which is obtained by solvent extraction of the ground
spice, is used in brine pickles and to some extent in mayonnaise and relish
formulations, non-alcoholic beverages, gelatins, butter and cheese etc.
Indian Ayurvedic and Chinese medicines are found to be using turmeric for the treatment of
inflammatory and digestive disorders since ages. Turmeric has been considered as an excellent natural
cosmetic.
It requires a hot and moist climate and hence can be grown on different types of soil under irrigated and
rainfall conditions and has crop duration of 7-9 months. Sowing period varies from June to August while
harvesting takes place between Dec-March. Important producing states are Telangana, Andhra
Pradesh, Tamil Nadu and Maharashtra.
Life Cycle: Value Chain of the Commodity
Major Varieties /Grade
Major Varieties
Alleppey Finger (Kerala) and Erode and Salem
turmeric (Tamil Nadu), Rajapore and Sangli turmeric
(Maharashtra) and Nizamabad Bulb (Andhra
Pradesh). In Tamil Nadu
NCDEX: Quality Parameters (Unpolished Fingers)
Inferior quality should not be more than 2.25%
Length: Fingers that are broken/those less than 15mm should not be more than 3.0%; Fingers less than or equal to 3 cm in length should not be more than 15%
Damage due to moisture (i.e. Lokhandi) or over boiling (i.e. Kadh) should not be more than 1.2%
Unboiled or less boiled (Gajarthod) Turmeric should not be more than 0.3%
Foreign matter: 0.75% Max
Bulbs should not be more than 3%
Moisture: 12% max
Turmeric should be free from fungus Turmeric should not be artificially colored with
dyes or chemicals
Crop Cycle (India)
Jan Feb Mar Apr May Jun Jul Aug Sep Oct Nov Dec
Sowing Harvesting

Table: Reference Years for Commodities
Sl. No. A B C
Season Kharif Kharif (Long Duration crop)
Rabi
Crops Paddy, Maize, Bajra, Moong, Soybean, Guar, Kapas, Sesame Seed
Castor and Turmeric Wheat, Barley, Chana, RM Seed, Coriander, Jeera
Relevant Processed commodities
Guargum, Soybean meal, Soy oil, Cotton, Cotton seed Oil cake, Gur, CPO
- -
With Reference to Production Year (PY) 2019-20 (July to June)
Marketing Year (MY) Oct 2019 to Sep 2020 Jan/Feb 2020 to Dec/Jan 2020/21
Mar/Apr 2020 to Feb/Mar 2021
Financial Year (FY) April 2019 - March 2020 April 2020 - March 2021 Apr 2020 to Mar 2021
Calendar Year (CY) Jan 2019 to Dec 2019 Jan 2020 to Dec 2020 Jan 2020 to Dec 2020
Relationship b/w Reference Years
Production Year = Marketing Year = Financial Year = Calendar Year
Production Year is previous year. Marketing Year = Financial Year = Calendar Year
Production Year is previous year. Marketing Year = Financial Year = Calendar Year
Example PY 2019-20=MY2019-20=FY2019-20=CY2019
PY 2019-20 MY2020-21=FY2020-21=CY2020
PY 2019-20 MY2020-21=FY2020-21=CY2020
Explanatory Notes:
India is a vast country and various crops are sown and harvested at different point of time. However,
two major crop seasons, are there i.e. Kharif & Rabi. Apart from it, Zaid/Summer season is also
there.
Crop seasons are classified based upon sowing time. Normally Kharif season sowing starts from
mid-June/July and new crop arrivals begin from Oct/Nov. However, early/late sowing/harvesting
also takes place. Rabi season sowing usually takes places mainly from October/November and
harvesting starts from March/April. Early/late sowing/harvesting also takes place.
Summer crops/Zaid crops are short duration crops mainly sown during January-March and
harvested during April-June.
Production Year is considered as July to June and it remains same for all crops.
Marketing Year starts from beginning of the new crop arrivals. Thus, for Kharif crops Marketing
Year is generally considered as October to September, while for Rabi crops Marketing Year is April
to March. However, Marketing Year may vary slightly for some of the crops depending upon
early/late maturity/harvesting.
For processed commodities, their production starts after the start of new season crop arrivals of
their underlying crop.
b. Commodity fundamentals and balance sheet as per the following format (to be prepared
based on publicly available information on best effort basis):
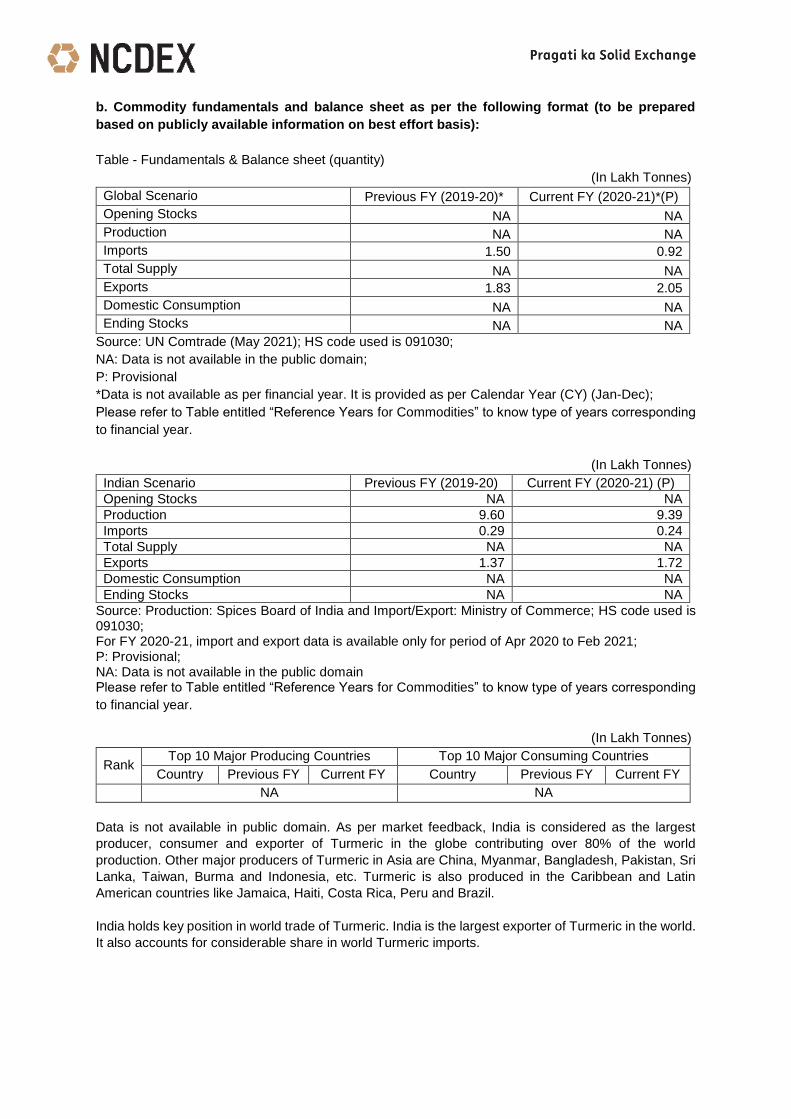
Table - Fundamentals & Balance sheet (quantity)
(In Lakh Tonnes)
Global Scenario Previous FY (2019-20)* Current FY (2020-21)*(P)
Opening Stocks NA NA
Production NA NA
Imports 1.50 0.92
Total Supply NA NA
Exports 1.83 2.05
Domestic Consumption NA NA
Ending Stocks NA NA
Source: UN Comtrade (May 2021); HS code used is 091030;
NA: Data is not available in the public domain;
P: Provisional
*Data is not available as per financial year. It is provided as per Calendar Year (CY) (Jan-Dec);
Please refer to Table entitled “Reference Years for Commodities” to know type of years corresponding
to financial year.
(In Lakh Tonnes)
Indian Scenario Previous FY (2019-20) Current FY (2020-21) (P)
Opening Stocks NA NA
Production 9.60 9.39
Imports 0.29 0.24
Total Supply NA NA
Exports 1.37 1.72
Domestic Consumption NA NA
Ending Stocks NA NA
Source: Production: Spices Board of India and Import/Export: Ministry of Commerce; HS code used is 091030; For FY 2020-21, import and export data is available only for period of Apr 2020 to Feb 2021; P: Provisional; NA: Data is not available in the public domain Please refer to Table entitled “Reference Years for Commodities” to know type of years corresponding
to financial year.
(In Lakh Tonnes)
Rank Top 10 Major Producing Countries Top 10 Major Consuming Countries
Country Previous FY Current FY Country Previous FY Current FY
NA NA
Data is not available in public domain. As per market feedback, India is considered as the largest
producer, consumer and exporter of Turmeric in the globe contributing over 80% of the world
production. Other major producers of Turmeric in Asia are China, Myanmar, Bangladesh, Pakistan, Sri
Lanka, Taiwan, Burma and Indonesia, etc. Turmeric is also produced in the Caribbean and Latin
American countries like Jamaica, Haiti, Costa Rica, Peru and Brazil.
India holds key position in world trade of Turmeric. India is the largest exporter of Turmeric in the world.
It also accounts for considerable share in world Turmeric imports.

(In Lakh Tonnes)
Rank
Top 10 Major Exporting Countries Top 10 Major Importing Countries
Country Previous
FY(2019-20)* Current FY
(2020-21)*(P) Country
Previous FY(2019-20)*
Current FY(2020-21)*
(P)
1 India 1.31 1.78 India 0.28 0.25
2 Myanmar 0.23 0.17 USA 0.10 0.13
3 Netherlands 0.03 0.03 UK 0.09 0.10
4 Germany 0.01 0.01 China 0.15 0.09
5 China 0.01 0.01 Netherlands 0.04 0.06
6 Spain 0.01 0.01 Germany 0.05 0.06
7 UK 0.01 0.01 Japan 0.05 0.05
8 USA 0.01 0.01 South Africa 0.03 0.03
9 Belgium 0.00 0.00 Spain 0.02 0.02
10 Pakistan 0.00 0.00 Canada 0.01 0.02
Others 0.22 0.01 Others 0.68 0.11
World total 1.83 2.05 World total 1.50 0.92
Source: UN Comtrade (May 2021); HS code used is 091030; P: Provisional; *Data is not available as per financial year. It is provided as per Calendar Year (CY) (Jan-Dec);
Countries are arranged in descending order based on the data in the Current Year; Please refer to Table entitled “Reference Years for Commodities” to know type of years corresponding
to financial year.
(In Lakh Tonnes)
Top 10 Major producing states in India
Rank States Previous FY (2019-20) Current FY (2020-21) (P)
1 Telangana 3.45 3.12
2 Karnataka 1.54 1.50
3 Tamil Nadu 0.80 0.90
4 Andhra Pradesh 0.86 0.80
5 West Bengal 0.45 0.45
6 Orissa 0.44 0.44
7 Maharashtra 0.38 0.40
8 Mizoram 0.30 0.30
9 Assam 0.19 0.23
10 Gujarat 0.17 0.16
Others 1.01 1.09
All India 9.60 9.39
Source: Spices Board of India; P: Provisional; States are arranged in descending order based on the data in the Current Year; Please refer to Table entitled “Reference Years for Commodities” to know type of years corresponding to financial year. c. Major changes in the polices governing trade in the spot markets of the commodity (FY 2020-
21)
Date Major Policies Governing Trade and related Changes
14-Apr-20 The nation-wide lockdown amid outbreak of COVID-19 was extended till May 03,
2020
15-Apr-20 Despite the extension of lockdown, restrictions on certain agriculture related activities
were eased effective from Apr 20, 2020.
17-May-20 The nation-wide lockdown amid outbreak of COVID-19 was extended till May 31,
2020
05-Jun-20 Approval to three ordinances--amendment to the Essential Commodities Act, and two
central laws on inter-state trade of farm produce, and contract farming

Date Major Policies Governing Trade and related Changes
28-Sep-20
The three farm bills that were passed in the Parliament during Sep 15 to 22, 2020
received Presidential Assent amid nationwide farmers’ protest, thus thus converting
them into Laws.
01-Oct-20 The State Govt. of Andhra Pradesh fixed MSP for Turmeric at Rs 6850/Qtl for MY
2020-21.
13-Oct-20
FSSAI has notified the Food Safety and Standards (Food Products Standards and
Food Additives) Eighth Amendment Regulations, 2020, related to microbiological
requirements for spices and herbs. Food Business Operators shall comply with all the
provisions of these regulations by July 1, 2021, says the notification.
29-Dec-20
FSSAI asked state food commissioners to conduct effective enforcement drive to check
adulteration in spices in wholesale markets/mandis under their jurisdictions in the wake
of media reports about sale of adulterated spices in the domestic market. As per one
such report, the spices like turmeric powder is being adulterated with broken rice which
is mixed with yellow colour.
11-Jan-21
The Supreme Court stayed the implementation of the three Farm Acts 2020 and
constituted a four-member committee to make recommendations on the same. The
panel was given two months’ time to submit its report for a 'fair, equitable and just
solution'.
Mar-21 Various states Govt. imposed local lockdown during the month of March 2021 amid
second wave of Covid, led to closure of physical markets.
d. Geo political issues in the commodity and its impact on Indian scenario (FY 2020-21)
There were no major Geo political issues which has any significant impact on market sentiments for Turmeric in India during the FY 2020-21.

2. Trading Parameters
a. Monthly and Annual traded volume (quantity in appropriate units)
Monthly Traded Volume
Month Traded volume (MT)
Apr-20 32,380
May-20 38,030
Jun-20 50,270
Jul-20 46,930
Aug-20 61,190
Sep-20 71,325
Oct-20 68,055
Nov-20 45,585
Dec-20 40,020
Jan-21 24,040
Feb-21 94,180
Mar-21 109,900
Yearly Traded Volume 681,905
b. Annual traded volume as proportion of total deliverable supply (quantity in appropriate
units)
Traded volume (MT) Deliverable supply( MT) Proportion
681,905 952,342 72.60%
c. Annual traded volume as proportion of total annual production (quantity in appropriate
units)
Traded volume (MT) Production( MT) Proportion
681,905 930,308 73.25%
d. Annual average Open interest as proportion of total production
Avg Open Int (MT) Production( MT) Proportion
8,896 930,908 0.96%
e. Annual average Open interest as proportion of total deliverable supply
Avg Open Int (MT) Deliverable supply ( MT) Proportion
8,896 952,342 0.93%
f. Monthly and Annual value of trade (in Rs. Crore)
Monthly Traded Value
Month Traded Value(in Cr.)
Apr-20 185
May-20 203
Jun-20 280
Jul-20 365
Aug-20 422
Sep-20 400
Oct-20 262
Nov-20 229

Dec-20 150
Jan-21 720
Feb-21 954
Yearly Value of Trade 4,438
g. Monthly and Annual quantity of delivery (in appropriate units)
Monthly Delivery Quantity
Month Total Delivery(MT)
Jun-20 10
Jul-20 40
Oct-20 40
Nov-20 140
Dec-20 110
Yearly Delivery Quantity 340
*Future contracts expiring in the month of January, February and March are not available.
h. Monthly and Annual value of delivery (in Rs. Crore)
Monthly Delivery Value
Month Value in Rs Cr
Jun-20 0
Jul-20 0
Oct-20 0
Nov-20 1
Dec-20 1
Yearly Delivery Quantity 2
i. Monthly and Annual Average Open Interest (OI) (in appropriate units)
Monthly Average OI
Month Avg Open Int (MT)
Apr-20 5,592
May-20 6,840
Jun-20 7,063
July-20 6,980
Aug-20 9,500
Sep-20 11,120
Oct-20 10,875
Nov-20 10,663
Dec-20 8,293
Jan-21 8,300
Feb-21 9,385
Mar-21 11,500
Yearly Average OI 8,896
j. Annual average volume to open interest ratio
Volume to OI Ratio
0.30

k. Total number of unique members and clients who have traded during the financial year
Member Count Client Count
173 2044
l. Ratio of open interest by FPOs/farmers/Hedge/VCP positions to total open interest (Annual average as well as maximum daily value)
VCPs/ Hedger
Annual Average 5.37%
Maximum Daily value 3.41% *It is calculated on the day when commodity has highest open interest during the year.
*Commodity wise client categorization is as per category details as provided by the members.
m. Number of unique FPOs / farmers and VCPs/hedgers who traded in the financial year
Commodity Count
TMCFGRNZM 31 *Commodity wise client categorization is as per category details as provided by the members.
n. Algorithmic trading as percentage of total trading
Commodity %
TMCFGRNZM 12.40%
o. Delivery defaults
Number of Instances 5
Quantity involved (MT) 405
Value Involved (Cr) 2.21

3. Price movements
a. Comparison, correlation and ratio of standard deviation of Exchange futures price vis-à-vis
international futures price (wherever relevant comparable are available).
NA
b. Comparison, correlation and ratio of standard deviation of Exchange futures price vis-à-vis
international spot price (wherever relevant comparable are available) and domestic spot price (exchange polled price). NA
c. Correlation between exchange futures & domestic spot prices along with ratio of standard
deviation.
d. Correlation between international futures & international spot prices along with ratio of
standard deviation (wherever relevant comparable are available). NA
e. Comparison of Exchange polled price and mandi price (in case of agricultural commodities) / other relevant price (in case non-agricultural commodities) at basis centre. Sufficient data points were not available for analysis
Futures Spot Futures Spot
Futures 1 Futures 1 0.525
Spot 0.521 1 Spot 1.906 1
Standard DeviationCorrelation
4,000
5,000
6,000
7,000
8,000
9,000
10,000
Apr-20 May-20 Jul-20 Aug-20 Oct-20 Dec-20 Jan-21 Mar-21
Pri
ce
in
Rs p
er
Quin
tal
Price Comparison
Futures Spot

f. Maximum & Minimum value of daily futures price volatility and spot price volatility along
with disclosure of methodology adopted for computing the volatility. (Volatility calculated by Standard Deviation of daily returns for the period from 1 April 2019 to 31 March 2020)
Volatility Futures Spot
Month Value Month Value
Max Mar 0.029 Feb 0.016
Min Nov 0.007 Nov 0.003
g. Number of times the futures contract was in backwardation/contango by more than 4% for the near month contract in the period under review
Contango 8
Backwardation 4
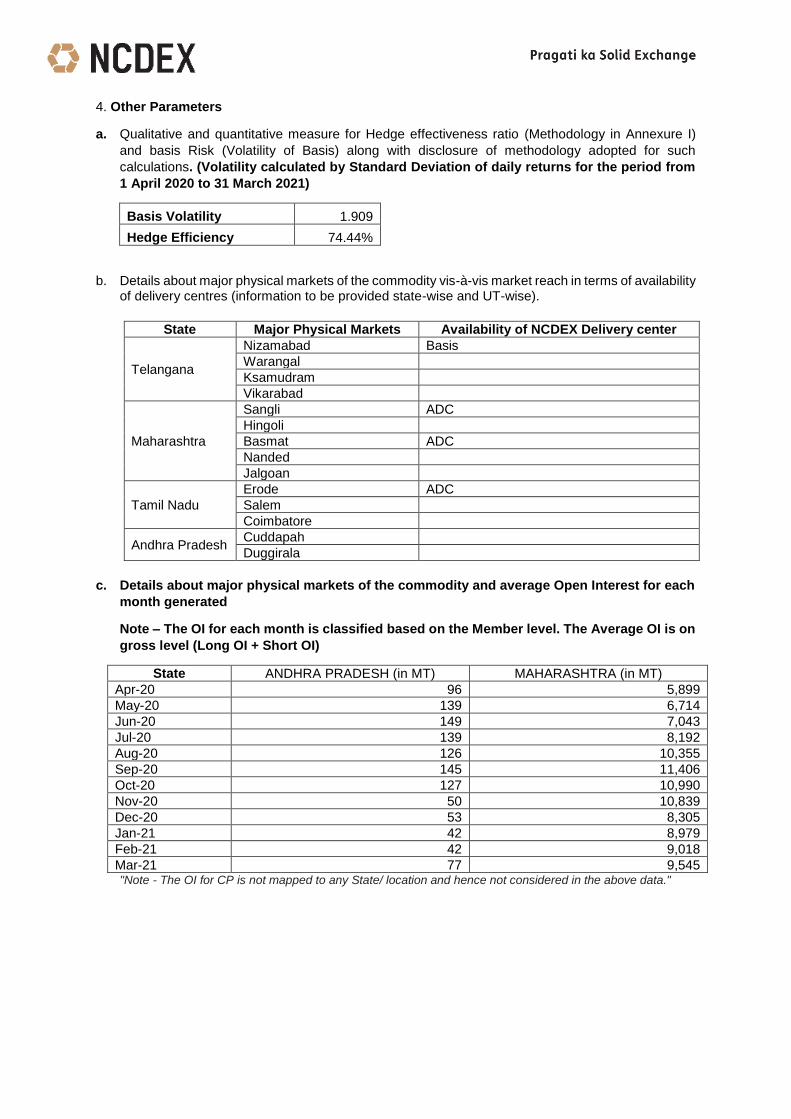
4. Other Parameters
a. Qualitative and quantitative measure for Hedge effectiveness ratio (Methodology in Annexure I)
and basis Risk (Volatility of Basis) along with disclosure of methodology adopted for such
calculations. (Volatility calculated by Standard Deviation of daily returns for the period from
1 April 2020 to 31 March 2021)
Basis Volatility 1.909
Hedge Efficiency 74.44%
b. Details about major physical markets of the commodity vis-à-vis market reach in terms of availability of delivery centres (information to be provided state-wise and UT-wise).
State Major Physical Markets Availability of NCDEX Delivery center
Telangana
Nizamabad Basis
Warangal
Ksamudram
Vikarabad
Maharashtra
Sangli ADC
Hingoli
Basmat ADC
Nanded
Jalgoan
Tamil Nadu
Erode ADC
Salem
Coimbatore
Andhra Pradesh Cuddapah
Duggirala
c. Details about major physical markets of the commodity and average Open Interest for each
month generated
Note – The OI for each month is classified based on the Member level. The Average OI is on
gross level (Long OI + Short OI)
State ANDHRA PRADESH (in MT) MAHARASHTRA (in MT)
Apr-20 96 5,899
May-20 139 6,714
Jun-20 149 7,043
Jul-20 139 8,192
Aug-20 126 10,355
Sep-20 145 11,406
Oct-20 127 10,990
Nov-20 50 10,839
Dec-20 53 8,305
Jan-21 42 8,979
Feb-21 42 9,018
Mar-21 77 9,545 "Note - The OI for CP is not mapped to any State/ location and hence not considered in the above data."
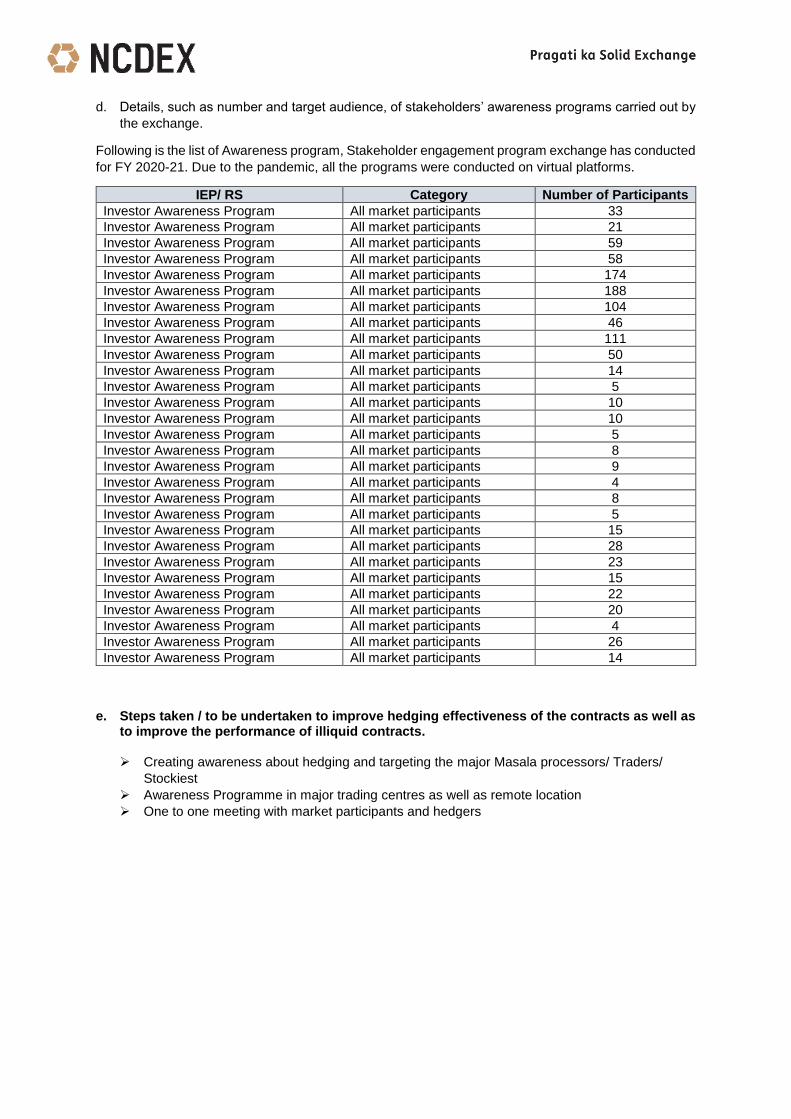
d. Details, such as number and target audience, of stakeholders’ awareness programs carried out by
the exchange.
Following is the list of Awareness program, Stakeholder engagement program exchange has conducted
for FY 2020-21. Due to the pandemic, all the programs were conducted on virtual platforms.
IEP/ RS Category Number of Participants
Investor Awareness Program All market participants 33
Investor Awareness Program All market participants 21
Investor Awareness Program All market participants 59
Investor Awareness Program All market participants 58
Investor Awareness Program All market participants 174
Investor Awareness Program All market participants 188
Investor Awareness Program All market participants 104
Investor Awareness Program All market participants 46
Investor Awareness Program All market participants 111
Investor Awareness Program All market participants 50
Investor Awareness Program All market participants 14
Investor Awareness Program All market participants 5
Investor Awareness Program All market participants 10
Investor Awareness Program All market participants 10
Investor Awareness Program All market participants 5
Investor Awareness Program All market participants 8
Investor Awareness Program All market participants 9
Investor Awareness Program All market participants 4
Investor Awareness Program All market participants 8
Investor Awareness Program All market participants 5
Investor Awareness Program All market participants 15
Investor Awareness Program All market participants 28
Investor Awareness Program All market participants 23
Investor Awareness Program All market participants 15
Investor Awareness Program All market participants 22
Investor Awareness Program All market participants 20
Investor Awareness Program All market participants 4
Investor Awareness Program All market participants 26
Investor Awareness Program All market participants 14
e. Steps taken / to be undertaken to improve hedging effectiveness of the contracts as well as
to improve the performance of illiquid contracts.
Creating awareness about hedging and targeting the major Masala processors/ Traders/
Stockiest
Awareness Programme in major trading centres as well as remote location
One to one meeting with market participants and hedgers

ANNEXURE I
Qualitative and quantitative measure for Hedge effectiveness ratio
Hedging Efficiency Methodology
Regression analysis is carried out between near month futures returns and NCDEX polled spot prices
returns of the FY2020-21.
The R-Square value of the Regression analysis represents the “Hedging Efficiency”.
Note: -
Date for which spot prices were not available is not used for analysis.
Weekly returns are used for performing Regression Analysis.
The method used to calculate Hedging Efficiency does not consider liquidity risk because of this
reason illiquid commodities can have high hedging efficiency.
References:
Ghosh, Ph.D, Nilanjan & Dey, Debojyoti & Moulvi, Nazir & Jain, Niteen & Sinha, Neha & Rachuri,
Sarika. (2013). Hedging Efficiency—Measures and Empirical Study.