performance report sat act dual credit college …...the 2017 advanced placement mean score was 2.89...
TRANSCRIPT

1
2017 Performance Report SATACT Dual Credit
Advanced Placement College Readiness

2
Report to the Conroe ISD Board of Trustees October 17, 2017
Board of Trustees
Melanie Bush President
Datren Williams First Vice President
Skeeter Hubert Second Vice President
Ray Sanders Secretary
Scott Kidd Assistant Secretary
John Husbands Immediate Past President
Scott Moore Trustee
CISD Central Administration
Don Stockton, Ed.D. Superintendent of Schools
Chris Hines, Ed.D. Deputy Superintendent of Operations
Curtis Null, Ed.D. Deputy Superintendent of Schools
James Kacur Assistant Superintendent for Secondary Education
Debbie Phillips, Ed.D. Assistant Superintendent for Elementary Education
Denise Cipolla Coordinator of Guidance and Counseling
Debbie McNeely Coordinator for Advanced Academic Programs
Tamika Taylor, Ed.D Coordinator of Assessment and Evaluation
Greg Shipp Coordinator of Career and Technology
Laura Willard College Readiness Specialist

3
Table of Contents
Report Highlights………………………………………………………………………………………………………….…………………..4
Description of College Entrance Exams………………………………………………………………………….………………….5
Recognizing Achievement…………………………………………………………………………………………………….……………7
SAT Mean Score Report……………………………………………………………………………….……………………………………9
SAT Report Trends – National and State 2006‐2017……………….……………………….………………………………11
CISD SAT Mean Scores – Spring 2017 Graduates – Demographic Report for District…….…..…………….17
ACT Report for Conroe ISD……………………………………..………………………………………………………………………33
ACT Report Trends – National and State 2006‐2017………………………………………………………………….……36
ACT Report Trends by Student Group……………………………………………………………………………………..………43
ACT Report Trends – CISD Campus Reports 2011‐2017………………………………………………………………..…49
CISD Advanced Placement Report…..……………………………………………………………………………………………..54
CISD Campus AP Reports…………….….………………………………………………………………………………………………62
CISD 2017 AP Exam Statistics………….………………………………………………………………………………………………67
2017 Current Campus Dual Credit Enrollment by Course……….………………………………………………………73
CISD Career and Technical Education Certifications……………………………………………………………………....77
CISD Graduate College Enrollment and Performance Report………………………………………………………….78
Post‐Secondary Plans……………………………………….……………………………………………………78
Colleges Attended by CISD Graduates……………….…………………………………………………..80
CISD Class of 2016 Freshman Performance………..………………………………………………….83
Colleges and Universities Attended by 2015 CISD Graduates………………………………………………………..86

4
Report Highlights
In 2017, CISD has 24 National Merit Semifinalists
2,308 seniors took the SAT and 1,793 seniors took the ACT. This is an increase in college entrance assessment participation.
In 2017, 4,544 students took 9,367 AP exams.
The 2017 Advanced Placement mean score was 2.89 compared to the Texas mean score of 2.51 and the national mean score of 2.84.
Currently, there are 1,981 CISD dual credit enrollments at Lone Star College the 2016‐2017 school year. Summer 2017, CISD had 1 dual credit students enrolled in CISD summer school program.
Based on information submitted by Lone Star College‐Montgomery, over 550 current CISD students have earned 12 or more college credits through the CISD dual credit and accelerated college programs.
CISD administered over 900 TSI assessments during the 2016‐2017 school year. In addition, Lone Star College‐Montgomery provided assistance with TSI testing for approximately 700 CISD dual credit potential students and 12th grade students through Senior Connections.
Targeted Areas for Improvement
Increase the number of students participating in the Accelerated College Program Increase African American and Hispanic student’s participation in AP classes and taking AP exams. Increase academic and workforce development dual credit participation. Increase the number of National Merit Semifinalists.
Hard Work High Expectations Meaningful Relationships
Developing a Sense of Future Creating Capacity Aligning our Beliefs We believe hard work and setting high expectations has a significant role in the success of our CISD students. In our efforts to develop a sense of future for our students, we believe that every CISD student will be academically prepared to enter any post‐secondary program with confidence and the ability to strive for success. By developing meaningful relationship among students and adults, CISD students are provided with a strong foundation for student achievement in post‐secondary programs. Under the leadership of our Board of Trustees and Superintendent, we are working to create the capacity within our organizations to continue to improve. We are working to align our action plans and operational procedures to support our district and campus goals as well as what we believe.
We have acknowledged that continuous improvement is a requirement in servicing the students. Therefore, we are committed to working hard to raise the level of academic rigor and success for all CISD students. This report attempts to capture the performance of high school programs as they relate to preparing students for college and post‐high school programs.

5
Description of College Entrance Exams
PSAT The PSAT (Preliminary SAT) is a test designed for high school juniors; in CISD all sophomores and juniors sit for the October exam, along with freshmen who self‐select to test. Students take the test to: (1) Assess their college‐readiness academic skills; (2) Prepare for the SAT; (3) Qualify for national scholarship considerations; and (4) Receive information from colleges through College Board College Search. For juniors, the PSAT becomes the qualifying exam for the National Merit Scholarship Program (NMSQT).
National Merit Semifinalists
The National Merit Scholarship Program is an academic competition for recognition and scholarships that began in 1955. High school juniors enter the competition by taking the Preliminary SAT/National Merit Scholarship Qualifying Test. Of the 1.6 million entrants among 11th grade students nationwide, some 50,000 with the highest PSAT/NMSQT Selection Index Scores (calculated by doubling the sum of the Reading, Writing, and Language Test Score and Math Test score) qualify for recognition in the National Merit Scholarship Program as either Commended students or Semifinalists. In September, about 16,000 students, roughly 1% of the entrants, or approximately one‐third of the 50,000 high scorers are identified as National Merit Semifinalists. Semifinalists are designated on a state representational basis, meaning that the highest scores for each state are represented. To advance to the Finalist standing in February, Semifinalists must apply, take the SAT, and meet high academic standards.
Number of National Merit Semifinalists by Campus
Campus 2013‐14 2014‐15 2015‐16 2016‐2017 2017‐2018
Caney Creek H.S. ‐ ‐ ‐ ‐ ‐
Conroe H.S. 1 ‐ 1 ‐ ‐
Hauke H.S. ‐ ‐ ‐ ‐ ‐
Oak Ridge H.S. ‐ 1 ‐ ‐ 1
The Woodlands H.S. 11 14 7 11 5
TW College Park H.S. 20 16 15 16 18
District Total 32 31 23 27 24
23
27
2018
32 31
23
2724
0
5
10
15
20
25
30
35
2009‐10 2010‐11 2011‐12 2012‐13 2013‐14 2014‐15 2015‐16 2016‐17 2017‐18
National Merit Semifinalists 2010‐2017

6
SAT The SAT is accepted by many colleges and universities as part of the admissions process. It is scored on a scale from 400-1600. SAT consists of two sections: Math and Evidence-Based Reading and Writing. Each section receives a score on the scale of 200–800. The total score is the sum of both sections. SAT offers an optional Essay section that is required by some universities for admissions.
SAT Subject Tests
SAT Subject Tests measure the students’ knowledge of concentrated academic subjects. Students may take up to three tests on a given test date There are 20 SAT Subject Tests in five general subject areas: English, history, languages, mathematics and science. These tests can be required or strongly recommended by highly selective colleges for academic placement and holistic admissions.
ACT The ACT is a curriculum-based examination that is accepted by most U.S. colleges and universities for admissions. The ACT consists of four sections: English, Reading, Mathematics, and Science. Each section is scored on the scale of 1-36, with a mean composite score in the same range. In addition to the required composite score, some colleges will use the individual subject scores for academic placement. An optional Essay section is also available on the ACT.
AP The Advanced Placement exams are administered each year in May and represent the culmination of college‐level work attained in a given course in a high school setting. AP exams test students’ ability to perform at a college level. The AP Program offers more than 30 courses across a wide variety of subject areas. The exams are scored on 1‐5 scale, and students who score a 3 or above are given credit at Texas public universities. Some students are able to begin college with sophomore standing. During the 2014‐2015 school year, the Texas Education Agency provided a test fee subsidy in the amount of $30 for each AP exam taken by students who qualify for the free and reduced lunch program significantly bringing the cost of the exam down. To support participation on exams all of our high school campuses subsidized the exam cost to some extent.
Texas Success Initiative (TSI) The Texas Success Initiative (TSI) is a state legislated program designed to improve student success by requiring all students attending public institutions of higher education to complete assessments in reading, writing and mathematics before enrolling in classes. Students scoring below placement standards are required to enroll in developmental courses which do not apply towards a degree or certificate. TSI exempt status is obtained if a student acquires a qualifying score on the PSAT, SAT or ACT exams. In 2013-2014, the TSI became a requirement for dual credit eligibility.

7
Recognizing Achievement Each September, the College Board recognizes the many high school students who have distinguished themselves academically by announcing AP award recipients. There are several types of awards granted for various levels of achievement. Although there is no monetary award in addition to receiving the award certificate, this achievement is acknowledged on any score report that is sent to colleges the following fall.
AP Scholar = Granted to students who receive grades of 3 or higher on three or more AP Exams.
AP Scholar with Honor = Granted to students who receive an average grade of at least 3.25 on all AP Exams taken, and grades of 3 or higher on four or more of these exams.
AP Scholar with Distinction = Granted to students who receive an average grade of at least 3.5 on all AP Exams taken, and grades of 3 or higher on five or more of these exams.
National AP Scholar = Granted to students in the United States who receive an average grade of at least 4 on all AP Exams taken, and grades of 4 or higher on eight or more of these exams.
State AP Scholar = Granted to the one male and one female student in each U.S. state and the District of Columbia with scores of 3 or higher on the greatest number of AP Exams, and then the highest average score (at least 3.5) on all AP Exams taken.
International AP Scholar = Granted to the one male and one female student attending a school outside the United States and Canada that is not a Do DEA school with the highest average score on the greatest number of AP Exams. The minimum requirement is a score of 3 or higher on three exams.
AP Scholar Awards Advanced Placement
Student Awards AP Scholar Scholar with Honor Scholar with Distinction
2013 2014 2015 2016 2017 2013 2014 2015 2016 2017 2013 2014 2015 2016 2017
Caney Creek 20 19 28 26 22 3 5 1 0 4 0 0 2 3 5
Conroe 37 53 46 53 53 3 5 5 11 4 12 14 16 13 15
Oak Ridge 59 66 83 108 114 10 14 26 30 35 17 20 18 24 35
College Park 97 102 129 129 137 47 53 50 56 61 149 159 164 182 199
The Woodlands 179 192 171 203 237 103 111 131 103 111 198 205 226 189 190
Conroe ISD 392 432 457 519 563 166 188 213 200 215 376 398 426 411 444
Advanced Placement
Student Awards National Scholar
State Scholar
International Scholar
2013 2014 2015 2016
2017 2013 2015
2016 2017
Caney Creek 0 0 0 0 0 0 0 0 0
Conroe 4 3 2 4 3 0 0 0 0
Oak Ridge 1 3 4 1 3 0 0 0 0
College Park 39 50 51 52 55 0 1 1 2
The Woodlands 38 44 51 38 30 1 1 0 1
Conroe ISD 82 100 108 95 91 1 2 1 3
8
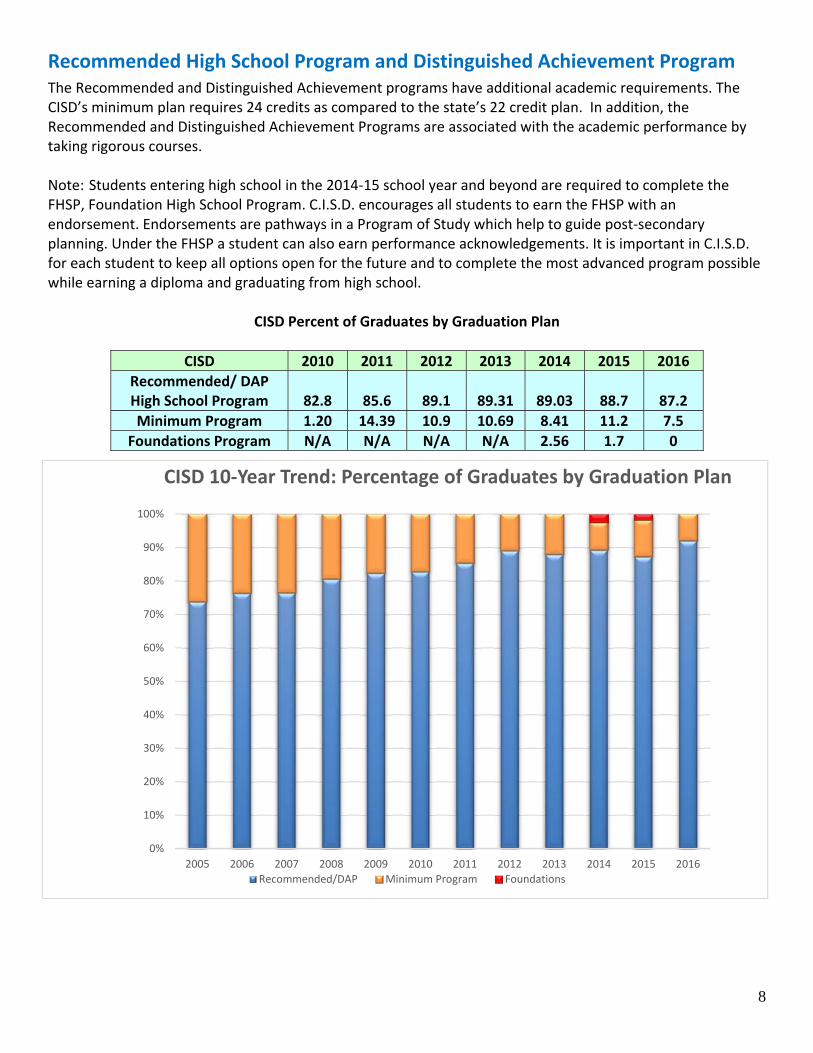
Recommended High School Program and Distinguished Achievement Program The Recommended and Distinguished Achievement programs have additional academic requirements. The CISD’s minimum plan requires 24 credits as compared to the state’s 22 credit plan. In addition, the Recommended and Distinguished Achievement Programs are associated with the academic performance by taking rigorous courses. Note: Students entering high school in the 2014‐15 school year and beyond are required to complete the FHSP, Foundation High School Program. C.I.S.D. encourages all students to earn the FHSP with an endorsement. Endorsements are pathways in a Program of Study which help to guide post‐secondary planning. Under the FHSP a student can also earn performance acknowledgements. It is important in C.I.S.D. for each student to keep all options open for the future and to complete the most advanced program possible while earning a diploma and graduating from high school.
CISD Percent of Graduates by Graduation Plan
CISD 2010 2011 2012 2013 2014 2015 2016
Recommended/ DAP High School Program 82.8 85.6 89.1 89.31 89.03 88.7 87.2
Minimum Program 1.20 14.39 10.9 10.69 8.41 11.2 7.5
Foundations Program N/A N/A N/A N/A 2.56 1.7 0
0%
10%
20%
30%
40%
50%
60%
70%
80%
90%
100%
2005 2006 2007 2008 2009 2010 2011 2012 2013 2014 2015 2016
CISD 10‐Year Trend: Percentage of Graduates by Graduation Plan
Recommended/DAP Minimum Program Foundations

9
SAT MEAN SCORES
Spring 2017 GraduatesStudent Number/
Subject National TexasConroe ISD
Caney Creek Conroe
Oak Ridge
TWCPHS TWHS
Student Number 1,715,481 204,409 2,308 150 295 502 502 854Evidence Based Reading
& Writing 533 513 573 509 516 551 599 603Math 527 507 569 499 503 538 601 604
Total 2 Tests Combined 1,060 1,019 1,143 1,008 1,019 1,088 1,200 1,207
533 527
1,060
513 507
1,019
573 569
1,143
0
200
400
600
800
1000
1200
1400
Evidence Based Reading +Writing (EBW)
Math 2 Test Combined
2017 SAT Performance
National Texas Conroe ISD

10
Spring 2016 Graduates Student Number/
Subject National TexasConroe ISD
Caney Creek Conroe
Oak Ridge
TWCPHS TWHS
Student Number 1,637,539 196,028 2,165 155 180 453 492 768Critical Reading 494 466 521 453 468 499 545 554
Math 508 478 535 424 437 508 534 536Writing 482 449 508 425 454 469 535 545
Combined Critical Reading and Math 1,002 934 1,056 877 905 1,007 1,079 1,090
Total 3 Tests 1,484 1,393 1,564 1,334 1,359 1,476 1,614 1,635
Spring 2015 Graduates Student Number/
Subject National TexasConroe ISD
Caney Creek Conroe
Oak Ridge
TWCPHS TWHS
Student Number 1,698,521 193,768 2,194 145 264 463 492 818Critical Reading 495 470 530 448 472 503 552 566
Math 511 486 545 461 486 514 570 583Writing 484 454 508 425 454 473 535 545
Combined Critical Reading and Math 1,006 956 1,075 909 958 1,017 1,122 1,149
Total 3 Tests 1,490 1,410 1,583 1,334 1,412 1,490 1,657 1,694
Spring 2014 Graduates Student Number/
Subject National TexasConroe ISD
Caney Creek Conroe
Oak Ridge
TWCPHS TWHS
Student Number 1,672,395 179,036 2,202 156 311 390 493 852Critical Reading 497 476 523 449 467 497 552 533
Math 513 496 541 471 478 511 570 574Writing 487 461 503 426 448 461 538 535
Combined Critical Reading and Math 1,010 972 1,064 920 945 1,108 1,122 1,127
Total 3 Tests 1,497 1,433 1,567 1,346 1,393 1,469 1,660 1,662
Spring 2013 Student Number/
Subject National TexasConroe ISD
Caney Creek Conroe
Oak Ridge
TWCPHS TWHS
Student Number 1,660,047 172,870 2,109 137 269 398 466 837Critical Reading 496 477 521 462 460 481 552 553
Math 514 499 540 485 480 497 566 574Writing 488 461 501 444 441 452 528 539
Combined Critical Reading and Math 1,010 976 1,061 947 940 978 1,118 1,127
Total 3 Tests 1,498 1,437 1,562 1,391 1,381 1,430 1,646 1,666

11
SAT Report Trends 2006‐2017
Conroe ISD Report Trend 2006‐2017
SAT
YEAR SENIORS TAKING SAT
VERBAL/CR (06) (MEAN SCORE)
MATH(MEAN SCORE)
TOTAL (MEAN SCORE)
2006‐2007 1652 533 551 1084
2007‐2008 1708 531 551 1082
2008‐2009 1515 528 556 1084
2009‐2010 1812 522 547 1069
2010‐2011 1959 521 548 1069
2011‐2012 2129 512 539 1051
2012‐2013 2109 521 540 1061
2013‐2014 2202 523 541 1064
2014‐2015 2129 530 545 1075
2015‐2016 2165 521 535 500
Redesigned Seniors EBRW Math Total
2016‐2017 2308 573 569 1143
SAT National Scores SAT State Scores
YEAR
VERBAL/CR (06)
(MEAN SCORE)
MATH (MEAN SCORE)
TOTAL (MEAN SCORE)
VERBAL/ CR (06) (MEAN SCORE)
MATH (MEAN SCORE)
TOTAL (MEAN SCORE)
2006‐2007 502 515 1017 492 507 999
2007‐2008 502 515 1017 488 505 993
2008‐2009 499 514 1013 484 504 988
2009‐2010 500 515 1015 483 504 987
2010‐2011 497 514 1011 479 502 981
2011‐2012 496 514 1010 474 499 973
2012‐2013 496 514 1010 477 499 976
2013‐2014 497 513 1010 476 495 971
2014‐2015 495 511 1006 470 454 924
2015‐2016 494 508 1002 466 478 944
Redesigned EBRW Math Total EBRW Math Total
2016‐2017 495 511 1070 470 486 1019

12
850
900
950
1000
1050
1100
1150
SAT Combined Critical Reading and Math Trend2007‐2017
ConroeISD
State
1447
16521708
1515
1812
1959
2129 21092202
2129 2165
2308
1000
1200
1400
1600
1800
2000
2200
2400
SAT Number of Students Tested Trend

13
SAT Writing Performance Trend
Writing Performance Trend
National
Texas Conroe ISD
Caney Creek HS
Conroe HS
Oak Ridge HS
TWCPHS TWHS
2012 488 461 498 429 454 459 523 534
2013 488 461 501 444 441 452 528 539
2014 487 461 503 426 448 461 538 535
2015 484 454 508 425 454 473 535 545
2016 482 449 500 424 439 469 534 536 Redesigned Evidence‐Based Writing + Reading
2017 533 513 573 509 516 551 599 603
488 488 487 484 482533
461 461 461 454 449513498 501 503 508 500
573
0
100
200
300
400
500
600
700
2012 2013 2014 2015 2016 2017
5‐Year SAT Writing Trend*2017 ‐ Redesigned Test
National Texas Conroe ISD
14
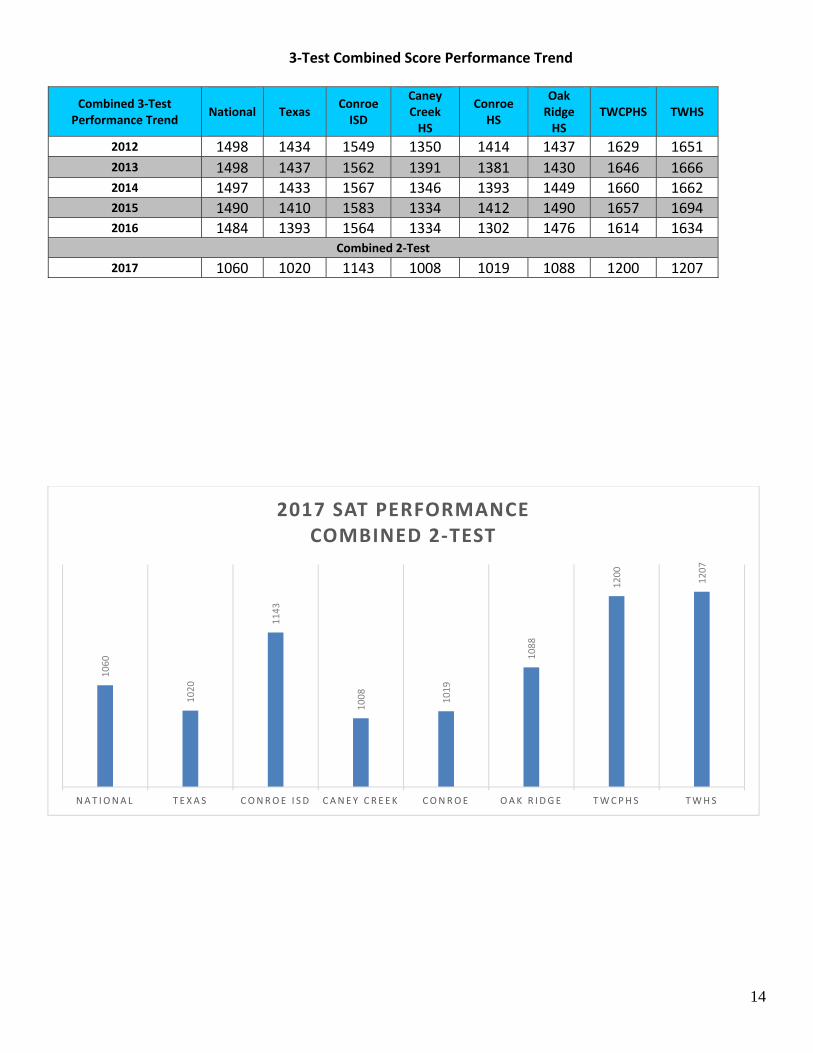
3‐Test Combined Score Performance Trend
Combined 3‐Test Performance Trend
National
Texas
Conroe ISD
Caney Creek HS
Conroe HS
Oak Ridge HS
TWCPHS TWHS
2012 1498 1434 1549 1350 1414 1437 1629 1651 2013 1498 1437 1562 1391 1381 1430 1646 1666 2014 1497 1433 1567 1346 1393 1449 1660 1662 2015 1490 1410 1583 1334 1412 1490 1657 1694 2016 1484 1393 1564 1334 1302 1476 1614 1634
Combined 2‐Test
2017 1060 1020 1143 1008 1019 1088 1200 1207
1060
1020
1143
1008
1019
1088
1200
1207
N A T IONA L T EXA S CONROE I S D CANEY CRE EK CONROE OAK R I DGE TWCPHS TWHS
2017 SAT PERFORMANCECOMBINED 2‐TEST

15
0
200
400
600
800
1000
1200
1400
1600
1800
National Texas Conroe ISD Caney Creek Conroe Oak Ridge TWCPHS TWHS
5‐Year Combined SAT Score Trend2013‐2016 ‐ 3‐Test Combined
2017 ‐ 2‐Test Combined
2013 2014 2015 2016 2017*
1498 1497 1490 1484
1070
1437 1433 1410 1393
1019
1562 1567 1583 1564
1143
2013 2014 2015 2016 2017*
5‐Year SAT Combined Test Trend2013‐2016: 3‐Test Combined*2017: 2‐Test Combined
National Texas Conroe ISD

16
SAT Campus Performance Data
CANEY CREEK HIGH SCHOOL
SAT Statistics
YEAR SENIORS
TAKING SAT PERCENTAGE OF SENIORS TESTED
VERBAL/CR
(MEAN SCORE)
MATH (MEAN SCORE)
TOTAL (MEAN SCORE)
2006‐2007 50 15% 503 551 1054
2007‐2008 65 20% 493 509 1002
2008‐2009 66 20% 467 500 967 2009‐2010 122 35% 445 486 931 2010‐2011 131 42% 463 500 963 2011‐2012 167 46% 442 479 921 2012‐2013 137 41% 462 485 947 2013‐2014 156 48% 449 471 920 2014‐2015 145 44% 448 461 909 2015‐2016 155 42% 453 424 877 Redesigned EBRW 2016‐2017 150 32% 509 499 1008
50
65 66
122131
167
137
156
145155
150
0
20
40
60
80
100
120
140
160
180
2006‐20072007‐20082008‐20092009‐20102010‐20112011‐20122012‐20132013‐20142014‐20152015‐20162016‐2017
CCHS SAT Test Taker Trend

17
CCHS SAT Writing Summary
YEAR WRITING (MEAN SCORE) 3‐TEST TOTAL
2008‐2009 442 1409
2009‐2010 430 1361
2010‐2011 442 1405
2011‐2012 429 1350
2012‐2013 444 1391
2013‐2014 426 1346
2014‐2015 425 1357
2015‐2016 424 1334
EBRW 2‐Test Total
2016‐2017 509 1008
1002967
931963
921947
920 909877
1008
2007‐2008 2008‐2009 2009‐2010 2010‐2011 2011‐2012 2012‐2013 2013‐2014 2014‐2015 2015‐2016 2016‐2017
CCHS SAT Score Trend
VERBAL/CR MATH (Mean Score) Total (Mean Score

18
CONROE HIGH SCHOOL SAT Statistics
YEAR SENIORS TAKING SAT
PERCENTAGE OF SENIORS TESTED
VERBAL (MEAN SCORE)
MATH (MEAN SCORE)
TOTAL (MEAN SCORE)
2006‐2007 228 44% 492 498 990
2007‐2008 210 38% 483 500 983
2008‐2009 223 35% 482 503 985
2009‐2010 291 42% 458 480 938
2010‐2011 283 44% 479 499 978
2011‐2012 300 44% 469 491 960
2012‐2013 269 39% 460 480 940
2013‐2014 311 48% 467 478 945
2014‐2015 264 38% 472 486 958
2015‐2016 180 39% 468 437 905
Redesigned EBRW
2016‐2017 295 30% 516 503 1019
210223
291 283300
269
311
264
180
295
100
150
200
250
300
350
CHS SAT Senior Test Taker Trend

19
CHS SAT Writing Summary YEAR WRITING (MEAN SCORE) 3 TEST TOTAL
2008‐2009 477 1462
2009‐2010 446 1384
2010‐2011 466 1444
2011‐2012 454 1414
2012‐2013 441 1381
2013‐2014 448 1393
2014‐2015 454 1412
2015‐2016 439 1359
EBRW 2 Test Total
2016‐2017 516 1019
983 985938
978 960 940 945 958905
1019
2007‐2008 2008‐2009 2009‐2010 2010‐2011 2011‐2012 2012‐2013 2013‐2014 2014‐2015 2015‐2016 2016‐2017
CHS SAT Score Trend
VERBAL (MEAN SCORE) MATH (MEAN SCORE) TOTAL (MEAN SCORE)

20
OAK RIDGE HIGH SCHOOL SAT Statistics
YEAR SENIORS TAKING SAT
PERCENTAGE OF SENIORS TESTED
VERBAL (MEAN SCORE)
MATH (MEAN SCORE)
TOTAL (MEAN SCORE)
2006‐2007 313 64% 525 557 1082
2007‐2008 276 55% 506 531 1037
2008‐2009 216 44% 494 519 1013
2009‐2010 301 51% 494 522 1066
2010‐2011 329 58% 485 511 996
2011‐2012 389 60% 479 499 978
2012‐2013 398 56% 481 497 978
2013‐2014 390 57% 497 611 1108
2014‐2015 463 62% 503 514 1017
2015‐2016 453 56% 499 508 1007
Redesigned EBRW
2016‐2017 502 50% 551 538 1088
313
276
216
301
329
389 398 390
463 453
502
200
250
300
350
400
450
500
550
ORHS SAT Senior Test Taker Trend
21
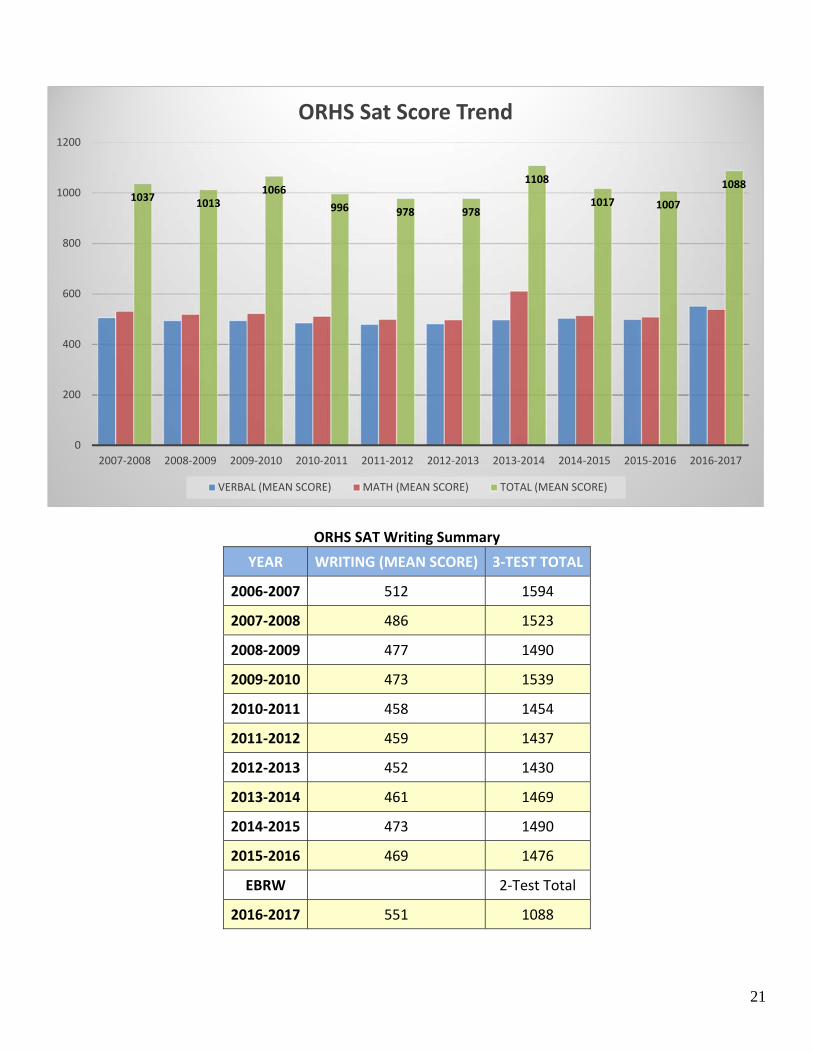
ORHS SAT Writing Summary
YEAR WRITING (MEAN SCORE) 3‐TEST TOTAL
2006‐2007 512 1594
2007‐2008 486 1523
2008‐2009 477 1490
2009‐2010 473 1539
2010‐2011 458 1454
2011‐2012 459 1437
2012‐2013 452 1430
2013‐2014 461 1469
2014‐2015 473 1490
2015‐2016 469 1476
EBRW 2‐Test Total
2016‐2017 551 1088
1037 10131066
996 978 978
1108
1017 1007
1088
0
200
400
600
800
1000
1200
2007‐2008 2008‐2009 2009‐2010 2010‐2011 2011‐2012 2012‐2013 2013‐2014 2014‐2015 2015‐2016 2016‐2017
ORHS Sat Score Trend
VERBAL (MEAN SCORE) MATH (MEAN SCORE) TOTAL (MEAN SCORE)

22
THE WOODLANDS COLLEGE PARK HIGH SCHOOL
SAT Statistics
YEAR SENIORS TAKING SAT
PERCENTAGE OF SENIORS TESTED
VERBAL (MEAN SCORE)
MATH (MEAN SCORE)
TOTAL (MEAN SCORE)
2006‐2007 228 56% 530 545 1075
2007‐2008 419 79% 549 570 1119
2008‐2009 377 62% 554 586 1140
2009‐2010 427 72% 556 557 1133
2010‐2011 489 84% 542 574 1116
2011‐2012 490 83% 537 569 1106
2012‐2013 466 77% 552 566 1118
2013‐2014 493 80% 552 570 1122
2014‐2015 492 81% 552 570 1122
2015‐2016 493 79% 545 535 1079
Redesigned
2016‐2017 502 74% 599 601 1200
228
419
377
427
489 490
466
493 492 493502
200
250
300
350
400
450
500
550
TWCP SAT Senior Test Taker Trend

23
TWCP SAT Writing Summary
YEAR WRITING (MEAN SCORE) 3‐TEST TOTAL
2008‐2009 544 1684
2009‐2010 547 1680
2010‐2011 530 1646
2011‐2012 523 1629
2012‐2013 528 1646
2013‐2014 538 1660
2014‐2015 535 1657
2015‐2016 534 1655
EBRW 2‐Test Total
2016‐2017 599 1200
1119 1140 1133 1116 1106 1118 1122 11221079
1200
2007‐2008 2008‐2009 2009‐2010 2010‐2011 2011‐2012 2012‐2013 2013‐2014 2014‐2015 2015‐2016 2016‐2017
TWCP SAT Score Trend
VERBAL (MEAN SCORE) MATH (MEAN SCORE) TOTAL (MEAN SCORE)

24
THE WOODLANDS HIGH SCHOOL
SAT Statistics
YEAR SENIORS TAKING SAT
PERCENTAGE OF SENIORS TESTED
VERBAL (MEAN SCORE)
MATH (MEAN SCORE)
TOTAL (MEAN SCORE)
2006‐2007 833 94% 549 565 1114
2007‐2008 738 87% 547 566 1113
2008‐2009 632 75% 547 575 1122
2009‐2010 671 80% 554 580 1134
2010‐2011 725 84% 550 574 1124
2011‐2012 781 86% 545 572 1117
2012‐2013 837 82% 553 574 1127
2013‐2014 852 83% 553 574 1127
2014‐2015 818 81% 566 583 1149
2015‐2016 768 82% 554 536 1090
Redesigned
2016‐2017 854 76% 603 604 1207
833
738
632
671
725
781
837852
818
768
854
500
550
600
650
700
750
800
850
900
TWHS SAT Senior Test Taker Trend
25
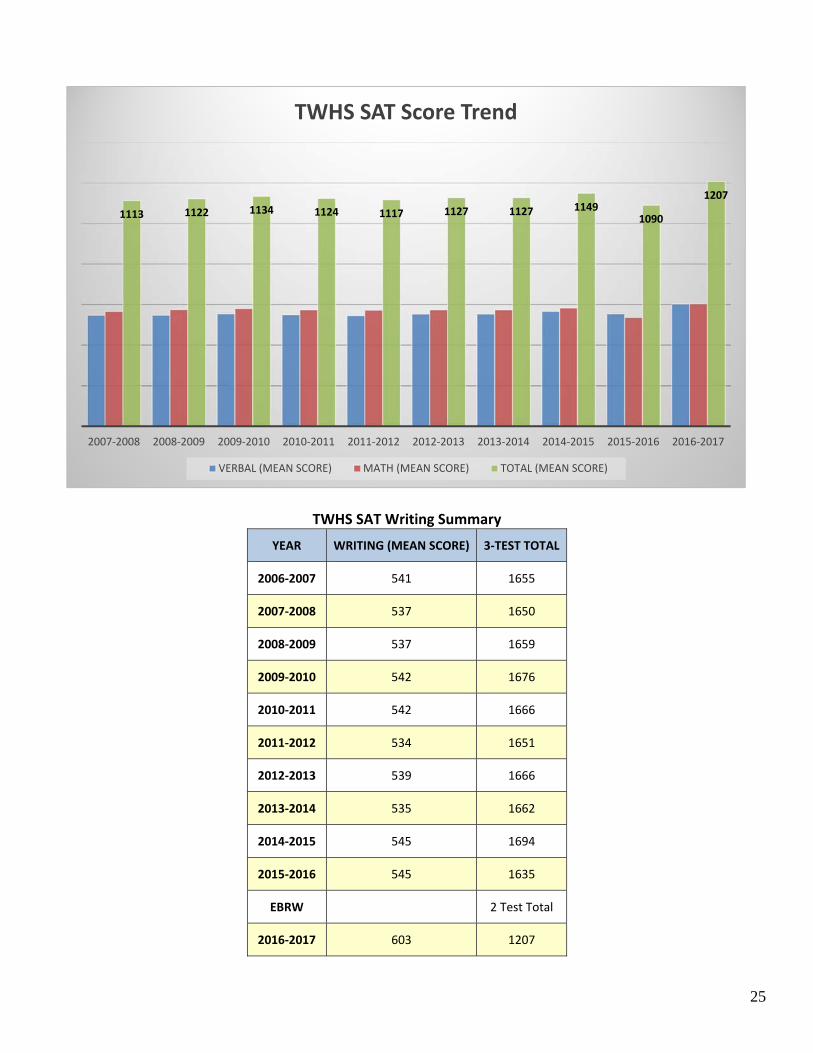
TWHS SAT Writing Summary
YEAR WRITING (MEAN SCORE) 3‐TEST TOTAL
2006‐2007 541 1655
2007‐2008 537 1650
2008‐2009 537 1659
2009‐2010 542 1676
2010‐2011 542 1666
2011‐2012 534 1651
2012‐2013 539 1666
2013‐2014 535 1662
2014‐2015 545 1694
2015‐2016 545 1635
EBRW 2 Test Total
2016‐2017 603 1207
1113 1122 1134 1124 1117 1127 1127 11491090
1207
2007‐2008 2008‐2009 2009‐2010 2010‐2011 2011‐2012 2012‐2013 2013‐2014 2014‐2015 2015‐2016 2016‐2017
TWHS SAT Score Trend
VERBAL (MEAN SCORE) MATH (MEAN SCORE) TOTAL (MEAN SCORE)

26
2012‐2017 CISD SAT Mean Scores Demographic Summary This demographic report includes data regarding CISD graduate SAT scores by ethnicity from 2012 ‐ 2016.
This data has been monitored by following the participation and performance of our students. However, it should be noted that students self‐report this data. Therefore, it has limited application.
Student Group AI AS/PI AA Hispanic W Other NR
2017 Percent Participating 1 5 8 26 57 3 1
2016 Percent Participating 1 6 7 28 55 1 2
2015 Percent Participating 1 7 6 21 63 1 1
2014 Percent Participating 1 6 7 21 62 2 1
2013 Percent Participating 1 6 5 22 63 2 1
2012 Percent Participating 1 6 6 20 65 1 1
2017 Evidence‐Based Reading +Writing 495 611 515 547 589 605 543
2016 Critical Reading 549 561 452 469 541 517 558
2015 Critical Reading 536 573 466 507 544 551 526
2014 Critical Reading 491 563 460 503 542 563 479
2013 Critical Reading 515 559 446 487 535 572 486
2012 Critical Reading 535 523 448 472 528 551 506
2017 Math 490 627 502 545 582 603 534
2016 Math 542 597 451 505 554 512 561
2015 Math 547 609 463 519 560 555 514
2014 Math 496 599 469 514 568 570 481
2013 Math 530 591 454 508 553 568 520
2012 Math 539 572 454 504 555 551 533
2017 Writing Discontinued * * * * * * *
2016 Writing 517 556 431 464 520 494 521
2015 Writing 507 566 447 484 521 525 502
2014 Writing 470 560 432 478 518 552 455
2013 Writing 494 551 430 473 513 527 480
2012 Writing 514 525 433 466 512 506 473
2017 Combined ERW + Math 985 1237 1017 1093 1171 1208 1077
2016 Combined CR and Math 1091 1158 903 974 1095 1029 1109
2015 Combined CR and Math 1083 1182 929 1026 1111 1106 1040
2014 Combined CR and Math 987 1162 956 929 1107 1133 960
2013 Combined CR and Math 1045 1150 900 995 1088 1140 1006
2012 Combined CR and Math 1074 1095 902 976 1083 1102 1039
2017 Total 3 Tests Discontinued * * * * * * *
2016 Total 3 tests 1608 1714 1354 1438 1615 1523 1609
2015 Total 3 tests 1590 1748 1376 1510 1632 1631 1542
2014 Total 3 Tests 1457 1722 1388 1407 1625 1685 1415
2013 Total 3 Tests 1539 1701 1330 1468 1601 1667 1486
2012 Total 3 Tests 1588 1620 1335 1442 1595 1608 1512

27
SAT Math
Student Group Asian/PI African American Hispanic White
2013 591 454 508 553
2014 599 469 514 568
2015 609 463 519 560
2016 597 451 505 554
2017 627 502 545 582
0
100
200
300
400
500
600
700
AS/PI AA Hispanic W
5‐Year SAT Math Performance by Group
2013 2014 2015 2016 2017

28
SAT Critical Reading (Evidence‐Based Reading + Writing*)
Student Group Asian/PI African American Hispanic White
2012 523 448 472 528
2013 559 446 487 535
2014 563 460 503 542
2015 573 466 507 544
2016 549 452 489 541
2017* 611 515 547 589
0
100
200
300
400
500
600
700
AS/PI AA Hispanic W
5‐Year SAT Critical Reading Performance by Group*2017 ‐ Redesigned Test
2013 2014 2015 2016 2017 Evidence‐Based Reading & Writing

29
SAT Math
Student Group Asian/PI African American Hispanic White
2012 572 454 504 555
2013 591 454 508 553
2014 599 469 514 568
2015 609 463 519 560
2016 597 451 505 554
2017 627 502 545 582
0
100
200
300
400
500
600
700
AS/PI AA Hispanic W
5‐Year SAT Math Performance by Group
2013 2014 2015 2016 2017

30
SAT Writing
Student Group Asian/PI African American Hispanic White
2012 525 433 466 512
2013 551 430 473 513
2014 560 432 478 518
2015 507 566 484 521
2016 556 531 464 520
Discontinued in 2017
0
100
200
300
400
500
600
AI AS/PI AA Hispanic W Other NR
5‐Year SAT Writing by Group*2017 ‐ Redesigned Test
2013 2014 2015 2016

31
SAT Critical Reading and Math
Student group Asian/PI African American Hispanic White
2012 1095 902 976 1083
2013 1150 900 995 1088
2014 1162 956 929 1107
2015 1083 929 1026 1111
2016 1158 903 974 1095
2017* 1237 1017 1093 1171
*Redesigned Test (EBRW + Math)
0
200
400
600
800
1000
1200
1400
AS/PI AA Hispanic W
5‐Year Critical Reading & Math Combined by Group*2017 ‐ Redesigned Test
2013 2014 2015 2016 2017 Combined ERW + Math

32
SAT All 3 Tests Combined Scores
Year Asian/PI African American Hispanic White
2012 1620 1335 1442 1595
2013 1701 1330 1468 1601
2014 1722 1388 1407 1634
2015 1748 1376 1510 1632
2016 1714 1334 1438 1615
*Discontinued in 2017
0
200
400
600
800
1000
1200
1400
1600
1800
2000
AS/PI AA Hispanic W
5‐Year SAT Combined 3 Tests by Group*2017 ‐ Redesigned Test
2013 2014 2015 2016 *2017 Discontinued

33
ACT REPORT FOR CONROE ISD
2017 ACT Students, Taking English Math Reading Science Composite
National 2,182,030 20.3 20.7 21.4 21.0 21.0
Texas 146,608 19.5 20.7 21.1 20.9 20.7
Conroe ISD 1,793 22.7 23.4 24.1 23.4 23.5
2016 ACT Students, Taking English Math Reading Science Composite
National 2,090,342 20.1 20.6 21.3 20.8 20.8
Texas 142,877 19.4 20.7 21.0 20.7 20.6
Conroe ISD 1,606 22.1 23.3 23.7 23.1 23.2
20.1 20.621.3 20.8 20.8
19.4
20.721 20.7 20.6
22.123.3 23.7 23.1 23.2
0
5
10
15
20
25
English Math Reading Science Composite
2016 ACT Results
National Texas Conroe ISD
20.3 20.7 21.4 21 2119.5
20.7 21.1 20.9 20.722.7 23.4 24.1 23.4 23.5
0
5
10
15
20
25
30
English Math Reading Science Composite
2017 CISD ACT Results
National Texas Conroe ISD

34
2015 ACT Students, Taking English Math Reading Science Composite
National 1,924,436 20.4 20.8 21.4 20.9 21.0
Texas 124,764 19.8 21.1 21.1 21.0 20.9
Conroe ISD 1,406 23.3 24.3 24.4 23.8 24.1
2014 ACT Students, Taking English Math Reading Science Composite
National 1,845,787 20.3 20.9 21.3 20.8 21.0
Texas 116,547 19.8 21.4 21.1 21.0 20.9
Conroe ISD 1,290 22.6 24.0 23.8 23.2 23.5
20.4 20.8 21.4 20.9 2119.8
21.1 21.1 21 20.923.3 24.3 24.4 23.8 24.1
0
5
10
15
20
25
30
English Math Reading Science Composite
2015 CISD ACT Results
National Texas Conroe ISD
20.3 20.9 21.3 20.8 2119.8
21.4 21.1 21 20.922.6
24 23.8 23.2 23.5
0
5
10
15
20
25
30
English Math Reading Science Composite
2014 CISD ACT Results
National Texas Conroe ISD

35
2013 ACT Students Taking English Math Reading Science Composite
National 1,799,243 20.2 20.9 21.1 20.7 20.9
Texas 109,841 19.8 21.5 21.0 20.9 20.9
Conroe ISD 1,302 22.4 23.9 23.6 22.8 23.3
20.2 20.9 21.1 20.7 20.919.8
21.5 21 20.9 20.922.4
23.9 23.6 22.8 23.3
0
5
10
15
20
25
30
English Math Reading Science Composite
2013 CISD ACT Results
National Texas Conroe ISD

36
ACT Report Trends‐National and State 2007‐2017 College Readiness Benchmarks: A benchmark score is the minimum score needed on an ACT subject‐area test to indicate a 50% chance of obtaining a B or higher or about a 75% chance of obtaining a C or higher in the corresponding college credit course.
Percent Meeting College
Readiness Benchmarks
Texas
CISD
TX Eng. (18)
CISD Eng. (18)
TX
Math (22)
CISD Math (22)
TX Soc.Sci (22)
CISD Soc.Sci (22)
TX
Science (23)
CISD
Science (23)
TX
Meeting All Four
CISD
Meeting All Four
2007 76,542 829 62 81 41 67 47 66 24 42 19 37
2008 79,050 913 63 81 44 66 49 66 25 39 20 35
2009 82,640 1048 63 78 44 68 49 65 26 41 22 36
2010 92,615 1127 61 78 46 67 48 66 29 46 24 41
2011 101,569 1204 60 80 48 71 48 70 28 48 24 43
2012 110,180 1,412 61 75 48 66 48 64 29 44 24 38
2013 109,841 1,302 61 79 48 68 43 60 36 52 26 42
2014 116,547 1290 60 81 47 69 42 62 36 55 26 43
2015 124,764 1406 59 80 44 69 44 67 38 62 27 51
2016 142,877 1606 57 74 42 62 43 61 35 55 26 44
2017 146,608 1,793 57 78 40 63 45 65 35 55 26 45
19 2022
24 24 2426 26 27 26 26
3735 36
4143
38
42 43
51
44 45
0
10
20
30
40
50
60
2007 2008 2009 2010 2011 2012 2013 2014 2015 2016 2017
ACT College Readiness Trend:Percent Meeting All Four Subjects
TX Meeting All Four CISD Meeting All Four

37
2017 ACT Results
2017 Students Taking English Math Reading Science Composite
National 2,182,030 20.3 20.7 21.4 21.0 21.0
Texas 146,608 19.5 20.7 21.1 20.9 20.7
Conroe ISD 1,793 22.7 23.4 24.1 23.4 23.5
Caney Creek 118 18.3 19.5 20.3 20.2 19.6
Conroe 338 18.1 19.5 20.2 19.8 19.5
Oak Ridge 283 20.7 22.0 22.7 22.3 22.1
The Woodlands 714 25.1 25.4 26.0 25.1 25.5
The Woodlands College Park
340 25.4 25.6 26.6 25.5 25.9
2016 ACT Results
2016 Students Taking English Math Reading Science Composite
National 2,090,342 20..1 20.6 21.3 20.8 20.8
Texas 142,877 19.4 20.7 21.0 20.7 20.6
Conroe ISD 1,606 23.3 24.3 24.4 23.8 24.1
Caney Creek 73 17.3 19.7 19.3 19.4 19.1
Conroe 321 18.2 19.2 20.4 20.2 19.6
Oak Ridge 282 20.4 21.9 22.5 22.1 21.9
The Woodlands 570 24.5 25.4 25.6 24.7 25.2
The Woodlands College Park
358 24.3 25.3 25.5 24.9 25.1

38
2015 ACT Results
2015 Students Taking English Math Reading Science Composite
National 1,924,436 20.4 20.8 21.4 20.9 21.0
Texas 124,764 19.8 21.1 21.1 21.0 20.9
Conroe ISD 1,406 23.3 24.3 24.4 23.8 24.1
Caney Creek 71 17.2 19.0 18.8 19.5 18.7
Conroe 108 19.1 20.7 20.7 20.8 20.5
Oak Ridge 278 21.0 22.0 22.7 21.1 22.1
The Woodlands 605 25.2 26.0 25.9 25.2
25.7
The Woodlands College Park 343 24.5 25.5 25.4 24.4 25.1
ACT COMPOSITE SCORE TREND 2006‐2017
TEST ADMINISTRATION YEAR NATIONAL TEXAS CISD CISDSTUDENT NUMBER
2006‐2007 21.2 20.5 23.3 829
2007‐2008 21.1 20.7 23.2 913
2008‐2009 21.1 20.8 23.2 1,048
2009‐2010 21.0 20.8 23.4 1,127
2010‐2011 21.1 20.8 23.7 1,204
2011‐2012 21.1 20.8 22.9 1,412
2012‐2013 20.9 20.9 23.3 1,302
2013‐2014 21.0 20.9 23.5 1,290
2014‐2015 21.0 20.9 24.1 1,406
2015‐2016 20.8 20.6 23.2 1,606
2016‐2017 21.0 20.7 23.5 1,793

39
Conroe ISD ACT Score by Subject Area
Graduate Year Number Tested English Math Reading Science Composite
2006 807 22.3 23.6 23.0 22.2 22.9
2007 829 22.6 23.8 23.4 22.8 23.3
2008 913 22.5 23.9 23.2 22.6 23.2
2009 1,048 22.5 24.1 23.1 22.6 23.2
2010 1,127 22.5 24.1 23.5 23.0 23.4
2011 1,204 22.9 24.3 23.8 23.3 23.7
2012 1,412 22.0 23.7 23.0 22.6 22.9
2013 1,302 22.4 23.9 23.6 22.8 23.3
2014 1,290 22.6 24.0 23.8 23.2 23.5
2015 1406 23.3 24.3 24.4 23.8 24.1
2016 1606 22.1 23.3 23.7 23.1 23.2
2017 1,793 22.7 23.4 24.1 23.4 23.5

40
829
913
1,048
1,127
1,204
1,412
1,302 1,290
1406
1606
1,793
800
1000
1200
1400
1600
1800
2000
2007 2008 2009 2010 2011 2012 2013 2014 2015 2016 2017
ACT Number of Students Tested
20.5
21
21.5
22
22.5
23
23.5
24
24.5
25
2007 2008 2009 2010 2011 2012 2013 2014 2015 2016 2017
10‐Year ACT Subject Test Trend
English Math Reading Science

41
17
18
19
20
21
22
23
24
25
26
27
English Math Reading Science Composite
2017 ACT Performance by Subject
Caney Creek
Conroe
Oak Ridge
The Woodlands
The Woodlands College Park
National
Texas
Conroe ISD

42
10 Year Trend for Composite Performance by Student Group
2006 2007 2008 2009 2010 2011 2012 2013 2014 2015 2016 2017
All 22.9 23.3 23.2 23.2 23.4 23.7 22.9 23.3 23.5 24.1 23.2 23.5
African Am. 19.0 18.7 18.8 17.2 17.9 18.9 17.7 18.8 19.5 18.0 18.6 19.4
Am. Indian 22.5 22.8 21.0 25.8 20.0 25.8 23.3 20.0 20.6 20.7 23.4 21.5
White 23.1 23.8 23.5 23.5 24.1 24.5 23.8 24.1 24.2 24.8 24.4 24.6
Hispanic 20.8 21.8 21.2 21.9 21.1 21.6 20.9 21.5 21.3 22.3 21.2 21.4
Asian 27.5 26.1 25.7 26.5 26.8 25.9 25.3 26.6 27.2 26.8 26.6 26.5
NR 22.9 22.7 24.4 24.2 22.6 23.2 25.3 23.2 26.6 26.2 24.4 24.3
15
17
19
21
23
25
27
29
2007 2008 2009 2010 2011 2012 2013 2014 2015 2016 2017
10‐Year Trend ACT Performance Trend by Ethnicity
All
African Am.
Am. Indian
White
Hispanic
Asian
NR

43
CISD 2017 ACT Participation by Student Group
Student Group Number Tested
English Math Reading Science Composite
All 1,793 22.7 23.4 24.1 23.4 23.5
African Am. 107 18.1 18.3 19.5 19.7 19.4
Am. Indian 6 20.3 21.0 21.7 22.0 21.5
White 997 23.8 24.2 25.3 24.4 24.6
Hispanic 473 20.2 21.6 21.9 21.6 21.4
Asian 86 26.1 27.0 26.4 25.8 26.5
Other Pac. Isl. 5 22.0 22.8 24.6 22.4 23.0
2 or More Races 62 25.1 25.1 26.3 24.8 25.4
No Response 57 23.6 24.5 24.7 23.9 24.3
Other Pac. Isl. 0%Am. Indian 0%
No Response 3%
2 or More Races 4%
Asian 5%
African Am. 6%
Hispanic 26%
White 56%
Other 7%
2017 ACT Participation by Student Group

44
17
19
21
23
25
27
English Math Reading Science Composite
2017 Performance by Student Group
Other Pac. Isl.
Am. Indian
No Response
2 or More Races
Asian
African Am.
Hispanic
White
Average

45
CISD 2016 ACT Participation by Student Group
Student Group Number Tested
English Math Reading Science Composite
All 1,606 22.1 23.3 23.7 23.1 23.2
African Am. 111 17.3 18.6 19.4 18.8 18.6
Am. Indian 5 21.2 24.6 24.0 23.2 23.4
White 869 23.5 24.4 24.8 24.2 24.4
Hispanic 429 19.7 21.4 21.7 21.5 21.2
Asian 68 25.9 27.0 27.0 26.0 26.6
Other Pac. Isl. 5 20.8 22.6 23.4 23.0 22.4
2 or More Races 45 22.7 22.3 24.7 23.0 23.3
No Response 74 23.6 24.5 25.1 24.0 24.4
Am. Indian 0%
Other Pac. Isl. 0%
2 or More Races 3%
Asian 4%
No Response 5%
African Am. 7%
Hispanic 27%
White 54%
Other 12%
2016 ACT Participation by Student Group

46
17
18
19
20
21
22
23
24
25
26
27
English Math Reading Science Composite
2016 ACT Performance by Student Group
Am. Indian
Other Pac. Isl.
2 or More Races
Asian
No Response
African Am.
Hispanic
White
Average

47
CISD 2015 ACT Participation by Student Group
Student Group Number Tested
English Math Reading Science Composite
All 1,406 23.3 24.3 24.4 23.8 24.1
African Am. 70 17.1 18.6 17.9 18.2 18.0
Am. Indian 7 20.9 20.3 21.1 20.3 20.7
White 863 24.2 25.0 25.2 24.4 24.8
Hispanic 288 21.0 22.7 22.3 22.4 22.3
Asian 69 25.8 27.7 27.0 26.4 26.8
Other Pac. Isl. 3 21.0 22.7 21.3 19.7 21.3
2 or More Races 45 23.6 24.6 25.0 23.9 24.4
No Response 61 26.1 26.2 26.4 25.2 26.2
Other Pac. Isl. 0%
Am. Indian 1%
2 or More Races 3%
No Response 4%
Asian 5%
African Am. 5%
Hispanic 21%
White 61%
Other 18%
CISD 2015 ACT Participation by Student Group
Other Pac. Isl. Am. Indian 2 or More Races No Response Asian African Am. Hispanic White

48
17
19
21
23
25
27
English Math Reading Science Composite
2015 ACT Performance by Student Group
Other Pac. Isl.
Am. Indian
2 or More Races
No Response
Asian
African Am.
Hispanic
White
Average

49
CISD ACT Campus Reports
Caney Creek High School
Graduate Year Number Tested English Math Reading Science Composite
2011 104 16.9 20.5 18.7 19.2 18.9
2012 122 16.7 20.1 18.1 18.3 18.4
2013 89 18.1 20.1 19.9 20.1 19.7
2014 74 16.8 19.6 18.5 18.6 18.4
2015 71 17.2 19.0 18.8 19.5 18.7
2016 73 17.3 19.7 19.3 19.4 19.1
2017 118 18.3 19.5 20.3 20.2 19.6
104
122
89
74 71 73
118
0
20
40
60
80
100
120
140
2011 2012 2013 2014 2015 2016 2017
ACTCCHS ‐ Number of Students Tested

50
Conroe High School
Graduate Year Number Tested English Math Reading Science Composite
2011 99 19.6 22.0 21.3 21.2 21.1
2012 166 18.1 20.3 19.1 19.6 19.4
2013 118 18.2 20.6 19.4 19.7 19.6
2014 134 19.3 21.3 20.7 20.6 20.6
2015 108 19.1 20.7 20.7 20.8 20.5
2016 321 18.2 19.2 20.4 20.2 19.6
2017 338 18.1 19.5 20.2 19.8 19.5
99
166
118134
108
321338
2011 2012 2013 2014 2015 2016 2017
CHSACT ‐ Number of Students Tested

51
Oak Ridge High School
Graduate Year Number Tested English Math Reading Science Composite
2011 178 20.7 22.5 21.9 21.7 21.8
2012 257 19.9 21.4 21.6 21.0 21.1
2013 234 19.7 21.7 21.4 21.0 21.1
2014 225 20.5 22.0 22.0 21.1 21.5
2015 278 21.0 22.0 22.7 22.1 22.1
2016 282 20.4 21.9 22.5 22.1 21.9
2017 283 20.7 22.0 22.7 22.3 22.1
178
257
234225
278 282 283
2011 2012 2013 2014 2015 2016 2017
ORHSACT ‐ Number of Students Tested
52
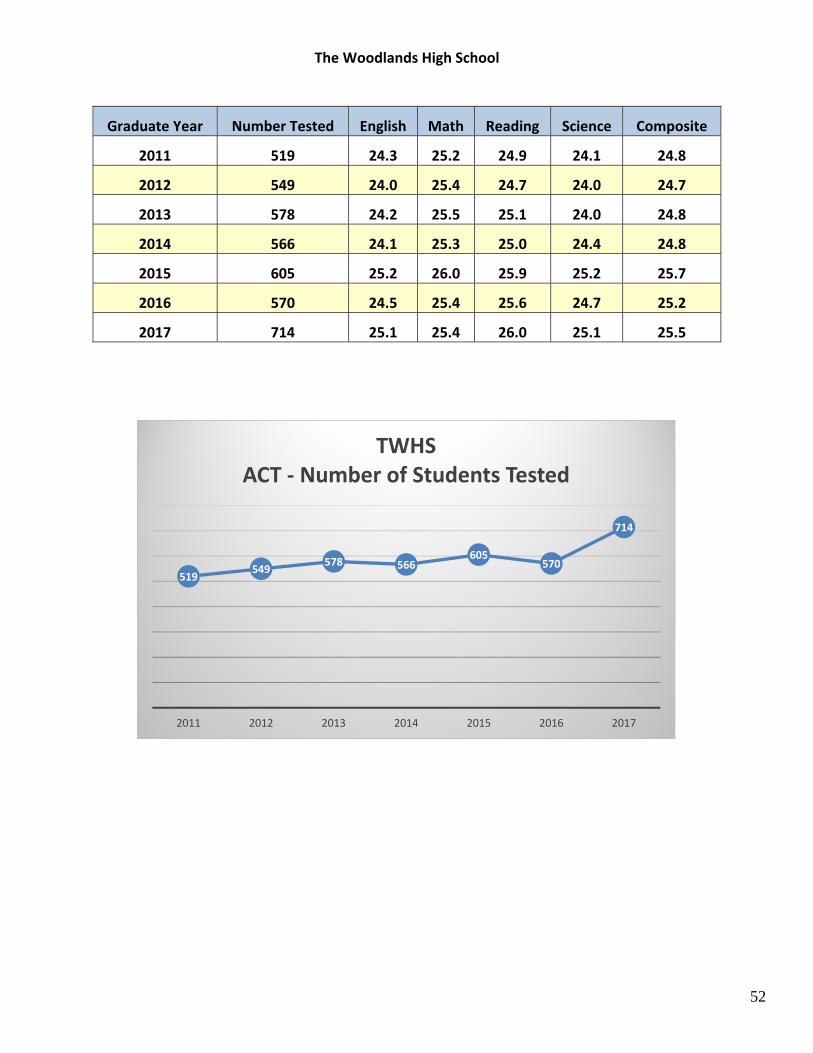
The Woodlands High School
Graduate Year Number Tested English Math Reading Science Composite
2011 519 24.3 25.2 24.9 24.1 24.8
2012 549 24.0 25.4 24.7 24.0 24.7
2013 578 24.2 25.5 25.1 24.0 24.8
2014 566 24.1 25.3 25.0 24.4 24.8
2015 605 25.2 26.0 25.9 25.2 25.7
2016 570 24.5 25.4 25.6 24.7 25.2
2017 714 25.1 25.4 26.0 25.1 25.5
519549
578 566605
570
714
2011 2012 2013 2014 2015 2016 2017
TWHSACT ‐ Number of Students Tested

53
The Woodlands College Park High School
Graduate Year Number Tested English Math Reading Science Composite
2011 304 24.8 26.1 25.5 24.9 25.5
2012 309 24.4 26.0 25.3 24.8 25.3
2013 282 24.0 25.2 25.1 24.1 24.7
2014 291 24.4 25.5 25.5 24.9 24.2
2015 343 24.5 25.5 25.4 24.4 25.1
2016 358 24.3 25.3 25.5 24.9 25.1
2017 340 25.4 25.6 26.6 25.5 25.9
304 309
282291
343
358
340
200
220
240
260
280
300
320
340
360
380
2011 2012 2013 2014 2015 2016 2017
TWCPACT ‐ Number of Students Tested

54
CISD Advanced Placement Report
Secondary Curriculum and Instruction Equity Belief Statement
Conroe ISD encourages teachers, counselors, and principals to make equitable access a guiding principle for their advanced academic programs. Conroe ISD is committed to the principle that all students deserve an opportunity to participate in rigorous and academically challenging courses and programs. All students who are willing to accept the challenge of a rigorous academic curriculum should be considered for admission into Pre‐AP and AP courses. Conroe ISD encourages the elimination of barriers that restrict access to these programs for students from ethnic, racial, and socioeconomic groups that have been traditionally underrepresented in the advanced programs. Schools should put forth a concerted effort to ensure that AP and Pre‐AP classes reflect the diversity of the campus population.
The College Board Report to the Nation now offers a different approach to the measurement of AP success. In order to encourage the largest percentage of students to participate in AP, school results are now reported by the percentage of students in a total population who had at least one AP experience resulting in an exam score of 3 or higher. There are three objectives for success. 1) Increase Access. Recent research shows that participation in high‐quality curricula, measured by an external assessment such as the AP exam, significantly boosts the likelihood of traditionally underserved students’ future success in college. 2) Improve Awareness. Students who score a 3 or higher on AP exams typically experience greater academic success in college and have higher graduation rates than otherwise comparable non‐AP peers. 3) Strengthen Academics. Research shows that students who took AP math or science exams were more likely than non‐AP students to earn degrees in particular physical science, engineering and life science disciplines.
In the 2013 Education Pays report, research supports the life‐long benefits for students with access to higher education. There is not only a positive correlation between education and earnings but also the positive impact on the community. Although more students are graduating from high school, the income gap between a student with high school diploma and a one with a bachelor’s degree has increased significantly. The benefits of higher education include:
Higher earnings and better likelihood of employment
Better health care
Less reliance on social safety‐net programs
Healthier lifestyles
Higher levels of civic participation
Better preparation of children for school Participation in college is affected by family income, parent education level, and type of institution attended.

55
Current Research on AP Programs
Growth of AP Programs nationwide has raised questions about the validity of the score on an AP test. Current research shows that the standards have not decreased despite growth in the program. AP students outperform freshman college students in most subjects. A worldwide comparison of calculus students shows that the United States ranks 15th in the world. AP calculus students are performing better than the top ranked nation, France. Even with scoring a 1 or 2 on the test, they outperform the highest ranking countries on standardized testing.
Impact of AP on 5‐Year College Graduation Rates
Student Group AP Exam Grade of 3, 4, 5 AP Exam Grade of 1, 2 Took AP course but not exam
African American 28% higher 22% higher 16% higher
Hispanic 28% higher 12% higher 10% higher
White 33% higher 22% higher 20% higher
Low Income 26% higher 17% higher 12% higher
Not Low‐Income 34% higher 23% higher 19% higher
Source: Chrys Dougherty, Lynn Mellor, and Shuling Jian, The Relationship Between Advanced Placement and College Graduation (National Center for Educational Accountability, 2006)

56
College Board AP Audit
The AP Course Audit was created at the request of secondary school and college and university members of the College Board who sought a means to provide teachers and administrators with clear guidelines on the curricular and resource requirements for AP courses. The AP Course Audit also helps colleges and universities better interpret secondary school courses marked "AP" on students' transcripts. To receive authorization from the College Board to label a course "AP," schools must demonstrate how their courses meet or exceed these requirements. All Conroe ISD AP teachers submit an audit and syllabus for their course. Schools and their approved courses are available to the public. Colleges and universities are sent a ledger listing all schools offering authorized AP courses as well as the names of all courses authorized at each school.

57
The Advanced Placement Program (34 College‐level Courses and Exams)
English
• English Language and Composition, English Literature and Composition History and Social Sciences
• Economics (2), European History, Government and Politics (2), Human Geography, U.S. History, World History, Psychology
Arts • Art History, Music Theory, Studio Art (3)
World Languages and Cultures • French, German, Italian, Latin, Spanish Language and Culture, Spanish Literature Chinese, Japanese
STEM • Calculus (2), Computer Science, Statistics • Biology, Chemistry, Environmental Science, Physics (4)
AP Capstone • AP Seminar and AP Research
The Advanced Placement program in Conroe ISD
Access to rigorous courses and preparation for higher education is the foundation to the Advanced Placement program in Conroe ISD.
2017 AP Program Statistics:
In 2017, nationwide, 57% of students scored a 3 or higher on subject tests.
In 2017. Conroe ISD, 60% of students scored 3 or higher on subject tests.
The mean grade for CISD students is 2.89.
The mean grade in Texas is 2.51.
The national mean grade is 2.84. In CISD the most popular tests, in order, are:
World History – a sophomore course – 20%
US Government – 17%
Human Geography – a freshman course – 16%
Macroeconomics – 13%
English Language and Composition – 13% Of all exams administered in 2017:
47% were Social Studies subjects
11% were English
19% were Science
14% were Math and Computer Science
5% were Foreign Language
4% were Art and Music

58
Conroe ISD AP Exam Participation
4046
5167 5324 55386094
6525
75888009
9155 9386 9367
3000
4000
5000
6000
7000
8000
9000
10000
2007 2008 2009 2010 2011 2012 2013 2014 2015 2016 2017
10‐Year AP Test TrendCISD
Number of Tests
1960
2410 24322604 2735
30043324
3633
41214377
4544
1000
1500
2000
2500
3000
3500
4000
4500
5000
2007 2008 2009 2010 2011 2012 2013 2014 2015 2016 2017
Number of Students Taking AP ExamsCISD
Number of Students
Year Number of
Tests Number of Students Taking AP Exams
2007 4046 1960
2008 5167 2410
2009 5324 2432
2010 5538 2604
2011 6094 2735
2012 6525 3004
2013 7588 3324
2014 8009 3633
2015 9155 4121
2016 9386 4377
2017 9367 4544

59
2017 CISD Advanced Placement Results and Summaries
School #Students #Tests National Mean
State Mean
School Mean
Percentage of Tests 3 or Above
Caney Creek 437 808 2.84 5.51 1.82 22%
Conroe 843 1682 2.84 2.51 1.98 28%
Oak Ridge 945 1782 2.84 2.51 2.56 49%
College Park 948 2229 2.84 2.51 3.56 82%
The Woodlands 1371 2866 2.84 2.51 3.42 80%
CISD 4544 9367 2.84 2.51 2.89 60%
Texas 313,517 590,006 2.84 2.51 2.51 46%
National 2,687,887 4,854,518 2.84 2.51 2.84 57%
2.51
2.842.89
Texas National CISD
2017 AP Mean Scores
2.842.51
2.89
1.82 1.98
2.56
3.56 3.42
2017 AP Mean Score ComparisonMean Score

60
1516
1568 1906
1877
1673
1513
1578
1799
1984
2059
1808
1949 2282
2279
2434
1688
1745
1973
1962
2017
1063
1174
1195
1282
1184
2013 1
2014 1
2015 1
2016 1
2017 1
2013 2
2014 2
2015 2
2016 2
2017 2
2013 3
2014 3
2015 3
2016 3
2017 3
2013 4
2014 4
2015 4
2016 4
2017 4
2013 5
2014 5
2015 5
2016 5
2017 5
SCORE DISTRIBUTION3=UNIVERSITY QUALIFIED 5=HIGHEST SCORE
437
843945 948
1371
0
200
400
600
800
1000
1200
1400
1600
CANEY CREEK CONROE OAK RIDGE COLLEGE PARK THE WOODLANDS
2017 Number of Students Tested ‐ AP
57%
46%
60%
22%28%
49%
82% 80%
0%
10%
20%
30%
40%
50%
60%
70%
80%
90%
2017 Percentage of AP Tests 3 or Above

61
2016 CISD Advanced Placement Results and Summaries
School #Students #Tests National Mean
State Mean
School Mean
Percentage of Tests 3 or Above
Caney Creek 477 966 2.85 2.51 1.74 19%
Conroe 815 1738 2.85 2.51 1.9 25%
Oak Ridge 730 1538 2.85 2.51 2.65 52%
College Park 962 2292 2.85 2.51 3.53 80%
The Woodlands 1391 2850 2.85 2.51 3.44 80%
CISD 4377 9384 2.85 2.51 2.87 59%
Texas 291,679 547,276 2.85 2.51 2.51 46%
National 2,555,851 4,600,082 2.85 2.51 2.85 57%
2015 CISD Advanced Placement Results and Summaries
School #Students #Tests National Mean State Mean School Mean Percentage of
Tests 3 or Above
Caney Creek 441 883 2.82 2.48 1.73 20%
Conroe 810 1713 2.82 2.48 1.91 26%
Oak Ridge 670 1389 2.82 2.48 2.45 47%
College Park 883 2144 2.82 2.48 3.55 81%
The Woodlands 1317 3026 2.82 2.48 3.44 81%
CISD 4121 9155 2.82 2.48 2.86 60%
Texas 270,723 510,555 2.82 2.48 2.48 46%
National 2,432,393 4,383,885 2.82 2.48 2.82 57%
2014 CISD Advanced Placement Results and Summaries
School #Students #Tests National Mean State Mean School Mean Percentage of
Tests 3 or Above
Caney Creek 384 716 2.87 2.57 1.81 23%
Conroe 761 1672 2.87 2.57 1.95 27%
Oak Ridge 520 1059 2.87 2.57 2.61 52%
College Park 739 1893 2.87 2.57 3.53 80%
The Woodlands 1229 2669 2.87 2.57 3.49 82%
CISD 3633 8009 2.87 2.57 2.92 61%
Texas 239,632 437,002 2.87 2.57 2.57 49%
National 2,293,625 4,083,487 2.87 2.57 2.87 59%

62
Caney Creek High School
Year # Students #Tests National Mean
State Mean
School Mean % of 3+
2008 171 306 2.85 2.55 1.98 26%
2009 199 356 2.89 2.57 2.02 31%
2010 261 466 2.86 2.54 2.01 30%
2011 306 534 2.84 2.48 1.87 24%
2012 279 495 2.89 2.56 1.77 22%
2013 325 645 2.87 2.56 1.7 19%
2014 384 716 2.87 2.57 1.81 23%
2015 441 883 2.82 2.48 1.73 20%
2016 477 966 2.85 2.51 1.74 19%
2017 437 808 2.84 2.51 1.82 22%
CCHS Participation by Ethnicity
Ethnicity Asian African American Hispanic White
2008 3 0 79 85
2009 2 2 84 107
2010 1 1 105 142
2011 2 2 134 159
2012 3 2 101 166
2013 5 8 120 186
2014 6 8 160 199
2015 7 5 183 229
2016 4 7 233 213
2017 3 5 199 216
171 199 261 306 279 325 384 441 477 437306 356
466 534 495645 716
883 966808
010020030040050060070080090010001100
2008 2009 2010 2011 2012 2013 2014 2015 2016 2017
Caney CreekAP Participation
Students Tests

63
Conroe High School
Year #Students #Tests National Mean
State Mean
School Mean % of 3+
2008 480 1083 2.85 2.55 1.87 24%
2009 495 1150 2.89 2.57 2.07 23%
2010 533 1148 2.86 2.54 2.18 36%
2011 514 1185 2.84 2.48 2.04 30%
2012 541 1146 2.89 2.56 1.87 25%
2013 643 1392 2.87 2.56 1.83 23%
2014 761 1672 2.87 2.57 1.95 27%
2015 810 1713 2.82 2.48 1.91 26%
2016 815 1738 2.85 2.51 1.9 25%
2017 843 1682 2.84 2.51 1.98 28%
CHS Participation by Ethnicity
Ethnicity Asian African American Hispanic White
2008 18 26 167 245
2009 20 37 155 262
2010 21 32 202 247
2011 17 29 214 233
2012 26 26 235 236
2013 26 42 280 274
2014 27 53 360 303
2015 25 73 347 332
2016 26 60 382 310
2017 40 54 369 344
480 495 533 514 541 643 761 810 815 843
1083 1150 1148 1185 11461392
1672 1713 1738 1682
0200400600800100012001400160018002000
2008 2009 2010 2011 2012 2013 2014 2015 2016 2017
Conroe High SchoolAP Participation
Students Tests

64
Oak Ridge High School
Year #Students #Tests National Mean
State Mean
School Mean % of 3+
2008 227 386 2.85 2.55 2.23 38%
2009 257 515 2.89 2.57 2.21 37%
2010 322 663 2.86 2.54 2.35 42%
2011 372 705 2.84 2.48 2.45 47%
2012 420 854 2.89 2.56 2.55 51%
2013 437 852 2.87 2.56 2.55 48%
2014 520 1059 2.87 2.57 2.61 52%
2015 670 1389 2.82 2.48 2.45 47%
2016 730 1538 2.85 2.51 2.65 52%
2017 945 1782 2.84 2.51 2.56 49%
ORHS Participation by Ethnicity
Ethnicity Asian African American Hispanic White
2008 10 5 44 154
2009 12 8 54 171
2010 24 13 59 211
2011 19 13 70 245
2012 28 26 88 261
2013 30 26 110 255
2014 31 33 141 307
2015 115 20 285 857
2016 129 23 334 846
2017 64 57 228 846
227 257 322 372 420 437520
670 730
945
386515
663 705854 852
1059
13891538
1782
0200400600800100012001400160018002000
2008 2009 2010 2011 2012 2013 2014 2015 2016 2017
Oak RidgeAP Participation
Students Tests

65
The Woodlands High School
Year #Students #Tests National Mean
State Mean
School Mean % of 3+
2008 916 1807 2.85 2.55 3.41 78%
2009 907 1752 2.89 2.57 3.67 86%
2010 920 1871 2.86 2.54 3.71 85%
2011 933 2058 2.84 2.48 3.6 82%
2012 1105 2267 2.89 2.56 3.54 82%
2013 1218 2806 2.87 2.56 3.45 80%
2014 1229 2669 2.87 2.57 3.49 82%
2015 1317 3026 2.82 2.48 3.44 81%
2016 1391 2850 2.85 2.51 3.44 80%
2017 1371 2866 2.84 2.51 3.42 80%
TWHS Participation by Ethnicity
Ethnicity Asian African American Hispanic White
2008 60 15 93 722
2009 62 15 97 708
2010 75 16 98 705
2011 78 15 126 657
2012 92 23 162 777
2013 108 17 210 839
2014 115 16 249 811
2015 115 20 285 857
2016 129 23 334 846
2016 156 29 337 807
916 907 920 933 1105 1218 1229 1317 1391 1371
1807 1752 18712058
2267
2806 26693026
2850 2866
0400800120016002000240028003200
2008 2009 2010 2011 2012 2013 2014 2015 2016 2017
The WoodlandsAP Participation
Students Tests

66
The Woodlands College Park High School
Year #Students #Tests National Mean
State Mean
School Mean % of 3+
2008 617 1591 2.85 2.55 3.31 74%
2009 574 1551 2.89 2.57 3.39 78%
2010 556 1372 2.86 2.54 3.41 76%
2011 609 1611 2.84 2.48 3.46 77%
2012 659 1763 2.89 2.56 3.41 76%
2013 701 1893 2.87 2.56 3.44 80%
2014 739 1893 2.87 2.57 3.53 80%
2015 883 2144 2.82 2.48 3.55 81%
2016 962 2292 2.85 2.51 3.53 80%
2017 948 2229 2.84 2.51 3.56 82%
TWCP Participation by Ethnicity
Ethnicity Asian African American Hispanic White
2008 76 14 52 451
2009 74 8 51 415
2010 66 11 60 398
2011 76 14 80 413
2012 78 18 92 448
2013 86 20 117 445
2014 120 27 106 467
2015 145 28 142 549
2016 156 28 170 550
2017 176 25 176 531
617 574 556 609 659 701 739883 962 948
1591 15511372
16111763 1893 1893
21442292 2229
0
400
800
1200
1600
2000
2400
2800
2008 2009 2010 2011 2012 2013 2014 2015 2016 2017
The Woodlands College ParkAP Participation
Students Tests
67
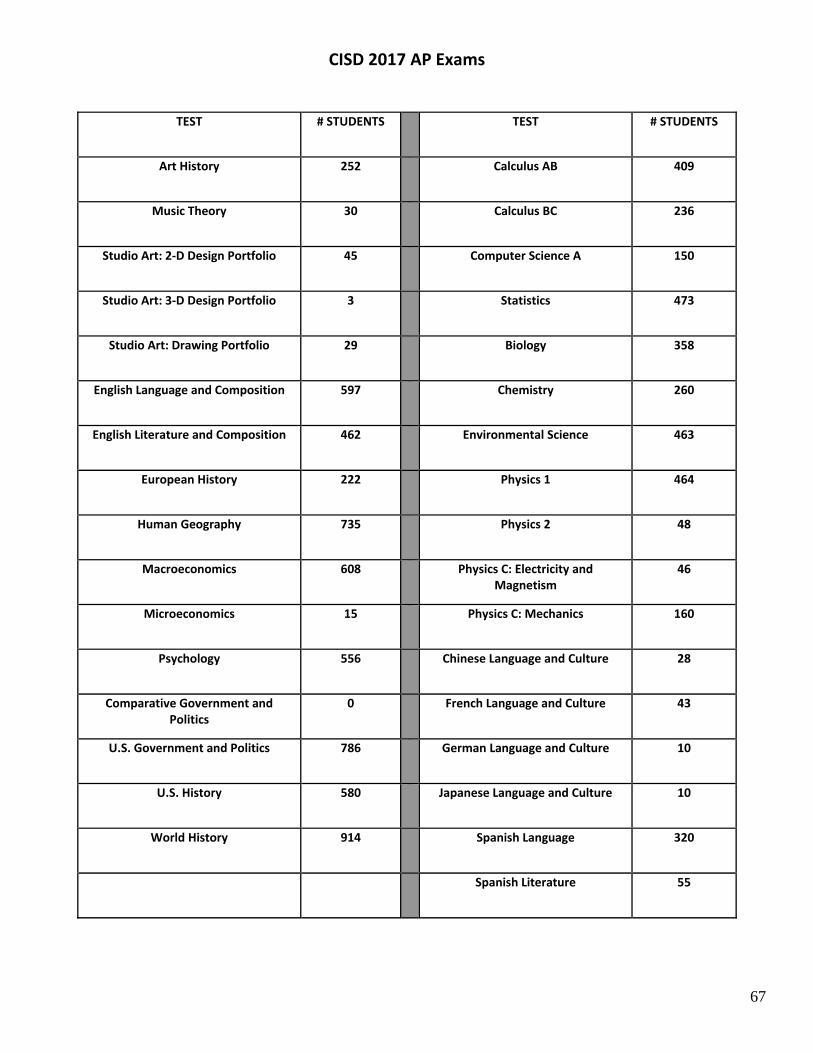
CISD 2017 AP Exams
TEST # STUDENTS TEST # STUDENTS
Art History 252 Calculus AB 409
Music Theory 30 Calculus BC 236
Studio Art: 2‐D Design Portfolio 45 Computer Science A 150
Studio Art: 3‐D Design Portfolio 3 Statistics 473
Studio Art: Drawing Portfolio 29 Biology 358
English Language and Composition 597 Chemistry 260
English Literature and Composition 462 Environmental Science 463
European History 222 Physics 1 464
Human Geography 735 Physics 2 48
Macroeconomics 608 Physics C: Electricity and Magnetism
46
Microeconomics 15 Physics C: Mechanics 160
Psychology 556 Chinese Language and Culture 28
Comparative Government and Politics
0 French Language and Culture 43
U.S. Government and Politics 786 German Language and Culture 10
U.S. History 580 Japanese Language and Culture 10
World History 914 Spanish Language 320
Spanish Literature 55

68
561
397
301
526469
360
597
462
320
0
100
200
300
400
500
600
700
English Language English Literature Spanish Language
AP Exam Participationby Subject 2017
Sum of 2015
Sum of 2016
Sum of 2017
561
783723
826
526
822
679
806608
786
580
914
0
100
200
300
400
500
600
700
800
900
1000
Macro Economics US Government US History World History
Sum of 2015
Sum of 2016
Sum of 2017
47
11
19
14
54
Percentage of Exams Taken
Social Studies
English
Science
Math and Computer Science
Foreign Language
Art and Music

69
AP Participation by Ethnicity
Year Am. Indian Asian/ PI
African Am. Hispanic White Other NR 2 or more Races
2008‐09 13 170 70 441 1663 36 39
2009‐10 7 186 74 531 1712 33 63
2010‐11 22 197 74 636 1722 49 35
2011‐12 23 227 95 678 1888 48 45
2012‐13 28 255 113 837 1999 71 21
2013‐14 9 299 137 1016 2087 40 22
2014‐15 39 339 181 1116 2360 42 44
2015‐16 0 361 165 1324 2320 5 49
2016‐17 0 439 170 1309 2452 2 39 89
0
200
400
600
800
1000
1200
1400
Asian/PI African American Hispanic
AP Participation by Ethnicity
2012‐13 2013‐14 2014‐15 2015‐16 2016‐17

70
AP Access and Equity
This information enables a school to see what percentage of students enrolled in grades 10, 11, and 12 scored 3 or higher on at least one AP Exam this year, a good indicator of both the equity and excellence of a school’s AP program. The graduating Class Summary shows what percentage of s schools twelfth graders scored a 3 or higher at any point in their high school years.
7.9 7.1
4.6
16.7
9.9
6.6 6.8
17.6
9.3 8.7
12.5
24.4
6.49.6 8.5
18.7
0
5
10
15
20
25
30
Sum of 10th Grade Sum of 11th Grade Sum of 12th Grade Sum of Graduating Class
Caney Creek High School
2014
2015
2016
2017
11.6
7.9
10.617.98
10.28.2
16.8
11.3
16.8 17
24.5
11.410.1 9.3
21.9
0
5
10
15
20
25
30
Sum of 10th Grade Sum of 11th Grade Sum of 12th Grade Sum of Graduating Class
Conroe High School
2014
2015
2016
2017
11.3 14.3 13.119.7
9.1
14.717.2
23.6
11.3
16.817
24.5
11.6
18.9
15
24.6
0
5
10
15
20
25
30
Sum of 10th Grade Sum of 11th Grade Sum of 12th Grade Sum of Graduating Class
Oak Ridge High School
2014
2015
2016
2017

71
24.6
36.834.2
43.9
25.5
37.134.7
46.5
27.2
39.5
32.9
46
23.2
34.1 32.8
47.7
0
10
20
30
40
50
60
Sum of 10th Grade Sum of 11th Grade Sum of 12th Grade Sum of Graduating Class
College Park High School
2014
2015
2016
2017
19.2
44.9
33.8
48.9
19.7
42.2 42.1
56
20.5
39.9 38.8
51
18
36.840
52.8
0
10
20
30
40
50
60
Sum of 10th Grade Sum of 11th Grade Sum of 12th Grade Sum of Graduating Class
The Woodlands High School
2014
2015
2016
2017

72
CISD AP Scholars
Recognizing Achievement Each September, the College Board recognizes the many high school students who have distinguished themselves academically by announcing AP award recipients. There are several types of awards granted for various levels of achievement. Although there is no monetary award in addition to receiving an award certificate, this achievement is acknowledged on any score report that is sent to colleges the following fall.
AP Scholar = Granted to students who receive grades of 3 or higher on three or more AP Exams.
AP Scholar with Honor = Granted to students who receive an average grade of at least 3.25 on all AP Exams taken, and grades of 3 or higher on four or more of these exams.
AP Scholar with Distinction = Granted to students who receive an average grade of at least 3.5 on all AP Exams taken, and grades of 3 or higher on five or more of these exams.
National AP Scholar = Granted to students in the United States who receive an average grade of at least 4 on all AP Exams taken, and grades of 4 or higher on eight or more of these exams.
State AP Scholar = Granted to the one male and one female student in each U.S. state and the District of Columbia with scores of 3 or higher on the greatest number of AP Exams, and then the highest average score (at least 3.5) on all AP Exams taken
AP Prep Conference
To assist CISD AP students on their AP exams, CISD has offered an AP Prep Conference in April for the past eleven years. The conference has been offered each year at a different CISD high school and offers students the opportunity to attend up to four sessions of their choice where they learn tips and content for the tests from Master CISD AP teachers. Students attending the AP Prep Conference receive an AP t‐shirt in recognition of their achievement in AP. In 2008, 445 students attended the prep conference. That number grew to 479 in 2009 and almost doubled in 2010 to 808, and had 900 students in 2011, in 2012 over 1000 students, and 2013 exceeded the previous year with over 1300 students. 2014 hosted a successful 1100 students, 2015 exceeded the previous year with a total of 1207 students, and 2016 registered well over 1250. This past April 2017, the conference topped over 1300 students.
237
137
563
111
61
215
190
199
444
30
55
91
0
0
0
1
2
3
0 200 400 600 800 1000 1200 1400
CCHS
CHS
ORHS
TWHS
TWCP
CISD
Scholar
Honor
Distinction
National
International

73
2017 Current CISD Campus Dual Credit Enrollment by Course The Conroe Independent School District has an ongoing relationship with Lone Star College Montgomery in offering dual credit and Work Force courses. These are classes taught for both high school and college credit at the same time. Instructors must be adjunct faculty members of the college. Here is a summary of the courses currently being taught at our CISD high schools. All credits earned in dual credit classes are transferable to any state university. LSC tuition is waived for dual credit courses. CISD students pay $72.00 per course in administrative fees. Traditional cost is approximately $210.00 per course for non‐dual credit students. The more college credits a student obtains in high school directly correlates student college retention and degree completion. CISD students are encouraged to cross the “20 college credit threshold” that is a key breaking point between students who complete a college degree and those who never finish college. Caney Creek, Conroe and Oak Ridge High Schools offer an Accelerated College Program as an opportunity for students to earn an Associate of Arts of Science degree. Oak Ridge High School is in the ninth year of their Accelerated College Program. Currently, Caney Creek and Conroe High Accelerated College are in their fourth year in the Accelerated College Program. In 2016‐2017, one student from Caney Creek and two students from Conroe High, and five students from Oak Ridge High School earned their Associates Degree with the CISD diploma. Factors affecting student participation in 2016‐2017 Dual Credit:
Availability of math and elective dual credit qualifying teachers on high school campuses.
Limited availability of dual credit courses offered on high school campuses.
More students are engaging in extra‐curricular activities which limits the flexibility in their high school schedule.
Campus Eng. 1301
Eng. 1302
Eng. 2332
Eng. 2333
Hist 1301
Hist 1302
Math 1314Spring Only
Speech 1315 Gov.
SPAN2311
Campus Totals F/S
Caney Creek 41 39 22 25 45 33 108/97
Conroe 135 123 91 100 139 107 30 105 11 481/360Oak Ridge 168 145 131 125 168 136 66 455/472
TWCP 119 77 120 85 36 73 285/225
TWHS 290 362 247 184 115 95 141 652/782
Total CISD 753 746 491 434 587 456 273 151 11
1981/1936
3917

74
CISD students participate in Dual Credit courses during the summer. The following chart includes college courses taken by CISD student’s during the summer of 2017
Dual Credit Summer 2017
Campus Eng. 1301
Eng. 1302
Eng. 2332
Bio. 1414
Hist 1301
Hist 1302
Campus Totals
District Summer School
16 78 78 172
Total summer 16 78 67 172
786760
335
252
492440
12873
15
0
100
200
300
400
500
600
700
800
900
Eng. 1301 Eng. 1302 Eng. 2332 Eng. 2333 Hist. 1301 Hist. 1302 Gov. 2305 Math 1314(Spring Only)
Speech
Spring 2015‐ Fall 2017 Dual Credit Enrollments by campus
Caney Creek HS Conore HS Oak Ridge HS TW College Park HS The Woodlands HS CISD Total

75
2014
Campus Eng. 1301
Eng. 1302
Eng. 2332
Eng. 2333
Hist 1301
Hist 1302
Math 1314 Spring Only
Psych 2301
Fall Only
Educ 1300 Spring Only
Campus TotalsF/S
Caney Creek 38 38 14 14 36 36 15 6 88/109
Conroe 83 83 65 65 80 80 15 228/243
Oak Ridge 88 88 83 83 83 83 29 254/283
TWCP 42 42 76 76 118/118TWHS 102 102 116 116 51 51 45 2 269/316
Total CISD 353 353 278 278 231 231 55 2 21 957/1069
2026
2013
Campus Eng. 1301
Eng. 1302
Eng. 2332
Eng. 2333
Hist 1301
Hist 1302
Math 1314 Spring Only
Psych 2301 Fall Only
Educ 1300 Spring Only
Aumt 1405/1407Spring Only
Campus Totals F/S
Caney Creek
18 18 34 34 17 17 27 26
69/122
Conroe 118 118 19 19 50 50 15 45 187/247
Oak Ridge
101 101 43 43 106 106 28
250/278
TWCP 63 63 58 58 121/121
TWHS 96 96 6 102/96
Total CISD
396 396 96 96 231 231 55 6 41 45 729/864
1593
2012
Campus Eng. 1301 Eng. 1302 Eng. 2332 Eng. 2333 Hist 1301 Hist 1302 Math 1314Spring Only
Campus Totals F/S
Caney Creek
62 62 22 22 47 47 25 131/156
Conroe 96 96 48 48 72 72 216/216
Oak Ridge 64 64 56 56 57 57 77 177/254
TWCP 111 111 60 60 171/171
TWHS 147 147 147/147
Total CISD 480 480 126 126 236 236 102 842/944
1786

76
Dual Credit Enrollment Trends (Fall Semesters only)
Campus Fall 2010
Fall 2011
Fall 2012
Fall 2013
Fall 2014
Fall 2015
Fall 2016
Fall 2017
CCHS 105 82 131 69 88 101 101 108
Conroe 251 253 216 187 228 314 477 481
Hauke 9
ORHS 290 175 177 250 254 380 423 455
TWCP 154 132 171 121 118 123 187 285
TWHS 150 191 147 102 269 603 669 652
Total 950 842 842 729 957 1,521 1742 1,981
Note: The Chart above includes Workforce dual credit data.
950
842 842
729
957
1,521
1857
1,981
700
900
1100
1300
1500
1700
1900
2100
2010 2011 2012 2013 2014 2015 2016 2017
Dual Credit Fall Enrollment TrendCISD Total

77
Certification and Work Force Programs Fall 2017
The Conroe ISD Career & Technical Education Program is pleased to announce the Annual Career Expo scheduled for Thursday, October 26, 2017 at the Lone Star Convention Center. This event provides our students and their families the opportunity to meet with business and industry representatives from Montgomery County. The goal of the Career Expo is to connect our students with Montgomery County career information and workforce opportunities that will enhance their successful transition into the workforce after graduation.
Certification Number of Certificates
Certification Number of Certificates
MOS Office Word 2013 448 Certified Pharmacy Tech 9
MOS Office Excel 2013 274 Certified SolidWorks Associate 12
MOS Office One Note 15 Cosmetology Operator License 4
MOS Office PowerPoint 2013 186 CPR/First Aid/AED 126
MOS Office Outlook 2013 47 OSHA 10 HR 395
MOS Office Access 2013 55 FEMA 23
MOS Office Word 2013 Expert Part 1
39 ServSafe Food Handlers Certificate 147
MOS Office Word 2013 Expert Part 2
33 ServSafe Mangers Certification 45
MOS Office Excel 2013 Expert Part 1 29 Texas Park & Wildlife Hunter Education Certificate
11
MOS Office Excel 2013 Expert Part 2 16 TSFA Floral Certification 1
AutoCAD Certified User – 20 20 TVMA Certified Veterinary Assistant Level
12
Autodesk Inventor Certified User 2 National Technical Honor Society 21
CCEI Child Care Education Institute 220
Total Certifications 2190
We began a partnership with Lone Star College Montgomery in the area of Work Force training in the 2008‐09 school year. We currently have students enrolled in three certificate programs: Welding, Phlebotomy and Certified Nurse’s Aide (CNA), and CNC (Computer Numeric Operation and Programming):
Program
Welding Phlebotomy Computer Numeric Controls Operation and Programming
Auto Tech Emerg Medical Technician
Enrollment 10 31 7 11 14

78
2016 CISD Graduate College Enrollment and Performance Report
What are the post‐secondary and workforce plans for our 2016 graduates? According to the class of 2016 Exit Survey, 79% of our graduates will enter a two or four‐year College or university. Less than 5% of our graduates reported attending vocational or technical schools or enlisting in the military. Fifteen percent of CISD graduates reported working full‐time or part‐time.
2%
2%
3%
5%
7%
28%
54%
0% 10% 20% 30% 40% 50% 60%
Voc/Tech School
Other
Military
Work part time
Work full time
2 Year College
4 Year College
2016 Graduate Post‐Secondary Plans
2%
3%
5%
7%
2%
28%
54%
0% 10% 20% 30% 40% 50% 60%
Other
Military
Work part time
Work full time
Voc/Tech School
2 Year College
4 Year College
2017 Graduate Post‐Secondary Plans

79
2%
2%
3%
5%
7%
28%
54%
0% 10% 20% 30% 40% 50% 60%
Voc/Tech School
Other
Military
Work part time
Work full time
2 Year College
4 Year College
2015 Graduate Post‐Secondary Plans
3%
3%
6%
7%
15%
27%
59%
0% 10% 20% 30% 40% 50% 60% 70%
Other
Military
Work part time
Work full time
Voc/Tech School
2 Year College
4 Year College
2014 Graduate Post‐Secondary Plans
2%
5%
6%
8%
2%
28%
57%
0% 10% 20% 30% 40% 50% 60%
Other
Military
Work part time
Work full time
Voc/Tech School
2 Year College
4 Year College
2013 Graduate Post‐Secondary Plans

80
2016 CISD Students College First Year Statistics
Institution # Students Avg. # Hours/Sem Avg. GPA
Baylor 53 15.52 3.17
Sam Houston State University 98 14.34 2.68
Stephen F. Austin University 22 13.45 2.69
Texas A&M 181 12.74 3.05
Texas Christian University 12 14.57 3.33
Texas State University 50 16.29 2.93
Texas Tech University 57 14.19 2.75
University of Houston 75 14.1 2.70
University of Oklahoma 28 14.68 3.43
University of Texas‐Arlington 11 14.36 3.08
University of Texas‐Austin 107 13.37 3.49
University of Texas‐Dallas 21 14.9 3.14
University of Texas‐San Antonio 74 14.34 3.18
Louisiana State University 10 13.4 2.93

81
10
11
12
21
22
28
50
53
57
74
75
98
107
181
0 20 40 60 80 100 120 140 160 180 200
Louisiana State University
University of Texas‐Arlington
Teas Christian University
University of Texas‐ Dallas
Stephen F. Austin University
University of Oklahoma
Texas State University
Baylor
Texas Tech
University of Texas‐San Antonio
University of Houston
Sam Houston State University
University of Texas‐Austin
Texas A&M
Class of 2015 College Attended
2
16
21
25
38
49
50
62
69
69
98
132
164
0 20 40 60 80 100 120 140 160 180
Texas Christian University
University of Texas‐Arlington
Stephen F. Austin University
University of Oklahoma
University of Texas‐ Dallas
University of Texas‐San Antonio
Baylor
Texas Tech
University of Houston
Texas State University
Sam Houston State University
University of Texas‐Austin
Texas A&M
Class of 2016 College Attended

82
11
16
22
22
25
49
52
66
67
69
78
123
123
167
0 20 40 60 80 100 120 140 160 180
Texas Christian University
Stephen F. Austin University
University of Texas‐ Dallas
Louisiana State University
University of Oklahoma
University of Texas‐San Antonio
Baylor
Texas State University
University of Houston
Texas Tech
Sam Houston State University
University of Texas‐Arlington
University of Texas‐Austin
Texas A&M
Class of 2014 Colleges Attended

83
CISD Class of 2016 Graduate Performance as Freshmen
How well are our CISD performing in college? The student performance is reported by each individual institution and may be different from the enrollment due to transfers throughout the academic year.
Caney Creek High School
Institution # Students Avg. # Hours/Sem Avg. GPA
Baylor 0 *** ***
Sam Houston State University 15 13 2.0
Stephen F. Austin University 5 15 2.82
Texas A&M 9 14 2.7
Texas Christian University 0 *** ***
Texas State University 2 14 2.74
Texas Tech University 0 *** ***
University of Houston 6 14.6 2.94
University of Oklahoma 0 *** ***
University of Texas‐Arlington 0 *** ***
University of Texas‐Austin 0 *** ***
University of Texas‐Dallas 0 *** ***
University of Texas‐San Antonio *** *** *** *Numbers only given for total CISD enrollment ***Information withheld – less than 5 students
Conroe High School
Institution # Students Avg. # Hours/Sem Avg. GPA
Baylor 6 14.8 3.27
Sam Houston State University 28 13.5 2.50
Stephen F. Austin University 3 14 2.37
Texas A&M 20 14 2.93
Texas Christian University * * *
Texas State University 13 13.5 2.32
Texas Tech University 5 13 2.73
University of Houston 3 12.5 1.41
University of Oklahoma 0 0 0
University of Texas‐Arlington 4 15 3.26
University of Texas‐Austin 10 14 3.06
University of Texas‐Dallas 0 0 0
University of Texas‐San Antonio 7 13 2.42 *Numbers only given for total CISD enrollment
*** Information withheld – less than 5 students

84
Oak Ridge High School
Institution # Students Avg. # Hours/Sem Avg. GPA
Baylor 5 15.6 3.02
Sam Houston State University 24 14 2.34
Stephen F. Austin University 8 14 2.87
Texas A&M 40 14 2.8
Texas Christian University * * *
Texas State University 26 12.5 2.57
Texas Tech University 12 14 2.91
University of Houston 18 14 2.50
University of Oklahoma 1 14 2.32
University of Texas‐Arlington 4 15 3.23
University of Texas‐Austin 19 13 3.02
University of Texas‐Dallas 5 14.8 2.55
University of Texas‐San Antonio 11 12 2.67 *Numbers only given for total CISD enrollment ***Information withheld – less than 5 students
The Woodlands College Park High School
Institution # Students Avg. # Hours/Sem Avg. GPA
Baylor 11 14.63 3.35
Sam Houston State University 12 14 2.75
Stephen F. Austin University 0 *** ***
Texas A&M 21 12.6 3.37
Texas Christian University * * *
Texas State University 12 13.5 3.09
Texas Tech University 17 14 3.18
University of Houston 20 14.1 2.62
University of Oklahoma 8 14.5 3.22
University of Texas‐Arlington 4 15 3.16
University of Texas‐Austin 46 13.5 3.51
University of Texas‐Dallas 8 14.36 3.5
University of Texas‐San Antonio 11 14 3.12 *Numbers only given for total CISD enrollment ***Information withheld – less than 5 students

85
The Woodlands High School
Institution # Students Avg. # Hours/Sem Avg. GPA
Baylor 28 15.2 3.45
Sam Houston State University 19 14.5 2.97
Stephen F. Austin University 5 15 3.33
Texas A&M 74 12.4 3.32
Texas Christian University * * *
Texas State University 16 14 2.93
Texas Tech University 28 14 3.06
University of Houston 22 14.4 2.62
University of Oklahoma 16 14.5 3.38
University of Texas‐Arlington 4 15.5 3.83
University of Texas‐Austin 57 13 3.43
University of Texas‐Dallas 25 14.29 3.06
University of Texas‐San Antonio 20 13 2.94 *Numbers only given for total CISD enrollment ***Information withheld – less than 5 students
CISD
Institution # Students Avg. # Hours/Sem Avg. GPA
Baylor 50 15.06 3.36
Sam Houston State University 98 13.8 2.50
Stephen F. Austin University 21 14.47 2.89
Texas A&M 164 13.09 3.11
Texas Christian University 2 15 3.63
Texas State University 69 13 2.70
Texas Tech University 62 13.91 3.03
University of Houston 69 14.1 2.56
University of Oklahoma 25 14.48 3.28
University of Texas‐Arlington 16 15.13 3.37
University of Texas‐Austin 132 13.25 3.37
University of Texas‐Dallas 38 14.37 3.08
University of Texas‐San Antonio 49 13 2.84 *Numbers only given for total CISD enrollment ***Information withheld – less than 5 students

86
Class of 2016 – Colleges Attending
In‐State Four‐Year
Abilene Christian University Texas A&M University, Galveston
Angelo State University Texas A&M University, Kingsville
Arlington Baptist College Texas A&M University, Texarkana
Austin College Texas A&M University‐Corpus Christi
Baylor University Texas A&M University‐Kingsville
Concordia University Texas Texas Christian University
Dallas Baptist University Texas Lutheran University
East Texas Baptist University Texas Southern University
Harding University Texas Tech University
Hardin‐Simmons University Texas Woman's University
Houston Baptist University The University of Texas at Arlington
Lamar University The University of Texas at Austin
LeTourneau University The University of Texas at San Antonio
Mary Hardin Baylor The University of Texas, Arlington
Midwestern State University The University of Texas, Austin
Prairie View A&M University The University of Texas, Dallas
Rice University The University of Texas, El Paso
Sam Houston State University The University of Texas, San Antonio
Sam Houston State University The University of Texas, Tyler
Schreiner University Trinity University
Southern Methodist University University of Dallas
Southwestern University University of Houston
St. Edwards University University of Houston, Clear Lake
Stephen F. Austin State University University of Houston, Downtown
Stephen F. State University University of Houston‐Main Campus
Tarleton State University University of Houston‐Victoria
Texas A&M University University of Mary Hardin‐Baylor
Texas A&M University at Galveston University of North Texas
Texas A&M University, Commerce University of St. Thomas
Texas A&M University, Corpus Christi West Texas A&M University

87
In‐State Two‐Year
Alvin Community College
Angelina College
Austin Community College
Blinn College
Cedar Valley College
Galveston College
Houston Community College System
Kilgore College
Lone Star Coll ‐ Kingwood
Lone Star Coll ‐ Montgomery
Lone Star Coll ‐ North Harris
Lone Star Coll ‐ Tomball
Lone Star College
Lone Star College ‐ Montgomery
McLennan Community College
Navarro College
North Central College
Northeast Texas Community College
Paris Junior College
Pratt Community College
Ranger College
San Antonio College
San Jacinto College
San Jacinto College, Central
Tarrant County College District
Temple College
Texas State Technical College, Abilene
Texas State Technical College, Waco
The Art Institute of Houston
Trinity Valley Community College
Tyler Junior College
Weatherford College

88
Out‐of‐State – Four Year
Adams State University Purchase College State University of New York
Albion College Purdue University
American Musical and Dramatic Academy (AMDA) Reed College
American University Rensselaer Polytechnic Institute
Appalachian State University Rider University
Arizona State University Rogers State University
Auburn University Rollins College
Belhaven University Roosevelt University
Belmont University Rutgers University‐New Brunswick
Berklee College of Music San Diego State University
Bethany College Savannah College of Art and Design
Biola University Southeastern Louisiana University
Boise State University Southern Virginia University
Boston College St. Olaf College
Boston Conservatory at Berklee Stanford University
Boston University Sterling College
Brigham Young University Suffolk University
Brigham Young University, Idaho Syracuse University
Brigham Young University‐Hawaii The Evergreen State College
California Baptist University The George Washington University
California North State University The Los Angeles Film School
California Polytechnic State University, San Luis Obispo The Ohio State University
California State University, Monterey Bay The University of Mississippi
California State University, San Marcos The University of Alabama
Campbell University The University of Alabama in Huntsville
Carnegie Mellon University The University of Arizona
Centenary College of Louisiana The University of Iowa
Central Michigan University The University of North Carolina at Chapel Hill
College for Creative Studies The University of Oklahoma
College of Charleston The University of Vermont
College of the Holy Cross Tulane University
Colorado Christian University United States Air Force Academy
Colorado College United States Coast Guard Academy
Colorado Mesa University United States Merchant Marine Academy
Colorado School of Mines United States Military Academy
Colorado State University United States Naval Academy
Columbia College Chicago Unity College
Cornell University University of Alabama
DePauw University University of Arkansas
Dordt College University of Arkansas at Fort Smith
Drexel University University of California Berkeley
Embry‐Riddle Aeronautical University ‐ Prescott University of California, Davis
Emerson College University of California, Irvine

89
Out‐of‐State – Four Year (cont.) Fashion Institute of Technology University of Central Arkansas
Florida College University of Central Florida
Florida Gulf Coast University University of Chicago
Florida State University University of Cincinnati
Fordham University University of Colorado at Boulder
Full Sail University University of Colorado at Denver
Georgetown University University of Colorado Springs
Gonzaga University University of Delaware
Goucher College University of Denver
Grambling State University University of Florida
Harding University University of Hawaii Hilo
Hendrix College University of Illinois at Urbana‐Champaign
Hillsdale College University of Kansas
Howard University University of Kentucky
Indiana University at Bloomington University of Louisiana
Iowa State University University of Louisville
Ithaca College University of Maryland, College Park
Jackson State University University of Massachusetts, Amherst
Johns Hopkins University University of Michigan
Kansas State University University of Mississippi
Kingsborough Community College of the CUNY University of Missouri Columbia
Laguna College of Art and Design University of Montevallo
Louisiana State University University of Mount Union
Louisiana Tech University University of Nevada, Las Vegas
Loyola University Chicago University of North Carolina at Wilmington
Massachusetts College of Pharmacy & Health Sciences University of North Dakota
Massachusetts Institute of Technology University of Notre Dame
McNeese State University University of Pennsylvania
McPherson College University of Portland
Mercyhurst University University of San Diego
Miami University, Oxford University of San Francisco
Michigan State University University of South Alabama
Milwaukee Institute of Art and Design University of South Carolina
Mississippi State University University of South Florida, Tampa
Montana State University Bozeman University of Southern California
Murray State University University of Southern Mississippi
New York University University of Tennessee, Knoxville
Newcastle University University of Tulsa
North Carolina State University University of Utah
North Park University University of Virginia
Northeastern University University of Washington
Northern Arizona University University of Wisconsin, Madison
Nova Southeastern University University of Wisconsin, River Falls

90
Out‐of‐State – Four Year (cont.) Oklahoma Baptist University Utah State University
Oklahoma City University Virginia Military Institute
Oklahoma State University Virginia Tech
Oral Roberts University Wake Forest University
Oral Roberts University Washington University in St. Louis
Otis College of Art and Design West Virginia University
Penn State‐Abington Wichita State University
Pennsylvania State University Wingate University
Pittsburg State University Winthrop University
Pratt Institute
Out of State Two‐Year
Allen County Community College
Arkansas Northeastern College
Borough of Manhattan Community College of the CUNY
Bossier Parish Community College
Community College of Philadelphia
Cottey College
Garden City Community College
Ivy Tech Community College
Nassau Community College
Neuchatel Junior College
Sacramento City College
Saddleback College
San Diego City College
Santa Monica College
St. Petersburg College
Tech/Specialty
Aveda Institute, Houston
Culinary Institute LeNotre
Lamar Institute of Technology
Lincoln Technical Institute
Make‐up Designory ‐ New York
Texas State Tech College Waco
The Culinary Institute of America ‐ TX
Tulsa Welding School
Universal Technical Institute

91
Out of Country
Alberta College of Art and Design
Bishop's University
Franklin University Switzerland
Hult International Business School ‐ London
Instituto Tecnologico y de Estudios Superiores de Monterrey, Campus Guadalajara
Instituto Tecnologico y de Estudios Superiores de Monterrey, Campus Toluca
Temple University Japan
Tsinghua University
Universidad Autonoma De Nuevo Leon
Universidad CEU San Pablo
Universidad de las Americas Puebla
Universidad de Navarra
Universidad Francisco de Vitoria
Universidad Latina de Panama
Universitat de Barcelona
Universiteit van Amsterdam
University of Alberta
University of British Columbia
University of London
University of Puerto Rico, Humacao
University of Sydney
University of Toronto
University of Victoria