performance report primergy tx200 s7 -...
TRANSCRIPT
WHITE PAPER PERFORMANCE REPORT PRIMERGY TX200 S7
© Fujitsu Technology Solutions 2012 Page 1 (34)
WHITE PAPER FUJITSU PRIMERGY SERVERS PERFORMANCE REPORT PRIMERGY TX200 S7
This document contains a summary of the benchmarks executed for the PRIMERGY TX200 S7.
The PRIMERGY TX200 S7 performance data are compared with the data of other PRIMERGY models and discussed. In addition to the benchmark results, an explanation has been included for each benchmark and for the benchmark environment.
Version
1.1
2012-10-04
WHITE PAPER PERFORMANCE REPORT PRIMERGY TX200 S7 VERSION: 1.1 2012-10-04
Page 2 (34) © Fujitsu Technology Solutions 2012
Contents
Document history
Version 1.0
New:
Technical data SPECcpu2006
Measurements with processors of Xeon series E5-2400 SPECpower_ssj2008
Measurement with Oracle Java HotSpot VM OLTP-2
Results for Xeon E5-2400 processor series STREAM
Measurements with processors of Xeon series E5-2400 LINPACK
Measurements with processors of Xeon series E5-2400
Version 1.1
New:
Disk I/O Measurements with ―LSI SW RAID on Intel C600 (Onboard SATA)‖, ―LSI SW RAID on Intel C600 (Onboard SAS)‖, ―RAID Ctrl SAS 6G 0/1‖,―RAID Ctrl SAS 5/6 512MB (D2616)‖ and ―RAID Ctrl SAS 6G 5/6 1GB (D3116)‖ controllers
Updated:
SPECpower_ssj2008 Measurement with IBM J9 VM
LINPACK Measurement with Xeon E5-2450
Document history ................................................................................................................................................ 2
Technical data .................................................................................................................................................... 3
SPECcpu2006 .................................................................................................................................................... 6
SPECpower_ssj2008 ........................................................................................................................................ 12
Disk-I/O ............................................................................................................................................................. 18
OLTP-2 ............................................................................................................................................................. 25
STREAM ........................................................................................................................................................... 29
LINPACK .......................................................................................................................................................... 31
Literature ........................................................................................................................................................... 33
Contact ............................................................................................................................................................. 34
WHITE PAPER PERFORMANCE REPORT PRIMERGY TX200 S7 VERSION: 1.1 2012-10-04
© Fujitsu Technology Solutions 2012 Page 3 (34)
Technical data
Decimal prefixes according to the SI standard are used for measurement units in this white paper (e.g. 1 GB = 10
9 bytes). In contrast, these prefixes should be interpreted as binary prefixes (e.g. 1 GB = 2
30 bytes) for
the capacities of caches and storage modules. Separate reference will be made to any further exceptions where applicable.
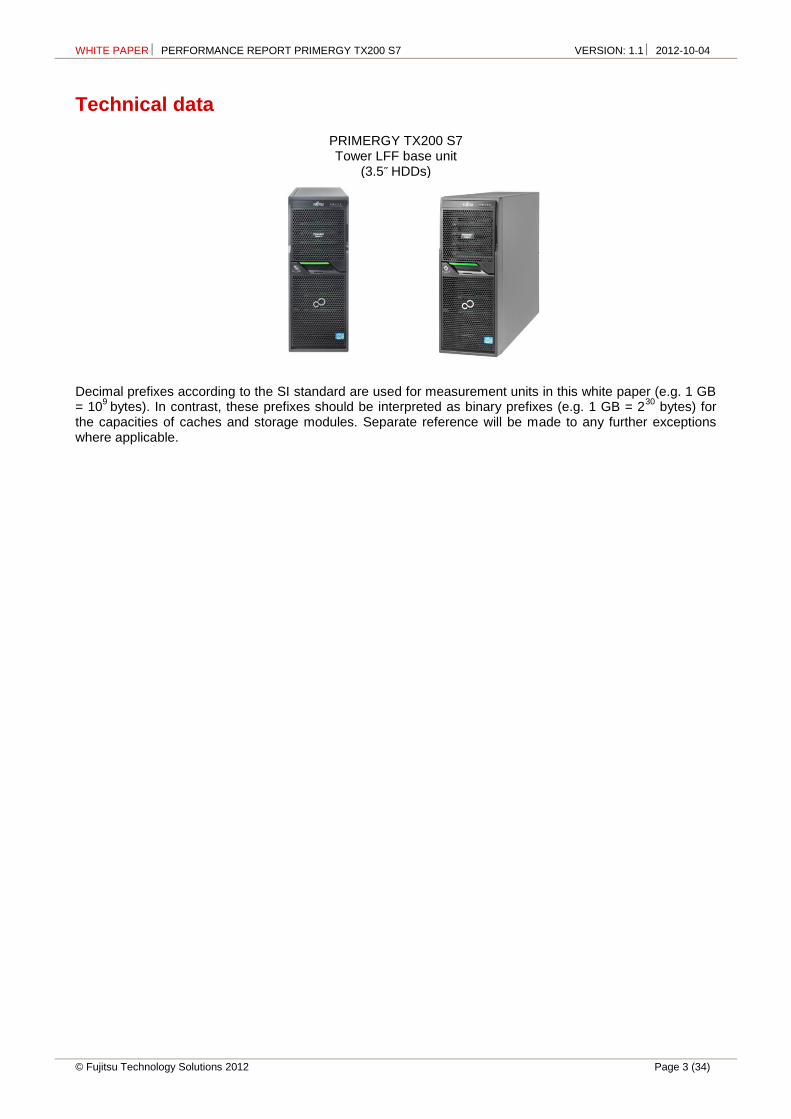
PRIMERGY TX200 S7 Tower LFF base unit
(3.5˝ HDDs)
WHITE PAPER PERFORMANCE REPORT PRIMERGY TX200 S7 VERSION: 1.1 2012-10-04
Page 4 (34) © Fujitsu Technology Solutions 2012
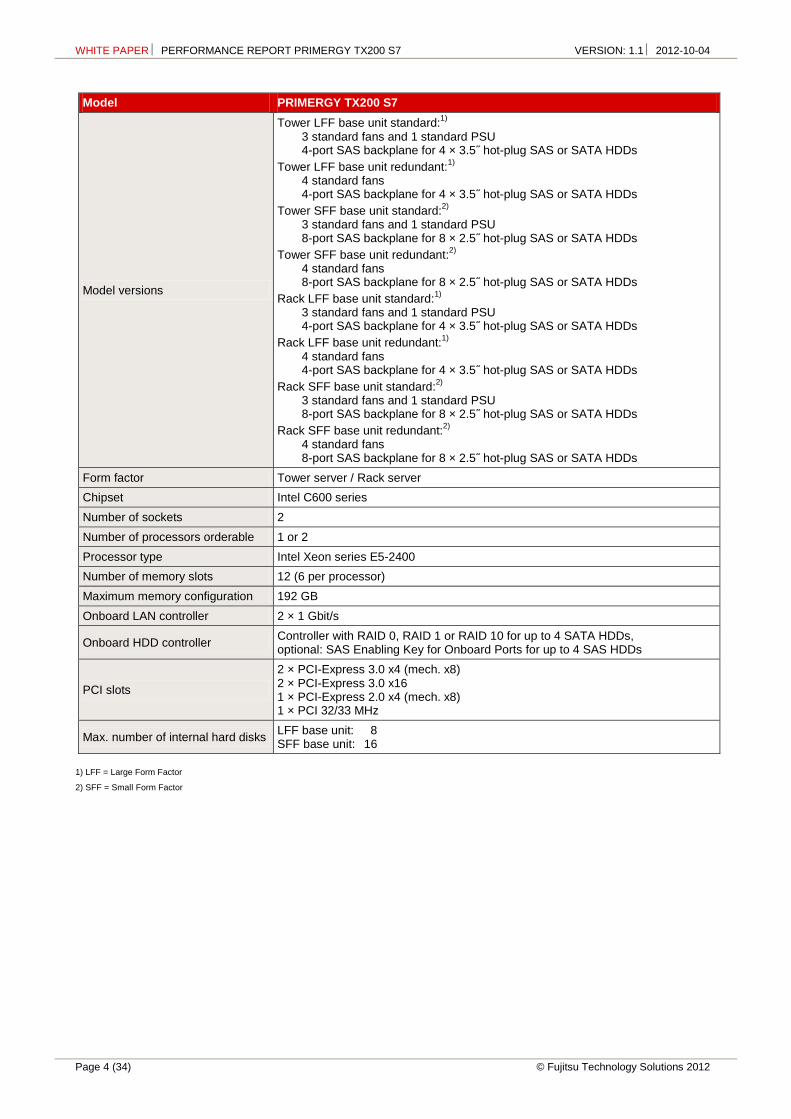
Model PRIMERGY TX200 S7
Model versions
Tower LFF base unit standard:1)
3 standard fans and 1 standard PSU 4-port SAS backplane for 4 × 3.5˝ hot-plug SAS or SATA HDDs
Tower LFF base unit redundant:1)
4 standard fans 4-port SAS backplane for 4 × 3.5˝ hot-plug SAS or SATA HDDs
Tower SFF base unit standard:2)
3 standard fans and 1 standard PSU 8-port SAS backplane for 8 × 2.5˝ hot-plug SAS or SATA HDDs
Tower SFF base unit redundant:2)
4 standard fans 8-port SAS backplane for 8 × 2.5˝ hot-plug SAS or SATA HDDs
Rack LFF base unit standard:1)
3 standard fans and 1 standard PSU 4-port SAS backplane for 4 × 3.5˝ hot-plug SAS or SATA HDDs
Rack LFF base unit redundant:1)
4 standard fans 4-port SAS backplane for 4 × 3.5˝ hot-plug SAS or SATA HDDs
Rack SFF base unit standard:2)
3 standard fans and 1 standard PSU 8-port SAS backplane for 8 × 2.5˝ hot-plug SAS or SATA HDDs
Rack SFF base unit redundant:2)
4 standard fans 8-port SAS backplane for 8 × 2.5˝ hot-plug SAS or SATA HDDs
Form factor Tower server / Rack server
Chipset Intel C600 series
Number of sockets 2
Number of processors orderable 1 or 2
Processor type Intel Xeon series E5-2400
Number of memory slots 12 (6 per processor)
Maximum memory configuration 192 GB
Onboard LAN controller 2 × 1 Gbit/s
Onboard HDD controller Controller with RAID 0, RAID 1 or RAID 10 for up to 4 SATA HDDs, optional: SAS Enabling Key for Onboard Ports for up to 4 SAS HDDs
PCI slots
2 × PCI-Express 3.0 x4 (mech. x8) 2 × PCI-Express 3.0 x16 1 × PCI-Express 2.0 x4 (mech. x8) 1 × PCI 32/33 MHz
Max. number of internal hard disks LFF base unit: 8 SFF base unit: 16
1) LFF = Large Form Factor
2) SFF = Small Form Factor
WHITE PAPER PERFORMANCE REPORT PRIMERGY TX200 S7 VERSION: 1.1 2012-10-04
© Fujitsu Technology Solutions 2012 Page 5 (34)
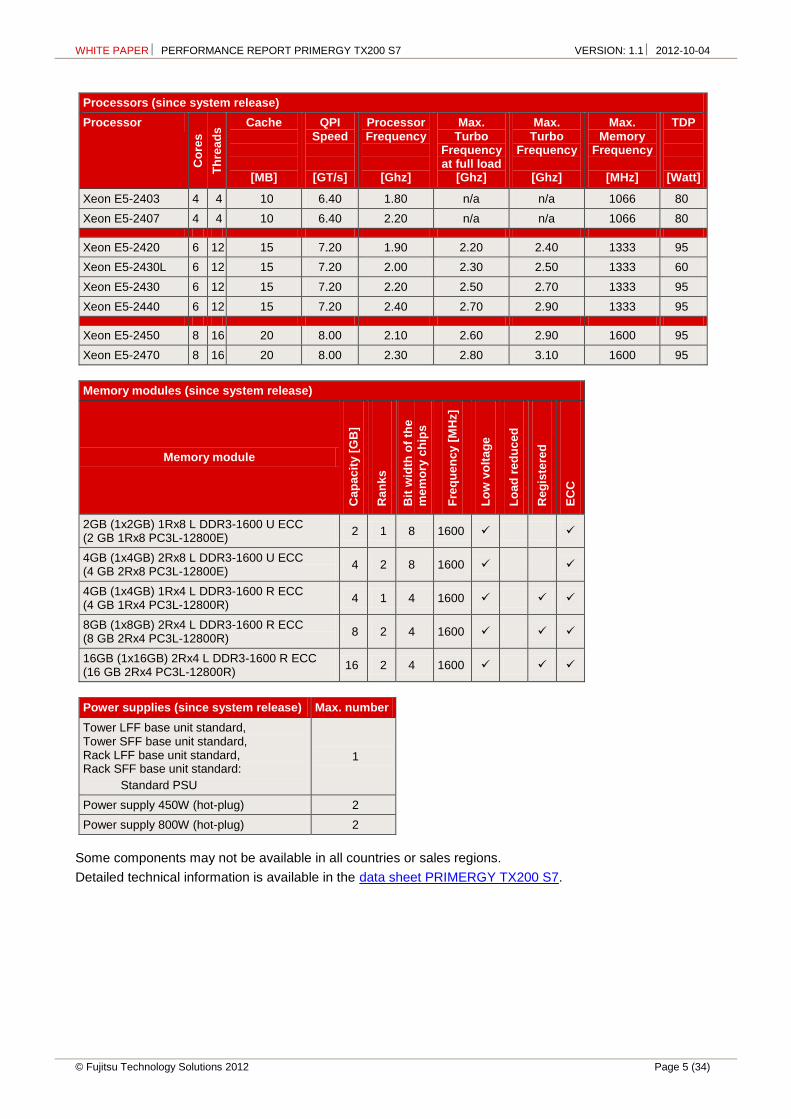
Processors (since system release)
Processor
Co
res
Th
rea
ds Cache
[MB]
QPI Speed
[GT/s]
Processor Frequency
[Ghz]
Max. Turbo
Frequency at full load
[Ghz]
Max. Turbo
Frequency
[Ghz]
Max. Memory
Frequency
[MHz]
TDP
[Watt]
Xeon E5-2403 4 4 10 6.40 1.80 n/a n/a 1066 80
Xeon E5-2407 4 4 10 6.40 2.20 n/a n/a 1066 80
Xeon E5-2420 6 12 15 7.20 1.90 2.20 2.40 1333 95
Xeon E5-2430L 6 12 15 7.20 2.00 2.30 2.50 1333 60
Xeon E5-2430 6 12 15 7.20 2.20 2.50 2.70 1333 95
Xeon E5-2440 6 12 15 7.20 2.40 2.70 2.90 1333 95
Xeon E5-2450 8 16 20 8.00 2.10 2.60 2.90 1600 95
Xeon E5-2470 8 16 20 8.00 2.30 2.80 3.10 1600 95
Memory modules (since system release)
Memory module
Cap
ac
ity [
GB
]
Ran
ks
Bit
wid
th o
f th
e
me
mo
ry c
hip
s
Fre
qu
en
cy
[M
Hz]
Lo
w v
olt
ag
e
Lo
ad
red
uc
ed
Reg
iste
red
EC
C
2GB (1x2GB) 1Rx8 L DDR3-1600 U ECC (2 GB 1Rx8 PC3L-12800E)
2 1 8 1600
4GB (1x4GB) 2Rx8 L DDR3-1600 U ECC (4 GB 2Rx8 PC3L-12800E)
4 2 8 1600
4GB (1x4GB) 1Rx4 L DDR3-1600 R ECC (4 GB 1Rx4 PC3L-12800R)
4 1 4 1600
8GB (1x8GB) 2Rx4 L DDR3-1600 R ECC (8 GB 2Rx4 PC3L-12800R)
8 2 4 1600
16GB (1x16GB) 2Rx4 L DDR3-1600 R ECC (16 GB 2Rx4 PC3L-12800R)
16 2 4 1600
Power supplies (since system release) Max. number
Tower LFF base unit standard, Tower SFF base unit standard, Rack LFF base unit standard, Rack SFF base unit standard:
Standard PSU
1
Power supply 450W (hot-plug) 2
Power supply 800W (hot-plug) 2
Some components may not be available in all countries or sales regions.
Detailed technical information is available in the data sheet PRIMERGY TX200 S7.

WHITE PAPER PERFORMANCE REPORT PRIMERGY TX200 S7 VERSION: 1.1 2012-10-04
Page 6 (34) © Fujitsu Technology Solutions 2012
SPECcpu2006
Benchmark description
SPECcpu2006 is a benchmark which measures the system efficiency with integer and floating-point operations. It consists of an integer test suite (SPECint2006) containing 12 applications and a floating-point test suite (SPECfp2006) containing 17 applications. Both test suites are extremely computing-intensive and concentrate on the CPU and the memory. Other components, such as Disk I/O and network, are not measured by this benchmark.
SPECcpu2006 is not tied to a special operating system. The benchmark is available as source code and is compiled before the actual measurement. The used compiler version and their optimization settings also affect the measurement result.
SPECcpu2006 contains two different performance measurement methods: the first method (SPECint2006 or SPECfp2006) determines the time which is required to process single task. The second method (SPECint_rate2006 or SPECfp_rate2006) determines the throughput, i.e. the number of tasks that can be handled in parallel. Both methods are also divided into two measurement runs, ―base‖ and ―peak‖ which differ in the use of compiler optimization. When publishing the results the base values are always used; the peak values are optional.
Benchmark Arithmetics Type Compiler optimization
Measurement result
Application
SPECint2006 integer peak aggressive Speed single-threaded
SPECint_base2006 integer base conservative
SPECint_rate2006 integer peak aggressive Throughput multi-threaded
SPECint_rate_base2006 integer base conservative
SPECfp2006 floating point peak aggressive Speed single-threaded
SPECfp_base2006 floating point base conservative
SPECfp_rate2006 floating point peak aggressive Throughput multi-threaded
SPECfp_rate_base2006 floating point base conservative
The measurement results are the geometric average from normalized ratio values which have been determined for individual benchmarks. The geometric average - in contrast to the arithmetic average - means that there is a weighting in favour of the lower individual results. Normalized means that the measurement is how fast is the test system compared to a reference system. Value ―1‖ was defined for the SPECint_base2006-, SPECint_rate_base2006, SPECfp_base2006 and SPECfp_rate_base2006 results of the reference system. For example, a SPECint_base2006 value of 2 means that the measuring system has handled this benchmark twice as fast as the reference system. A SPECfp_rate_base2006 value of 4 means that the measuring system has handled this benchmark some 4/[# base copies] times faster than the reference system. ―# base copies‖ specify how many parallel instances of the benchmark have been executed.
Not every SPECcpu2006 measurement is submitted by us for publication at SPEC. This is why the SPEC web pages do not have every result. As we archive the log files for all measurements, we can prove the correct implementation of the measurements at any time.
WHITE PAPER PERFORMANCE REPORT PRIMERGY TX200 S7 VERSION: 1.1 2012-10-04
© Fujitsu Technology Solutions 2012 Page 7 (34)
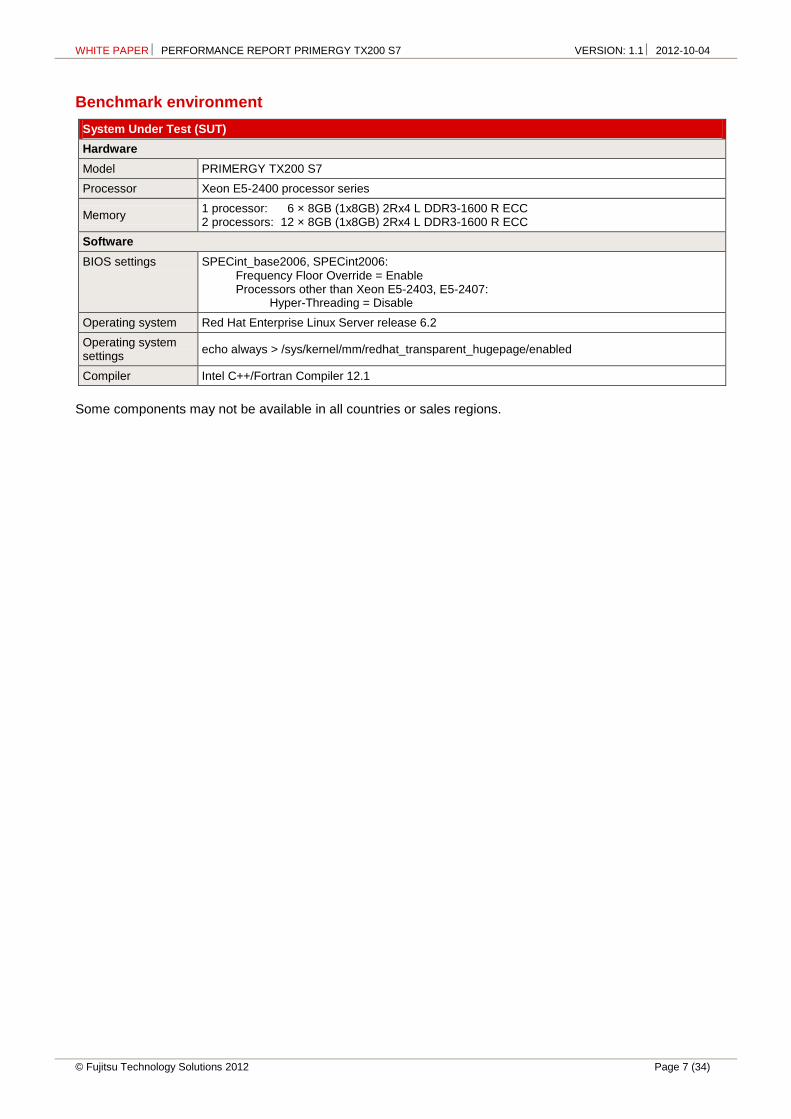
Benchmark environment
System Under Test (SUT)
Hardware
Model PRIMERGY TX200 S7
Processor Xeon E5-2400 processor series
Memory 1 processor: 6 × 8GB (1x8GB) 2Rx4 L DDR3-1600 R ECC 2 processors: 12 × 8GB (1x8GB) 2Rx4 L DDR3-1600 R ECC
Software
BIOS settings SPECint_base2006, SPECint2006: Frequency Floor Override = Enable Processors other than Xeon E5-2403, E5-2407:
Hyper-Threading = Disable
Operating system Red Hat Enterprise Linux Server release 6.2
Operating system settings
echo always > /sys/kernel/mm/redhat_transparent_hugepage/enabled
Compiler Intel C++/Fortran Compiler 12.1
Some components may not be available in all countries or sales regions.
WHITE PAPER PERFORMANCE REPORT PRIMERGY TX200 S7 VERSION: 1.1 2012-10-04
Page 8 (34) © Fujitsu Technology Solutions 2012
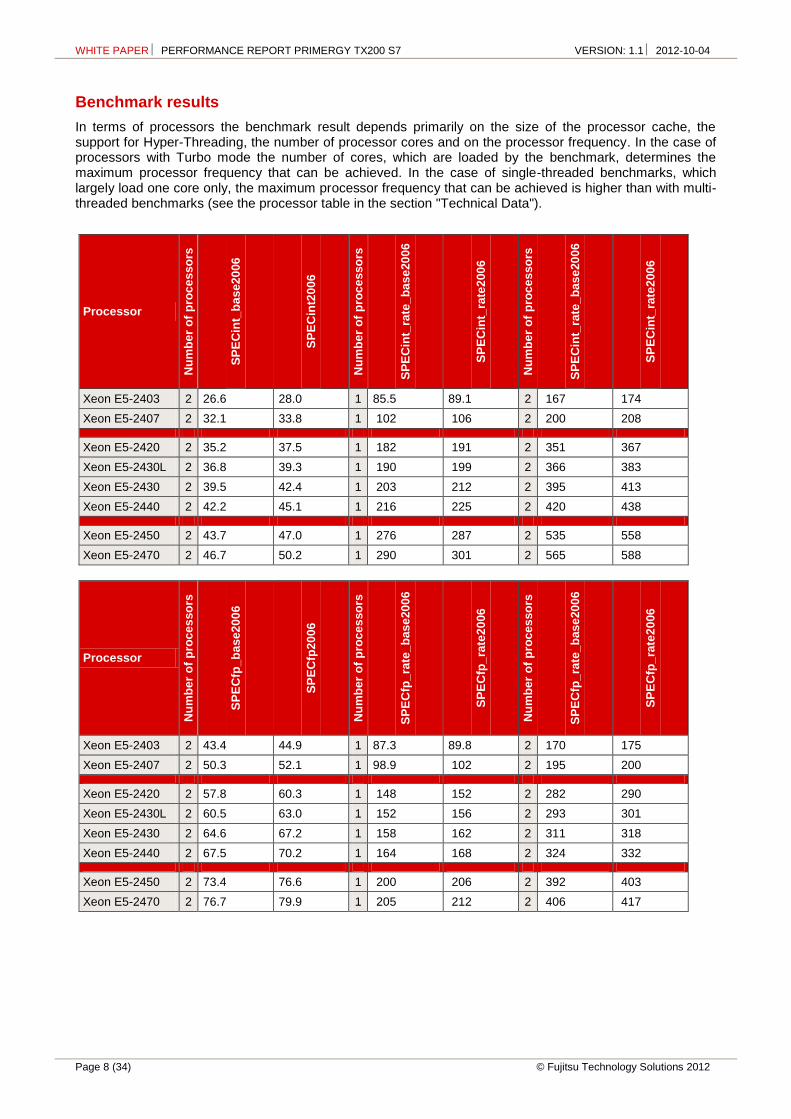
Benchmark results
In terms of processors the benchmark result depends primarily on the size of the processor cache, the support for Hyper-Threading, the number of processor cores and on the processor frequency. In the case of processors with Turbo mode the number of cores, which are loaded by the benchmark, determines the maximum processor frequency that can be achieved. In the case of single-threaded benchmarks, which largely load one core only, the maximum processor frequency that can be achieved is higher than with multi-threaded benchmarks (see the processor table in the section "Technical Data").
Processor
Nu
mb
er
of
pro
ce
sso
rs
SP
EC
int_
ba
se2
006
SP
EC
int2
00
6
Nu
mb
er
of
pro
ce
sso
rs
SP
EC
int_
rate
_b
as
e20
06
SP
EC
int_
rate
200
6
Nu
mb
er
of
pro
ce
sso
rs
SP
EC
int_
rate
_b
as
e20
06
SP
EC
int_
rate
200
6
Xeon E5-2403 2 26.6 28.0 1 85.5 89.1 2 167 174
Xeon E5-2407 2 32.1 33.8 1 102 106 2 200 208
Xeon E5-2420 2 35.2 37.5 1 182 191 2 351 367
Xeon E5-2430L 2 36.8 39.3 1 190 199 2 366 383
Xeon E5-2430 2 39.5 42.4 1 203 212 2 395 413
Xeon E5-2440 2 42.2 45.1 1 216 225 2 420 438
Xeon E5-2450 2 43.7 47.0 1 276 287 2 535 558
Xeon E5-2470 2 46.7 50.2 1 290 301 2 565 588
Processor
Nu
mb
er
of
pro
ce
sso
rs
SP
EC
fp_
ba
se2
00
6
SP
EC
fp2
00
6
Nu
mb
er
of
pro
ce
sso
rs
SP
EC
fp_
rate
_b
as
e20
06
SP
EC
fp_
rate
20
06
Nu
mb
er
of
pro
ce
sso
rs
SP
EC
fp_
rate
_b
as
e20
06
SP
EC
fp_
rate
20
06
Xeon E5-2403 2 43.4 44.9 1 87.3 89.8 2 170 175
Xeon E5-2407 2 50.3 52.1 1 98.9 102 2 195 200
Xeon E5-2420 2 57.8 60.3 1 148 152 2 282 290
Xeon E5-2430L 2 60.5 63.0 1 152 156 2 293 301
Xeon E5-2430 2 64.6 67.2 1 158 162 2 311 318
Xeon E5-2440 2 67.5 70.2 1 164 168 2 324 332
Xeon E5-2450 2 73.4 76.6 1 200 206 2 392 403
Xeon E5-2470 2 76.7 79.9 1 205 212 2 406 417

WHITE PAPER PERFORMANCE REPORT PRIMERGY TX200 S7 VERSION: 1.1 2012-10-04
© Fujitsu Technology Solutions 2012 Page 9 (34)
The following four diagrams illustrate the throughput of the PRIMERGY TX200 S7 in comparison to its predecessor PRIMERGY TX200 S6, in their respective most performant configuration.
SPECint_rate_base2006
SPECint_rate2006
0
100
200
300
400
500
600
PRIMERGY TX200 S62 x Xeon X5670
PRIMERGY TX200 S72 x Xeon E5-2470
337
565
360
588
SPECint_base2006
SPECint2006
0
10
20
30
40
50
60
PRIMERGY TX200 S62 x Xeon X5670
PRIMERGY TX200 S72 x Xeon E5-2470
36.6
46.7
39.5
50.2
SPECcpu2006: integer performance PRIMERGY TX200 S7 vs. PRIMERGY TX200 S6
SPECcpu2006: integer performance PRIMERGY TX200 S7 vs. PRIMERGY TX200 S6

WHITE PAPER PERFORMANCE REPORT PRIMERGY TX200 S7 VERSION: 1.1 2012-10-04
Page 10 (34) © Fujitsu Technology Solutions 2012
SPECfp_rate_base2006
SPECfp_rate2006
0
50
100
150
200
250
300
350
400
450
PRIMERGY TX200 S62 x Xeon X5670
PRIMERGY TX200 S72 x Xeon E5-2470
241
406
248
417
SPECfp_base2006
SPECfp2006
0
10
20
30
40
50
60
70
80
PRIMERGY TX200 S62 x Xeon X5670
PRIMERGY TX200 S72 x Xeon E5-2470
42.5
76.7
45.5
79.9
SPECcpu2006: floating-point performance PRIMERGY TX200 S7 vs. PRIMERGY TX200 S6
SPECcpu2006: floating-point performance PRIMERGY TX200 S7 vs. PRIMERGY TX200 S6
WHITE PAPER PERFORMANCE REPORT PRIMERGY TX200 S7 VERSION: 1.1 2012-10-04
© Fujitsu Technology Solutions 2012 Page 11 (34)
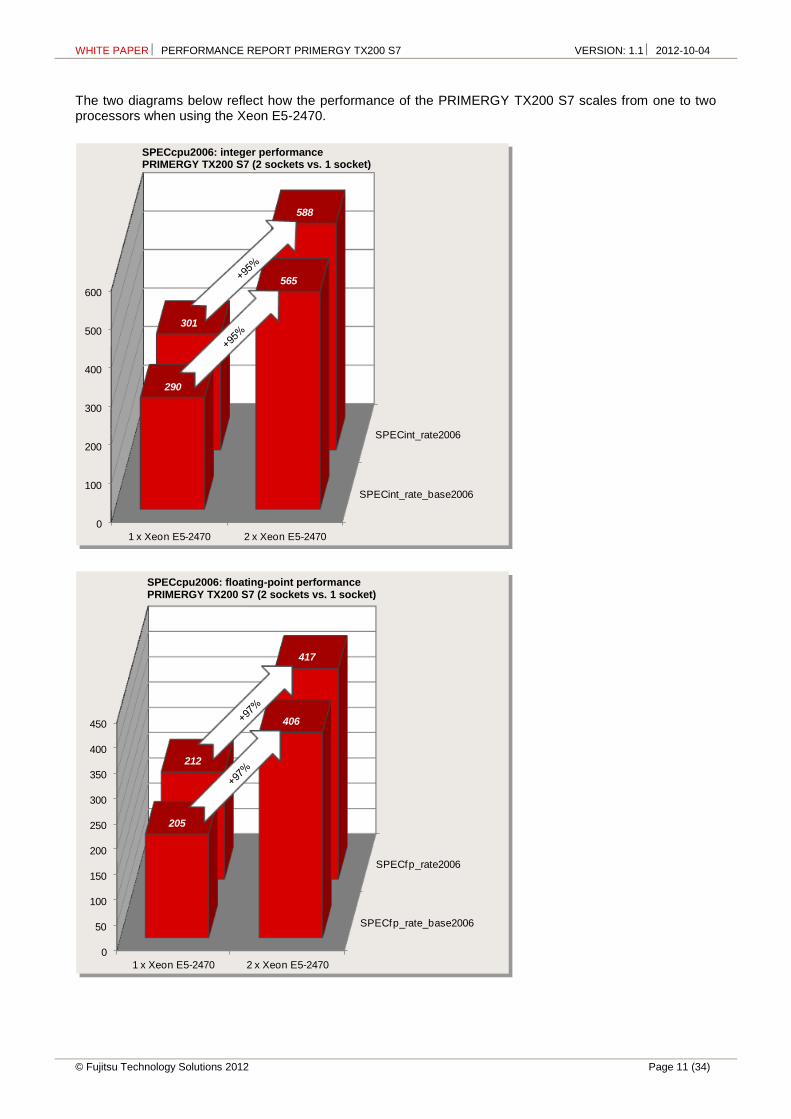
The two diagrams below reflect how the performance of the PRIMERGY TX200 S7 scales from one to two processors when using the Xeon E5-2470.
SPECfp_rate_base2006
SPECfp_rate2006
0
50
100
150
200
250
300
350
400
450
1 x Xeon E5-2470 2 x Xeon E5-2470
205
406
212
417
SPECint_rate_base2006
SPECint_rate2006
0
100
200
300
400
500
600
1 x Xeon E5-2470 2 x Xeon E5-2470
290
565
301
588
SPECcpu2006: integer performance PRIMERGY TX200 S7 (2 sockets vs. 1 socket)
SPECcpu2006: floating-point performance PRIMERGY TX200 S7 (2 sockets vs. 1 socket)

WHITE PAPER PERFORMANCE REPORT PRIMERGY TX200 S7 VERSION: 1.1 2012-10-04
Page 12 (34) © Fujitsu Technology Solutions 2012
SPECpower_ssj2008
Benchmark description
SPECpower_ssj2008 is the first industry-standard SPEC benchmark that evaluates the power and performance characteristics of a server. With SPECpower_ssj2008 SPEC has defined standards for server power measurements in the same way they have done for performance.
The benchmark workload represents typical server-side Java business applications. The workload is scalable, multi-threaded, portable across a wide range of platforms and easy to run. The benchmark tests CPUs, caches, the memory hierarchy and scalability of symmetric multiprocessor systems (SMPs), as well as the implementation of Java Virtual Machine (JVM), Just In Time (JIT) compilers, garbage collection, threads and some aspects of the operating system.
SPECpower_ssj2008 reports power consumption for servers at different performance levels — from 100% to ―active idle‖ in 10% segments — over a set period of time. The graduated workload recognizes the fact that processing loads and power consumption on servers vary substantially over the course of days or weeks. To compute a power-performance metric across all levels, measured transaction throughputs for each segment are added together and then divided by the sum of the average power consumed for each segment. The result is a figure of merit called ―overall ssj_ops/watt‖. This ratio provides information about the energy efficiency of the measured server. The defined measurement standard enables customers to compare it with other configurations and servers measured with SPECpower_ssj2008. The diagram shows a typical graph of a SPECpower_ssj2008 result.
The benchmark runs on a wide variety of operating systems and hardware architectures and does not require extensive client or storage infrastructure. The minimum equipment for SPEC-compliant testing is two networked computers, plus a power analyzer and a temperature sensor. One computer is the System Under Test (SUT) which runs one of the supported operating systems and the JVM. The JVM provides the environment required to run the SPECpower_ssj2008 workload which is implemented in Java. The other computer is a ―Control & Collection System‖ (CCS) which controls the operation of the benchmark and captures the power, performance and temperature readings for reporting. The diagram provides an overview of the basic structure of the benchmark configuration and the various components.
WHITE PAPER PERFORMANCE REPORT PRIMERGY TX200 S7 VERSION: 1.1 2012-10-04
© Fujitsu Technology Solutions 2012 Page 13 (34)
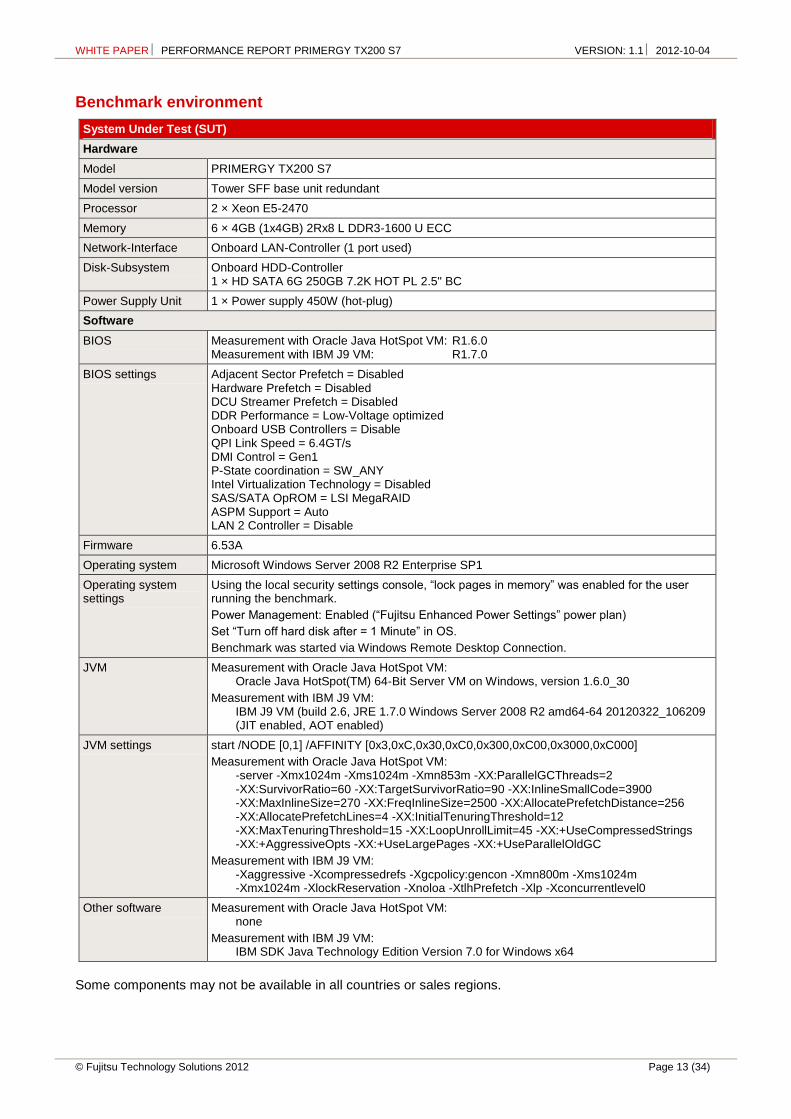
Benchmark environment
System Under Test (SUT)
Hardware
Model PRIMERGY TX200 S7
Model version Tower SFF base unit redundant
Processor 2 × Xeon E5-2470
Memory 6 × 4GB (1x4GB) 2Rx8 L DDR3-1600 U ECC
Network-Interface Onboard LAN-Controller (1 port used)
Disk-Subsystem Onboard HDD-Controller 1 × HD SATA 6G 250GB 7.2K HOT PL 2.5" BC
Power Supply Unit 1 × Power supply 450W (hot-plug)
Software
BIOS Measurement with Oracle Java HotSpot VM: R1.6.0 Measurement with IBM J9 VM: R1.7.0
BIOS settings Adjacent Sector Prefetch = Disabled Hardware Prefetch = Disabled DCU Streamer Prefetch = Disabled DDR Performance = Low-Voltage optimized Onboard USB Controllers = Disable QPI Link Speed = 6.4GT/s DMI Control = Gen1 P-State coordination = SW_ANY Intel Virtualization Technology = Disabled SAS/SATA OpROM = LSI MegaRAID ASPM Support = Auto LAN 2 Controller = Disable
Firmware 6.53A
Operating system Microsoft Windows Server 2008 R2 Enterprise SP1
Operating system settings
Using the local security settings console, ―lock pages in memory‖ was enabled for the user running the benchmark.
Power Management: Enabled (―Fujitsu Enhanced Power Settings‖ power plan)
Set ―Turn off hard disk after = 1 Minute‖ in OS.
Benchmark was started via Windows Remote Desktop Connection.
JVM Measurement with Oracle Java HotSpot VM: Oracle Java HotSpot(TM) 64-Bit Server VM on Windows, version 1.6.0_30
Measurement with IBM J9 VM: IBM J9 VM (build 2.6, JRE 1.7.0 Windows Server 2008 R2 amd64-64 20120322_106209 (JIT enabled, AOT enabled)
JVM settings start /NODE [0,1] /AFFINITY [0x3,0xC,0x30,0xC0,0x300,0xC00,0x3000,0xC000]
Measurement with Oracle Java HotSpot VM: -server -Xmx1024m -Xms1024m -Xmn853m -XX:ParallelGCThreads=2 -XX:SurvivorRatio=60 -XX:TargetSurvivorRatio=90 -XX:InlineSmallCode=3900 -XX:MaxInlineSize=270 -XX:FreqInlineSize=2500 -XX:AllocatePrefetchDistance=256 -XX:AllocatePrefetchLines=4 -XX:InitialTenuringThreshold=12 -XX:MaxTenuringThreshold=15 -XX:LoopUnrollLimit=45 -XX:+UseCompressedStrings -XX:+AggressiveOpts -XX:+UseLargePages -XX:+UseParallelOldGC
Measurement with IBM J9 VM: -Xaggressive -Xcompressedrefs -Xgcpolicy:gencon -Xmn800m -Xms1024m -Xmx1024m -XlockReservation -Xnoloa -XtlhPrefetch -Xlp -Xconcurrentlevel0
Other software Measurement with Oracle Java HotSpot VM: none
Measurement with IBM J9 VM: IBM SDK Java Technology Edition Version 7.0 for Windows x64
Some components may not be available in all countries or sales regions.
WHITE PAPER PERFORMANCE REPORT PRIMERGY TX200 S7 VERSION: 1.1 2012-10-04
Page 14 (34) © Fujitsu Technology Solutions 2012
Benchmark results
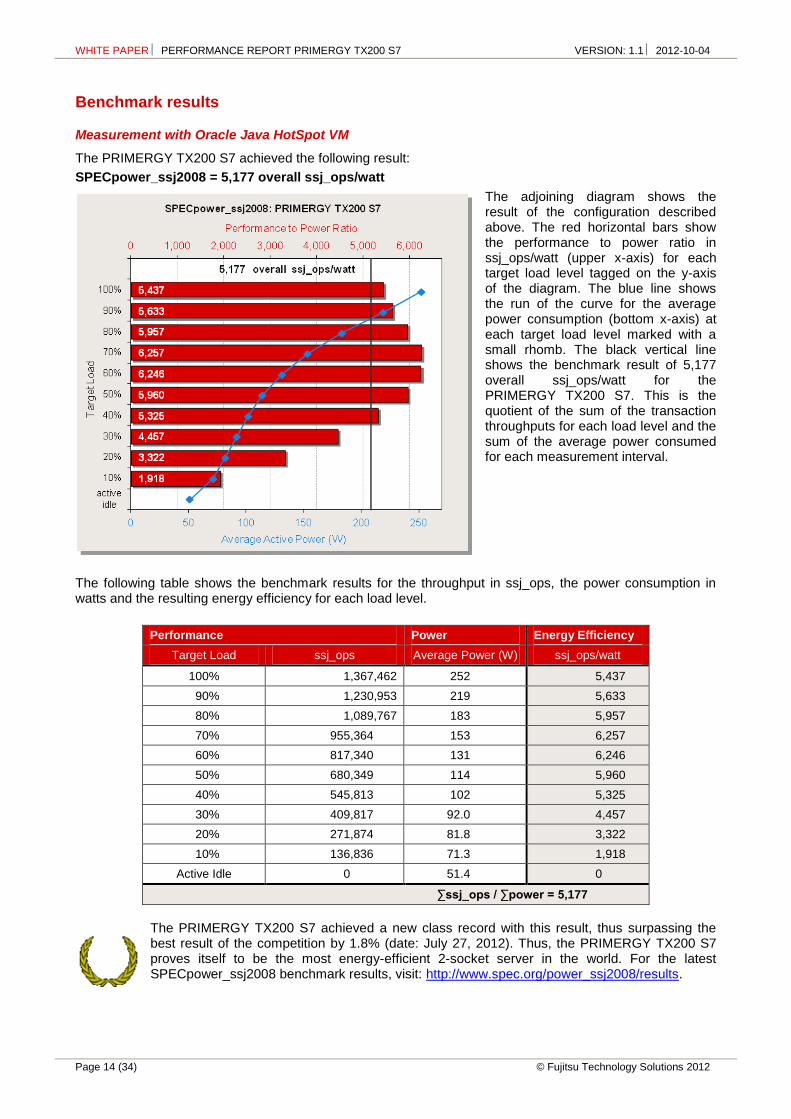
Measurement with Oracle Java HotSpot VM
The PRIMERGY TX200 S7 achieved the following result:
SPECpower_ssj2008 = 5,177 overall ssj_ops/watt
The adjoining diagram shows the result of the configuration described above. The red horizontal bars show the performance to power ratio in ssj_ops/watt (upper x-axis) for each target load level tagged on the y-axis of the diagram. The blue line shows the run of the curve for the average power consumption (bottom x-axis) at each target load level marked with a small rhomb. The black vertical line shows the benchmark result of 5,177 overall ssj_ops/watt for the PRIMERGY TX200 S7. This is the quotient of the sum of the transaction throughputs for each load level and the sum of the average power consumed for each measurement interval.
The following table shows the benchmark results for the throughput in ssj_ops, the power consumption in watts and the resulting energy efficiency for each load level.
Performance Power Energy Efficiency
Target Load ssj_ops Average Power (W) ssj_ops/watt
100% 1,367,462 252 5,437
90% 1,230,953 219 5,633
80% 1,089,767 183 5,957
70% 955,364 153 6,257
60% 817,340 131 6,246
50% 680,349 114 5,960
40% 545,813 102 5,325
30% 409,817 92.0 4,457
20% 271,874 81.8 3,322
10% 136,836 71.3 1,918
Active Idle 0 51.4 0
∑ssj_ops / ∑power = 5,177
The PRIMERGY TX200 S7 achieved a new class record with this result, thus surpassing the best result of the competition by 1.8% (date: July 27, 2012). Thus, the PRIMERGY TX200 S7 proves itself to be the most energy-efficient 2-socket server in the world. For the latest SPECpower_ssj2008 benchmark results, visit: http://www.spec.org/power_ssj2008/results.
WHITE PAPER PERFORMANCE REPORT PRIMERGY TX200 S7 VERSION: 1.1 2012-10-04
© Fujitsu Technology Solutions 2012 Page 15 (34)
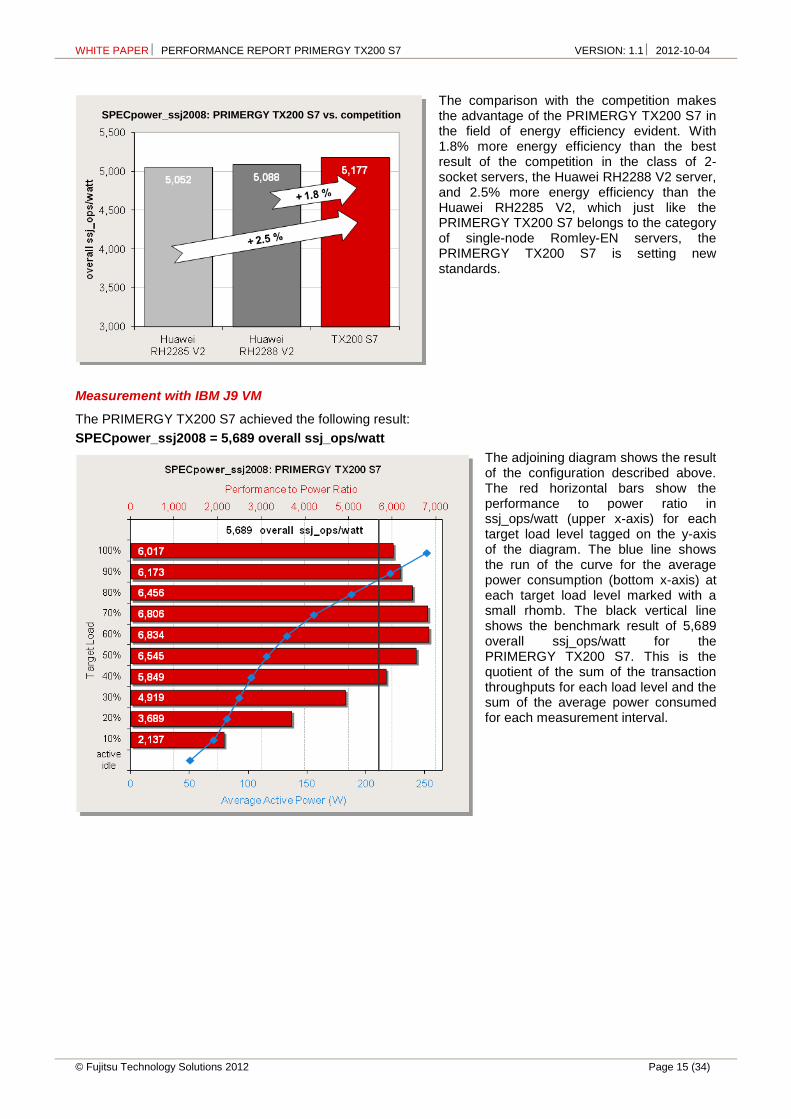
The comparison with the competition makes the advantage of the PRIMERGY TX200 S7 in the field of energy efficiency evident. With 1.8% more energy efficiency than the best result of the competition in the class of 2-socket servers, the Huawei RH2288 V2 server, and 2.5% more energy efficiency than the Huawei RH2285 V2, which just like the PRIMERGY TX200 S7 belongs to the category of single-node Romley-EN servers, the PRIMERGY TX200 S7 is setting new standards.
Measurement with IBM J9 VM
The PRIMERGY TX200 S7 achieved the following result:
SPECpower_ssj2008 = 5,689 overall ssj_ops/watt
The adjoining diagram shows the result of the configuration described above. The red horizontal bars show the performance to power ratio in ssj_ops/watt (upper x-axis) for each target load level tagged on the y-axis of the diagram. The blue line shows the run of the curve for the average power consumption (bottom x-axis) at each target load level marked with a small rhomb. The black vertical line shows the benchmark result of 5,689 overall ssj_ops/watt for the PRIMERGY TX200 S7. This is the quotient of the sum of the transaction throughputs for each load level and the sum of the average power consumed for each measurement interval.
SPECpower_ssj2008: PRIMERGY TX200 S7 vs. competition
WHITE PAPER PERFORMANCE REPORT PRIMERGY TX200 S7 VERSION: 1.1 2012-10-04
Page 16 (34) © Fujitsu Technology Solutions 2012
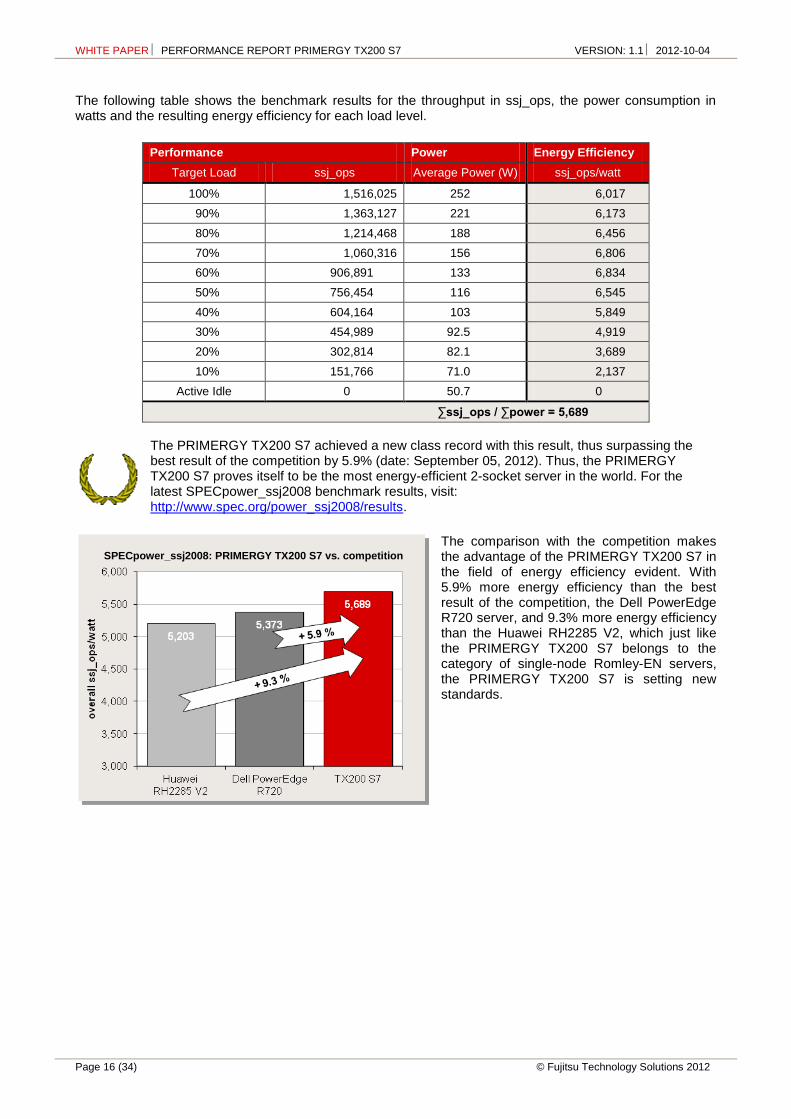
The following table shows the benchmark results for the throughput in ssj_ops, the power consumption in watts and the resulting energy efficiency for each load level.
Performance Power Energy Efficiency
Target Load ssj_ops Average Power (W) ssj_ops/watt
100% 1,516,025 252 6,017
90% 1,363,127 221 6,173
80% 1,214,468 188 6,456
70% 1,060,316 156 6,806
60% 906,891 133 6,834
50% 756,454 116 6,545
40% 604,164 103 5,849
30% 454,989 92.5 4,919
20% 302,814 82.1 3,689
10% 151,766 71.0 2,137
Active Idle 0 50.7 0
∑ssj_ops / ∑power = 5,689
The PRIMERGY TX200 S7 achieved a new class record with this result, thus surpassing the best result of the competition by 5.9% (date: September 05, 2012). Thus, the PRIMERGY TX200 S7 proves itself to be the most energy-efficient 2-socket server in the world. For the latest SPECpower_ssj2008 benchmark results, visit: http://www.spec.org/power_ssj2008/results.
The comparison with the competition makes the advantage of the PRIMERGY TX200 S7 in the field of energy efficiency evident. With 5.9% more energy efficiency than the best result of the competition, the Dell PowerEdge R720 server, and 9.3% more energy efficiency than the Huawei RH2285 V2, which just like the PRIMERGY TX200 S7 belongs to the category of single-node Romley-EN servers, the PRIMERGY TX200 S7 is setting new standards.
SPECpower_ssj2008: PRIMERGY TX200 S7 vs. competition
WHITE PAPER PERFORMANCE REPORT PRIMERGY TX200 S7 VERSION: 1.1 2012-10-04
© Fujitsu Technology Solutions 2012 Page 17 (34)
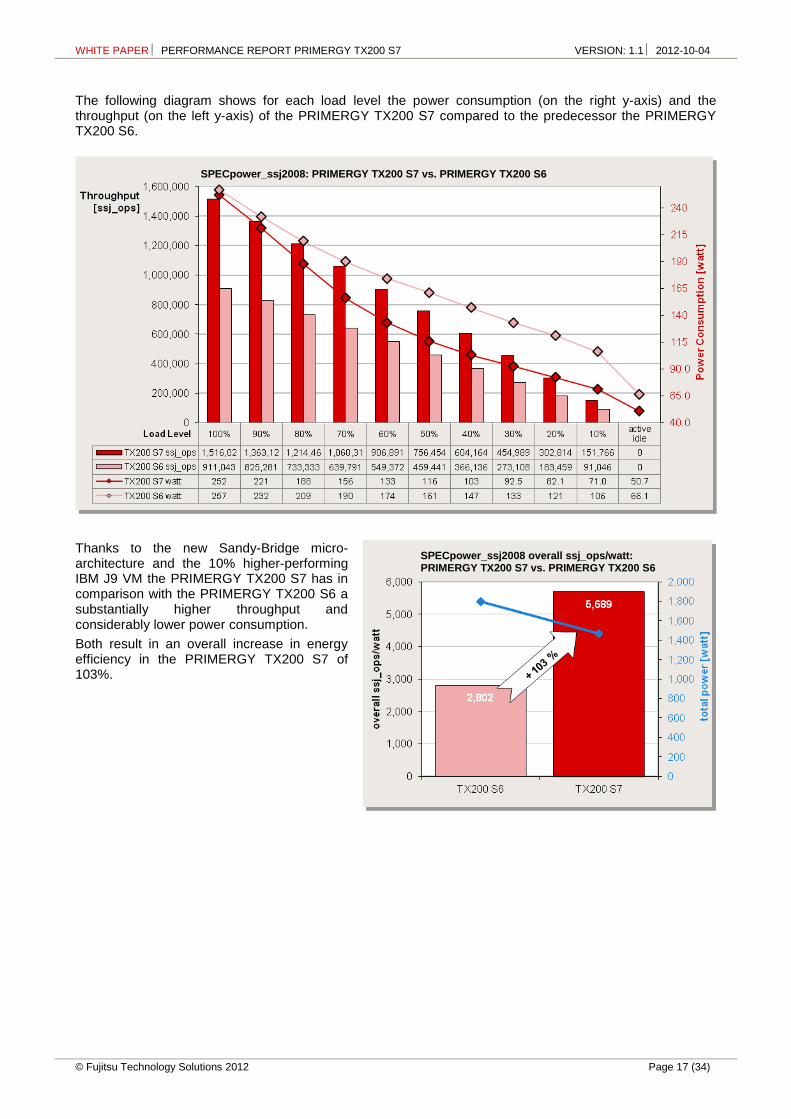
The following diagram shows for each load level the power consumption (on the right y-axis) and the throughput (on the left y-axis) of the PRIMERGY TX200 S7 compared to the predecessor the PRIMERGY TX200 S6.
Thanks to the new Sandy-Bridge micro-architecture and the 10% higher-performing IBM J9 VM the PRIMERGY TX200 S7 has in comparison with the PRIMERGY TX200 S6 a substantially higher throughput and considerably lower power consumption.
Both result in an overall increase in energy efficiency in the PRIMERGY TX200 S7 of 103%.
SPECpower_ssj2008 overall ssj_ops/watt: PRIMERGY TX200 S7 vs. PRIMERGY TX200 S6
SPECpower_ssj2008: PRIMERGY TX200 S7 vs. PRIMERGY TX200 S6
WHITE PAPER PERFORMANCE REPORT PRIMERGY TX200 S7 VERSION: 1.1 2012-10-04
Page 18 (34) © Fujitsu Technology Solutions 2012
Disk-I/O
Benchmark description
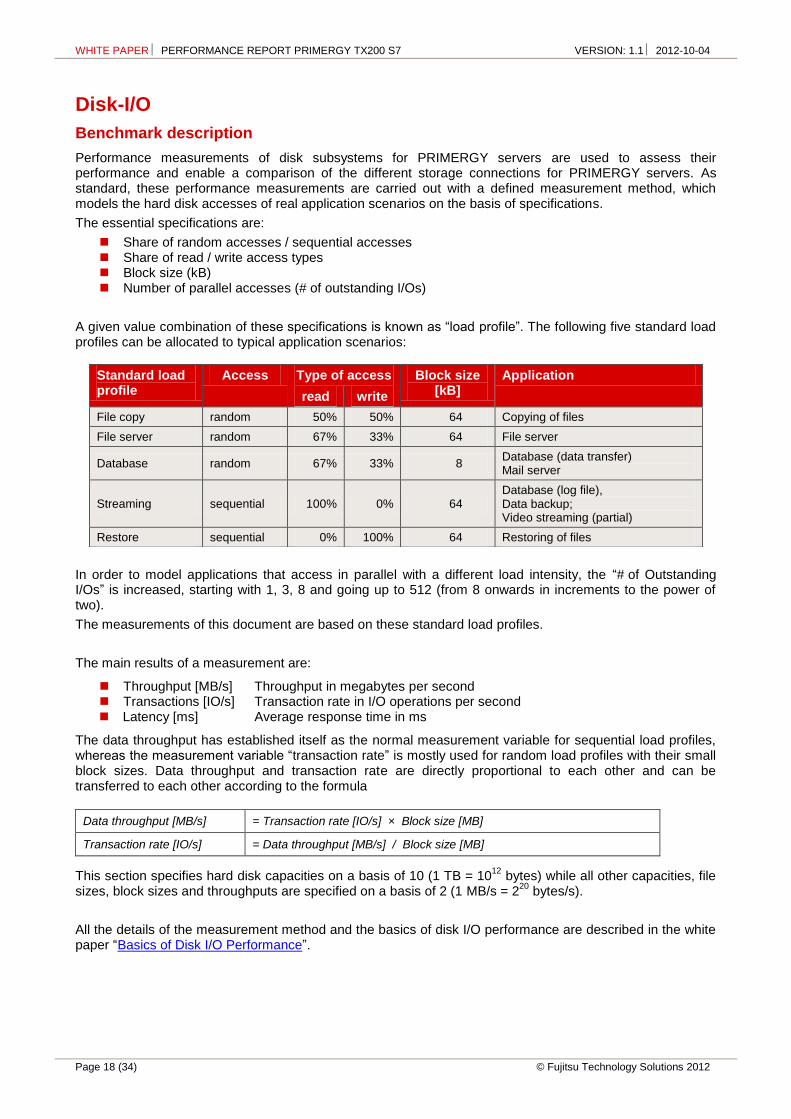
Performance measurements of disk subsystems for PRIMERGY servers are used to assess their performance and enable a comparison of the different storage connections for PRIMERGY servers. As standard, these performance measurements are carried out with a defined measurement method, which models the hard disk accesses of real application scenarios on the basis of specifications.
The essential specifications are:
Share of random accesses / sequential accesses Share of read / write access types Block size (kB) Number of parallel accesses (# of outstanding I/Os)
A given value combination of these specifications is known as ―load profile‖. The following five standard load profiles can be allocated to typical application scenarios:
In order to model applications that access in parallel with a different load intensity, the ―# of Outstanding I/Os‖ is increased, starting with 1, 3, 8 and going up to 512 (from 8 onwards in increments to the power of two).
The measurements of this document are based on these standard load profiles.
The main results of a measurement are:
Throughput [MB/s] Throughput in megabytes per second Transactions [IO/s] Transaction rate in I/O operations per second Latency [ms] Average response time in ms
The data throughput has established itself as the normal measurement variable for sequential load profiles, whereas the measurement variable ―transaction rate‖ is mostly used for random load profiles with their small block sizes. Data throughput and transaction rate are directly proportional to each other and can be transferred to each other according to the formula
Data throughput [MB/s] = Transaction rate [IO/s] × Block size [MB]
Transaction rate [IO/s] = Data throughput [MB/s] / Block size [MB]
This section specifies hard disk capacities on a basis of 10 (1 TB = 1012
bytes) while all other capacities, file sizes, block sizes and throughputs are specified on a basis of 2 (1 MB/s = 2
20 bytes/s).
All the details of the measurement method and the basics of disk I/O performance are described in the white paper ―Basics of Disk I/O Performance‖.
Standard load profile
Access Type of access Block size [kB]
Application
read write
File copy random 50% 50% 64 Copying of files
File server random 67% 33% 64 File server
Database random 67% 33% 8 Database (data transfer) Mail server
Streaming sequential 100% 0% 64 Database (log file), Data backup; Video streaming (partial)
Restore sequential 0% 100% 64 Restoring of files

WHITE PAPER PERFORMANCE REPORT PRIMERGY TX200 S7 VERSION: 1.1 2012-10-04
© Fujitsu Technology Solutions 2012 Page 19 (34)
Benchmark environment
All the measurement results were determined using the hardware and software components listed below.
System Under Test (SUT)
Hardware
Controller 1 × ―LSI SW RAID on Intel C600 (Onboard SATA)‖ 1 × ―LSI SW RAID on Intel C600 (Onboard SAS)‖ 1 × ―RAID Ctrl SAS 6G 0/1‖ 1 × ―RAID Ctrl SAS 5/6 512MB (D2616)‖ 1 × ―RAID Ctrl SAS 6G 5/6 1GB (D3116)‖
Drive 8 × EP HDD SAS 6 Gbit/s 2.5 15000 rpm 146 GB
8 × EP HDD SAS 6 Gbit/s 3.5 15000 rpm 300 GB
8 × EP SSD SAS 6 Gbit/s 2.5 200 GB MLC
4 × BC HDD SATA 6 Gbit/s 2.5 7200 rpm 1 TB
Software
Operating system Microsoft Windows Server 2008 Enterprise x64 Edition SP2
Administration software
ServerView RAID Manager 5.0.2
Initialization of RAID arrays
RAID arrays are initialized before the measurement with an elementary block size of 64 kB (―stripe size‖)
File system NTFS
Measuring tool Iometer 27.07.2006
Measurement data Measurement files of 32 GB with 1 – 8 hard disks; 64 GB with 9 – 16 hard disks; 128 GB with 17 or more hard disks
Some components may not be available in all countries / sales regions.

WHITE PAPER PERFORMANCE REPORT PRIMERGY TX200 S7 VERSION: 1.1 2012-10-04
Page 20 (34) © Fujitsu Technology Solutions 2012
Benchmark results
The results presented here are designed to help you choose the right solution from the various configuration options of the PRIMERGY TX200 S7 in the light of disk-I/O performance. The selection of suitable components and the right settings of their parameters is important here. These two aspects should therefore be dealt with as preparation for the discussion of the performance values.
Components
The hard disks are the first essential component. If there is a reference below to ―hard disks‖, this is meant as the generic term for HDDs (―hard disk drives‖, in other words conventional hard disks) and SSDs (―solid state drives‖, i.e. non-volatile electronic storage media). When selecting the type of hard disk and number of hard disks you can move the weighting in the direction of storage capacity, performance, security or price. In order to enable a pre-selection of the hard disk types – depending on the required weighting – the hard disk types for PRIMERGY servers are divided into three classes:
―Economic‖ (ECO): low-priced hard disks ―Business Critical‖ (BC): very failsafe hard disks ―Enterprise‖ (EP): very failsafe and very high-performance hard disks
The following table is a list of the hard disk types that have been available for the PRIMERGY TX200 S7 since system release.
Drive class
Data medium type
Interface Form factor
krpm
Economic HDD SATA 6G 3.5" 7.2
Business Critical HDD SATA 6G 2.5" 7.2
Business Critical HDD SATA 6G 3.5" 7.2
Enterprise HDD SAS 6G 3.5" 15
Enterprise HDD SAS 6G 2.5" 10, 15
Enterprise SSD SATA 6G 2.5" -
Enterprise SSD SAS 6G 2.5" -
Mixed drive configurations of SAS and SATA hard disks in one system are permitted, unless they are excluded in the configurator for special hard disk types.
The SATA-HDDs offer high capacities right up into the terabyte range at a very low cost. The SAS-HDDs have shorter access times and achieve higher throughputs due to the higher rotational speed of the SAS-HDDs (in comparison with the SATA-HDDs). SAS-HDDs with a rotational speed of 15 krpm have better access times and throughputs than comparable HDDs with a rotational speed of 10 krpm. The 6G interface has in the meantime established itself as the standard among the SAS-HDDs.
Of all the hard disk types SSDs offer on the one hand by far the highest transaction rates for random load profiles, and on the other hand the shortest access times. In return, however, the price per gigabyte of storage capacity is substantially higher.
More hard disks per system are possible as a result of using 2.5" hard disks instead of 3.5" hard disks. Consequently, the load that each individual hard disk has to overcome decreases and the maximum overall performance of the system increases.
More detailed performance statements about hard disk types are available in the white paper ―Single Disk Performance‖.
WHITE PAPER PERFORMANCE REPORT PRIMERGY TX200 S7 VERSION: 1.1 2012-10-04
© Fujitsu Technology Solutions 2012 Page 21 (34)
The maximum number of hard disks in the system depends on the system configuration. The following table lists the essential cases.
Form factor
Interface Connection
type
Number of PCIe
controllers
Maximum number of hard disks
2.5", 3.5" SATA 3G, SAS 3G direct 0 4
2.5", 3.5" SATA 6G, SAS 6G direct 1 8
2.5" SATA 6G, SAS 6G direct 2 16
After the hard disks the RAID controller is the second performance-determining key component. In the case of these controllers the ―modular RAID‖ concept of the PRIMERGY servers offers a plethora of options to meet the various requirements of a wide range of different application scenarios.
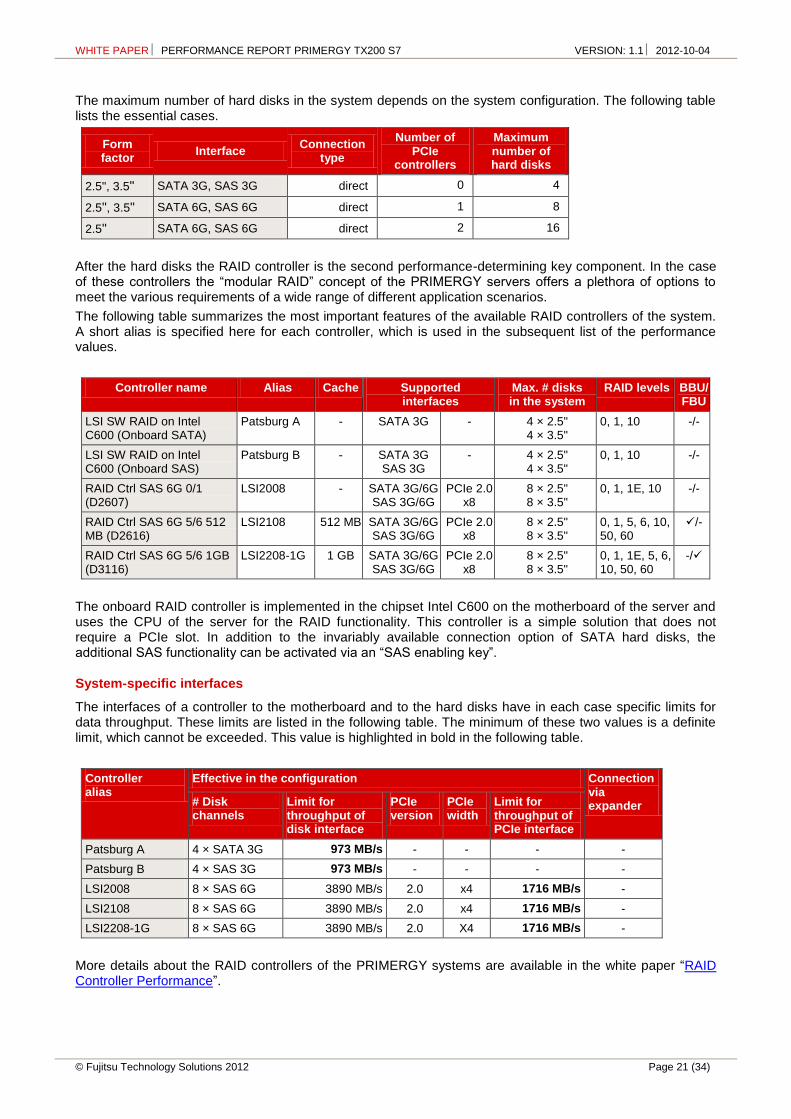
The following table summarizes the most important features of the available RAID controllers of the system. A short alias is specified here for each controller, which is used in the subsequent list of the performance values.
Controller name Alias Cache Supported interfaces
Max. # disks in the system
RAID levels BBU/ FBU
LSI SW RAID on Intel C600 (Onboard SATA)
Patsburg A - SATA 3G - 4 × 2.5" 4 × 3.5"
0, 1, 10 -/-
LSI SW RAID on Intel C600 (Onboard SAS)
Patsburg B - SATA 3G SAS 3G
- 4 × 2.5" 4 × 3.5"
0, 1, 10 -/-
RAID Ctrl SAS 6G 0/1 (D2607)
LSI2008 - SATA 3G/6G SAS 3G/6G
PCIe 2.0 x8
8 × 2.5" 8 × 3.5"
0, 1, 1E, 10 -/-
RAID Ctrl SAS 6G 5/6 512 MB (D2616)
LSI2108 512 MB SATA 3G/6G SAS 3G/6G
PCIe 2.0 x8
8 × 2.5" 8 × 3.5"
0, 1, 5, 6, 10, 50, 60
/-
RAID Ctrl SAS 6G 5/6 1GB (D3116)
LSI2208-1G 1 GB SATA 3G/6G SAS 3G/6G
PCIe 2.0 x8
8 × 2.5" 8 × 3.5"
0, 1, 1E, 5, 6, 10, 50, 60
-/
The onboard RAID controller is implemented in the chipset Intel C600 on the motherboard of the server and uses the CPU of the server for the RAID functionality. This controller is a simple solution that does not require a PCIe slot. In addition to the invariably available connection option of SATA hard disks, the additional SAS functionality can be activated via an ―SAS enabling key‖.
System-specific interfaces
The interfaces of a controller to the motherboard and to the hard disks have in each case specific limits for data throughput. These limits are listed in the following table. The minimum of these two values is a definite limit, which cannot be exceeded. This value is highlighted in bold in the following table.
Controller alias
Effective in the configuration Connection via expander # Disk
channels Limit for throughput of disk interface
PCIe version
PCIe width
Limit for throughput of PCIe interface
Patsburg A 4 × SATA 3G 973 MB/s - - - -
Patsburg B 4 × SAS 3G 973 MB/s - - - -
LSI2008 8 × SAS 6G 3890 MB/s 2.0 x4 1716 MB/s -
LSI2108 8 × SAS 6G 3890 MB/s 2.0 x4 1716 MB/s -
LSI2208-1G 8 × SAS 6G 3890 MB/s 2.0 X4 1716 MB/s -
More details about the RAID controllers of the PRIMERGY systems are available in the white paper ―RAID Controller Performance‖.
WHITE PAPER PERFORMANCE REPORT PRIMERGY TX200 S7 VERSION: 1.1 2012-10-04
Page 22 (34) © Fujitsu Technology Solutions 2012
Settings
In most cases, the cache of the hard disks has a great influence on disk-I/O performance. It is frequently regarded as a security problem in case of power failure and is thus switched off. On the other hand, it was integrated by hard disk manufacturers for the good reason of increasing the write performance. For performance reasons it is therefore advisable to enable the hard disk cache. This is particular valid for SATA-HDDs. The performance can as a result increase more than tenfold for specific access patterns and hard disk types. More information about the performance impact of the hard disk cache is available in the document ―Single Disk Performance‖. To prevent data loss in case of power failure you are recommended to equip the system with a UPS.
In the case of controllers with a cache there are several parameters that can be set. The optimal settings can depend on the RAID level, the application scenario and the type of data medium. In the case of RAID levels 5 and 6 in particular (and the more complex RAID level combinations 50 and 60) it is obligatory to enable the controller cache for application scenarios with write share. If the controller cache is enabled, the data temporarily stored in the cache should be safeguarded against loss in case of power failure. Suitable accessories are available for this purpose (e.g. a BBU or FBU).
For the purpose of easy and reliable handling of the settings for RAID controllers and hard disks it is advisable to use the RAID-Manager software ―ServerView RAID‖ that is supplied for PRIMERGY servers. All the cache settings for controllers and hard disks can usually be made en bloc – specifically for the application – by using the pre-defined modi ―Performance‖ or ―Data Protection‖. The ―Performance‖ mode ensures the best possible performance settings for the majority of the application scenarios.
More information about the setting options of the controller cache is available in the white paper ―RAID Controller Performance‖.
Performance values
In general, disk-I/O performance of a RAID array depends on the type and number of hard disks, on the RAID level and on the RAID controller. If the limits of the system-specific interfaces are not exceeded, the statements on disk-I/O performance are therefore valid for all PRIMERGY systems. This is why all the performance statements of the document ―RAID Controller Performance‖ also apply for the PRIMERGY TX200 S7 if the configurations measured there are also supported by this system.
The performance values of the system are listed in table form below, specifically for different RAID levels, access types and block sizes. Substantially different configuration versions are dealt with separately.
The performance values in the following tables use the established measurement variables, as already mentioned in the subsection Benchmark description. Thus, transaction rate is specified for random accesses and data throughput for sequential accesses. To avoid any confusion among the measurement units the tables have been separated for the two access types.
The table cells contain the maximum achievable values. This has three implications: On the one hand hard disks with optimal performance were used (the components used are described in more detail in the subsection Benchmark environment). Furthermore, cache settings of controllers and hard disks, which are optimal for the respective access scenario and the RAID level, are used as a basis. And ultimately each value is the maximum value for the entire load intensity range (# of outstanding I/Os).
In order to also visualize the numerical values each table cell is highlighted with a horizontal bar, the length of which is proportional to the numerical value in the table cell. All bars shown in the same scale of length have the same color. In other words, a visual comparison only makes sense for table cells with the same colored bars.
Since the horizontal bars in the table cells depict the maximum achievable performance values, they are shown by the color getting lighter as you move from left to right. The light shade of color at the right end of the bar tells you that the value is a maximum value and can only be achieved under optimal prerequisites. The darker the shade becomes as you move to the left, the more frequently it will be possible to achieve the corresponding value in practice.

WHITE PAPER PERFORMANCE REPORT PRIMERGY TX200 S7 VERSION: 1.1 2012-10-04
© Fujitsu Technology Solutions 2012 Page 23 (34)
Random accesses (performance values in IO/s):
RA
ID
Co
ntr
olle
r
Inte
rfa
ce
Fo
rm f
ac
tor
# D
isk
s
2 RAID 1 550 447
4 RAID 0 1073 583
4 RAID10 828 446
2 RAID 1 804 694
4 RAID 0 1830 1015
4 RAID10 1347 744
2 RAID 1 500 448
4 RAID 0 1062 609
4 RAID10 832 479
2 RAID 1 780 660
4 RAID 0 1824 1008
4 RAID10 1359 755
2 RAID 1 820 702
8 RAID 0 3491 1980
8 RAID10 2716 1516
2 RAID 1 868 729
8 RAID 0 3476 1971
8 RAID10 2705 1497
2 RAID 1 859 679
8 RAID 10 4356 2209
8 RAID 0 5933 3010
8 RAID 5 3346 1896
2 RAID 1 1042 730
8 RAID10 4243 2165
8 RAID 0 5825 2958
8 RAID 5 3143 1750
2 RAID 1 1109 863
8 RAID 10 4444 2285
8 RAID 0 5883 2989
8 RAID 5 3574 1935
2 RAID 1 1105 746
8 RAID 10 4313 2195
8 RAID 0 5789 2983
8 RAID 5 3220 1839
LSI2208-1G SAS 3.5"
LSI2108 SAS 2.5"
LSI2208-1G SAS 2.5"
LSI2108 SAS 3.5"
LSI2008 SAS 2.5"
LSI2008 SAS 3.5"
Patsburg A SATA 3.5"
Patsburg B SAS 3.5"
Configuration version
RA
ID le
ve
l
HD
Ds
ra
nd
om
,
8 k
B b
loc
ks
,
67
% r
ea
d, [I
O/s
]
HD
Ds
ra
nd
om
,
64
kB
blo
ck
s,
67
% r
ea
d, [I
O/s
]
Patsburg A SATA 2.5"
Patsburg B SAS 2.5"
WHITE PAPER PERFORMANCE REPORT PRIMERGY TX200 S7 VERSION: 1.1 2012-10-04
Page 24 (34) © Fujitsu Technology Solutions 2012
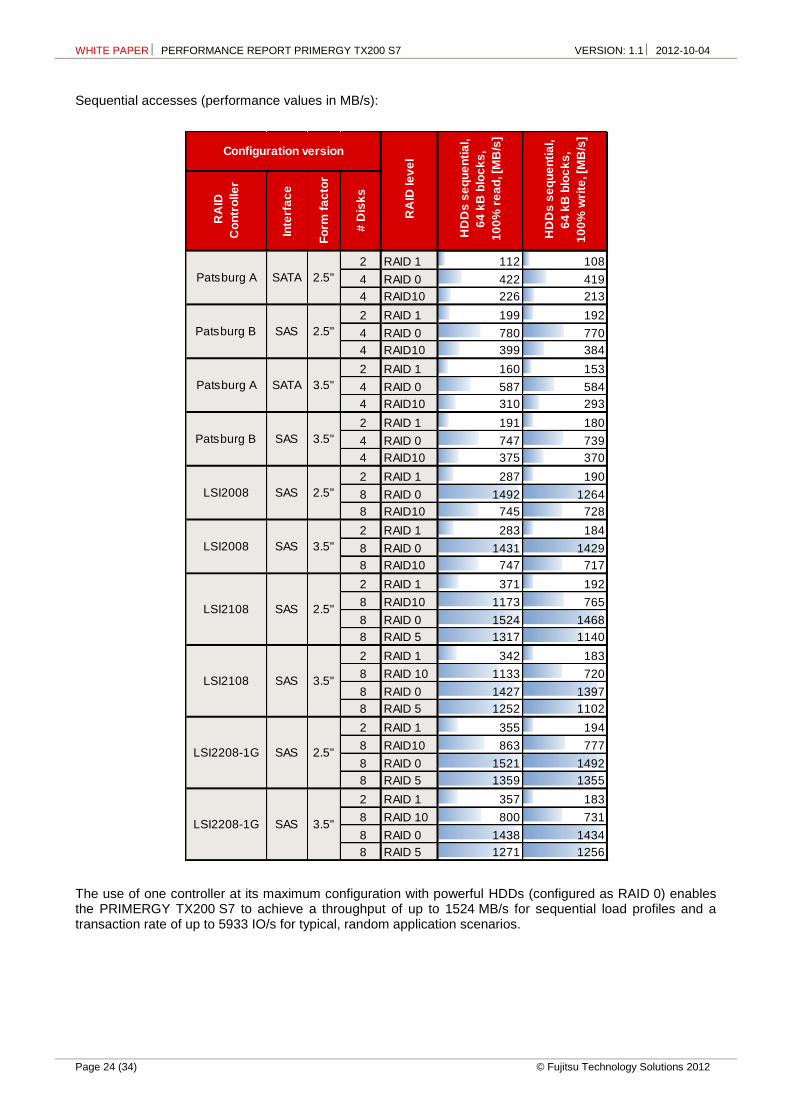
Sequential accesses (performance values in MB/s):
The use of one controller at its maximum configuration with powerful HDDs (configured as RAID 0) enables the PRIMERGY TX200 S7 to achieve a throughput of up to 1524 MB/s for sequential load profiles and a transaction rate of up to 5933 IO/s for typical, random application scenarios.
RA
ID
Co
ntr
olle
r
Inte
rfa
ce
Fo
rm f
ac
tor
# D
isk
s
2 RAID 1 112 108
4 RAID 0 422 419
4 RAID10 226 213
2 RAID 1 199 192
4 RAID 0 780 770
4 RAID10 399 384
2 RAID 1 160 153
4 RAID 0 587 584
4 RAID10 310 293
2 RAID 1 191 180
4 RAID 0 747 739
4 RAID10 375 370
2 RAID 1 287 190
8 RAID 0 1492 1264
8 RAID10 745 728
2 RAID 1 283 184
8 RAID 0 1431 1429
8 RAID10 747 717
2 RAID 1 371 192
8 RAID10 1173 765
8 RAID 0 1524 1468
8 RAID 5 1317 1140
2 RAID 1 342 183
8 RAID 10 1133 720
8 RAID 0 1427 1397
8 RAID 5 1252 1102
2 RAID 1 355 194
8 RAID10 863 777
8 RAID 0 1521 1492
8 RAID 5 1359 1355
2 RAID 1 357 183
8 RAID 10 800 731
8 RAID 0 1438 1434
8 RAID 5 1271 1256
LSI2208-1G SAS 3.5"
LSI2208-1G SAS 2.5"
LSI2108 SAS 3.5"
LSI2108 SAS 2.5"
LSI2008 SAS 2.5"
LSI2008 SAS 3.5"
Patsburg A SATA 3.5"
Patsburg B SAS 3.5"
Configuration version
RA
ID le
ve
l
HD
Ds
se
qu
en
tia
l,
64
kB
blo
ck
s,
10
0%
re
ad
, [M
B/s
]
HD
Ds
se
qu
en
tia
l,
64
kB
blo
ck
s,
10
0%
wri
te, [M
B/s
]
Patsburg A SATA 2.5"
Patsburg B SAS 2.5"
WHITE PAPER PERFORMANCE REPORT PRIMERGY TX200 S7 VERSION: 1.1 2012-10-04
© Fujitsu Technology Solutions 2012 Page 25 (34)
OLTP-2
Benchmark description
OLTP stands for Online Transaction Processing. The OLTP-2 benchmark is based on the typical application scenario of a database solution. In OLTP-2 database access is simulated and the number of transactions achieved per second (tps) determined as the unit of measurement for the system.
In contrast to benchmarks such as SPECint and TPC-E, which were standardized by independent bodies and for which adherence to the respective rules and regulations are monitored, OLTP-2 is an internal benchmark of Fujitsu. OLTP-2 is based on the well-known database benchmark TPC-E. OLTP-2 was designed in such a way that a wide range of configurations can be measured to present the scaling of a system with regard to the CPU and memory configuration.
Even if the two benchmarks OLTP-2 and TPC-E simulate similar application scenarios using the same load profiles, the results cannot be compared or even treated as equal, as the two benchmarks use different methods to simulate user load. OLTP-2 values are typically similar to TPC-E values. A direct comparison, or even referring to the OLTP-2 result as TPC-E, is not permitted, especially because there is no price-performance calculation.
Further information can be found in the document Benchmark Overview OLTP-2.
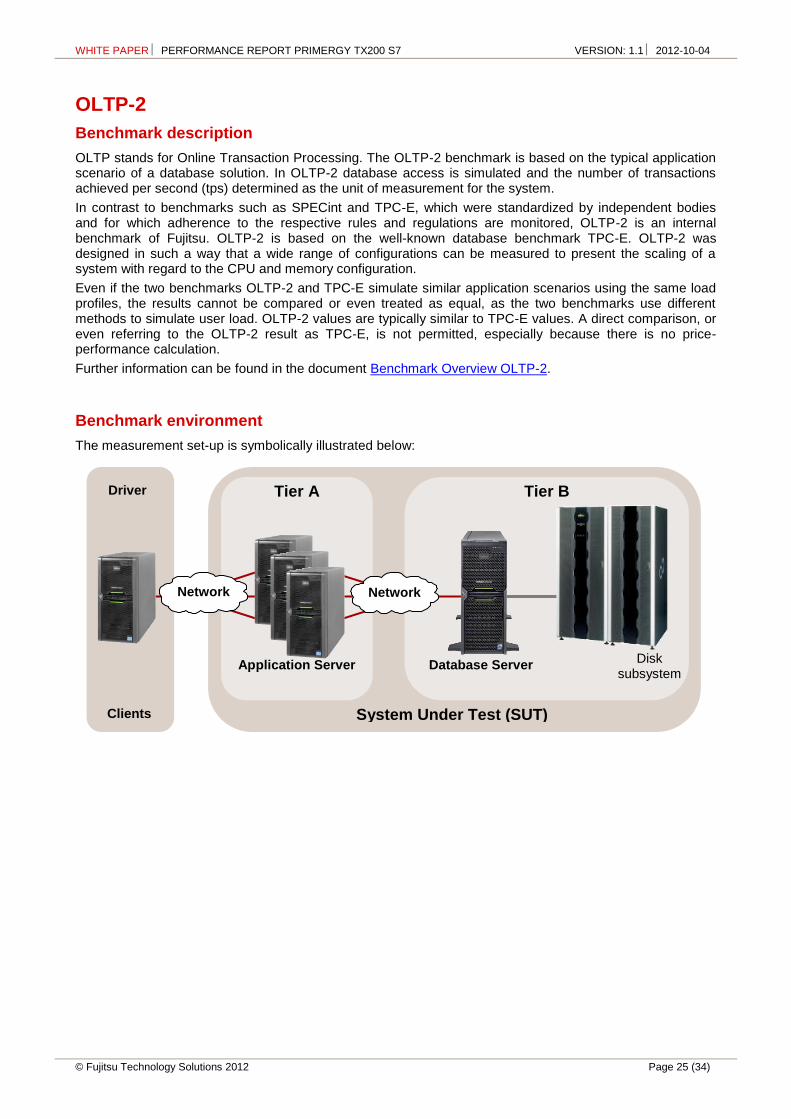
Benchmark environment
The measurement set-up is symbolically illustrated below:
Application Server
Tier A Tier B
Clients
Database Server Disk
subsystem
System Under Test (SUT)
Driver
Network
Network
WHITE PAPER PERFORMANCE REPORT PRIMERGY TX200 S7 VERSION: 1.1 2012-10-04
Page 26 (34) © Fujitsu Technology Solutions 2012
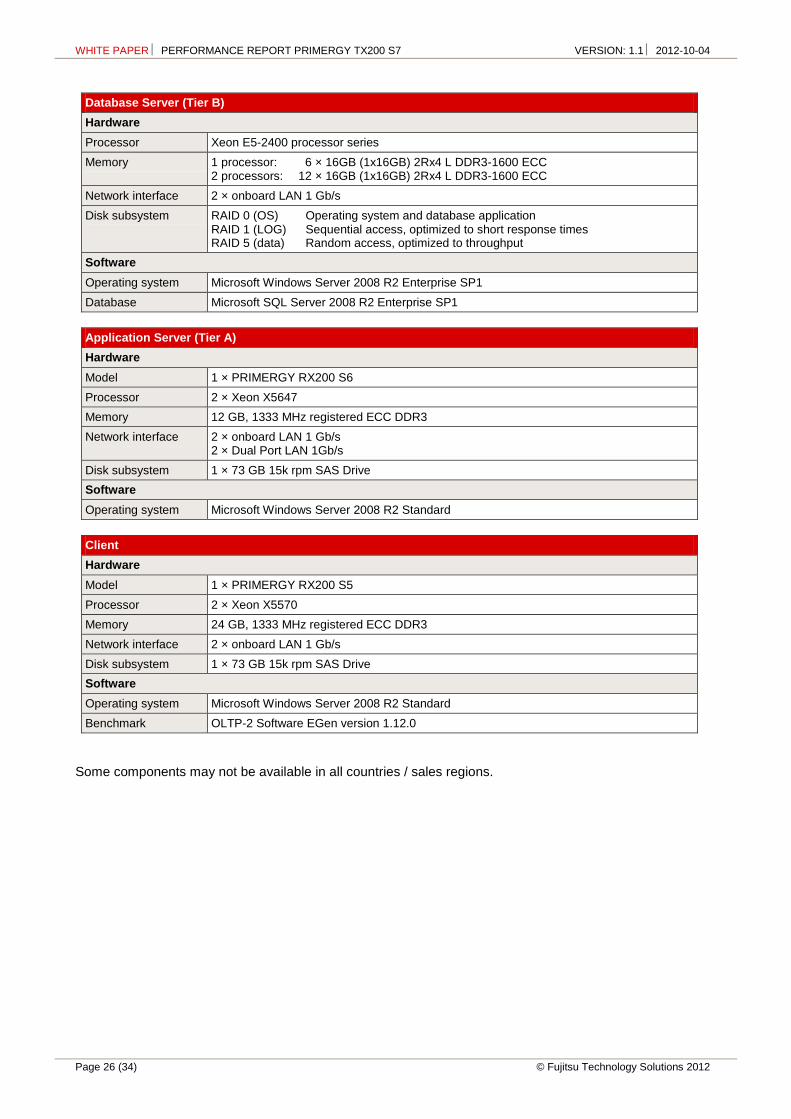
Database Server (Tier B)
Hardware
Processor Xeon E5-2400 processor series
Memory 1 processor: 6 × 16GB (1x16GB) 2Rx4 L DDR3-1600 ECC 2 processors: 12 × 16GB (1x16GB) 2Rx4 L DDR3-1600 ECC
Network interface 2 × onboard LAN 1 Gb/s
Disk subsystem RAID 0 (OS) Operating system and database application RAID 1 (LOG) Sequential access, optimized to short response times RAID 5 (data) Random access, optimized to throughput
Software
Operating system Microsoft Windows Server 2008 R2 Enterprise SP1
Database Microsoft SQL Server 2008 R2 Enterprise SP1
Application Server (Tier A)
Hardware
Model 1 × PRIMERGY RX200 S6
Processor 2 × Xeon X5647
Memory 12 GB, 1333 MHz registered ECC DDR3
Network interface 2 × onboard LAN 1 Gb/s 2 × Dual Port LAN 1Gb/s
Disk subsystem 1 × 73 GB 15k rpm SAS Drive
Software
Operating system Microsoft Windows Server 2008 R2 Standard
Client
Hardware
Model 1 × PRIMERGY RX200 S5
Processor 2 × Xeon X5570
Memory 24 GB, 1333 MHz registered ECC DDR3
Network interface 2 × onboard LAN 1 Gb/s
Disk subsystem 1 × 73 GB 15k rpm SAS Drive
Software
Operating system Microsoft Windows Server 2008 R2 Standard
Benchmark OLTP-2 Software EGen version 1.12.0
Some components may not be available in all countries / sales regions.
WHITE PAPER PERFORMANCE REPORT PRIMERGY TX200 S7 VERSION: 1.1 2012-10-04
© Fujitsu Technology Solutions 2012 Page 27 (34)
Benchmark results
Database performance greatly depends on the configuration options with CPU, memory and on the connectivity of an adequate disk subsystem for the database. In the following scaling considerations for the processors we assume that both the memory and the disk subsystem has been adequately chosen and is not a bottleneck.
A guideline in the database environment for selecting main memory is that sufficient quantity is more important than the speed of the memory accesses. This why a configuration with a total memory of 192 GB was considered for the measurements with two processors and a configuration with a total memory of 96 GB for the measurements with one processor. Both memory configurations have memory access of 1333 MHz, which however is limited to 1066 MHz with the processors Xeon E5-2403 and E5-2407. Further information about memory performance can be found in the White Paper Memory Performance of Xeon E5-2400 (Sandy Bridge-EN) Based Systems.
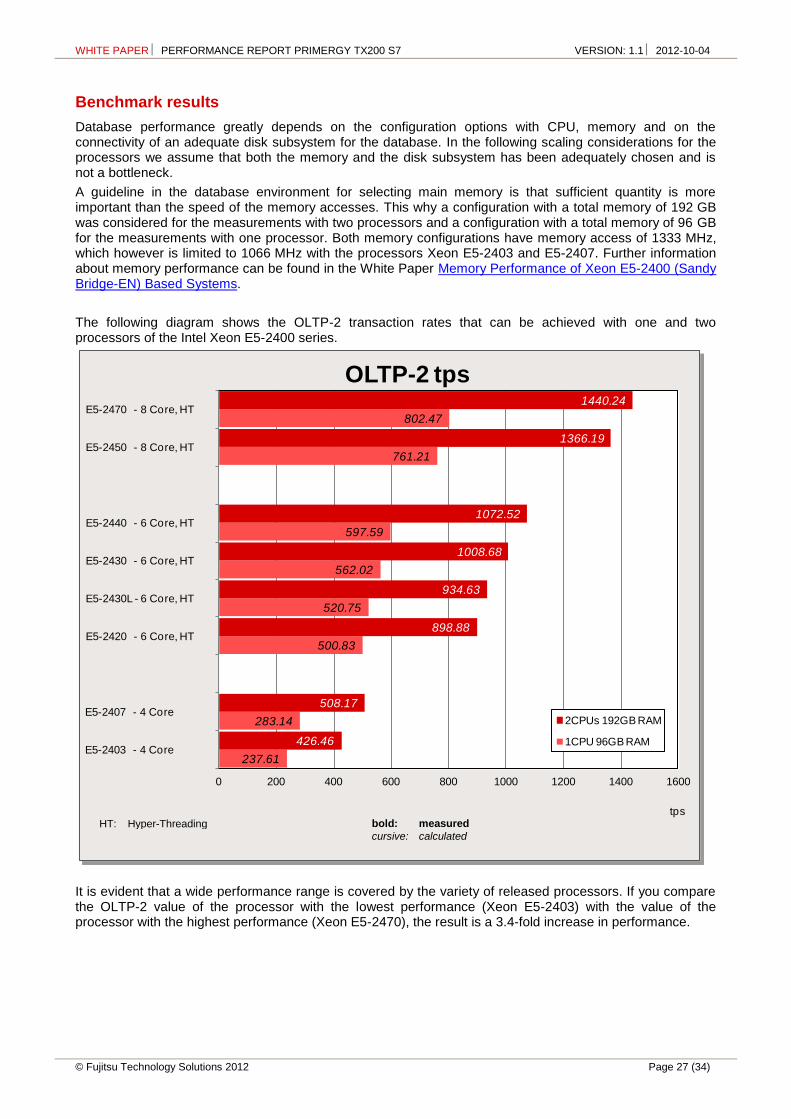
The following diagram shows the OLTP-2 transaction rates that can be achieved with one and two processors of the Intel Xeon E5-2400 series.
It is evident that a wide performance range is covered by the variety of released processors. If you compare the OLTP-2 value of the processor with the lowest performance (Xeon E5-2403) with the value of the processor with the highest performance (Xeon E5-2470), the result is a 3.4-fold increase in performance.
237.61
283.14
500.83
520.75
562.02
597.59
761.21
802.47
426.46
508.17
898.88
934.63
1008.68
1072.52
1366.19
1440.24
0 200 400 600 800 1000 1200 1400 1600
E5-2403 - 4 Core
E5-2407 - 4 Core
E5-2420 - 6 Core, HT
E5-2430L - 6 Core, HT
E5-2430 - 6 Core, HT
E5-2440 - 6 Core, HT
E5-2450 - 8 Core, HT
E5-2470 - 8 Core, HT
OLTP-2 tps
2CPUs 192GB RAM
1CPU 96GB RAM
tpsbold: measured
cursive: calculated HT: Hyper-Threading
WHITE PAPER PERFORMANCE REPORT PRIMERGY TX200 S7 VERSION: 1.1 2012-10-04
Page 28 (34) © Fujitsu Technology Solutions 2012
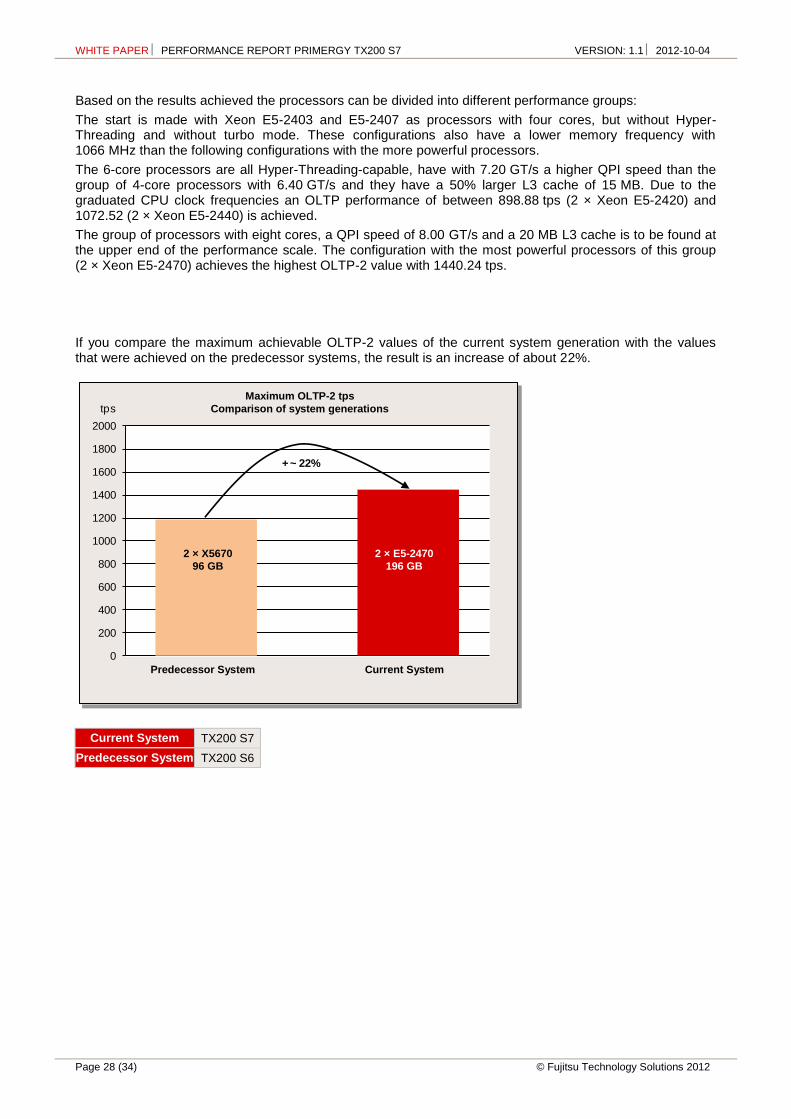
Based on the results achieved the processors can be divided into different performance groups:
The start is made with Xeon E5-2403 and E5-2407 as processors with four cores, but without Hyper-Threading and without turbo mode. These configurations also have a lower memory frequency with 1066 MHz than the following configurations with the more powerful processors.
The 6-core processors are all Hyper-Threading-capable, have with 7.20 GT/s a higher QPI speed than the group of 4-core processors with 6.40 GT/s and they have a 50% larger L3 cache of 15 MB. Due to the graduated CPU clock frequencies an OLTP performance of between 898.88 tps (2 × Xeon E5-2420) and 1072.52 (2 × Xeon E5-2440) is achieved.
The group of processors with eight cores, a QPI speed of 8.00 GT/s and a 20 MB L3 cache is to be found at the upper end of the performance scale. The configuration with the most powerful processors of this group (2 × Xeon E5-2470) achieves the highest OLTP-2 value with 1440.24 tps.
If you compare the maximum achievable OLTP-2 values of the current system generation with the values that were achieved on the predecessor systems, the result is an increase of about 22%.
Current System TX200 S7
Predecessor System TX200 S6
0
200
400
600
800
1000
1200
1400
1600
1800
2000
+ ~ 22%
tps
Current System Predecessor System
Maximum OLTP-2 tps
Comparison of system generations
2 × X5670
96 GB 2 × E5-2470
196 GB

WHITE PAPER PERFORMANCE REPORT PRIMERGY TX200 S7 VERSION: 1.1 2012-10-04
© Fujitsu Technology Solutions 2012 Page 29 (34)
STREAM
Benchmark description
STREAM is a synthetic benchmark that has been used for many years to determine memory throughput and which was developed by John McCalpin during his professorship at the University of Delaware. Today STREAM is supported at the University of Virginia, where the source code can be downloaded in either Fortran or C. STREAM continues to play an important role in the HPC environment in particular. It is for example an integral part of the HPC Challenge benchmark suite.
The benchmark is designed in such a way that it can be used both on PCs and on server systems. The unit of measurement of the benchmark is GB/s, i.e. the number of gigabytes that can be read and written per second.
STREAM measures the memory throughput for sequential accesses. These can generally be performed more efficiently than accesses that are randomly distributed on the memory, because the CPU caches are used for sequential access.
Before execution the source code is adapted to the environment to be measured. Therefore, the size of the data area must be at least four times larger than the total of all CPU caches so that these have as little influence as possible on the result. The OpenMP program library is used to enable selected parts of the program to be executed in parallel during the runtime of the benchmark, consequently achieving optimal load distribution to the available processor cores.
During implementation the defined data area, consisting of 8-byte elements, is successively copied to four types, and arithmetic calculations are also performed to some extent.
Type Execution Bytes per step Floating-point calculation per step
COPY a(i) = b(i) 16 0
SCALE a(i) = q × b(i) 16 1
SUM a(i) = b(i) + c(i) 24 1
TRIAD a(i) = b(i) + q × c(i) 24 2
The throughput is output in GB/s for each type of calculation. The differences between the various values are usually only minor on modern systems. In general, only the determined TRIAD value is used as a comparison.
The measured results primarily depend on the clock frequency of the memory modules; the CPUs influence the arithmetic calculations. The accuracy of the results is approximately 5%.
This chapter specifies throughputs on a basis of 10 (1 GB/s = 109 Byte/s).
Benchmark environment
System Under Test (SUT)
Hardware
Model PRIMERGY TX200 S7
Processor 2 processors of Xeon E5-2400 processor series
Memory 12 × 8GB (1x8GB) 2Rx4 L DDR3-1600 R ECC
Software
BIOS settings Hyper-Threading = Disabled
Operating system Red Hat Enterprise Linux Server release 6.2
Operating system settings
echo never > /sys/kernel/mm/redhat_transparent_hugepage/enabled
Compiler Intel C Compiler 12.1
Benchmark Stream.c Version 5.9
Some components may not be available in all countries or sales regions.

WHITE PAPER PERFORMANCE REPORT PRIMERGY TX200 S7 VERSION: 1.1 2012-10-04
Page 30 (34) © Fujitsu Technology Solutions 2012
Benchmark results
Processor Cores Processor Frequency
[Ghz]
Max. Memory Frequency
[MHz]
TRIAD
[GB/s]
2 × Xeon E5-2403 4 1.80 1067 36.3
2 × Xeon E5-2407 4 2.20 1067 42.4
2 × Xeon E5-2420 6 1.90 1333 41.8
2 × Xeon E5-2430L 6 2.00 1333 44.7
2 × Xeon E5-2430 6 2.20 1333 49.1
2 × Xeon E5-2440 6 2.40 1333 51.5
2 × Xeon E5-2450 8 2.10 1600 57.0
2 × Xeon E5-2470 8 2.30 1600 60.4
The results depend primarily on the maximum memory frequency. The smaller differences with processors with the same maximum memory frequency are a result in arithmetic calculation of the different processor frequencies.
The following diagram illustrates the throughput of the PRIMERGY TX200 S7 in comparison to its predecessor, the PRIMERGY TX200 S6, in their most performant configuration.
0
10
20
30
40
50
60
70
PRIMERGY TX200 S62 × Xeon X5670
PRIMERGY TX200 S72 × Xeon E5-2470
40.8
60.4
GB/s
STREAM TRIAD: PRIMERGY TX200 S7 vs. PRIMERGY TX200 S6

WHITE PAPER PERFORMANCE REPORT PRIMERGY TX200 S7 VERSION: 1.1 2012-10-04
© Fujitsu Technology Solutions 2012 Page 31 (34)
LINPACK
Benchmark description
LINPACK was developed in the 1970s by Jack Dongarra and some other people to show the performance of supercomputers. The benchmark consists of a collection of library functions for the analysis and solution of linear system of equations. A description can be found in the document http://www.netlib.org/utk/people/JackDongarra/PAPERS/hplpaper.pdf.
LINPACK can be used to measure the speed of a computer during the solution of an N–dimensional linear system of equations. The result is specified in GFlops (Giga Floating Point Operations per Second). It is a measure of how many floating-point operations can be carried out per second. The number of floating-point operations required for the solution is determined by the formula
2/3 × N
3 + 2 × N
2.
For the calculation LINPACK requires a matrix of size N × N in the main memory with the value N standing for the number of equations to be solved. Maximum performance is achieved if the available main memory can be fully used as a result of choosing this value. However, the determination of this limit is very time-consuming and the expected increase in the result is only minor. The memory bandwidth of the system also has hardly any impact on the result, because floating-point calculations are chiefly carried out during the run and data exchange only seldom takes place between the parallel processes. Thus the benchmark result is determined for a value of N that is somewhat below the maximum value.
LINPACK is classed as one of the leading benchmarks in the field of high performance computing (HPC). LINPACK is one of the seven benchmarks currently included in the HPC Challenge benchmark suite, which takes other performance aspects in the HPC environment into account.
Intel offers a LINPACK version that has been highly optimized for individual systems with Intel processors. The optimal parameter values are autonomously determined by the software on the basis of the current processor architecture. Another version provided by Intel is based on hpl (High-Performance Linpack) for use on distributed systems, with the intercommunication of the servers taking place via Message Passing Interface (MPI). In the case of this version the parameter values are set via a configuration file. Both versions can be downloaded from http://software.intel.com/en-us/articles/intel-math-kernel-library-linpack-download/.
It is possible to publish LINPACK results at http://www.top500.org/. Prerequisite for this is the use of an MPI-based (Message Passing Interface) version. (See: http://www.netlib.org/benchmark/hpl)
The maximum theoretical performance of a processor core follows from the number of floating-point operations that are performed within a clock cycle. Thus e.g. a single processor core with a clock frequency of 2.4 GHz and 4 floating-point operations per cycle would achieve a maximum performance of 9.6 GFlops. The ratio of the measured result to the maximum value shows the efficiency of the system for floating-point calculations. The fewer memory accesses required during the calculation, the better the ratio.
Manufacturer-specific LINPACK versions are also used when graphics cards are used for general purpose computation on a graphics processing unit (GPGPU). They are based on hpl and contain extensions which are needed for communication with the graphics cards. During runtime the compute load is distributed over the system processors and the processors of the graphics cards according to a ratio specified by the user. The LINPACK result accordingly consists of the total performance of the system processors and graphics cards, with the system processors not achieving the result that would be possible without a graphics card on account of the data transfer between main memory and graphics card.
WHITE PAPER PERFORMANCE REPORT PRIMERGY TX200 S7 VERSION: 1.1 2012-10-04
Page 32 (34) © Fujitsu Technology Solutions 2012
Benchmark environment
System Under Test (SUT)
Hardware
Model PRIMERGY TX200 S7
Processor 2 processors of Xeon E5-2400 processor series
Memory 12 × 8GB (1x8GB) 2Rx4 L DDR3-1600 R ECC
Software
BIOS settings Hyper-Threading = Disabled
Operating system Red Hat Enterprise Linux Server release 6.2
Benchmark xlinpack_xeon64 from Intel Compiler 12.1
Some components may not be available in all countries or sales regions.
Benchmark results
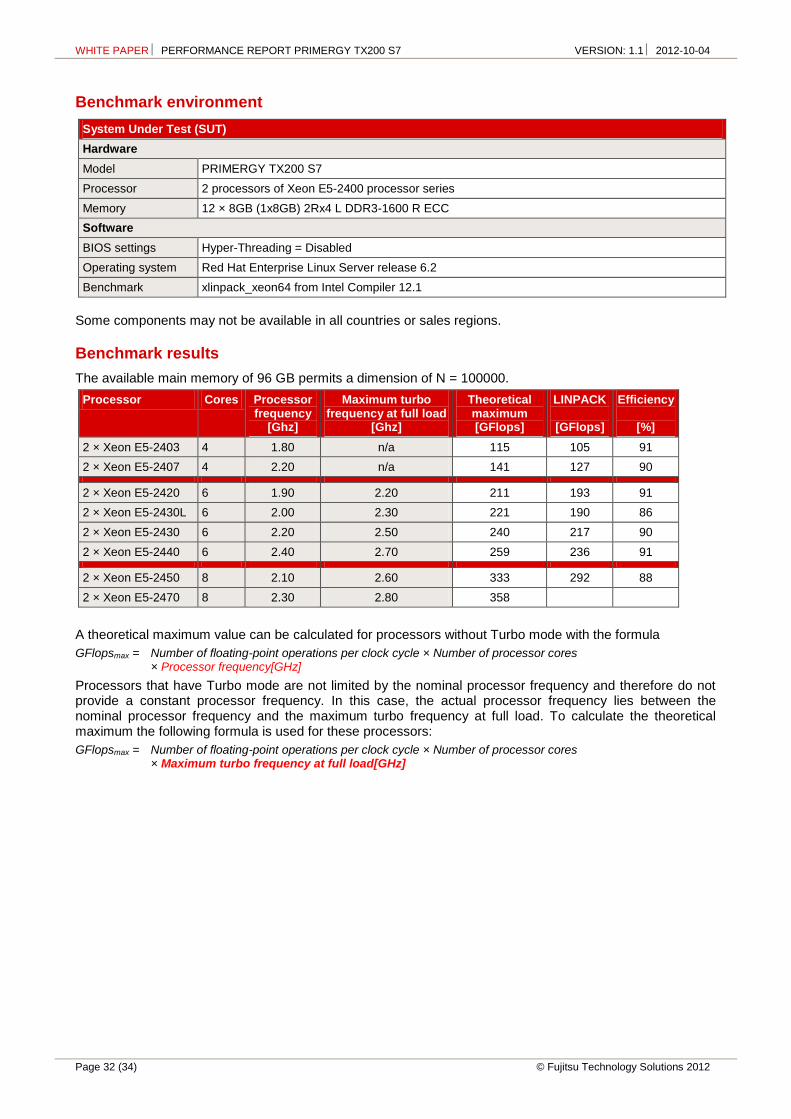
The available main memory of 96 GB permits a dimension of N = 100000.
Processor Cores Processor frequency
[Ghz]
Maximum turbo frequency at full load
[Ghz]
Theoretical maximum [GFlops]
LINPACK
[GFlops]
Efficiency
[%]
2 × Xeon E5-2403 4 1.80 n/a 115 105 91
2 × Xeon E5-2407 4 2.20 n/a 141 127 90
2 × Xeon E5-2420 6 1.90 2.20 211 193 91
2 × Xeon E5-2430L 6 2.00 2.30 221 190 86
2 × Xeon E5-2430 6 2.20 2.50 240 217 90
2 × Xeon E5-2440 6 2.40 2.70 259 236 91
2 × Xeon E5-2450 8 2.10 2.60 333 292 88
2 × Xeon E5-2470 8 2.30 2.80 358
A theoretical maximum value can be calculated for processors without Turbo mode with the formula
GFlopsmax = Number of floating-point operations per clock cycle × Number of processor cores × Processor frequency[GHz]
Processors that have Turbo mode are not limited by the nominal processor frequency and therefore do not provide a constant processor frequency. In this case, the actual processor frequency lies between the nominal processor frequency and the maximum turbo frequency at full load. To calculate the theoretical maximum the following formula is used for these processors:
GFlopsmax = Number of floating-point operations per clock cycle × Number of processor cores × Maximum turbo frequency at full load[GHz]
SPECcpu2006: floating-point performance PRIMERGY TX200 S6 vs. predecessor
WHITE PAPER PERFORMANCE REPORT PRIMERGY TX200 S7 VERSION: 1.1 2012-10-04
© Fujitsu Technology Solutions 2012 Page 33 (34)
Literature
PRIMERGY Systems
http://primergy.com/
PRIMERGY TX200 S7
Data sheet http://docs.ts.fujitsu.com/dl.aspx?id=9b30516a-8342-48bb-9e0e-42579dbe7571
Memory performance of Xeon E5-2400 (Sandy Bridge-EN)-based systems http://docs.ts.fujitsu.com/dl.aspx?id=4bf85b37-fd9c-44a2-8593-3a913e007bd5
PRIMERGY Performance
http://www.fujitsu.com/fts/products/computing/servers/primergy/benchmarks/
Disk I/O
Basics of Disk I/O Performance http://docs.ts.fujitsu.com/dl.aspx?id=65781a00-556f-4a98-90a7-7022feacc602
Single Disk Performance http://docs.ts.fujitsu.com/dl.aspx?id=0e30cb69-44db-4cd5-92a7-d38bacec6a99
RAID Controller Performance http://docs.ts.fujitsu.com/dl.aspx?id=e2489893-cab7-44f6-bff2-7aeea97c5aef
Information about Iometer http://www.iometer.org
LINPACK
http://www.netlib.org/linpack/
OLTP-2
Benchmark Overview OLTP-2 http://docs.ts.fujitsu.com/dl.aspx?id=e6f7a4c9-aff6-4598-b199-836053214d3f
SPECcpu2006
http://www.spec.org/osg/cpu2006
Benchmark overview SPECcpu2006 http://docs.ts.fujitsu.com/dl.aspx?id=1a427c16-12bf-41b0-9ca3-4cc360ef14ce
SPECpower_ssj2008
http://www.spec.org/power_ssj2008
Benchmark Overview SPECpower_ssj2008 http://docs.ts.fujitsu.com/dl.aspx?id=166f8497-4bf0-4190-91a1-884b90850ee0
STREAM
http://www.cs.virginia.edu/stream/
WHITE PAPER PERFORMANCE REPORT PRIMERGY TX200 S7 VERSION: 1.1 2012-10-04
Page 34 (34) © Fujitsu Technology Solutions 2012
Contact
FUJITSU
Website: http://www.fujitsu.com/
PRIMERGY Product Marketing
mailto:[email protected]
PRIMERGY Performance and Benchmarks
mailto:[email protected]
All rights reserved, including intellectual property rights. Technical data subject to modifications and delivery subject to availability. Any liability that the data and illustrations are complete, actual or correct is excluded. Designations may be trademarks and/or copyrights of the respective manufacturer, the use of which by third parties for their own purposes may infringe the rights of such owner. For further information see http://www.fujitsu.com/fts/resources/navigation/terms-of-use.html
2012-10-04 WW EN Copyright © Fujitsu Technology Solutions 2012