performance report 2002 - ecotrust canadaecotrust.ca/wp-content/uploads/2015/01/ec-pr-2002.pdf ·...
TRANSCRIPT

1
part one: introduction
part two: how we performed
1. making a difference 2. delivering value 3. inspiring action 4. communicating effectively 5. modeling sustainable behaviour
part three: going forward
part four: appendices
PerformanceReport
2002

2

3
part one: introduction Ecotrust Canada is a private, nonprofit organization whose work is based on the provocative idea that people, communities and jobs are essential to lasting conservation. We believe that conservation and economic sustainability are mutually dependent, and that environmental protection is the product of healthy, diverse local economies. We are agents of change in the ongoing search for true protection and sustainability of British Columbia’s unmatched natural legacy. Mission Ecotrust Canada’s mission is to support the emergence of a conservation economy in the coastal temperate rain forests of British Columbia. A conservation economy sustains itself on “principled income” earned from activities that restore rather than deplete natural capital. We envision a region in which the economy results in social and ecological improvement rather than degradation. Programs and Services We work in communities throughout coastal British Columbia including Alberni-Clayoquot, Georgia Basin, Central Coast, Central Vancouver Island, and North Coast-Haida Gwaii. Within these community programs, we deliver a range of services aimed at building capacity, supporting effective decisions, financing local entrepreneurs, and diversifying local economies, as follows: Information Services
- On-site Training and Technical Support: geographic information systems, traditional use studies, global positioning systems;
- Mapping and Information Products: bioregional atlases, publications, satellite imagery - Land Use Planning: forest profiling, fish and habitat monitoring, support in managing crown
land referrals; - Networking, Workshops and Conferences: Forest Stewardship Council workshops, the
Aboriginal Mapping Network, community-visioning workshops.
Economic Development Services - Business lending: working capital, product or market development, bridge financing for
confirmed contracts; - Economic and Business Development Services: feasibility studies, market research and analysis,
business planning.
For more detail about our programs and services, please refer to our 2002 Annual Report, which is available online at www.ecotrustcan.org. This document reports only on the survey responses and data we collected in year one of our performance measurement. Why measure performance? Ecotrust Canada is entering its tenth year of operations and we continue to experience significant growth in, and demand for, all aspects of our work. We have felt the need to measure our performance—for ourselves, for our funders, and for our community and individual partners. Our goal is to ensure that we perform effectively, that our stakeholders are confident that we are fulfilling our mission and that we improve our performance.
4
The challenge we face is that our mission describes a state that currently does not exist, one that we are defining as we work: the conservation economy. There are no pre-existing templates for measuring our progress and to our knowledge there are few other organizations with a similar mandate with which to compare. We need to create a system for measuring our program activities against our mission statement. Why use social audit methodology? We chose social audit methodology because it is stakeholder-based, allowing for a systematic approach to gathering internal and external feedback. It also allows us to approach the larger questions of measuring our social, ethical and environmental performance. We undertook this work to demonstrate our accountability, and open a dialogue with the people who are Ecotrust Canada, the people with whom we work up and down the coast, and the people who financially support our work. We expect to continue using this measurement framework on an ongoing basis to inform our performance management and to continue the dialogue with the people who are the lifeblood of our success. Ecotrust Canada used the AA1000 framework developed by AccountAbility, the Institute of Social and Ethical AccountAbility (www.accountability.org.uk) to conduct our performance assessment. This method is both inclusive and transparent, involving our key stakeholders from the design stage forward. An Advisory Committee, made up of stakeholder representatives, both internal and external, and individuals familiar with social audit methodology guided our social audit process. With the exception of the verification step, we have followed the AA1000 process. Please see Appendix Two for more information on this process. Susan Todd of Solstice Consulting, an accredited member of AccountAbility and an experienced social auditor, provided guidance and instruction throughout as we’ve learned the skills to allow us to continue our performance assessments going forward. Solstice was also responsible for conducting stakeholder interviews and focus groups, and designed and compiled the surveys. We’ve chosen to emphasize performance and mission measurement with the goal to provide Ecotrust Canada staff and supervisors with information and direction for improving our effectiveness. Public reporting of the audit results has been a secondary consideration. As our emphasis is more on internal learning than external reporting, we decided not to have the process and results independently audited. However, through this performance report we do want to share what we’ve learned and the targets we’ve set for improving our performance. During 2004 we will work on the targets we have set, and develop new indicators where we have committed to do so. Our next performance report is planned for 2005, collecting the work and information from 2004. It is our goal to merge this reporting with our 2004 Annual Report, which will be published in the spring of 2005. As we continue to measure our performance, we welcome your input. Your comments and suggestions will help us define and improve this process. Please use the feedback form to let us know what you think of our first performance report.

5
Acknowledgements:
Launching this project has been possible through the J.W. McConnell Family Foundation’s targeted support; our process and outcomes will be assessed to inform the Foundation’s interest in building
capacity in non-profit organizations nationally.
Ecotrust Canada would like to acknowledge Susan Todd’s patience and thoughtfulness in teaching us how to begin measuring and reporting our performance.
We would like to recognize the members of our Social Audit Advisory Committee, and the time and insight they provided: Gerald Amos, Priscilla Boucher, Jacqueline Koerner, Betty Plewes, Nina Winham,
and Donovan Woollard.
Our appreciation is also due to the people who took time to respond to our questionnaires, who assisted in collecting data and who participated in drafting this report.
Without your assistance this project would not have succeeded. Thank-you.

6
part two: the results and targets In this first performance assessment, we set out to measure the functional performance of our programs and get honest feedback on the value of the services we provide. We deliberately limited the scope of this first assessment, deciding that we could not yet attempt to measure our role within the emergence of the conservation economy. Measuring the contribution of a single organization to the conservation economy is tricky. Change may occur over long periods of time or sporadically. External events or decisions may influence program outcomes for better or worse. Many people and organizations are working towards the emergence of the conservation economy simultaneously and sometimes at cross-purposes. How should we tease out our contribution? New forms of measurement are needed. Moreover, even traditional economic data is often reported and compiled at a province-wide level that is not useful in assessing performance in the small rural and First Nations communities in which we work on the B.C. coast. We wanted to treat this first performance assessment as a learning cycle, so that we can confidently carry on the process in years to come. It made sense to restrict our first measurements somewhat to accommodate our need to learn the methodology, recognizing that new indicators can be added as we develop them.
Nevertheless, we did hope to see some glimmerings of how our work is adding up in communities. In the next audit cycle, Ecotrust Canada plans to develop further ways to measure our contribution to the emergence of the conservation economy on the B.C. coast. Measuring Performance We gathered most of our data through stakeholder surveys and interviews that were independently tabulated by the external consultant to ensure confidentiality of stakeholder responses. Ecotrust Canada staff compiled the additional data. In each case, an initial ‘focus group’ - conducted in a group or as a series of interviews – served to help us develop the survey questions sent to the broad group. Our goal was to ensure that the questions we asked were aligned with the issues at the forefront of our stakeholders’ minds. Survey Results Ecotrust Canada surveyed all of our 2002 active stakeholders in three key categories: community partners and clients (20), funders (39) and staff (22). Please refer to our survey lists below. We achieved 46% or better response rates in all groups. The results are sufficiently consistent to allow us to set commitments and performance targets and are strong qualitatively. We have reported both survey numbers and percentages in this report. 1 For most survey questions, we used a six-point scale ofrom strongly agree through strongly disagree. The results presented in the tables show only those who agreed or strongly agreed with the statement. We decided not to include those who only slightly agreed.
Disclosure of material information is crucial in social audit methodology. This report has been written to reflect the diversity of our stakeholders’ views and to provide information that we consider necessary for readers to have a full understanding of our activities and values.
1 Strictly speaking, percentages are not appropriate as we have fewer than 100 responses in each group, but we have used them to standardize results across stakeholder groups and to set targets. The actual number of positive responses compared to the total number of responses for each question is shown.

7
Organization of results and performance targets:
1. making a difference 2. delivering value 3. inspiring action 4. communicating effectively 5. modeling sustainable behaviour
In the social audit process the responsibility for setting targets towards maintaining and improving performance rests with the organization’s managers and board. These targets are then translated into actions through the organization’s business or annual planning processes. The targets in this report are of two types: quantitative and process-oriented. On the quantitative front, we have set goals for numeric scores in future surveys on the same questions asked this year. In terms of process, we hope to broaden the scope of data we collect, and confirm our commitment to engaging in this performance measurement process on an ongoing basis. We wrestled with setting these targets. Would our small sample sizes hold up to numeric targets next time around? How do we recognize what we want to maintain and what we want to improve without creating so many targets that the work becomes unmanageable? How do we show our current work towards improving some of the scores when these targets apply to steps we’ll take in 2004? These and other questions underline some of the learning process we underwent internally. In the end, we accepted a formula to recognize both our strong and weak scores: for scores of 85% or greater, we want to score 90% or more next time. For scores of less than 65% we want to achieve 65% or more. This formula does result in some strange looking targets. For example, if we scored 94% in one area this year, our target for our next cycle is slightly lower at a score of 90% or more. However, our goal is to focus our efforts where they are most needed, while not allowing areas that are strong to slip, within a manageable framework. We recognize that the main work we have to do is to improve any scores below 65%. This leaves results that fall between 65% and 85%. We decided we would not set targets in these areas, but will monitor them to see what we can learn in future cycles. 2 We’ve also included some targets related to the ongoing performance assessment process and other types of data we should be collecting in the Delivering Value and Modeling Sustainable Behaviour sections. Where we have set targets, we have refrained from including detail about how to achieve them. We learned from others who have undertaken similar work that often the process of developing a response is informed as the work progresses, and that we should leave ourselves open to learning what the best response is as we move ahead. Our next performance report will include detail about the work we have done to meet the targets we’ve set.
2 Where we have not set targets, we have notated “n.t.” or “no target” in our results tables.

8
Who we surveyed for this report, who we intend to survey in 2004: Community Partners and Clients In early 2003 we sent questionnaires to one key contact person within each community partnership or client organization, and received anonymous responses from 10 of 20 people (50%).
In 2004 we would like to increase our community partner and client survey representation. We propose to send surveys to at least one key contact person from each active project relationship Ecotrust Canada has within communities and with client organizations. This should increase our survey list by about 50%. We will have also begun new community and client partnerships since 2002.
Funders In early 2003 we sent questionnaires to one key contact person from each active 2002 foundation supporter, individual donor and corporate supporter. We received responses from 18 of 39 (46%). Four Ecotrust Canada Board members were included in the donor group.
In 2004 we would like to send surveys to one key contact person from each active 2004 foundation, individual or corporate supporter. We will consider whether Board members who are also donors should be surveyed separately.
Staff and Contractors Surveyed in 2002: All staff and long-term contractors as at November 2002 were included. 22 questionnaires were distributed, 15 were returned (68%).
To be surveyed in 2004: • All staff employed by Ecotrust Canada in 2004. • All Ecotrust Canada Board members in 2004. • All casual and contract employees and all project consultants employed by Ecotrust Canada in 2004.
Others who have similar aims (a NEW stakeholder group for our 2004 survey) In the 2004 round of stakeholder surveying we will add a new stakeholder group: Other individuals and organizations who are working toward similar aims. These are people and organizations that we believe can provide us with meaningful insight into how well we are contributing to the conservation economy. These are peers and experts: community members, consultants, academics, community organizations or businesses, and other non-profit organizations. We welcome your suggestions for members to add to this stakeholder group. For practical reasons we will limit this group to a maximum of 30 members in the 2004 survey round.

9
1. making a difference:
This is the most difficult performance for us to measure. It aims to answer, “what impact do we have in the work we do?” Are all of our projects and services in our five programming areas adding up to a conservation economy? In this first round of surveying we relied on what our community partners, clients and donors had to tell us about our mission performance.
We have chosen to set targets differently in this section than in others: we have extended our timeline. While we have targeted scores that are low in terms of the percent of respondents who agree, we note that most of these have corresponding high scores in the “not sure” column. We don’t know if we are experiencing a gap based on lack of information about what we do, lack of understanding, or actual lack of impact. We will measure responses to the same questions in our next round of measurement (in 2004), and use that round to continue to understand why our “not sure” responses were so high. We hope to use that learning to reach our targets in 2006.
results and targets
Targets for 2004:
⇒ Target deeper and wider stakeholder representation in our next round of surveying, including adding a new stakeholder category: others who have similar aims.
⇒ Develop a set of three to six additional key indicators to measure Ecotrust Canada’s performance against mission: supporting the emergence of the conservation economy in coastal B.C.
⇒ Develop and implement a management tool to effectively serve Ecotrust Canada’s needs for monthly program reporting on performance to mission-based program objectives.
⇒ Integrate ongoing performance measurement processes with organizational planning, evaluation and goal setting to the fullest extent possible. These activities should inform each other.
⇒ Continue this performance dialogue, based on the AccountAbility 1000 framework, with our staff, community partners, clients and funders, on an ongoing basis. The next full round of surveying will take place late in 2004.

10
making a difference.making a difference.making a difference.making a difference.
# agree % agree % disagree
% not sure
Target minimum % agree in 2006
Clients and communities Ecotrust Canada’s involvement in our work has made me more optimistic about the future of my community.
7 of 10 70% 10% 20% n.t.
Working with Ecotrust Canada has convinced me that we can have a healthy environment and a healthy economy at the same time.
6 of 9 67% 11% 22% n.t.
Ecotrust Canada’s work has improved employment prospects in our community
5 of 10 50% 0% 50% 65%
Ecotrust Canada’s work has improved environmental conditions in our community
5 of 10 50% 20% 30% 65%
Donors Ecotrust Canada’s work has improved environmental conditions in the region.
15 of 18 83% 0% 17% n.t.
Ecotrust Canada’s work has strengthened communities in the region.
14 of 18 78% 0% 22% n.t.
Ecotrust Canada’s work has convinced me that we can have a healthy environment and a healthy economy at the same time.
14 of 18 78% 5% 17% n.t.
Ecotrust Canada’s work has made me more optimistic about the future of the region.
13 of 18 72% 6% 22% n.t.
Ecotrust Canada does a good job of convincing others that we can have a healthy environment and a healthy economy at the same time.
10 of 18 56% 0% 44% 65%
Ecotrust Canada’s work has improved employment prospects in the coastal temperate rainforest region (“the region”).
9 of 18 50% 0% 50% 65%
Analysis Clients, community partners and donors were asked for their perspectives on Ecotrust Canada’s effectiveness. Possible responses included “agree”, “disagree” or “not sure” to various statements. A solid majority of donors agreed that Ecotrust Canada’s work has strengthened communities (78%) and improved the environment (83%).
However, the donors didn’t feel that Ecotrust Canada has done as good a job at convincing others of the model. About 44% were not sure if Ecotrust Canada had done a good job at convincing others. “There has been a significant shift in understanding that coastal communities need other forms of economic development, but still more [needs] to be done,” one donor commented. Furthermore, only half the respondents said that employment prospects have been improved by Ecotrust Canada’s work. The other half was unsure.
This skepticism is understandable, given the massive economic decline that has occurred on the coast over the past five years. Many clients and community partners—the very people who’ve suffered through this economic decline—also share this attitude. Many of their interview comments are especially illuminating. “There are huge social issues that won’t be fixed

11
“Ecotrust Canada has excellent staff, a great vision and passion, and the determination to make a difference. I wonder if they should focus their work on fewer projects. I suspect they are overstretched.”
—funder
overnight,” stated one stakeholder. Another suggested that social equity was as real as Star Trek in their community. “[I] don’t see measurable improvement in rural communities. Progress in First Nations is slow, not measurable, but there are some turtle steps,” stated another. Only half the respondents agreed that employment and the environment has been improved. The rest were unsure or disagreed.
Still, more than two-thirds of the community partners and clients were convinced about the conservation economy model—that we can have a healthy economy and environment at the same time—which made them more optimistic about their future. Two stakeholders also provided some advice about the direction Ecotrust Canada should take
to be more effective: smaller is better, they suggested. “I believe that Ecotrust Canada can, and should, do more to support small community and individual initiatives toward the development of the conservation economy,” stated a donor. “There may be too much focus on big stuff when small business is what really needs support to develop [the] conservation economy,” stated a community/client stakeholder.
In 2004 we want to define and adopt additional relevant indicators towards measuring whether we are making a difference. We also want to implement an effective management tool to allow us to track our program performance to mission-based objectives on a monthly basis throughout the year. Until now, we have been using a performance-to-plan tracking tool that contains all of the project level objectives set out in our annual plan. There were 256 of these objectives in 2002, and 212 in 2003. Reporting to these on a monthly basis is onerous for program staff and currently does not directly fall out of mission-based strategic objectives, nor are these multiple objectives linked to budget information. We recognize that this management tool needs to be overhauled as part of our annual planning process and plan to put a new tool into effect in January 2004.
We will continue compiling census data for the regions in which we work, please refer to Appendix One.

12
2. delivering value:
In 2002, Ecotrust Canada delivered $2.6 million in programs and services. We had also provided $3.5 million in loans and business development services by year-end. About 81% of Ecotrust Canada’s revenue in 2002 came from foundations, Canadian and foreign, with the rest from fee-for-service, loans, interest and other earned income. Guided by our mission statement, we try to link foundation and other funding to projects and programs that will advance the conservation economy on the B.C. coast. Our summarized consolidated financial statements for 2002 are included in our 2002 Annual Report and are available online at www.ecotrustcan.org.
2002 Sources of Funding (General Fund)Total: $2,783,638
non-Canadian foundations
57%
Canadian foundations
20%
Other (corporate, government and organizational,
grants, publication sales)3%
Donations from individuals
1%
Misc. income6%
Interest (on bank accounts)
2%
Fee-for-service income
6%Loan fees and interest
5%

13
Explain loan fund revenue and lending program? Loan criteria –etc?
Ecotrust Canada’s lending activity in 2002 is summarized by region and sector in the graphs below. At year-end 2002, Ecotrust Canada had just over $1 million in loans outstanding. Our total business development lending to that point was $3.5 million.
2002 expenses by program (General Fund)Total: $2,631,716
Central Coast10%
Bioregional1%
Economic Development
13%
General Programs18%
Central Vancouver Island
7%
North Coast Haida Gwaii4%
Planning and Info Services
11%
Alberni Clayoquot15%
Administration7%
Georgia Basin6%
Policy0.4%
Fundraising8%
2002 Loans by Region:$1,070,656
Central Coast
3%
Central Vancouver
Island36%
Alberni Clayoquot
61%
2002 Loans by Sector:$1,070,656
Tourism21%
Forestry25%
Value-added wood processing
35%Services
5%
Shellfish14%

14
results and targets Ecotrust Canada works with many partners in various communities. We work where communities invite us to participate, or where communities or individuals seek our services. In many cases our success in securing funding for various projects determines how resources are allocated. In others, we provide services on a fee-for-service basis, so the ability of the community to do its own fundraising impacts decisions about where we work. In all cases we seek to develop lasting relationships with communities, with a commitment to patient change rather than quick fixes or one-time collaborations.
delivering value.delivering value.delivering value.delivering value. % agree Minimum target scores for 2004
Donors
Ecotrust Canada delivers good value for the resources we entrust to them. (16 of 18 responses)
89% 90%
Clients and communities (10 respondents) Ecotrust Canada fees seem reasonable for the value we receive. (7 of 10 responses)
70% n.t.
sure
Donors
% agree % disagree % unsure % agree 2004 target
The activities Ecotrust Canada supports and the allocation of resources to these activities seem appropriate to their mission. (12 of 18 responses)
67% 0% 33% n.t.
Through Ecotrust Canada’s involvement, we have developed valuable relationships that we wouldn’t have otherwise. (11 of 18 responses)
61% 11% 28% 65%
Clients and communities Ecotrust Canada’s involvement has made us more effective at what we do. (8 of 10 responses)
80% 20% 0% n.t.
The skills we learned or the tools (e.g. maps, business plans) we developed through Ecotrust Canada’s involvement are still being used. (7 of 10 responses)
70% 0% 30% n.t.
The activities Ecotrust Canada supports and the allocation of resources to these activities seems fair based on what I know of Ecotrust Canada. (7 of 10 responses)
70% 20% 10% n.t.
Members of my community have learned useful skills through Ecotrust Canada’s involvement. (6 of 10 responses)
60% 10% 30% 65%
Through Ecotrust Canada’s involvement, we have developed valuable relationships that we wouldn’t otherwise have (5 of 10 responses).
50% 10% 40% 65%

15
“[Ecotrust Canada] are helping to develop [through skill development] the next generation of leaders in our community.”
—community stakeholder
“They’ve helped me personally. I could never have done this without
[Ecotrust Canada].” —client
Analysis Donors responded that Ecotrust Canada delivers “good value” (90%), and likewise, clients and communities generally found our services useful and indicated a high likelihood of using them again. Indeed, a community/client stakeholder commented that they had “never met anyone so effective” as their Ecotrust Canada partner. Another said, “they hire great people who are good
at interpreting what needs to be done.” About two-thirds or more of stakeholders also felt that Ecotrust Canada allocates funds fairly and appropriately based on our mission statement. A third were unsure. Some may lack the appropriate information to answer the questions. Indeed, one community/client stakeholder
suggested that Ecotrust Canada provide “more detailed financial reporting so people can understand what Ecotrust Canada does with the margin between staff costs and daily charges for staff time.”
This comment is likely in regards to our fee-for-service work, which is set at per diem rates ($400-$700) comparable to the low end of market rates for consulting firms and based on the actual cost to Ecotrust Canada. In interviews, one stakeholder thought that this fee was too high; however, overall, 70% of clients and community partners thought that our fees were reasonable.
Some 60% to 80% of community partners and clients felt that Ecotrust Canada provides them with useful skills and effective services. Moreover, 70% said they are still using those skills and tools, suggesting that Ecotrust Canada is indeed delivering lasting value to communities. According to one stakeholder, “Ecotrust Canada stands out in terms of their effectiveness.” “They have done a lot of good work for us,” said another. One reason why communities found the organization effective may be because Ecotrust Canada actually hires community members on projects, which brings valuable jobs and skills into communities.

16
“Shared values [are] the reason we’re so comfortable with Ecotrust Canada. They don’t just have academic qualifications. They are in the field with us.”
—client/community partner.
3. inspiring action Ecotrust Canada’s conservation economy model rests on three pillars: ecological integrity, economic opportunity and social equity. This vision for the future resonates very strongly with our constituents, and is one towards which we will continue to work.
results and targets:
inspiring action.inspiring action.inspiring action.inspiring action. # agree or strongly agree
% agree or strongly agree
Minimum target scores for 2004
Donors Ecotrust Canada seems to share my/our goals 18 of 18 100% 90%Ecotrust Canada inspires me 16 of 18 89% 90%Clients and communities
Ecotrust Canada seems to share my/our goals 9 of 10 90% 90%Staff There is a good fit between my own values and EC’s values as I understand them.
15 of 15 100% 90%
Analysis Results from the survey indicate that all our stakeholder groups share Ecotrust Canada’s values and goals. Moreover, 14 of the 18 funders who responded said that it was our conservation economy model with the social, economic and ecological pillars which was one of the factors
that initially drew them to Ecotrust Canada. “As I got to know what they were doing, I liked the hybrid nature [i.e. environment and economic development together],” one funder said during interviews. These positive attitudes were also shared by staff and community partners, who have grown comfortable with Ecotrust Canada in part because our staff are in
the field working daily with these people. As one client/community partner comments: “Trust has developed over time.”
Still, because the path towards the conservation economy is relatively uncharted, there is some concern about our practicality. One funder expressed concern about the on-the-ground implementation of the vision: “There is trust, a sharing of vision. However, I’m not entirely clear on the vision. I like the philosophical concept, but it’s not clear where all this is going.” Some staff also felt that the organization’s values “could use clearer articulation internally” and another questioned how strongly Ecotrust Canada’s mission actually guides daily operations.
The targets we’ve set related to these comments are addressed in 1. Delivering Value.

17
4. communicating effectively: Being an effective communicator is essential in our role as catalyst and broker with our partners. It is essential inside the organization as well. We also have a mandate to demonstrate through best practices that the conservation economy is not just a “philosophical concept”, as one funder described it, but that it can be, with a little hard work and much intelligence, a practical reality. Effectively communicating this message is also essential in demonstrating to our supporters that their funds are indeed seeding real, practical social change.
results and targets
communicating effectively.communicating effectively.communicating effectively.communicating effectively.
# agree or strongly agree
% agree or strongly agree
Minimum target scores
for 2004Staff I feel connected and up to date on what’s happening around Ecotrust Canada.
6 of 15 40% 65%
Donors When I need to talk to someone at Ecotrust Canada, the person I need is usually available to talk to me within a reasonable time.
15 of 16 94% 90%
Ecotrust Canada communicates openly with me/us. 17 of 18 94% 90%I am satisfied with the level of formal reporting on Ecotrust Canada operations.
13 of 17 76% n.t.
Clients and communities When I need to talk to someone at Ecotrust Canada, the person I need is usually available to talk to me within a reasonable time.
9 of 10 90% 90%
Ecotrust Canada people have enough face-to-face contact with us to work with us effectively.
9 of 10 90% 90%
Ecotrust Canada involves me/us enough in the decisions that affect us.
7 of 9 78%
Ecotrust Canada people really understand the nature of our business/community/project.
6 of 10 60% 65%
Analysis The low score from staff around feeling up to date on what is happening around the organization has prompted an analysis of our internal communications. We have engaged a full-time Communications Manager this year, and part of his role is to develop and steward effective internal communications processes. This work will also tie in to the targets set in Making a Difference, around streamlining and enhancing cross-functionality in our measurement and reporting processes. There was a high level (90%) of satisfaction from client/community stakeholders about their ability to connect and communicate with Ecotrust Canada staff. Stakeholders generally praised our accessibility, especially via telephone. Some client/ community partners did express concern about not being
18
“Focus on communication. Provide honest feedback. Trust that we can handle the truth.”
—funder
involved enough in decision making and about 40% felt that Ecotrust Canada didn’t really understand the nature of their business, community or project. “Ecotrust Canada like other similar groups still has not understood First Nations point of view and too often we feel ‘pushed’ by their own agenda instead of ‘pushing’ them to conform to our own,” stated one stakeholder. “We need more frequent and better quality communication.”
Gauging how effectively Ecotrust Canada communicates to the broader public is difficult to do. One donor suggested that one way to gauge the effectiveness of Ecotrust Canada is to see whether the “message is getting out” and whether there’s a “heightened awareness” in the business community
about the environment. Another funder also suggested that measuring our effectiveness “has to include [the] perception of the organization by the general public.” This comment reaffirms our need to explore how much of our stakeholders’ perceptions that we are, or aren’t, making a difference may stem from communication shortcomings or from impact shortcomings. The targets related to this exploration are noted in Making a Difference.
19
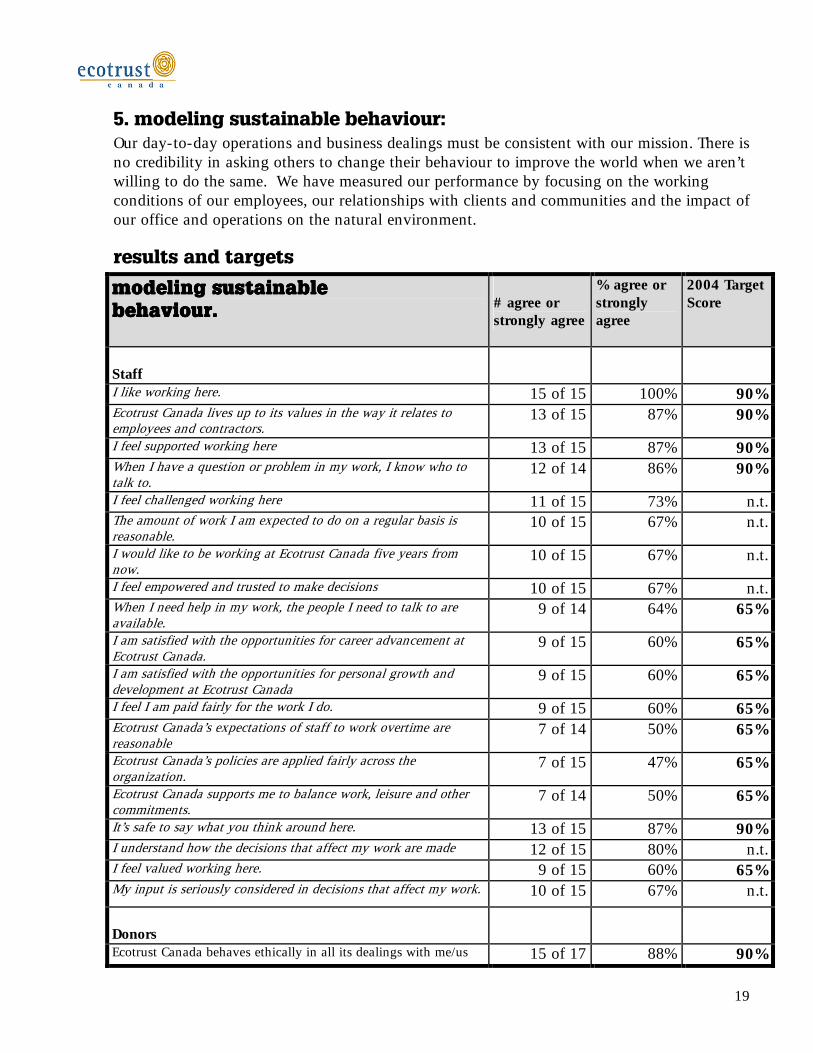
5. modeling sustainable behaviour: Our day-to-day operations and business dealings must be consistent with our mission. There is no credibility in asking others to change their behaviour to improve the world when we aren’t willing to do the same. We have measured our performance by focusing on the working conditions of our employees, our relationships with clients and communities and the impact of our office and operations on the natural environment.
results and targets
modeling sustainablemodeling sustainablemodeling sustainablemodeling sustainable behaviour.behaviour.behaviour.behaviour.
# agree or strongly agree
% agree or strongly agree
2004 Target Score
Staff
I like working here. 15 of 15 100% 90%Ecotrust Canada lives up to its values in the way it relates to employees and contractors.
13 of 15 87% 90%
I feel supported working here 13 of 15 87% 90%When I have a question or problem in my work, I know who to talk to.
12 of 14 86% 90%
I feel challenged working here 11 of 15 73% n.t.The amount of work I am expected to do on a regular basis is reasonable.
10 of 15 67% n.t.
I would like to be working at Ecotrust Canada five years from now.
10 of 15 67% n.t.
I feel empowered and trusted to make decisions 10 of 15 67% n.t.When I need help in my work, the people I need to talk to are available.
9 of 14 64% 65%
I am satisfied with the opportunities for career advancement at Ecotrust Canada.
9 of 15 60% 65%
I am satisfied with the opportunities for personal growth and development at Ecotrust Canada
9 of 15 60% 65%
I feel I am paid fairly for the work I do. 9 of 15 60% 65%Ecotrust Canada’s expectations of staff to work overtime are reasonable
7 of 14 50% 65%
Ecotrust Canada’s policies are applied fairly across the organization.
7 of 15 47% 65%
Ecotrust Canada supports me to balance work, leisure and other commitments.
7 of 14 50% 65%
It’s safe to say what you think around here. 13 of 15 87% 90%I understand how the decisions that affect my work are made 12 of 15 80% n.t.I feel valued working here. 9 of 15 60% 65%My input is seriously considered in decisions that affect my work. 10 of 15 67% n.t.
Donors
Ecotrust Canada behaves ethically in all its dealings with me/us 15 of 17 88% 90%

20
“The workload is immense. Everyone is exceptionally hardworking and expectations are high.”
—staff member
Clients and communities
Ecotrust Canada treats me/us with respect 9 of 10 90% 90%Ecotrust Canada behaves ethically in all its dealings with me/us 9 of 10 90% 90%
Analysis Overall, our relationships with external stakeholders, communities and clients are quite good. Ecotrust Canada scores very high (88%-94%) in our ethical standards and respectful treatment of our partners. Comments from community partners and clients were very positive.
The survey of staff attitudes found that most (between 87%-100%) employees who responded enjoy working at Ecotrust Canada and believe their work is valuable. A large majority of staff
(80%-87%) understands how decisions are made and feel safe to say what they think about the organization and two-thirds feel their input is seriously considered in decisions. There was a relatively large staff turnover of 25% (or 5 people) in 2002: two staff did not return from maternity leaves begun in 2001, and three moved on to other offers.
We were short-staffed for the latter part of the 2002, and gained five new staff in the first half of 2003. Being short-staffed at the time of the survey may be reflected in the scores related to workload and overtime.
Ecotrust Canada employee supervisors have considered the staff results carefully, recognizing the importance of maintaining a challenging yet satisfying workplace. In collaboration with staff and outside human resources consultants, we have taken steps to develop new employee policies for the organization, including compensation polices. We have identified where our existing policies and practices are generous and will maintain these aspects: vacation entitlement, leave allowances, parental benefits, and extended health and dental benefits are some of these. We focused on redefining areas that were rated low by staff: work load, flexible work arrangements, and consistent and fair allocations of resources such as training. Our new policies are expected to take effect in September 2003, and we have begun to build consistent employee management practice.
In 2002, the organization had 22 staff of which 14 (64%) were permanent full time, 4 (18%) were part time and 4 (18%) were on contract. Female staff members made up 38% of the organization and were well represented in management (40%) and on the board of directors (36.4%). There is room for improvement, however: women are underrepresented in program staff (22%) and over-represented in administration (100%). Some ten percent of the staff self-identify as aboriginal compared to 1% in the general B.C. workforce; however some staff members commented that aboriginal people should be even better represented considering how much work we do in First Nation communities.
Ecotrust Canada models sustainable behaviour in other ways, through our green office practices and supplier selection. We constantly seek to improve these practices and have incorporated a section on office purchasing and waste management in our new employee policies. A recent

21
example includes our purchase of Forest Stewardship Council (FSC) certified and locally milled desks for our Vancouver office. Our staff also voluntarily conserve resources in many ways. In Vancouver, staff commute primarily by bicycle, which was a factor in determining where to locate our office. We installed a shower and bike racks to support cycling to work. In our other offices and in travel to communities we are conscious of the economic and environmental costs involved and try to maximize trip effectiveness and thus reduce trips. We source our office supplies through one of our business development clients, which offers “green” alternatives. We purchase 80% (or better) post-consumer recycled paper for our offices and publications. In Vancouver, our office supply of coffee is fair trade and organic. These are just some ways that we have and will continue to adopt best green office practices. We will measure and report our paper usage and electricity usage, as these are the most common office benchmarks.
Paper usage in 2002 (reams per person) 6 reams (3000 sheets) per person Electricity usage in 2002 (Kwh per person) 1173 Kwh per person
Additional target in 2004:
⇒ Measure and report our office paper and electricity usage on an annual per capita basis.
22
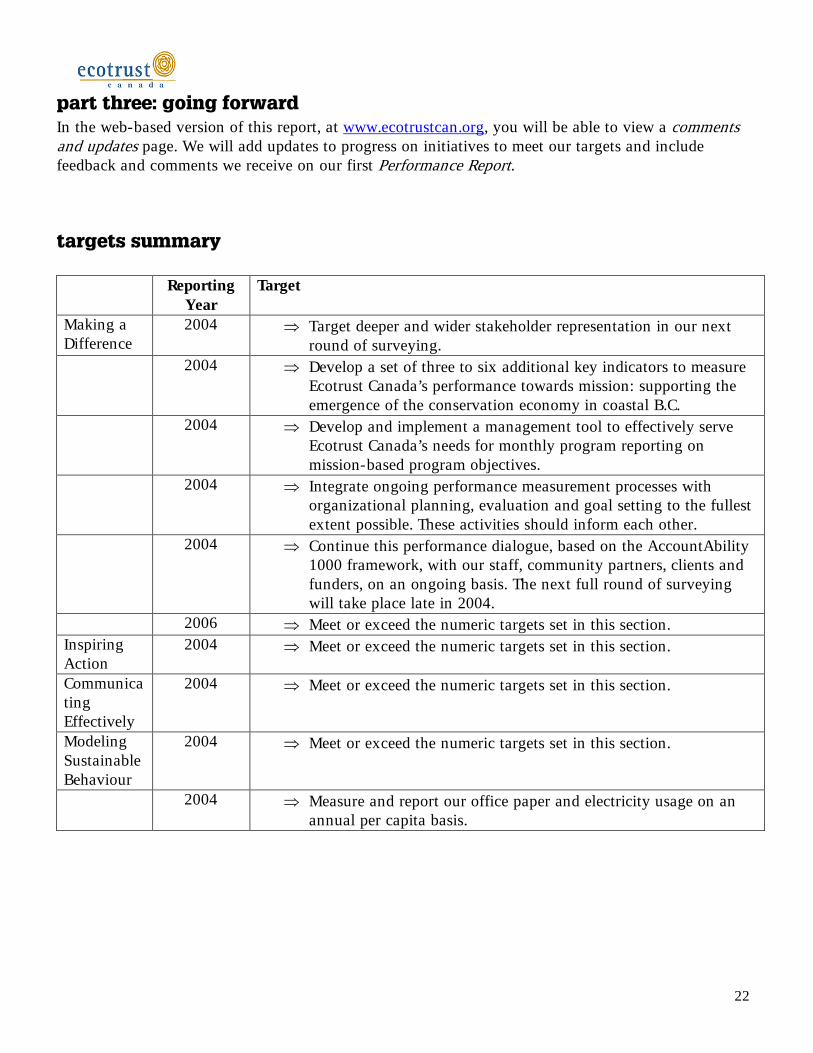
part three: going forward In the web-based version of this report, at www.ecotrustcan.org, you will be able to view a comments and updates page. We will add updates to progress on initiatives to meet our targets and include feedback and comments we receive on our first Performance Report.
targets summary Reporting
Year Target
Making a Difference
2004 ⇒ Target deeper and wider stakeholder representation in our next round of surveying.
2004 ⇒ Develop a set of three to six additional key indicators to measure Ecotrust Canada’s performance towards mission: supporting the emergence of the conservation economy in coastal B.C.
2004 ⇒ Develop and implement a management tool to effectively serve Ecotrust Canada’s needs for monthly program reporting on mission-based program objectives.
2004 ⇒ Integrate ongoing performance measurement processes with organizational planning, evaluation and goal setting to the fullest extent possible. These activities should inform each other.
2004 ⇒ Continue this performance dialogue, based on the AccountAbility 1000 framework, with our staff, community partners, clients and funders, on an ongoing basis. The next full round of surveying will take place late in 2004.
2006 ⇒ Meet or exceed the numeric targets set in this section. Inspiring Action
2004 ⇒ Meet or exceed the numeric targets set in this section.
Communicating Effectively
2004 ⇒ Meet or exceed the numeric targets set in this section.
Modeling Sustainable Behaviour
2004 ⇒ Meet or exceed the numeric targets set in this section.
2004 ⇒ Measure and report our office paper and electricity usage on an annual per capita basis.

23
Appendix One: Census data for the communities where Ecotrust Canada works
1996 Census Data 2001 Census Data
Georgia Basin: GVRD, Fraser Valley RD, CRD, Squamish-Lillooet RD
* Population 2,401,452 2,583,280
* First Nations pop'n (% of total) 49,580 (2.1%) 61,170 (2.4%) * Household income (average) $52,827 N/a * Household income (median) N/a $49,020 * Unemployment 8.7% 7.3% Central Coast: Central Coast RD
* Population 3,921 3,781
* First Nations pop'n (% of total) 2,175 (55.5%) 2,240 (59.2%) * Household income (average) $34,709 N/a * Household income (median) N/a $35,183 * Unemployment 16.7% 20.0% North Coast Haida Gwaii: Skeena - Queen Charlotte RD
* Population 24,795 21,693
* First Nations pop'n (% of total) 8,120 (32.8%) 7,705 (35.5%) * Household income (average) $51,952 N/a * Household income (median) N/a $45,229 * Unemployment 16.5% 16.4% Central Vancouver Island: Comox-Strathcona RD
* Population 97,666 96,131
* First Nations pop'n (% of total) 4,220 (4.3%) 5,125 (5.3%) * Household income (average) $47,405 N/a * Household income (median) N/a $43,196 * Unemployment 11.0% 12.0% Alberni-Clayoquot: Alberni-Clayoquot RD
* Population 31,750 30,345
* First Nations pop'n (% of total) 3,700 (11.7%) 4,905 (16.2%) * Household income (average) $45,300 N/a * Household income (median) N/a $40,271 * Unemployment 12.1% 13.8%

24
Appendix Two: Our social audit process AccountAbility Framework: For more information on the AccountAbility model and to review examples of organizations that have used this framework, visit: www.accountability.org.uk Susan Todd, Solstice Consulting: Solstice Consulting has been the external auditor for three local organizations and an advisor on social auditing for others. Susan Todd, Principal of Solstice, is an accredited member of AccountAbility, the Institute of Social and Ethical AccountAbility. Susan is a BC Chartered Accountant. She has a Masters in Resource Management from SFU, and is no stranger to the marriage of social, environmental and economic development objectives that Ecotrust Canada strives for. For more information on Solstice Consulting visit: www.solsticeconsulting.ca
Our Social Audit Process:
Begin next round of
Stakeholder Dialogue
Review policies & commitments
Decide scope
Stakeholder based design
Define Indicators
Stakeholder consultation
Gather & test data
Draft report
Set commitments and targets
Audit sign-off (not applicable)
Report to stakeholders

25
Appendix Three: Feedback Form
Ecotrust Canada Performance Report Feedback Form
What do you think of our performance report? Do you feel that your input was reflected in the report (if appropriate)? Do you have any suggestions to improve how we measure our progress toward supporting the emergence of the Conservation Economy? Please mail or fax to: Ecotrust Canada 1238 Homer Street, Suite 200 Vancouver, BC V6B 2Y5 Fax: 604-682-1944

26
Appendix Four: Updates and Comments To be updated in the web-based version of the performance report. This is what we’ve been doing to meet our action targets: Here are some comments and questions from people who have read our first performance report: