performance of reinforced concrete buildings in the …
TRANSCRIPT

394
Bulletin of the New Zealand Society for Earthquake Engineering, Vol. 50, No. 3, September 2017
1 PhD Candidate, University of Auckland, Auckland, [email protected] 2 Professor, University of Auckland, Auckland, [email protected] (Member) 3 Professor, University of Canterbury, Christchurch, [email protected] (Member) 4 Technical Director, Beca, Auckland, [email protected] (Member) 5 Senior Project Engineer, Holmes Consulting Group, Christchurch, [email protected] (Member) 6 Chief Engineer, Ministry of Business Innovation and Employment, Wellington, [email protected] (Fellow) 7 Professor, Tohoku University, Sendai, [email protected] 8 Professor, University of Tokyo, Tokyo, [email protected] 9 Senior Research Engineer, Building Research Institute, Tsukuba, [email protected] 10 Masters Student, Tohoku University, Sendai, [email protected]
PERFORMANCE OF REINFORCED CONCRETE
BUILDINGS IN THE 2016 KUMAMOTO EARTHQUAKES
AND SEISMIC DESIGN IN JAPAN
Mehdi Sarrafzadeh1, Ken J. Elwood
2, Rajesh P. Dhakal
3,
Helen Ferner4, Didier Pettinga
5, Mike Stannard
6, Masaki Maeda
7,
Yoshiaki Nakano 8, Tomihisa Mukai
9 and Takuya Koike
10
(Submitted February 2017; Reviewed June 2017; Accepted July 2017)
ABSTRACT
This report outlines the observations of an NZSEE team of practitioners and researchers who travelled to
the Kumamoto Prefecture of Japan on a reconnaissance visit following the April 2016 earthquakes. The
observations presented in this report are focussed on the performance of reinforced concrete (RC) buildings
throughout Kumamoto Prefecture. It was found overall that modern RC buildings performed well, with
patterns of damage which highlighted a philosophy of designing stiffer buildings with less of an emphasis
on ductile behaviour. To explore this important difference in design practice, the Japanese Building
Standard Law (BSL) is summarised and compared with standard New Zealand seismic design practices and
evaluation methods.
INTRODUCTION
Between 14 April and 16 April, 2016, a series of earthquakes
struck Kumamoto Prefecture on Kyushu Island, Japan (Figure
1). An NZSEE reconnaissance team made up of structural
engineering researchers and practitioners (the authors), in
collaboration with a Japanese team funded by Japan Science
and Technology Agency, visited the Kumamoto Prefecture
between 29 June and 3 July 2016. This report is organized to
provide insights on the seismic demands from the earthquake
and observed building performance, followed by a summary
of seismic design actions, assessment procedures for existing
buildings, and post-earthquake damage assessment procedures
used in Japan. Detailed reports on building performance are
provided in Appendices A1-A16 and referenced throughout
the body of the paper.
KUMAMOTO EARTHQUAKE SEQUENCE
The largest foreshock of the Kumamoto sequence occurred at
21:26 JST on 14 April, with a magnitude of Mj 6.5, in the
Northern regions of the Hinagu Fault. This event was followed
by further seismic activity, including the magnitude Mj 7.3
main-shock at 01:25 JST on 16 April due to right lateral
strike-slip movement of the Futagawa Fault. The main-shock
was approximately 15 km South-East of Kumamoto City at a
depth of 12 km [1]. Magnitudes are quoted in Mj, which is the
local magnitude scale calculated by the Japanese
Meteorological Agency (JMA). In Mashiki near the Hinagu
and Futagawa faults, both major events resulted in the
maximum possible intensity of 7 on the Japan Meteorological
Agency Intensity (JMAI) scale. Similar to the Canterbury
Earthquake Sequence, the majority of the significant damage
occurred in the second strong seismic event; but unlike
Christchurch these events occurred so close together there was
insufficient time to fully assess damage from the 14 April
event before the 16 April event occurred just 28 hours later.
Figure 1: Epicentre and fault map of Kumamoto Prefecture.
Adapted from Chiaro et al. (2017) [2]. Inset map of Japan obtained from https://www.kumagaku.ac.jp/english/
(accessed June 2017).
The 2016 April Kumamoto earthquakes resulted in 50
fatalities and almost 3000 injuries, with most deaths occurring
due to collapse of residential houses concentrated in Mashiki
Town to the east of Kumamoto [3]. Death toll and injuries
would likely have been considerably higher if the 14 April
event had not occurred since many people had already
evacuated their houses at the time of the 16 April main-shock.
Multistory reinforced concrete buildings generally performed
very well, most enabling immediate occupancy after the
earthquakes. Damaged multistory buildings were generally
constructed prior to 1981, when the Japanese Building code
was updated following the 1978 Miyagi Earthquake.
395
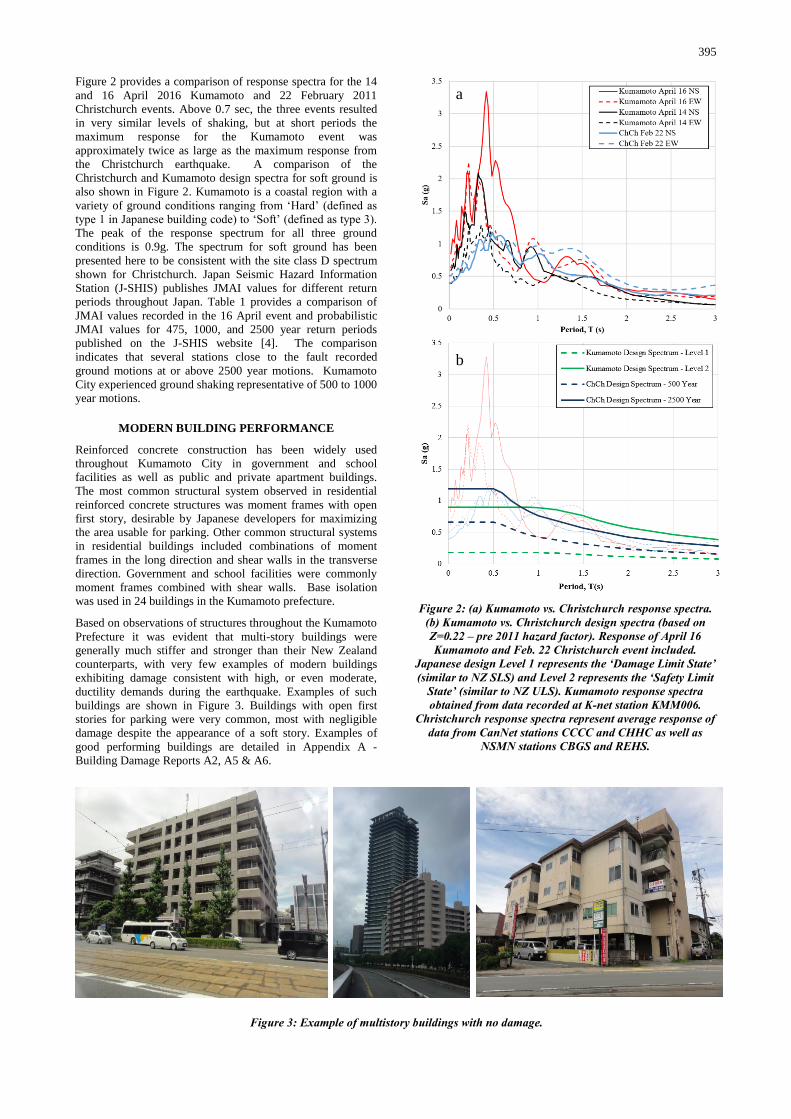
Figure 2 provides a comparison of response spectra for the 14
and 16 April 2016 Kumamoto and 22 February 2011
Christchurch events. Above 0.7 sec, the three events resulted
in very similar levels of shaking, but at short periods the
maximum response for the Kumamoto event was
approximately twice as large as the maximum response from
the Christchurch earthquake. A comparison of the
Christchurch and Kumamoto design spectra for soft ground is
also shown in Figure 2. Kumamoto is a coastal region with a
variety of ground conditions ranging from ‘Hard’ (defined as
type 1 in Japanese building code) to ‘Soft’ (defined as type 3).
The peak of the response spectrum for all three ground
conditions is 0.9g. The spectrum for soft ground has been
presented here to be consistent with the site class D spectrum
shown for Christchurch. Japan Seismic Hazard Information
Station (J-SHIS) publishes JMAI values for different return
periods throughout Japan. Table 1 provides a comparison of
JMAI values recorded in the 16 April event and probabilistic
JMAI values for 475, 1000, and 2500 year return periods
published on the J-SHIS website [4]. The comparison
indicates that several stations close to the fault recorded
ground motions at or above 2500 year motions. Kumamoto
City experienced ground shaking representative of 500 to 1000
year motions.
MODERN BUILDING PERFORMANCE
Reinforced concrete construction has been widely used
throughout Kumamoto City in government and school
facilities as well as public and private apartment buildings.
The most common structural system observed in residential
reinforced concrete structures was moment frames with open
first story, desirable by Japanese developers for maximizing
the area usable for parking. Other common structural systems
in residential buildings included combinations of moment
frames in the long direction and shear walls in the transverse
direction. Government and school facilities were commonly
moment frames combined with shear walls. Base isolation
was used in 24 buildings in the Kumamoto prefecture.
Based on observations of structures throughout the Kumamoto
Prefecture it was evident that multi-story buildings were
generally much stiffer and stronger than their New Zealand
counterparts, with very few examples of modern buildings
exhibiting damage consistent with high, or even moderate,
ductility demands during the earthquake. Examples of such
buildings are shown in Figure 3. Buildings with open first
stories for parking were very common, most with negligible
damage despite the appearance of a soft story. Examples of
good performing buildings are detailed in Appendix A -
Building Damage Reports A2, A5 & A6.
Figure 2: (a) Kumamoto vs. Christchurch response spectra. (b) Kumamoto vs. Christchurch design spectra (based on Z=0.22 – pre 2011 hazard factor). Response of April 16 Kumamoto and Feb. 22 Christchurch event included.
Japanese design Level 1 represents the ‘Damage Limit State’ (similar to NZ SLS) and Level 2 represents the ‘Safety Limit
State’ (similar to NZ ULS). Kumamoto response spectra obtained from data recorded at K-net station KMM006.
Christchurch response spectra represent average response of data from CanNet stations CCCC and CHHC as well as
NSMN stations CBGS and REHS.
a
b
Figure 3: Example of multistory buildings with no damage.

396
These anecdotal observations are supported by the limited red
and yellow placards applied to modern buildings in
Kumamoto Prefecture. A summary of the buildings assessed
in the Mashiki Town area showed that, of the assessed RC
structures, 71% were constructed post 1981 of which 89%
were assessed as undamaged with the remaining 11% being
deemed as only moderately damaged. A common observation
in modern multistory RC residential buildings was shear
failure in “non-structural walls” (See appendix A2 and A8).
These non-structural wall components were made of
reinforced concrete and were commonly tied into the structural
system with what Japanese designers referred to as “half
connections”. This connection is shown in Figure 4, where
only half of the thickness of the wall has reinforcement
extending into the lateral force resisting system. These walls
are referred to as “non-structural” as they are not considered to
contribute to the lateral strength of the building during design,
but are accounted for when determining the stiffness of the
structure. This practice is a contributing factor to the lower
ductility behavior of the observed RC structures.
Figure 4: Typical non-structural wall connection and example of damage to non-structural wall (see Appendix
A2).
Performance of Base Isolated Buildings
Three base isolated multistory RC residential buildings were
inspected in close proximity to Kumamoto city centre. All
three structures had some level of visible damage or residual
displacement, but all had been cleared for occupation and had
generally performed well. Details of the inspection of these
buildings can be found in appendix A5 and A6. Figure 5
provides some examples of the external damage observed.
Figure 5: External damage to base isolated buildings (a) Base Isolated Building No.1 (Appendix A5) (b) & (c) Base
Isolated Building No.2 (Appendix A6).
The reconnaissance team was given access to the basement of
Base Isolated Building No. 1 (Appendix A5) to inspect the
state of the isolation system of the structure. Observations of
the damage (Figure 6) indicate that the building performed
well, however due to some unconventional design choices, the
damping system of the structure sustained heavy damage. The
structure was damped using a combination of steel and lead
dampers (refer to Appendix A5 for plan of isolation system
and location of isolators). All base isolators were connected
through a grid of concrete beams and no damage was observed
to the isolators. The steel dampers were also connected into
the concrete beam grid, however as shown in Figure 6, they
were connected with an eccentricity which contributing to the
damage sustained by the supporting concrete blocks. The lead
dampers were completely excluded from the concrete beam
grid and were simply connected to the concrete slab above by
protruding concrete blocks. Most of the protruding concrete
blocks for the lead dampers displayed similar damage to that
shown in Figure 6 (c), where the concrete block-slab
connection was completely lost.
Location Station ID
Station Distance
from Epicentre
(km)
JMAI Probability of Exceedance in Station Area Kumamoto April 16th Event
JMAI 2% in 50 Yrs
(1/2500)
5% in 50 Yrs
(1/1000)
10% in 50 Yrs
(1/500)
Toyono KMMH14 13.2 6 -/6 + 6 - 5 +/6 - 6 +
Mashiki KMMH16 7.3 6 +/7 6 + 6 - 7
Yabe KMM009 22.3 6 - 5 +/6 - 5 + 6 -
Uto KMM008 12.1 7 6 + 6 + 6 +
Tomochi
(Misato) KMM011 18 6 -/6 + 5 +/6 - 5 +/6 - 6 -
Kumamoto KMM006 4.7 7 6 +/7 6 + 6 +
Yatsushiro KMM012 31.1 7 6 +/7 6 + 6 -
Izumi KMMH09 32.2 6 - 5 + 5 + 4/5 -
Takamori KMM007 34.7 6 - 6 - 5 + 5 +
Tanoura KMM013 49.2 6 +/7 6 -/6 + 6 - 5 +
Kikuchi KMMH03 28 6 -/6 + 6 - 6 - 6 -/6 +
a b c
Table 1: Summary of recorded and probabilistic JMAI values for stations near Kumamoto. JMAI exceedance probabilities were obtained from www.j-shis.bosai.go.jp [4].

397
Access was not obtained to the isolation basement of Base
Isolated Building No.2 and No.3, however, the damage
observed externally was minimal with the exception of shear
failure of a stairwell wall which was concentrated between the
first floor plane of isolation of the main structure and the base
isolation of the stairwell at the ground level (Figure 5b). All
base isolated buildings continued to be occupied after the
earthquakes.
Figure 6: Damage sustained to Steel (a) & (b) and lead (c) dampers below Base Isolated Building No. 1.
Nonstructural Element Performance
Authors observed limited damage to nonstructural elements, in
part due to clean up in the more than two months since the
earthquakes but also due to design features used to minimize
damage. There were many examples of mechanical plants
being housed externally which avoided damage through the
use of flexible connections and appropriate fixings. In cases of
public school facilities, a lack of suspended ceilings and
sprinkler systems was noted with the result being very limited
amounts of damage due to non-structural system failure.
Damage to suspended ceilings in gymnasium facilities was
observed, and in one notable case resulted in emergency
evacuation facilities not being suitable for use following the
earthquake. It was noted by Japanese researchers, that several
facilities in Japan have opted to remove suspended ceilings
since the extensive damage to such systems in the 2011
Tohoku Earthquake. Further details of non-structural element
performance can be found in appendix A16.
PRE-1981 CONCRETE BUILDING PERFORMANCE
Earthquake design in the Building Standard Law of Japan
(BSL; equivalent to the New Zealand Building Statutes –
including NZS1170) was significantly revised in 1981
following damage in the 1978 Miyagi Earthquake. As such,
many pre-1981 buildings do not comply with the current
seismic standard and have performed poorly in past
earthquakes. Figure 7 provides three examples of pre-1980s
concrete buildings with severe damage to columns and beam-
column joints. Appendices A3, A11, and A15 provide further
details on these buildings. Damage observed in such buildings
tended to be concentrated in the first story which typically was
open for parking while non-structural walls provided
additional stiffness on upper stories. From 52 RC buildings
assessed by Japanese authorities in the Mashiki Town area, 15
were constructed prior to 1981 with 5 being deemed
undamaged, 8 moderately damaged and 2 had collapsed.
JAPANESE SEISMIC DESIGN APPROACH
To understand the observed good performance of modern
buildings in this strong earthquake, it is necessary to
appreciate the seismic design approach used in Japan. The
following section describes how seismic design forces are
determined, an overview of the verification steps, and provides
a comparison with NZS 1170.5 design forces.
Scientific study of earthquakes in Japan dates back to the
1880s, with building standards and guidelines only coming
into effect in 1920. Seismic resistant building guidelines or
detailing were not included however, and design standards and
procedures were gradually developed through many
significant seismic events over the decades. The first inclusion
of seismic detailing in building guidelines came in 1924
following significant damage and loss of life in the Tokyo and
Yokohama regions in the 1923 Kanto Earthquake. The Japan
BSL was only introduced in 1950, applying to all forms of
building construction. At the time, BSL did not include
technical guidelines but instead referred to the previous
building guidelines for such requirements. Since the
introduction of BSL, many revisions and additions have been
made, largely based on observed performance and damaged of
buildings in major seismic events. Notable changes to BSL
include major revisions in 1971 and 1981 following the 1968
Tokachi-oki and 1978 Miyagi-ken Oki Earthquakes,
respectively. These revisions included changes to detailing as
well as a focus on the use of larger sections and improved
shear capacity of members. The procedures for the current
seismic design provisions of BSL are largely unchanged after
the 1981 revision. Building damage in seismic events
following the 1981 revision has highlighted the improved
performance of post-1981 buildings relative to the
performance of pre-1971 and pre-1981 construction [5].
The seismic design forces for building design in Japan are
specified in Japan BSL [6]. Two design levels are considered;
Level 1 “damage limit verification” where functionality of the
building must be maintained and Level 2 “safety limit
verification” where life safety must be satisfied. There are no
importance factors used in the determination of seismic loads
in BSL, however guidelines from the Ministry of Land
Infrastructure Transport and Tourism (MLIT) provide a three-
level importance rating in relation to public buildings and
facilities which applies an importance factor to design actions.
Buildings are categorised as Normal (Importance factor = 1),
School or Government Facilities (Importance factor = 1.25)
and finally Hospitals and Emergency Facilities (Importance
factor = 1.5).
BSL design shear force at each storey is calculated by multiplying the full live load and dead load for the storey by
a b c
Figure 7: Examples of damage to pre-1980s concrete buildings.

398
seismic storey shear coefficient, Ci:
𝐶𝑖 = 𝑍 𝑅𝑡 𝐴𝑖 𝐶𝑜 (1)
where,
Co is the standard shear coefficient (0.2 for Level 1 damage
limit verification and 1.0 for Level 2 safety limit verification,
except timber buildings use 0.3 and 1.0, respectively)
Z is the earthquake region coefficient (see Figure 8).
Rt is a value depending on the elastic period of the building
and the ground conditions (see Figure 9)
Ai is a value representing the distribution of seismic shear co-
efficient over the height of the building (see Figure 10) given
as
T
TA i
ii
31
211
(2)
where T is the natural period of the building and i is the ratio
of the cumulative weight from the roof to the ith storey (i.e. Wi
+ Wi+1 +…Wn) to the total building weight (i.e. W1 + W2
+…Wn).
Figure 8: Z values for different locations in Japan. Figure adapted from BSL seismic loading guidelines [6].
Figure 9: Rt values for buildings of different natural period founded on different soil types. Figure adapted from BSL
seismic loading guidelines [6].
Note that the seismic hazard used to arrive at the design forces
in the BSL is not derived from Probabilistic Seismic Hazard
Analysis (PSHA) for PGA or spectral ordinates as is
commonly done in most other countries including New
Zealand. Instead Japan is divided into three regions (plus
Okinawa) based on historical seismicity (see Figure 8), with
each region assigned an earthquake region coefficient (Z) from
1.0 to 0.8 (0.7 for Okinawa only). Much of the populated east
coast of the main island of Japan, Honshu, is in Zone A with
Z=1.0. The majority of Kumamoto Prefecture is assigned
Z=0.9 with some western regions such as Uto City assigned
Z=0.8. The earthquake region coefficients have not changed
in the BSL since 1979. The earthquake region coefficients,
and hence the seismic design forces, vary by less than 25%
across most of Japan. In New Zealand, the hazard factor (Z)
varies between 0.13 for Auckland and Northland to 0.4 in
Wellington and 0.6 close to the Alpine Fault at Otira and
Arthurs Pass.
Figure 10: Sensitivity of Ai to different values of αi. Figure adapted from BSL seismic loading guidelines [6].
It has been suggested that for Zone A (Z=1.0), the damage
limit verification level is intended to represent the demand
corresponding to frequent earthquakes with PGA of about
0.08-0.1g; while the safety limit verification level represents
the demand corresponding to rare earthquakes with PGA 0.3-
0.4g [7].
For Level 1 damage verification, drift in each storey at design
shear is normally limited to a maximum of 1/200 (0.5%); but
may be increased up to 1/120 (0.8%) if there is evidence of
sustaining no substantial damage at this drift limit. Note the
drift is an elastic drift obtained by elastic analysis without any
consideration for ductility.
For buildings shorter than 31 m, the building may be deemed
acceptable by checking the stiffness distribution up the
building and the torsional susceptibility and ensuring that
allowable stresses are not exceeded (see Table 2 (a) & (b) for
allowable stress limits for RC structures).
The final step for buildings under 31 m height is to ensure
sufficient strength through a simplified check of the area of
columns and walls in each story. Based on the primary lateral
load resisting system of the structure being frame or wall
based, Equation 3 (wall) or 4 (frame) is used for the minimum
wall/column area check on each floor. Note pure frame
structures are then also designed to level 2 of the BSL.
𝛴2.5𝛼𝐴𝑤 + 𝛴0.7𝛼𝐴𝑐 ≧ 0.75𝑍𝑊𝐴𝑖 (3)
𝛴1.8𝛼𝐴𝑤 + 𝛴1.8𝛼𝐴𝑐 ≧ 𝑍𝑊𝐴𝑖 (4)
Where: 𝛼 = √𝑓𝑐
′
18, 1 ≦ 𝛼 ≦ √2
𝐴𝑤= Plan area of shear walls in each principal direction on
each floor in mm2.
𝐴𝑐 = Plan area of columns on each floor in mm2.
𝐴𝑖 = Vertical distribution factor as shown in Equation 2.
𝑍 = Seismic zone factor shown in Figure 8.

399
𝑊 = Total weight of the building supported by the floor in
consideration in N.
For Level 2 safety verification, only required when a building
is over 31m or does not meet the stiffness or eccentricity ratio
limits above, the design storey shear force is calculated as:
𝑄𝑢𝑛 = 𝐷𝑠 𝐹𝑒𝑠 𝑄𝑢𝑑 (5)
Where
Qun is the required value of ultimate lateral strength of each
storey
Qud is the elastic shear force acting in each storey due to the
design seismic action (i.e. product of Ci and cumulative storey
weight including full live and dead loads)
Fes is a factor to account for the stiffness irregularity of the
building in height and plan. It is calculated for each story of a
building by multiplying stiffness ratio factor Fs (defined in
Table 3) and the eccentricity ratio factor Fe (defined in Table
4).
Table 3: Calculation of Fs for different stiffness ratios. Table adapted from BSL seismic loading guidelines [6].
Table 4: Calculation of Fe for different eccentricity ratios. Table adapted from BSL seismic loading guidelines [6].
The stiffness ratio, Rs, for each story must satisfy the
following:
𝑅𝑠 =𝑟𝑠
�̅�𝑠≥ 0.6 (6)
where rs is the reciprocal of the relative story drift angle for
each story and rs is the arithmetic mean of all the rs values for
the building.
The eccentricity ratio, Re, of each story must satisfy the
following:
𝑅𝑒 =𝑒
𝑟𝑒< 0.15 (7)
Where e is distance between the centre of mass and stiffness
and re is the “elasticity radius” based on the ratio of the
torsional to lateral stiffness at each story.
Ds is a value representing structural characteristics (damping
and ductility) of the lateral load resisting components in each
storey (see Figure 11). Ds is effectively equal to the inverse of
the assumed design ductility. Figure 11 implies that the
assumed design ductility for concrete frames in the Japan BSL
ranges between 1.8 and 3.3; in contrast to New Zealand where
the design ductility ranges from 1.25 to 6. This means that in
Japanese design practice, elastic demand of regular buildings
is reduced by a factor 1.8 to 3.3 depending on their ability to
deform plastically, whereas in NZ the Sp and K (ductility)
factors can reduce the elastic demand by a factor of six or
more.
Figure 11: Example of Ds values for concrete frames. Figure adapted from BSL seismic loading guidelines [6].
Stiffness Ratio, Rs Stiffness Ratio Factor, Fs
2.0-(Rs/0.6)
1.0
Where Rs represents the stiffness ratio for each story.
Rs ≥ 0.6
Rs < 0.6
Where Re represents the eccentricity ratio for each story.
0.15 < Re < 0.3 Interpolate between 1.0 & 1.5 based on Re
Eccentricity Ratio, Re Eccentricity Ratio Factor, Fe
Re ≤ 0.15 1.0
Re ≥ 0.3 1.50
0.1
0.2
0.3
0.4
0.5
0.6
Ds
Plastic Deformation Class
Moment Frame
Other Frames
Frames in Wall Building
Low High
Table 2: Allowable stress limits for Level 1 'Damage Limit' design for (a) concrete (b) steel reinforcement: Adapted from BSL Article 91. Load cases for stress checks are defined in BSL Article 82 (2) [5]. These combinations
include Dead, Live, Wind, Snow and Seismic loading with consideration given to regions with heavy snow fall.
400
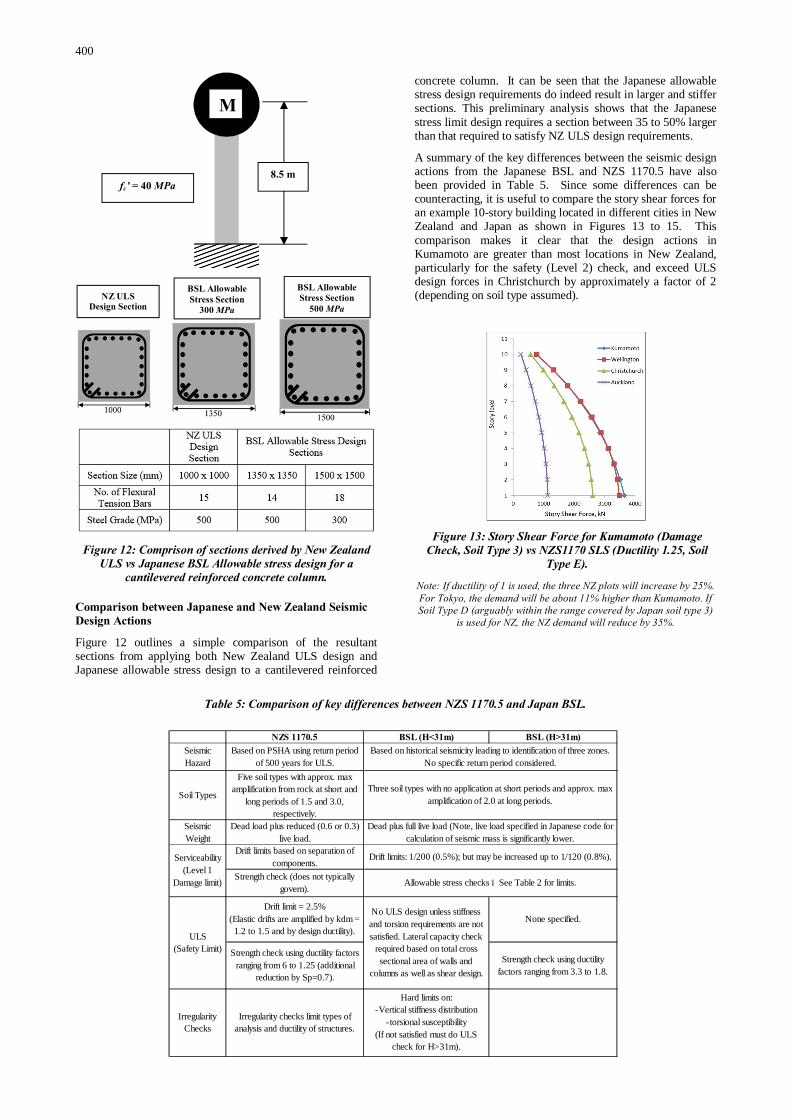
Figure 12: Comprison of sections derived by New Zealand
ULS vs Japanese BSL Allowable stress design for a cantilevered reinforced concrete column.
Comparison between Japanese and New Zealand Seismic Design Actions
Figure 12 outlines a simple comparison of the resultant sections from applying both New Zealand ULS design and Japanese allowable stress design to a cantilevered reinforced
concrete column. It can be seen that the Japanese allowable stress design requirements do indeed result in larger and stiffer sections. This preliminary analysis shows that the Japanese stress limit design requires a section between 35 to 50% larger than that required to satisfy NZ ULS design requirements.
A summary of the key differences between the seismic design actions from the Japanese BSL and NZS 1170.5 have also been provided in Table 5. Since some differences can be counteracting, it is useful to compare the story shear forces for an example 10-story building located in different cities in New Zealand and Japan as shown in Figures 13 to 15. This comparison makes it clear that the design actions in Kumamoto are greater than most locations in New Zealand, particularly for the safety (Level 2) check, and exceed ULS design forces in Christchurch by approximately a factor of 2 (depending on soil type assumed).
Note: If ductility of 1 is used, the three NZ plots will increase by 25%. For Tokyo, the demand will be about 11% higher than Kumamoto. If Soil Type D (arguably within the range covered by Japan soil type 3)
is used for NZ, the NZ demand will reduce by 35%.
Figure 13: Story Shear Force for Kumamoto (Damage Check, Soil Type 3) vs NZS1170 SLS (Ductility 1.25, Soil
Type E).
Table 5: Comparison of key differences between NZS 1170.5 and Japan BSL.
NZS 1170.5 BSL (H<31m) BSL (H>31m)Seismic Hazard
Based on PSHA using return period of 500 years for ULS.
Soil Types
Five soil types with approx. max amplification from rock at short and
long periods of 1.5 and 3.0, respectively.
Seismic Weight
Dead load plus reduced (0.6 or 0.3) live load.
Drift limits based on separation of components.
Strength check (does not typically govern).
Strength check using ductility factors ranging from 6 to 1.25 (additional
reduction by Sp=0.7).
Strength check using ductility factors ranging from 3.3 to 1.8.
Based on historical seismicity leading to identification of three zones. No specific return period considered.
Three soil types with no application at short periods and approx. max amplification of 2.0 at long periods.
Dead plus full live load (Note, live load specified in Japanese code for calculation of seismic mass is significantly lower.
Serviceability (Level 1
Damage limit)
Drift limits: 1/200 (0.5%); but may be increased up to 1/120 (0.8%).
Allowable stress checks – See Table 2 for limits.
No ULS design unless stiffness and torsion requirements are not satisfied. Lateral capacity check
required based on total cross sectional area of walls and
columns as well as shear design.
None specified.
Irregularity Checks
Irregularity checks limit types of analysis and ductility of structures.
ULS(Safety Limit)
Drift limit = 2.5%(Elastic drifts are amplified by kdm =
1.2 to 1.5 and by design ductility).
Hard limits on:-Vertical stiffness distribution
-torsional susceptibility (If not satisfied must do ULS
check for H>31m).
M
fc’ = 40 MPa 8.5 m
NZ ULS Design Section
BSL Allowable Stress Section
300 MPa
BSL Allowable Stress Section
500 MPa

401
Note: Ds=0.3 is assigned for the most ductile category allowed in
Japanese code. For Tokyo, the demand will be about 11% higher than
Kumamoto. If Soil Type D (arguably within the range covered by
Japan soil type 3) is used for NZ, the NZ demand will reduce by 35%.
Note: Ds=0.3 is assigned for the most ductile category in BSL. For
important buildings, the NZ demand will increase by 30% for IL3 and
80% for IL4 (might be larger for IL4 as SLS2 criteria kicks in and ductility of 4 might not be tenable). No change for Japan. Even with
80% increase for an emergency building in Wellington, the building
designed in Tokyo will still be designed for a base shear demand that is almost twice as that for IL4 building in Wellington.
Noting that the drift limits are applied for Level 1 in BSL and
for ULS in NZS 1170.5, it is of interest to compare the ratio of
the drift limits and the elastic design forces as shown in Table
6 for the example 10 story building considered in Figures 13
to 15. The ratios shown in Table 6 suggest that the drift limit
check at ULS for NZS1170.5 is approximately equivalent to
the drift limit check at Level 1 in the Japan BSL and thus this
design parameter cannot be attributed to the overall stiffer
structures which were observed in Japan.
Table 6: Comparison of drift limits in NZS 1170.5 and Japan BSL.
Drift limits (from elastic analysis)
Elastic design shear (from Fig 13)
ULS NZS 1170.5
(Christchurch)
1.7 to 2.1%
(= 2.5% / 1.5 to 1.2) 12800 kN
BSL Damage limit
(Kumamoto) 0.5% to 0.8% 3700 kN
Ratio 2.1 to 4.2 3.5
Some further comparisons of design actions derived from BSL
and NZS 1170.5 are shown in Table 7. It can be seen that
seismic actions for design scenarios in Kumamoto,
comparable to conditions in Christchurch, yield reduced base
shears of up to 3.6 times larger than those from NZS 1170.5.
Table 7: Design base shear coefficient for different design scenarios in NZ and Japan. Note all NZS 1170.5 actions are for 50-year design life and Importance level 2. Hazard and
soil conditions were selected for comparison between typical soft soil conditions in Christchurch and Kumamoto.
JAPANESE SEISMIC EVALUATION OF EXISTING
REINFORCED CONCRETE BUILDINGS
Seismic evaluation of pre-1981 concrete buildings is done in
Japan according to the Japanese Building Disaster Prevention
Association (JBDPA) Standard for Seismic Evaluation of
Existing Reinforced Concrete Buildings [8]. Similar to many
other assessment guidelines and standards internationally (e.g.
ASCE 41 [9], Eurocode 8 Part 3 [10], and draft NZ guideline
Seismic Assessment of Existing Buildings [11]), JBDPA
provides a means of assessing and retrofitting buildings
designed prior to the development of current seismic design
codes. The standard calculates a seismic capacity index, 𝐼𝑆
based on the product of the strength and ductility for each
story of the structure and compares this coefficient to a
seismic demand index, 𝐼𝑆𝑜:
𝐼𝑆 ≥ 𝐼𝑆𝑜 (8)
The seismic capacity index, 𝐼𝑆 is the minimum value of 𝐼𝑖 𝑆
(Equation 9) determined on a floor-by-floor basis in each
principal direction of the building. It is dependent on the
strength and ductility of structural members with modifiers for
age and shape of the building.
𝐼𝑆𝑖 = 𝐸0𝑖 . 𝑆𝐷. 𝑇 (9)
Where, 𝑖 = signifies the floor number, 𝑆𝐷 = irregularity index
related to the shape of the building, T = aging index and 𝐸0 =
seismic capacity index.
The seismic capacity index, 𝐸0 is dependent on the ductility
and strength of the structural elements on each floor, and
hence, a representation of the energy dissipation capacity of
these elements. 𝐸0 is calculated based on Equation 10:
Height, m 14 14 35 35 60 60
SLS ULS SLS ULS SLS ULS
Weight, KN 7920 7920 20400 20400 41200 41200
Soil Type Soft, D Soft, D Soft, D Soft, D Soft, D Soft, D
Period, s 0.5 0.5 1 1 1.6 1.6
Ch(T) 3 3 1.93 1.93 1.358 1.358
Z Factor 0.3 0.3 0.3 0.3 0.3 0.3
R Factor 0.25 1 0.25 1 0.25 1
Ductility 1.25 4 1.25 4 1.25 4
Sp Factor 0.7 0.7 0.7 0.7 0.7 0.7
Kμ Factor 1.18 3.14 1.25 4 1.25 4
Design Cd 0.133 0.201 0.081 0.101 0.057 0.071
NZS 1170.5
Height, m 14 14 35 35 60 60
Level 1 Level 2 Level 1 Level 2 Level 1 Level 2
Weight, KN 7920 7920 20400 20400 41200 41200
Soil Type Soft 3 Soft 3 Soft 3 Soft 3 Soft 3 Soft 3
Period, s 0.28 0.28 0.7 0.7 1.2 1.2
Rt Factor 1 1 1 1 0.95 0.95
Z Factor 0.9 0.9 0.9 0.9 0.9 0.9
Co Factor 0.2 1 0.2 1 0.2 1
Ductility Factor, Ds N/A 0.3 N/A 0.3 N/A 0.3
Irregularit Factor, Fes N/A 1 N/A 1 N/A 1
Base Shear, KN 1425.6 7128 3672 18360 7045.2 35226
Elastic Design Cd 0.180 0.900 0.180 0.900 0.171 0.855
Reduced Design Cd N/A 0.270 N/A 0.270 N/A 0.257
Japan Building Standard Law
Figure 14: Story Shear Force for Kumamoto (Safety Check, Soil Type 3, Ds=0.3) vs NZS1170 ULS (IL2, Ductility 4, Soil
Type E).
Figure 15: Story Shear Force for Tokyo (Safety Check, Soil Type 2, Ds=0.3) vs NZS1170 ULS (IL2, Ductility 4, Soil Type C).
402
𝐸0𝑖 = C𝑖 . F𝑖 . 𝜙 (10)
where, C𝑖 = Strength index at ith floor, F𝑖 = Ductility index at
ith floor and ϕ = Story shear distribution index estimated
simply as𝑛+1
𝑛+𝑖, where n is the number of stories in the building.
The seismic demand index, 𝐼𝑆𝑜 is determined as per Equation
11:
𝐼𝑆𝑜 = 𝐸𝑠. 𝑍. 𝐺. 𝑈 (11)
where, 𝐸𝑠 = Basic Seismic Demand index equal to 0.8 for
level 1 screening, 0.6 for level 2 and 3 screening, Z = Zone
index from Figure 8, G = Ground index, accounting for
amplification effects of the surface soil and U = Importance
Factor as described in the previous section on the Japanese
BSL.
As previously alluded to, the JBDPA evaluation guide
provides three different procedures for the calculation of the
strength (C) and ductility (F) indices. The three levels increase
in complexity and accuracy, such that an engineer will
typically start with Level 1 and only proceed to Level 2 or 3 if
requirements are not satisfied. These procedures are briefly
described below but further details of all three levels can be
found in Section 3 of the JBDPA Standard for Seismic
Evaluation of Existing Reinforced Concrete Buildings.
Level One
Simplest method which may be considered analogous to a
screening method or the Initial Evaluation Procedure (IEP) in
New Zealand.
Strength Index, C: Calculated based on the cross-sectional
area of walls and columns on each floor.
Ductility Index, F: For this level the vertical elements are
categorized into two groups, walls and columns (F = 1.0), and
short columns (F = 0.8).
Level Two
This method assumes a story mechanism as this is the most
common mechanism observed in damaged buildings in Japan.
Strength Index, C: C is calculated from the ultimate lateral
load carrying capacity of vertical members (columns and
walls) with the assumption that beams are “strong enough” to
force a strong-beam-weak-column mechanism. The strength
index calculation in this level, considers the failure mode of
the vertical load carrying elements i.e. shear/flexure controlled
columns and walls, as well as brittle columns. The index is
calculated based on the minimum of the ultimate shear
strength, Qsu and the shear force Qmu at the development of a
flexural mechanism. Where Qsu is the lower of the two, the
member is classified as shear-controlled and where Qmu is the
lower the member is classified as flexure-controlled.
Ductility Index, F: The Guideline provides a set of equations
for the determination of the ductility index at each floor based
on the classification of the vertical elements as shear or flexure
controlled from the calculation of the C index.
Level Three
This is similar to the procedure in Level Two except that the
collapse mechanism of the building is determined from
analysis rather than assuming a story mechanism.
Strength Index, C: The effect of earthquake induced axial
loads are now taken into consideration in the calculation of the
ultimate load carrying capacities. A detailed analysis is used to
determine the location of hinges in the structure based on a
comparison of beam and column yield moments at joints.
Ductility Index, F: A set of detailed equations are provided for
the determination of the ductility index, in accordance with the
vertical member classification provided in the Level Three
procedure. The classification system includes categories for
flexure-controlled and shear-controlled beams and walls with
uplift.
Since 𝑆𝐷, T, ϕ, Z, G, U are frequently equal to 1.0, the
methodology effectively simplifies down to:
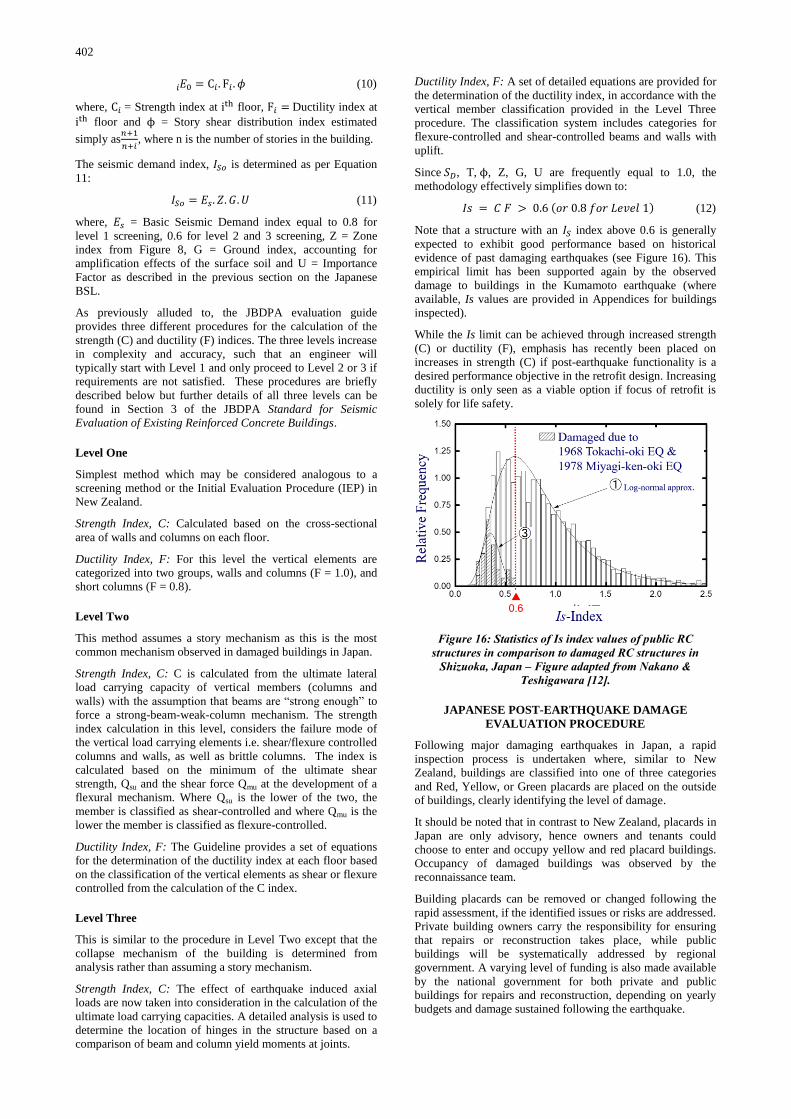
𝐼𝑠 = 𝐶 𝐹 > 0.6 (𝑜𝑟 0.8 𝑓𝑜𝑟 𝐿𝑒𝑣𝑒𝑙 1) (12)
Note that a structure with an 𝐼𝑆 index above 0.6 is generally
expected to exhibit good performance based on historical
evidence of past damaging earthquakes (see Figure 16). This
empirical limit has been supported again by the observed
damage to buildings in the Kumamoto earthquake (where
available, Is values are provided in Appendices for buildings
inspected).
While the Is limit can be achieved through increased strength
(C) or ductility (F), emphasis has recently been placed on
increases in strength (C) if post-earthquake functionality is a
desired performance objective in the retrofit design. Increasing
ductility is only seen as a viable option if focus of retrofit is
solely for life safety.
Figure 16: Statistics of Is index values of public RC structures in comparison to damaged RC structures in
Shizuoka, Japan – Figure adapted from Nakano & Teshigawara [12].
JAPANESE POST-EARTHQUAKE DAMAGE
EVALUATION PROCEDURE
Following major damaging earthquakes in Japan, a rapid
inspection process is undertaken where, similar to New
Zealand, buildings are classified into one of three categories
and Red, Yellow, or Green placards are placed on the outside
of buildings, clearly identifying the level of damage.
It should be noted that in contrast to New Zealand, placards in
Japan are only advisory, hence owners and tenants could
choose to enter and occupy yellow and red placard buildings.
Occupancy of damaged buildings was observed by the
reconnaissance team.
Building placards can be removed or changed following the
rapid assessment, if the identified issues or risks are addressed.
Private building owners carry the responsibility for ensuring
that repairs or reconstruction takes place, while public
buildings will be systematically addressed by regional
government. A varying level of funding is also made available
by the national government for both private and public
buildings for repairs and reconstruction, depending on yearly
budgets and damage sustained following the earthquake.

403
Figure 17 shows the building assessment process following an
earthquake. Following the rapid assessment procedure, a more
detailed damage assessment is then carried out. In Japan, the
residual seismic capacity of buildings is currently defined by
the R-index in accordance with the Japanese Damage
Evaluation Guideline (JDEG). The guideline, established in
1991, was originally based on the evaluation of buildings with
a story-collapse failure mechanism, being the most common
failure mechanism in Japanese RC buildings. A revision of the
guideline was released in 2015, with the inclusion of an R-
index evaluation method for buildings where a full frame
mechanism develops with yielding of beams throughout the
structure.
The general calculation for the residual seismic capacity ratio,
R-index, is shown in Equation 13:
𝑅 =𝐼𝐷 𝑆
𝐼𝑆 .100 (13)
Where, 𝐼𝑆 = original seismic capacity index discussed
previously and 𝐼𝐷 𝑆 = post-earthquake seismic capacity
discussed below.
Similar to the 𝐼𝑆 index, the 𝐼𝐷 𝑆 index (Equation 14) is also
determined based on the strength (C) and ductility (F) indices.
A seismic capacity reduction factor, ɳ is also applied to these
indices when calculating 𝐼𝐷 𝑆. The reduction factor take into
consideration the deterioration in the energy dissipation
capacity of each structural element, represented by the product
of the strength and ductility indices. 𝐼𝐷 𝑆 is determined on a
floor by floor basis in each principal direction.
𝐼𝐷 𝑆 = Σ(𝜂. 𝐶. 𝐹). 𝑆𝐷. 𝑇 (14)
The reduction factor ɳ, are determined for all structural
elements on a floor to calculate the 𝐼𝐷 𝑆 index. In practice
these reduction factors are determined through inspection of
the structural elements and classification of their damage state
as described by the JDEG guidelines. For RC Buildings,
JDEG defines five levels of damage for both ductile and brittle
elements which are used to classify individual structural
elements (Table 8 & 9).
Table 8: JDEG Damage Level Classification for ductile vertical elements. Adapted from Maeda et al. 2014 [13].
Damage Class Observed Damage on Structural Members
I Some cracks found. Crack widths smaller than
0.2mm.
II Cracks widths of 0.2 - 1mm are found.
III Some heavy cracks of 1 – 2mm wide are
found. Some concrete spalling is observed.
IV Many heavy cracks are found. Crack widths
larger than 2mm. Reinforcing bars exposed due to spalling of cover concrete.
V Buckling of reinforcement, crushing of
concrete core, vertical deformation of columns and/or shear walls. Subsidence of upper floor
and/or fracture of reinforcing bars are observed
in some cases.
Table 9: JDEG Damage Level Classification for brittle vertical elements. Adapted from Maeda et al. 2014 [13].
Damage Class Observed Damage on Structural Members
I Some cracks found. Crack widths smaller than
0.2mm. Diagonal X crack patterns may be visible.
II Cracks widths of 0.2 - 1mm are found.
Diagonal X crack patterns may be visible.
III Some heavy cracks of 1 – 2mm wide are found. Some concrete spalling is observed.
Diagonal X crack patterns may be visible.
IV Many heavy cracks are found. Crack widths
larger than 2mm. Reinforcing bars exposed due to spalling of cover concrete. A significant
reduction in both lateral and vertical load carrying capacity of vertical elements.
V Buckling of reinforcement, crushing of
concrete core, vertical deformation of columns
and/or shear walls. Subsidence of upper floor and/or fracture of reinforcing bars are observed
in some cases. Widening of X-shape shear
cracks and sudden loss of lateral and vertical load carrying capacity of structural elements.
Each class is defined with observable characteristics of the
sustained damage with key factors used to differentiate ductile
and brittle elements such as distinct crack patterns. In the
latest edition of JDEG, elements are further classified into
ductile, quasi-ductile and brittle columns, shear walls and
beams. As described by Maeda et al. [13], the η factors in the
guideline were determined based on experimental data where
η is calculated based on the residual energy dissipation
capacity of a structural element as shown in Figure 18.
Figure 17: Flow diagram summary of Japanese Damage Evaluation and Rehabilitation Guideline. Adapted from
Maeda et al. 2014 [12].

404
Figure 18: Seismic Capacity Reduction Factor. Adapted from Maeda et al. [13].
The resultant R-index which is obtained from application of
JDEG can be used to classify the building into the following
categories shown in Table 10.
Table 10: JDEG R-index Building Damage Classification. Adapted from Maeda et al. 2014 [13].
Damage Level Residual Capacity
Slight Damage R ≥ 95%
Minor Damage 80 ≤ R < 95%
Moderate Damage 60 ≤ R < 80%
Severe Damage R < 60%
Collapse R = 0%
Figure 19: R-index evaluation results vs Engineer’s expert judgment for RC school buildings damaged in 1995 Kobe
Earthquake and 2011 East Japan Earthquake. Figure adapted from Maeda et al. [13].
The 95% threshold has been set to correspond with the
serviceability level performance of buildings and hence
buildings with 95% or above R-index do not require any
rehabilitation. JDEG provides guidance based on the intensity
of the earthquake, R-index of the superstructure and
foundation, the cases which required rehabilitation or in severe
cases detailed analysis for further options and finally
demolition. Maeda et al. (2014) outlines the results of the
application of JDEG to 70 RC school buildings following the
2011 East Japan Earthquake and 140 RC school buildings
following the 1995 Kobe Earthquake. The results of this
analysis have been plotted against the judgment of experts
based on their observations of these buildings. This plot is
shown in Figure 19 and the close correlation between the R-
index boundaries shown in Table 10 and expert’s judgment is
evident.
CONCLUDING OBSERVATIONS
The April 2016 Kumamoto earthquakes share similarities with
the 2010-11 Canterbury Earthquake Sequence; both comprised
of multiple damaging events, including a shallow event in
close proximity to a major urban center and similar levels of
shaking for structures with periods above 0.7s. These
similarities provide a unique opportunity for comparison of
building performance in the two countries and possible lessons
for structural design.
The observations from Kumamoto particularly highlighted a
difference in the resilience of New Zealand and Japanese
buildings and the subsequent impact on the city as a whole.
The overarching impression in Kumamoto was of a
functioning city with the majority of the population being able
to carry on with their daily lives with minimal disruption, and
no sight of closed off areas or “Red Zones” two months after
the earthquake. In contrast, an exclusion zone was maintained
in Christchurch CBD for over 2 years following the February
2011 earthquake.
Modern code designed structures in Kumamoto sustained
limited damage and exhibited good performance on the whole.
The inspected buildings pointed to a design philosophy
emphasising stiffer and stronger buildings than those
commonly seen in New Zealand and few examples of high
ductility demands were noted. Observations of stiffer and
stronger structures have been supported by the analysis of the
Japanese BSL seismic design guidelines. As outlined in this
report, Japanese structures are designed to higher base shears
and assume ductility of 1.8 to 3.3, compared to design
ductility of 1.25 to 6.0 in New Zealand. The Japanese BSL
adopts a simple allowable stress design approach for the Level
1 design, typically resulting in larger and stiffer sections than
New Zealand ULS design. On the other hand, the BSL does
not focus on the identification of ductile mechanisms and
capacity design to the same extent as New Zealand Standards.
It is also worth noting that the seismic design forces in the
BSL have not changed since 1981, while NZS design forces
change frequently as the science for determining probabilistic
seismic hazard evolves. While many codes in the world have
“scientifically progressed” from seismic zones to probabilistic
assessment of hazard, the Japanese BSL has remained far
more stable by avoiding the delusional precision of estimating
future earthquake demands and the reliance on a constantly
changing science in setting building design forces.
Non-structural elements were also observed to have performed
favorably in the Kumamoto earthquake. Proactive practices
such as passive fire resistance and removal of suspended
ceiling panels were also observed in order to minimise internal
damage due to nonstructural systems and allow offices and
schools to return to a functioning state as rapidly as possible.
The implementation of post-earthquake rapid assessment was
also observed in Kumamoto, using a tagging procedure similar
to the system used in New Zealand. Unlike the New Zealand
system, however, the building tags are only advisory in nature,

405
and although they are largely adhered to by the public they are
not strictly enforced. There was also an emphasis in damaged
areas to maintain community services in place with
government and school facilities being kept on site through the
use of temporary offices and classrooms.
Overall, the observations of the performance and community
response in Kumamoto highlighted similar goals to New
Zealand where life safety was concerned; however, in terms of
resilience and return to function, the observations were quite
contrasting to what was experienced in New Zealand
following both the Christchurch and Kaikoura Earthquakes.
This contrast suggests that the New Zealand structural
engineering profession should carefully consider if the widely
accepted design philosophy relying on high ductility response
of modern structures could be replaced by a focus on strength
and stiffness leading to lower ductility demands and faster
recovery after earthquakes.
Research is required to identify the cost of such changes to
building designs in New Zealand and potential architectural
impacts due to the need for larger structural elements. Cost
considerations must not only include higher up-front costs, but
also savings in terms of life cycle costs due to lower damage
in future earthquakes.
The authors encourage the continued exchange and
comparison of design philosophies and field experiences
between the earthquake engineering professions of Japan and
New Zealand.
ACKNOWLEDGEMENTS
The authors gratefully acknowledge the financial assistance of,
the J-Rapid grant from JST (Japan Science and Technology
Agency), NZSEE, QuakeCoRE, MBIE Building Performance
Branch, Beca and Holmes Consulting. A Special thanks to all
members of the J-Rapid team, Assoc. Prof Yasushi Sanada,
Joji Sakuta, Masanobu Sakasita, Akihiro Nakamura, Tomomi
Suzuki and Norihiro Hosoya for their help during the visit to
Kumamoto. Also thank you to Prof Kabeyasawa, Chair of AIJ
Reconnaissance Committee, and his colleagues for insights on
the performance of concrete buildings during workshop at
University of Tokyo. Finally a special thanks to Maria Dela
Torre from Beca for her efforts with formatting of the report.
REFERENCES
1 Epstein W, Nishimoto T, Okumura K, Swan S and Yanev
P (2016) “The Kumamoto Earthquake Investigation: A
Preliminary Report”.
2 Chiaro G, Alexander G, Brabhaharan P, Massey C, Koseki
J, Yamada S and Aoyagi Y (2017). “Reconnaissance
report on geotechnical and geological aspects of the 2016
Kumamoto Earthquake, Japan”. Bulletin of the New
Zealand Society for Earthquake Engineering, 50(3): 365-
393.
3 The Japan Times (2016). “Last Kumamoto quake victim
ID’d leaving death toll at 50”.
http://www.japantimes.co.jp/news/2016/08/14/national/las
t-kumamoto-quake-victim-idd-bringing-toll-
50/#.WATfj4OLS9I, Retrieved [November 13, 2016]
4 Japan Seismic Hazard Information Station (2016). “J-
SHIS Japan Seismic Hazard Information”. http://www.j-
shis.bosai.go.jp/map/?lang=en, Retrieved [November 13,
2016].
5 Kabeyasawa T and Shiohara H (2003). “Performance-
based Engineering for Earthquake Resistant Reinforced
Concrete Structures: A Volume Honoring Shunsuke
Otani”. Department of Architecture, Faculty of
Engineering, University of Tokyo, Tokyo, 550 pages.
6 The Building Standard Law of Japan (2016). “The
Building Center of Japan (BCJ)”. Tokyo, Japan.
7 Teshigawara M (2011). “Preliminary Reconnaissance
Report of the 2011 Tohoku-Chiho Taiheiyo-Oki
Earthquake”. Geotechnical, Geological and Earthquake
Engineering, Appendix A.
8 Building Research Institute (2004). “Standard for Seismic
Evaluation of Existing Reinforced Concrete Buildings,
2001”. Japan: The Japan Building Disaster Prevention
Association.
9 ASCE 41-06 (2006). “Seismic Rehabilitation of Existing
Buildings”. American Society of Civil Engineers, Reston,
Virginia.
10 Eurocode 8 Part 3 (2005). “Assessment and Retrofitting of
Buildings”. European Committee for Standardization,
Brussels, Belgium.
11 Elwood KJ, Marder K, Pampanin S, Cuevas Ramirez A,
Kral M, Smith P, Cattanach A and Stannard M (2016).
“Draft framework for assessing residual capacity of
earthquake-damaged concrete buildings”. Proceedings of
the Annual NZSEE Conference, Christchurch, New
Zealand.
12 Nakano Y and Tashigawara M (2007). “Seismic
Evaluation and Rehabilitation of Vulnerable RC Buildings
– Experiences and Lessons in Japan”. Indonesia-Japan
Joint Seminar on Mapping out Strategies for Better
Seismic Disaster Mitigation, Jakarta, Indonesia.
13 Maeda M, Matsukawa K and Ito Y (2014). “Revision of
Guideline for Post-Earthquake Damage Evaluation of RC
Buildings in Japan”. Proceedings of the Tenth U.S.
National Conference on Earthquake Engineering,
Anchorage, Alaska.
https://nees.org/resources/11882/download/10NCEE-
000942.pdf (accessed April 2017).

406
APPENDIX A
BUILDING DAMAGE REPORTS
Building Damage Report - A1
Item Details
Street Address/Location Apartment C: Irichimachi, Uto City
Construction Year 1998
Building Description Private residential apartments. Structural form is regular in plan with pilotis ground floor.
Building Footprint / Floor Area 48x12m
No. of storeys / basements 4
Structural system Regular RC moment-frames with flat-slab floor system. Transverse end walls, and walls
around the stairs. Infill walls non-structural, insitu RC stairs.
Earthquake resisting system RC MRFs + end walls in transverse direction. Some contribution likely from the walls
associated to the stairs although uncertain if intended.
Foundation system Uncertain but possibly shallow footings due to spreading of wall bases away from the
footprint.
Past seismic strengthening None
Likely Design Standards Latest Japanese Design Code (post 1981)
Plan showing floor slab outline and full-height structural elements and photo locations.
Photo 1: North-east part elevation.
Photo 2: South-west part elevation.
Photo 3: Column hinge and end wall footing spread
Photo 4: Plastic hinge at top of column.

407
Photo 5: Column plastic hinge with intact concrete core.
Observations
The damage observed from the outside of this building
was limited to the ground floor only. All of the columns
had formed plastic hinges at the top of the columns and
very limited damage was observed at the column bases.
Possibly there is column damage below ground level.
The column plastic hinges may be due to capacity design
not being followed through completely with the interaction
of the first floor transfer slab. There appeared to be bars
terminated within the top of the ground floor columns,
however it is uncertain if these are column bars or 90
degree bends from slab and beam steel. Generally the
hinge was well confined, with the concrete core remaining
intact, although vertical bar buckling was observed in
many locations.
The end transverse walls had formed horizontal cracks as a
result of the wall folding against the Level 1 transfer slab.
There was also noticeable spread of the wall base away
from the building, indicating that the footings were not
tied into the rest of the building foundation system.
The walls around the stairs had limited damage. Given the
short MRF bays in the longitudinal direction is likely that
these were not intended to act as seismic resistance.
Details of the slab connections could not be observed to
understand if the stair areas were effectively isolated from
the main building.
Building Damage Report – A2
Item Details
Street Address/Location Yasuyomachi 558-1. Chuo District, Kumamoto City
Construction Year 1991
Building Description Private residential apartments
Building Footprint / Floor Area 50x12m + 15x10m wing towards river
No. of storeys / basements 11
Structural system RC moment-frames with flat-slab floor system with transverse walls and walls around
service cores. Insitu RC stairs. Non-structural infill walls connected to MRF beams
Earthquake resisting system RC MRFs + walls in transverse direction
Foundation system Uncertain. Presumably piles
Other notable features Over central bike store/walk-through a ‘non-structural’ infill panel transfers out at first
suspended floor level.
Past seismic strengthening None
Likely Design Standards Designed to Current Code approach
Plan showing floor slab outline with known full-height structural elements and photo locations.
Photo 1: North-west elevation.

408
Photo 2: East part elevation.
Photo 3: Typical infill concrete wall shear cracking due to interaction with moment frame beams.
Photo 4: Moment frame beam flexural hinging in regions not affected by infill walls.
Photo 5: Foundation settlement at base of shear walls due to rocking.
Observations
Well distributed flexural cracks in some of the moment-
frame beams, but no cracking in the columns or joint
regions. This would suggest that the strong-column weak-
beam design intent for the moment-frames was achieved
where the infill walls didn’t interfere with the frame
response.
Some damage observed to the pavement around the core-
walls on the north-west side of the building and settlement
relative to the surrounding pavement. This suggests that
the walls (particularly those attached the perimeter of the
building) have rocked with limited soil failure. The
foundation system is unknown but if these cores were not
considered part of the primary lateral-force resisting
system then they may not have the same foundation
treatment as the rest of the building.
Within each moment-frame bay, ‘non-structural’
reinforced concrete infill walls were used to define
windows and doors, however these were constructed to be
integral with the moment-frames. Extensive shear cracking
was observed in these elements.
The observed damage in this building represented typical
reinforced concrete design and construction practice that is
understood to have been applied in Japanese seismic
design for a number of years under previous design codes,
and to some extent under the current code. The rigidly
connected ‘non-structural’ panel approach has only
recently has been phased out of standard practice.
Building Damage Report – A3
Item Details
Street Address/Location Demachi 1-5, Nishi District, Kumamoto City, north of Kumamoto Castle
Construction Year 1975
Building Description Apartments
Building Footprint / Floor Area ~700m2
No. of storeys / basements 7 stories (no basement)
Structural system RC moment frame. No apparent structural walls in building.
Earthquake resisting system RC moment frame with pilotis ground floor for parking
Foundation system Unknown
Past seismic strengthening None
Likely Design Standards Pre-1981 code

409
Plan showing building layout with known full-height structural elements and photo locations
(note walls shown in blue were not clearly structural walls)
Elevation A
Elevation B
Elevation C
Elevation D
Elevation E
410
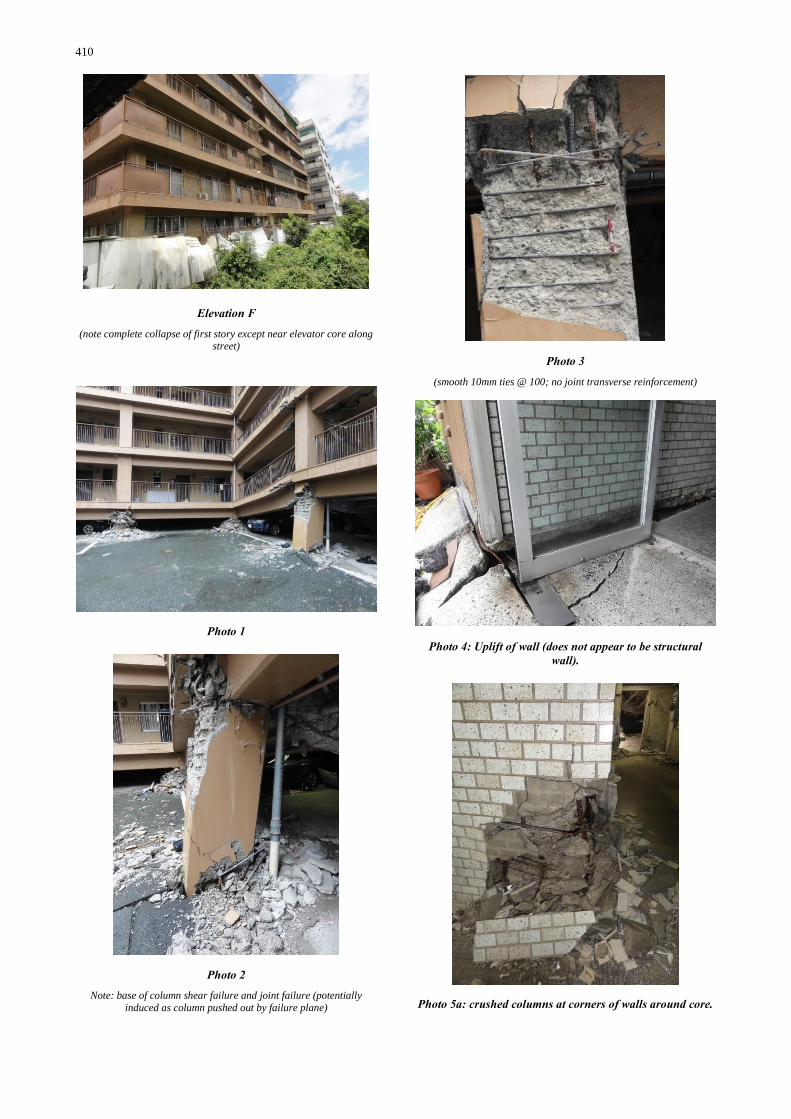
Elevation F
(note complete collapse of first story except near elevator core along street)
Photo 1
Photo 2
Note: base of column shear failure and joint failure (potentially
induced as column pushed out by failure plane)
Photo 3
(smooth 10mm ties @ 100; no joint transverse reinforcement)
Photo 4: Uplift of wall (does not appear to be structural wall).
Photo 5a: crushed columns at corners of walls around core.

411
Photo 5b: crushed columns at corners of walls around core.
Photo 6: Damage to first floor diaphragm at wall (similar damage not apparent on other levels).
Photo 7
Observations
Complete collapse of first story except along street.
RC walls around elevator and stairs not structural (limited
anchorage to foundation), but may have contributed to
torsional response of building.
No apparent structural walls in building.
Most columns crushed and unable to identify mode of
failure.
Photos 1-3 show column with shear failure at base and
joint failure – expect shear failure occurred first followed
by joint failure when column slides down shear failure
plane and is forced outward.
Photo 6 shows damage to diaphragm near core (possible
shear damage), but similar damage not observed at upper
levels and thus believed to be damage induced by bending
(or compression) of slab during collapse.
Two similar buildings located next door and across the
street did not collapse (Refer building summary A4 for
description of building across the street).
Building Damage Report – A4
Item Details
Street Address/Location Nishi District, Kumamoto City, north of Kumamoto Castle
Date of construction 1970
Description / Building Occupancy Apartments
Building Footprint / Floor Area ~700m2
No. of storeys / basements 7 stories (no basement)
Structural system RC moment frame
Earthquake resisting system RC moment frame with walls, pilotis ground floor for parking
Foundation system unknown
Stair System unknown
Past seismic strengthening none
Likely Design Standards Pre-1981 code
Other Across street from building described in Appendix A3 (collapsed)
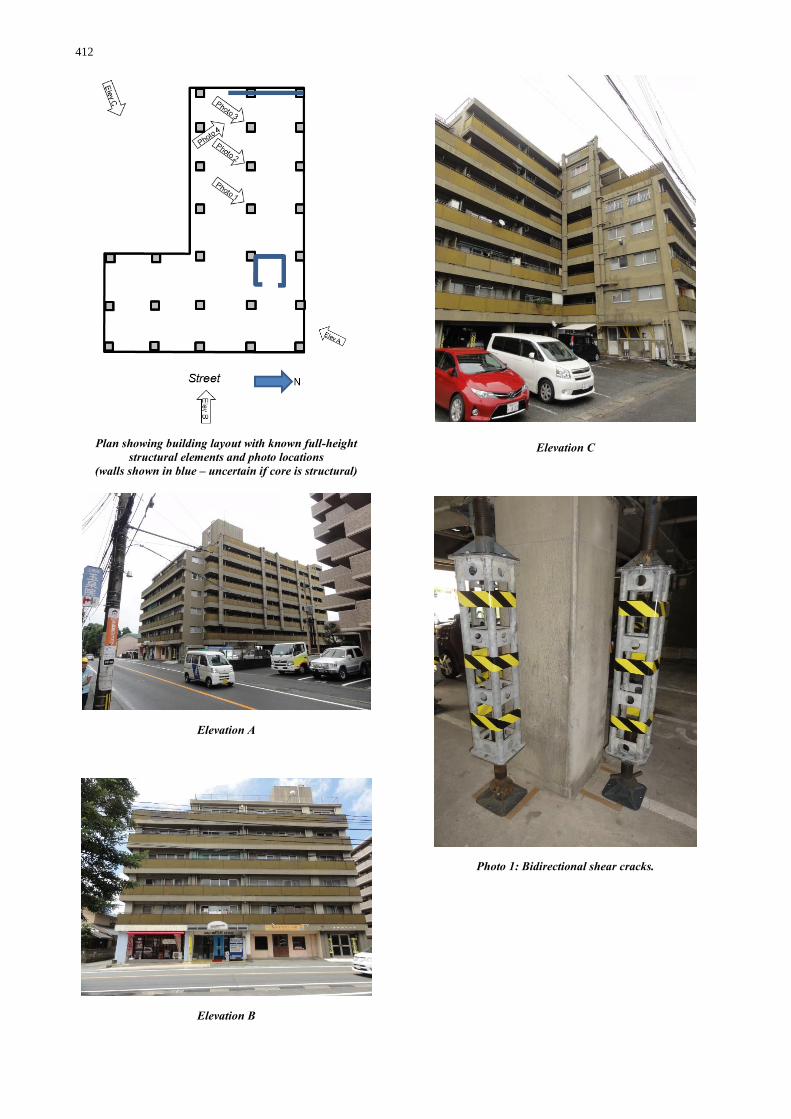
412
Plan showing building layout with known full-height structural elements and photo locations
(walls shown in blue – uncertain if core is structural)
Elevation A
Elevation B
Elevation C
Photo 1: Bidirectional shear cracks.

413
Photo 2: Bidirectional shear cracks.
Photo 3a: Apparent torsional cracks.
Photo 3b: Apparent torsional cracks.
Photo 4: Wall on west end of building.
Observations
Across street from collapsed building. (Appendix A3)
Built by same owner 5 years prior to collapsed building.
Both designed to pre-1981 code
Primary difference is presence of wall at west end of
building and location of core in the corner of L-shape
(could not confirm if core is structural)
Significant bidirectional shear cracking on two interior
columns – bidirectional shear appears more prevalent in
Japan due to similar size beams in two orthogonal
directions.
Cracking on third column appears torsional (cracks wrap
around column

414
Building Damage Report – A5
Item Details
Street Address/Location Kumamoto City, Kumamoto Prefecture
Date of construction Approx 2010
Building Description Private Residential Apartments, Structural form is regular in plan
Building Footprint / Floor Area ~29m x29m (~850 m2)
No. of storeys / basements 15 stories (+ 1 Storey Basement)
Structural system RC moment frame in orthogonal directions
Earthquake resisting system RC moment frame with base isolation at underside of ground floor slab level in basement
Foundation system Foundation below base isolation unknown
Other notable features Features rubber bearings with a combination of both steel and lead dampers
Past seismic strengthening none
Likely Design Standards Latest Japanese Design Code (post 1981)
Placard and date (if known) Green, building fully occupied
Sketch plan of building layout showing isolation system layout
Building street elevation
Photo 1: Lead dampers.

415
Photo 2: Steel dampers.
Photos 3 & 4: Separation of steel dampers from concrete beams.
Photo 5: Failure at joint between floor slab & lead dampers.
Photo 6: Failure at joint between floor slab & lead dampers.
Photo 7: Failure at joint between floor slab & lead dampers.
Photo 8: Small base isolator (see floor plan for location).
Photo 9: Visible signs of cone failure like cracking in base slab where small base isolator is connected.
Photo 10: Cracking in deck slab where connected to small base isolator
416
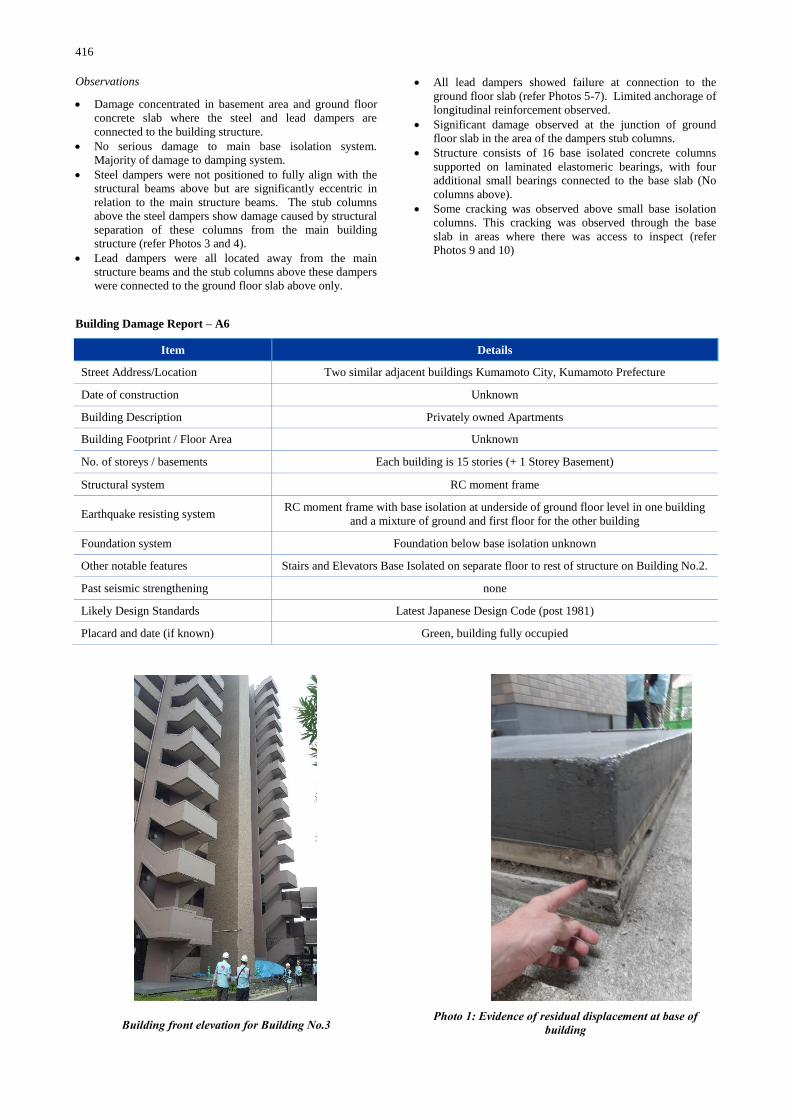
Observations
Damage concentrated in basement area and ground floor
concrete slab where the steel and lead dampers are
connected to the building structure.
No serious damage to main base isolation system.
Majority of damage to damping system.
Steel dampers were not positioned to fully align with the
structural beams above but are significantly eccentric in
relation to the main structure beams. The stub columns
above the steel dampers show damage caused by structural
separation of these columns from the main building
structure (refer Photos 3 and 4).
Lead dampers were all located away from the main
structure beams and the stub columns above these dampers
were connected to the ground floor slab above only.
All lead dampers showed failure at connection to the
ground floor slab (refer Photos 5-7). Limited anchorage of
longitudinal reinforcement observed.
Significant damage observed at the junction of ground
floor slab in the area of the dampers stub columns.
Structure consists of 16 base isolated concrete columns
supported on laminated elastomeric bearings, with four
additional small bearings connected to the base slab (No
columns above).
Some cracking was observed above small base isolation
columns. This cracking was observed through the base
slab in areas where there was access to inspect (refer
Photos 9 and 10)
Building Damage Report – A6
Item Details
Street Address/Location Two similar adjacent buildings Kumamoto City, Kumamoto Prefecture
Date of construction Unknown
Building Description Privately owned Apartments
Building Footprint / Floor Area Unknown
No. of storeys / basements Each building is 15 stories (+ 1 Storey Basement)
Structural system RC moment frame
Earthquake resisting system RC moment frame with base isolation at underside of ground floor level in one building
and a mixture of ground and first floor for the other building
Foundation system Foundation below base isolation unknown
Other notable features Stairs and Elevators Base Isolated on separate floor to rest of structure on Building No.2.
Past seismic strengthening none
Likely Design Standards Latest Japanese Design Code (post 1981)
Placard and date (if known) Green, building fully occupied
Building front elevation for Building No.3
Photo 1: Evidence of residual displacement at base of building
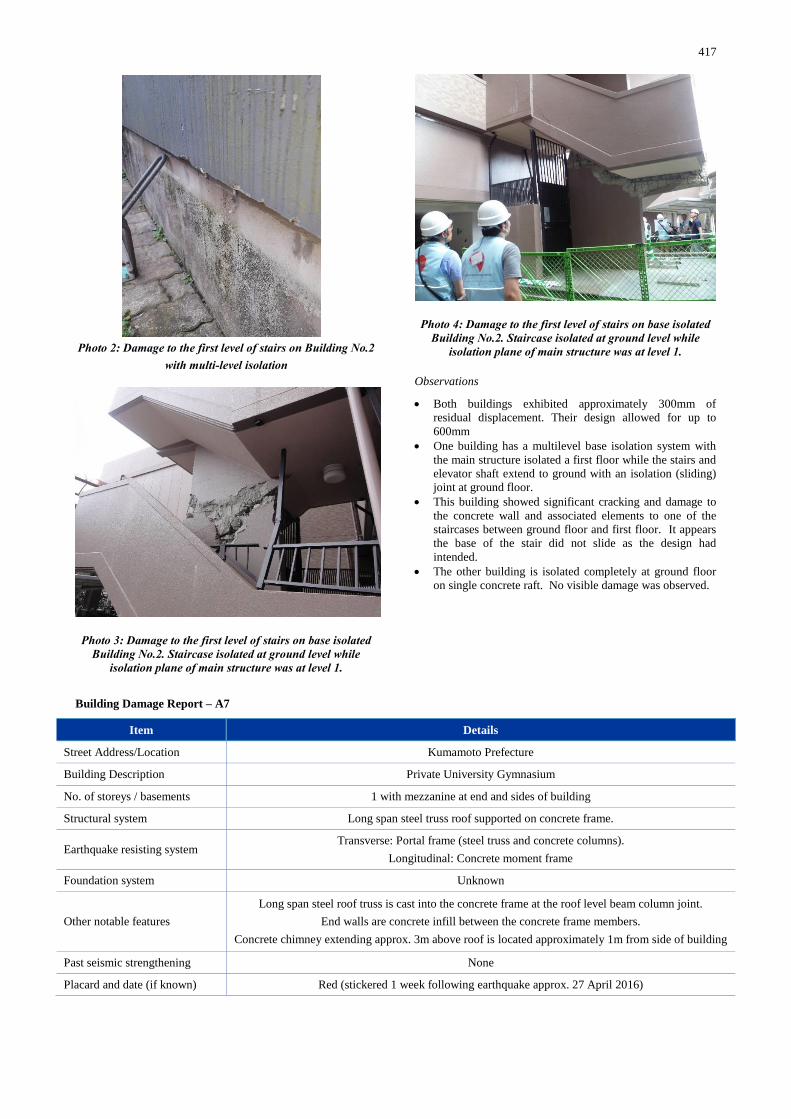
417
Photo 2: Damage to the first level of stairs on Building No.2 with multi-level isolation
Photo 3: Damage to the first level of stairs on base isolated Building No.2. Staircase isolated at ground level while
isolation plane of main structure was at level 1.
Photo 4: Damage to the first level of stairs on base isolated Building No.2. Staircase isolated at ground level while
isolation plane of main structure was at level 1.
Observations
Both buildings exhibited approximately 300mm of
residual displacement. Their design allowed for up to
600mm
One building has a multilevel base isolation system with
the main structure isolated a first floor while the stairs and
elevator shaft extend to ground with an isolation (sliding)
joint at ground floor.
This building showed significant cracking and damage to
the concrete wall and associated elements to one of the
staircases between ground floor and first floor. It appears
the base of the stair did not slide as the design had
intended.
The other building is isolated completely at ground floor
on single concrete raft. No visible damage was observed.
Building Damage Report – A7
Item Details
Street Address/Location Kumamoto Prefecture
Building Description Private University Gymnasium
No. of storeys / basements 1 with mezzanine at end and sides of building
Structural system Long span steel truss roof supported on concrete frame.
Earthquake resisting system Transverse: Portal frame (steel truss and concrete columns).
Longitudinal: Concrete moment frame
Foundation system Unknown
Other notable features
Long span steel roof truss is cast into the concrete frame at the roof level beam column joint.
End walls are concrete infill between the concrete frame members.
Concrete chimney extending approx. 3m above roof is located approximately 1m from side of building
Past seismic strengthening None
Placard and date (if known) Red (stickered 1 week following earthquake approx. 27 April 2016)

418
Photo 1: Aerial view of campus indicating location of Gymnasium.
Photo 2: Building front exterior elevation (note damage to infill concrete walls and ceiling at roof interface).
Photo 3: Building interior (note daylight at end wall roof interface).
Photo 4: Shear cracking damage to concrete beam supporting mezzanine on side wall.
Photo 4: Shear cracking damage to concrete beam supporting mezzanine on side wall.
Photo 5: Light fitting partially unclipped.
Photos 6 & 7: Chimney adjacent to building (note pounding damage at roof interface).

419
Observations
Loss of connection between the front end wall and the roof
portal frame observed extending across at least the middle
half of the end wall. The steel embedded connections had
pulled out of the concrete. Resultant damage to exterior
roof ceiling observed.
Pounding of chimney and roof indicates movement of
approximately 1.2m at roof level between the gymnasium
roof and chimney.
Shear damage to beams supporting mezzanine on side
walls appeared to be limited to one beam location.
Connection between roof trusses and concrete frame not
able to be observed.
No damage observed to hung lighting or other hung
elements including basketball hoops supports except one
light fitting partially unclipped.
Building used as a shelter for approximately a week before
damage assessment completed and damage identified.
Building Damage Report – A8
Item Details
Street Address/Location Kumamoto City, Kumamoto Prefecture, South East of Kumamoto Castle
Date of construction Constructed between 1971 and 2004
Building Description 13 x 5 storey Apartments Buildings
Building Footprint / Floor Area Each building ~250 m2
No. of storeys / basements 5 storeys
Structural system RC moment frame
Earthquake resisting system RC moment frame with transverse shear walls. Concrete “non structural” infill exterior walls
Foundation system
38m deep, hollow 500 dia. piles 350mm dia. Cavity in pile used to auger through earth and
rest of pile drive down simultaneously. Bottom 500mm of pile socketed into dense material
and backfilled with grout for increased bearing area at base
Past seismic strengthening Buildings 10, 11, 12 and 13 have been seismically retrofitted
Likely Design Standards Buildings 1-9, 17, 18 post 1981 code. Buildings 10-13 pre 1981 code.
Placard and date (if known) Buildings 3,4 and 5 evacuated all others have green placards
Apartment complex plan view with building numbers and year constructed
Typical building elevation.
Photo 1: Cracking of non-structural walls due to differential settlement of building.
Photo 2: Visible leaning of Building No. 5 (One side noticeably lower than other).

420
Photo 3: Separation of columns and non-structural walls as part of seismic retrofitting.
Photo 4: Seismic retrofitting of pre-1980 buildings.
Observations
Buildings 3, 4 and 5 were damaged and evacuated due to
global building tilts of between 3 and 4%. These buildings
are planned to be demolished and reconstructed.
Damaged buildings had extensive disruption of soil
immediately surrounding each building.
Some limited cracking of non-structural walls due to
differential movement observed.
Buildings with seismic retrofitting performed well with no
visible damage.
Buildings 3, 4 and 5 are to be demolished and
reconstructed.
Building Damage Report – A9
Item Details
Street Address/Location Miyazono 702, Mashikimachi, Kamimashiki District, Kumamoto Prefecture
Building Description Municipal Office Building, connected by small footbridge to adjacent building
No. of storeys / basements 3 Storeys, no basement on sloping site
Structural system RC moment frame
Earthquake resisting system RC moment frame
Foundation system Piled Foundations
Past seismic strengthening Retrofitted with extra concrete frame on outside of building
Likely Design Standards Pre 1980 Japanese Design Code
Placard and date (if known) Green (initially Red)
Building elevation. Additional exterior RC moment frame added as a seismic
retrofit shown.
Photos 1 & 2: Ground subsidence around the building.
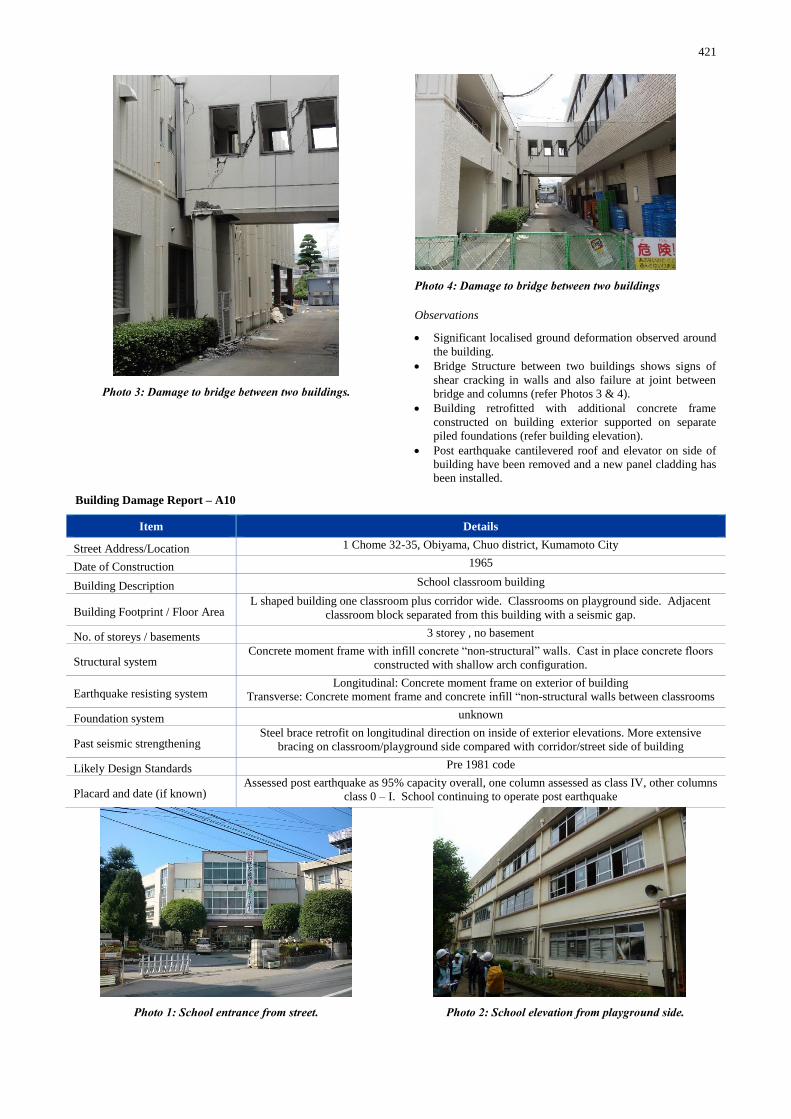
421
Photo 3: Damage to bridge between two buildings.
Photo 4: Damage to bridge between two buildings
Observations
Significant localised ground deformation observed around
the building.
Bridge Structure between two buildings shows signs of
shear cracking in walls and also failure at joint between
bridge and columns (refer Photos 3 & 4).
Building retrofitted with additional concrete frame
constructed on building exterior supported on separate
piled foundations (refer building elevation).
Post earthquake cantilevered roof and elevator on side of
building have been removed and a new panel cladding has
been installed.
Building Damage Report – A10
Item Details
Street Address/Location 1 Chome 32-35, Obiyama, Chuo district, Kumamoto City
Date of Construction 1965
Building Description School classroom building
Building Footprint / Floor Area L shaped building one classroom plus corridor wide. Classrooms on playground side. Adjacent
classroom block separated from this building with a seismic gap.
No. of storeys / basements 3 storey , no basement
Structural system Concrete moment frame with infill concrete “non-structural” walls. Cast in place concrete floors
constructed with shallow arch configuration.
Earthquake resisting system Longitudinal: Concrete moment frame on exterior of building
Transverse: Concrete moment frame and concrete infill “non-structural walls between classrooms
Foundation system unknown
Past seismic strengthening Steel brace retrofit on longitudinal direction on inside of exterior elevations. More extensive
bracing on classroom/playground side compared with corridor/street side of building
Likely Design Standards Pre 1981 code
Placard and date (if known) Assessed post earthquake as 95% capacity overall, one column assessed as class IV, other columns
class 0 – I. School continuing to operate post earthquake
Photo 1: School entrance from street.
Photo 2: School elevation from playground side.

422
Photo 3: School elevation from playground side.
Photo 4: Interior of corridor showing retrofitted braces.
Photo 5: View of interior corridor. Interior wall of classrooms framed in non-structural aluminium joinery
partitions.
Photos 6 & 7: Shear damaged column (damage class IV) located in corridor 1st floor level.
Photo 8: Typical damage to concrete “non-structural” walls between concrete moment frames.
Photo 9: Pounding damage at seismic joint between classroom blocks.

423
Observations
Damage relatively limited. Significant shear crack in one
column mid-height on corridor level 1, identified in
Japanese damage assessment system as class IV. All other
columns identified in Japanese damage assessment system
as classes 0 or I, no damage or slight cracking.
Damage observed at seismic joint with adjacent school
block.
Damage observed (cracking of concrete) in the non-
structural concrete walls on the building exterior.
School operating not withstanding shear crack damaged
reinforced concrete column and various cracks in “non-
structural” concrete walls.
Building Damage Report – A11
Item Details
Street Address/Location Kuhonji 3-1-1, Chuo District, Kumamoto City
Date of construction 1960
Building Description Private High School Classroom building
Building Footprint / Floor Area 2224 m2
No. of storeys / basements 4 storeys, no basement
Structural system Rectangular regular RC building supported on concrete frame and walls.
Earthquake resisting system Transverse (2 unequal bays): RC frame with walls between classrooms
Longitudinal (9 almost equal bays): RC moment frame
Foundation system Unknown
Other notable features
The two longitudinal frames had full-width windows, which resulted in short columns.
The window height was smaller in the corridor side, which made this frame more
critical/vulnerable to short column shear failure.
In the transverse direction, RC walls within the larger bay (excluding the corridor) of every
alternate frame separated the classrooms. Walls may have been designed to be non-structural,
but due to their monolithic construction with the columns they will contribute to the lateral
strength and stiffness.
Past seismic strengthening None
Placard and date (if known) Red (1 week following earthquake approx. 27 April 2016)
Other Seismic assessment was conducted before earthquake and the rating (denoted as Is as per
Japanese evaluation method) was 0.19. Concrete strength was 9.2 MPa
Photo 1: Damaged columns from outside the building
Photo 2: Close up view of typical columns failed in short column induced shear failure.
Photo 3: A typical classroom (Internal longitudinal frame can be seen at the left end of the room, transverse frame without wall can be seen in the middle of the room and
transverse frame infilled with structural wall can be seen at the far end of the classroom.

424
Photo 4: A rare instance of damage to the classroom side external columns.
Observations
Severe shear damage to the external columns on the
corridor side. The cracks were typical of short column
failure; i.e. x shaped cracks across the height of the
window.
No similar damage observed on the other side columns as
the windows on the opposite side were taller. Also, the
transverse shear walls were connected to the alternate
columns in the other side, which further restrained the
deformation (and hence damage) of the columns on the
other side.
Signs of plastic hinges about to develop at the ends of the
beam in the extreme longitudinal frame in some of the
classrooms.
No major damage observed in the transverse frame/wall
systems.
Building Damage Report – A12
Item Details
Street Address/Location Nagaminehigashi 8-13-1, Higashi District, Kumamoto City
Date of construction 1990s
Building Description Private Apartment
Building Footprint / Floor Area Rectangular (roughly: 12mx30m), ~350—400 m2
No. of storeys / basements 12 storey with pilotis ground floor for parking
Structural system Rectangular regular RC building supported on concrete frames and walls.
Earthquake resisting system
Transverse NS (1 long bay ~12m): 5 RC moment frames. The frame on west and east ends
include wall sections of different lengths while the three interior frames have longer spans
with relatively small beams suggesting these columns may respond like cantilever columns.
Longitudinal EW (4 equal bays): 2 RC moment frames. The south frame is bare on the ground
floor whereas the frame on the North side has infill RC walls in 3 bays
Foundation system Unknown
Other notable features
The column size was 950x950mm at the pilotis floor. We understand the column size reduces
from the 2nd floor onwards. May be due to the stringent design requirement to avoid soft story
failure in the current Japanese code (design seismic coefficient of 0.55 for soft storey failure).
Beams along the longitudinal direction are deeper and wider than the much longer beam along
the transverse direction.
Two intermediate beams run along the longitudinal direction on top of the ground floor, but no
columns or walls were present along these beams.
Past seismic strengthening None
Likely Design Standards Latest Japanese Design Code (post 1981)
Placard and date (if known) Red, April 27.
Photo 1: Building south-east elevation
Photo 2: Building north elevation.

425
Photo 3: Damage to the columns on South side (most severe damage was to the far-east end column).
Photo 4: Damage to the central beam-column connection on the south frame.
Photo 5: Damaged walls and column on the north side.
Photos 6 & 7: Close up view of typical columns failed in short column induced shear failure.
Photo 8: Beam-Column connection at the top of the shear damaged column.
Photo 9: Shear cracks on the east side wall and damage to the south-east corner column.
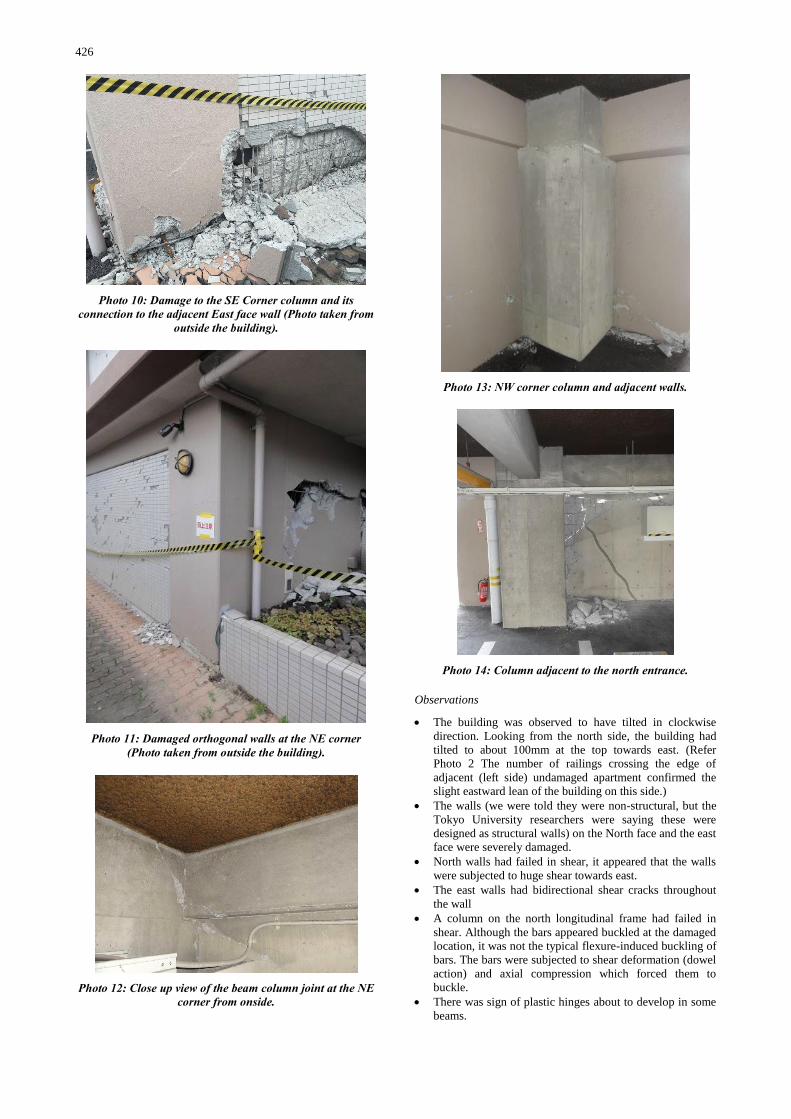
426
Photo 10: Damage to the SE Corner column and its connection to the adjacent East face wall (Photo taken from
outside the building).
Photo 11: Damaged orthogonal walls at the NE corner (Photo taken from outside the building).
Photo 12: Close up view of the beam column joint at the NE corner from onside.
Photo 13: NW corner column and adjacent walls.
Photo 14: Column adjacent to the north entrance.
Observations
The building was observed to have tilted in clockwise
direction. Looking from the north side, the building had
tilted to about 100mm at the top towards east. (Refer
Photo 2 The number of railings crossing the edge of
adjacent (left side) undamaged apartment confirmed the
slight eastward lean of the building on this side.)
The walls (we were told they were non-structural, but the
Tokyo University researchers were saying these were
designed as structural walls) on the North face and the east
face were severely damaged.
North walls had failed in shear, it appeared that the walls
were subjected to huge shear towards east.
The east walls had bidirectional shear cracks throughout
the wall
A column on the north longitudinal frame had failed in
shear. Although the bars appeared buckled at the damaged
location, it was not the typical flexure-induced buckling of
bars. The bars were subjected to shear deformation (dowel
action) and axial compression which forced them to
buckle.
There was sign of plastic hinges about to develop in some
beams.
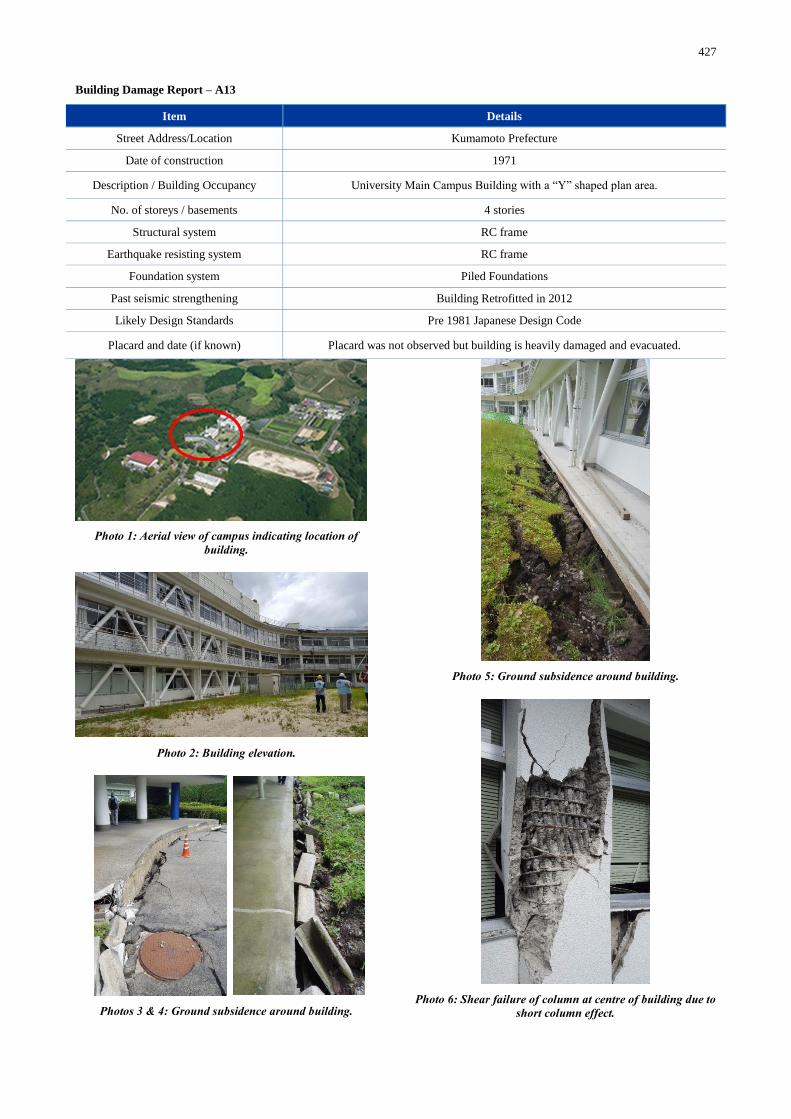
427
Building Damage Report – A13
Item Details
Street Address/Location Kumamoto Prefecture
Date of construction 1971
Description / Building Occupancy University Main Campus Building with a “Y” shaped plan area.
No. of storeys / basements 4 stories
Structural system RC frame
Earthquake resisting system RC frame
Foundation system Piled Foundations
Past seismic strengthening Building Retrofitted in 2012
Likely Design Standards Pre 1981 Japanese Design Code
Placard and date (if known) Placard was not observed but building is heavily damaged and evacuated.
Photo 1: Aerial view of campus indicating location of building.
Photo 2: Building elevation.
Photos 3 & 4: Ground subsidence around building.
Photo 5: Ground subsidence around building.
Photo 6: Shear failure of column at centre of building due to short column effect.

428
Photos 7, 8 & 9: Visible signs of damage at “Y” juncture of building.
Photos 10 & 11: Cracks found throughout ground on both sides of the building.
Observations
Building identified as not meeting seismic requirements
and retrofitted in 2012 with steel bracing.
Building damaged at centre where two sides of “Y” shape
have been pulled apart (see Photo 4-7).
Campus located in vicinity of volcanic mountains.
University campus is located just north of a known fault
location. Ground cracks could be indication of the location
of the fault or potentially due to ground settlement and
slump of sedimentary layer (from previous eruptions)
down nearby slopes.
Damaged columns (refer Photo 4) shows lack of
stirrups/ties around internal longitudinal reinforcement
(only single stirrup around all longitudinal reinforcing
bars).
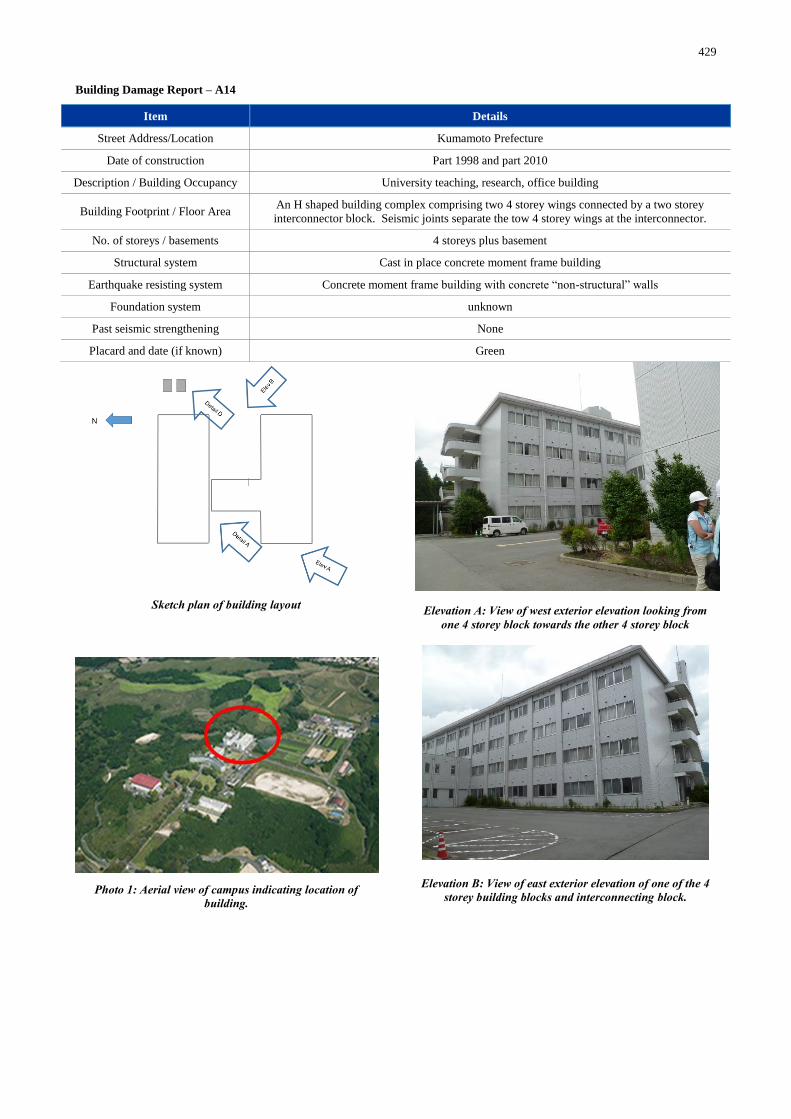
429
Building Damage Report – A14
Item Details
Street Address/Location Kumamoto Prefecture
Date of construction Part 1998 and part 2010
Description / Building Occupancy University teaching, research, office building
Building Footprint / Floor Area An H shaped building complex comprising two 4 storey wings connected by a two storey
interconnector block. Seismic joints separate the tow 4 storey wings at the interconnector.
No. of storeys / basements 4 storeys plus basement
Structural system Cast in place concrete moment frame building
Earthquake resisting system Concrete moment frame building with concrete “non-structural” walls
Foundation system unknown
Past seismic strengthening None
Placard and date (if known) Green
Sketch plan of building layout
Photo 1: Aerial view of campus indicating location of building.
Elevation A: View of west exterior elevation looking from one 4 storey block towards the other 4 storey block
Elevation B: View of east exterior elevation of one of the 4 storey building blocks and interconnecting block.

430
Detail A: Seismic joint between four storey block and interconnector at building exterior.
Detail B: Seismic joint between four storey block and interconnector at building interior showing some damage to
floor at joint.
Detail C: Interior view of south four storey block at ground level. Note no damage to interiors including ceilings.
Detail D: Chiller plant located exterior to building. Note ground rupture adjacent to foundations.
Observations
Minor damage observed at seismic joint between the
buildings.
No damage observed to non-structural elements within the
building including ceilings, and MEP
Advised of shear failure of foundation beams at the
seismic joint and one corner of the building advised to
have risen by 300 mm.
Building apparently 0.7% inclined
Building Damage Report – A15
Item Details
Street Address/Location Uratamichi 51, Uto City
Age Unknown. Possibly late 1950s/early 1960s
Description / Building
Occupancy
Municipal Office Buildings
Building Footprint / Floor Area 24x24m main floor area + 24x3m services/access core
No. of storeys / basements 5
Structural system RC moment-frames around main office floor area. Unknown floor system, possibly two-way flat
slab. Service core is perforated RC walls.
Earthquake resisting system RC MRFs + core walls
Foundation system Unknown
Other notable features Core of building is eccentric to main floor area and is at 45 degrees to the grid setout of the main
office floor. This results in significant eccentricity and limited slab connection to the core
Past seismic strengthening None
Likely Design Standards Pre 1981 code
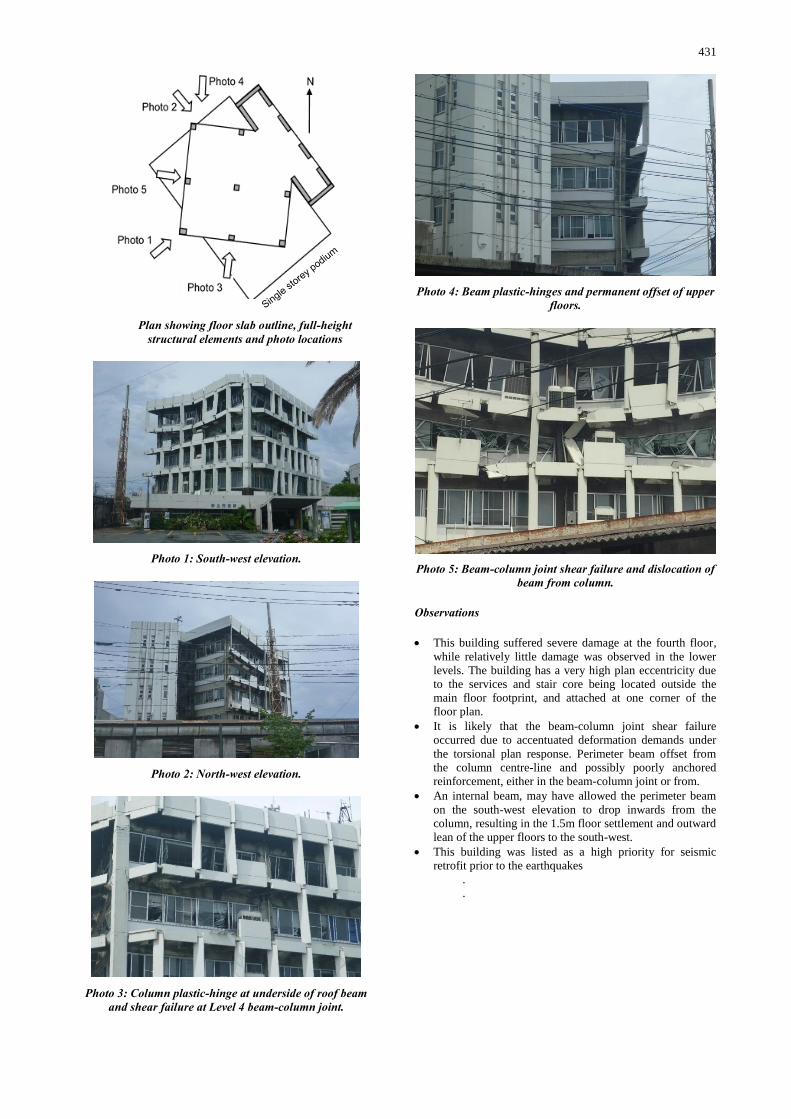
431
Plan showing floor slab outline, full-height structural elements and photo locations
Photo 1: South-west elevation.
Photo 2: North-west elevation.
Photo 3: Column plastic-hinge at underside of roof beam and shear failure at Level 4 beam-column joint.
Photo 4: Beam plastic-hinges and permanent offset of upper floors.
Photo 5: Beam-column joint shear failure and dislocation of beam from column.
Observations
This building suffered severe damage at the fourth floor,
while relatively little damage was observed in the lower
levels. The building has a very high plan eccentricity due
to the services and stair core being located outside the
main floor footprint, and attached at one corner of the
floor plan.
It is likely that the beam-column joint shear failure
occurred due to accentuated deformation demands under
the torsional plan response. Perimeter beam offset from
the column centre-line and possibly poorly anchored
reinforcement, either in the beam-column joint or from.
An internal beam, may have allowed the perimeter beam
on the south-west elevation to drop inwards from the
column, resulting in the 1.5m floor settlement and outward
lean of the upper floors to the south-west.
This building was listed as a high priority for seismic
retrofit prior to the earthquakes
.
.

432
Building Damage Report – A16
The observations below relate to the performance of different
non-structural systems and components in the various
buildings visited. Refer to the building damage assessments
referenced for further details of the buildings.
Building Mechanical Plant
Photos 1 & 2: Building A14 major plant items located behind the teaching / office building.
Ground rupture observed beside chillers (highlighted in
above photos with dashed lines).
No damage observed to plant or plant supports or
connecting piping.
The arrangement of major plant on the ground near the
building was observed at many locations.
Photo 3: Building A5. Plant and piping in the basement located below the plane of isolation and flexible connectors
across the plane of isolation.
Photo 4: Building A5. Plant and piping in the basement located below the plane of isolation and flexible connectors
across the plane of isolation. Note base isolation dampers in background.
Photo 5: Building A5. Supports for storm water piping located immediately hung from ground floor above the plane
of seismic isolation.
Major services plant located in basement below plane of
isolation. Flexible pipe connections at all locations where
plant crosses the plane of isolation with braced supports on
each side of the flexible connection.
Storm water plumbing appeared to be located entirely
above the plane of isolation on hung supports.
No damage observed to any of the plant or piping.
Ceilings
Photo 6: Building A7 designed with no ceiling thus avoiding damage

433
Photo 7: Building A7 detail of ceiling.
Damage to exterior soffit where end wall of the building
separated from the roof structure. No ceiling on building
interior.
Detail of lights hung from roof structure indicating one
light fitting that has become partially unclipped, assumed
to be resulting from earthquake movements.
Photo 8: Building A13 interior ceiling damage.
Localised damage to hung ceiling tiles adjacent to
structural column penetrating ceiling.
Photo 9: Building A14 building internal ceiling, no damage observed
No damage observed to ceilings or hung services.
No fire sprinklers observed.
Photo 10: Building A10 classroom corridor.
No hung ceiling.
Acoustical protection applied directly to underside of
concrete floor structure. No damage observed to hung
services.
Photos 11 & 12: Gym close to Building A10.
Suspended ceiling damaged at changes in orientation and
adjacent to structural end walls and columns. No damage
observed to hung services e.g. lights.
No fire sprinklers observed.
Note damage at change in ceiling orientation

434
Photo 13: Building A11.
No damaged observed to ceiling or hung non-structural
elements. Ceiling appeared to be rigidly adhered to the
concrete floor structure above.
No fire sprinklers observed.
Underground Services
Photos 14 & 15: Ground and underground services disruption Building A13.
Photo 16: Broken piping adjacent to Building A13.
Significant ground rupture observed in the area of the
dormitory resulting in significant damage to underground
services particularly at junctions between pipes and cast in
place concrete chambers and concrete foundation pads.
Building Cladding Systems
Photo 17: Building A14. Exterior covered in ceramic tiles applied directly to the concrete structure. A typical Japanese
cladding system
No damage observed to building cladding system.
Photo 18: Building A12, Exterior tiled cladding.
Cracking in cast in place concrete wall elements
(considered to not be part of the lateral load resisting
structure evidenced in the exterior tiles.
Photo 19: Apartment buildings Kumamoto. Undamaged buildings.
Note separation joint in concrete balcony balustrades to
allow movement without damage to building.

435
Stairs
Photo 20: Building A10 no damage observed to stairs.
Stairs constructed in reinforced concrete, no sliding joints
observed.
Photo 21: Building A11.
No damage observed to stairs, minor cracking to non-
structural wall below stairs.
Stairs constructed in reinforced concrete, no sliding joints
observed.
Furniture / Signage
Photo 22: Building A10.
Bookcase laid down in school corridor to prevent possible
falling in any aftershocks.
Photo 23: Building A13 exterior signage.
Limited mortar joint affixing stone signage to wall.
Temporary Buildings
Photo 24: Building A11, Temporary school administration block.
Photo 25: Building A15, City Hall temporary office block erected on carpark adjacent to the damaged buildings they
are temporarily replacing
Photo 38: Building A11,, Temporary class room block erected in school playing field