performance of regional rural bank in …icmrr.org/apr_2015/ijfrr/20154208.pdfperformance of...
TRANSCRIPT

PERFORMANCE OF REGIONAL RURAL BANK IN INDIA WITH
SPECIAL REFERENCE TO PANDYAN GRAMA BANK, TAMIL NADU
Dr R.SURESH 1 N.JEGANATHAN
2
1Principal, Madurai Kamaraj University College, Aundipatti.
2Research Scholar, Bharathiyar University, Coimbatore.
ABSTRACT
The necessity of rural finance was felt to provide protection and reliance to rural people who
are highly depend on informal squeezing source of finance like moneylenders, landlords and traders
etc. They exploit farmers and small entrepreneurs by charging exorbitant rate of interest and force
farmers to sell their product at low price to them and even their agriculture land other assets. Rural
people also face the risk of unpredictable production of crops due to high dependency on monsoon.
The problems of finance suffer from lack of seeds, fertilizers, water supply and other facilities which
lead to rural ineptness. Rural bank are providing finance to the weaker sections of society like small
farmers, rural artisans, small producers, rural laborers ect, to provide finance to cooperative societies,
primary credit societies, agricultural marketing societies, enhance and improve banking facilities to
semi urban, rural and other untapped market. One of the object under three tire mechanism, the
Regional Rural Bank helps the rural people to come out from the financial problems and secured the
financial assistance to agriculture in India. The study is concentrated on Pandyan Grama Bank is of
utmost importance in Tamil Nadu state to provide financial support to agriculture and performance of
the bank in various identified potential areas. This bank focused on the continuous rural development,
reaching the uncovered and being farmer friendly.
Key Words: Regional Rural Banks, Credit facilities to agriculture, performance of Pandyan Grama
Bank, Economy.
INTRODUCTION
Agriculture is a major source of live hood in India. The majority of poor people living in
rural areas. The Indian economy majority depend on the rural economy. Agriculture financing is best
done by financial institution that has the capacity to diversify across geographical regions, economic
sector and agriculture sub sector. Agriculture finance significance is to increase access to financial
services for farmers and other enterprises in rural areas. In most of the cases, the Indian farmers are
not able to meet the expenditure, because of low size of the holdings, low productivity, low income
and high level of consumption for domestic want. In earlier days the agriculture finance is provided
only by Co-operatives, land development banks and private money lenders. After nationalization of
Commercial Banks (1969) and establishment of Regional Rural Banks in 1975 both banks are also
extending credit facilities for agriculture purpose. As agriculture sector contributes about 40% of
worldwide employment and a 100% food production increase will be required in developing countries
to feed the 2050 population. Technology plays an important role in the management of high yielding
variety seeds has increased productivity of crops considerably.
Though the outreach and amount of agriculture credit have increased over the years, several
weaknesses have crept which have affected the viability and sustainability of these institutions.
Following the shifts in consumption and dietary patterns from cereals to non-cereal products, a silent
transformation is taking place in rural areas calling for diversification in agriculture production and
value addition processes in order to protect employment and incomes of the rural population. In the
www.icmrr.org 62 [email protected]
INTERCONTINENTAL JOURNAL OF FINANCE RESEARCH REVIEWISSN:2321-0354 - ONLINE ISSN:2347-1654 - PRINT - IMPACT FACTOR:0.720VOLUME 3, ISSUE 4, APRIL 2015
WWW.ICMRR.ORG
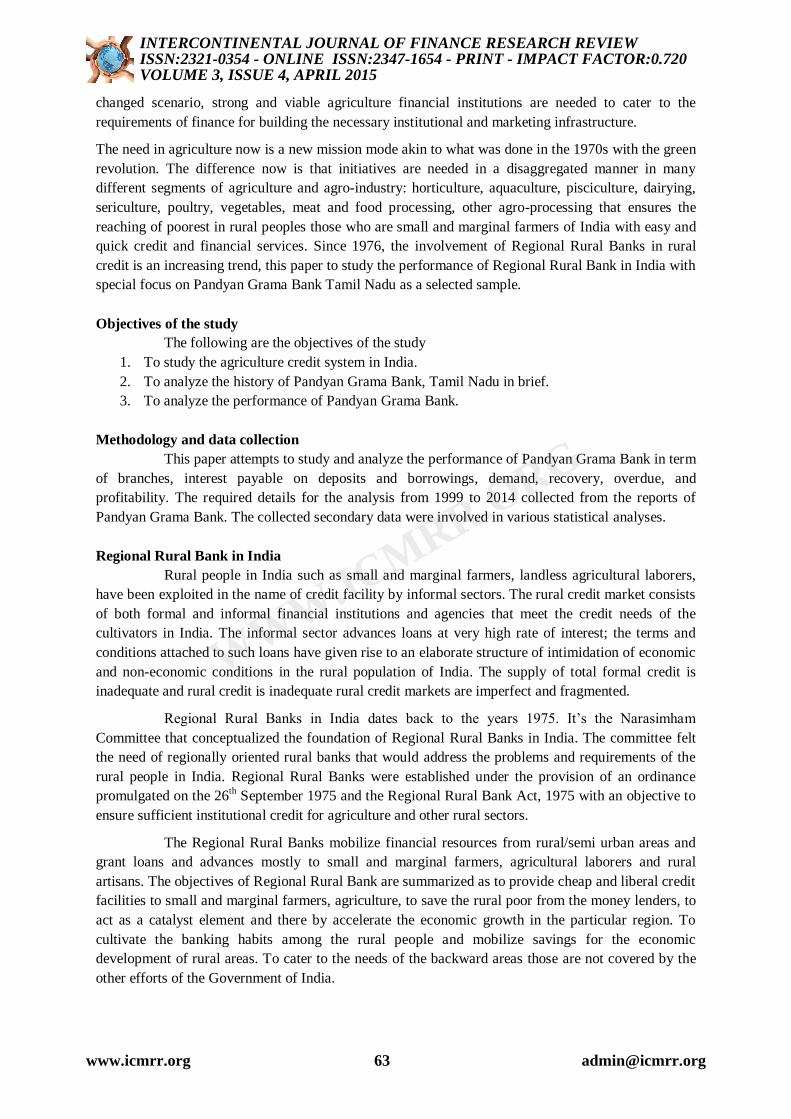
changed scenario, strong and viable agriculture financial institutions are needed to cater to the
requirements of finance for building the necessary institutional and marketing infrastructure.
The need in agriculture now is a new mission mode akin to what was done in the 1970s with the green
revolution. The difference now is that initiatives are needed in a disaggregated manner in many
different segments of agriculture and agro-industry: horticulture, aquaculture, pisciculture, dairying,
sericulture, poultry, vegetables, meat and food processing, other agro-processing that ensures the
reaching of poorest in rural peoples those who are small and marginal farmers of India with easy and
quick credit and financial services. Since 1976, the involvement of Regional Rural Banks in rural
credit is an increasing trend, this paper to study the performance of Regional Rural Bank in India with
special focus on Pandyan Grama Bank Tamil Nadu as a selected sample.
Objectives of the study
The following are the objectives of the study
1. To study the agriculture credit system in India.
2. To analyze the history of Pandyan Grama Bank, Tamil Nadu in brief.
3. To analyze the performance of Pandyan Grama Bank.
Methodology and data collection
This paper attempts to study and analyze the performance of Pandyan Grama Bank in term
of branches, interest payable on deposits and borrowings, demand, recovery, overdue, and
profitability. The required details for the analysis from 1999 to 2014 collected from the reports of
Pandyan Grama Bank. The collected secondary data were involved in various statistical analyses.
Regional Rural Bank in India
Rural people in India such as small and marginal farmers, landless agricultural laborers,
have been exploited in the name of credit facility by informal sectors. The rural credit market consists
of both formal and informal financial institutions and agencies that meet the credit needs of the
cultivators in India. The informal sector advances loans at very high rate of interest; the terms and
conditions attached to such loans have given rise to an elaborate structure of intimidation of economic
and non-economic conditions in the rural population of India. The supply of total formal credit is
inadequate and rural credit is inadequate rural credit markets are imperfect and fragmented.
Regional Rural Banks in India dates back to the years 1975. It’s the Narasimham
Committee that conceptualized the foundation of Regional Rural Banks in India. The committee felt
the need of regionally oriented rural banks that would address the problems and requirements of the
rural people in India. Regional Rural Banks were established under the provision of an ordinance
promulgated on the 26th
September 1975 and the Regional Rural Bank Act, 1975 with an objective to
ensure sufficient institutional credit for agriculture and other rural sectors.
The Regional Rural Banks mobilize financial resources from rural/semi urban areas and
grant loans and advances mostly to small and marginal farmers, agricultural laborers and rural
artisans. The objectives of Regional Rural Bank are summarized as to provide cheap and liberal credit
facilities to small and marginal farmers, agriculture, to save the rural poor from the money lenders, to
act as a catalyst element and there by accelerate the economic growth in the particular region. To
cultivate the banking habits among the rural people and mobilize savings for the economic
development of rural areas. To cater to the needs of the backward areas those are not covered by the
other efforts of the Government of India.
www.icmrr.org 63 [email protected]
INTERCONTINENTAL JOURNAL OF FINANCE RESEARCH REVIEWISSN:2321-0354 - ONLINE ISSN:2347-1654 - PRINT - IMPACT FACTOR:0.720VOLUME 3, ISSUE 4, APRIL 2015
WWW.ICMRR.ORG

Agricultural Credit System in India
Money lenders in India are as old as its villages, agricultural credit co-operative go back a
century, commercial banks have been involved in agricultural loans for nearly 50 years, the Regional
Rural Bank network is over 38 years old, and reforms in the banking system were triggered a decade
back. Yet, credit flow to small farmers has remained far below needs, both for crop cultivation and for
long terms requirements such as land development, irrigation and farm equipment as compared to the
potential demand. The wide spread discontent among farmers has manifested itself in the form of
mass voting against incumbent government as also individual acts of despair such as farmers
committing suicide, particularly in states like Andhrapradesh and Maharashtra. The structure of
agricultural credit system in India shows in exhibit, which is self explanatory.
STRUCTURE OF AGRICULTURAL CREDIT SYSTEM IN INDIA
Source: RBI’s website
About Pandyan Grama Bank
Pandyan Grama Bank is scheduled bank in the public sector in India under Regional Rural
Bank Act 1976. Pandyan Grama Bank is established on 9th March 1977 having its headquarters at
sattur then shifted to Virudhunagar, Tamil Nadu on 16.07.1993. The administrative office has started
functioning in its own building from 31.10.2000 onwards. The issued and paid up share capital is Rs 1
crore, held by Government of India (50%), Government of Tamil Nadu (15%), and sponsor bank-
Indian Overseas Bank (35%). Pandyan Grama Bank’s primary objective is to finance farm and non-
farm sectors and other employment generating programs. This bank operates in 16 Districts of
southern Tamilnadu with 246 Branches. It achieved all the 5 parameters in the Tripartite
Memorandum of Understanding signed between Government of India and sponsor bank (IOB) for the
2nd
consecutive year. Pandyan Grama Bank have opened 22 new branches during 2013-2014, out of
which, 8 are in unbanked rural area covering five Financial Inclusion villages. Further, the present
Government of India Reserve Bank of
India
NABARD
Commercial Banks Rural Co-operative Credit
Institutions
Regional Rural
Banks
Long-Term Credit Structure Short-Term Credit
Structure
State Co-operative Agriculture
and Rural Development Banks
Primary Co-operative
Agriculture and Rural
Development Banks
State Co-operative Banks
District Central Co-
operative Banks
Primary Agricultural
credit Societies
Depositors and Borrowers
www.icmrr.org 64 [email protected]
INTERCONTINENTAL JOURNAL OF FINANCE RESEARCH REVIEWISSN:2321-0354 - ONLINE ISSN:2347-1654 - PRINT - IMPACT FACTOR:0.720VOLUME 3, ISSUE 4, APRIL 2015
WWW.ICMRR.ORG

banking activity consists of 3179.96 crores as Deposits, 1945.10 crores as Borrowings, and 3232.54
crores as advances.
Branches Performance
In the first section, the analysis is made by considering the number of branches that include
the Rural, Semi Urban, Urban distribution of Pandyan Grama Bank Tamil Nadu. The Bank is
operating in sixteen districts namely Virudhunagar, Sivagangai, Ramanathapuram, Tirunelveli,
Thoothukudi, Pudukottai, Madurai, Dindigul, Kanyakumari, Theni, Tiruchirappalli, Thanjavur,
Thiruvarur, Perambalur, Nagapattinam, and Ariyalur. During the financial year, 22 new branches and
a locker division attached to Devakottai branch were opened and 10 branches were shifted to
spacious, easy accessible building with better ambience. The following table-1 exhibits the details
from 1999-2000 to 2013-2014 in the terms of number of branches coverage that include the Rural,
Semi Urban, Urban distribution during these period.
Table-1: Development of Branches in Pandyan Grama Bank
S.No Years Rural
% to
Rural
Semi
Urban
% to Semi
Urban Urban
% to
Urban
Total
Areas
% to Total
Areas
1 1999-2000 114 70.37 45 27.77 3 1.85 162 100
2 2000-2001 112 68.29 48 29.26 4 2.43 164 100
3 2001-2002 109 67.70 48 29.81 4 2.48 161 100
4 2002-2003 109 67.28 49 30.24 4 2.46 162 100
5 2003-2004 108 66.66 50 30.86 4 2.46 162 100
6 2004-2005 111 67.27 50 30.30 4 2.42 165 100
7 2005-2006 112 66.27 53 31.36 4 2.36 169 100
8 2006-2007 102 60 63 37.05 5 2.94 170 100
9 2007-2008 105 56.75 73 39.45 7 3.78 185 100
10 2008-2009 107 54.87 81 41.53 7 3.58 195 100
11 2009-2010 107 54.04 84 42.42 7 3.53 198 100
12 2010-2011 111 54.67 85 41.87 7 3.44 203 100
13 2011-2012 120 56.07 87 40.65 7 3.27 214 100
14 2012-2013 123 57.20 94 43.72 7 3.25 224 100
15 2013-2014 135 54.87 104 42.27 7 2.84 246 100
AVG 112.33 ---- 67.6 ---- 5.57 ---- 184.73 ----
SDEV 8.24 ---- 20.10 ---- 1.50 ---- 26.10 ----
CV 7.33 ---- 29.73 ---- 27.00 ---- 14.12 ----
CGR 0.76 ---- 6.6 ---- 9.48 ---- 3.26 ----
Source: Annual Reports of Pandyan Grama Bank.
Table 1 reveals the development of the branches across Tamil Nadu during the years 1999-
2000 to 2013-2014. The performance indication shows the branches development in rural, semi urban,
urban areas in Tamil Nadu. On examination of data presented in table 1 most of the branches are
clearly placed at rural areas with 70.37% (114) in the year 1999-2000 and maximum reached to 135
branches in the financial year 2013-2014. It shows special importance is given to rural carrier by the
Pandyan Grama Bank. It observed that the branches are growth in semi urban 104 and urban 7, since
the year 2013-2014, the bank zooming on its branch expansion. It may be concluded from the analysis
that Pandyan Grama Bank will be expanding its branches all over the rural areas in Tamil Nadu to
assists the farmer’s financial needs. Based on the above facts a hypothesis is framed covering the
entire period of the study that there is no significant difference in the branches covered in rural, semi-
www.icmrr.org 65 [email protected]
INTERCONTINENTAL JOURNAL OF FINANCE RESEARCH REVIEWISSN:2321-0354 - ONLINE ISSN:2347-1654 - PRINT - IMPACT FACTOR:0.720VOLUME 3, ISSUE 4, APRIL 2015
WWW.ICMRR.ORG
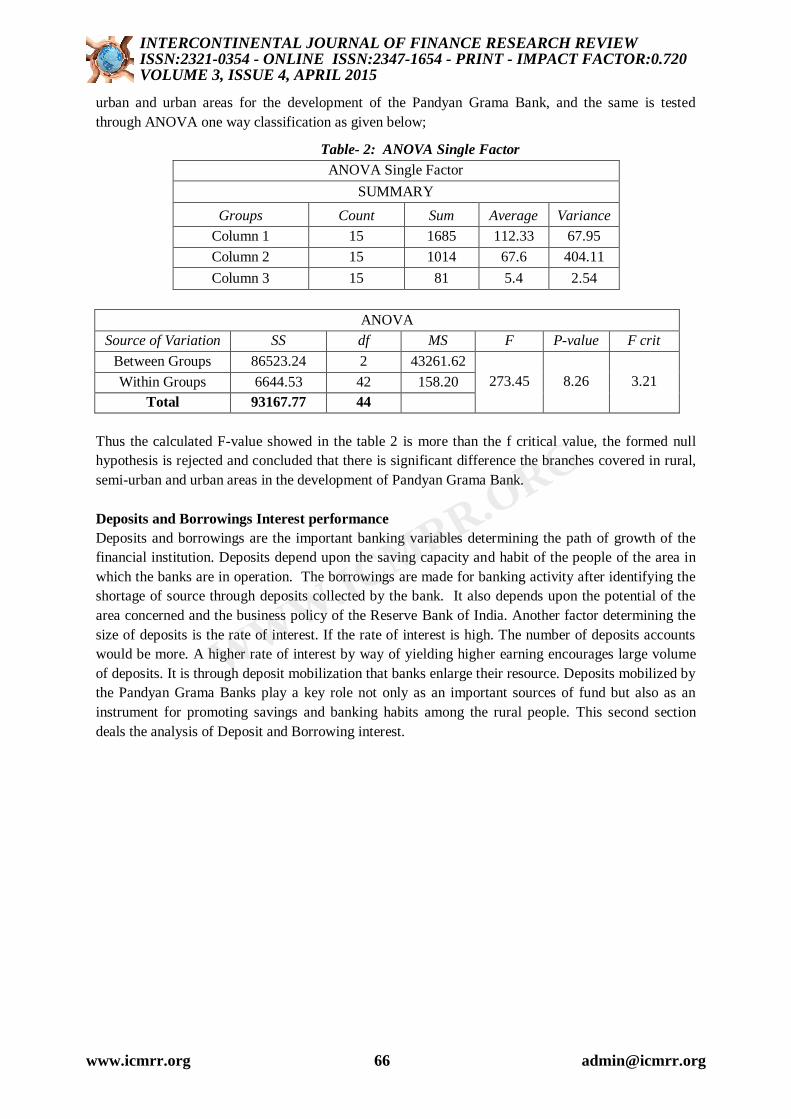
urban and urban areas for the development of the Pandyan Grama Bank, and the same is tested
through ANOVA one way classification as given below;
Table- 2: ANOVA Single Factor
ANOVA Single Factor
SUMMARY
Groups Count Sum Average Variance
Column 1 15 1685 112.33 67.95
Column 2 15 1014 67.6 404.11
Column 3 15 81 5.4 2.54
ANOVA
Source of Variation SS df MS F P-value F crit
Between Groups 86523.24 2 43261.62
273.45 8.26 3.21 Within Groups 6644.53 42 158.20
Total 93167.77 44
Thus the calculated F-value showed in the table 2 is more than the f critical value, the formed null
hypothesis is rejected and concluded that there is significant difference the branches covered in rural,
semi-urban and urban areas in the development of Pandyan Grama Bank.
Deposits and Borrowings Interest performance
Deposits and borrowings are the important banking variables determining the path of growth of the
financial institution. Deposits depend upon the saving capacity and habit of the people of the area in
which the banks are in operation. The borrowings are made for banking activity after identifying the
shortage of source through deposits collected by the bank. It also depends upon the potential of the
area concerned and the business policy of the Reserve Bank of India. Another factor determining the
size of deposits is the rate of interest. If the rate of interest is high. The number of deposits accounts
would be more. A higher rate of interest by way of yielding higher earning encourages large volume
of deposits. It is through deposit mobilization that banks enlarge their resource. Deposits mobilized by
the Pandyan Grama Banks play a key role not only as an important sources of fund but also as an
instrument for promoting savings and banking habits among the rural people. This second section
deals the analysis of Deposit and Borrowing interest.
www.icmrr.org 66 [email protected]
INTERCONTINENTAL JOURNAL OF FINANCE RESEARCH REVIEWISSN:2321-0354 - ONLINE ISSN:2347-1654 - PRINT - IMPACT FACTOR:0.720VOLUME 3, ISSUE 4, APRIL 2015
WWW.ICMRR.ORG

Table- 3: Deposits and borrowings of Pandyan Grama Bank
(Rs. In Crore)
S.No Years
Interest
paid on
Deposits
% to
Interest
paid on
Deposits
Interest
paid on
Borrowing
% to
Interest
paid on
Borrowing
Net
Profit
% of Net
Profit on
Int.
Expenses
1 1999-2000 26.96 2.19 4.42 0.90 4.42 14.09
2 2000-2001 31.77 2.59 5.24 1.07 5.15 13.92
3 2001-2002 36.49 2.97 6.16 1.26 8.15 19.11
4 2002-2003 37.16 3.03 6.33 1.29 13.75 31.62
5 2003-2004 37.09 3.02 6.4 1.31 4.82 11.08
6 2004-2005 34.31 2.79 7.3 1.49 10.08 24.22
7 2005-2006 36.85 3.00 10.12 2.07 12.5 26.61
8 2006-2007 46.59 3.79 16.31 3.34 20.32 32.31
9 2007-2008 71.1 5.79 24.58 5.04 11.01 11.51
10 2008-2009 94.21 7.68 27.1 5.56 19.28 15.89
11 2009-2010 106.32 8.66 37.79 7.75 25.54 17.72
12 2010-2011 110.32 8.99 45.52 9.33 39.17 25.13
13 2011-2012 147.7 12.04 83.38 17.10 81.47 35.26
14 2012-2013 194.31 15.84 95.15 19.52 142.73 49.31
15 2013-2014 215.13 17.54 111.57 22.89 204.22 62.51
TOTAL 1226.31 ---- 487.37 ---- 602.61 ----
AVG 81.75 6.66 32.49 6.66 40.17 26.01
SDEV 61.83 5.04 35.90 7.36 58.66 37.08
CV 75.63 75.63 110.49 110.49 146.02 112.54
CGR 16.42 16.42 28.28 28.28 27.77 29.12
Source: Annual Reports of Pandyan Grama Bank.
Table 3 contains the deposits and borrowings interest performance of Pandyan Grama Bank in the
financial years 1999-2000 to 2013-2014. The particulars are given the interest paid on deposits and
borrowings.
It evident that there is an increase in deposits and borrowings revealed by the interest paid
on there it is clear that the interest on deposits by 15.35 per cent compared with the 1999-2000 with
2013-2014 financial year. There is significant increase high deposit is observed in the years from
2013-2014 there is an increase of 17.54 percentages. The borrowing also shows growth of 21.99% in
the years from 2011-2012 to 2012-2013. Further the percentage level of occupation of net profit
earned by the bank is calculated in the interest expenses spent by the bank. The level of net profit in
association with the interest expenses are below 50% up to 2012-2013, and for the period 2013-2014
it exceeds 50%. It is suggestive for all banks to have earnings of net profit more than 50% on its
primary expenses that will show a normal profitability of the bank. If it crosses more than cent
percent, it will show its better profitability.
From another angle of view, it may be concluded that bank provides best interest rates
compared with the nationalized banks and it has expanded branches all over the district in Tamil
Nadu. The rural people are mostly interested to deposit in the nearest banks. There is every scope that
may gain more deposits in future by maintaining its performance.
www.icmrr.org 67 [email protected]
INTERCONTINENTAL JOURNAL OF FINANCE RESEARCH REVIEWISSN:2321-0354 - ONLINE ISSN:2347-1654 - PRINT - IMPACT FACTOR:0.720VOLUME 3, ISSUE 4, APRIL 2015
WWW.ICMRR.ORG
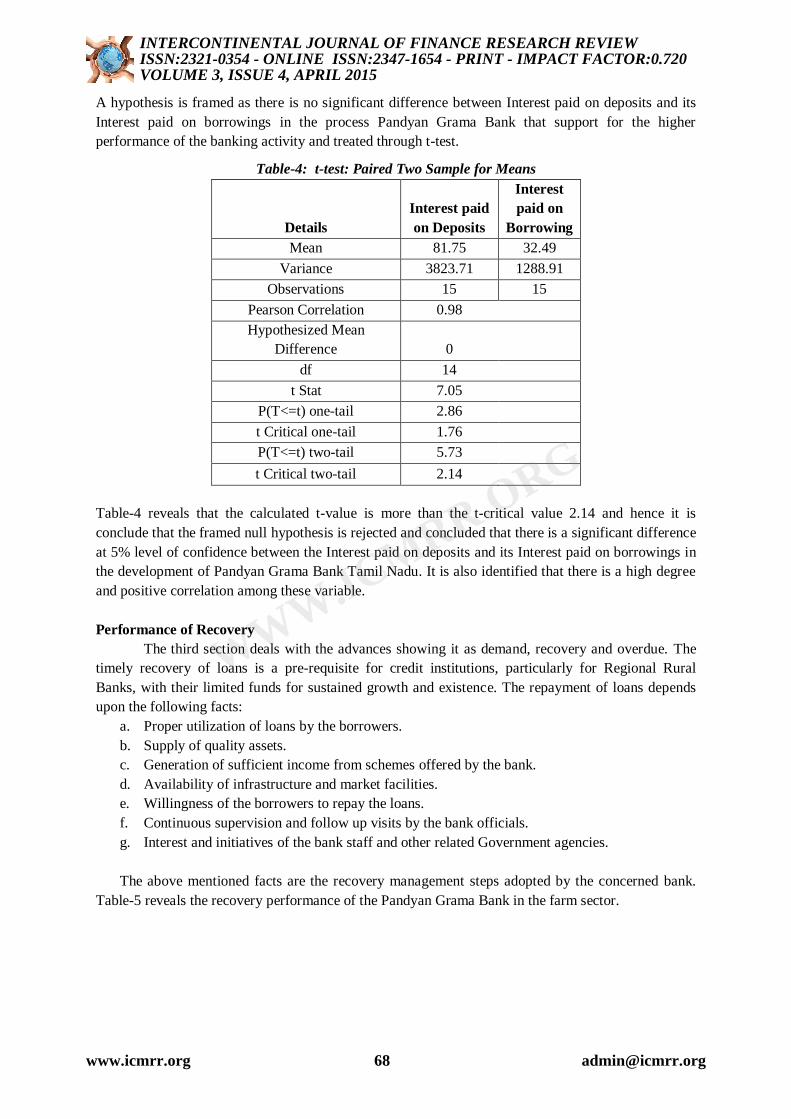
A hypothesis is framed as there is no significant difference between Interest paid on deposits and its
Interest paid on borrowings in the process Pandyan Grama Bank that support for the higher
performance of the banking activity and treated through t-test.
Table-4: t-test: Paired Two Sample for Means
Details
Interest paid
on Deposits
Interest
paid on
Borrowing
Mean 81.75 32.49
Variance 3823.71 1288.91
Observations 15 15
Pearson Correlation 0.98
Hypothesized Mean
Difference 0
df 14
t Stat 7.05
P(T<=t) one-tail 2.86
t Critical one-tail 1.76
P(T<=t) two-tail 5.73
t Critical two-tail 2.14
Table-4 reveals that the calculated t-value is more than the t-critical value 2.14 and hence it is
conclude that the framed null hypothesis is rejected and concluded that there is a significant difference
at 5% level of confidence between the Interest paid on deposits and its Interest paid on borrowings in
the development of Pandyan Grama Bank Tamil Nadu. It is also identified that there is a high degree
and positive correlation among these variable.
Performance of Recovery
The third section deals with the advances showing it as demand, recovery and overdue. The
timely recovery of loans is a pre-requisite for credit institutions, particularly for Regional Rural
Banks, with their limited funds for sustained growth and existence. The repayment of loans depends
upon the following facts:
a. Proper utilization of loans by the borrowers.
b. Supply of quality assets.
c. Generation of sufficient income from schemes offered by the bank.
d. Availability of infrastructure and market facilities.
e. Willingness of the borrowers to repay the loans.
f. Continuous supervision and follow up visits by the bank officials.
g. Interest and initiatives of the bank staff and other related Government agencies.
The above mentioned facts are the recovery management steps adopted by the concerned bank.
Table-5 reveals the recovery performance of the Pandyan Grama Bank in the farm sector.
www.icmrr.org 68 [email protected]
INTERCONTINENTAL JOURNAL OF FINANCE RESEARCH REVIEWISSN:2321-0354 - ONLINE ISSN:2347-1654 - PRINT - IMPACT FACTOR:0.720VOLUME 3, ISSUE 4, APRIL 2015
WWW.ICMRR.ORG

Table- 5: Demand, Recovery and Overdue of Pandyan Grama Bank in the farm sector
(Rs. In Crore)
S.No Years Demand Recovery Over
Due
% of
Recovery
over
demand
Growth
%
% of
overdue
over
demand
Growth
%
1 1999-2000 50.79 37.49 13.3 73.81 ---- 26.19 --
2 2000-2001 56.73 44.87 11.86 79.09 5.28 20.91 -5.28
3 2001-2002 63.46 51.78 11.67 81.59 2.50 18.39 -2.52
4 2002-2003 89.43 77.15 12.28 86.27 4.67 13.73 -4.66
5 2003-2004 127.83 111.71 16.11 87.39 1.12 12.60 -1.13
6 2004-2005 178.55 157.67 20.87 88.31 0.92 11.69 -0.91
7 2005-2006 168.41 157.41 11 93.47 5.16 6.53 -5.16
8 2006-2007 187.19 176.28 10.9 94.17 0.70 5.82 -0.71
9 2007-2008 98.53 87.19 11.33 88.49 -5.68 11.50 5.68
10 2008-2009 543.01 513.98 29.02 94.65 6.16 5.34 -6.15
11 2009-2010 554.49 468.99 85.49 84.58 -10.07 15.42 10.07
12 2010-2011 1275.23 781.11 56.16 61.25 -23.33 4.40 -11.01
13 2011-2012 1525.15 1477.87 45.24 96.90 35.65 2.97 -1.44
14 2012-2013 1561.45 1539.66 21.78 98.60 1.70 1.39 -1.57
15 2013-2014 1597.86 1563.57 34.29 97.85 -0.75 2.15 0.75
TOTAL 8078.11 7246.73 391.3 1323.74 ---- 159.03 ----
AVG 538.54 483.11 26.08 88.24 ---- 10.60 ----
SDEV 617.29 579.74 21.48 1.34 ---- 7.41 ----
CV 114.62 120 82.35 7.69 ---- 69.89 ----
CGR 31.42 32.79 10.84 1.34 ---- 9.23 ----
Source: Annual Reports of Pandyan Grama Bank.
A closer observation of Table-5 the demand is increased as well as the over dues also
increased and the percentage of recovery improved from the financial years 1999-2000 to 2013-2014.
The Highest recovery can be seen in the year 2012-2013 with 98.60% and the lowest recovery can be
observed in the year 1999-2000 with 74%. It shows the trend will be continued in future. This is a
positive sign the recovery performance of farm sector in Pandyan Grama Bank in rural agriculture
sector. In the case of overdue the highest overdue can be seen in the year1999-2000 with 26.19% and
the lowest overdue can be observed in the year 2012-2013 with 1.39%.
The table-6 reveals the recovery performance of the bank in the non-farm sector.
www.icmrr.org 69 [email protected]
INTERCONTINENTAL JOURNAL OF FINANCE RESEARCH REVIEWISSN:2321-0354 - ONLINE ISSN:2347-1654 - PRINT - IMPACT FACTOR:0.720VOLUME 3, ISSUE 4, APRIL 2015
WWW.ICMRR.ORG

Table-6: Demand, Recovery and Overdue of Pandyan Grama Bank in the non-farm sector
(Rs. In
Crore)
S.No Years Demand Recovery Over Due
% to
Recovery
Growth
%
% of overdue
over demand
Growth
%
1 1999-2000 60.6 52.85 7.74 87.45 ---- 12.77 ----
2 2000-2001 66.93 61.04 5.89 91.12 4 8.80 3.97
3 2001-2002 87.19 81.09 6.1 93.12 2 7.00 1.80
4 2002-2003 108.27 100.69 7.57 93.45 0 6.99 0.00
5 2003-2004 186.71 174.78 11.93 93.61 0.6 6.39 0.60
6 2004-2005 247.95 230.44 17.5 93.45 -0.6 7.06 -0.67
7 2005-2006 236.41 214.62 21.79 90.35 -3 9.22 -2.16
8 2006-2007 238.23 217.7 20.52 91.47 1 8.61 0.60
9 2007-2008 394.52 361.21 33.3 91.56 0.56 8.44 0.17
10 2008-2009 873.78 837.28 36.5 95.82 4.26 4.18 4.26
11 2009-2010 906.2 811.91 94.29 89.59 -6.23 10.40 -6.23
12 2010-2011 1275.23 781.11 56.16 90.23 0.64 4.40 6.00
13 2011-2012 1525.15 1477.87 45.24 93.12 2.89 2.97 1.44
14 2012-2013 1696.51 1615.7 80.8 95.24 2.12 4.76 -1.80
15 2013-2014 1942.93 1886.73 56.2 97.11 1.87 2.89 1.87
TOTAL 9846.61 8905.02 501.53 1384.27 ---- 104.88 ----
AVG 656.44 593.66 33.43 92.28 ---- 6.99 ----
SDEV 661.08 619.26 28.01 2.63 ---- 2.63 ----
CV 100.70 104.31 83.77 2.85 ---- 2.58 ----
CGR 31.00 30.76 22.01 0.31 ---- 0.40 ----
Source: Annual Reports of Pandyan Grama Bank.
Table-6 reveals that the recovery performance of the Pandyan Grama Bank for the financial
year 1999-2000 to 2013-2014 particularly in the non – farm sector.
A closer observation of Table 6 the demand is increased as well as the over dues also increased and
the percentage of recovery improved from the financial years 1999-2000 to 2013-2014.
The highest recovery can be seen in the year2013-2014 with 97.11% and the lowest recovery
can be observed in the year 1999-2000 with 87%. It shows the trend will be continued in future. This
is a positive sign the recovery performance of non-farm sector in Pandyan Grama Bank in rural
agriculture sector. In the case of overdue the highest overdue can be seen in the year1999-2000 with
12.77% and the lowest overdue can be observed in the year 2013-2014 with 2.89%.
www.icmrr.org 70 [email protected]
INTERCONTINENTAL JOURNAL OF FINANCE RESEARCH REVIEWISSN:2321-0354 - ONLINE ISSN:2347-1654 - PRINT - IMPACT FACTOR:0.720VOLUME 3, ISSUE 4, APRIL 2015
WWW.ICMRR.ORG

Table 7: Total Demand, Recovery and Overdue of Pandyan Grama Bank
(Rs. In
Crore)
S.
No Years Demand Recovery Over Due
% to
Recovery
Growth
%
% of
overdue
over
demand
Growth
%
1 1999-2000 111.4 90.35 21.04 81.47 ---- 73.81 ----
2 2000-2001 123.67 105.91 17.76 86.42 5 79.09 -5.28
3 2001-2002 150.65 132.87 17.78 88.45 2 81.59 -2.50
4 2002-2003 197.7 177.85 19.85 90.12 2 86.27 -4.67
5 2003-2004 314.54 286.5 28.04 91.11 1.1 87.39 -1.12
6 2004-2005 426.5 388.12 38.38 91.14 -0.1 88.31 -0.92
7 2005-2006 404.83 372.04 32.79 92.14 1 93.47 -5.16
8 2006-2007 425.42 393.99 31.43 92.61 0.61 94.17 -0.70
9 2007-2008 493.05 448.59 44.64 90.95 -1.66 88.49 5.68
10 2008-2009 1416.8 1351.27 65.52 95.37 4.42 94.65 -6.16
11 2009-2010 1460.69 1280.9 179.78 87.69 -7.68 84.58 10.07
12 2010-2011 2550.47 1562.23 112.32 92.36 4.67 61.25 23.33
13 2011-2012 3050.3 2955.74 90.58 94.52 2.16 96.90 -35.65
14 2012-2013 3257.96 3155.37 102.58 96.85 2.33 98.60 -1.70
15 2013-2014 3540.8 3450.31 90.49 97.44 0.59 97.85 0.75
TOTAL 17924.78 16152.04 892.98 1366.89 ---- 1306.42 ----
AVG 1194.98 1076.80 59.53 91.12 ---- 87.09 ----
S.DEV 1271.67 1192.48 46.87 4.29 ---- 3.89 ----
CV 106.41 110.74 78.74 4.71 ---- 3.75 ----
CGR 31.33 -88.01 31.76 0.87 ---- 0.78 ----
Source: Annual Reports of Pandyan Grama Bank.
A closer observation of Table-7 the demand is increased as well as the over dues also
increased and the percentage of recovery improved from the financial years 1999-2000 to 2013-2014.
The highest recovery can be seen in the year 2013-2014 with 97.44% and the lowest recovery can be
observed in the year 1999-2000 with 81.47%. It shows the trend will be continued in future. This is a
positive sign the recovery performance of total farm sector in Pandyan Grama Bank in rural
agriculture sector. In the case of overdue the highest overdue can be seen in the year2012-2013 with
98.60% and the lowest overdue can be observed in the year 2010-2011 with 61.25%.
A Null hypothesis is framed from the above analysis that there is no significant difference
between the total demand, recovery and over dues that support higher growth of the Pandyan Grama
Bank Tamil Nadu.
ANOVA one way classification was performed to test the hypothesis and correlation was
also computed. The results are exhibited in table-8 and 9.
www.icmrr.org 71 [email protected]
INTERCONTINENTAL JOURNAL OF FINANCE RESEARCH REVIEWISSN:2321-0354 - ONLINE ISSN:2347-1654 - PRINT - IMPACT FACTOR:0.720VOLUME 3, ISSUE 4, APRIL 2015
WWW.ICMRR.ORG

Table: 8 ANOVA: Single Factor
SUMMARY
Groups Count Sum Average Variance
Column 1 15 17924.78 1194.985 1617155
Column 2 15 16152.04 1076.803 1422021
Column 3 15 892.98 59.532 2197.695
ANOVA
Source of Variation SS df MS F
P-
value F crit
Between Groups 116 2 5845153 5.76 0.0 3.2
Within Groups 425 42 1013791
Total 542 44 ---- ----
Thus calculated F-value showed in table-8 is less than the f-critical value, the formed null
hypothesis is rejected and concluded that there is a significant difference the demand, recovery and
overdues process of Pandyan Grama Bank s that supports for the higher performance of the banking
activity. In additional to that these three variables are also involved in testing the relationship through
correlation.
Table 9: Correlation analysis
Particulars Demand Recovery Overdues
Demand 1
Recovery 0.982305 1
Overdues 0.707742 0.656186 1
Table-9 reveals it is also clear from the above that there is positive correlation among the
above variable
Profitability performance
In common parlance profitability is the ability of a business to earn a profit. A profit is what is
left of the revenue a business generates after it pays all expenses directly related to the generation of
the revenue, such as producing a product, and other expenses related to the conduct of the business'
activities. With regards to banking, profitability majorly depends on the income generated from
banking activity through lending and interest paid for the borrowings and deposits collected.
www.icmrr.org 72 [email protected]
INTERCONTINENTAL JOURNAL OF FINANCE RESEARCH REVIEWISSN:2321-0354 - ONLINE ISSN:2347-1654 - PRINT - IMPACT FACTOR:0.720VOLUME 3, ISSUE 4, APRIL 2015
WWW.ICMRR.ORG
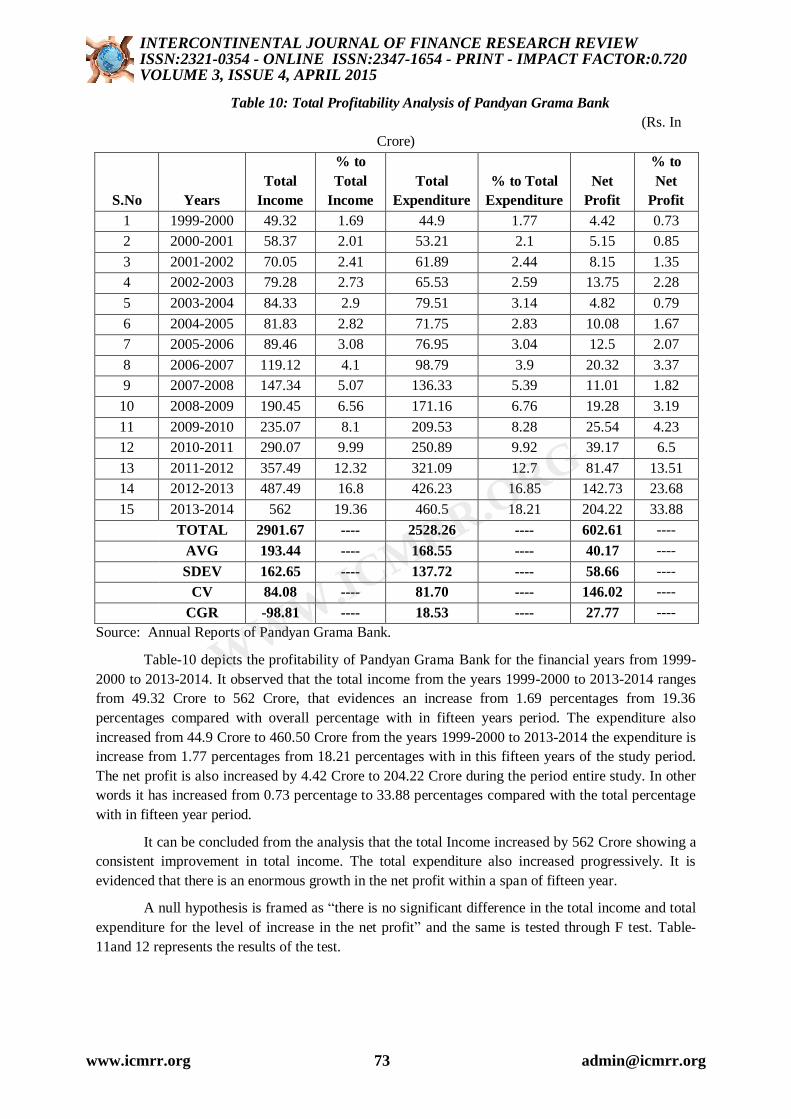
Table 10: Total Profitability Analysis of Pandyan Grama Bank
(Rs. In
Crore)
S.No Years
Total
Income
% to
Total
Income
Total
Expenditure
% to Total
Expenditure
Net
Profit
% to
Net
Profit
1 1999-2000 49.32 1.69 44.9 1.77 4.42 0.73
2 2000-2001 58.37 2.01 53.21 2.1 5.15 0.85
3 2001-2002 70.05 2.41 61.89 2.44 8.15 1.35
4 2002-2003 79.28 2.73 65.53 2.59 13.75 2.28
5 2003-2004 84.33 2.9 79.51 3.14 4.82 0.79
6 2004-2005 81.83 2.82 71.75 2.83 10.08 1.67
7 2005-2006 89.46 3.08 76.95 3.04 12.5 2.07
8 2006-2007 119.12 4.1 98.79 3.9 20.32 3.37
9 2007-2008 147.34 5.07 136.33 5.39 11.01 1.82
10 2008-2009 190.45 6.56 171.16 6.76 19.28 3.19
11 2009-2010 235.07 8.1 209.53 8.28 25.54 4.23
12 2010-2011 290.07 9.99 250.89 9.92 39.17 6.5
13 2011-2012 357.49 12.32 321.09 12.7 81.47 13.51
14 2012-2013 487.49 16.8 426.23 16.85 142.73 23.68
15 2013-2014 562 19.36 460.5 18.21 204.22 33.88
TOTAL 2901.67 ---- 2528.26 ---- 602.61 ----
AVG 193.44 ---- 168.55 ---- 40.17 ----
SDEV 162.65 ---- 137.72 ---- 58.66 ----
CV 84.08 ---- 81.70 ---- 146.02 ----
CGR -98.81 ---- 18.53 ---- 27.77 ----
Source: Annual Reports of Pandyan Grama Bank.
Table-10 depicts the profitability of Pandyan Grama Bank for the financial years from 1999-
2000 to 2013-2014. It observed that the total income from the years 1999-2000 to 2013-2014 ranges
from 49.32 Crore to 562 Crore, that evidences an increase from 1.69 percentages from 19.36
percentages compared with overall percentage with in fifteen years period. The expenditure also
increased from 44.9 Crore to 460.50 Crore from the years 1999-2000 to 2013-2014 the expenditure is
increase from 1.77 percentages from 18.21 percentages with in this fifteen years of the study period.
The net profit is also increased by 4.42 Crore to 204.22 Crore during the period entire study. In other
words it has increased from 0.73 percentage to 33.88 percentages compared with the total percentage
with in fifteen year period.
It can be concluded from the analysis that the total Income increased by 562 Crore showing a
consistent improvement in total income. The total expenditure also increased progressively. It is
evidenced that there is an enormous growth in the net profit within a span of fifteen year.
A null hypothesis is framed as “there is no significant difference in the total income and total
expenditure for the level of increase in the net profit” and the same is tested through F test. Table-
11and 12 represents the results of the test.
www.icmrr.org 73 [email protected]
INTERCONTINENTAL JOURNAL OF FINANCE RESEARCH REVIEWISSN:2321-0354 - ONLINE ISSN:2347-1654 - PRINT - IMPACT FACTOR:0.720VOLUME 3, ISSUE 4, APRIL 2015
WWW.ICMRR.ORG
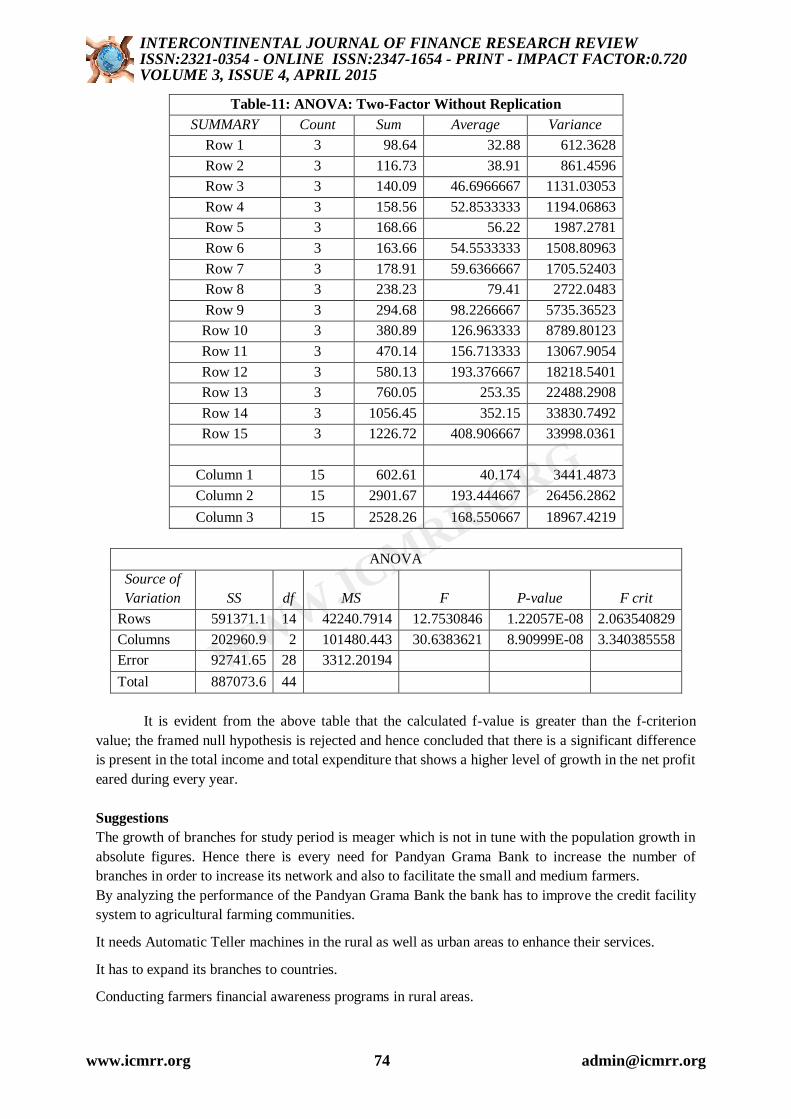
Table-11: ANOVA: Two-Factor Without Replication
SUMMARY Count Sum Average Variance
Row 1 3 98.64 32.88 612.3628
Row 2 3 116.73 38.91 861.4596
Row 3 3 140.09 46.6966667 1131.03053
Row 4 3 158.56 52.8533333 1194.06863
Row 5 3 168.66 56.22 1987.2781
Row 6 3 163.66 54.5533333 1508.80963
Row 7 3 178.91 59.6366667 1705.52403
Row 8 3 238.23 79.41 2722.0483
Row 9 3 294.68 98.2266667 5735.36523
Row 10 3 380.89 126.963333 8789.80123
Row 11 3 470.14 156.713333 13067.9054
Row 12 3 580.13 193.376667 18218.5401
Row 13 3 760.05 253.35 22488.2908
Row 14 3 1056.45 352.15 33830.7492
Row 15 3 1226.72 408.906667 33998.0361
Column 1 15 602.61 40.174 3441.4873
Column 2 15 2901.67 193.444667 26456.2862
Column 3 15 2528.26 168.550667 18967.4219
ANOVA
Source of
Variation SS df MS F P-value F crit
Rows 591371.1 14 42240.7914 12.7530846 1.22057E-08 2.063540829
Columns 202960.9 2 101480.443 30.6383621 8.90999E-08 3.340385558
Error 92741.65 28 3312.20194
Total 887073.6 44
It is evident from the above table that the calculated f-value is greater than the f-criterion
value; the framed null hypothesis is rejected and hence concluded that there is a significant difference
is present in the total income and total expenditure that shows a higher level of growth in the net profit
eared during every year.
Suggestions
The growth of branches for study period is meager which is not in tune with the population growth in
absolute figures. Hence there is every need for Pandyan Grama Bank to increase the number of
branches in order to increase its network and also to facilitate the small and medium farmers.
By analyzing the performance of the Pandyan Grama Bank the bank has to improve the credit facility
system to agricultural farming communities.
It needs Automatic Teller machines in the rural as well as urban areas to enhance their services.
It has to expand its branches to countries.
Conducting farmers financial awareness programs in rural areas.
www.icmrr.org 74 [email protected]
INTERCONTINENTAL JOURNAL OF FINANCE RESEARCH REVIEWISSN:2321-0354 - ONLINE ISSN:2347-1654 - PRINT - IMPACT FACTOR:0.720VOLUME 3, ISSUE 4, APRIL 2015
WWW.ICMRR.ORG
Pandyan Grama Bank can expand its services through post office for financial transactions in the rural
areas. In view of food security bill there is a need to increase the production of pulses and cereals
under circumstances. The Pandyan Grama Bank should come to the support of more number of small
and medium farmers who are the back bone of Indian agriculture and national economy.
Conclusion
India is primary agricultural based and rural density populated country compared with urban areas,
which needs the financial assistance as well as rural friendly, policies to develop rural areas. The
regional rural banks of India are playing a vital role in the development of rural and needy agriculture
poor people in all spheres. The Pandyan Grama Bank is one of the growing banks in Tamil Nadu to
serve the poor agricultural farmers. Pandyan Grama Bank has to further expand its branches all over
the rural areas in Tamil Nadu to assists the farmer’s financial plight on par or more than commercial
banks. If the rural banks tend to move towards the peak of the banking mountain, it is sure that during
the year 2020, India will become not only self-sufficient, but also makes other countries to get ample
level of agriculture and allied products for their survival.
Reference
Books
1. Gupta, S.P. (1992) Statistical Methods, Sultan & Sons, New Delhi, India.
2. Gordon and Natarajan, (2006) Banking Theory Law and Practice, Himalaya Publishing
House, New Delhi, India.
3. Kothari, C.R. Research Methodology, (2004), New Age International Publishers, New Delhi,,
India.
Journals
1. Agarwal R. K., (1991) “Evaluation of the Working of Regional Rural Bank”. Mittal,
Publications, New Delhi, India.
2. Navkiranjit Kaur Dhaliwal,(2010)“Growth and Performance of Regional Rural Bank”,
Discovery Publishing House Pvt Ltd, New Delhi, India.
3. Suresh. R. (2012), “Deposit, Lending and Recovery Performance of Pandyan Grama
Bank Tamil Nadu“An Analysis, Indian Journal of Finance, vol.8, No.12.
4. Venkata Rao.B. (2014) “Performance of Regional Rural Bank in India- Andhra Pradesh
Grameena Vikas Bank in Andhra Pradesh”, International Journal of Advance Research in
Computer Science and Management Studies, vol 2, Issue 4.
www.icmrr.org 75 [email protected]
INTERCONTINENTAL JOURNAL OF FINANCE RESEARCH REVIEWISSN:2321-0354 - ONLINE ISSN:2347-1654 - PRINT - IMPACT FACTOR:0.720VOLUME 3, ISSUE 4, APRIL 2015
WWW.ICMRR.ORG