performance of hot plate for measuring solid precipitation
TRANSCRIPT

Performance of Hot Plate for Measuring Solid Precipitation in Complex Terrainduring the 2010 Vancouver Winter Olympics
FAISAL S. BOUDALA
Cloud Physics and Severe Weather Research Section, Environment Canada, Toronto, Ontario, Canada
ROY RASMUSSEN
National Center for Atmospheric Research, Boulder, Colorado
GEORGE A. ISAAC
Cloud Physics and Severe Weather Research Section, Environment Canada, Toronto, Ontario, Canada
BILL SCOTT
Meteorological Service of Canada, Environment Canada, Vancouver, British Columbia, Canada
(Manuscript received 2 November 2012, in final form 17 September 2013)
ABSTRACT
Solid precipitation intensity, snow density, wind speed, and temperature were collected from November
2009 to February 2010 at a naturally sheltered station located at an altitude of 1640m MSL on Whistler
Mountain in British Colombia, Canada. The snowfall was measured using the instruments OTT Pluvio; the
Yankee Environmental Systems, Inc., hot plate (HP); and the Vaisala FD12P (optical weather sensor). The
snow amount and density were also measured manually daily. The observed wind speeds were in the range
0–4.5m s21 with a mean value of 0.5m s21. Based on this study, the HP overestimated the snow amount by
about a factor of 2 as compared to the Pluvio measurements. Further data analysis using the raw output HP
data suggests that this was because of false precipitations produced, particularly by the downslope flows
in the complex terrain when the wind speeds were relatively stronger. This false precipitation varied from
20.9 to 1.3mmh21 with two peaks at 0.1 and 0.3mmh21 depending on wind speed—the larger peak being at
higher wind speeds. Since the observed wind speeds were relatively calm, setting the correction factor to
0.15mmh21 gave reasonable values as compared to the Pluvio data. The difference between the corrected
HP and Pluvio accumulation data varied from 16% to 3% depending on wind speed. The observed snow
density in January 2010 varied from 0.04 to 0.32 g cm23 with a mean value of 0.08 g cm23. The snow amount
measured using the corrected HP data agreed well with the manually measured values with a correlation
coefficient of 0.93.
1. Introduction
Precipitation plays an essential role in our planet by
controlling the hydrological cycle and hence affecting
climate and weather. Thus, accurate measurement of
precipitation is necessary for understanding its spatial
and temporal variability. Such measurement also has
a critical importance for development and validation
of the numerical weather prediction, climate models,
and satellite and radar remote sensing algorithms. It is
now well recognized that accurate determination of
solid precipitation is particularly challenging. This is
because the traditionally used snow gauges, such as the
OTT Pluvio and Geonor, can be affected by many fac-
tors, including wind- and evaporation-induced loses
(Rasmussen et al. 2012) and wet snow capping (Boudala
et al. 2014; Rasmussen et al. 2012). Although currently
available automatic gauges, such as the Geonor and
Pluvio, can provide short-term precipitation intensity,
they are not sensitive enough to provide reliable in-
tensities at short temporal scales (in minutes) (Boudala
Corresponding author address:Dr. Faisal Boudala, Cloud Physics
and Severe Weather Research Section, Environment Canada, 4905
Dufferin Street, Toronto ON M3H-5T4, Canada.
E-mail: [email protected]
FEBRUARY 2014 BOUDALA ET AL . 437
DOI: 10.1175/JTECH-D-12-00247.1
� 2014 American Meteorological SocietyUnauthenticated | Downloaded 12/13/21 01:54 AM UTC

and Isaac 2009). There are other kinds of instruments
that can measure precipitation, such as the hot plates
(Rasmussen et al. 2011) and forward-scattering probes,
such as the FD12P (Haavasoja et al. 1994). These in-
struments are much more sensitive than the traditional
gauges, but these gauges are relatively new and un-
tested. In particular, these instruments are not well
tested in a complex terrain environment, where it is
particularly challenging to measure precipitation.
The hot plates (HP) are increasingly used for mea-
suring precipitation (Rasmussen et al. 2011, 2012). The
HP is attractive for measuring precipitation because
of its portability and associated straightforward basic
principles employed for determination of precipitation.
However, the HP can be affected by wind and other
factors, such as radiation, and hence requires some cor-
rections (Rasmussen et al. 2011). This study will explore
the validity of the internal algorithms used in the Yankee
Environmental Systems, Inc., hot plates for determina-
tion of solid precipitation in a complex terrain environ-
ment by comparing it with a much more traditional
gauge—the OTT Pluvio—and the FD12P in a natu-
rally sheltered area to minimize the effect of wind.
2. Observations
The Pluvio and FD12P data presented here are also
discussed in Boudala et al. (2014). Here, a brief de-
scription of the dataset will be given. Precipitation in-
tensity and other standard meteorological data were
collected at a station (called VOA) located at 1640-m
height MSL on Whistler Mountain (see Fig. 1), British
Colombia, Canada. The data were collected as part
of the Science and Nowcasting Olympic Weather for
Vancouver 2010 (SNOW-V10) project. More details
about this site are also given in Isaac et al. (2014) and
Boudala et al. (2014). Since the location is naturally
sheltered by trees, it is an ideal place to measure pre-
cipitation (Boudala et al. 2014; Rasmussen et al. 2012).
The VOA station had three platforms. One of them was
part of the Olympic observation network site that was
set up by the Pacific and Yukon Region (PYR) of En-
vironment Canada, where the OTT Pluvio gauge was
placed. The second, which was placed a fewmeters away
from the PYR platform, was a SNOW-V10 research
platform, where the FD12P, hot plate, and other optical
instruments were installed. The third platform, where
the manual measurements were made, was located ap-
proximately 10m away from the other two platforms.
This is the Whistler Mountain long-term station. One-
minute-averaged data from the Pluvio, hot plate, FD12P,
and the other instruments were collected in November
2009 and from January to February 2010. Manual snow
depth and occasional snow density measurements were
also performed daily. For the comparisons between
the Pluvio and the other instruments such as the HP
and FD12P, only the periods when 1-min-averaged
Pluvio data were available were included in this study,
since there have been some dates that the data were
unavailable due to power loss and some communica-
tion problems (see Boudala et al. 2014). There were no
1-min-averaged Pluvio andHP data for the entiremonth
of December 2009, and hence it is not included in this
study.
Instrumentations
Detailed descriptions of instruments used in this study
are given in Boudala et al. (2014); here, only brief de-
scriptions will be given. The precipitation data were
measured using the OTT Pluvio 1 gauge, the Vaisala
FD12P, and the Yankee hot plate.
The Pluvio 1 is a weighting gauge. It is equipped with
a container with a collecting area of 200 cm22. The
weight of the precipitation collected in the container
is measured with an electronic weighing cell at a reso-
lution of 0.1mm with a capacity of measuring up to
1000mm. The OTT Pluvio calculates the precipitation
weight every 6 s using a special intrinsic filter algorithm
to correct for wind effects. The measured precipitation
intensity or amount is reported every minute. The
Pluvio gauge was initially equipped with a collecting
FIG. 1. VOA observation site where three platforms were set up.
These included (i) a permanent Whistler Mountain weather ob-
servation station, where manual snow depth data were collected,
(ii) a PYR platform, where the OTT Pluvio gauge was placed; and
(iii) a second SNOW-V10 research platform, where the FD12P,
HP, and other optical instruments were installed.Whistler gondola
lift towers can be faintly seen in the clearing on the west side of the
site on this Google Earth image.
438 JOURNAL OF ATMOSPHER IC AND OCEAN IC TECHNOLOGY VOLUME 31
Unauthenticated | Downloaded 12/13/21 01:54 AM UTC
ring-heating device to avoid the snow capping problem
and a Tretyakov Shield supplied by the OTT to mini-
mize the effect of wind. The shield created some snow
capping problems by accumulating the heavy, wet snow,
and hence the shield was removed to minimize these
problems. However, the capping persisted because of
the fact that the heated ring worked poorly as a result
of heavy and wet snow. To avoid these problems, the
gauge was wrapped around with a thermostatically con-
trolled water pipe heat tape that was automatically con-
trolled to keep the surface close to 28C when the outside
temperature was less than 28C (see Boudala et al.
2014). Boudala et al. (2014) have shown that the snow
amount measured with the Pluvio at this naturally shel-
tered location agreed quite well with manual snow mea-
surements with an overall average difference of only 4%,
indicating that the Pluvio heating technique mentioned
above worked well and that the effect of wind was rela-
tively minor, which gave overall confidence toward test-
ing the hot plates against the Pluvio measurements.
The Vaisala FD12P is an optical instrument (Haavasoja
et al. 1994). It measures precipitation intensity, precipi-
tation type, and visibility. The probe combines forward
scattering and an analog capacitive surface that senses
precipitation falling on it to determine visibility and
the liquid water equivalent precipitation rate.
This study mainly focuses on the hot plates, and
hence detailed descriptions of this instrument are given
in section 3.
3. Description of the hot plate precipitation gauge
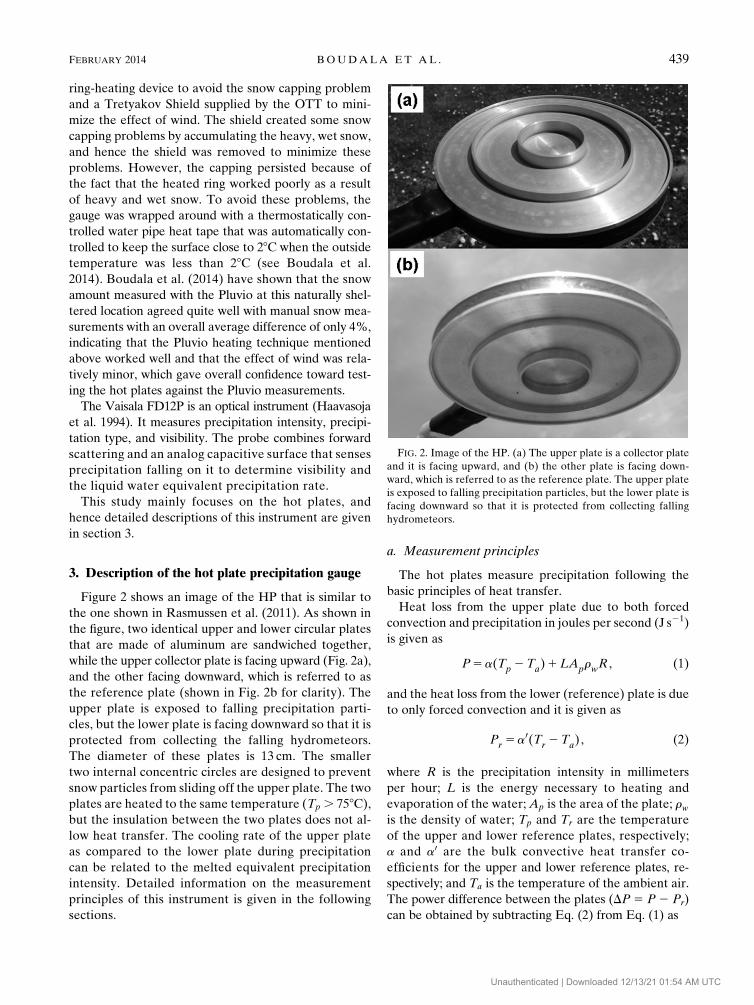
Figure 2 shows an image of the HP that is similar to
the one shown in Rasmussen et al. (2011). As shown in
the figure, two identical upper and lower circular plates
that are made of aluminum are sandwiched together,
while the upper collector plate is facing upward (Fig. 2a),
and the other facing downward, which is referred to as
the reference plate (shown in Fig. 2b for clarity). The
upper plate is exposed to falling precipitation parti-
cles, but the lower plate is facing downward so that it is
protected from collecting the falling hydrometeors.
The diameter of these plates is 13 cm. The smaller
two internal concentric circles are designed to prevent
snow particles from sliding off the upper plate. The two
plates are heated to the same temperature (Tp . 758C),but the insulation between the two plates does not al-
low heat transfer. The cooling rate of the upper plate
as compared to the lower plate during precipitation
can be related to the melted equivalent precipitation
intensity. Detailed information on the measurement
principles of this instrument is given in the following
sections.
a. Measurement principles
The hot plates measure precipitation following the
basic principles of heat transfer.
Heat loss from the upper plate due to both forced
convection and precipitation in joules per second (J s21)
is given as
P5a(Tp2Ta)1LAprwR , (1)
and the heat loss from the lower (reference) plate is due
to only forced convection and it is given as
Pr 5a0(Tr 2Ta) , (2)
where R is the precipitation intensity in millimeters
per hour; L is the energy necessary to heating and
evaporation of the water; Ap is the area of the plate; rwis the density of water; Tp and Tr are the temperature
of the upper and lower reference plates, respectively;
a and a0 are the bulk convective heat transfer co-
efficients for the upper and lower reference plates, re-
spectively; and Ta is the temperature of the ambient air.
The power difference between the plates (DP 5 P 2 Pr)
can be obtained by subtracting Eq. (2) from Eq. (1) as
FIG. 2. Image of the HP. (a) The upper plate is a collector plate
and it is facing upward, and (b) the other plate is facing down-
ward, which is referred to as the reference plate. The upper plate
is exposed to falling precipitation particles, but the lower plate is
facing downward so that it is protected from collecting falling
hydrometeors.
FEBRUARY 2014 BOUDALA ET AL . 439
Unauthenticated | Downloaded 12/13/21 01:54 AM UTC

DP5a(Tp2Ta)2a0(Tr 2Ta)1LAprwR . (3)
As indicated in Eq. (3), there are two forced convective
heat loss terms associated with upper and lower plates,
and the last term is associated with precipitation. Note
that here the effects of sensible and radiative cooling–
heating are neglected. During precipitation, it is gen-
erally assumed that Eq. (3) can be approximated as
DP’LAprwR , (4)
since the two convection terms cancel each other out.
When there is no precipitation (R 5 0), it is also ex-
pected that
DP5a(Tp2Ta)2a0(Tr 2Ta)’ 0: (5)
Provided this assumption holds, the melted equivalent
precipitation rate in millimeters per hour for rain (Rr)
and snow (Rs) can be calculated as
Rr 5(1000mmm21)(3:63 103 s) h21
LyAprwDP5 fLDP , (6)
Rs 5(1000mmm21)(3:63 103 s) h21
LsAprwDP5 fSDP , (7)
where Ly and Ls are the latent heat of vaporization and
sublimation, respectively. The average values of these
parameters maybe taken as Ly 5 2.58 3 106 J kg21 and
Ls 5 1.13Ly (Korolev et al. 1998). The area of the hot
plate used in this study is 13.267 3 1023 and knowing
rw 5 1000 kgm23 5 1000 kgm23, it can be shown that
coefficients fS 5 0.0931 and fL 5 0.1052. The same co-
efficients given by Rasmussen et al. are derived assum-
ing Ap 5 8.844 3 1023m2, and they are given as fS 50.1392 and fL 5 0.1578. According to Rasmussen et al.
(2011), these conversion factors are lower by about 20%
as compared to the Geonor gauge placed in double fence
intercomparison reference (DFIR) measurements, and
hence the modified values are fL 5 0.1219 and fS 50.1118. Since the hot plate used in this study has a differ-
ent area as given above, the new coefficients derived in
this study will be used for calculating the precipitation
rate and comparing it with the default internal HP pre-
cipitation algorithm. As described in Rasmussen et al.
(2011), the HP probe uses temperature to discriminate
between liquid and solid precipitation. For temperatures
less than 08C, solid precipitation is assumed, and hence
the conversion factor fS is used.When the temperatures
were greater than 48C, liquid precipitation is assumed
and hence fL is used. For temperatures between 08 and48C, a linear combination of fL and fS was used.
In reality, however, the assumption given in Eq. (5)
does not always hold due to a heating imbalance be-
tween the two hot plates that produces false precipita-
tion, and hence some correction is required. Based on
Rasmussen et al. (2011), this correction factor has a wind
speed (ws) dependence. Therefore, the expression for de-
riving precipitation using the hot plates can be given as
R5 fDP2Rcor , (8)
where Rcor is the correction factor in millimeters per
hour. This can be determined using Eq. (6) or Eq. (7)
depending on temperature, knowing that no precipita-
tion intensity has been detected, but the power differ-
ence DP is nonzero. With this correction factor, it is
expected that when precipitation is not detected, the
right-side terms cancel each other and hence R 5 0.
This will be discussed in more detail in section 5.
The expression given in Eq. (8) also needs to be cor-
rected for collection efficiency (Colleff) of the upper
plate for solid precipitation. Based on Rasmussen et al.
(2011), this parameter depends on wind speed and it is
given as
CollEff5 12 0:08ws10 ws10 , 10m s21
5 0:2 ws10 . 10m s21 , (9)
where the wind speed is measured at a 10-m height
(ws10). Hence, after correction for collection efficiency
the precipitation intensity is given as
R05R/CollEff . (10)
This collection efficiency factor was developed by
Rasmussen et al. based on data collected using the hot
plate and a Geonor gauge placed in a DFIR at an open
and windy location. Therefore, it is generally expected to
work better in an open field, where the airflow impacting
the hot plates is nearly horizontal. Furthermore, since the
wind speed is normally derived based onPr andTa, which
are generally measured at 2-m height, some adjustment
for wind speed is also required if Eq. (9) is to be used. It is
expected that Yankee may have a similar collection
efficiency algorithm that uses wind speedmeasured at a
2-m height. This equation was not available, and Eqs. (9)
and (10) were not tested in this paper. However, CollEff
is available as an output variable from the probe.
b. Wind speed and collection efficiency
Figure 3a shows CollEff and gauge-level wind speed
(wsHP) reported by the HP, and Fig. 3b shows wsHP
440 JOURNAL OF ATMOSPHER IC AND OCEAN IC TECHNOLOGY VOLUME 31
Unauthenticated | Downloaded 12/13/21 01:54 AM UTC

plotted against 2-m observed wind speed at the VOA
site. As indicated in the figure, the HP probe over-
estimates the wind by more than a factor of 2 under
some conditions, indicating that the HP wind algorithm
in complex terrain and sheltered locations does not
work well. Therefore, the collection efficiency derived
using wsHP would overestimate the precipitation in-
tensity, particularly at higher wind speeds where the
collection efficiencies are smaller than 0.8.As indicated in
Fig. 3b, the 2-m observed wind speeds were generally
very low (,4ms21 with a mean value of 0.5m s21), and
hence the associated collection efficiencies would be
much higher than the values shown in Fig. 3a.
c. Correction factor
As discussed earlier, when winds preferentially cool
the top plate more than the bottom plate, false indica-
tions of precipitation can occur. This may happen when
downslope flow occurs at the site during the evening
hours, for instance, or during down-valley flow over the
mountain from the north. To identify the meteorolog-
ical conditions influencing the HP to produce false
precipitation events, false precipitation intensity cal-
culated using Eqs. (6) and (7) is plotted in Fig. 4 against
2-m observed wind speed (Fig. 4a), 2-m observed wind
speed and direction (Fig. 4c), and temperature (Fig. 4d).
The frequency distribution of the false precipitation for
several 2-m observed wind speed intervals is also given
in Fig. 4b. For the data in this plot, the entire datasets
mentioned in section 2 were used, but only when the
FD12P detected no precipitation. There are some in-
dications that the false precipitations that are associ-
ated with wind directions between 1008 and 2008, andto the lesser extent from 3008 to 3508 are significantly
higher when the wind speeds were relatively stronger
(Fig. 4b). These wind directions are consistent with
downslope flow from the mountain (see Fig. 1). Hence,
this suggests that both wind direction and wind speed
are important factors, but as indicated in Fig. 4a, there
is no significant correlation of false precipitation with
wind speed alone. Based on the frequency distribu-
tion of false precipitation, there is also some indication
that for larger wind speeds (ws . 2m s21), the false
precipitations are larger. The false precipitation varies
from 20.9 to 1.3mmh21 with peaks at 0.1mmh21 and
0.3mmh21 depending on wind speed (Fig. 4b). Al-
though the false precipitation showed some systematic
dependence on wind speed and wind direction, the
dependence is not easily parameterized as a func-
tion of any of the meteorological parameters discussed
above. Hence, in this study, setting the correction
factor Rc to be a constant value of 0.15mmh21 gave
reasonable results, and this is discussed in the follow-
ing section.
FIG. 3. The CollEff and wshp reported by (a) HP and (b) wshp plotted against 2-m observed wind speed at the
VOA site.
FEBRUARY 2014 BOUDALA ET AL . 441
Unauthenticated | Downloaded 12/13/21 01:54 AM UTC

4. Comparisons of precipitation
a. HP against Pluvio and FD12P
Figure 5 shows comparisons of solid precipitation
(SP) amount measured with the Pluvio gauge, FD12P,
and reported directly by the HP (HPrep), calculated
using the raw HP data and Eq. (7) without any correc-
tion for collection efficiency or false precipitation (HPcal)
and with correction for false precipitation (HPcor) using
Eq. (8) without the collection efficiency correction, as-
suming the correction factor is 0.15mmh21 (Fig. 5a).
The corresponding temperature and wind speed are
shown in Fig. 5c. Similar plots to Figs. 5a and 5c are
shown in Figs. 5b and 5d, respectively, but for 2-m
observed wind speed less than 1m s21. The data were
collected in November 2009 and from 1 January to
17 February 2010. In Fig. 5, one data point represents
1min of averaged data. The total SP amounts based on
the HP were 343, 259, and 175mm for HPrep, HPcal, and
HPcor, respectively. For the same period, the SPmeasured
using the Pluvio and FD12P were 150.4 and 111mm,
respectively. The ratios HPrep/Pluvio, HPcal/Pluvio,
HPcor/Pluvio, and FD12P/Pluvio were 2.3, 1.72, 1.16,
and 0.74, respectively. Hence, the total SP amount re-
ported by theHPwas larger than the valuemeasured with
Pluvio by a little more than a factor of 2. However, after
correction for false precipitation (HPcal 2 0.15), the cal-
culated precipitation is quite close to the value measured
with Pluvio with only a 16%difference. The FD12P seems
to underestimate the SP by about 26%as compared to the
value measured by Pluvio. Note that the collection effi-
ciency effect on HP was not included in the calculation
of HPcal, but it can be seen by comparing the reported
values that include this effect, and the calculated values
before correction and after correction (Fig. 5a). The effect
of wind is relatively small as compared to the effect of false
precipitation. Based on the results found here, the effect
of wind via collection efficiency was close to 10%. It can
be seen in Fig. 5a, however, that the effect of false pre-
cipitation onHP increases with increasing time, and hence
for shorter time periods, the effect of collection efficiency
may dominate if the wind is sufficiently large.
FIG. 4. (a) False precipitation intensity (HPfalse) calculated using Eqs. (6) and (7) plotted against 2-m observed
wind speed, (c) 2-m observed wind speed and direction, and (d) temperature. (b) Frequency distributions of the
HPfalse for several 2-m observed wind speed intervals.
442 JOURNAL OF ATMOSPHER IC AND OCEAN IC TECHNOLOGY VOLUME 31
Unauthenticated | Downloaded 12/13/21 01:54 AM UTC

When the data were segregated based on the 2-m
observedwind speed (,1m s21) as in Figs. 5c and 5d, the
reported and calculated SP amounts were 263, 198, and
132.6mm for HPrep, HPcal, and HPcor, respectively, and
the SP amounts measured by Pluvio and FD12P were
128 and 86mm, respectively. The rations HPrep/Pluvio,
HPcal/Pluvio, HPcor/Pluvio, and FD12P/Pluvio were
for 2.1, 1.55, 1.03, and 0.7, respectively. The ratios
changed by approximately 10%, indicating the effects
of wind speed were relatively weak, but the HPcor value
was much closer to the value measured by the Pluvio
gauge with only a 3% difference as compared to a 16%
difference when all the wind speed values were in-
cluded in the analysis.
These results suggest that the internal algorithms
used in HP may not be applicable for a sheltered, com-
plex terrain environment due to several factors. These
include the overestimation of wind speed by the HP
when it is sheltered, which affects the collection effi-
ciency algorithm, and downslope flow, which may in-
duce false precipitation. Nonetheless, a simple correction
factor for false precipitation and neglecting the effect of
collection efficiency seems to remove most of the bias.
b. HP against manual measurements: Snow depthand snow density
As mentioned earlier in the introduction, there were
manual measurements of snow depth and snow density
at the VOA site. The manual snow depth readings taken
daily at VOA were done by a permanent tall ruler left
in the snow, and the data are available for all winter
seasons. The snow density measurements were made
sporadically once per day during the Olympics period
in December 2009 and January 2010 using a Snow-
metrics T1 tube sampler and a hanging weighing scale.
The Snowmetrics T1 tube sampler is about 30.5 cm in
length and about 5.5 cm in diameter, and marked with
a ruler in metric and English graduations. The snow
depth is measured by inserting the tube into freshly
fallen snow typically collected on a snowboard. The
amount of snow in the tube was scooped with a help of
a scrapper and secured by closing the tube with a lid.
FIG. 5. (a) Time series of SP amount measured with the Pluvio gauge and FD12P; and HPrep calculated using
Eq. (7) without any correction HPcal and with correction HPcor using Eq. (8), assuming the correction factor is
0.15mmh21 without the collection efficiency factor. (c) Corresponding temperature and 2-m observed wind speed.
(b),(d) As in (a),(c), but for wind speed, 1m s21. Data were collected in November 2009 and from 1 Jan 2010 to 17
Feb 2010. One data point represents 1-min-averaged data.
FEBRUARY 2014 BOUDALA ET AL . 443
Unauthenticated | Downloaded 12/13/21 01:54 AM UTC

The weight of the snow as water equivalent (SWE) in
millimeters was determined by weighing the tube and
the snow using the hanging scale.
In this study, we have included snow depth measure-
ments taken in November 2009 and January–February
2010. However, as stated earlier, there were no 1-min-
averaged HP data for the entire month of December
2009, and hence the snow density information cannot be
used. For the rest of the period, snow density measure-
ments were only made in January, and for November
and February the mean snow density of 12:1 ratio mea-
sured in January was assumed (see the discussion below)
for converting the snow depth to SWE. Using measure-
ments of snow depth (Ds) in centimeters and associated
SWE in millimeters, the snow to SWE ratio (SWR) can
be computed as
SWR510Ds
SWE, (11a)
and the bulk snow density is given as
rs 5rw
SWR, (11b)
where rw is the density of pure water, which is 1.
Figure 6 shows the daily variation of observed SWR
(Fig. 6a) and associated snow density (Fig. 6b), and
temperature (maximum, minimum, mean) (Fig. 6c) for
January 2010. The values of SWR range from 3.1 to
26 (Fig. 6a) with an associated range of densities of
0.32–0.04 g cm23 (Fig. 6b). The calculated mean values
for SWR and rs were 12.3 and 0.08 g cm23, respectively.
Traditionally, the average SWR is assumed to be 10
for most meteorological applications based on a Cana-
dian study reported by Potter (1965) (see Roebber et al.
2003 for discussions), and this would imply a snow den-
sity of 0.1 g cm23, which is very close to themean rs value
found in this study, but slightly higher. As would be ex-
pected, the two higher snow density days (the 10th and
11th) are associated with relatively warmer tempera-
tures with a mean value near 08C (Fig. 6c).
Figure 7 shows the daily accumulation rate of the
SWE measured manually and using the hot plate (HPcor)
(Fig. 7a), the total accumulation starting on 14 November
2009 to the end of November and from January to
February 2010 (Fig. 7b), the observed daily averaged
minimum and maximum temperatures (Fig. 7c), and
the HPcor data plotted against the manual measurements
(Fig. 7d). The manual snow depth measurements were
converted to SWE with the help of the snow density for
FIG. 6. (a) Daily variation of observed SWR, (b) the associated snow density, and
(c) temperature (maximum, minimum, mean) for January 2010.
444 JOURNAL OF ATMOSPHER IC AND OCEAN IC TECHNOLOGY VOLUME 31
Unauthenticated | Downloaded 12/13/21 01:54 AM UTC

the January data as discussed above, and when this
information was missing, the mean snow density of
0.08 g cm23 was used for the rest of the data. The in-
clusion of the snow density information for January data
improved the agreement with the corrected HP data by
increasing the correlation coefficient from 0.68 to 0.84
and decreasing the mean bias from 0.34 to 0.22mm.
A total of about 76 daily manual measurements are in-
cluded in Fig. 7. The daily averaged temperature varied
from a maximum of 4.58C in February to 2128C. Thetotal amounts of solid precipitation measured using the
HP and the manual method were very close—697 and
721mm, respectively. The two datasets correlated well
with a correlation coefficient (r) of 0.93 with a mean
difference (MD) of 0.32 (mm), but the data also shows
occasional discrepancy at the lower end of the data
(Fig. 7d) that may be associated with uncertainties in
snow density and manual snow depth measurements
and other factors, such as uncertainty in the HP pre-
cipitation algorithms.
5. Summary and conclusions
Solid precipitation intensity, snow depth, snow den-
sity, and relevant meteorological parameters were col-
lected at a station that is in a naturally sheltered area
located at an altitude of about 1640m MSL on Whistler
Mountain in British Colombia, Canada. The precipi-
tation intensity was measured using the Pluvio, a hot
plate, and FD12P instruments. The data analyzed in this
paper were collected from November 2009 to February
2010, which is the same dataset reported in Boudala
et al. (2014). The wind speeds measured during this
period were in the range 0–4.5m s21 with a mean value
of 0.5m s21. This study was particularly intended to
explore the validity of the internal algorithms used in
the Yankee hot plates for determination of solid pre-
cipitation in a complex terrain environment by com-
paring it with much more traditional gauges: the OTT
Pluvio and the FD12P. Based on this study, there is
an indication that the hot plate overestimates solid
FIG. 7. (a) Daily accumulation rate of the manually measured SWE and using the HPcor, (b) total accumulation,
and (c) observed daily average minimum and maximum temperatures, all starting on 14 Nov 2009 to the end of
November and from January to February 2010. (d) HPcor data plotted against the manual measurements.
FEBRUARY 2014 BOUDALA ET AL . 445
Unauthenticated | Downloaded 12/13/21 01:54 AM UTC

precipitation amount by approximately a factor of 2 as
compared to the Pluvio gauge measurements. There
are some indications that this is because of false pre-
cipitations produced by the downslope flow in the
complex terrain, particularly when the wind speeds were
stronger. This false precipitation varied from 20.9 to
1.3mmh21 with two peaks at 0.2 and 0.4mmh21 de-
pending on wind speed—the larger peak being at higher
wind speeds (ws . 2m s21). Nonetheless, since the ob-
served wind speeds were relatively calm, neglecting the
collection efficiency and setting the correction factor
to 0.15mmh21 gave reasonable values as compared to
the Pluvio, particularly at lower wind speeds. After the
correction was applied, the difference between the hot-
plate and the Pluvio accumulation varied from 16% to
3%, the 3% difference was being at the lower wind
speeds (ws , 1m s21).
The snow density measured in January 2010 varied
from 0.04 to 0.32 g cm23 with a mean value of 0.08g cm23.
The hot plate data were also compared to the daily
manual measurements, and the agreement was good
with a correlation coefficient of 0.92 with a mean dif-
ference just 0.32mm.
Acknowledgments. The authors thank Monika Baily
and Paul Joe for their help; and Steve Bacic, Robert
Reed, and Mike Harwood for installing the instrument;
and Ivan Heckman and Janti Reid for helping with data
management and archiving. The authors also would like
to extend their thanks to the Whistler Mountain weather
observers, who manually measured depth; and to Janiper
Buller, Antom Horvath, and Jan Davies for measuring
snow density and amounts.
REFERENCES
Boudala, F. S., and G. A. Isaac, 2009: Parameterization of visibility
in snow: Application in numerical weather prediction models.
J. Geophys. Res., 114, D19202, doi:10.1029/2008JD011130.
——, ——, R. Rasmussen, S. G. Cober, and B. Scott, 2014: Com-
parisons of snowfall measurements in complex terrain made
during the 2010 Winter Olympics in Vancouver. Pure Appl.
Geophys., doi:10.1007/s00024-012-0610-5, in press.
Haavasoja, T., J. L€onnqvist, and P. Nylander, 1994: Present weather
and fog detection for highways. Proc. Seventh SIRWEC Conf.,
Seefeld, Austria, SIRWEC, 211–215.
Isaac, G. A., and Coauthors, 2014: Science of nowcasting Olympic
weather for Vancouver 2010 (SNOW-V10): AWorldWeather
Research Programme Project. Pure Appl. Geophys., doi:10.1007/
s00024-012-0579-0, in press.
Korolev, A. V., J. W. Strapp, G. A. Isaac, and A. N. Nevzorov, 1998:
The Nevzorov airborne hot-wire LWC–TWC probe: Principle
of operation and performance characteristics. J.Atmos.Oceanic
Technol., 15, 1495–1510.
Potter, J. G., 1965:Water content of freshly fallen snow. CIR-4232,
TEC-569, Meteorology Branch, Dept. of Transport, Toronto,
ON, Canada, 12 pp. [Available from National Snow and Ice
Data Center User Services, University of Colorado, Campus
Box 449, Boulder, CO 80309-0449.]
Rasmussen, R.M., J. Hallett, R. Purcell, S. D. Landolt, and J. Cole,
2011: The hotplate precipitation gauge. J. Atmos. Oceanic
Technol., 28, 148–164.
——, and Coauthors, 2012: How well are we measuring snow: The
NOAA/FAA/NCAR winter precipitation test bed. Bull. Amer.
Meteor. Soc., 93, 811–829.
Roebber, P. J., S. Bruening, D. M. Schultz, and J. V. Cortinas Jr.,
2003: Improving snowfall forecasting by diagnosing snow den-
sity. Wea. Forecasting, 18, 264–287.
446 JOURNAL OF ATMOSPHER IC AND OCEAN IC TECHNOLOGY VOLUME 31
Unauthenticated | Downloaded 12/13/21 01:54 AM UTC