performance of enterprise web applications in docker ...€¦ · performance of enterprise web...
TRANSCRIPT

PERFORMANCE OF ENTERPRISE WEB APPLICATIONS IN DOCKER CONTAINERS ON VMWARE vSPHERE 6.5
PERFORMANCE STUDY – SEPTEMBER 2017

PERFORMANCE OF ENTERPRISE WEB APPLICATIONS IN DOCKER CONTAINERS ON VMWARE VSPHERE 6.5
PERFORMANCE STUDY / 2
Table of Contents
Executive Summary ..........................................................................................................................................................................3 Introduction ....................................................................................................................................................................................... 4 Test Environment ............................................................................................................................................................................. 4
Test Workload ................................................................................................................................................................................................... 4 Reference Application ............................................................................................................................................................................. 5 Reference Workload ................................................................................................................................................................................. 6
Testbed Configuration................................................................................................................................................................................... 6 Workload Driver Servers ......................................................................................................................................................................... 7 Test Servers .................................................................................................................................................................................................. 7 Storage ........................................................................................................................................................................................................... 7
vSphere 6.5 Configuration .......................................................................................................................................................................... 8 Virtual Machine Configuration .............................................................................................................................................................. 8 Docker Container Configuration .......................................................................................................................................................... 8
Bare-Metal Configuration ............................................................................................................................................................................ 9 Operating System ...................................................................................................................................................................................... 9 Docker Container Configuration .......................................................................................................................................................... 9
Performance of Docker Containers in vSphere VMs .............................................................................................................. 10 Baseline Performance ................................................................................................................................................................................. 10 Effect of Docker Tuning Options on Performance........................................................................................................................... 12
Tuning Docker Containers for Weathervane Performance in vSphere 6.5 VMs ............................................................. 12 Tuning Docker Containers for Weathervane Performance on Bare-Metal ...................................................................... 14
Conclusion ........................................................................................................................................................................................ 18 References ........................................................................................................................................................................................ 18 Appendix 1: CPU Scheduler Example......................................................................................................................................... 19 Appendix 2: Configuration Details ............................................................................................................................................ 20
Docker with CPU/Memory Affinity ....................................................................................................................................................... 20 Server Memory Hierarchy and NUMA Nodes .............................................................................................................................. 20 Test with Strict CPU Affinity ................................................................................................................................................................ 22 Test with Affinity to CPU Socket ....................................................................................................................................................... 23

PERFORMANCE OF ENTERPRISE WEB APPLICATIONS IN DOCKER CONTAINERS ON VMWARE VSPHERE 6.5
PERFORMANCE STUDY / 3
Executive Summary Docker containers are growing in popularity as a deployment platform for enterprise applications. However, the performance impact of running these applications in Docker containers on virtualized infrastructures is not well understood. This paper uses the open-source Weathervane performance benchmark to investigate the performance of an enterprise web application running in Docker containers in VMware vSphere® 6.5 virtual machines (VMs). The results show that an enterprise web application can run in Docker on a vSphere environment with not only no degradation of performance, but even better performance than Docker containers on bare-metal
Weathervane is used to evaluate the performance of virtualized and cloud infrastructures by deploying an enterprise web application on the infrastructure and then driving a load on the application. The tests discussed in this paper use three different deployment configurations for the Weathervane application.
• VMs without Docker containers: The application runs directly in the guest operating systems in vSphere 6.5 VMs, with no Docker containers.
• VMs with Docker containers: The application runs in Docker containers, which run in guest operating systems in vSphere 6.5 VMs.
• Bare-metal with Docker containers: The application runs in Docker containers, but the containers run in an operating system that is installed on a bare-metal server.
Figure 1 shows the peak results achieved when running the Weathervane benchmark in the three configurations. The results using Docker containers include the impact of tuning options that are discussed this paper.
Figure 1. Maximum Supported Users for Tuned Configurations
PERFORMANCE OF ENTERPRISE WEB APPLICATIONS IN DOCKER CONTAINERS ON VMWARE VSPHERE 6.5
PERFORMANCE STUDY / 4
Some important things to note in these results:
• The performance of the application using Docker containers in vSphere 6.5 VMs is almost identical to that of the same application running in VMs without Docker containers.
• The application running in Docker containers in VMs outperforms the same application running in Docker containers on bare-metal by about 5%. Most of this advantage can be attributed to the sophisticated algorithms employed by the vSphere 6.5 scheduler.
The results discussed in this paper, along with the results of previous investigations of Docker performance on vSphere [1], show that vSphere 6.5 is an ideal platform for deploying applications in Docker containers.
Introduction Docker containers [2] are rapidly emerging as a key platform for deploying applications onto a variety of compute infrastructures. Deploying applications in Docker containers helps to eliminate issues caused by incompatible environments and eases the movement of applications from development to production. However, the adoption of Docker containers as a deployment vehicle often raises questions about the impact of the underlying infrastructure on application performance.
In this paper, we explore the performance characteristics of a large enterprise web application running in Docker containers deployed in VMware vSphere 6.5 virtual machines (VMs). In order to put the performance of this deployment choice into context, we compare its performance to that of the same application running both in vSphere 6.5 VMs without Docker containers and in Docker containers on an operating system (OS) running directly on the bare-metal server. We also look at the performance impact of some common configuration options in order to better understand the performance differences among these three configurations.
Test Environment In order to evaluate the performance of an application running in Docker containers on vSphere 6.5, we used the open-source Weathervane benchmark and ran all configurations on a common hardware infrastructure.
We used version 1.0.15 of Weathervane [3], an open-source performance benchmark which enables performance comparisons of virtualization and cloud technologies. Weathervane includes a scalable, multi-tier, web application which implements a real-time auction web site. This application can be deployed directly on the OS or inside Docker containers. We deployed a configuration of this application that was large enough to fully utilize the resources of the target server platform, and used the capabilities of the Weathervane benchmark to determine the peak load supported in each deployment scenario. All tests used an identical configuration of the Weathervane Auction application. All of the configuration files needed to replicate the tests discussed in this paper are available in the Weathervane GitHub repository [4].
This section gives an overview of the workload, software, and testbed configuration for the results presented in this paper.
Test Workload We collected the performance data discussed in this paper by deploying an application onto the infrastructure being tested and collecting performance data while driving a controlled workload against the application. We used the Weathervane benchmark for the application, data collection, and generated workload. Weathervane consists of a reference application, a workload driver to generate a load for the application, and a run harness which controls the execution of a benchmark run and collects and summarizes the relevant performance metrics.

PERFORMANCE OF ENTERPRISE WEB APPLICATIONS IN DOCKER CONTAINERS ON VMWARE VSPHERE 6.5
PERFORMANCE STUDY / 5
Reference Application The Weathervane reference application is a scalable web application which implements a real-time auction web site. A deployment of the Weathervane Auction application consists of the following services:
• Java application servers which execute the core application services.
• Front-end web services, such as web servers and load balancers. These services proxy requests to the correct back-end services and perform HTTP-level caching.
• Application support services, such as message and coordination servers. These services support inter-service communication and coordination.
• Data services, including both relational and NoSQL data stores. These services store transactional and high-volume event data for the application.
We selected the configuration of the Weathervane Auction application used for the results discussed in this paper based on testing performed to establish a configuration that placed significant load on the underlying hardware, but that was not bottlenecked by any hardware resource. This enabled us to look at the impact of VM and Docker tuning without having the results biased by hardware limitations. This configuration is shown in Figure 2.
The selected configuration uses two web servers as front-end load balancers and proxy servers, six application servers, and one of each of a number of other support services. Each of these services were deployed both directly on the OS and in Docker containers. More detail about the services used in the Weathervane Auction application are given in the Weathervane User’s Guide [5]. The configuration of the VMs and Docker containers for each of these services is discussed later in this section. Note that in the actual physical layout, all of the services were connected by a single physical network.
Figure 2. Logical layout of Weathervane Auction application deployment

PERFORMANCE OF ENTERPRISE WEB APPLICATIONS IN DOCKER CONTAINERS ON VMWARE VSPHERE 6.5
PERFORMANCE STUDY / 6
Reference Workload The Weathervane workload driver creates a load on the Auction application by simulating users interacting with the application’s client-facing REST API. The level of load driven against the Auction application by the workload driver is stated in terms of the number of active simulated users. A simulated user performs a sequence of operations against the Auction application, modeling the behavior of a real user of the application. Details of the user operations are discussed in the Weathervane User’s Guide [5].
Weathervane defines quality of service (QoS) metrics for the workload created by the simulated users. These QoS metrics define limits on the 99th percentile response times of the user operations, as well as requirements on the percentage of occurrence of each operation in the overall mix. If the workload does not satisfy the QoS requirements at a certain load, then the application and associated infrastructure is unable to support the offered load, and the run is considered to have failed. The peak load at which a particular application and infrastructure combination is able to successfully satisfy the QoS requirements is a measure of the performance capabilities of that deployment. If, as in these tests, we hold the application configuration and tuning constant, then we can compare the performance of different infrastructure options based on the peak passing load that each supports.
Testbed Configuration The tests discussed in this paper were run on the testbed depicted in Figure 3. Four physical servers were used, two for the workload driver VMs, and two for the VMware vSphere and bare-metal test servers. Two identical servers were used to run a total of sixteen workload-driver VMs. All sixteen workload-driver VMs were used for every test. Two identical servers were used as the application host servers for the configurations using VMware vSphere 6.5 and those using CentOS 7.3 on bare-metal. The driver servers were connected to the test servers by a private 10Gbps Ethernet switch. Both test servers used identically configured LUNs on a Fibre Channel storage array. Note that the vSphere and bare-metal tests were never run at the same time to avoid contention for the resources of the storage array.

PERFORMANCE OF ENTERPRISE WEB APPLICATIONS IN DOCKER CONTAINERS ON VMWARE VSPHERE 6.5
PERFORMANCE STUDY / 7
Figure 3. Testbed configuration
Workload Driver Servers The servers used to run the workload driver VMs were identical Dell PowerEdge R720 servers. Each server contained two Intel® Xeon® Processors E5-2690 running at 2.9GHz, each with 8 cores and 16 threads, for a total of 32 logical processors. Each server had 256GB of memory. The BIOS on these servers was set to the Performance profile.
Test Servers The servers used to run the Weathervane Auction application were identical Dell PowerEdge R730 servers. Each server contained two Intel Xeon Processors E5-2687W v3 running at 3.1GHz, each with 10 cores and 20 threads, for a total of 40 logical processors. Each server had 256GB of memory The BIOS on these servers was set to the Performance profile, and Turbo Boost was disabled.
Storage The storage for the VMs and containers used in the deployment of the Weathervane Auction application was located on an EMC VNX5800 storage array. A total of six 5-disk, all SSD, RAID-5 LUNs were used for storage.
For the deployments in vSphere 6.5 VMs, one LUN was used for the relational database (PostgreSQL), one LUN for the event store (MongoDB), and one LUN for all other VMs. For the deployments in Docker containers on bare metal, one LUN was mounted and used as a host-mounted volume for the relational database (PostgreSQL) container, one LUN was mounted and used for the event store (MongoDB) container, and one LUN for all other container storage.

PERFORMANCE OF ENTERPRISE WEB APPLICATIONS IN DOCKER CONTAINERS ON VMWARE VSPHERE 6.5
PERFORMANCE STUDY / 8
vSphere 6.5 Configuration This section describes how we configured the virtual machines for the “VMs without Docker containers” and “VMs with Docker containers” tests.
Virtual Machine Configuration When running the Weathervane Auction application in vSphere 6.5 VMs, we ran each of the application services in separate VMs. There were 13 VMs, using a total of 32 vCPUs and 150GB of memory. Note that because the test server had only 20 physical cores, this meant that some VMs needed to take advantage of both threads available in each core.
APPLICATION SERVICE
NUMBER OF
INSTANCES
SERVICE IMPLEMENTATION
NUMBER OF
VCPUS
MEMORY SIZE
Workload Driver
16 Weathervane Workload Driver
2 16GB
Web Server 2 Nginx 1.12.0 4 16GB
Application Server
6 Apache Tomcat 8.5.15
2 8GB
Coordination Server (CS)
1 Apache Zookeeper 3.4.10
1 1GB
Configuration Manager
(CM)
1 Custom Spring Boot Service
1 1GB
Message Server
1 RabbitMQ 3.5.3 2 4GB
Event Datastore
1 MongoDB 3.0.15 4 48GB
Relational Database
1 PostgreSQL 9.3.17 4 16GB
Table 1. VM configuration
We set the vSphere 6.5 Power Management Policy to High Performance.
In each VM, we installed CentOS 7.3 and VMware Tools using the open-vm-tools.x86_64 package, version 10.0.5-4.el7_3.
Docker Container Configuration When we ran the application services in Docker containers inside the VMs, the VM configuration remained the same, with one Docker container running in each VM. We used the default overlay driver as the Docker storage driver. We used Docker version 17.05.0-ce, build 89658be.

PERFORMANCE OF ENTERPRISE WEB APPLICATIONS IN DOCKER CONTAINERS ON VMWARE VSPHERE 6.5
PERFORMANCE STUDY / 9
Bare-Metal Configuration This section describes the OS and Docker container configurations we used for the “Bare-metal with Docker containers” test. “Bare-metal” here refers to the physical system on which an OS is installed, then Docker containers are run in the OS.
Operating System We used CentOS 7.3 in this configuration. The tuned service was used to manage OS performance, and was set to the latency-performance profile. This profile was selected based on performance testing using Weathervane. The latency-performance profile gave better performance than either the throughput-performance or network-latency profiles for this Weathervane configuration.
Docker Container Configuration When running the Weathervane Auction application in Docker containers on the “bare metal” server, we ran each of the application services in separate containers. There were 13 Docker containers, using a total of 32 vCPUs and 150GB of memory. Note that because the test server had only 20 physical cores, this meant that some containers needed to take advantage of both threads available in each core.
The Docker containers were limited to the same amount of CPU and memory resources as the equivalent virtual machines using the --cpus and --memory options of the docker run command. In some of the tuning experiments we used additional options, which are discussed in later sections.
APPLICATION SERVICE
NUMBER OF INSTANCES
SERVICE IMPLEMENTATION
NUMBER OF CPUS, LIMITED USING
--CPUS
MEMORY SIZE, LIMITED USING
--MEMORY
Web Server 2 Nginx 1.12.0 4 16GB
Application Server 6 Apache Tomcat 8.5.15 2 8GB
Coordination Server (CS)
1 Apache Zookeeper 3.4.10
1 1GB
Configuration Manager (CM)
1 Custom Spring Boot Service
1 1GB
Message Server 1 RabbitMQ 3.5.3 2 4GB
Event Datastore 1 MongoDB 3.0.15 4 48GB
Relational Database 1 PostgreSQL 9.3.17 4 16GB
Table 2. Docker container configuration
The default overlay driver was used as the Docker storage driver. The Docker version used was 17.05.0-ce, build 89658be.

PERFORMANCE OF ENTERPRISE WEB APPLICATIONS IN DOCKER CONTAINERS ON VMWARE VSPHERE 6.5
PERFORMANCE STUDY / 10
Performance of Docker Containers in vSphere VMs In order to understand the performance characteristics of the Weathervane Auction application when run in Docker containers in vSphere 6.5 VMs, we compared the performance of this configuration (“VMs with Docker containers”) to that of two baseline configurations:
• In the first baseline, we ran the application services in identical VMs directly on the guest OS, without using Docker containers. We call this configuration, “VMs without Docker containers.”
• We then ran the application services in Docker containers on an OS running on the bare-metal server without virtualization. We call this configuration, “Bare-metal with Docker containers.”
For the latter configuration, we used the Docker resource controls, --cpus and --memory, to limit the containers to use the same CPU and memory resources as the equivalent vSphere VMs. For each infrastructure configuration, we used the findMax functionality of the Weathervane benchmark to find the peak number of users that the configuration could support while satisfying the per-operation QoS requirements.
We first compared the performance of the three configurations with no special tuning for the Docker containers. In order to better understand these results, we then looked at the effect of specifying parameters to the Docker engine docker run command that could impact the performance results. The results of these investigations are discussed in the following sections.
Baseline Performance Figure 4 shows the peak user load that is supported by each of the three configurations. These results represent out-of-the-box performance, with no special tuning beyond setting the BIOS- and OS-level performance modes, as discussed previously.
• VMs without Docker containers: The configuration with the application running directly in vSphere 6.5 VMs had the best performance characteristics, and was able to support 40,062 active users while still satisfying the QoS requirements. Note that the load generated by 40,062 users corresponds to approximately 25,000 HTTP requests-per-second.
• VMs with Docker containers: The configuration with the application running inside Docker containers within the VMs was able to support a maximum of 35,969 users, about 90% of the “VMs without Docker containers” configuration.
• Bare-metal with Docker containers: The configuration with Docker containers on bare-metal was able to support a maximum of 30,657 users, about 77% of the of the “VMs without Docker containers” configuration and about 85% of the “VMs with Docker containers” configuration.
The results shown in the figure are the average of four findMax runs. The standard deviation was less than 1% of the average for all configurations.

PERFORMANCE OF ENTERPRISE WEB APPLICATIONS IN DOCKER CONTAINERS ON VMWARE VSPHERE 6.5
PERFORMANCE STUDY / 11
Figure 4. Maximum supported users for out-of-the-box configurations
In all three configurations, the average CPU utilization over all 40 logical CPUs was about 60% at the peak load. For reference, when we ran larger configurations of the Weathervane Auction application, the largest passing load that we were able to achieve on this server was about 45,000 users, which occurred at about 72% average CPU utilization.
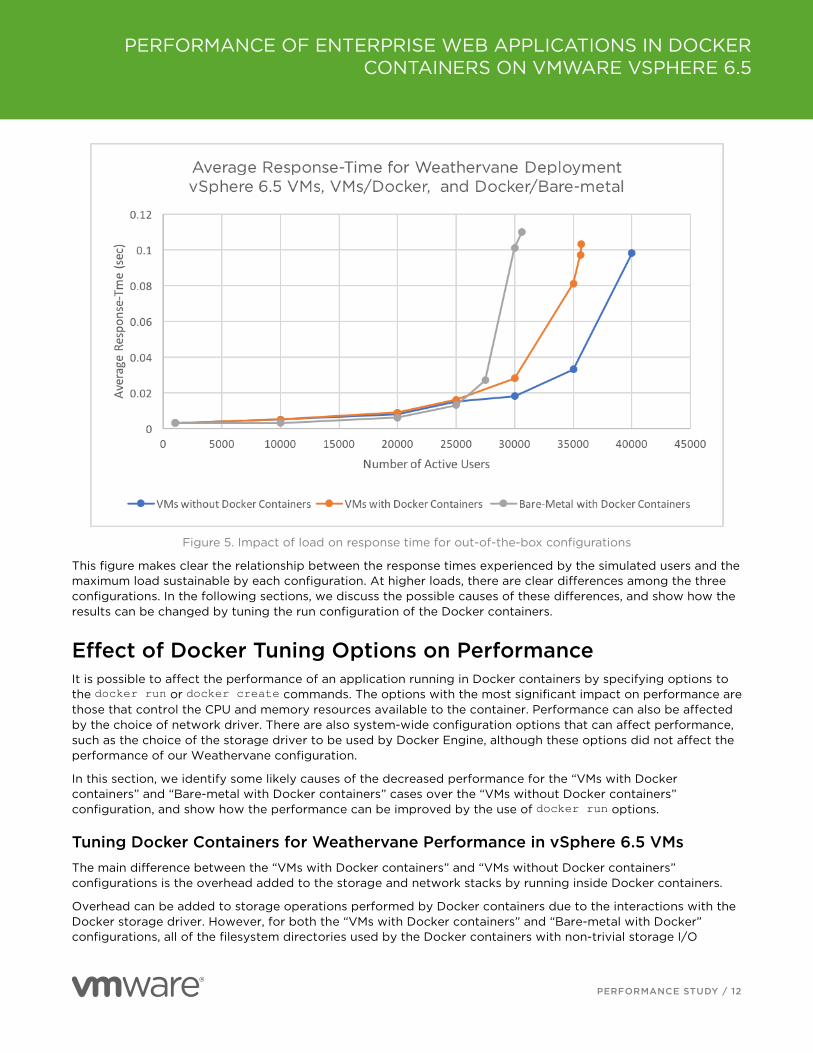
Figure 5 shows the average operation response time as a function of user load for the three configurations, up to the maximum load supported by each. At low load, all three configurations have similar response times, with a slight advantage to the bare-metal configuration. As the load increases, the response times increase rapidly as each configuration approaches its maximum load.
PERFORMANCE OF ENTERPRISE WEB APPLICATIONS IN DOCKER CONTAINERS ON VMWARE VSPHERE 6.5
PERFORMANCE STUDY / 12
Figure 5. Impact of load on response time for out-of-the-box configurations
This figure makes clear the relationship between the response times experienced by the simulated users and the maximum load sustainable by each configuration. At higher loads, there are clear differences among the three configurations. In the following sections, we discuss the possible causes of these differences, and show how the results can be changed by tuning the run configuration of the Docker containers.
Effect of Docker Tuning Options on Performance It is possible to affect the performance of an application running in Docker containers by specifying options to the docker run or docker create commands. The options with the most significant impact on performance are those that control the CPU and memory resources available to the container. Performance can also be affected by the choice of network driver. There are also system-wide configuration options that can affect performance, such as the choice of the storage driver to be used by Docker Engine, although these options did not affect the performance of our Weathervane configuration.
In this section, we identify some likely causes of the decreased performance for the “VMs with Docker containers” and “Bare-metal with Docker containers” cases over the “VMs without Docker containers” configuration, and show how the performance can be improved by the use of docker run options.
Tuning Docker Containers for Weathervane Performance in vSphere 6.5 VMs The main difference between the “VMs with Docker containers” and “VMs without Docker containers” configurations is the overhead added to the storage and network stacks by running inside Docker containers.
Overhead can be added to storage operations performed by Docker containers due to the interactions with the Docker storage driver. However, for both the “VMs with Docker containers” and “Bare-metal with Docker” configurations, all of the filesystem directories used by the Docker containers with non-trivial storage I/O

PERFORMANCE OF ENTERPRISE WEB APPLICATIONS IN DOCKER CONTAINERS ON VMWARE VSPHERE 6.5
PERFORMANCE STUDY / 13
demands were mounted as host volumes on fast, all SDD storage LUNs. Container storage that is mounted as a host volume does not interact with the Docker storage driver, and thus is not subject to the overheads that can be added by those drivers. As a result, we found that the choice of the Docker storage driver did not significantly impact performance in our tests.
The default network driver for Docker containers uses a private bridge network to connect the containers running on a host. The bridge driver also allows the mapping of TCP ports on the host’s network to ports on the bridge network so that containers can be accessed by the outside world. For containers running on the same host and connected by the same bridge, this can provide fast, low-overhead networking. However, for containers which communicate with external hosts, the bridge network will add latency and CPU overhead to every network interaction. In the “VMs with Docker containers” configuration, we are running every container in its own VM. As a result, in the default configuration, all of the network traffic between services running in different VMs will have to traverse two separate bridge networks.
It is possible to eliminate the overhead of the bridge network by using the Docker host network driver. This gives a container direct access to the host’s network without using a bridge network. On a host that is shared by multiple containers, this can raise security concerns and issues with TCP port contention. However, these concerns are not relevant in our configuration of one container per VM.
In order to evaluate the impact of the Docker bridge network on performance in the “VMs with Docker containers” configuration, we repeated the same tests, but with the Docker containers using the host network driver.
Figure 6 shows the results of the two original VM configurations, and the new results using the Docker host network driver. The change in network driver yielded a significant improvement in peak performance. The configuration with Docker running in the VMs is now within 2% of the non-Docker configuration. The results shown in the figure are the average of four findMax runs. The standard deviation was less than 1% of the average for all configurations.
Figure 6. Impact of Docker host network driver on maximum supported users

PERFORMANCE OF ENTERPRISE WEB APPLICATIONS IN DOCKER CONTAINERS ON VMWARE VSPHERE 6.5
PERFORMANCE STUDY / 14
Figure 7 shows the load versus response time curves for these three configurations. We can see that switching to the host network significantly improved the response times at high loads.
Figure 7. Impact of load on response time for VMs
Tuning Docker Containers for Weathervane Performance on Bare-Metal The main contributor to the difference in peak performance between the “VMs with Docker containers” and “Bare-metal with Docker containers” configurations is the manner in which the VMs and containers are scheduled onto the server’s physical processors. When running an application inside a Docker container, a process that runs in that container’s environment runs directly on the server’s OS in the same manner as any other Linux process. In a scenario where there are multiple containers or other active processes running on the OS, such as in the “Bare-metal with Docker containers” configuration, the performance of an individual container will be affected by the operation of the OS’s algorithm for scheduling that process onto physical CPUs. For the “VMs with Docker containers” configuration, the guest OS scheduler manages the assignment of the running processes to the VM’s virtual CPUs (vCPUs), but the vSphere 6.5 scheduler manages the assignment of those virtual CPUs to physical CPUs.
The Linux scheduler uses per-core run queues to spread the threads of executing processes among all available cores. While it does use the concept of hierarchical scheduling domains to attempt to keep threads scheduled within a set of memory resources, such as CPU caches and NUMA nodes [6], it will spread the threads of a single process among all available CPU cores in order to balance the run queues. This takes advantage of all available CPU resources, but may result in the threads and process memory being distributed among NUMA nodes and CPU cache resources. When multiple processes are running, as in the case of the “Bare-metal with Docker containers” configuration, the threads from the individual containers will similarly be spread among CPU cores, potentially with threads from different containers sharing a single core. This can lead to inefficient use of the CPU cache resources and memory hierarchy. The interleaving of threads from different processes on individual run queues may be made worse by the use of the cgroup mechanisms for limiting the CPU usage of a

PERFORMANCE OF ENTERPRISE WEB APPLICATIONS IN DOCKER CONTAINERS ON VMWARE VSPHERE 6.5
PERFORMANCE STUDY / 15
container. This mechanism, used by the Docker cpus option, will force a thread to yield the CPU when it has used its quota for the current period.
The unit of scheduling for the vSphere 6.5 scheduler is a virtual CPU (vCPU) world. Within a VM, the guest OS scheduler will manage the assignment of processes and threads to vCPUs, but it is the vSphere scheduler that manages the assignment of vCPUs to the physical CPU resources. The vSphere scheduler uses sophisticated scheduling algorithms to assign these vCPUs to physical CPU and memory resources. The algorithms are aware of the relationships among a VM’s vCPUs, as well as the server’s CPU and memory configuration, the processors’ cache hierarchy, and the amount of inter-VM communication. When a VM’s vCPUs are scheduled onto physical CPU cores, the processes within that VM can run only on those cores. As a result, when running multi-threaded processes in a VM, the threads will be constrained to run on a subset of the available CPU cores. This can provide better memory locality and make more efficient use of the CPU’s cache and TLB resources than spreading the threads among all cores, particularly when multiple processes or VMs are sharing the server’s resources. The vSphere scheduler also detects communication and data sharing among VMs, and keeps relevant network processing close to the vCPU threads for added efficiency. The CPU Scheduler whitepaper for VMware vSphere 5.1 [7] contains more information about the operation of the vSphere scheduler, although it does not include the improvements that have been made since that paper was published. We show an example of the differences between the Linux and vSphere schedulers in Appendix 1: CPU Scheduler Example.
In our tests, we saw no performance impact from the choice of Docker storage or network driver on the “Bare-metal with Docker containers” configuration. While this configuration used the default bridge network driver, all of the application services were running in Docker containers on the same bridge network. This provided a low overhead, low latency path between the containers that was not improved by the use of the host network driver.
In order to evaluate the impact of the scheduler on the performance of the “Bare-metal with Docker containers” configuration, we re-ran the tests while controlling the Docker containers’ CPU and memory affinity in order to approximate the behavior of the vSphere scheduler. Docker provides the ability to constrain the set of logical CPUs on which a container can run using the cpuset-cpus option to the docker run and docker create commands. On NUMA systems, such as our test servers, it is also possible to constrain a container to use memory from a particular set of NUMA nodes using the cpuset-mems option. Setting affinity is a manual operation that can cause performance issues if not done carefully. It is particularly difficult to find a good assignment of containers to CPUs when, as in the case of our Weathervane configuration, the number of CPUs assigned to the containers exceeds the number of physical CPU cores. Maintaining good performance with CPU affinity is also difficult to manage as containers are added or removed from the system over time.
We looked at the impact of two ways of setting CPU affinity for the containers in the “Bare-metal with Docker containers” configuration:
• In the first test, we set affinity for each Docker container to all of the CPUs in a single physical CPU socket, and set memory affinity to the local NUMA node for that socket. This keeps all of a container’s processes within the same lower-level cache domain, and keeps all memory accesses local, while still allowing the Linux scheduler some control over the assignment of the processes to logical CPUs. The details of the container to CPU assignments for this test are given in Appendix 2: Configuration Details.
• In the second test, we set affinity for each Docker container to the same number of logical CPUs as the same container was assigned in the non-affinity tests. This totally eliminates any control of the CPU assignment of the container by the Linux scheduler, and ensures that its processes remain within a fixed number of cache and TLB hierarchies. We also set the memory affinity for the containers to the local NUMA node for the assigned CPUs. This eliminates issues with remote memory accesses. Note that there are many possible assignments of containers to CPUs, and we looked at only one. While there is likely to be a different assignment that would have better performance characteristics, the effort involved in finding the optimal assignment makes the task impractical. The details of the container to CPU assignments for this test are given in Appendix 2: Configuration Details.

PERFORMANCE OF ENTERPRISE WEB APPLICATIONS IN DOCKER CONTAINERS ON VMWARE VSPHERE 6.5
PERFORMANCE STUDY / 16
Figure 8 shows the results of these tests. Setting affinity to a single CPU socket and NUMA node improved the peak performance of the “Bare-metal with Docker containers” configuration by about 16%, while setting affinity to specific logical CPUs (CPU threads) improved the peak performance of the same configuration by about 21%. The peak performance using affinity with the Docker containers is about 3% higher than the untuned “VMs with Docker containers” configuration, but is about 6% less than the same configuration using Docker host networking. The results shown in the figure are the average of four findMax runs. The standard deviation was less than 1% of the average for all configurations.
Figure 8. Impact of Docker container affinity on maximum supported users
Figure 9 shows the impact of load on response time for the three Docker container affinity configurations. Setting affinity improves the response time at higher loads.

PERFORMANCE OF ENTERPRISE WEB APPLICATIONS IN DOCKER CONTAINERS ON VMWARE VSPHERE 6.5
PERFORMANCE STUDY / 17
Figure 9. Impact of load on response time for Docker containers with and without affinity

PERFORMANCE OF ENTERPRISE WEB APPLICATIONS IN DOCKER CONTAINERS ON VMWARE VSPHERE 6.5
PERFORMANCE STUDY / 18
Conclusion The results in this paper show that VMware vSphere 6.5 provides a highly performant platform on which to deploy applications in Docker containers. The sophisticated algorithms used by the vSphere 6.5 scheduler allow virtual machines, and thus the Docker containers deployed within them, to make efficient use of the available hardware resources.
References
[1] VMware, Inc. VMware VROOM! Blog Tag Archives: Docker. https://blogs.vmware.com/performance/tag/docker
[2] Docker, Inc. (2017) Docker website. https://www.docker.com/
[3] Hal Rosenberg. (2017, August) Weathervane GitHub site. https://github.com/vmware/weathervane
[4] Hal Rosenberg. (2017, April) Weathervane configuration files on GitHub. https://github.com/vmware/weathervane/tree/master/doc/publications/vSphereDocker
[5] Hal Rosenberg. (2017, April) Weathervane User's Guide. https://github.com/vmware/weathervane/blob/master/weathervane_users_guide.pdf
[6] Jean-Pierre Lozi, Baptiste Lepers, Justin Funston, and et al. (2016) The Linux Scheduler: a Decade of Wasted Cores. http://www.ece.ubc.ca/~sasha/papers/eurosys16-final29.pdf
[7] VMware, Inc. (2013, January) The CPU Scheduler in VMware vSphere 5.1. https://www.vmware.com/content/dam/digitalmarketing/vmware/en/pdf/techpaper/vmware-vsphere-cpu-sched-performance-white-paper.pdf
[8] Alexey Kopytov. (2017, September) sysbench. https://github.com/akopytov/sysbench

PERFORMANCE OF ENTERPRISE WEB APPLICATIONS IN DOCKER CONTAINERS ON VMWARE VSPHERE 6.5
PERFORMANCE STUDY / 19
Appendix 1: CPU Scheduler Example To demonstrate the difference between the operation of the vSphere 6.5 scheduler and the Linux scheduler, we ran a simple test using the complex OLTP workload of the Sysbench benchmark [8]. This workload performs a series of insert, select, update, and delete operations against tables in a MySQL database. As long as the database is stored on sufficiently fast storage, this test is CPU limited. We ran the workload, using 40 threads, in a single 4 vCPU VM on vSphere 6.5, and in a Docker container, limited to 4 CPUs with --cpus=4, on bare-metal. We used the same storage and servers as were used in the Weathervane tests.
Figure 10 shows the utilization for all 40 of the server’s logical CPUs during a five-minute steady-state period of the Sysbench/OLTP tests. The chart for the 4 vCPU VM shows that vSphere 6.5 scheduler runs the VM on exactly four logical CPUs at a time, with the utilization of those CPUs being close to 100%. The selected logical CPUs are all on different physical cores, thus avoiding the conflicts that can occur between threads on the same core, and all are local to a single socket and NUMA node. While there is a small amount of migration of work between logical CPUs, the locality achieved by the vSphere 6.5 scheduler makes very efficient use of the CPU cache, TLB, and memory resources, thus achieving high performance. The chart for the 4 CPU Docker container running on bare metal shows that the Linux scheduler spreads the threads for the Sysbench processes evenly across all of the available logical CPUs. While this allows it to take advantage of all of the available CPU resources, it also leads to less efficient use of the cache and TLB resources, more remote memory accesses, possible conflicts between threads on the same core, and may cause conflicts on heavily used cache lines. The Sysbench/OLTP workload achieved an average throughput of 1628 transactions-per-second on bare metal, and 2202 transactions-per-second in the VM, an increase of 35%.
Figure 10. Utilization of logical CPUs for 4 CPU Sysbench/OLTP tests
PERFORMANCE OF ENTERPRISE WEB APPLICATIONS IN DOCKER CONTAINERS ON VMWARE VSPHERE 6.5
PERFORMANCE STUDY / 20
Appendix 2: Configuration Details
Docker with CPU/Memory Affinity In the discussion of Tuning Docker Containers for Weathervane Performance on Bare-metal, we set CPU and memory affinity for the containers used to run the Weathervane Auction application services. In this section, we document the specific assignments used for these tests. Environment variables and other tuning parameters that are generated automatically by the Weathervane run harness have been left off for clarity.
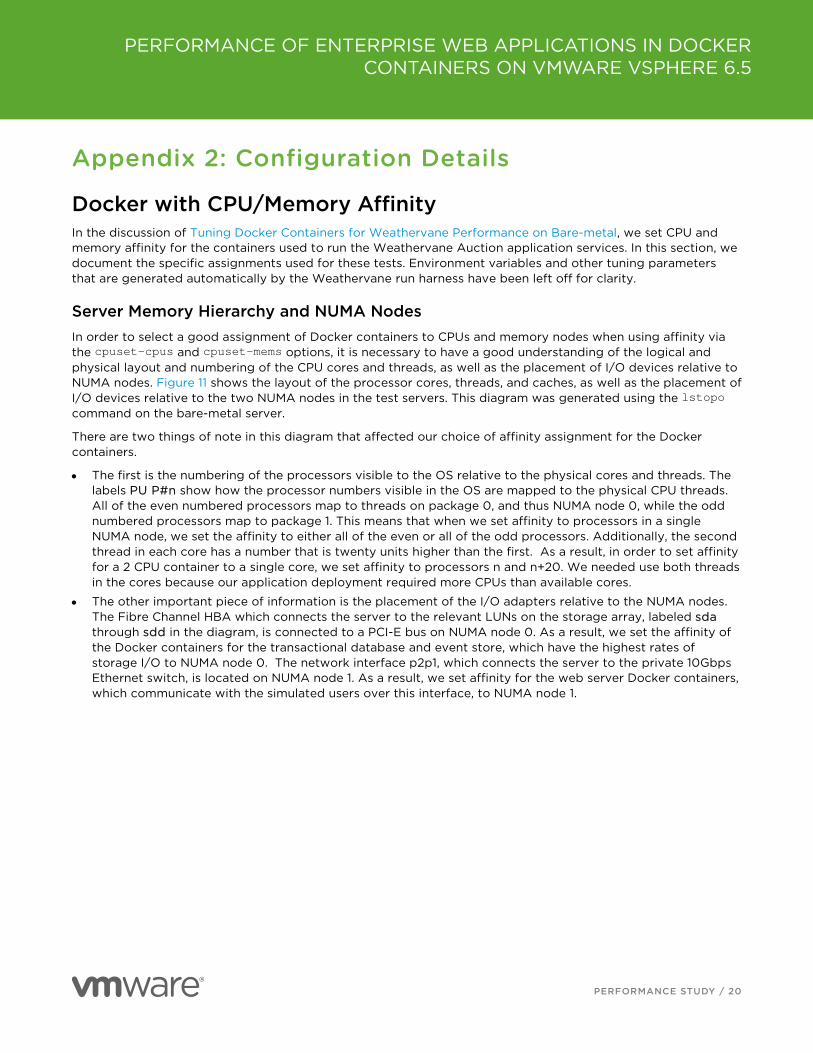
Server Memory Hierarchy and NUMA Nodes In order to select a good assignment of Docker containers to CPUs and memory nodes when using affinity via the cpuset-cpus and cpuset-mems options, it is necessary to have a good understanding of the logical and physical layout and numbering of the CPU cores and threads, as well as the placement of I/O devices relative to NUMA nodes. Figure 11 shows the layout of the processor cores, threads, and caches, as well as the placement of I/O devices relative to the two NUMA nodes in the test servers. This diagram was generated using the lstopo command on the bare-metal server.
There are two things of note in this diagram that affected our choice of affinity assignment for the Docker containers.
• The first is the numbering of the processors visible to the OS relative to the physical cores and threads. The labels PU P#n show how the processor numbers visible in the OS are mapped to the physical CPU threads. All of the even numbered processors map to threads on package 0, and thus NUMA node 0, while the odd numbered processors map to package 1. This means that when we set affinity to processors in a single NUMA node, we set the affinity to either all of the even or all of the odd processors. Additionally, the second thread in each core has a number that is twenty units higher than the first. As a result, in order to set affinity for a 2 CPU container to a single core, we set affinity to processors n and n+20. We needed use both threads in the cores because our application deployment required more CPUs than available cores.
• The other important piece of information is the placement of the I/O adapters relative to the NUMA nodes. The Fibre Channel HBA which connects the server to the relevant LUNs on the storage array, labeled sda through sdd in the diagram, is connected to a PCI-E bus on NUMA node 0. As a result, we set the affinity of the Docker containers for the transactional database and event store, which have the highest rates of storage I/O to NUMA node 0. The network interface p2p1, which connects the server to the private 10Gbps Ethernet switch, is located on NUMA node 1. As a result, we set affinity for the web server Docker containers, which communicate with the simulated users over this interface, to NUMA node 1.

PERFORMANCE OF ENTERPRISE WEB APPLICATIONS IN DOCKER CONTAINERS ON VMWARE VSPHERE 6.5
PERFORMANCE STUDY / 21
Figure 11. Processor and I/O layout of test servers

PERFORMANCE OF ENTERPRISE WEB APPLICATIONS IN DOCKER CONTAINERS ON VMWARE VSPHERE 6.5
PERFORMANCE STUDY / 22
Test with Strict CPU Affinity docker run -v /mnt/cache/nginx2:/var/cache/nginx -p 9081 -p 9444 --cpus=4.00 --cpuset-cpus=1,21,3,23 -
-cpuset-mems=1 --memory=16G --name IsoW1I1Web2D localRegistry:5000/weathervane-nginx:1.0.15
docker run -d -v /mnt/cache/nginx1:/var/cache/nginx -p 9443 -p 9080 --cpus=4.00 --cpuset-
cpus=5,25,7,27 --cpuset-mems=1 --memory=16G --name IsoW1I1Web1D localRegistry:5000/weathervane-
nginx:1.0.15
docker run -d -p 2888 -p 3888 -p 2181 --cpus=1.00 --cpuset-cpus=33 --cpuset-mems=1 --memory=1G --name
IsoW1I1Cs1D localRegistry:5000/weathervane-zookeeper:1.0.15
docker run -d -p 8888 --cpus=1.00 --cpuset-cpus=13 --cpuset-mems=1 --memory=1G --name IsoW1I1Cm1D
localRegistry:5000/weathervane-cm:1.0.15
docker run -d -p 8448 -p 8085 -p 8010 --cpus=2.00 --cpuset-cpus=9,29 --cpuset-mems=1 --memory=8G --
name IsoW1I1App6D localRegistry:5000/weathervane-tomcat:1.0.15
docker run -d -p 8009 -p 8084 -p 8447 --cpus=2.00 --cpuset-cpus=11,31 --cpuset-mems=1 --memory=8G --
name IsoW1I1App5D localRegistry:5000/weathervane-tomcat:1.0.15
docker run -d -p 8083 -p 8446 -p 8008 --cpus=2.00 --cpuset-cpus=0,20 --cpuset-mems=0 --memory=8G --
name IsoW1I1App4D localRegistry:5000/weathervane-tomcat:1.0.15
docker run -d -p 8082 -p 8007 -p 8445 --cpus=2.00 --cpuset-cpus=2,22 --cpuset-mems=0 --memory=8G --
name IsoW1I1App3D localRegistry:5000/weathervane-tomcat:1.0.15
docker run -d -p 8006 -p 8444 -p 8081 --cpus=2.00 --cpuset-cpus=4,24 --cpuset-mems=0 --memory=8G --
name IsoW1I1App2D localRegistry:5000/weathervane-tomcat:1.0.15
docker run -d -p 8443 -p 8005 -p 8080 --cpus=2.00 --cpuset-cpus=6,26 --cpuset-mems=0 --memory=8G --
name IsoW1I1App1D localRegistry:5000/weathervane-tomcat:1.0.15
docker run -d -p 5672 -p 15672 -p 25672 --cpus=2.00 --cpuset-cpus=17,37 --cpuset-mems=1 --memory=4G
--name IsoW1I1Msg1D localRegistry:5000/weathervane-rabbitmq:1.0.15
docker run -d -v /mnt/mongoData:/mnt/mongoData -p 27017 --cpus=4.00 --cpuset-cpus=8,28,10,30 --cpuset-
mems=0 --memory=48G --name IsoW1I1Nosql1D localRegistry:5000/weathervane-mongodb:1.0.15 mongod -f
/etc/mongod.conf
docker run -d -v /mnt/dbLogs/postgresql:/mnt/dbLogs/postgresql -v
/mnt/dbData/postgresql:/mnt/dbData/postgresql -p 5432 --cpus=4.00 --cpuset-cpus=12,32,14,34 --cpuset-
mems=0 --memory=16G --name IsoW1I1Db1D localRegistry:5000/weathervane-postgresql:1.0.15

PERFORMANCE OF ENTERPRISE WEB APPLICATIONS IN DOCKER CONTAINERS ON VMWARE VSPHERE 6.5
PERFORMANCE STUDY / 23
Test with Affinity to CPU Socket docker run -v /mnt/cache/nginx2:/var/cache/nginx -p 9081 -p 9444 --cpus=4.00 --cpuset-
cpus=1,3,5,7,9,11,13,15,17,19,21,23,25,27,29,31,33,35,37,39 --cpuset-mems=1 --memory=16G --name
IsoW1I1Web2D localRegistry:5000/weathervane-nginx:1.0.15
docker run -d -v /mnt/cache/nginx1:/var/cache/nginx -p 9443 -p 9080 --cpus=4.00 --cpuset-
cpus=1,3,5,7,9,11,13,15,17,19,21,23,25,27,29,31,33,35,37,39 --cpuset-mems=1 --memory=16G --name
IsoW1I1Web1D localRegistry:5000/weathervane-nginx:1.0.15
docker run -d -p 2888 -p 3888 -p 2181 --cpus=1.00 --cpuset-
cpus=1,3,5,7,9,11,13,15,17,19,21,23,25,27,29,31,33,35,37,39 --cpuset-mems=1 --memory=1G --name
IsoW1I1Cs1D localRegistry:5000/weathervane-zookeeper:1.0.15
docker run -d -p 8888 --cpus=1.00 --cpuset-cpus=1,3,5,7,9,11,13,15,17,19,21,23,25,27,29,31,33,35,37,39
--cpuset-mems=1 --memory=1G --name IsoW1I1Cm1D localRegistry:5000/weathervane-cm:1.0.15
docker run -d -p 8448 -p 8085 -p 8010 --cpus=2.00 --cpuset-
cpus=1,3,5,7,9,11,13,15,17,19,21,23,25,27,29,31,33,35,37,39 --cpuset-mems=1 --memory=8G --name
IsoW1I1App6D localRegistry:5000/weathervane-tomcat:1.0.15
docker run -d -p 8009 -p 8084 -p 8447 --cpus=2.00 --cpuset-
cpus=1,3,5,7,9,11,13,15,17,19,21,23,25,27,29,31,33,35,37,39 --cpuset-mems=1 --memory=8G --name
IsoW1I1App5D localRegistry:5000/weathervane-tomcat:1.0.15
docker run -d -p 8083 -p 8446 -p 8008 --cpus=2.00 --cpuset-
cpus=0,2,4,6,8,10,12,14,16,18,20,22,24,26,28,30,32,34,36,38 --cpuset-mems=0 --memory=8G --name
IsoW1I1App4D localRegistry:5000/weathervane-tomcat:1.0.15
docker run -d -p 8082 -p 8007 -p 8445 --cpus=2.00 --cpuset-
cpus=0,2,4,6,8,10,12,14,16,18,20,22,24,26,28,30,32,34,36,38 --cpuset-mems=0 --memory=8G --name
IsoW1I1App3D localRegistry:5000/weathervane-tomcat:1.0.15
docker run -d -p 8006 -p 8444 -p 8081 --cpus=2.00 --cpuset-
cpus=0,2,4,6,8,10,12,14,16,18,20,22,24,26,28,30,32,34,36,38 --cpuset-mems=0 --memory=8G --name
IsoW1I1App2D localRegistry:5000/weathervane-tomcat:1.0.15
docker run -d -p 8443 -p 8005 -p 8080 --cpus=2.00 --cpuset-
cpus=0,2,4,6,8,10,12,14,16,18,20,22,24,26,28,30,32,34,36,38 --cpuset-mems=0 --memory=8G --name
IsoW1I1App1D localRegistry:5000/weathervane-tomcat:1.0.15
docker run -d -p 5672 -p 15672 -p 25672 --cpus=2.00 --cpuset-
cpus=1,3,5,7,9,11,13,15,17,19,21,23,25,27,29,31,33,35,37,39 --cpuset-mems=1 --memory=4G --name
IsoW1I1Msg1D localRegistry:5000/weathervane-rabbitmq:1.0.15
docker run -d -v /mnt/mongoData:/mnt/mongoData -p 27017 --cpus=4.00 --cpuset-
cpus=0,2,4,6,8,10,12,14,16,18,20,22,24,26,28,30,32,34,36,38 –cpuset-mems=0 --memory=48G --name
IsoW1I1Nosql1D localRegistry:5000/weathervane-mongodb:1.0.15 mongod -f /etc/mongod.conf
docker run -d -v /mnt/dbLogs/postgresql:/mnt/dbLogs/postgresql -v
/mnt/dbData/postgresql:/mnt/dbData/postgresql -p 5432 --cpus=4.00 --cpuset-
cpus=0,2,4,6,8,10,12,14,16,18,20,22,24,26,28,30,32,34,36,38 –cpuset-mems=0 --memory=16G --name
IsoW1I1Db1D localRegistry:5000/weathervane-postgresql:1.0.15

PERFORMANCE OF ENTERPRISE WEB APPLICATIONS IN DOCKER CONTAINERS ON VMWARE VSPHERE 6.5
PERFORMANCE STUDY / 24
About the Author Hal Rosenberg is a performance engineer at VMware. He is the technical lead and lead developer for the Weathervane project.
VMware, Inc. 3401 Hillview Avenue Palo Alto CA 94304 USA Tel 877-486-9273 Fax 650-427-5001 www.vmware.com Copyright © 2017 VMware, Inc. All rights reserved. This product is protected by U.S. and international copyright and intellectual property laws. VMware products are covered by one or more patents listed at http://www.vmware.com/go/patents. VMware is a registered trademark or trademark of VMware, Inc. in the United States and/or other jurisdictions. All other marks and names mentioned herein may be trademarks of their respective companies. Comments on this document: https://communities.vmware.com/docs/DOC-36121