performance of continuous and segmented post-tensioned ... · performance of continuous and...
TRANSCRIPT

PERFORMANCE OF CONTINUOUS AND SEGMENTED POST-TENSIONED
CONCRETE FILLED FIBER TUBES
By
AARON JOHN BOOKER
A thesis submitted in partial fulfillment of
the requirements for the degree of
MASTER OF SCIENCE IN CIVIL ENGINEERING
WASHINGTON STATE UNIVERSITY
Department of Civil Engineering
DECEMBER 2008

ii
To the Faculty of Washington State University:
The members of the Committee appointed to examine the dissertation/thesis of AARON JOHN BOOKER find it satisfactory and recommend that it be accepted.
___________________________________
Chair
___________________________________
___________________________________

iii
ACKNOWLEDGEMENT
I wish to acknowledge all those that have helped me both through and leading to my
education.
My family, for reminding me of the little things that needed to be done. My brother Joel
for reminding me sometimes to be thankful I have a bachelor’s degree under my belt already. My
mother for trying to take care of me from five states away. For providing humorous support in
his adventures with moving house my father.
All of my friends, both old and new for giving me advice and help. Good advice and
humor from my two good friends Chris and Gabi, even as they keep breaking themselves. Many
friends from Michigan Tech who kept me in touch with the world outside of school; Matt,
Dustin, The very tall Bethlyn, Kim, Dan, Brian and Josh. Also Lynn, hopefully you will be
writing one of these soon as well.
Those friends that I’ve met here at Washington State. Steve for not stealing the desk by
the window, although it did not work that well with the glare. Courtney for not allowing me to
work too long in my office without a pleasant interruption, and letting everyone know what time
they came in. Tony, Diana and Zack for keeping the times outside of the office lively. John and
Chris for showing me both the wonder of disc golf and that there are more to board games than
Monopoly. Karl for showing Alan and I around the nicer parts of Oregon. Alan for attracting the
mosquitoes on the aforementioned trip away from me. Kristen, Jon and Julie for making my stay
here at what I would call home enjoyable.

iv
I wish to thank my chair, Dr. Mohamed ElGawady and the my committee of Dr. David
Pollock and Dr. David McLean for giving me the opportunity to come to Washington State
University and for the research project.
All those here at Washington State that lent their technical and professional support. Scott
and Bob out at the wood lab for making the transition between ideas and reality a bit smoother.
Dr. Pollock and his advice as to my direction throughout this degree was also greatly
appreciated. I’d also like to thank those from Michigan Tech who gave me my start, Dr. Bogue
Sandberg and his advice and teaching in particular.
v
PERFORMANCE OF CONTINUOUS AND SEGMENTED POST-TENSIONED
CONCRETE FILLED FIBER TUBES
Abstract
By Aaron John Booker M.S. Washington State University
December 2008
Chair: Mohamed ElGawady
This research investigated the performance of continuous and segmented post-
tensioned concrete-filled fiber tubes as columns. Four post-tensioned specimens were compared
against a typical monolithic RC specimen with 8 in. diameters and approximate column heights
of 60 in. The four post-tensioned specimens used fiber reinforced polymer tubes as confining
reinforcement, shear reinforcement, and construction formwork. The specimens were subjected
to increasing levels of cyclic lateral displacements. Specimens were compared based on
performance, damage, and energy damping. The specimens were also compared to one analytical
model to predict performance and a finite element analysis using ABAQUS/standard to predict
performance.
The specimens utilizing fiber reinforced polymer tubes had four configurations. Two
configurations tested the specimens with no additional energy dissipation devices in a single 60

vi
in. segment, while a second specimen tested a segmental column consisting of four 15 in.
segments totaling 60 in. Additionally two specimens consisting of four 15 in. segments tested
additional energy dissipation devices. Rubber sheeting was placed between the interfaces of one
specimen to allow the hysteretic displacement of the rubber to dissipate energy and lengthen the
period. In the final specimen steel angles were affixed to both the supporting base and the
column to plastically deform during testing in order to dissipate energy.
Failure of the monolithic RC specimen was typical of the construction type. Significant
spalling of concrete with formation of a plastic hinge occurred prior to failure of the specimen.
Energy dissipation of the monolithic RC specimen was the greatest out of all tested specimens.
For the four specimens utilizing fiber reinforced polymers failure through damage did not occur.
All specimens completed the lateral displacement cycles without significant damage. Force
displacement characteristics of the rubber sheet specimen was significantly lower than that of the
remaining post-tensioned specimens which all exhibited similar force displacement
characteristics. However, in all post-tensioned specimens a rigid rotation about the column base
occurred which caused a permanent elongation in the post-tensioning bar. This permanent
elongation had significant impact on the performance of the column in subsequent displacement
cycles.
vii
TABLE OF CONTENTS
CHAPTER 1: INTRODUCTION ................................................................................................. 1
1.1 Background ........................................................................................................................... 1
1.2 Research Objectives .............................................................................................................. 2
CHAPTER 2: LITERATURE REVIEW ...................................................................................... 3
2.1 Modern Requirements ........................................................................................................... 3
2.2 FRP Advantage ..................................................................................................................... 3
2.3 Confinement .......................................................................................................................... 4
2.4 Shear Reinforcement ............................................................................................................. 5
2.5 Complete CFFT’s .................................................................................................................. 6
2.6 Plastic Hinge Confinement .................................................................................................... 6
2.7 Energy Dissipation of CFFT’s .............................................................................................. 6
2.8 Segmented Columns .............................................................................................................. 7
CHAPTER 3: EXPERIMENTAL PROGRAM .......................................................................... 10
3.1 Introduction ......................................................................................................................... 10
3.2 Monolithic Column ............................................................................................................. 10
3.3 FRP Columns ...................................................................................................................... 10
3.3.1 Specimen FRP-1 and FRP-S ............................................................................................ 11
3.3.2 Specimen FRP-R .............................................................................................................. 12

viii
3.3.3 Specimen FRP-T .............................................................................................................. 12
3.4 Footings ............................................................................................................................... 13
3.5 Specimen Summary............................................................................................................. 15
3.6 Material Properties .............................................................................................................. 15
3.6.1 Concrete ........................................................................................................................... 15
3.6.2 FRP Tube.......................................................................................................................... 15
3.6.3 Sheet Rubber .................................................................................................................... 16
3.6.4 Post-Tensioning Bar ......................................................................................................... 16
3.7 Testing Equipment .............................................................................................................. 18
3.7.1 FRP Strain Gages ............................................................................................................. 20
3.7.2 Post-Tensioning Bar Strain Gages ................................................................................... 21
3.7.3 String Potentiometers ....................................................................................................... 21
3.8 Loading Pattern ................................................................................................................... 23
CHAPTER 4: RESULTS ............................................................................................................ 27
4.1 Introduction ......................................................................................................................... 27
4.2 Specimen RC ....................................................................................................................... 27
4.3 Specimen FRP-1 .................................................................................................................. 30
4.4 Specimen FRP-S ................................................................................................................. 33
4.5 Specimen FRP-R ................................................................................................................. 38
ix
4.6 Specimen FRP-T ................................................................................................................. 42
4.7 Backbone Curves ................................................................................................................. 47
4.8 Energy Dissipation .............................................................................................................. 50
4.9 Post-Tensioning Bar Strain ................................................................................................. 53
4.10 FRP Strain ......................................................................................................................... 57
4.11 Rotations............................................................................................................................ 64
4.12 Curvature ........................................................................................................................... 68
CHAPTER 5: ANALYSIS OF TEST RESULTS ...................................................................... 71
5.1 Moment Curvature Analysis ............................................................................................... 71
5.2 Monolithic RC Performance ............................................................................................... 71
5.3 FRP Specimen Performance ................................................................................................ 73
5.4 Interpretation of Analysis .................................................................................................... 74
CHAPTER 6: FINITE ELEMENT ANALYSIS ........................................................................ 76
6.1 Introduction ......................................................................................................................... 76
6.2 Model Setup ........................................................................................................................ 76
6.3 Model Results ...................................................................................................................... 80
6.4 Model comparison ............................................................................................................... 86
CHAPTER 7: CONCLUSIONS ................................................................................................. 89
7.1 Summary ............................................................................................................................. 89

x
7.2 Conclusions ......................................................................................................................... 89
References: ............................................................................................................................. 93
Appendix A – XTRACT Analysis Results ................................................................................... 95
Appendix B - ABAQUS Input file................................................................................................ 97

xi
LIST OF TABLES
Table 1: Specimen Summary ....................................................................................................... 15
Table 2: FRP Tube Material Properties ....................................................................................... 16
xii
LIST OF FIGURES
Figure 1: Segmented Column at key stages of response (after Hewes and Priestley 2002) ........... 9
Figure 2: Steel Angle .................................................................................................................... 13
Figure 3: Footing........................................................................................................................... 14
Figure 4: Post-Tensioning Jack and Anchorage ........................................................................... 17
Figure 5: Test Setup ...................................................................................................................... 19
Figure 6: Test Setup ...................................................................................................................... 20
Figure 7: String Potentiometer Layout ......................................................................................... 22
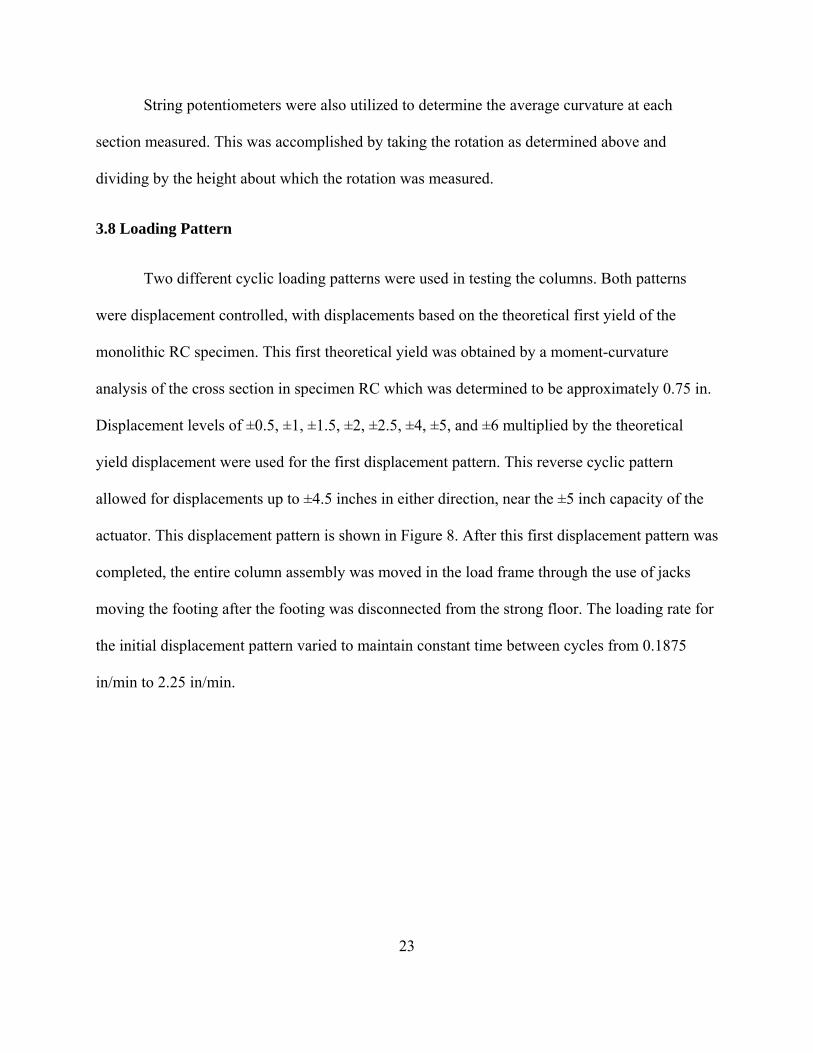
Figure 8: Initial Displacement-based Load Protocol .................................................................... 24
Figure 9: Second Displacement-based Load Protocol .................................................................. 25
Figure 10: Complete Displacement-based Loading Protocol ....................................................... 26
Figure 11: Specimen RC Longitudinal Rebar Buckling After Testing ......................................... 28
Figure 12: Specimen RC at 10 in. Displacement .......................................................................... 28
Figure 13: Specimen RC Load-Displacement Hysteresis Curves ................................................ 29
Figure 14: Specimen FRP-1 Column Base During Pull ............................................................... 31
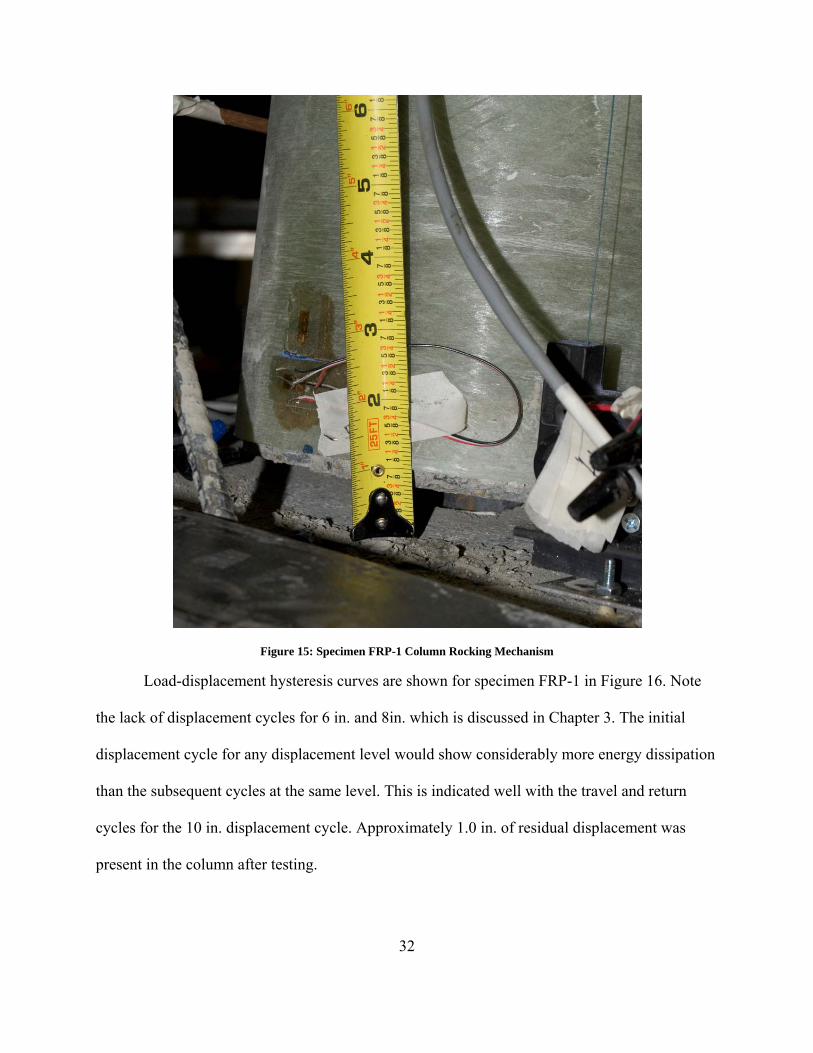
Figure 15: Specimen FRP-1 Column Rocking Mechanism .......................................................... 32
Figure 16: Specimen FRP-1 Load-displacement Hysteresis Curves ............................................ 33
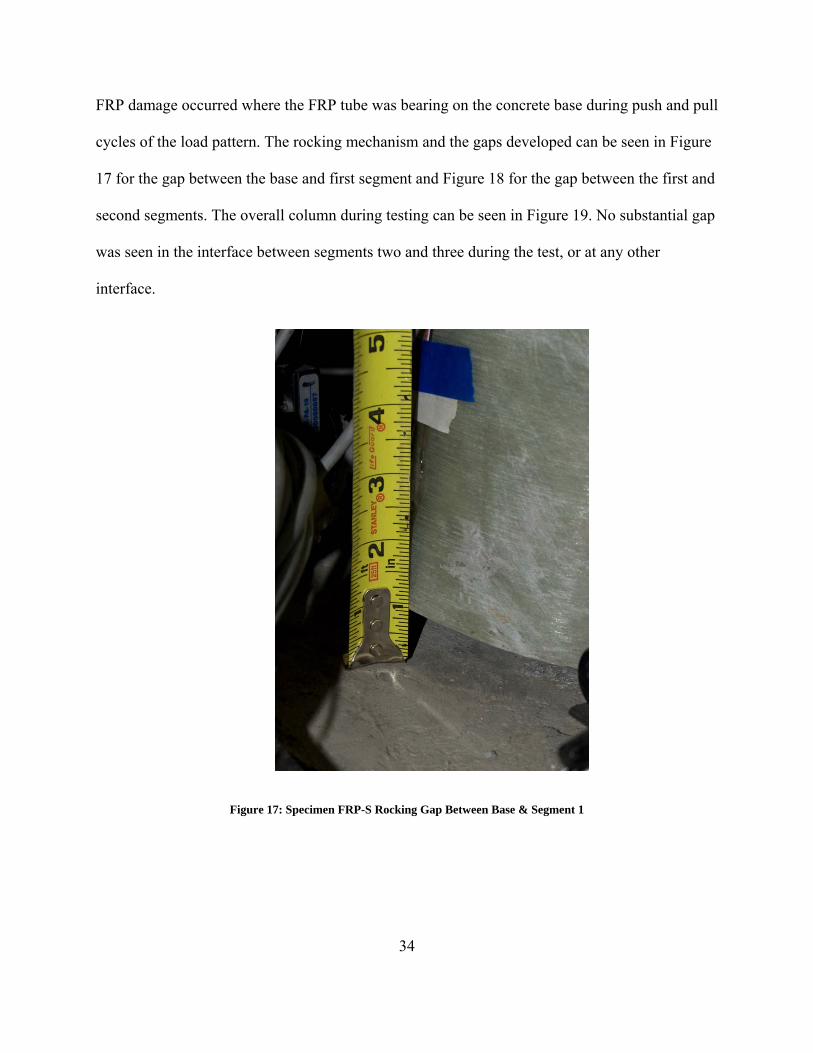
Figure 17: Specimen FRP-S Rocking Gap Between Base & Segment 1 ..................................... 34
Figure 18: Specimen FRP-S Rocking Gap Between Segments 1 & 2 .......................................... 35
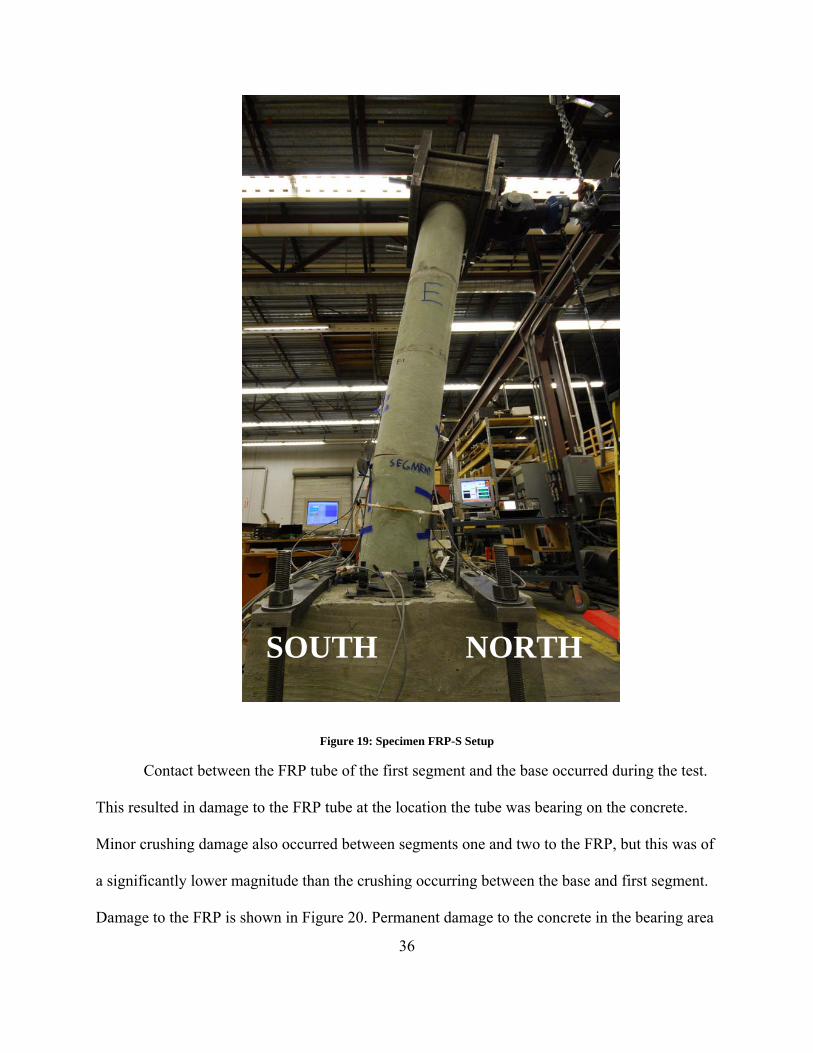
Figure 19: Specimen FRP-S Setup ............................................................................................... 36
Figure 20: Specimen FRP-S Damage to FRP ............................................................................... 37
Figure 21: Specimen FRP-S Load-Displacement Hysteresis Curves ........................................... 38
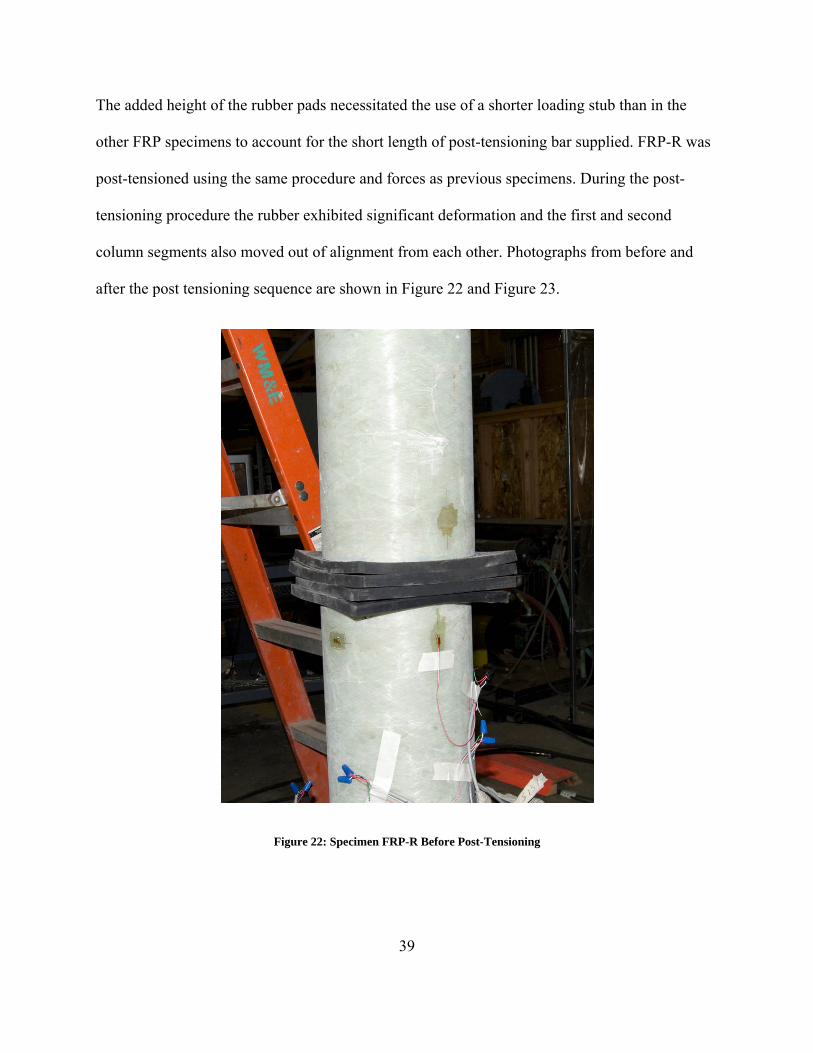
Figure 22: Specimen FRP-R Before Post-Tensioning .................................................................. 39
xiii
Figure 23: Specimen FRP-R After Post-Tensioning .................................................................... 40
Figure 24: Specimen FRP-R Under Displacement ....................................................................... 41
Figure 25: Specimen FRP-R Load-Displacement Hysteresis Curves ........................................... 42
Figure 26: Specimen FRP-T Steel Angles After Testing .............................................................. 43
Figure 27: Specimen FRP-T North Angle Closing ....................................................................... 44
Figure 28: Specimen FRP-T South Angle Opening ..................................................................... 45
Figure 29: Specimen FRP-T First-Second Segment Gap Opening .............................................. 46
Figure 30: Specimen FRP-T Load-Displacement Hysteresis Curves ........................................... 47
Figure 31: Drift vs. Load .............................................................................................................. 48
Figure 32: Drift vs. Secant Stiffness ............................................................................................. 49
Figure 33: Normalized Secant Stiffness ....................................................................................... 50
Figure 34: Drift vs. Cumulative Energy ....................................................................................... 51
Figure 35: Drift vs. Energy in First Cycle .................................................................................... 52
Figure 36: Drift vs. Equivalent Viscous Damping ........................................................................ 53
Figure 37: Post-tensioning Sequence ............................................................................................ 54
Figure 38: Specimen FRP-T Displacement vs. Steel Strain ......................................................... 55
Figure 39: Specimen FRP-S Displacement vs. Steel Strain ......................................................... 56
Figure 40: Specimen FRP-R Displacement vs. Steel Strain ......................................................... 57
Figure 41: Specimen FRP-1 Circumferential Strain ..................................................................... 58
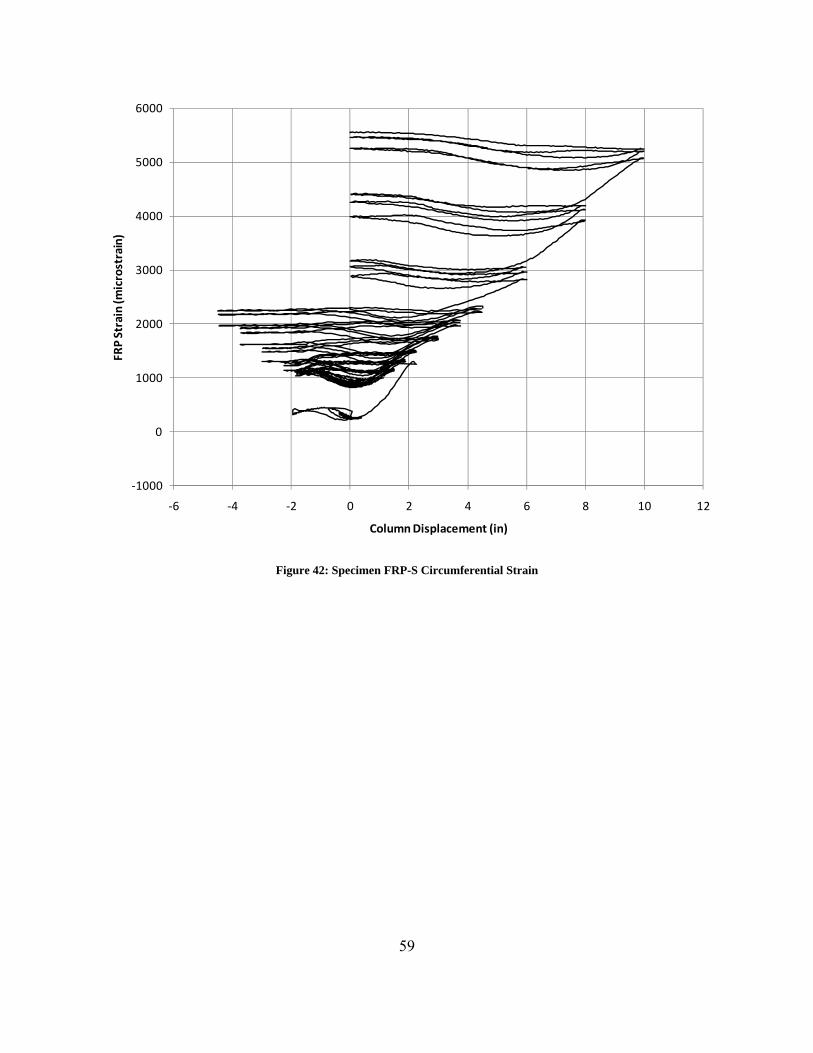
Figure 42: Specimen FRP-S Circumferential Strain ..................................................................... 59
Figure 43: Specimen FRP-R Circumferential Strain .................................................................... 60
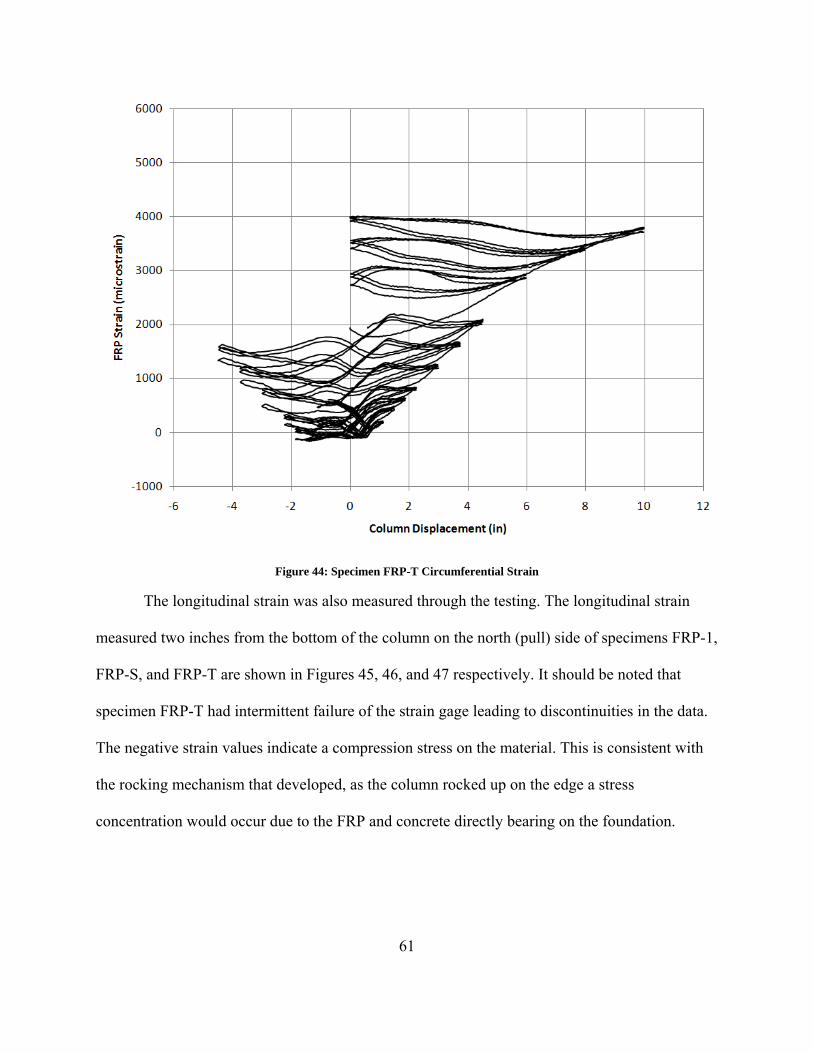
Figure 44: Specimen FRP-T Circumferential Strain .................................................................... 61
Figure 45: Specimen FRP-1 Longitudinal Strain.......................................................................... 62
xiv
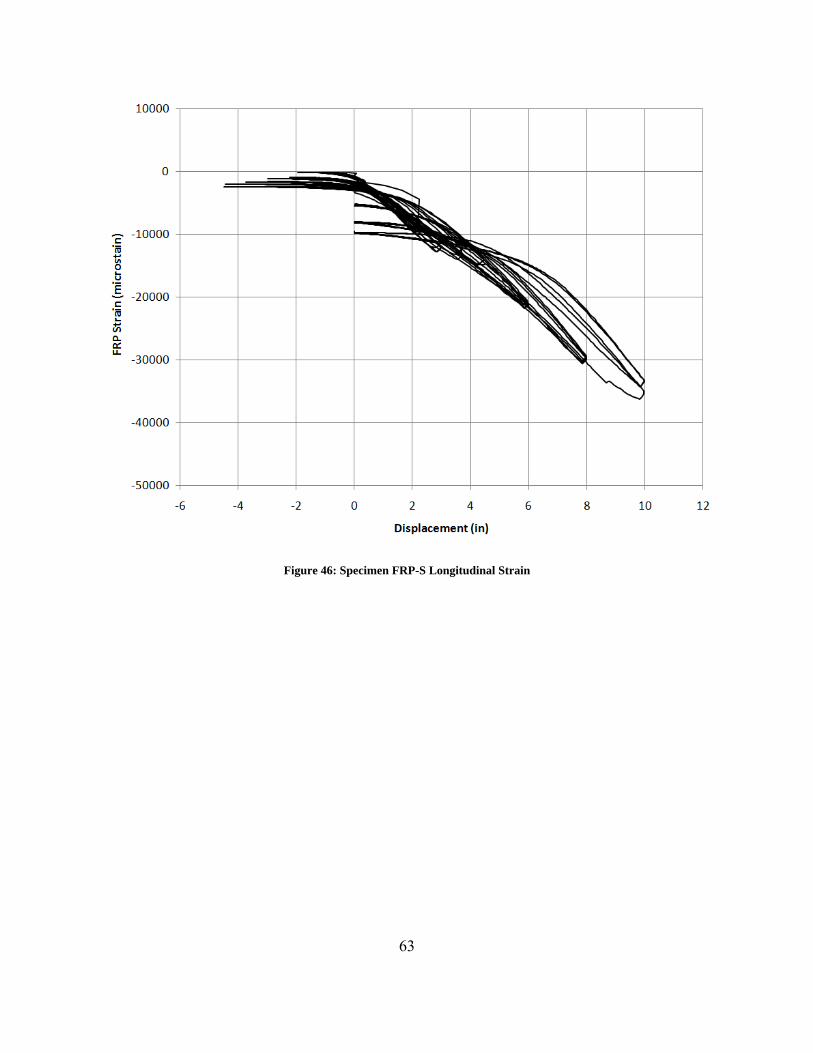
Figure 46: Specimen FRP-S Longitudinal Strain ......................................................................... 63
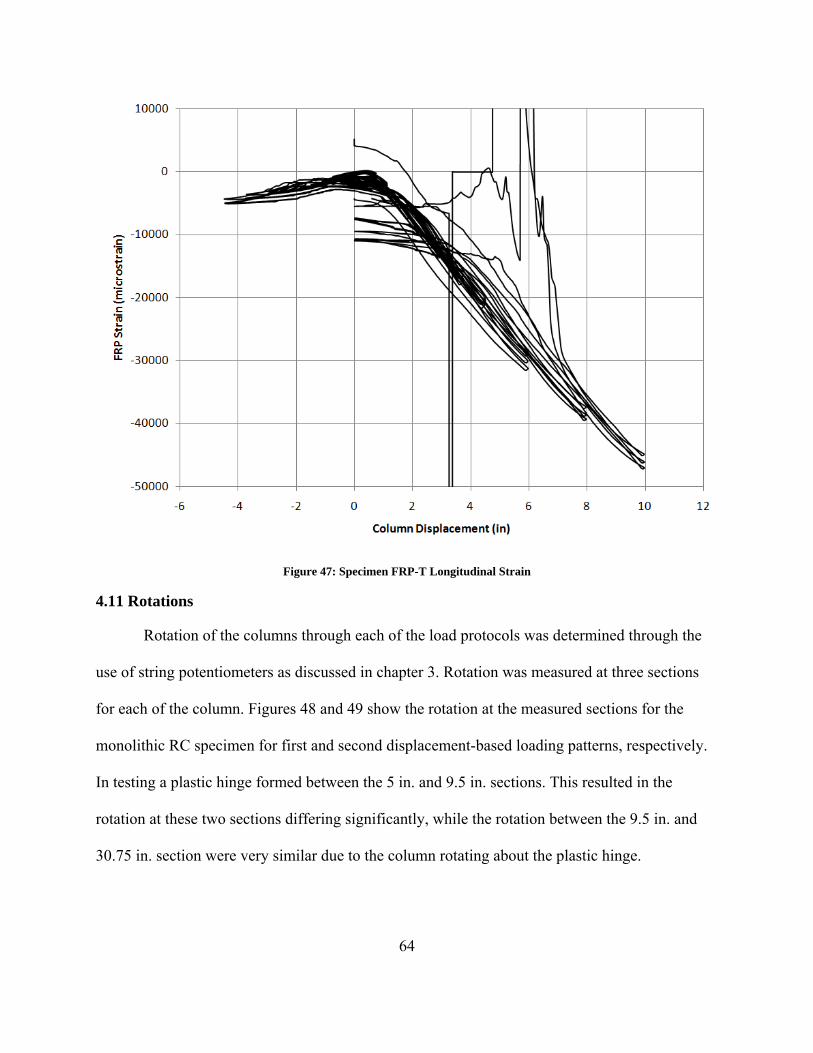
Figure 47: Specimen FRP-T Longitudinal Strain ......................................................................... 64
Figure 48: Specimen RC Section Rotation for First Load Protocol ............................................. 65
Figure 49: Specimen RC Section Rotation for Second Load Protocol ......................................... 65
Figure 50: Specimen FRP-1 Section Rotations for Second Load Protocol .................................. 66
Figure 51: Specimen FRP-S Section Rotation .............................................................................. 67
Figure 52: Specimen FRP-T Section Rotation.............................................................................. 67
Figure 53: Specimen RC Curvature .............................................................................................. 68
Figure 54: Specimen FRP-S Curvature ......................................................................................... 69
Figure 55: Specimen FRP-T Curvature ........................................................................................ 70
Figure 56: Specimen RC Load-Displacement Analysis ............................................................... 73
Figure 57: Specimen FRP-1 Load-Displacement Analysis .......................................................... 74
Figure 58: ABAQUS Model ......................................................................................................... 79
Figure 59: FEA Model FRP-1 Mises Stresses .............................................................................. 81
Figure 60: FEA Model FRP-S Mises Stresses .............................................................................. 82
Figure 61: FEA Model FRP-S Separation Distance Base and 1st segment ................................... 83
Figure 62: FEA Model FRP-S Separation Distance 1st and 2nd segments .................................... 83
Figure 63: FEA Model FRP-S Mises Stresses .............................................................................. 84
Figure 64: FEA Model FRP-S Mises Stresses .............................................................................. 85
Figure 65: FEA Model FRP-S 1st segment Mises Stresses .......................................................... 85
Figure 66: FEA Model Comparison ............................................................................................. 86
Figure 67: FEA Model Comparison ............................................................................................. 87

xv
DEDICATION
This thesis is dedicated to my parents.

1
CHAPTER 1: INTRODUCTION
1.1 Background
Large seismic events have often changed modern reinforced concrete design. Today it is
often common to carefully detail and design for a plastic hinge in areas of high moments. These
plastic hinges dissipate energy through permanent deformation and damage to the concrete
structure in carefully controlled areas. While these structures will often satisfy life-safety
requirements, these structures often require extensive repairs or complete reconstruction to be
returned to service after a major earthquake.
Prior to the 1971 San Fernando earthquake many bridges and building columns were
constructed with inadequate transverse reinforcement. Jackets made of reinforced concrete, steel,
or fiber reinforced polymers (FRP) are often used to retrofit seismically inadequate structures to
provide additional shear transverse reinforcement and additional confinement. These add
additional confinement to the core concrete, improving performance of the plastic hinge and
increase the column ductility capacity.
Utilizing post-tensioning allows for several advantages over a normal reinforced concrete
approach. Post-tensioning allows for a much quicker construction time, which can save
significant amounts of time and money while allowing for a safer and more environmentally
friendly construction. Post-tensioning also allows for a rocking mechanism to develop during a
seismic event. The entire column will rigidly rotate about the base and/or the connection with the
superstructure. After an event the post-tensioned column will re-center and undergo little
permanent deformation, if any, when compared to typical monolithic reinforced concrete
columns. Little damage occurs to the concrete itself, allowing for a system to be returned to
service after a major earthquake quickly. The disadvantage of a post-tensioned column is that it
2
does not allow for significant energy dissipation. Hence, adding external energy dissipation
devices to post-tensioned columns may represent a promising construction system.
This thesis investigates the performance of FRP composite columns in a post-tensioned
configuration. This system involving FRP tubes filled with concrete and post-tensioned together
into a column system offers several initial advantages. As a pre-cast system, construction time
and costs can be significantly reduced while taking advantage of increased quality control. FRP
reinforcement acting as the transverse reinforcement provides for high shear strength as well as a
continuous high level of confinement. Furthermore, the post tensioning system allows for the
development of a rocking mechanism during strong earthquakes which induce a large amount of
lateral displacement, reducing permanent damage to the column system during and after an
earthquake.
1.2 Research Objectives
Objectives of this research project were to evaluate the performance of the post-tensioned
FRP confined system against that of a typical monolithic reinforced concrete system. Specific
objectives for this research are as follows:
1) Evaluate the performance characteristics of segmented post-tensioned concrete-filled
fiber reinforced polymer tubes against that of a typical monolithic reinforced concrete
column.
2) Compare the performance of columns with different segment configurations and aspect
ratios.
3) Compare two methods to dissipate energy from the segmented systems that would require
either no repairs, or repairs of non-critical elements. These methods are the use of rubber
3
sheeting between segments, and sacrificial steel attached to the column which will
permanently yield with sufficiently large displacements.
4) Determine the feasibility of the segmented FRP system for use in modern construction.
CHAPTER 2: LITERATURE REVIEW
2.1 Modern Requirements
The advantages of modern composites have proven themselves in numerous industries.
Much research has been done on the uses of fiber reinforced polymers (FRP) in the construction
industry. This research has primarily focused on cyclic performance of concrete filled FRP tubes
(CFFT).
With recent major earthquakes of the past few decades building code requirements in
high seismic areas have increased drastically. A much greater requirement for shear
reinforcement as well as confinement has led to FRP being used to retrofit existing structures
(ACI 440, 2006; Seible et al, 1997). Recent research has also focused on FRP systems in new
construction.
2.2 FRP Advantage
Older columns have previously demonstrated many weaknesses in events such as the
1971 San Fernando, 1989 Loma Prieta , and 1994 Northridge earthquakes. Modern concrete
codes have overcome design deficiencies through heavily reinforced concrete elements and time
consuming construction detailing. While FRP has been successfully utilized to retrofit existing
columns, it is also a viable alternative for new construction. The advantages in an FRP jacket is

4
the shear strength provided, excellent confinement of the core concrete, and an advantage in
construction speed due to the reduction of reinforcing steel amount.
2.3 Confinement
FRP utilized as an exterior reinforcement provides for significant confinement of the core
concrete. While in a typical column the core concrete would be confined by stirrups and cross-
ties, the exterior continuous confinement of the FRP allows a greater amount of concrete to be
confined with greater effectiveness. There are several current models for predicting the stress-
strain relationship of confined concrete in both circular and non-circular cross sections (Mander
et. al, 1988; Restrepol and De Vino, 1996; Mirmiran et al, 1998; ACI 400, 2006; Campione and
Miraglia, 2003; Lam and Teng 2003).
The approach by Mander was used in this thesis to determine the stress-strain behavior of
the confined concrete. This approach determines the confined strength through determining the
effective lateral confining stress and the unconfined concrete compressive strength as in equation
1.
` ` 1.254 2.254 1 . ``
2 ``
(Equation 1)
Where
`
`
`

5
`12
1
2.4 Shear Reinforcement
The utilization of FRP as a shear reinforcement is very similar to steel as a shear
reinforcement in reinforced concrete. As with steel, the calculation of shear capacity is based on
the material strengths and size. Differing from steel are two additional factors presented by ACI
440 (2006). A degradation of the concrete contribution to the shear strength was observed before
the FRP reached ultimate stress. This degradation occurred due to losses in the aggregate
interlock mechanism. This necessitates a limiting strain of 0.4% (Seible et al, 1995) in the FRP
composite. However, research by Ozbakkaloglu and Saatcioglu (2005) showed transverse fiber
strains in excess of 1.0% before failure in columns with high axial compression. The higher
values shown by Ozbakkaloglu and Saatcioglu were only seen for circular and square columns
with well-rounded corners. Columns with sharp corners showed considerably lower maximum
strains at the time of fiber rupture.

6
2.5 Complete CFFT’s
Tests by Shao and Mirmiran (2005) utilized two differing types of FRP tubes in addition
to mild steel reinforcement. The mild steel was in both an under-reinforced and over-reinforced
configuration. The CFFT’s were tested in a three point bending configuration. The over-
reinforced CFFT sections showed lower deformations, generally linear behavior, and little
energy dissipation. Under-reinforced sections showed nonlinear elasto-plastic behavior, larger
ultimate deflections and an increase in energy dissipation.
2.6 Plastic Hinge Confinement
One of the key benefits of FRP applied to the exterior of columns is the confinement of
the plastic hinge area. This allows for a much greater ductility of the column and ultimate
capacity. In testing by Zhu et al (2006) CFFT’s showed a distinct increase in ductility over a
control RC column. While the RC column showed significant load drops during loading due to
spalling of the concrete, the CFFT columns did not show any concrete spalling or significant
sources of damage after ultimate displacements were attained. The CFFT columns also achieved
a lower permanent deflection following the ultimate displacements.
2.7 Energy Dissipation of CFFT’s
Testing by Zhu et al (2006) showed that CFFT columns with internal reinforcement did
not differ significantly in energy dissipation from a control RC column. Precast CFFT columns
with post-tensioning showed significantly less energy dissipation due to the lack of bonded
reinforcement in the section. The post-tensioned columns did exhibit favorable characteristics in
terms of residual displacements being reduced significantly.

7
2.8 Segmented Columns
In order to mitigate damage to columns during an earthquake the approach of using
segmented columns has begun to be analyzed. Mander (1997) presented a damage avoidance
design in which columns are designed to rock on their bases to prevent damage. Because of this
inherent ability the columns suffer little damage during a seismic event, but due to little energy
dissipation undergo significantly larger displacements when compared to conventional columns.
Ou et al (2006) noted that for segmented columns there are two distinct stages of the
loading. While a segmented column is subjected to a lateral load, a bending moment occurs
throughout the column. This lateral load adds a tension and compression component to opposite
sides of the column cross section, in addition to the existing compression load from axial
sources. As the lateral load increases, the compressive stress on one side of the column will
decrease, eventually reaching zero. Before the compressive force reaches zero, the column is in
the pre-decompression stage. At this point the column segments are in full contact with each
other, and the joints have not opened up.
As the lateral load increases and the tensile forces rise, the compressive stresses will drop
to zero. When this occurs, the joint between the segments will begin to open up due to the lack of
tensile resistance of the joint. This stage is the post-decompression stage. Further increases in the
lateral load will cause the gap at the joint to open wider. This gap will occur at any joint between
segments, as long as the net stress in either edge become tensile stresses. Increases in the gap
result in the increase of tensile force that will be resisted by the post-tensioning strand or any
steel reinforcement present across the joint. Any energy dissipation will be based off of

8
elongation of the tendon, impact on the compressive side, and from non-linear deformation in the
concrete.
Chou and Chen (2005) utilized a steel energy-dissipating device attached at the joint
between the lowest segment and base of the column. Prior to the energy dissipation device
failing at a 4% drift, the specimen with the device showed hysteretic energy dissipation
approximately 50% higher than the specimen without. The energy dissipation device used by
Chou and Chen failed in compression due to buckling, but would be pulled straight again in
tension when the cycle reversed to provide for energy dissipation. However, while pulled in
tension the device would not attribute energy dissipation to the column. Both energy dissipation
devices on either side of the column did fail due to the compression buckling.
Hewes and Priestley (2002) described a procedure to predict the response of precast
segmented columns undergoing a lateral loading. This method develops a moment-curvature
response of a column which is in turn used to determine the force-displacement response of the
column. The method isolates the response into three distinct phases (Figure 1). During the first
phase, the entire cross section at the bottom interface is still in compression and the
precompression provided by either a dead load or prestressing force is acting over the entire
section. As the lateral load increases, the strain profile at the interface will reach zero at one edge
and a crack will begin to form at the beginning of the second stage. This crack forms as there is
no other tensile reinforcement across the interface with the exception of the primary post-
tensioning bar. This crack will continue to expand until the area of zero strain reaches the middle
of the column and the location of the post-tensioning bar at the end of the second stage. As the
crack progresses beyond the post-tensioning bar into the third stage the post-tensioning bar will

9
be forced to elongate with the crack causing an increase in the post-tensioning force. These
stages are represented in Figure 1. If the post-tensioning bar is elongated sufficiently to cause the
stress in the post-tensioning material to go beyond yield the bar will be permanently elongated.
This can cause a reduction in post-tensioning force in the bar as the lateral load on the column is
removed.
Figure 1: Segmented Column at key stages of response (after Hewes and Priestley 2002)
10
CHAPTER 3: EXPERIMENTAL PROGRAM
3.1 Introduction
Four post-tensioned segmented concrete columns were constructed and subjected to
cyclic loading. The segments consisted of concrete filled fiber reinforced polymer tubes. One
monolithic reinforced concrete column was additionally tested as a reference to the current
design procedures and codes. This section details the specimens, construction, testing methods
and measurements.
3.2 Monolithic Column
Specimen RC was designed as a typical circular reinforced concrete column with a
diameter of 8 in. Longitudinal reinforcement in the form of six No. 3 Grade 60 bars were
provided. Shear and confining reinforcement was provided by a No. 2 Grade 40 spiral at a pitch
of four inches. These represent a longitudinal reinforcement ratio of 1.31% and a transverse
volumetric reinforcement ratio of 0.31%. Concrete cover of 0.5 in. was maintained throughout
the length of the column. A 10 in. reinforced concrete cube was placed atop the column to act as
a load stub through which the testing equipment would be attached. Vertical reinforcement from
the column was continued into the load block to provide adequate shear capacity. The column
height was 60 in. The loading pattern was applied halfway up the loading block at 5 in. giving a
total height above the top of the footing for the load application of 65 in.
3.3 FRP Columns
The four FRP specimens utilized circular fiberglass reinforced polymer tubes. The tube
acted as shear and confining reinforcement as well as a stay-in-place casting form. The FRP tube

11
had a nominal thickness of 0.125 in. and interior diameter of 8.0 in. The FRP specimens did not
posses any steel or other reinforcement in addition to the FRP tube. A 2 in. polyvinyl chloride
(PVC) duct to allow for the post-tensioning bar was placed in the center of the tube prior to
casting. All FRP tube segments were filled with concrete with the post tensioning ducts in place.
Two loading stubs were created for the FRP specimens. A 10 in. concrete cube identical
to the loading stub present at the top of the monolithic RC specimen was created with an addition
of a post-tensioning duct in the center. This loading stub was used for specimens FRP-1, FRP-S
and FRP-T. An additional loading stub with a height of only 6 inches was created to be used for
specimen FRP-R in order to account for height differences and length of the post-tensioning bar.
This loading stub would allow the FRP specimens to be easily connected to the loading
apparatus. All loading stubs were reinforced to resist shear loads applied by the testing
equipment to the specimens. This 4 in. difference in the dimensions of the stubs resulted in a
slightly lower lever arm of 63 in. for specimen FRP-R.
3.3.1 Specimen FRP-1 and FRP-S
Specimen FRP-1 consisted of a single concrete filled FRP tube 60 in. in length. As with
all FRP specimens, this specimen was placed directly on top of the foundation. The loading stub
was then being placed on top of the FRP tube. The column assembly was post-tensioned together
after being placed in the testing frame.
Specimen FRP-S utilized four 15 in. segments of concrete filled FRP tube. These
segments were stacked together with the 10 in. loading stub and post-tensioned in the same
manner as FRP-1.
12
3.3.2 Specimen FRP-R
Like specimen FRP-S, specimen FRP-R consisted of four 15 in. concrete filled FRP tube
segments stacked together with the 6 in. loading stub and the post-tensioning bar. Sheets of
rubber were placed at the interface between the footing and first segment, as well as the first and
second segments. The purpose of the rubber sheets was to provide for energy dissipation from
the hysteretic deformation of the rubber. Four 9 in. square sheets each having 0.5 in. thickness
were placed at each of these locations for a total thickness of 2 in. A central circular hole was
created in each of the sheets to allow the post-tensioning bar to pass through.
3.3.3 Specimen FRP-T
Specimen FRP-T consisted of four 15 in. concrete-filled FRP tubes and a 10 in. loading
stub in the same configuration as specimen FRP-S. Two steel angles were anchored to both the
top face of the footing and the first segment of the column in the plane of the load. Like the
rubber sheets from specimen FRP-R, the steel angles were provided as a source of energy
dissipation that would not damage the column otherwise. The steel angles were created from
0.375 in. thick stock material with a yield strength of 36 ksi. The angles were 1.25 in. in width
and had equal length legs of 8 in. Two holes were placed in each leg to allow attachment to the
footing and column segment at one inch and five inches from the end of each leg so moment
could be transmitted by both angles simultaneously. A drawing of the steel angles can be seen in
Figure 2. Attachment to the footing and column segments was provided by 0.375 in. threaded rod
and nuts anchored into the concrete with the Hilti HIT-RE 500 epoxy system.

13
Figure 2: Steel Angle
3.4 Footings
All specimens were either constructed monolithically with, or post-tensioned to, a heavily
reinforced concrete footing. The same footing dimensions and reinforcement design was utilized
for both the reference specimen and the four FRP segmented test specimens. Footings were 26
in. long, 18 in. wide and 24 in. deep. Footing reinforcement was provided through two No. 6
longitudinal bars in the bottom and four No. 5 longitudinal bars in the top, four No. 3 vertical
stirrups and four No. 3 horizontal stirrups. Two No. 3 bent bars were placed partially embedded

14
into the top of the footings to allow for easy lifting and transport by crane or forklift. With the
exception of the exposed bars for transport, a concrete cover of 0.5 in. was used.
For the monolithic RC specimen the column reinforcement was anchored into the footing
with a 90 degree hook at the level of the lower reinforcement. For FRP specimens a duct was
placed in the center of the column to allow for the post-tensioning bar to be placed through the
footing. The duct was a PVC pipe with an interior diameter of 2 in. that extended from the top to
6 inches above the bottom face of the footing. A rectangular recess between the bottom face of
the footing and the lower end of the duct was created in the concrete to allow the end anchorage
of the post-tensioning system to be placed and still allow the foundation to sit level and flush
with the floor. A drawing of the footing can be seen in Figure 3. Footings were attached to the
laboratory strong floor with two steel bars placed over the footing and anchored to the strong
floor with four bolts in total.
Figure 3: Footing

15
3.5 Specimen Summary
In total the five specimens are summarized below in Table 1.
Table 1: Specimen Summary
Name Joints Height to Load
Energy Dissipation
Longitudinal Reinforcement
Horizontal Reinforcement
Segment Height
RC Monolithic 65 in ‐ 6 No. 3 #2 spiral ‐FRP‐1 Dry 65 in ‐ PT Bar FRP Tube 60 inFRP‐S Dry 65 in ‐ PT Bar FRP Tube 15 inFRP‐R Dry 63 in Rubber PT Bar FRP Tube 15 in
FRP‐T Dry 65 in Steel Angles PT Bar FRP Tube 15 in
3.6 Material Properties
3.6.1 Concrete
Concrete for the column, FRP tubes, and loading blocks were provided by a pre-mix
operator. Testing resulted in a compressive strength of 2 ksi at the time of testing. This
compressive strength was lower than anticipated. Analytical models were completed using the
tested value of 2 ksi.
3.6.2 FRP Tube
The FRP tube was supplied by Amalga Composites. Amalga Composites clear fiberglass
tubing was selected with a diameter of 8 in. and wall thickness of 0.125 in. The tubes were
delivered in ten foot lengths which were cut to size. The manufacturing process involved
wrapping fibers around the tube at 45° in both directions. The material properties of the FRP
tubes are summarized in Table 2.

16
Table 2: FRP Tube Material Properties
Material Properties
Flexural Modulus Longitudinal 1,300,000 psi
Flexural Modulus Circumferential 3,600,000 psi
Tensile Strength Longitudinal 16,000 psi
Tensile Strength Circumferential 40,000 psi
Compressive Strength Longitudinal 27,000 psi
Compressive Strength Circumferential 37,000 psi
Shear Modulus 800,000 psi
Shear Strength 8,000 psi
Poisson’s Ratio 0.35
3.6.3 Sheet Rubber
The sheet rubber used in specimen FRP-R was provided by WARCO/Biltrite. Style 10
commercial grade neoprene was used. A rubber with a durometer hardness of 40 was selected.
Ultimate tensile strength of approximately 800 psi at 350% ultimate elongation can be achieved
with this material.
3.6.4 Post-Tensioning Bar
The post-tensioning system used was DYWIDAG bar post-tensioning. A 1.25 in.
diameter hot-rolled threaded bar in a nine foot length was used for each FRP specimen.
DYWIDAG anchor plates and nuts were used at either end for anchoring inside of the footing
recess and top of the loading block. The bars possessed an ultimate strength of 150 ksi giving

17
and ultimate load of 187.5 kips. Ultimate strain that can be reached is 5050 micro strain. In all
FRP configurations a post-tensioning force after initial losses of 30% of the ultimate capacity
was targeted at a strain of 1550 micro strain. The 30% post-tensioning was selected in an attempt
to match with the theoretical stiffness of the monolithic RC column. The post-tensioning jack
along with anchorage plate and nuts can be seen in Figure 4.
Figure 4: Post-Tensioning Jack and Anchorage

18
3.7 Testing Equipment
All columns were subjected to cyclic loading through the use of MTS 11kip hydraulic
actuator. A MTS 793 computer-based control system was used to control the displacement
response of the actuator. A 25 kip load cell was used in line with the actuator to determine load
magnitude on the column. Data acquisition was done with a second computer using a Labview
based acquisition system taking two readings per second. This system received feedback from
the MTS controller on ram position and load cell force, as well as information from independent
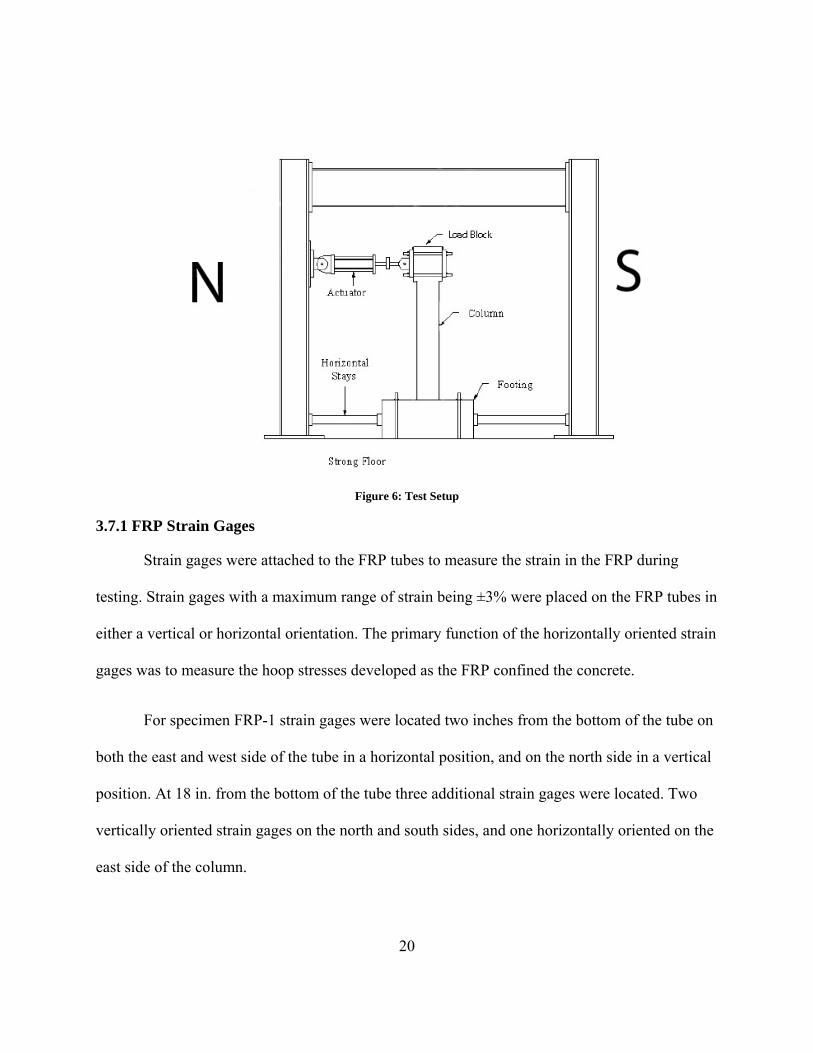
string potentiometers and strain gages. The entire test setup can be seen in Figure 5 and Figure 6.

19
Figure 5: Test Setup
SOUTH NORTH
20
Figure 6: Test Setup
3.7.1 FRP Strain Gages
Strain gages were attached to the FRP tubes to measure the strain in the FRP during
testing. Strain gages with a maximum range of strain being ±3% were placed on the FRP tubes in
either a vertical or horizontal orientation. The primary function of the horizontally oriented strain
gages was to measure the hoop stresses developed as the FRP confined the concrete.
For specimen FRP-1 strain gages were located two inches from the bottom of the tube on
both the east and west side of the tube in a horizontal position, and on the north side in a vertical
position. At 18 in. from the bottom of the tube three additional strain gages were located. Two
vertically oriented strain gages on the north and south sides, and one horizontally oriented on the
east side of the column.

21
For specimens FRP-S, FRP-R, and FRP-T strain gages were located on both the first and
second segments. For the first segment at two inches from the bottom of the segment two
oriented vertically on the north and south sides, and one horizontally on the west side. Two
inches from the top of the first segment, or thirteen inches from the bottom, there were three
additional strain gages. Again, two oriented vertically on the north and south sides with one
horizontally oriented on the west side. One the second segment two inches from the bottom was
again the same pattern with two vertical strain gages north and south, with an additional
horizontal strain gage on the west side.
3.7.2 Post-Tensioning Bar Strain Gages
Strain gages were placed on the post-tensioning bars to measure the strain in the bars
both during the post-tensioning sequence and during testing. Strain gages were placed near both
the top and bottom anchorages in areas less likely to come in direct contact with the post-
tensioning duct. Such contact and damage to the wires was a source of failure for several strain
gages throughout testing.
3.7.3 String Potentiometers
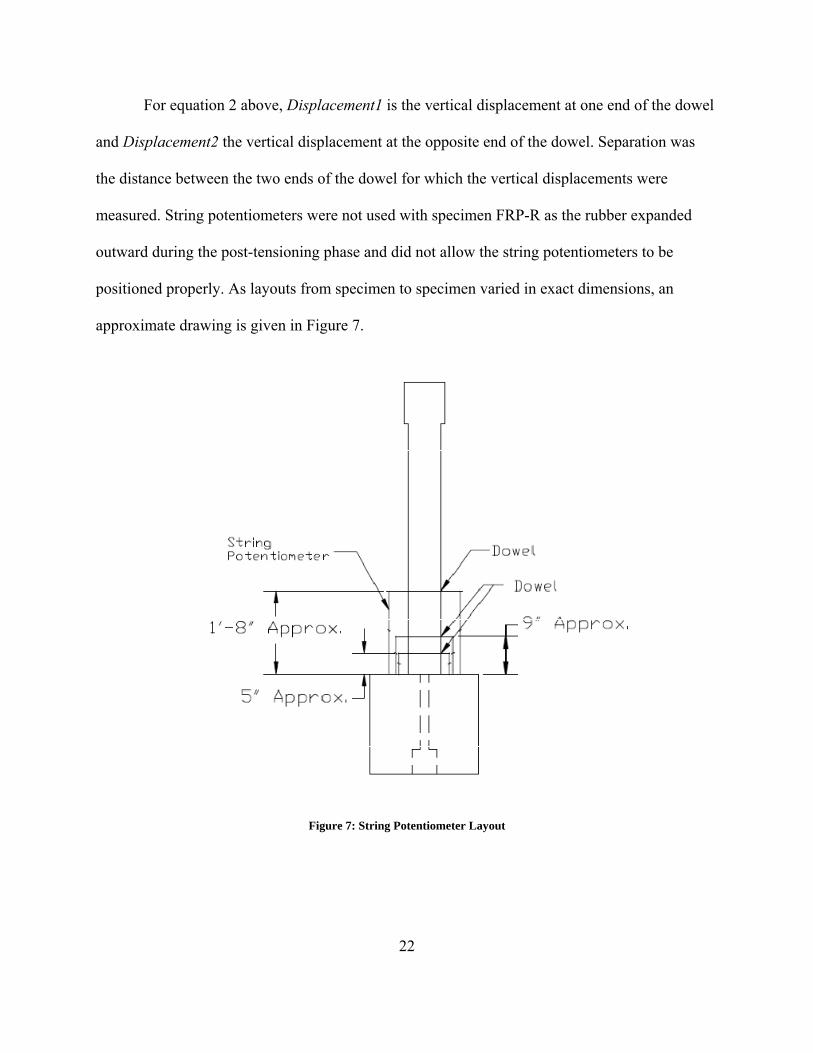
String potentiometers were placed on the top face of the footing in order to measure the
rotation of the column cross section at certain intervals. Dowels were glued to the columns at
heights of approximately 5 in., 9 in. and 21 in. String potentiometers were attached to the dowels
to measure the vertical displacement of the column at these sections. These displacements were
used to calculate the rotation at each section with Equation 2 as follows:
(Equation 2)
22
For equation 2 above, Displacement1 is the vertical displacement at one end of the dowel
and Displacement2 the vertical displacement at the opposite end of the dowel. Separation was
the distance between the two ends of the dowel for which the vertical displacements were
measured. String potentiometers were not used with specimen FRP-R as the rubber expanded
outward during the post-tensioning phase and did not allow the string potentiometers to be
positioned properly. As layouts from specimen to specimen varied in exact dimensions, an
approximate drawing is given in Figure 7.
Figure 7: String Potentiometer Layout
23
String potentiometers were also utilized to determine the average curvature at each
section measured. This was accomplished by taking the rotation as determined above and
dividing by the height about which the rotation was measured.
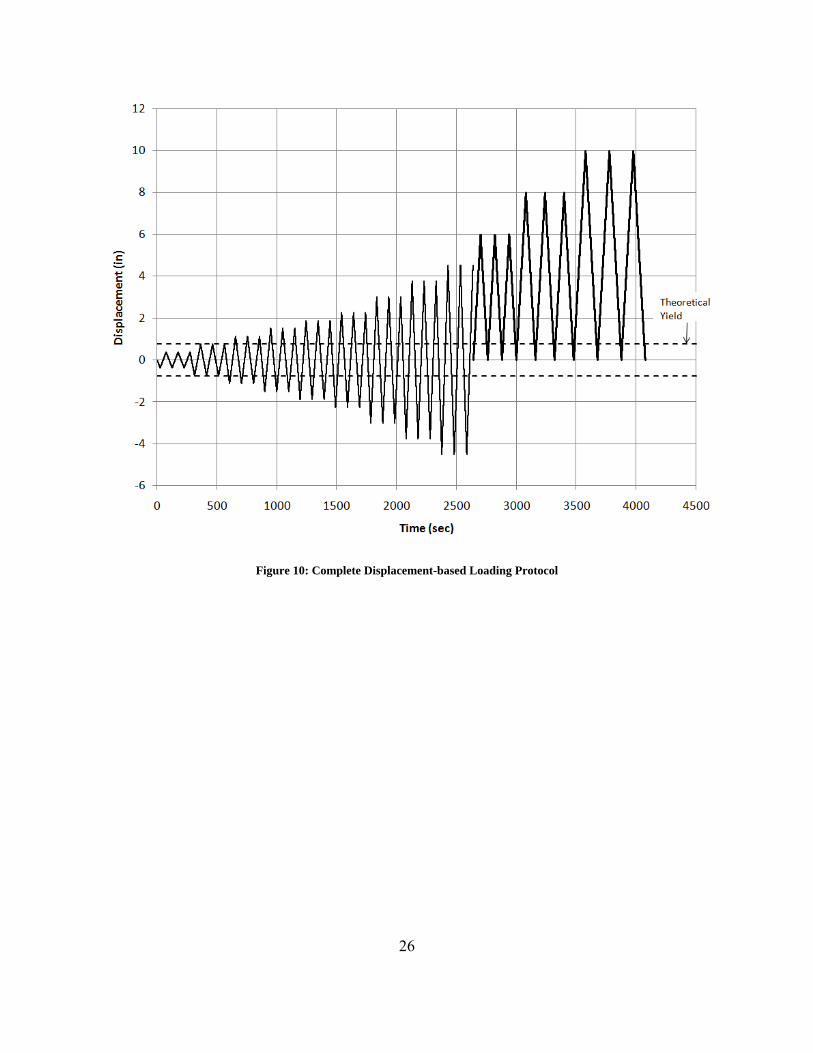
3.8 Loading Pattern
Two different cyclic loading patterns were used in testing the columns. Both patterns
were displacement controlled, with displacements based on the theoretical first yield of the
monolithic RC specimen. This first theoretical yield was obtained by a moment-curvature
analysis of the cross section in specimen RC which was determined to be approximately 0.75 in.
Displacement levels of ±0.5, ±1, ±1.5, ±2, ±2.5, ±4, ±5, and ±6 multiplied by the theoretical
yield displacement were used for the first displacement pattern. This reverse cyclic pattern
allowed for displacements up to ±4.5 inches in either direction, near the ±5 inch capacity of the
actuator. This displacement pattern is shown in Figure 8. After this first displacement pattern was
completed, the entire column assembly was moved in the load frame through the use of jacks
moving the footing after the footing was disconnected from the strong floor. The loading rate for
the initial displacement pattern varied to maintain constant time between cycles from 0.1875
in/min to 2.25 in/min.

24
Figure 8: Initial Displacement-based Load Protocol
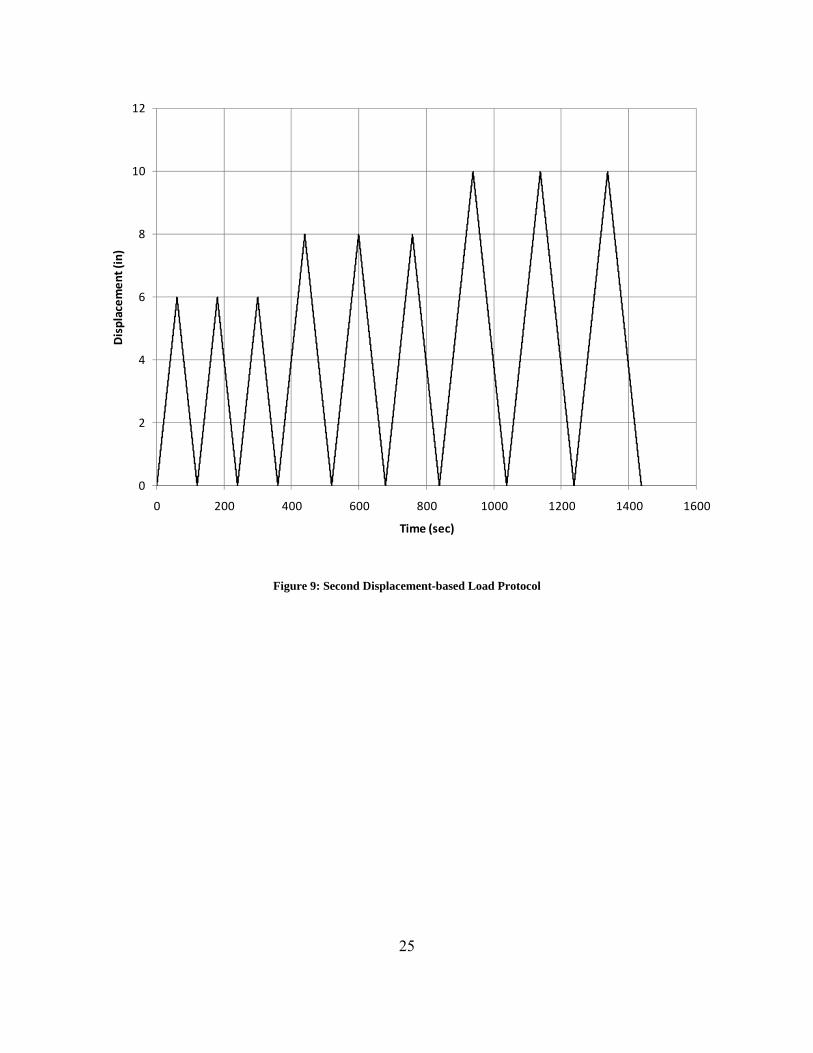
The second displacement pattern consisted of half cycles and allowed for the column to
be pulled to a certain displacement and back to the zero position (Figure 9). This displacement
pattern allowed for larger displacements to be realized by the testing system. Displacement
magnitudes followed the same method as the first displacement pattern, starting at +6 in.
followed by +8 in. and +10 in. Specimen FRP-1 was an exception to this second loading pattern
with only the +10 in. displacement set completed but not the +6 in. or +8 in. displacement sets.
The loading rate for the second displacement pattern was 0.1 in/sec. The complete load-
displacement pattern can be seen in Figure 10.
‐5
‐4
‐3
‐2
‐1
0
1
2
3
4
5
0 500 1000 1500 2000 2500 3000
Displacem
ent (in)
Time (sec)
TheoreticalYield
25
Figure 9: Second Displacement-based Load Protocol
0
2
4
6
8
10
12
0 200 400 600 800 1000 1200 1400 1600
Displacem
ent (in)
Time (sec)
26
Figure 10: Complete Displacement-based Loading Protocol

27
CHAPTER 4: RESULTS
4.1 Introduction
In this section the results of the five column tests are summarized. Information present in
this section includes load-displacement measurements, energy dissipation, equivalent viscous
damping, modes of failure, strains in the post-tensioning bar, and strains in the FRP, and rotation
of the sections.
4.2 Specimen RC
Specimen RC was constructed as a reference column. Specimen RC utilized six No. 3
bars s longitudinal reinforcement with a smooth No. 2 stirrup at a pitch of four inches.
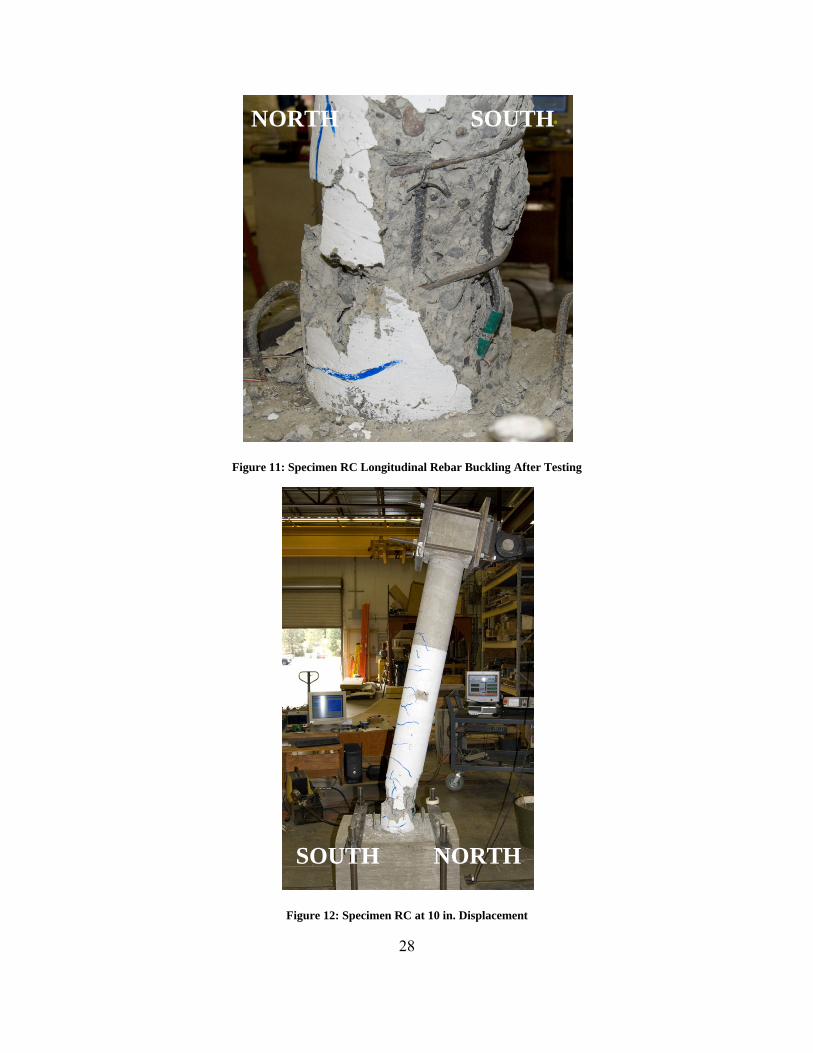
Initial cycles showed minor horizontal cracking at locations of the spiral steel
reinforcement. At the end of the third 4.5 in. cycle spalling of the cover concrete began
approximately 6 in. up from the base of the column. Following the 6 in. displacement cycle,
significant spalling exposed both the spiral steel and longitudinal steel present in the column.
Longitudinal reinforcement began to buckle during the 8 in. displacement cycle with additional
concrete spalling up to a height of 12 in. above the base of the column. Rebar buckling can be
seen in Figure 11 which was taken after testing. After the 10 in. displacement cycles, spalling
extended past 16 in. from the column base, horizontal cracking present to 40 in from the column
base, with significant buckling of the longitudinal reinforcement and permanent drift of the
column. A photograph of the column at the completion of the 10 in. displacement cycle is shown
in figure 12.
28
Figure 11: Specimen RC Longitudinal Rebar Buckling After Testing
Figure 12: Specimen RC at 10 in. Displacement
SOUTH NORTH
NORTH SOUTH

29
Load-displacement hysteresis curves for specimen RC are shown in Figure 13. No bar
ruptures or otherwise sudden failures occurred, resulting in curves with no breaks or large jumps
in the data. The result of the separate loading patterns due to actuator capacity can be seen in the
return and start points of the 6 in., 8in., and 10in. cycles. After the 1.5 in. displacement cycle the
column would possess permanent deformation. This permanent deformation can be clearly seen
in the larger displacement cycles, with the 10 in. displacement cycle having a permanent
deformation of approximately 7.5 in.
Figure 13: Specimen RC Load-Displacement Hysteresis Curves
Permanent Deformation

30
Specimen RC reached peak strength at the 6 in. displacement level. Significant loss of
concrete cover caused buckling of the primary reinforcement and slight degradation of capacity
at additional displacement cycles.
4.3 Specimen FRP-1
Specimen FRP-1 consisted of a single 60 in. long concrete-filled FRP tube. This was
post-tensioned to the column base and loading stub as described in Chapter 3. Throughout the
test no significant visual damage was apparent. The FRP tube of FRP-1 did not extend along the
entire length as a result of the casting process. This left a 0.25 in. extension of concrete extending
out of the bottom of the column segment shown clearly in Figure 15. The result of this extension
was that during testing the FRP tube did not come in contact with the base during the test
procedures. This resulted in very insubstantial damage to the FRP for this specimen.
The column as a whole developed a rocking mechanism, wherein the bottom interface
between the column and the footing would separate along the north side during a push and the
south side during a pull by the actuator. This would cause a couple to form at the interface
consisting of the post-tensioning bar in tension, and the concrete to concrete interface acting as
the compression element. An overall view of the column base during testing is shown in Figure
14 which shows the south side of the column lifting off of the base. A close-up view of the
column-base interface in which the gap is apparent and significant enough to view the post-
tensioning duct and bar is shown in Figure 15.

31
Figure 14: Specimen FRP-1 Column Base During Pull
SOUTH NORTH
32
Figure 15: Specimen FRP-1 Column Rocking Mechanism
Load-displacement hysteresis curves are shown for specimen FRP-1 in Figure 16. Note
the lack of displacement cycles for 6 in. and 8in. which is discussed in Chapter 3. The initial
displacement cycle for any displacement level would show considerably more energy dissipation
than the subsequent cycles at the same level. This is indicated well with the travel and return
cycles for the 10 in. displacement cycle. Approximately 1.0 in. of residual displacement was
present in the column after testing.

33
Figure 16: Specimen FRP-1 Load-displacement Hysteresis Curves
No significant failure of elements in specimen FRP-1 was encountered through testing.
The column as a system continued to function throughout all displacement levels.
4.4 Specimen FRP-S
Specimen FRP-S was constructed of four 15 in. FRP segments. Segments were post-
tensioned together along with the base and loading block as described in chapter 3 using the
same procedure and post-tensioning forces as specimen FRP-1. Specimen FRP-S developed a
similar rocking mechanism as specimen FRP-1. Gaps opened at two locations; the interface
between the base and first segment, and the interface between the first and second segments.
34
FRP damage occurred where the FRP tube was bearing on the concrete base during push and pull
cycles of the load pattern. The rocking mechanism and the gaps developed can be seen in Figure
17 for the gap between the base and first segment and Figure 18 for the gap between the first and
second segments. The overall column during testing can be seen in Figure 19. No substantial gap
was seen in the interface between segments two and three during the test, or at any other
interface.
Figure 17: Specimen FRP-S Rocking Gap Between Base & Segment 1

35
Figure 18: Specimen FRP-S Rocking Gap Between Segments 1 & 2
36
Figure 19: Specimen FRP-S Setup
Contact between the FRP tube of the first segment and the base occurred during the test.
This resulted in damage to the FRP tube at the location the tube was bearing on the concrete.
Minor crushing damage also occurred between segments one and two to the FRP, but this was of
a significantly lower magnitude than the crushing occurring between the base and first segment.
Damage to the FRP is shown in Figure 20. Permanent damage to the concrete in the bearing area
SOUTH NORTH

37
confined by the FRP was also sustained. This resulted in a permanent deformation in the
concrete which in turn led to the FRP crushing behavior.
Figure 20: Specimen FRP-S Damage to FRP
Load-Displacement hysteresis curves for specimen FRP-S are shown in Figure 21. It
should be noted that during the post-tensioning procedure the column developed a natural lean to
the south of approximately two inches. This was due to the top and bottom surfaces of some
segments not being parallel with each other. In order to test the specimen, the entire column was
first pulled to a zero displacement position after post-tensioning which caused initial forces to
develop. To correct for this, the data set was adjusted by two inches for the initial displacement
pattern. Specimen FRP-S showed similar behavior to specimen FRP-1.

38
Figure 21: Specimen FRP-S Load-Displacement Hysteresis Curves
No significant failure of elements in specimen FRP-S was observed during testing.
Localized crushing of the concrete and FRP at the bearing surfaces between the base and first
segment were not substantial enough to cause damage which impacted the performance.
Specimen FRP-S showed permanent deformation of approximately 4 in. which is primarily a
result of the loss in post-tensioning force.
4.5 Specimen FRP-R
Specimen FRP-R consisted of four 15 in. high segments identical to specimen FRP-S
with the addition of rubber pads placed between the base to first segment interface, and the first
to second segment interface. Four pads were used at each location for a total thickness of 2 in.
39
The added height of the rubber pads necessitated the use of a shorter loading stub than in the
other FRP specimens to account for the short length of post-tensioning bar supplied. FRP-R was
post-tensioned using the same procedure and forces as previous specimens. During the post-
tensioning procedure the rubber exhibited significant deformation and the first and second
column segments also moved out of alignment from each other. Photographs from before and
after the post tensioning sequence are shown in Figure 22 and Figure 23.
Figure 22: Specimen FRP-R Before Post-Tensioning

40
Figure 23: Specimen FRP-R After Post-Tensioning
During the test, displacement of the column was attained through rotation about the
rubber pads. The rubber pads were easily compressible which allowed for rotation about the two
interfaces equipped with the pads without opening of any concrete to concrete interfaces or
significant changes of the forces in the post-tensioning bar. Specimen FRP-R under displacement
is shown in Figure 24. Rotation at the two interfaces equipped with the rubber pads can be
clearly seen with the most rotation originating from the base to first segment interface.

41
Figure 24: Specimen FRP-R Under Displacement
The rubber pads allowed for displacement of the column under low levels of force. The
load-displacement hysteresis curves are shown in Figure 25. The specimen exhibited very little
energy dissipation at only the higher displacement, and no visible damage during testing was
observed. Some minor damage to the rubber pads was observed after testing. This damage is
SOUTH NORTH

42
suspected to have occurred during the post-tensioning sequence as the rubber expanded outward
due to the increasing post-tensioning force and the friction with the concrete. Damage observed
is also consistent with the extreme deflections seen in the rubber after post-tensioning as in
Figure 23 above.
Figure 25: Specimen FRP-R Load-Displacement Hysteresis Curves
As there was no noticeable damage to the FRP-R specimen, the only limiting factor in
this test was the capacity of the hydraulic actuator. No column failure or element failure was
encountered throughout testing.
4.6 Specimen FRP-T

43
Specimen FRP-T was identical to specimen FRP-S with the addition of two A36 steel
bent plates formed into angles attached to the base and first segment of the column. The angles
after testing with permanent deformation can be seen in Figure 26.
Figure 26: Specimen FRP-T Steel Angles After Testing
During testing the column developed similar behavior to specimen FRP-S. Gap openings
were observed between the base and first segment, as well as between the first and second
segments. In addition to the gap openings, limited deformations in the steel angles occurred. The
deformation occurred in two primary areas; at the bend in the angle, and at the location of the
first attachment to the base. The angle would open and the angle of the bend increase when the
column was pulled away from the angle, and close when pulled toward an angle. This is
NORTH SOUTH
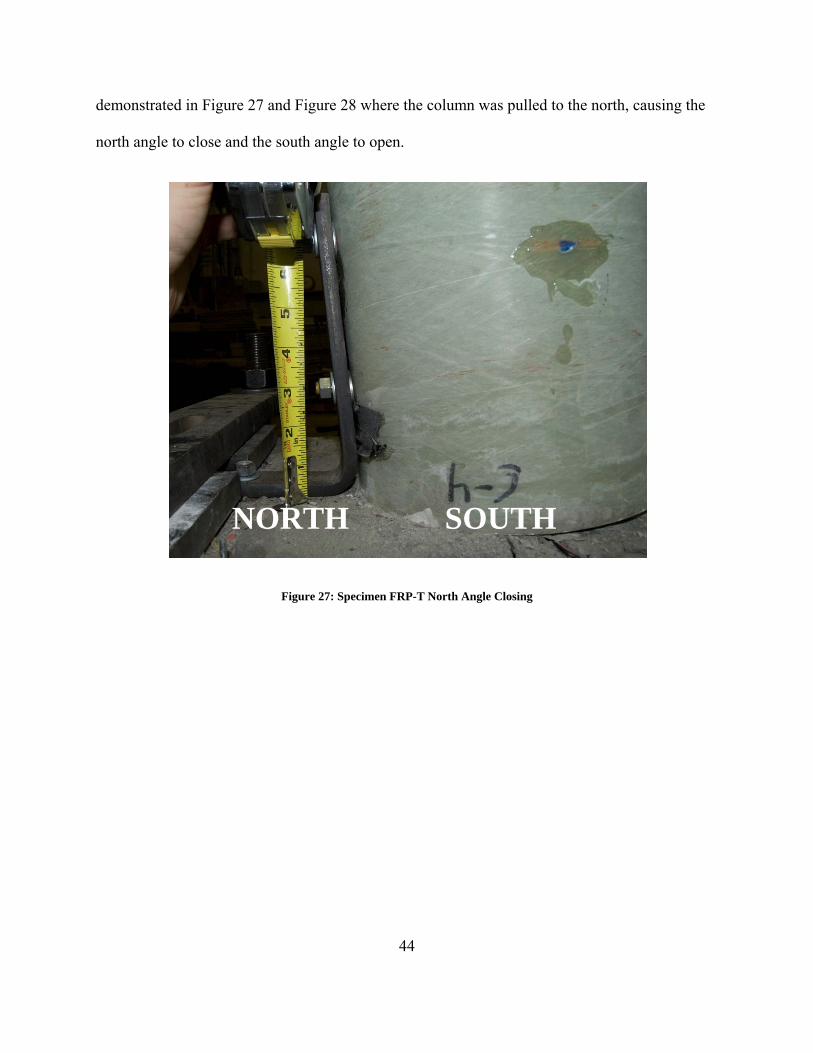
44
demonstrated in Figure 27 and Figure 28 where the column was pulled to the north, causing the
north angle to close and the south angle to open.
Figure 27: Specimen FRP-T North Angle Closing
NORTH SOUTH

45
Figure 28: Specimen FRP-T South Angle Opening
In addition, both segment gap openings observed in specimen FRP-S occurred in this
specimen as well. Opening between the first and second segments can be seen in Figure 29.
Damage to the FRP also occurred where the FRP was bearing on the base. This can be seen in
Figure 28 above.
NORTH SOUTH

46
Figure 29: Specimen FRP-T First-Second Segment Gap Opening
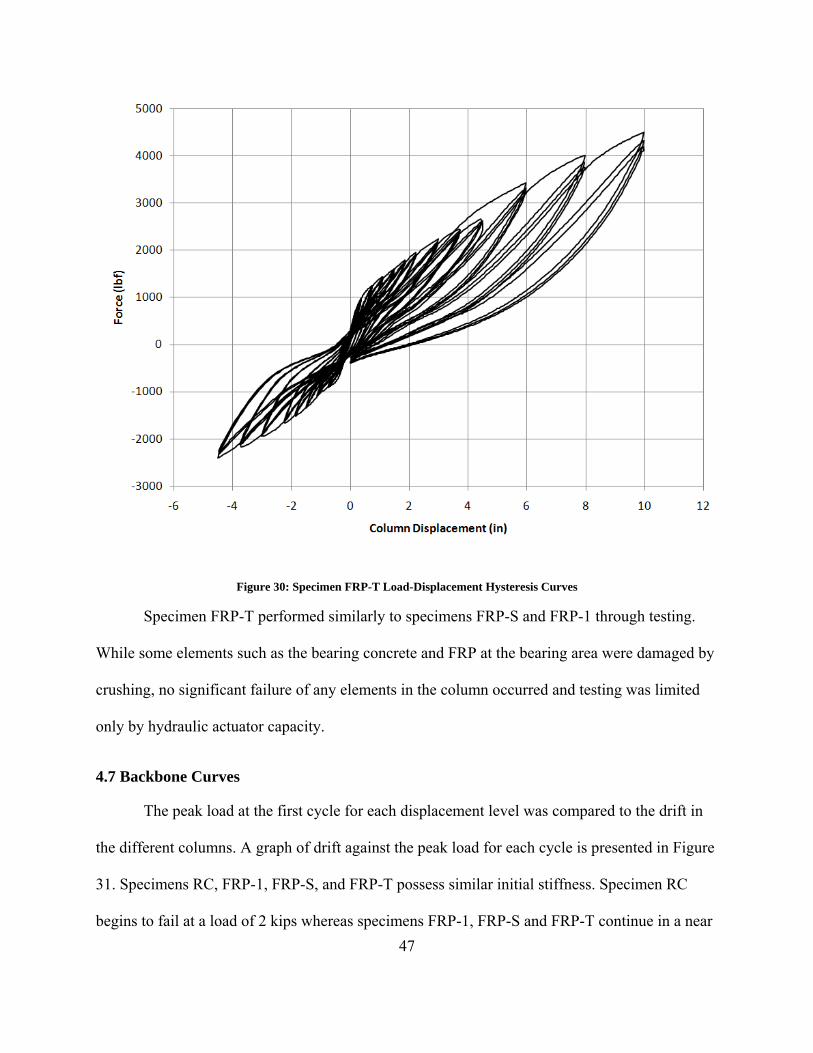
Load-displacement hysteresis curves for specimen FRP-T are shown in Figure 30. Curves
are similar to specimens FRP-1 and FRP-S. Permanent deformation of the column was
approximately 2 in.
SOUTH NORTH
47
Figure 30: Specimen FRP-T Load-Displacement Hysteresis Curves
Specimen FRP-T performed similarly to specimens FRP-S and FRP-1 through testing.
While some elements such as the bearing concrete and FRP at the bearing area were damaged by
crushing, no significant failure of any elements in the column occurred and testing was limited
only by hydraulic actuator capacity.
4.7 Backbone Curves
The peak load at the first cycle for each displacement level was compared to the drift in
the different columns. A graph of drift against the peak load for each cycle is presented in Figure
31. Specimens RC, FRP-1, FRP-S, and FRP-T possess similar initial stiffness. Specimen RC
begins to fail at a load of 2 kips whereas specimens FRP-1, FRP-S and FRP-T continue in a near

48
linear fashion. Specimen FRP-R deforms linear-elastically as the deformation was due to
compression of the rubber until a drift ratio of approximately 13%. Beyond that drift ratio there
was a significant increase in the stiffness of specimen FRP-R possibly due to stiffening of the
rubber.
Figure 31: Drift vs. Load
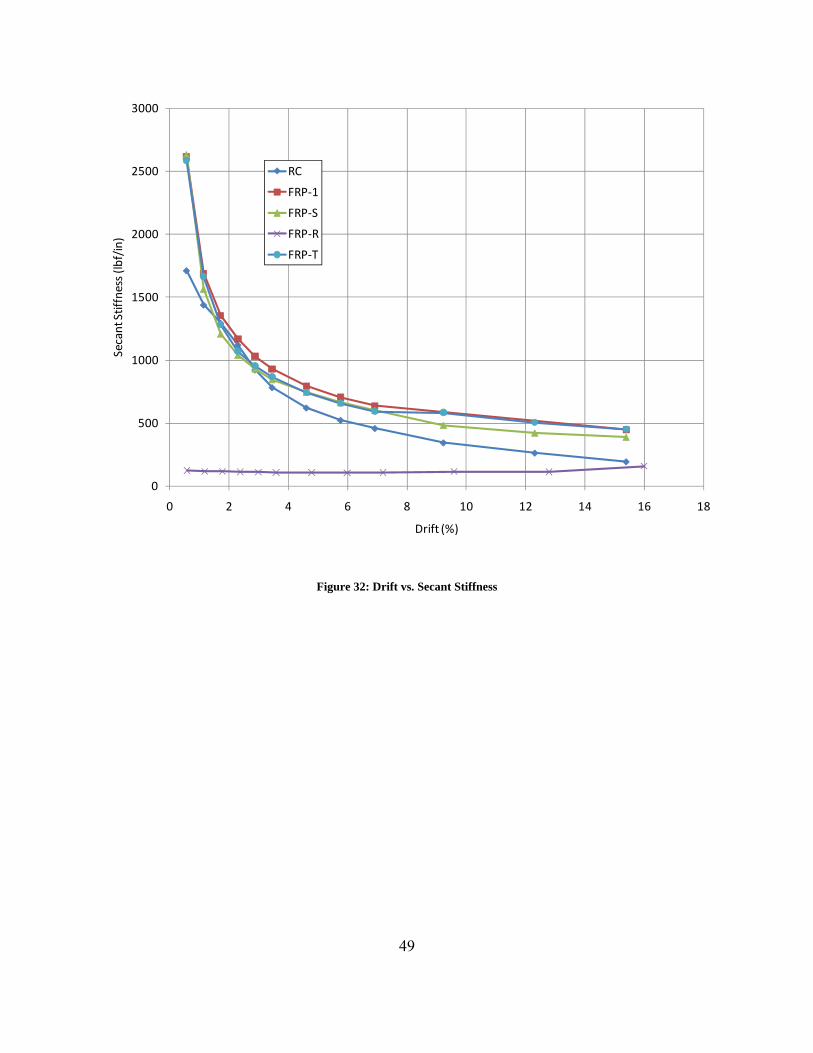
A chart showing the drift against secant stiffness is presented in Figure 32. A chart
showing the normalized secant stiffness is shown in Figure 33. This was determined by the ratio
of current secant stiffness to the secant stiffness of the first displacement level cycle.
49
Figure 32: Drift vs. Secant Stiffness
0
500
1000
1500
2000
2500
3000
0 2 4 6 8 10 12 14 16 18
Secant Stiffness (lb
f/in)
Drift (%)
RC
FRP‐1
FRP‐S
FRP‐R
FRP‐T

50
Figure 33: Normalized Secant Stiffness
4.8 Energy Dissipation
All specimens showed energy dissipation through permanent deformation of the
components. Specimen RC showed the most due to steel yielding and concrete damage resulting
in a significant permanent deformation at the end of testing. Specimen FRP-R showed the least
amount of energy dissipation, but was the least damaged at the end of testing due to the specimen
performing elastically and all deformations were due to rubber deformation.
0
0.2
0.4
0.6
0.8
1
1.2
1.4
0 2 4 6 8 10 12 14 16 18
Normalized
Stiffness
Drift (%)
RC
FRP‐1
FRP‐S
FRP‐R
FRP‐T

51
The energy dissipated during each cycle for each column was calculated by calculating
the area enclosed by the hysteresis curves. The cumulative energy for all columns is presented
against drift in Figure 34.
Figure 34: Drift vs. Cumulative Energy
Specimen RC dissipated the most energy, but suffered significant damage and permanent
deformation. Specimens FRP-1, FRP-S, and FRP-T dissipated moderate amounts of energy and
suffered little damage. Specimen FRP-R dissipated little energy, but suffered no observable
damage during testing. The amount of energy dissipated in each cycle of the loading patterns
depended on two factors; the displacement level, and which cycle for the given displacement
level whether it be the first, second, or third. As most FRP specimens saw a significant drop in

52
the energy dissipated at subsequent cycles after the first cycle for a given displacement, the
energy dissipated in the first cycle for each displacement level is presented in Figure 35. It
should be noted that the higher energy levels for specimen FRP-1 are primarily a result of the
lack of intermediate displacement levels as discussed in chapter 3.
Figure 35: Drift vs. Energy in First Cycle
The equivalent viscous damping is shown in Figure 36. This was calculated by equation
3.
∆ (Equation 3)
Where Ah represents the area under one load-displacement hysteresis loop, Vm is the peak
force, and Δm is the peak displacement during the specific cycle. A higher amount of viscous
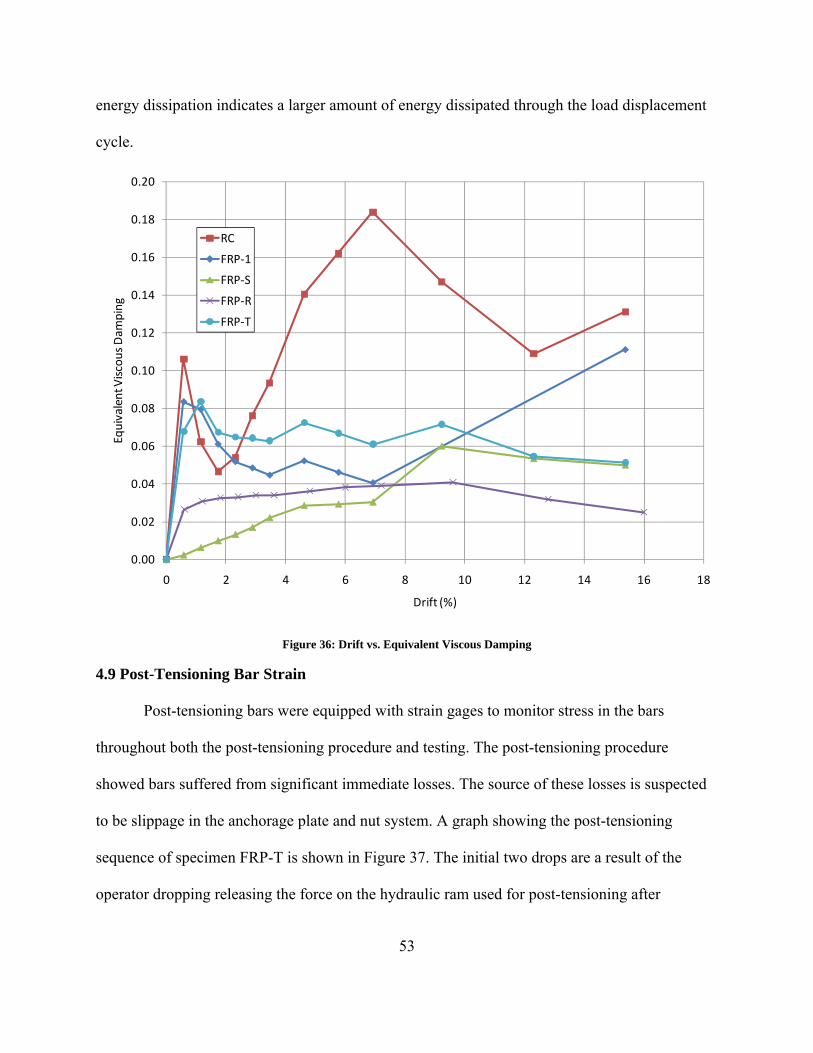
53
energy dissipation indicates a larger amount of energy dissipated through the load displacement
cycle.
Figure 36: Drift vs. Equivalent Viscous Damping
4.9 Post-Tensioning Bar Strain
Post-tensioning bars were equipped with strain gages to monitor stress in the bars
throughout both the post-tensioning procedure and testing. The post-tensioning procedure
showed bars suffered from significant immediate losses. The source of these losses is suspected
to be slippage in the anchorage plate and nut system. A graph showing the post-tensioning
sequence of specimen FRP-T is shown in Figure 37. The initial two drops are a result of the
operator dropping releasing the force on the hydraulic ram used for post-tensioning after
0.00
0.02
0.04
0.06
0.08
0.10
0.12
0.14
0.16
0.18
0.20
0 2 4 6 8 10 12 14 16 18
Equivalent Viscous Dam
ping
Drift (%)
RC
FRP‐1
FRP‐S
FRP‐R
FRP‐T

54
tightening the nut onto the anchorage plate. For the first two releases, the initial losses were great
and caused the post-tensioning strain to drop below the target value of 1550 micro strain. The
third attempt was successful for this specimen in attaining an appropriate amount of post-
tensioning force. Initial losses in the release of the hydraulic ram after tightening the top nut to
anchor plate were near 50%.
Figure 37: Post-tensioning Sequence
During of the FRP-1, FRP-S, and FRP-T specimens significant gaps opened between the
interfaces between base and first segment, and segments themselves. This led to an elongation in
the post-tensioning bar which in turn led to a higher strain and force in the bar. With a maximum
capacity of 187.5 kips the post-tensioning forces achieved in specimen FRP-T were
approximately 65% of capacity, a significant increase from the 30% initial post-tensioning force.
After the peak displacement for a cycle and return back to origin, the strain in the post-tensioning
bar reduced. This reduction was due to permanent elongation in the post-tensioning bar. As the

55
bar elongated it was subjected to higher levels of stress and strain until it exceeded the elastic
limit. After exceeding the elastic limit for the steel the post-tensioning bar began to behave
plastically, and as the bar was unloaded by the load-displacement cycle reversing there was
permanent elongation present in the bar. Subsequent cycles at the same displacement level would
lead to additional reduction in the steel strain, but to a lesser magnitude. This is demonstrated in
Figure 38 for specimen FRP-T and Figure 39 for specimen FRP-S. After testing was completed,
the final strain and therefore post-tensioning force reduced by a significant amount.
Figure 38: Specimen FRP-T Displacement vs. Steel Strain
0
20000
40000
60000
80000
100000
120000
0
500
1000
1500
2000
2500
3000
3500
4000
4500
‐6 ‐4 ‐2 0 2 4 6 8 10 12
Stee
l Force (lbf)
Stee
l Strain (m
icrostrain)
Column Displacement (in)

56
Figure 39: Specimen FRP-S Displacement vs. Steel Strain
Specimen FRP-R showed little change in post-tensioning force when compared to the
other FRP specimens. This is a result of the addition of the rubber, which deflected and caused
the rotation instead of a gap opening. Because of the rubber deflecting, the post-tensioning bar
underwent little elongation and therefore little change in strain. The post-tensioning bar strain is
plotted against displacement in Figure 40. Little permanent loss in the post-tensioning force
occurred for this specimen.
0
20000
40000
60000
80000
100000
120000
0
500
1000
1500
2000
2500
3000
3500
4000
4500
‐6 ‐4 ‐2 0 2 4 6 8 10 12
Stee
l Force (lbf)
Stee
l Strain (m
icrostain)
Column Displacement (in)

57
Figure 40: Specimen FRP-R Displacement vs. Steel Strain
4.10 FRP Strain
Strain in the FRP was measured on the external surface of the FPR at several points
throughout testing. Strains measured were both longitudinal and circumferential. Circumferential
strains for Specimens FRP-1, FRP-S, FRP-R, and FRP-T are shown in Figures 41, 42, 43, and 44
respectively. This circumferential strain was measured at a point two inches above the bottom of
the column. Specimen FRP-R did not see significant increase in the post-tensioning force as the
remainder of the FRP specimens did. This caused the circumferential strain to remain relatively
constant throughout the test, much like the strain in the post-tensioning bar for specimen FRP-R.
The circumferential strain increases throughout testing and does not return to the original amount
after each cycle. This is possibly due to microcracking of the concrete confined within the FRP
tubes.

58
Figure 41: Specimen FRP-1 Circumferential Strain
‐1000
1000
3000
5000
7000
9000
11000
13000
‐6 ‐4 ‐2 0 2 4 6 8 10 12
FRP Strain (m
icrostrain)
Column Displacement (in)
59
Figure 42: Specimen FRP-S Circumferential Strain
‐1000
0
1000
2000
3000
4000
5000
6000
‐6 ‐4 ‐2 0 2 4 6 8 10 12
FRP Strain (m
icrostrain)
Column Displacement (in)

60
Figure 43: Specimen FRP-R Circumferential Strain
‐1000
0
1000
2000
3000
4000
5000
6000
‐6 ‐4 ‐2 0 2 4 6 8 10 12
FRP Strain (m
icrostrain)
Column Displacement (in)
61
Figure 44: Specimen FRP-T Circumferential Strain
The longitudinal strain was also measured through the testing. The longitudinal strain
measured two inches from the bottom of the column on the north (pull) side of specimens FRP-1,
FRP-S, and FRP-T are shown in Figures 45, 46, and 47 respectively. It should be noted that
specimen FRP-T had intermittent failure of the strain gage leading to discontinuities in the data.
The negative strain values indicate a compression stress on the material. This is consistent with
the rocking mechanism that developed, as the column rocked up on the edge a stress
concentration would occur due to the FRP and concrete directly bearing on the foundation.

62
Figure 45: Specimen FRP-1 Longitudinal Strain
63
Figure 46: Specimen FRP-S Longitudinal Strain
64
Figure 47: Specimen FRP-T Longitudinal Strain
4.11 Rotations
Rotation of the columns through each of the load protocols was determined through the
use of string potentiometers as discussed in chapter 3. Rotation was measured at three sections
for each of the column. Figures 48 and 49 show the rotation at the measured sections for the
monolithic RC specimen for first and second displacement-based loading patterns, respectively.
In testing a plastic hinge formed between the 5 in. and 9.5 in. sections. This resulted in the
rotation at these two sections differing significantly, while the rotation between the 9.5 in. and
30.75 in. section were very similar due to the column rotating about the plastic hinge.

65
Figure 48: Specimen RC Section Rotation for First Load Protocol
Figure 49: Specimen RC Section Rotation for Second Load Protocol
‐0.1
‐0.05
0
0.05
0.1
0.15
0.2
0 200 400 600 800 1000 1200 1400
Rotation (radians)
Time (sec)
30.75 in.
9.5 in.
5 in.
‐0.1
‐0.05
0
0.05
0.1
0.15
0.2
0 200 400 600 800 1000 1200 1400
Rotation (radians)
Time (sec)
30.75 in.
9.5 in.
5 in.
66
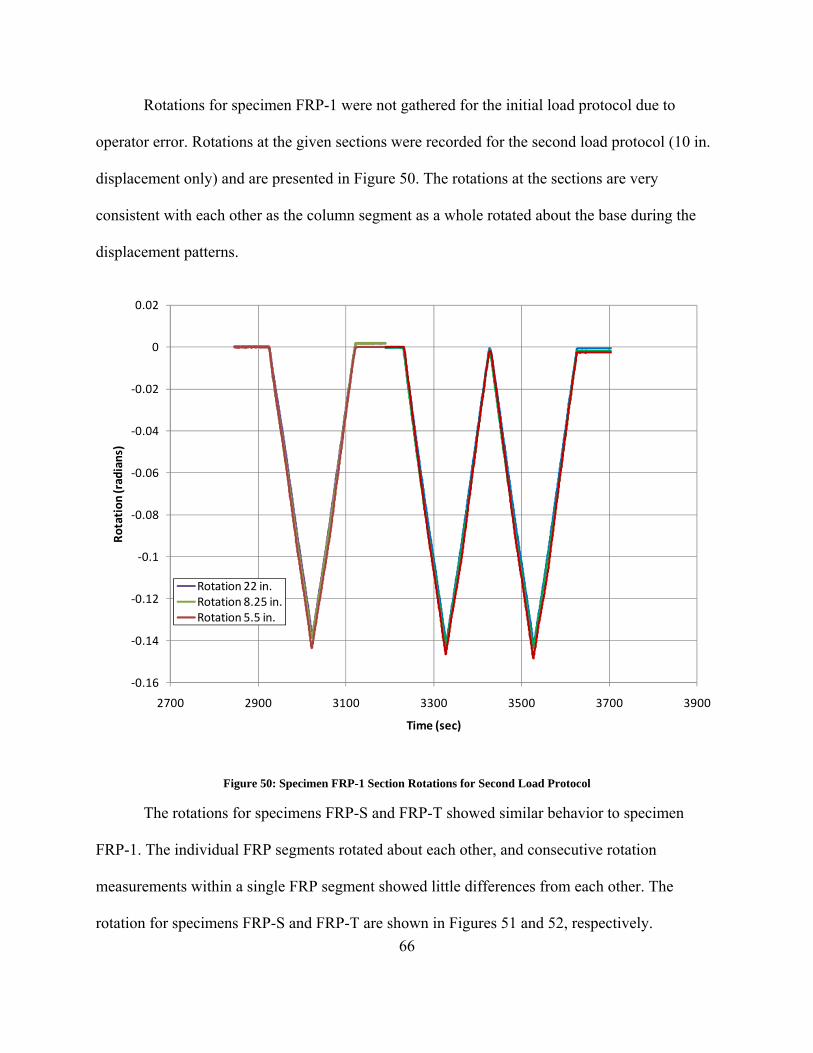
Rotations for specimen FRP-1 were not gathered for the initial load protocol due to
operator error. Rotations at the given sections were recorded for the second load protocol (10 in.
displacement only) and are presented in Figure 50. The rotations at the sections are very
consistent with each other as the column segment as a whole rotated about the base during the
displacement patterns.
Figure 50: Specimen FRP-1 Section Rotations for Second Load Protocol
The rotations for specimens FRP-S and FRP-T showed similar behavior to specimen
FRP-1. The individual FRP segments rotated about each other, and consecutive rotation
measurements within a single FRP segment showed little differences from each other. The
rotation for specimens FRP-S and FRP-T are shown in Figures 51 and 52, respectively.
‐0.16
‐0.14
‐0.12
‐0.1
‐0.08
‐0.06
‐0.04
‐0.02
0
0.02
2700 2900 3100 3300 3500 3700 3900
Rotation (radians)
Time (sec)
Rotation 22 in.Rotation 8.25 in.Rotation 5.5 in.

67
Figure 51: Specimen FRP-S Section Rotation
Figure 52: Specimen FRP-T Section Rotation
‐0.2
‐0.15
‐0.1
‐0.05
0
0.05
0.1
1000 1500 2000 2500 3000 3500 4000 4500 5000 5500 6000
Rotation
(radians)
Time (sec)
Rotation 21.75 in.Rotation 8.5 in.Rotation 5.25 in.
‐0.2
‐0.15
‐0.1
‐0.05
0
0.05
0.1
0 500 1000 1500 2000 2500 3000 3500 4000 4500
Rotation (radians)
Time (sec)
Segment Two 21.75 in.Segment One 8.5 in.Segment One 5.5 in.
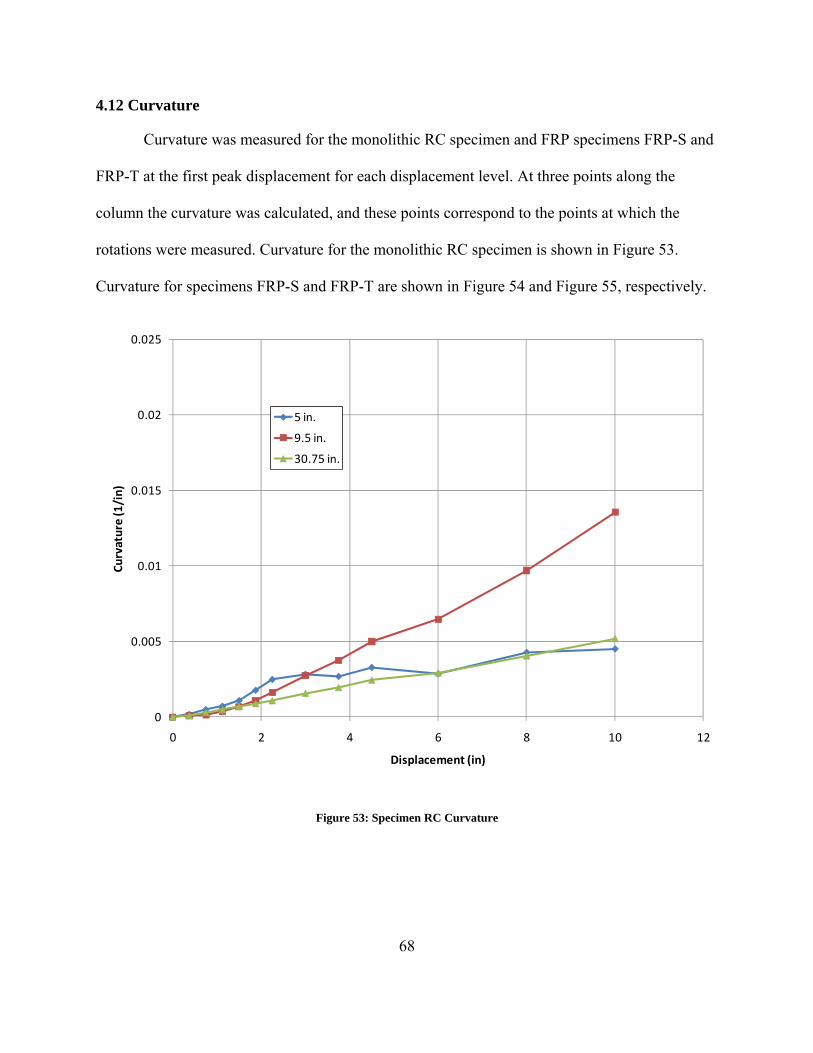
68
4.12 Curvature
Curvature was measured for the monolithic RC specimen and FRP specimens FRP-S and
FRP-T at the first peak displacement for each displacement level. At three points along the
column the curvature was calculated, and these points correspond to the points at which the
rotations were measured. Curvature for the monolithic RC specimen is shown in Figure 53.
Curvature for specimens FRP-S and FRP-T are shown in Figure 54 and Figure 55, respectively.
Figure 53: Specimen RC Curvature
0
0.005
0.01
0.015
0.02
0.025
0 2 4 6 8 10 12
Curvature (1/in)
Displacement (in)
5 in.
9.5 in.
30.75 in.

69
Figure 54: Specimen FRP-S Curvature
0
0.005
0.01
0.015
0.02
0.025
0 2 4 6 8 10 12
Curvature (1/in)
Displacement (in)
5.25 in.
8.5 in.
21.75 in.
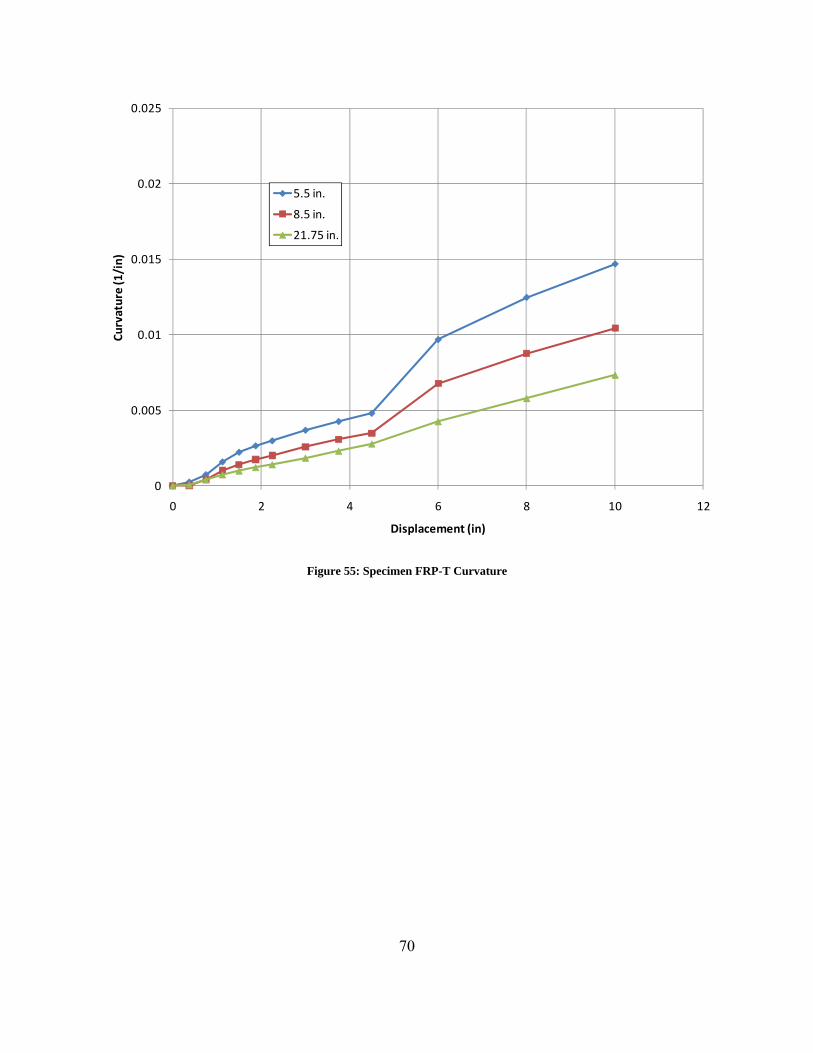
70
Figure 55: Specimen FRP-T Curvature
0
0.005
0.01
0.015
0.02
0.025
0 2 4 6 8 10 12
Curvature (1/in)
Displacement (in)
5.5 in.
8.5 in.
21.75 in.

71
CHAPTER 5: ANALYSIS OF TEST RESULTS
5.1 Moment Curvature Analysis
This chapter evaluates the performance of the test specimens against simplified
theoretical performance models. An XTRACT moment-curvature analysis was utilized for the
monolithic RC specimen. Theoretical load-displacement performance of the FRP specimens was
completed using the procedure outlined by Hewes and Priestley (2002).
5.2 Monolithic RC Performance
XTRACT was used to determine the curvature and moment at the points of initial yield
and ultimate capacity of the cross section. Data input into the program was all relevant as-built
dimensions and material properties. These values for moment and curvature were used to
calculate the load-displacement predicted performance of specimen RC. The results of this
analysis along with the actual test results can be seen in Figure 56. The monolithic RC specimen
shows similar initial stiffness up to the point of first yield. In the plastic region the column
exhibits significantly larger ductility than predicted.
To determine the force-displacement characteristics several key pieces of information
were taken from the XTRACT analysis. The XTRACT analysis can be seen in Appendix A. Φy
was taken as the curvature at yield, and Φn as the ultimate curvature. Moments at yield and at the
ultimate moment were also taken and divided by the height of the column of 65 in. to obtain
lateral forces at yield and at ultimate capacity to match with the displacements. The displacement
at yield Δy was calculated by simple elastic beam theory from the effective EI value given by the
XTRACT analysis. In order to predict the displacement Δult at the ultimate capacity the rotation
about the plastic hinge is determined. This is completed with the following equations where L is

72
the column length, db the longitudinal bar diameter, fy the longitudinal steel yield stress, lp the
plastic hinge length, and Δp the plastic displacement.
∆ (Equation 4)
0.08 0.15 (Equation 5)
∆ Φ Φ 0.5 (Equation 6)
∆ ∆ ∆ (Equation 7)

73
Figure 56: Specimen RC Load-Displacement Analysis
5.3 FRP Specimen Performance
The predicted load-displacement performance of the FRP specimens was done using the
procedure developed by Hewes and Priestley (2002). A moment-curvature analysis of the
segmented system was first completed. This moment curvature analysis was used to calculate the
load-displacement performance at three key stages by the method developed by Hewes and
Priestley; loss of pre-compression, rigid rotation with no increase in tendon force, and rigid
rotation with increase in tension force leading to ultimate capacity. The results of this simple
analysis are presented along with the actual response of specimen FRP-1 in Figure 57. This
0
500
1000
1500
2000
2500
0 2 4 6 8 10 12
Force (lbf)
Displacement (in)
Predicted
Actual

74
analysis only predicted the response for a specimen consisting of only one segment interface at
the bottom of the column.
Figure 57: Specimen FRP-1 Load-Displacement Analysis
5.4 Interpretation of Analysis
Key difference can be noted in both of the analyses. Both columns displayed greater
ductility than predicted. This can be attributed to inaccuracies in the models for predicting the
performance near failure. The moment-curvature analysis performed for the FRP specimens is
highly subject to user input for determining the performance near the point of failure.
0
1000
2000
3000
4000
5000
6000
0 2 4 6 8 10 12
Force (lbf)
Displacement (in)
Predicted
Actual

75
Both of the analyses did not account for the cyclic nature of the test and the relevant
interim damage to the specimens. For the monolithic RC specimen, the cyclic characteristics of
the test caused some stiffness degradation prior to the initial yielding. In the FRP specimen, the
cyclic test procedure caused loss of post-tension force in the system for subsequent cycles. This
loss in post-tensioning caused the force-displacement response to become less stiff after each
cycle where loss in post-tensioning occurred, making the force required for a given displacement
less, and reducing some of the overall damage to the column. Specimen FRP-S lost 80% of the
initial post-tensioning force once the entire test procedure was completed and the column
returned to a zero displacement condition. Taking into account of this loss in post-tensioning and
the cyclic nature of the test could result in a more accurate analysis for future work.

76
CHAPTER 6: FINITE ELEMENT ANALYSIS
6.1 Introduction
A finite element analysis using ABAQUS/Standard was performed in order to predict the
performance of specimens FRP-1 and FRP-S. Specimens FRP-1 and FRP-S were compared to
the force-displacement analysis method discussed in Chapter 5 and with testing results.
6.2 Model Setup
Specimen FRP-1 was modeled as a circular column 66 in. in height and 8 in. in diameter
This model consisted of four separate part instances. The concrete portion consisted of two
different material models. For the 60 in. of the column representing the actual column, an elastic-
plastic concrete was defined using Mander’s confined concrete model (Mander, 1988) discussed
in Chapter 2. For purposes of loading the column and post-tensioning a loading stub was created
by extending circular portion of the column by 6 in. out the top. This load stub had an elastic
material definition similar to that of steel (E=29000ksi). This would allow the forces from
embedding the post-tensioning wire to be distributed without causing premature failure in the
model. The column was meshed with a 0.5 in element size and using C3D8R elements which are
three-dimensional brick elements consisting of 8 nodes with reduced integration. Material
properties are included in the portion of the input file found in Appendix B.
An elastic material model was used in defining the FRP tube around the concrete. This
tube extended 60 in. high for the FRP-1 model to match the single segment column. The FRP
was also modeled with C3D8R elements with a 0.5 in. element size and a thickness of 0.25 in.
The foundation was modeled with C3D8R elements on which the column sat, with an analytical
rigid material definition. This ensured that failure in the base material would not dictate model
performance.

77
To post-tension the column system together and to the base, the post-tensioning bar was
modeled as a T3D2 three dimensional two node truss model with elements 1 in. long. The bar
was given an elastic-plastic material definition in line with the specification for 150ksi post-
tensioning bars.
The interactions between differing elements in this model were assumed to play a large
role in the performance. Interactions between the FRP and column, column and base, and FRP
and base were all defined with interaction properties. These interactions composed of tangential
friction and a hard contact for interaction normal to the surface. As the interior surface of the
FRP was very smooth, a friction coefficient of 0.1 was assigned to any FRP-concrete interface.
Concrete-concrete interfaces were given a friction coefficient of 0.5. For interface properties
normal to the surface an augmented Lagrange hard contact formulation was adopted to allow for
the materials to separate from each other in tension but not penetrate through each other in
compression. Interaction properties can be found in the portion of the ABAQUS input file found
in Appendix B.
In order to simulate the post-tensioning, the bar with the truss model formulation was
embedded at the ends into both the base and the 6 in. loading stub on the top of the column to
model the anchorages. The embedment was carried out in materials that behaved solely
elastically so as to not prematurely fail the model. To simulate the post-tensioning force an initial
stressed state was placed on the model in the second step of the model at a level of 45 ksi which
equals a 30% post-tension. Post-tensioning and embedment properties can also be found in the
portion of the ABAQUS input file found in Appendix B.

78
The ABAQUS model consisted of three steps. The first step initialized the model, and
developed contact. The second step applied a post-tensioning by an initial stress state on the truss
elements modeling the post-tensioning bar. The third step was the main analysis which applied
the monotonic lateral load on the model.
The load on the model was applied as a surface traction on the top of the column. This
was spread over the top of the 6 in. load stub to eliminate any localized forces which could
impair the model. Loading consisted of a monotonic push in a single direction until model
failure. This load was increment in ABAQUS until the column failed. In all tests the applied load
was not reach as it was an objective of the analysis to determine the maximum applied force.
Boundary conditions consisted of fixing the foundation in all directions for both post-tensioning
and loading steps, and fixing the top of the 6 in. extension on the column during the post-
tensioning step only. Displacement of the column was measured at a node at the top of the 6 in.
extension during the analysis. The location of the load and boundary conditions of the base can
be seen in Figure 58.
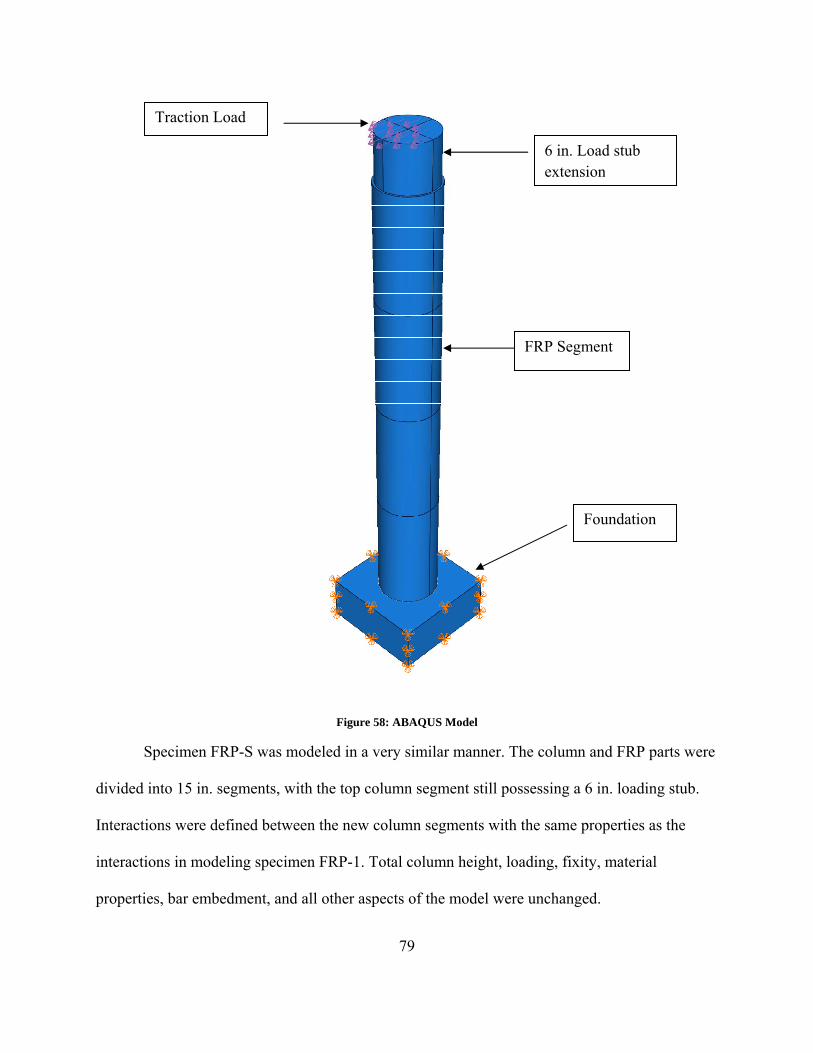
79
Figure 58: ABAQUS Model
Specimen FRP-S was modeled in a very similar manner. The column and FRP parts were
divided into 15 in. segments, with the top column segment still possessing a 6 in. loading stub.
Interactions were defined between the new column segments with the same properties as the
interactions in modeling specimen FRP-1. Total column height, loading, fixity, material
properties, bar embedment, and all other aspects of the model were unchanged.
6 in. Load stub extension
Traction Load
FRP Segment
Foundation

80
6.3 Model Results
Upon completion of the analysis it was shown that the column developed a pronounced
rocking mechanism as suspected. This rocking mechanism developed is the same observed
during testing of the specimens. Stress concentrations existed in portions of the concrete in direct
compression with the base or other segments. The FRP tube slipped against the column concrete
causing the FRP tube to move upwards in relation to the column. The Mises stresses and rocking
mechanism can be seen in Figure 59. The countour scale is from 0 to 17,390 psi which is the
maximum confined compressive strength of the concrete. The stress concentrations in the 6 in.
loading stub are a result of the post-tensioning bar embedment. These stress concentrations are
not present in the base as an analytical rigid formulation was used.

81
Figure 59: FEA Model FRP-1 Mises Stresses
Figure 60 shows the model for specimen FRP-S at the failure load. The rocking
mechanism developed at two interfaces. Stress concentrations are similar to those seen in the
model for specimen FRP-1. Like the rocking mechanism in the model for specimen FRP-1, the
model for FRP-S showed the same rocking mechanism that was observed in testing.

82
Figure 60: FEA Model FRP-S Mises Stresses
Figure 61 shows the distance of separation between the base and first segment, and
Figure 62 shows the distance of separation between the first and second segments. This can also
be thought of as the gap opening between the segments at the maximum load. Portions in black
at the top (positive Z direction) of the images are those in contact, while the remainder of the
scale goes to a 0.25 in. separation. These gap openings are less in magnitude than those observed
during testing, but the distribution is in line with that observed during testing. The areas in
contact are the sources of the concentrations in compressive stresses present in the concrete
sections.
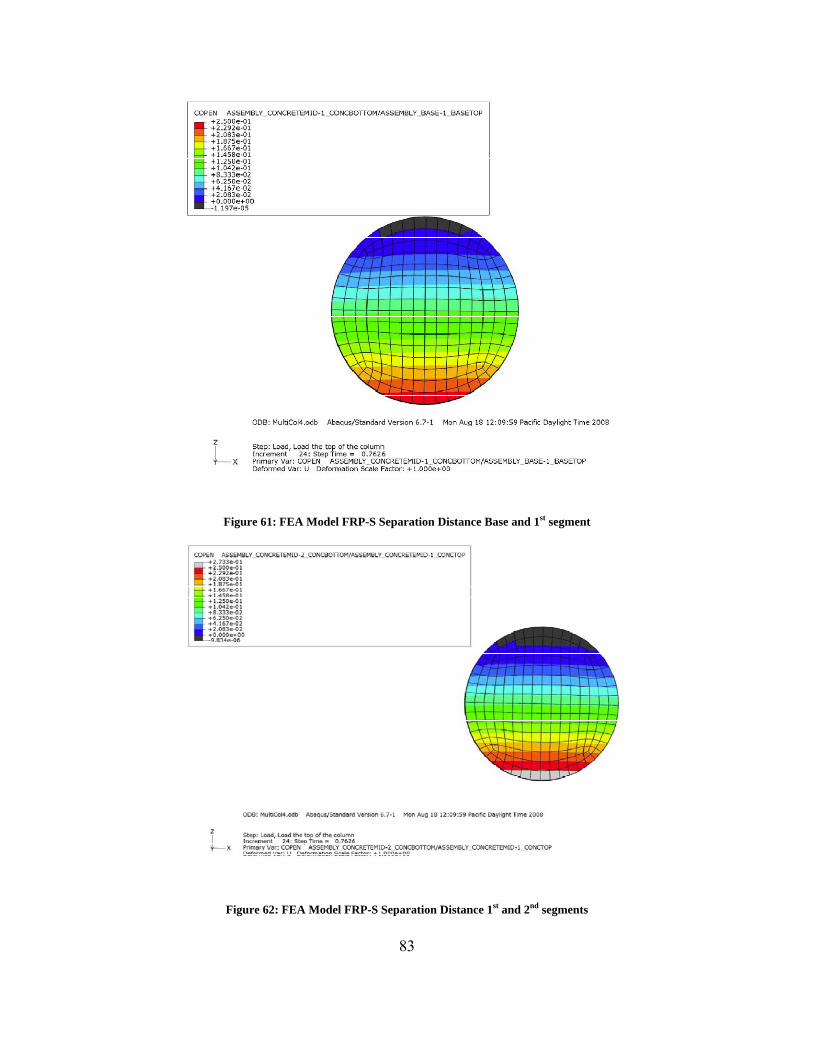
83
Figure 61: FEA Model FRP-S Separation Distance Base and 1st segment
Figure 62: FEA Model FRP-S Separation Distance 1st and 2nd segments

84
Mises stresses of the model for specimen FRP-S are shown in Figures 63 and 64 for the
base-1st segment interface and the interface between the 1st and 2nd segments, respectively. These
are cuts through the center of the column. The post-tensioning bar can be seen in the center of
the segment and foundation. The vertical portion in the first image is the portion which was
embedded into the base. The post-tensioning wire was not embedded or bound intermittently
through the model. This resulted in a shift of the bar of approximately 1 in. from the center of the
segments which is shown in the image of the 1st and 2nd segments below. This shift was more
than the shift allowed in the tested specimens due to the size of the post-tensioning duct and
diameter of the post-tensioning bar.
An image showing the 1st concrete segment is shown in Figure 65. The stress
concentration at the points of contact can clearly be seen. As with other mises stress plots, the
scale is from 0 to the maximum confined compressive strength of the concrete.
Figure 63: FEA Model FRP-S Mises Stresses

85
Figure 64: FEA Model FRP-S Mises Stresses
Figure 65: FEA Model FRP-S 1st segment Mises Stresses

86
6.4 Model comparison
The finite element analysis predicted the force-displacement response very similarly to
the analytical method discussed in Chapter 5. Using ABAQUS it was shown that the segmented
system would behave in a slightly stiffer manner than that of the system with a single segment.
The predicted force-displacement responses for the two ABAQUS models and the analytical
model are shown in Figure 66.
Figure 66: FEA Model Comparison
Like the analytical model before, the finite element analysis did not accurately predict the
true specimen performance. Theoretical models predicted a much stiffer column response than
was observed. Likewise, the FEA model predicted the segmented system being stiffer, while it
0
1000
2000
3000
4000
5000
6000
7000
8000
0.00 0.50 1.00 1.50 2.00 2.50 3.00 3.50 4.00 4.50 5.00
Force (lbf)
Displacement (in)
ABAQUS SingleCol4
ABAQUS MultiCol3
Analytical Moment‐Curvature
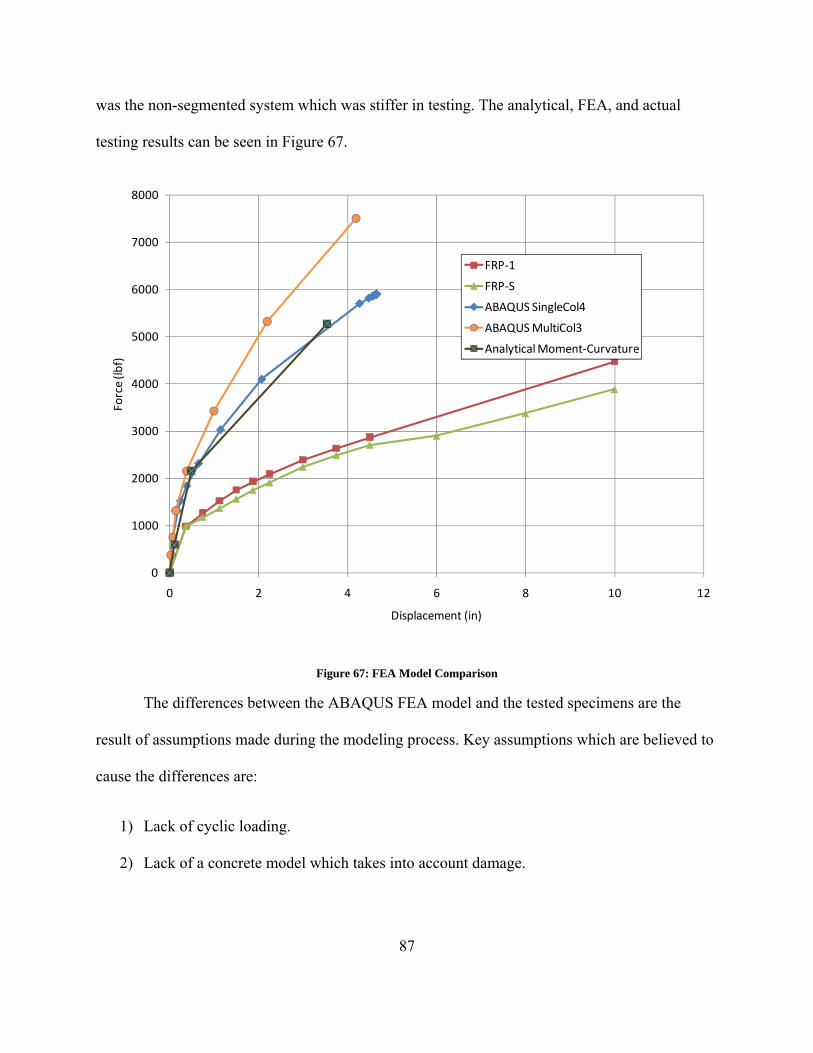
87
was the non-segmented system which was stiffer in testing. The analytical, FEA, and actual
testing results can be seen in Figure 67.
Figure 67: FEA Model Comparison
The differences between the ABAQUS FEA model and the tested specimens are the
result of assumptions made during the modeling process. Key assumptions which are believed to
cause the differences are:
1) Lack of cyclic loading.
2) Lack of a concrete model which takes into account damage.
0
1000
2000
3000
4000
5000
6000
7000
8000
0 2 4 6 8 10 12
Force (lb
f)
Displacement (in)
FRP‐1
FRP‐S
ABAQUS SingleCol4
ABAQUS MultiCol3
Analytical Moment‐Curvature

88
3) Allowing the post-tensioning bar to drift through the specimens outside of the bounds of
the post-tensioning duct.
4) Inaccurate FRP material model.
5) Analytical rigid base assumption could concentrate stresses in lower segments and FRP
jacket.

89
CHAPTER 7: CONCLUSIONS
7.1 Summary
The objective of this research was to conduct analysis on the performance of post-
tensioned concrete-filled fiber tubes. One monolithic reinforced concrete specimen was
compared against four post-tensioned segmented specimens. The force-displacement
performance, energy dissipation, equivalent viscous damping, and damage were compared for
the systems. Two methods of analysis including a simple model and finite element model were
used to model the performance of the segmented column.
7.2 Conclusions
Performance of post-tensioned system compared to typical reinforced concrete system-
The performance of the monolithic reinforced concrete specimen was as expected. A
plastic hinge was formed, which dissipated significant amounts of energy when compared to the
post-tensioned system. This plastic hinge also caused significant damage to the column.
Significantly larger deformations were possible with the post-tensioned systems. The only source
of damage was permanent elongation of the post-tensioning bar and minor crushing of the
concrete in the compression region where segments were bearing against one another and the
footing. This elongation resulted in a decrease in the post-tensioning force which in turn led to
diminishing performance when subjected to lateral loading. Prior to yielding of the reinforced
concrete column, performance between the systems were very similar. After yielding of the
reinforced concrete column, the post-tensioned systems continued to resist larger loads with no
significant sources of damage.
Performance of differing segment configurations-

90
The use of multiple segments for the column system yielded only a slight decrease in the
capacity of the column to resist lateral loads. Benefits were achieved in the construction of the
column however in the ability for the column to be assembled. During testing the columns with
multiple segments underwent rigid body rotation about multiple interfaces. This rotation was
achieved at all segments that were subjected to the required moment to induce the gap opening
between interfaces.
Post-tensioned energy dissipation-
The two systems utilized to increase the energy dissipation, rubber pads and steel angles,
performed very differently from each other. The rubber pads eliminated all visual signs of
damage to the column system, and did not allow for the permanent elongation of the post-
tensioning bar as seen in all other segmented systems. The disadvantage to this system was the
very poor force-displacement performance of the system with rubber pads.
The system with steel angles attached to the bottom of the column performed similarly to
the segmented system, and showed greater performance in terms of force-displacement at higher
levels of displacement. These sacrificial steel angles also allowed for greater energy dissipation
than any of the other post-tensioned systems.
Feasibility-
When compared to the current method of reinforced concrete design the system of post-
tensioning segments together has several advantages and disadvantages. As a pre-cast system
construction time on site is greatly improved over existing methods. There is no waiting period
to apply full load, only the time it takes to assemble and post-tension. The confinement provided

91
by the FRP is significant, and can confine a greater amount of concrete given a limiting column
diameter. During events with large lateral loadings, the segmented system suffers from
considerably less damage than the reinforced concrete system. This can allow a segmented
system to return to service much faster. The post-tensioning in the segmented system also causes
the column to effectively re-center itself after an event, while the reinforced concrete system
suffered from significant permanent displacements.
The energy dissipation from the segmented systems was significantly lower than that of
the reinforced concrete system. In order to attain energy dissipation near that of current systems,
specific energy dissipation members and devices would be required in the design. For this
research project those took the form of rubber pads and steel angles. While the steel angles
performed well, the rubber pads allowed excessive displacement under low lateral loads. The
issue with the loss of post-tensioning after an event is also one that must be addressed. This loss
in post-tensioning will reduce the performance of the system as a whole. However, if the initial
post-tensioning force is kept low so as to keep the forces during testing within the yield limit a
loss in post-tensioning should not occur due to permanent elongation of the bar.
Recommendations for future studies –
For future studies the deficiencies in the analytical and finite element models for the
behavior of the FRP specimens can be addressed by accounting for assumptions and
shortcomings in the mobels. By taking into account the cyclic nature of the test and the
associated damage both to the concrete and permanent elongation of the post-tensioning bar a
better estimation of the performance can be achieved.

92
While specimen FRP-R with the rubber sheeting at the interfaces was quite appealing in
the lack of major damage to the concrete, FRP, and post-tensioning bar, the performance in terms
of force-displacement was lackluster. By combining dedicated energy dissipation devices that
also can stiffen the response of the column such as the steel angles in specimen FRP-T to allow
for damage to be concentrated within replaceable components in easily accessible areas. With
this external energy dissipation system the post-tensioned column system would perform well
during an earthquake and can easily be returned to service afterwards while also giving the
benefits of a precast system to reduce construction time and costs.

93
References:
ACI Committee 440. (2002). Guide for the Design and Construction of Externally Bonded FRP Systems for Strengthening Concrete Structures. American Concrete Institute.
Chou, C.-C. & Chen, Y.-C. (2006). Cyclic tests of post-tensioned precast CFT segmental bridge columns with unbonded strands. Earthquake Engineering and Structural Dynamics , 35:159-175.
Hewes, J. T. & Priestley, M. J. (2002, May). Seismic Design and Performance of Precast Concrete Segmental Bridge Columns. Report No. SSRP 2001/25 . La Jolla, CA: University of California San Diego.
Lam, L. & Teng, J. G. (2003). Design-Oriented Stress-Strain Model for FRP-Confined Concrete in Rectangular Columns. Journal of Reinforced Plastics and Composites , 1149-1185.
Mander, M. J., Priestley, M. J. & Park, R. (1988, August). Theoretical Stress-Strain Model for Confined Concrete. Journal of Structural Engineering , 114 (8).
Ou, Y.-C., Ahn, I.-S., Chen, S. S., Lee, G. C., Chiewanichakorn, M. & Aref, A. J. (2006). Cyclic Performance of Precast Concrete Segmental Bridge Columns. TRB 2006 Annual Meeting CD-ROM.
Ou, Y.-C., Chiewanichakorn, M., Ahn, I.-S., Aref, A. J., Chen, S. S. & Filiatrault, A. (2006). Cyclic Performance of Precast Concrete Segmental Bridge Columns: Simplified Analytical and Finite Element Studies. Transportation Research Record: Journal of the Transportation Research Board, No. 1976 , 66-74.
Ozbakkaloglu, T. & Saatcioglu, M. (2005). FRP Stay-in-Place Formwork for Seismic Resistant High-Strength Concrete Column. Special Publication SP-230 , 1593-1612. ACI.
Seible, F., Priestley, M. J. & Innamorato, D. (1998). Earthquake retrofit of bridge columns with continuous carbon fiber jackets. NIST Workshop on Standards Development for the Use of Fiber Reinforced Polymers for the Rehabilitation of Concrete and Masonry Structures. Tucson, Arizone: National Institute of Standards and Technology.
Seible, F., Priestley, M. J., Hegemier, G. A. & Innamorato, D. (1997). Seismic Retrofit of RC Columns with Continuous Carbon Fiber Jackets. Journal of Composites for Construction .
Shao, Y. & Mirmiran, A. (2005, May/June). Experimental Investigation of Cyclic Behavior of Concrete-Filled Fiber Reinforced Polymer Tubes. Journal for Composites for Construction , 263-273.

94
Shao, Y., Aval, S. & Mirmiran, A. (2005, February). Fiber-Element Model for Cyclic Analysis of Concrete-Filled Fiber Reinforced Polymer Tubes. Journal of Structural Engineering , 292-303.
Zhu, Z., Ahmad, I. & Mirmiran, A. (2006, May/June). Seismic Performance of Concrete-Filled FRP Tube Columns for Bridge Substructure. Journal of Bridge Engineering , 359-370.

95
Appendix A – XTRACT Analysis Results
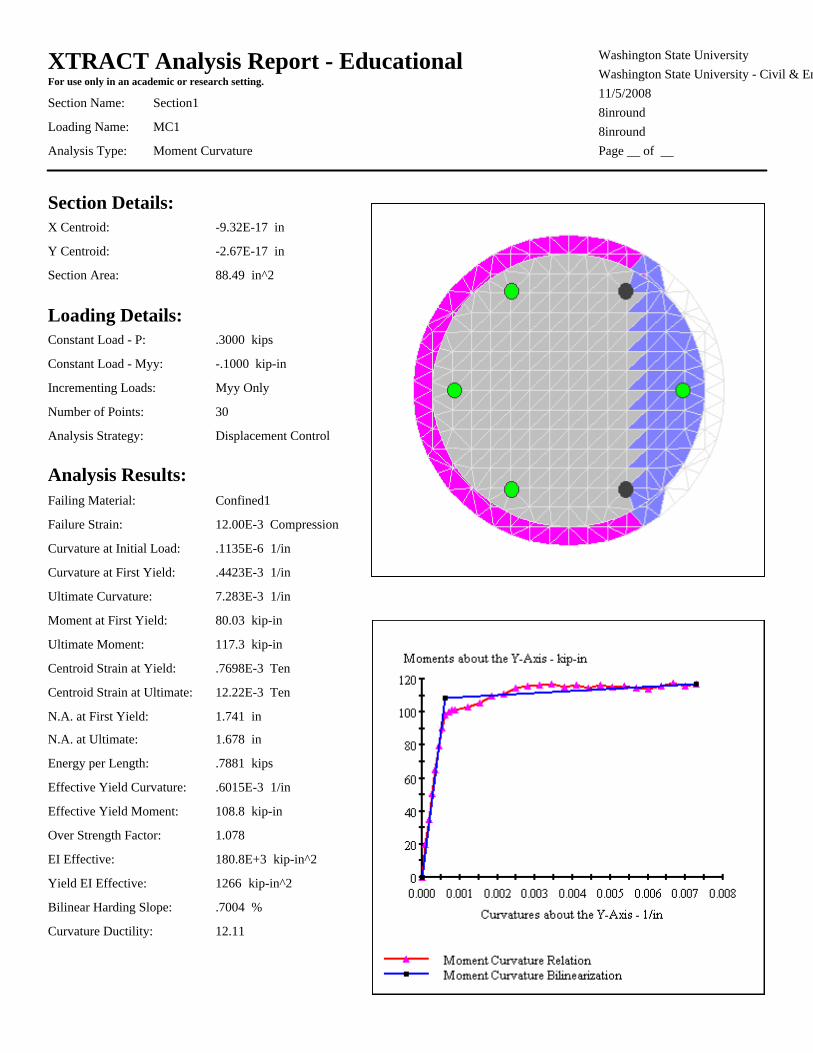
XTRACT Analysis Report - Educational Washington State University
8inround
Washington State University - Civil & En11/5/20088inround
Section1
Page __ of __
Section Name:
Analysis Type:
Loading Name:
Moment Curvature
MC1
For use only in an academic or research setting.
Section Details:X Centroid: -9.32E-17 in
Y Centroid: -2.67E-17 in
Section Area: 88.49 in^2
Loading Details:Constant Load - P: .3000 kips
Constant Load - Myy: -.1000 kip-in
Incrementing Loads: Myy Only
Number of Points: 30
Analysis Strategy: Displacement Control
Analysis Results:Failing Material: Confined1
Failure Strain: 12.00E-3 Compression
Curvature at Initial Load: .1135E-6 1/in
Curvature at First Yield: .4423E-3 1/in
Ultimate Curvature: 7.283E-3 1/in
Moment at First Yield: 80.03 kip-in
Ultimate Moment: 117.3 kip-in
Centroid Strain at Yield: .7698E-3 Ten
Centroid Strain at Ultimate: 12.22E-3 Ten
N.A. at First Yield: 1.741 in
N.A. at Ultimate: 1.678 in
Energy per Length: .7881 kips
Effective Yield Curvature: .6015E-3 1/in
Effective Yield Moment: 108.8 kip-in
Over Strength Factor: 1.078
EI Effective: 180.8E+3 kip-in^2
Yield EI Effective: 1266 kip-in^2
Bilinear Harding Slope: .7004 %
Curvature Ductility: 12.11

97
Appendix B - ABAQUS Input file
Note: This is the portion of the ABAQUS input file containing material definitions,
boundary conditions, loads, field outputs, interaction properties, embedments, post-tensioning,
and the steps. This file does not contain the geometric definitions.
*Surface, type=ELEMENT, name=ColTopSurf _ColTopSurf_S2, S2 **----------USER DEFINED EMBEDMENT-------------------- ** Constraint: PS-Wire-Embed *Embedded Element, host elset=TopSteelSet WireTopEnd ** Constraint: Ps-Wire-Base-Embed *Embedded Element, host elset=BaseSet WireBottomEnd **---------------------------------------------------- ** Constraint: FRP1-Conc1 *Tie, name=FRP1-Conc1, adjust=yes ConcreteMid-1.Conc-Side, FRP-1.FRP-Inside ** Constraint: FRP2-Conc2 *Tie, name=FRP2-Conc2, adjust=yes ConcreteMid-2.Conc-Side, FRP-2.FRP-Inside ** Constraint: FRP3-Conc3 *Tie, name=FRP3-Conc3, adjust=yes ConcreteMid-3.Conc-Side, FRP-3.FRP-Inside ** Constraint: FRP4-ConcTop *Tie, name=FRP4-ConcTop, adjust=yes ConcreteTop-1.Conc-Side, FRP-4.FRP-Inside *End Assembly ** ** MATERIALS ** *Material, name=Concrete ** Concrete *Elastic 4e+06, 0.15 *Plastic 6100., 0. 13010., 0.0036 16710., 0.009 17390., 0.017 14060., 0.06 1000., 0.062 *Material, name=ConcreteElastic ** Concrete *Elastic 4e+06, 0.15 *Material, name=FRP

98
*Elastic 4.35e+06, 0.2 *Material, name=PSteel *Elastic 2.9e+07, 0.3 *Plastic 117500., 0. 157500., 0.025 150000., 0.075 2000., 0.077 *Material, name=TopSteel ** Material for the top of the column *Elastic 2.9e+08, 0.3 ** ** INTERACTION PROPERTIES ** *Surface Interaction, name=Conc-Base 1., *Friction, slip tolerance=0.005 0.5, *Surface Behavior, augmented Lagrange *Surface Interaction, name=FRP-Base 1., *Friction, slip tolerance=0.005 0.1, *Surface Behavior, augmented Lagrange *Surface Interaction, name=FRP-FRP 1., *Friction, slip tolerance=0.005 0.1, *Surface Behavior, augmented Lagrange ** ** BOUNDARY CONDITIONS ** ** Name: FixColumn Type: Displacement/Rotation *Boundary RxnSet, 1, 1 RxnSet, 2, 2 RxnSet, 3, 3 ** Name: FixedBase Type: Displacement/Rotation *Boundary BaseSet, 1, 1 BaseSet, 2, 2 BaseSet, 3, 3 ** ** INTERACTIONS ** ** Interaction: Conc1-Base *Contact Pair, interaction=Conc-Base ConcreteMid-1.ConcBottom, Base-1.BaseTop ** Interaction: Conc1-Conc2

99
*Contact Pair, interaction=Conc-Base ConcreteMid-2.ConcBottom, ConcreteMid-1.ConcTop ** Interaction: Conc2-Conc3 *Contact Pair, interaction=Conc-Base ConcreteMid-3.ConcBottom, ConcreteMid-2.ConcTop ** Interaction: Conc3-ConcTop *Contact Pair, interaction=Conc-Base ConcreteTop-1.ConcBottom, ConcreteMid-3.ConcTop ** Interaction: FRP1-Base *Contact Pair, interaction=FRP-Base FRP-1.FRPBottom, Base-1.BaseTop ** Interaction: FRP1-FRP2 *Contact Pair, interaction=FRP-FRP FRP-2.FRPBottom, FRP-1.FRPTop ** Interaction: FRP2-FRP3 *Contact Pair, interaction=FRP-FRP FRP-3.FRPBottom, FRP-2.FRPTop ** Interaction: FRP3-FRP4 *Contact Pair, interaction=FRP-FRP FRP-4.FRPBottom, FRP-3.FRPTop ** ---------------------------------------------------------------- ** **-------------POST TENSION INITIAL STRESS------------------------- *Initial Conditions, Type=Stress WireSet, 45000 ** ** ** STEP: PostTensionStep ** *Step, name=PostTensionStep, nlgeom=YES *Static, Stabilize 1., 1., 1e-05, 1. ** ** OUTPUT REQUESTS ** *Restart, write, frequency=0 *Monitor, dof=3, node=DriftNode, frequency=1 *Output, field, frequency=0 *Output, history, frequency=0 *End Step ** ---------------------------------------------------------------- ** ** STEP: Load ** *Step, name=Load, nlgeom=YES, inc=1000 Load the top of the column *Static 0.05, 1., 1e-05, 1. **

100
** BOUNDARY CONDITIONS ** ** Name: FixColumn Type: Displacement/Rotation *Boundary, op=NEW ** Name: FixedBase Type: Displacement/Rotation *Boundary, op=NEW BaseSet, 1, 1 BaseSet, 2, 2 BaseSet, 3, 3 ** ** LOADS ** ** Name: Push Type: Surface traction *Dsload ColTopSurf, TRSHR, 225., 0., 0., 1. ** ** OUTPUT REQUESTS ** *Restart, write, frequency=0 ** ** FIELD OUTPUT: F-Output-1 ** *Output, field *Node Output CF, RF, U *Element Output, directions=YES E, EE, MISESMAX, PE, PEEQ, PEEQT, S *Contact Output CDISP, CSTRESS *Output, history, frequency=0 *End Step