performance of an advanced stirling convertor …€”2012-217731 1 performance of an advanced...
TRANSCRIPT

Scott D. WilsonGlenn Research Center, Cleveland, Ohio
Performance of an Advanced Stirling Convertor Based on Heat Flux Sensor Measurements
NASA/TM—2012-217731
October 2012
AIAA–2012–217731
https://ntrs.nasa.gov/search.jsp?R=20120016537 2018-07-09T06:55:10+00:00Z

NASA STI Program . . . in Profi le
Since its founding, NASA has been dedicated to the advancement of aeronautics and space science. The NASA Scientifi c and Technical Information (STI) program plays a key part in helping NASA maintain this important role.
The NASA STI Program operates under the auspices of the Agency Chief Information Offi cer. It collects, organizes, provides for archiving, and disseminates NASA’s STI. The NASA STI program provides access to the NASA Aeronautics and Space Database and its public interface, the NASA Technical Reports Server, thus providing one of the largest collections of aeronautical and space science STI in the world. Results are published in both non-NASA channels and by NASA in the NASA STI Report Series, which includes the following report types: • TECHNICAL PUBLICATION. Reports of
completed research or a major signifi cant phase of research that present the results of NASA programs and include extensive data or theoretical analysis. Includes compilations of signifi cant scientifi c and technical data and information deemed to be of continuing reference value. NASA counterpart of peer-reviewed formal professional papers but has less stringent limitations on manuscript length and extent of graphic presentations.
• TECHNICAL MEMORANDUM. Scientifi c
and technical fi ndings that are preliminary or of specialized interest, e.g., quick release reports, working papers, and bibliographies that contain minimal annotation. Does not contain extensive analysis.
• CONTRACTOR REPORT. Scientifi c and
technical fi ndings by NASA-sponsored contractors and grantees.
• CONFERENCE PUBLICATION. Collected papers from scientifi c and technical conferences, symposia, seminars, or other meetings sponsored or cosponsored by NASA.
• SPECIAL PUBLICATION. Scientifi c,
technical, or historical information from NASA programs, projects, and missions, often concerned with subjects having substantial public interest.
• TECHNICAL TRANSLATION. English-
language translations of foreign scientifi c and technical material pertinent to NASA’s mission.
Specialized services also include creating custom thesauri, building customized databases, organizing and publishing research results.
For more information about the NASA STI program, see the following:
• Access the NASA STI program home page at http://www.sti.nasa.gov
• E-mail your question to [email protected] • Fax your question to the NASA STI
Information Desk at 443–757–5803 • Phone the NASA STI Information Desk at 443–757–5802 • Write to:
STI Information Desk NASA Center for AeroSpace Information 7115 Standard Drive Hanover, MD 21076–1320
Scott D. WilsonGlenn Research Center, Cleveland, Ohio
Performance of an Advanced Stirling Convertor Based on Heat Flux Sensor Measurements
NASA/TM—2012-217731
October 2012
AIAA–2012–217731
National Aeronautics andSpace Administration
Glenn Research CenterCleveland, Ohio 44135
Prepared for the10th International Energy Conversion Engineering Conference (IECEC)sponsored by the American Institute of Aeronautics and AstronauticsAtlanta, Georgia, July 30–August 1, 2012

Acknowledgments
This work is funded through the NASA Science Mission Directorate and the Radioisotope Power Systems Program Offi ce.The authors wish to acknowledge the many people who supported this testing and analysis effort including Gus Fralick, John Wrbanek, Chuck Blaha, Ali Sayir, Tom Sabo, Art Atherton, Wayne Gerber, Nissim Lugasy, and Jeff Schreiber.
Available from
NASA Center for Aerospace Information7115 Standard DriveHanover, MD 21076–1320
National Technical Information Service5301 Shawnee Road
Alexandria, VA 22312
Available electronically at http://www.sti.nasa.gov
Trade names and trademarks are used in this report for identifi cation only. Their usage does not constitute an offi cial endorsement, either expressed or implied, by the National Aeronautics and
Space Administration.
Level of Review: This material has been technically reviewed by technical management.
This report is a formal draft or working paper, intended to solicit comments and
ideas from a technical peer group.
This report contains preliminary fi ndings, subject to revision as analysis proceeds.

NASA/TM—2012-217731 1
Performance of an Advanced Stirling Convertor Based on Heat Flux Sensor Measurements
Scott D. Wilson
National Aeronautics and Space Administration Glenn Research Center Cleveland, Ohio 44135
Abstract
The U.S. Department of Energy (DOE) and Lockheed Martin Space Systems Company (LMSSC) have been developing the Advanced Stirling Radioisotope Generator (ASRG) for use as a power system for space science missions. This generator would use two high-efficiency Advanced Stirling Convertors (ASCs), developed by Sunpower, Inc., and NASA Glenn Research Center. The ASCs convert thermal energy from a radioisotope heat source into electricity. As part of ground testing of these ASCs, different operating conditions are used to simulate expected mission conditions. These conditions require achieving a particular operating frequency, hot-end and cold-end temperatures, and specified electrical power output for a given heat input. It is difficult to measure heat input to Stirling convertors due to the complex geometries of the hot components, temperature limits of sensor materials, and invasive integration of sensors. A thin-film heat flux sensor was used to directly measure heat input to an ASC. The effort succeeded in designing and fabricating unique sensors, which were integrated into a Stirling convertor ground test and exposed to test temperatures exceeding 700 °C in air for 10,000 hr. Sensor measurements were used to calculate thermal efficiency for ASC–E (Engineering Unit) #1 and #4. The post-disassembly condition of the sensors is also discussed.
Nomenclature
Alumina Aluminum oxide ASC(–E) Advanced Stirling Convertor (Engineering Unit) ASRG Advanced Stirling Radioisotope Generator Au Gold DOE Department of Energy emf Electromotive force GPHS General Purpose Heat Source GRC Glenn Research Center LMSSC Lockheed Martin Space Systems Company PVD Physical vapor deposition Pt Platinum RPS Radioisotope Power System
Stirling Heat Addition
Stirling convertors are being developed for use in the Advanced Stirling Radioisotope Generator (ASRG). The ASRG, developed by the U.S. Department of Energy (DOE) and Lockheed Martin Space Systems Company (LMSSC), is a high-efficiency Radioisotope Power System (RPS) technology being developed to support future space missions. This generator would use two high-efficiency Advanced Stirling Convertors (ASCs), developed by Sunpower, Inc., and NASA Glenn Research Center (GRC). The ASCs convert thermal energy from a radioisotope heat source into electricity.
NASA/TM—2012-217731 2
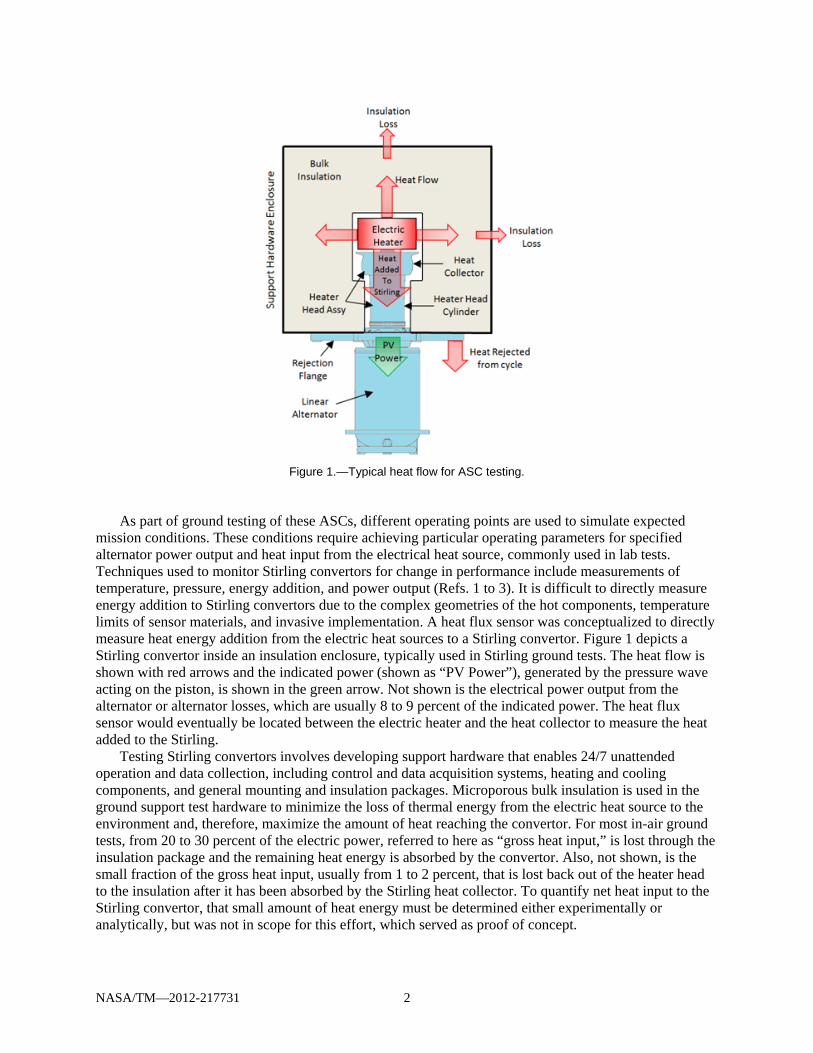
Figure 1.—Typical heat flow for ASC testing.
As part of ground testing of these ASCs, different operating points are used to simulate expected mission conditions. These conditions require achieving particular operating parameters for specified alternator power output and heat input from the electrical heat source, commonly used in lab tests. Techniques used to monitor Stirling convertors for change in performance include measurements of temperature, pressure, energy addition, and power output (Refs. 1 to 3). It is difficult to directly measure energy addition to Stirling convertors due to the complex geometries of the hot components, temperature limits of sensor materials, and invasive implementation. A heat flux sensor was conceptualized to directly measure heat energy addition from the electric heat sources to a Stirling convertor. Figure 1 depicts a Stirling convertor inside an insulation enclosure, typically used in Stirling ground tests. The heat flow is shown with red arrows and the indicated power (shown as “PV Power”), generated by the pressure wave acting on the piston, is shown in the green arrow. Not shown is the electrical power output from the alternator or alternator losses, which are usually 8 to 9 percent of the indicated power. The heat flux sensor would eventually be located between the electric heater and the heat collector to measure the heat added to the Stirling.
Testing Stirling convertors involves developing support hardware that enables 24/7 unattended operation and data collection, including control and data acquisition systems, heating and cooling components, and general mounting and insulation packages. Microporous bulk insulation is used in the ground support test hardware to minimize the loss of thermal energy from the electric heat source to the environment and, therefore, maximize the amount of heat reaching the convertor. For most in-air ground tests, from 20 to 30 percent of the electric power, referred to here as “gross heat input,” is lost through the insulation package and the remaining heat energy is absorbed by the convertor. Also, not shown, is the small fraction of the gross heat input, usually from 1 to 2 percent, that is lost back out of the heater head to the insulation after it has been absorbed by the Stirling heat collector. To quantify net heat input to the Stirling convertor, that small amount of heat energy must be determined either experimentally or analytically, but was not in scope for this effort, which served as proof of concept.

NASA/TM—2012-217731 3
Heat flux sensors are devices that measure the temperature drop across a finite thickness, often using thermocouples, which generate an electrical signal that is proportional to temperature. Heat flux sensors have been used in numerous areas, including industrial and engineering applications, building heating and cooling assessments, physics and medical studies, agriculture, and others. Commercially available heat flux sensors are typically available for operating temperatures below 500 °C. Some products, marketed as “high-temperature” heat flux sensors, can operate above 800 °C but are generally produced in shapes and sizes suitable for particular large-scale industrial applications. For aeronautics and aerospace harsh environment applications, thin films have been deposited on complex geometries such as fan blades and engine injector valves (Ref. 4). All heat flux sensors operate by measuring the temperature difference across a thermal resistance, based on Fourier’s law of heat conduction.
Design and Fabrication
Design requirements for this effort included sensor implementation without significantly diminishing available margin in heat source temperature limit or life and in a way that did not prevent the convertor from operating as expected. To make a noninvasive heat flux measurement between the heat source and Stirling convertor, a temperature difference and a way to measure it was needed. The proposed solution was to measure the surface temperature on each side of a solid disk, located between the heat source and Stirling convertor. The disk needed to introduce a thermal resistance, imposing a temperature drop from the heat source to the heat collector. The sensor design included thin-film thermocouples adhered to a ceramic substrate, intended to be robust enough to carry the application load and survive thermally-induced stresses from temperature transients during startup and shutdown.
The heat flux sensor was fabricated by depositing microlayers of noble metals onto a ceramic substrate (Ref. 5). The substrates were made via slipcasting, where powder was ball-milled in an aqueous solution, binders and dispersants were added, and castings were bisque fired and fully sintered. The disks were then machined to a thickness of 0.120±0.0005 in. with a near mirror surface finish and characterized by measuring the thermal conductivity. The thin-film thermocouples are deposited onto the ceramic disks in a pattern designed for a particular application. Wires are attached to the thin-film thermocouple patterns and fed out to a cold junction where the noble metal wires are transitioned to less-expensive, more-durable copper wires that interface the data acquisition system. The cold junction represents an additional offset of junction electromotive force (emf) voltage, which must be accounted for in the final calculation of junction temperature.
The sensors were designed to measure temperatures that could vary on the face of the sensor due to local heating of the cartridge heaters located in the heat source. To adequately capture radial and circumferential variations in temperature, sensors were spaced out in the radial direction and placed under and between heaters. For the nonstandard gold (Au) versus platinum (Pt) thermocouples, the positive leg was made from pure Au while the negative leg was made from pure Pt. The pattern was deposited on one side of a disk and its mirror image on the opposite side.
Convertor Testing
The ASC was designed to produce a nominal 80 We from 250 Wth gross heat input when integrated into the ASRG. The ASC–E (Engineering Unit) convertors utilize Inconel 718 heater heads, which operate at a maximum hot-end temperature of 650 °C. The cold-end temperature operating range is 40 to 90 °C. A heat collector is attached to the hot end of the heater head, which interfaces to an electric heat source during laboratory operation. A conductive flange, called the cold-side adapter flange, has been attached to the heat rejection zone of the heater head.

NASA/TM—2012-217731 4
Figure 2.—Test setup for ASC–E #1 and #4.
The sensors were installed into test setup for the ASC–E serial #1 and #4, shown in Figure 2. The white boxes house the insulation, hot end of the convertor, and electric heater. One heat flux sensor was installed onto each of the two convertors present in the setup. Historically, heat addition to the Stirling convertor has been quantified during operation by reducing static thermal loss data into a form that can be used during performance tests. A new method for measuring heat addition was desired to enable direct measurement of heat addition to the convertor that was envisioned as being insensitive to changes in the test setup, which could cause predictions to be in error. Errors can be caused by changes in the test setup due to aging insulation, which makes it difficult to distinguish between slow drift in a convertor’s operating point and a slow degradation in the convertor’s performance. Modeling errors are possible when assumptions are made for an initial test condition and do not apply to a final test configuration.
Prior to installation, the heat flux sensor wires were soldered to a custom wire feedthrough, shown in Figure 3. The relatively delicate 0.076-mm-diameter Au and Pt wires were successfully soldered to the copper wires present in the feedthrough, which was custom made to contain Type-T thermocouples for the cold-junction temperature measurement. The top left image shows the heat source sitting on top of the heat flux sensor. On each side of the heat flux sensor were nickel spacers, which contained Type-N thermocouple probes used as reference temperature measurements. The bottom left image shows the top spacer and the wire paths, which were machined into the microporous insulation by the vendor. The image on the right shows the outside surface of the enclosure where the custom feedthrough feeds out. Also shown is a D-sub feedthrough that contained seven Type-K thermocouples used to measure hot-end and heat source temperatures.
After the sensors were installed into the test setup, steps were taken to ensure that the data being streamed from the Agilent data recorder to LabVIEW (National Instruments) was being processed and captured correctly. The sensor output was recorded during convertor insulation loss testing, a test performed to enable first-order prediction of heat lost to the environment during operation. Figure 4 shows each junction’s temperature measurement for each of the four test temperatures. The convertor hot-end temperature was maintained at each of the following test temperatures: 350, 450, 550, and 650 °C. ASC–E #1’s sensor was delivered with Junctions 1 and 2 open so it was surprising to see both junctions fully functional. Junction 7, noted as functioning during the previous checkout test, did not report a temperature for the first two test points and then started functioning on the last two test points. ASC–E #4’s sensor was delivered with Junction 8 open, therefore, it was not unusual to find that junction inoperative. The data were used to determine that most junctions initially operated within the expected temperature range.

NASA/TM—2012-217731 5
Figure 4.—ASC–E #1 and #4’s heat flux sensor data: Temperatures during insulation loss testing.
Figure 3.—Heat flux sensor and heat source installed (top left), nickel spacer and wire path located in the microporous insulation (bottom left), and exterior view of custom wire feedthrough (right).
Custom wire feedthrough
D-sub wire feedthrough
Custom wire feedthrough
Heat source
Micro-porous insulation
Wire path
Nickel spacer
NASA/TM—2012-217731 6
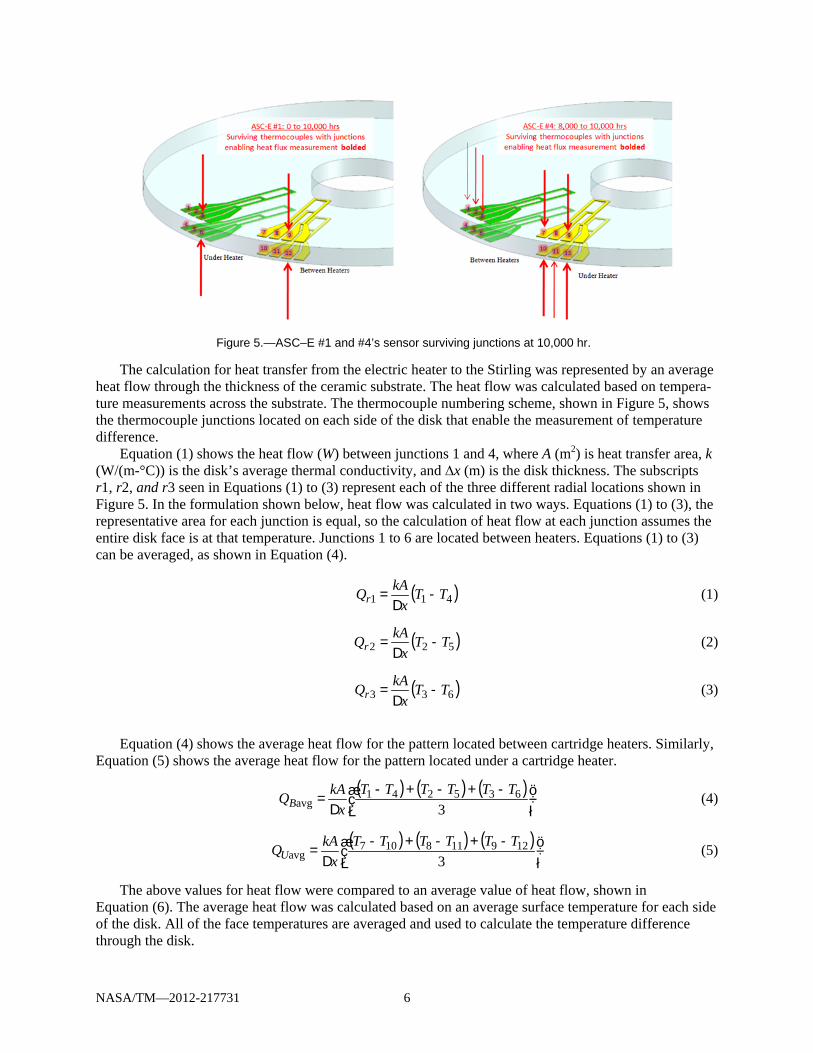
The calculation for heat transfer from the electric heater to the Stirling was represented by an average
heat flow through the thickness of the ceramic substrate. The heat flow was calculated based on tempera-ture measurements across the substrate. The thermocouple numbering scheme, shown in Figure 5, shows the thermocouple junctions located on each side of the disk that enable the measurement of temperature difference.
Equation (1) shows the heat flow (W) between junctions 1 and 4, where A (m2) is heat transfer area, k (W/(m-°C)) is the disk’s average thermal conductivity, and ∆x (m) is the disk thickness. The subscripts r1, r2, and r3 seen in Equations (1) to (3) represent each of the three different radial locations shown in Figure 5. In the formulation shown below, heat flow was calculated in two ways. Equations (1) to (3), the representative area for each junction is equal, so the calculation of heat flow at each junction assumes the entire disk face is at that temperature. Junctions 1 to 6 are located between heaters. Equations (1) to (3) can be averaged, as shown in Equation (4).
( )411 TTx
kAQr -D
= (1)
( )522 TTx
kAQr -D
= (2)
( )633 TTx
kAQr -D
= (3)
Equation (4) shows the average heat flow for the pattern located between cartridge heaters. Similarly, Equation (5) shows the average heat flow for the pattern located under a cartridge heater.
( ) ( ) ( )
÷øö
çèæ -+-+-
D=
3635241
avgTTTTTT
xkAQB (4)
( ) ( ) ( )
÷øö
çèæ -+-+-
D=
3129118107
avgTTTTTT
xkAQU (5)
The above values for heat flow were compared to an average value of heat flow, shown in Equation (6). The average heat flow was calculated based on an average surface temperature for each side of the disk. All of the face temperatures are averaged and used to calculate the temperature difference through the disk.
Figure 5.—ASC–E #1 and #4’s sensor surviving junctions at 10,000 hr.

NASA/TM—2012-217731 7
( ) ( )( )121110654987321avg AvgAvg T,T,T,T,T,TT,T,T,T,T,Tx
kAQ -D
= (6)
Using an average heat flow was believed to be a reasonable approach based on the assumption that
there would be a relatively small temperature gradient across the face of the sensor. This formulation also assumed adiabatic conditions at the surface of the ceramic disk. Some fraction of the total heat transfer is lost to the surrounding insulation. However, the amount should be relatively small because the thermal conductivity ratio of nickel parts to the ceramic is 10:1 and of the ceramic to blanket insulation surrounding that area is 30:1. One-dimensional heat transfer through a finite volume was calculated to estimate a worst-case heat loss from the edges of the heat flux sensor assembly. For an assembly surface temperature of 700 °C, the insulation loss is 420 W/m2. Approximating the exterior surface of the insulation with a thin, revolved surface results in a heat loss of 2.3 W (about 1 percent of total heat flow) so the average heat flow formulation is believed to be a suitable approach.
Results
Inspection of the heat flux sensor data revealed that many of the thermocouple junctions had failed during the 10,000-hr test. An interesting phenomenon observed about the thermocouple performance was that the junction output could fail, usually resulting in a zero value, and then later recover to a logical value (nearly picking up where it left off before failure). Figure 6 shows temperatures for both sensors from 0 to 10,000 hr. ASC–E #4’s sensor did not have a useful temperature difference measurement until around 6000 hr.
Some junctions had intermittently failed during the test. One would expect that the films that experienced physical damage would remain failed throughout the test. Furthermore, a change in chemistry due to diffusion of interfacing metallics should result in a constant bias. One possible explanation for the temporary nature of the output failure is that some portion of a film had adhered to the interfacing disk, despite the aluminum oxide (alumina) coating present to protect the thin-film sensors. At that point, the electrical circuit would be partially present on the sensor and partially present on the interfacing disk. Those parts of the circuit could become disjointed during thermal transients caused by convertor shutdown and startup. This could explain the intermittent signal output during startup and shutdown.
Figure 6.—ASC–E #1 and #4’s heat flux sensor data: Temperatures for all junctions, 0 to 10,000 hr.

NASA/TM—2012-217731 8
Figure 7 shows the thermocouples that survived the 10,000 hr test for both sensors. These junctions are highlighted in Figure 5, where the surviving junctions are shown with an arrow and enabled heat flux measurements are shown with bolded arrows.
The available temperatures were compared to the spacer temperatures, only to find the thick spacer temperature was about 35 °C higher than the sensor temperature near that spacer. In contrast, the thin spacer temperature was just about the same as the sensor temperature near that spacer. The local temperature drop observed might be explained by the steep temperature gradient near the much hotter heat source and by differences in contact resistance between the two spacers, although the latter does not appear to be prevalent throughout the data for either convertor, and is therefore unlikely.
Based on the surviving thermocouples, heat flow values were calculated for locations under and between the cartridge heaters. For comparison, the average heat flow was calculated using a temperature difference based on an average face temperature. Also included in the results are events that occurred throughout the 10,000-hr test, which explains some of the changes in trends. These events, summarized in Table I, include shutdown for facility maintenance, controlled shutdown due to failed test instrumentation, and changes in the operating point based on the desire to maintain a particular steady-state operation.
TABLE I.—TEST EVENT LIST Item Hr Description
1 808 A & B PID adjustment (–1 °C) 2 2986 No shutdown, unknown event 3 4444 Manual shutdown, known change in
performance 4 6049 Manual shutdown, rack calibration 5 6926 Manual shutdown, power lead swap 6 8024 Controlled shutdown, thermocouple failure 7 8999 No shutdown, unknown event 8 9273 No shutdown, unknown event 9 9667 Manual shutdown, facility maintenance 10 9743 No shutdown, unknown event 11 9888 No shutdown, unknown event 12 9980 Manual shutdown, facility maintenance
Figure 7.—ASC–E #1 and #4’s heat flux sensor data: Temperatures for surviving junctions, 0 to 10,000 hr.

NASA/TM—2012-217731 9
The measurements represent heat flow through the ceramic disk located between the heat source and Stirling convertor. Each disk contained six local heat flow measurement sites. In addition, the average heat flow was also calculated based on face temperature. By the end of the test, each disk contained only two local heat flow measurements. The sensors did not perform as desired due to intermittent junction failures, which disabled the heat flow measurements.
Figure 8 highlights events relevant to ASC–E #1 (left) and ASC–E #4 (right). Event 2 shows an increase in heat flow but does not correspond to a recorded event in the test history. Based on the four surviving thermocouples on ASC–E #4’s sensor, heat flow values were calculated for two locations under a cartridge heater. Events 2, 7, 8, 10, and 11 represent unknown causes for the change observed in heat flow. Other events represent shutdown/startup thermal transients.
Figure 9 (left) shows the resulting heat flow measurements made during the 10,000-hr test, with only the last 4000 hr shown for ASC–E #4. Heat flow varied most on ASC–E #1 ranging from 175 to 205 W and averaging at about 190 W. The value of heat flow usually changed after a convertor startup, as seen after events 3, 4, and 5. Heat flow only varied from 180 to 195 W on ASC–E #4. The convertor heat flow values are about 10 percent lower than the 200 to 210 W expected at those alternator power output levels. That could have elevated the efficiency calculations by about 3 to 4 percent.
Figure 9 shows the resulting heat flow and thermal efficiency for both convertors, where the efficiency was calculated using a constant alternator power output for each convertor. These hermetically sealed units operated on an AC bus controller so the operating frequency and piston amplitude remained essentially constant throughout the test. Each convertor’s hot-end temperature was used as an input to a
Figure 9.—Heat flow and thermal efficiency shown for ASC–E #1 and #4 based on heat flux sensor data.
Figure 8.—ASC–E #1 and #4’s heat flux sensor data: Heat flow for surviving thermocouple junctions.
NASA/TM—2012-217731 10
PID temperature controller so the gross electrical heat input was allowed to vary in order to maintain the desired hot-end temperature. ASC–E #4’s thermal efficiency appears to be slowly increasing throughout the period of successful data collection (6000 to 10,000 hr), reaching 35 percent at the end of the test. The thermal efficiency of ASC–E #1 was gradually increasing toward 39 percent until event 3, after which a new trend appeared. Upon every startup after event 3, the efficiency started at around 35 percent and decreased until the next shutdown occurred. Data between events 3 to 4 and between events 5 to 9 represent periods when alternator power output remained relatively constant while ASC–E #1’s heat flow increased. As expected, the calculated thermal efficiency is decreasing for those same periods. The spacer and heat source temperatures decreased slowly over the 10,000-hr test, suggesting the contact resistance was gradually decreasing between the heat source and convertor heater head, a phenomena observed in past extended operation tests. These decreasing trends were not well correlated to the heat flow calculations, suggesting that the heat flux sensor measurements were independent in how well it was thermally joined to the convertor.
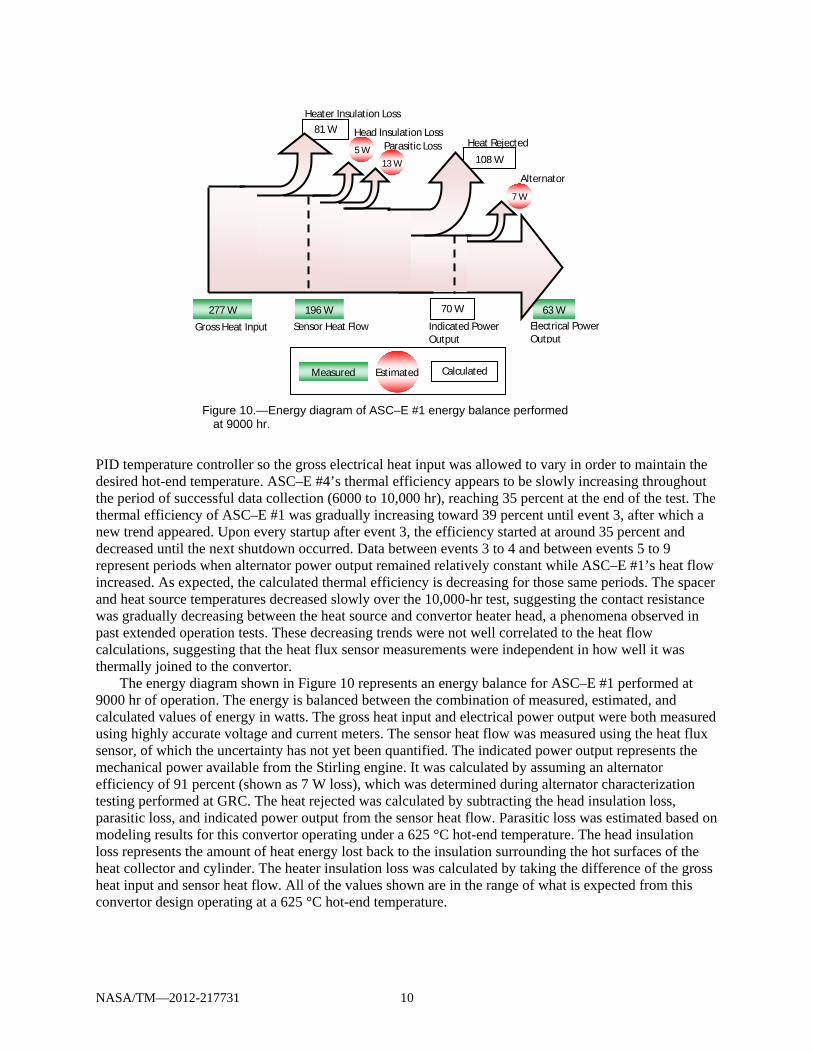
The energy diagram shown in Figure 10 represents an energy balance for ASC–E #1 performed at 9000 hr of operation. The energy is balanced between the combination of measured, estimated, and calculated values of energy in watts. The gross heat input and electrical power output were both measured using highly accurate voltage and current meters. The sensor heat flow was measured using the heat flux sensor, of which the uncertainty has not yet been quantified. The indicated power output represents the mechanical power available from the Stirling engine. It was calculated by assuming an alternator efficiency of 91 percent (shown as 7 W loss), which was determined during alternator characterization testing performed at GRC. The heat rejected was calculated by subtracting the head insulation loss, parasitic loss, and indicated power output from the sensor heat flow. Parasitic loss was estimated based on modeling results for this convertor operating under a 625 °C hot-end temperature. The head insulation loss represents the amount of heat energy lost back to the insulation surrounding the hot surfaces of the heat collector and cylinder. The heater insulation loss was calculated by taking the difference of the gross heat input and sensor heat flow. All of the values shown are in the range of what is expected from this convertor design operating at a 625 °C hot-end temperature.
Measured
63 W 196 W
108 W
81 W
277 W
Estimated
13 W 5 W
7 W
Calculated
Sensor Heat Flow
70 W
Indicated Power Output
Alternator
Heat Rejected Parasitic Loss Head Insulation Loss
Heater Insulation Loss
Electrical Power Output
Figure 10.—Energy diagram of ASC–E #1 energy balance performed at 9000 hr.
Gross Heat Input

NASA/TM—2012-217731 11
Conclusion
A thin-film heat flux sensor was designed, fabricated, characterized, and tested to directly measure the heat transfer from the heat source to a Stirling convertor while on test at NASA Glenn Research Center. The development effort identified materials, fabrication procedures, and data collection techniques required for measuring heat flux in a Stirling convertor application. The sensors contained gold versus platinum thermocouples deposited on full dense aluminum oxide (alumina) ceramic substrates. The sensors were tested for 10,000 hr at temperatures exceeding 700 °C in the Advanced Stirling Convertor Engineering Unit (ASC–E) #1 and #4 setup. The test started in 2009 and was completed in 2011, when the test was shut down and the sensors removed. Many thermocouple junctions had failed during the test, however, the surviving thermocouple junctions were used to calculate heat flow into the Stirling convertor for over 10,000 hr on ASC–E #1 and for the last 4000 hr of testing on ASC–E #4. While the effort proved the concept of directly measuring heat flow into an electrically heated Stirling convertor, it also showed that such sensors need to incorporate design improvements to improve reliability for possible future use in power systems.
References
1. Schreiber, J.G., Thieme, L.G., and Wong, W.A., “Supporting Technology at GRC to Mitigate Risk as Stirling Power Conversion Transitions to Flight,” Proceedings of the Sixth International Energy Conversion Engineering Conference (IECEC 2008), Cleveland, OH, August 2008.
2. Lewandowski, E.J., et al., “Extended Operation Testing of Stirling Convertors in Support of Stirling Radioisotope Power System Development,” Proceedings of the Sixth International Energy Conversion Engineering Conference (IECEC 2008), American Institute for Aeronautics and Astronautics, Cleveland, OH, August 2008.
3. Oriti, S.M., and Cornell, P.A., “Processing and Preparation of Advanced Stirling Convertors for Extended Operation at NASA Glenn Research Center,” Proceedings of the Sixth International Energy Conversion Engineering Conference (IECEC 2008), American Institute for Aeronautics and Astronautics, Cleveland, OH, August 2008.
4. Wrbanek, J.D., and Fralick, G.C., “Thin Film Physical Sensor Instrumentation Research and Development at NASA Glenn Research Center,” NASA/TM—2006-214395, ISA# TP06IIS023, September 2006.
5. Wilson, S.D., Fralick, G.C., Wrbanek, J.D., and Sayir, A., “Fabrication and Testing of a Thin-Film Heat Flux Sensor for a Stirling Convertor,” NASA/TM—2010-216063, AIAA 2009–4581, January 2010.

REPORT DOCUMENTATION PAGE Form Approved OMB No. 0704-0188
The public reporting burden for this collection of information is estimated to average 1 hour per response, including the time for reviewing instructions, searching existing data sources, gathering and maintaining the data needed, and completing and reviewing the collection of information. Send comments regarding this burden estimate or any other aspect of this collection of information, including suggestions for reducing this burden, to Department of Defense, Washington Headquarters Services, Directorate for Information Operations and Reports (0704-0188), 1215 Jefferson Davis Highway, Suite 1204, Arlington, VA 22202-4302. Respondents should be aware that notwithstanding any other provision of law, no person shall be subject to any penalty for failing to comply with a collection of information if it does not display a currently valid OMB control number. PLEASE DO NOT RETURN YOUR FORM TO THE ABOVE ADDRESS.
1. REPORT DATE (DD-MM-YYYY) 01-10-2012
2. REPORT TYPE Technical Memorandum
3. DATES COVERED (From - To)
4. TITLE AND SUBTITLE Performance of an Advanced Stirling Convertor Based on Heat Flux Sensor Measurements
5a. CONTRACT NUMBER
5b. GRANT NUMBER
5c. PROGRAM ELEMENT NUMBER
6. AUTHOR(S) Wilson, Scott, D.
5d. PROJECT NUMBER
5e. TASK NUMBER
5f. WORK UNIT NUMBER WBS 138494.01.99.01
7. PERFORMING ORGANIZATION NAME(S) AND ADDRESS(ES) National Aeronautics and Space Administration John H. Glenn Research Center at Lewis Field Cleveland, Ohio 44135-3191
8. PERFORMING ORGANIZATION REPORT NUMBER E-18222
9. SPONSORING/MONITORING AGENCY NAME(S) AND ADDRESS(ES) National Aeronautics and Space Administration Washington, DC 20546-0001
10. SPONSORING/MONITOR'S ACRONYM(S) NASA
11. SPONSORING/MONITORING REPORT NUMBER NASA/TM-2012-217731
12. DISTRIBUTION/AVAILABILITY STATEMENT Unclassified-Unlimited Subject Category: 20 Available electronically at http://www.sti.nasa.gov This publication is available from the NASA Center for AeroSpace Information, 443-757-5802
13. SUPPLEMENTARY NOTES
14. ABSTRACT The U.S. Department of Energy (DOE) and Lockheed Martin Space Systems Company (LMSSC) have been developing the Advanced Stirling Radioisotope Generator (ASRG) for use as a power system for space science missions. This generator would use two high-efficiency Advanced Stirling Convertors (ASCs), developed by Sunpower, Inc., and NASA Glenn Research Center. The ASCs convert thermal energy from a radioisotope heat source into electricity. As part of ground testing of these ASCs, different operating conditions are used to simulate expected mission conditions. These conditions require achieving a particular operating frequency, hot-end and cold-end temperatures, and specified electrical power output for a given heat input. It is difficult to measure heat input to Stirling convertors due to the complex geometries of the hot components, temperature limits of sensor materials, and invasive integration of sensors. A thin-film heat flux sensor was used to directly measure heat input to an ASC. The effort succeeded in designing and fabricating unique sensors, which were integrated into a Stirling convertor ground test and exposed to test temperatures exceeding 700 °C in air for 10,000 hr. Sensor measurements were used to calculate thermal efficiency for ASC-E (Engineering Unit) #1 and #4. The post-disassembly condition of the sensors is also discussed. 15. SUBJECT TERMS Advanced Stirling Convertor (ASC); Advanced Stirling Radioisotope Generator (ASRG); Thin-film thermocouples; Thin-film heat flux sensor; Net heat input; Stirling heat addition
16. SECURITY CLASSIFICATION OF: 17. LIMITATION OF ABSTRACT UU
18. NUMBER OF PAGES
18
19a. NAME OF RESPONSIBLE PERSON STI Help Desk (email:[email protected])
a. REPORT U
b. ABSTRACT U
c. THIS PAGE U
19b. TELEPHONE NUMBER (include area code) 443-757-5802
Standard Form 298 (Rev. 8-98)Prescribed by ANSI Std. Z39-18

