performance metrics in regions outside isos and … filedocket no. ad12-8-000 federal energy...
TRANSCRIPT

PERFORMANCE METRICS IN REGIONS OUTSIDE ISOs AND RTOs
Commission Staff Report
Federal Energy Regulatory Commission October 15 2012
This report does not necessarily reflect the views of the Commission its Chairman or individual Commissioners and it is not binding on the Commission
20121015-4003 FERC PDF (Unofficial) 10152012
Docket No AD12-8-000
Table of Contents
Section Page
I Backgroundhelliphelliphelliphelliphelliphelliphelliphelliphelliphelliphelliphelliphelliphelliphelliphelliphelliphelliphelliphelliphelliphelliphelliphelliphellip 4 II Notice of Filing and Responsive Pleadingshelliphelliphelliphelliphelliphelliphelliphelliphelliphelliphellip 5 III Discussionhelliphelliphelliphelliphelliphelliphelliphelliphelliphelliphelliphelliphelliphelliphelliphelliphelliphelliphelliphelliphelliphelliphellip 6
A Procedural Issueshelliphelliphelliphelliphelliphelliphelliphelliphelliphelliphelliphelliphelliphelliphelliphelliphelliphelliphellip 6 B Metrics Issueshelliphelliphelliphelliphelliphelliphelliphelliphelliphelliphelliphelliphelliphelliphelliphelliphelliphelliphelliphelliphellip7
1 General Issueshelliphelliphelliphelliphelliphelliphelliphelliphelliphelliphelliphelliphelliphelliphelliphelliphelliphelliphellip7 2 Additional Metricshelliphelliphelliphelliphelliphelliphelliphelliphelliphelliphelliphelliphelliphelliphelliphelliphellip9 3 Discussion of Individual Metricshelliphelliphelliphelliphelliphelliphelliphelliphelliphelliphellip15
a National and Regional Reliability Standardshelliphelliphellip15 b Dispatch Reliabilityhelliphelliphelliphelliphelliphelliphelliphelliphelliphelliphelliphelliphellip18 c Load Forecasting Accuracyhelliphelliphelliphelliphelliphelliphelliphelliphellip20 d Wind Forecasting Accuracyhelliphelliphelliphelliphelliphelliphelliphelliphellip20 e Unscheduled Flowshelliphelliphelliphelliphelliphelliphelliphelliphelliphelliphelliphelliphellip22 f Transmission Outage Coordinationhelliphelliphelliphelliphelliphellip23 g Long-Term Reliability Planning ndash Transmissionhellip24 h Long-Term Reliability Planning ndash Resourceshelliphellip27 i Infrastructure Investmenthelliphelliphelliphelliphelliphelliphelliphelliphelliphellip27 j Special Protection Systemshelliphelliphelliphelliphelliphelliphelliphelliphelliphellip30
k Demand Responsehelliphelliphelliphelliphelliphelliphelliphelliphelliphelliphelliphelliphellip31 l System Lambdahelliphelliphelliphelliphelliphelliphelliphelliphelliphelliphelliphelliphelliphellip31 m Congestion Managementhelliphelliphelliphelliphelliphelliphelliphelliphelliphelliphellip31 n Resource Availabilityhelliphelliphelliphelliphelliphelliphelliphelliphelliphelliphelliphellip32 o Transmission System Availabilityhelliphelliphelliphelliphelliphelliphellip32 p Fuel Diversityhelliphelliphelliphelliphelliphelliphelliphelliphelliphelliphelliphelliphelliphellip32 q Clean Energyhelliphelliphelliphelliphelliphelliphelliphelliphelliphelliphelliphelliphelliphellip33
C Burden Estimatehelliphelliphelliphelliphelliphelliphelliphelliphelliphelliphelliphelliphelliphelliphelliphelliphelliphelliphelliphellip33 D Information Collection Statementhelliphelliphelliphelliphelliphelliphelliphelliphelliphelliphelliphelliphellip34
Appendix Performance Metrics in Regions Outside ISOs and RTOs
2
20121015-4003 FERC PDF (Unofficial) 10152012
Docket No AD12-8-000
Federal Energy Regulatory Commission Staff Report on Performance Metrics for Regions Outside of ISOs and RTOs1
The purpose of this Federal Energy Regulatory Commission (Commission) Staff report is to describe the final metrics that have been developed to track performance and operations of utilities in regions outside of Independent System Operators (ISO) and Regional Transmission Organizations (RTO) While these metrics are based on the metrics previously developed to track the performance of ISOs and RTOs in Docket No AD10-5 they have been tailored to fit markets outside of ISOs and RTOs Consistent with the approach used to create performance metrics for ISOs and RTOs and also with the Commissionrsquos FY2009-2014 Strategic Plan Commission Staff worked with the Edison Electric Institute (EEI) its members and other interested stakeholders to design this set of performance metrics Commission Staff appreciates the public comments filed in this proceeding which we have taken into account in developing the final metrics for tracking performance and operations of utilities in regions outside of ISOs and RTOs2
As for next steps Commission Staff requests participating utilities to submit reports providing data and explanatory information for the 2006-2010 period that responds to the final list of performance metrics contained in the Appendix3 The information included in these reports will cover the same time period that ISOs and RTOs covered in their second performance report to the Commission We ask participating utilities to submit their reports by January 25 2013
The next performance report which is expected to issue in 2013 will be based on 2008-2012 data Having developed metrics for ISOsRTOs and then tailored these metrics to suit non-ISOsRTOs Commission Staff has established appropriate common metrics between ISOsRTOs and non-ISOsRTOs4 We will however continue to assess the metrics and evaluate the responses received in response to both the ISORTO metrics
1 This report does not necessarily reflect the views of the Commission its
Chairman or individual Commissioners and it is not binding on the Commission
2 The final list of metrics is provided in the Appendix
3 We expect entities to provide data and explain performance trends in a manner consistent with the responses provided by ISOs and RTOs in Docket No AD10-5-000 See eg The Six ISOs and RTOs 2011 ISORTO Metrics Report Docket No AD10-5-000 (Aug 31 2011) (2011 ISORTO Metrics Report)
4 See Commission Staff Report on ISORTO Metrics Docket No AD10-5-000 at 6 (October 21 2010) (Staff Report)
3
20121015-4003 FERC PDF (Unofficial) 10152012
Docket No AD12-8-000
and the non-ISORTO metrics to ensure there are no inconsistencies and we will further modify the metrics as necessary I Background Responding to a request for an investigation into ISORTO costs structure processes and operations5 the Government Accountability Office in a September 2008 Report to the US Senate Committee on Homeland Security and Governmental Affairs6 recommended that the Chairman of the Commission take action to accomplish the following (1) work with RTOs stakeholders and other experts to develop standardized measures that track the performance of RTO operations and markets and (2) report the performance results to Congress and the public while also providing the following interpretation (a) what the measures and reported performance communicate about the benefits of RTOs and where appropriate (b) changes that need to be made to address any performance concerns The Government Accountability Office Report also suggested that the Commission explore performance metrics for non-ISOsRTOs7 The Performance Metrics effort is also part of the Commissionrsquos Strategic Plan which includes a Metrics Initiative The first step of the Performance Metrics effort was to develop appropriate operational and financial metrics for ISOsRTOs This step was completed with the submission of a Report to Congress8 The next steps in the Metrics Initiative are as follows (1) explore and develop appropriate operational and financial
5 This request was made on May 21 2007 by Senator Joseph I Lieberman
Chairman and Senator Susan M Collins Ranking Minority Member of the US Senate Committee on Homeland Security and Governmental Affairs in a letter to the US Government Accountability Office The letter expressed the Senatorsrsquo concern that ISOsRTOs may not be living up to their full potential with respect to improving efficiencies and reducing costs and that they might not have adequate incentives to minimize costs
6 US Government Accountability Office Electricity Restructuring FERC Could Take Additional Steps to Analyze Regional Transmission Organizationsrsquo Benefits and Performance (2008) (Government Accountability Office Report) A copy of the Government Accountability Office Report GAO-08-987 can be found at httpwwwgaogovnewitemsd08987pdf
7 Government Accountability Office Report at 57
8 Performance Metrics For Independent System Operators and Regional Transmission Organizations Docket No AD10-5-000 at 5 (October 21 2010) See also 2010 ISORTO Metrics Report Docket No AD10-5-000 (Dec 6 2010)
4
20121015-4003 FERC PDF (Unofficial) 10152012
Docket No AD12-8-000
metrics for utilities in non-ISORTO regions (2) establish appropriate common metrics between ISOsRTOs and non-ISORTO regions (3) monitor implementation and performance and (4) evaluate performance and seek changes as necessary Consistent with FERCrsquos FY 2009 ndash 2014 Strategic Plan with the issuance of this report Commission Staff has now completed the first and second of the ldquonext stepsrdquo of the Metrics Initiative and in the coming months will evaluate the performance of utilities in non-ISORTO regions Starting with the list of metrics developed for ISOsRTOs Commission Staff met with a team of representatives of utilities that operate outside of ISOs and RTOs to develop performance metrics for utilities in non-ISORTO regions These discussions resulted in a list of 31 proposed performance metrics Commission Staff then held focused outreach meetings with a variety of industry consumer and state regulatory associations to discuss the proposed metrics9 As a follow-up to that outreach Commission Staffrsquos proposed performance metrics were noticed for public comment and reply comment in Docket No AD12-8-000 on February 23 2012 II Notice of Filing and Responsive Pleadings Notice of Commission Staffrsquos request for comments on draft metrics for regions outside of ISOs and RTOs was published in the Federal Register 77 Fed Reg 12832 (2012) with comments due on or before May 1 2012 and reply comments due on or before May 16 2012 Comments were filed by Edison Electric Institute (EEI) Electric Power Supply Association (EPSA) Joint Commenters10 Multiple TDUs11 and Northwest amp Intermountain Power Producers Coalition (NIPPC) EEI filed reply comments
9 Commission Staff Edison Electric Institute (EEI) and utility representatives met
with the Compete Coalition ISORTO Council Electric Power Supply Association (EPSA) National Association of Regulatory Utility Commissioners (NARUC) National Association of State Utility Consumer Advocates (NASUCA) and National Rural Electric Cooperative Association (NRECA)
10 Joint Protesters are AARP American Public Power Association Citizen Power Electricity Consumers Research Council and Virginia Citizens Consumer Council
11 Multiple TDUs are Public Works Commission of the City of Fayetteville North Carolina Lafayette Utilities System and the City of Orangeburg South Carolina
5
20121015-4003 FERC PDF (Unofficial) 10152012
Docket No AD12-8-000
III Discussion A Procedural Issues 1 Comments Joint Commenters argue that the process used for developing performance metrics outside of ISOs and RTOs is fundamentally flawed They claim that the metrics developed for ISOs and RTOs do not adequately measure performance because the Commission relied on the regulated ISOs and RTOs themselves to develop measures of their own performance Thus they maintain that any attempt to develop comparable metrics for public utilities outside of RTOs and ISOs is a fruitless endeavor Moreover they state that the Commission is making the same mistake here by allowing those entities that will eventually report under the metrics to drive their development While they acknowledge that regulated entities have expertise that can inform the development of the metrics they object to having regulated entities develop the metrics without the benefit of what Joint Commenters consider to be a transparent and open public process12 In reply EEI argues that the Joint Commenters overlook the fact that the metrics are the product of a collaborative process In this regard EEI notes that it and its members participated in Commission-led outreach sessions to discuss the proposed metrics and solicit feedback from stakeholders which was taken into account before the metrics were issued for public comment EEI notes that the Joint Commenters fail to provide reasons why the metrics will not be useful and cautions the Commission against ignoring the benefits of the metrics in favor of accepting the Joint Commentersrsquo unsupported claims13 2 Response Commission Staff disagrees with Joint Commentersrsquo characterization of the process used to develop the metrics for regions outside of ISOs and RTOs as ldquofundamentally flawedrdquo Commission Staff used a process similar to the process that was used to develop metrics for ISOsRTOs Commission Staff invited broad stakeholder participation and engaged in a process with EEI its members and other interested stakeholders to develop performance metrics tailored to regions outside of ISOs and RTOs Since the goal is to develop metrics that are comparable for ISOsRTOs and non-
12 Joint Commenters Comments at 2-3
13 EEI Reply Comments at 2-3
6
20121015-4003 FERC PDF (Unofficial) 10152012
Docket No AD12-8-000
ISOsRTOs Commission Staff began by assessing which ISORTO metrics should apply to non-ISOsRTOs and tailored these metrics to the non-ISORTO context Commission Staff met with representatives from various stakeholder groups and solicited comments prior to issuing the metrics for public comment Commission Staff then provided an opportunity for public comment and as further discussed below Commission Staff has taken these comments into account when crafting a final list of metrics Thus Commission Staff concludes that the process was sufficiently interactive and transparent Moreover Commission Staff concludes that any benefits to be gained from restarting the process would not justify the attendant delay in using the draft metrics to gather performance data Therefore just as similar procedural criticisms were considered in the ISORTO metrics report we also dismiss them here B Metrics Issues As noted when the draft metrics were issued for public comment the list of metrics for regions outside of ISOs and RTOs was based on the list of metrics adopted in Docket No AD10-5-000 and was tailored to markets in these regions14 Based on the comments discussed below and certain adjustments by Commission Staff 39 performance metrics have been selected for participating utilities in regions outside of ISOs and RTOs As noted above these metrics are listed in the Appendix 1 General Issues a Comments Several commenters express general support for the proposed metrics for regions outside of ISOs and RTOs EPSA explains that it supports the proposed metrics and expects that the metrics will address the factors necessary to evaluate the performance of non-ISORTO markets EPSA states that the proposed metrics appear to appropriately reflect the unique differences in the markets that exist outside of an ISO or RTO EPSA states that the development of performance metrics for non-ISORTO markets will assist the Commission by providing a solid basis for comparing markets within an ISO and RTO and those outside of such regions15
14 See Commission Staff Request Comments on Performance Metrics for Regions
Outside of RTOs and ISOs Non-ISORTO Performance Metrics Docket No AD12-8-000 at 2 (Feb 23 2012)
15 EPSA Comments at 2-3
7
20121015-4003 FERC PDF (Unofficial) 10152012
Docket No AD12-8-000
Similarly EEI states that the metrics are sufficient to provide meaningful data without being overly burdensome on members that choose to respond16 EEI cautions however that use of the data should be limited to the purposes contemplated in the notice EEI states that given the differences in the entities that voluntarily choose to respond it may be difficult to draw comparisons among them Moreover EEI states that data reported in response to the metrics should not be used as record evidence in any contested proceeding or serve as a basis for any enforcement action against an entity voluntarily providing data in response to these metrics17
A number of commenters claim that there will be gaps in the information available
without the participation of non-jurisdictional entities NIPPC explains that non-jurisdictional transmission providers play a significant role in the ldquoHybrid West marketrdquo (the area of the Western Interconnection outside of the organized markets in Alberta and California) and as a result the Commission will only have limited insight into market performance in this region without the participation of non-jurisdictional transmission providers Likewise EEI notes that several stand-alone utilities coordinate their operations with non-jurisdictional entities to maintain reliability and since these entities will not be reporting data there will be significant gaps for some of the metrics18 b Response
Commission Staff agrees with commenters that the proposed performance metrics
for non-ISORTO regions should provide a suitable basis for comparing the performance of ISOs RTOs and utilities in regions outside ISORTO markets Commission Staff will monitor implementation and performance under both the ISORTO metrics and the non-ISORTO metrics and if necessary make modifications to improve the comparability of metrics for these two sets of entities
While Commission Staff recognizes that an analysis of performance metrics in
non-ISORTO regions would be enhanced by the inclusion of information from non-jurisdictional entities as NIPPC and EEI note the performance metrics are being developed and analyzed in a voluntary and collaborative process Commission Staff encourages and welcomes information that these entities are willing to provide voluntarily
16 Id at 3
17 Id at 3 4-5
18 Id at 4
8
20121015-4003 FERC PDF (Unofficial) 10152012
Docket No AD12-8-000
2 Additional Metrics and Information a Comments
A number of commenters recommend that the Commission adopt additional metrics For instance EPSA states that the metrics should include a metric measuring and monitoring the transfer capability of a utility or transmission system as the ability to import or export megawatts (MW) into or out of a utilityrsquos transmission system is a solid indicator of that utilityrsquos or transmission systemrsquos performance EPSA explains that a metric monitoring transfer capability would assist both the Commission and the public in determining which balancing authority areas have available power to transfer which in turn could provide competitive suppliers with greater access to wholesale customers and enhance competition19
NIPPC argues that the Commission should require transmission providers to report
the extent of their participation in initiatives facilitating virtual consolidation of operations among transmission providers such as the Joint Initiative project NIPPC explains that the Joint Initiative project refers to an effort to promote market efficiency through greater cooperation among the Northern Tier Transmission Group Columbia Grid and WestConnect20 NIPPC also states that the Commission should include a metric concerning whether the transmission provider is participating in the Area Control Error Diversity Interchange Program which involves the pooling of individual Area Control Errors21 to take advantage of control error diversity22 NIPPC further maintains that the Commission should require transmission providers to indicate whether they are participating in the Joint Initiative Dynamic Scheduling System which allows dynamic
19 Id at 6
20 NIPPC Comments at 7
21 Area Control Error refers to the instantaneous difference between a balancing authorityrsquos net actual and scheduled interchange taking into account the effects of Frequency Bias and correction for meter error See North American Electric Reliability Council (NERC) Glossary of Terms Used in NERC Reliability Standards (NERC Glossary) available at httpwwwnerccomfilesGlossary_of_Terms_2012May25pdf It is a measure of the power balance on the interties between balancing authority areas
22 NIPPC Comments at 7
9
20121015-4003 FERC PDF (Unofficial) 10152012
Docket No AD12-8-000
schedules to be implemented quickly while requiring minimal changes to existingprocesses and p 23
rocedures
NIPPC argues that as parts of the western United States move to intra-hour
markets andor energy imbalance markets the Commission would benefit from information concerning which transmission providers are actively participating in those markets Similarly noting that the Commission has observed that intra-hour scheduling can reduce the cost of providing reserves to integrate variable energy resources24 NIPPC argues that the Commission should obtain information from transmission providers on whether they allow intra-hour scheduling Accordingly NIPPC urges the Commission to collect metrics describing (1) whether the transmission provider allows intra-hourly scheduling and facilitates customer participation in an intra-hour energy market (2) what products are traded in that intra-hour market (eg scheduling increments) and (3) the total number of intra-hour scheduling requests and (4) for each of the products identified the total number of transactions and the total megawatt hour (MWh) quantity of transactions25 Additionally NIPPC notes that transmission providers in the Hybrid West market26 are seeking to impose integration charges on variable energy resource generators and argues that the Commission should require transmission providers who impose such charges to report the specific charge and the specific service associated with the charge27
NIPPC also argues that the Commission should obtain information on whether the transmission provider has adopted the Joint Initiative standards ndash standardized business practices and procedures to facilitate the intra-hour schedule developed by the Joint Initiative project28 Further NIPPC claims that the Commission should obtain information from transmission providers on whether they participate in the I-TAPwebExchange and if so the number and nature of transactions using the tool29
23 Id at 8
24 Id (citing Integration of Variable Energy Resources Notice of Proposed Rulemaking 133 FERC para 61149 (2011) (VERS NOPR))
25 NIPPC Comments at 9-10
26 NIPPC defines the ldquoHybrid Westrdquo [market] as the area of the Western Interconnection outside the organized markets in Alberta and California Id at 2
27 Id at 10
28 Id
29 NIPPC explains that the Joint Initiative project developed I-TAP which reduces the number of keystrokes necessary to complete a transaction and thereby reduces the
10
20121015-4003 FERC PDF (Unofficial) 10152012
Docket No AD12-8-000
EPSA expresses concern that there are insufficient metrics for evaluating a
utilityrsquos cost to serve native load which is important for comparing the performance of utilities within an ISO or RTO with those outside30 EPSA argues that the Commission should evaluate price metrics for entities in regions outside of ISOs and RTOs EPSA asserts that establishing a price metric for these regions is consistent with the metrics established to evaluate performance in an ISO or RTO EPSA acknowledges the difficulties in comparing prices between a utility in a region outside of an RTO or ISO and one that participates in such a market Nevertheless EPSA maintains that it is important to establish some method to compare prices if the metrics are to provide a realistic method to compare ISOs and RTOs with regions outside of such markets31 EEI points out that it is the statersquos responsibility to monitor and evaluate a utilityrsquos cost of service to native load EEI argues that this is outside the Commissionrsquos jurisdiction and could further complicate state efforts to ensure that native load receives reliable cost-effective service32
b Response
With respect to EPSArsquos interest in transfer capability metrics we note that transfer capability is measured by Available Transfer Capacity (ATC)33 which is a function of system topology and the transmission capacity reserved by firm transmission customers to meet their load requirements Since many aspects of system topology are beyond the control of utilities such as system capabilities on neighboring systems and they must reserve firm capacity to meet load requirements Commission Staff does not consider ATC to be a good indication of a utilityrsquos performance
potential for errors Id at 8-9 I-TAP will not be a centralized market but instead is expected to operate as a highly-efficient bilateral market that will enable energy and capacity products to be traded in as short a term as intra-hour All participation will be voluntary with completed transactions being bilateral deals between the individual parties
30 EPSA Comments at 9
31 Id at 8 n6
32 EEI Reply Comments at 3-4
33 ATC is a measure of the flow capacity remaining on a flowgate for further commercial activity over and above already committed uses See NERC Glossary
11
20121015-4003 FERC PDF (Unofficial) 10152012
Docket No AD12-8-000
While Commission Staff does not think that ATC would be an appropriate measure of a utilityrsquos performance we share EPSArsquos concern about the under-utilization of capacity It appears that EPSA is concerned that utilities are reserving capacity that they do not utilize thereby leaving available capacity unused This can harm competition and reduce the efficiency of the electric system by limiting the ability to deliver low cost energy where it is needed Such a practice could be especially problematic where utilities do not schedule transmission until just prior to the operating hour For these reasons Commission Staff recommends that participating utilities provide a narrative discussion addressing interconnection-wide and seams issues consistent with the Commission Staff report addressing ISO and RTO markets34
As NIPPC points out initiatives such as the Joint Initiative project involving the Northern Tier Transmission Group Columbia Grid and WestConnect can be the basis for improving the efficiency of the regional transmission system through joint planning and transmission access programs For this reason Commission Staff recommends that transmission providers include narrative discussions of their participation in joint regional initiatives and progress made on improving the efficiency of regional transmission systems in their reports on interconnection-wide and seams-wide issues Also regarding NIPPCrsquos interest in tracking progress toward the development of energy imbalance markets in particular Commission Staff agrees that discussions of a transmission providerrsquos participation in such markets and the progress made in the development of these markets would be useful Imbalance markets can reduce the cost of supply and foster competition among suppliers Therefore utility participation in these programs can ultimately result in reducing the cost of power Consequently Commission Staff recommends that participating utilities include information on the development of energy imbalance markets in the narrative discussions in their performance reports However Commission Staff does not recommend adding metrics measuring the number of transactions or MW traded at this time35 In light of the early stage of development of these markets and the impact of factors beyond the control of utilities in the development of these markets it is premature to designate this information as a measure of the performance of utilities
Commission Staff agrees with NIPPC that information on utility participation in programs to facilitate the integration of variable energy resources and to mitigate any issues and uncertainty associated with scheduling variable energy resources would provide information relevant to the performance of utilities Such information would allow for an assessment of how utilities are ensuring the efficiency of their operations
34 Staff Report at 15
35 We note that this information is included in the Electric Quarterly Reports that must be filed with the Commission See 18 CFR sect 3510b (2012)
12
20121015-4003 FERC PDF (Unofficial) 10152012
Docket No AD12-8-000
while integrating renewable resources While we do not think a standard metric is necessary at this time Commission Staff nevertheless recommends that utilities include in their reports narrative discussions of their progress in implementing such programs including area control error diversity interchange dynamic scheduling systems intra-hour transmission scheduling36 and intra-hour transaction accelerator platforms Regarding NIPPCrsquos request for information on transmission grid integration charges for variable energy resources the Commission recently addressed the design of generator regulation service charges in its final rule in Docket No RM10-11-00037 Any such charges would be subject to Commission review under section 205 of the Federal Power Act38 and as a result subject to public review With respect to EPSArsquos interest in price metrics for entities in regions outside of ISOs and RTOs Commission Staff agrees with EPSA that it is difficult to compare prices outside of ISO and RTO markets with prices in these markets ISO and RTO market prices are locational marginal prices (LMPs) that are based on resource offers and load bids LMP pricing does not exist outside these markets This lack of comparability was the primary reason that Commission Staff did not propose a price metric for utilities outside ISO and RTO markets Commission Staff also considered utility cost-of-service rates that include retail costs to be unsuitable price metrics These rates include distribution and other functions that are not encompassed by the wholesale service provided by ISOs and RTOs and as noted by EEI utility cost-of-service rates are outside the Commissionrsquos jurisdiction Notwithstanding the difficulties inherent in comparing wholesale prices between ISORTO markets and regions outside ISORTO markets wholesale prices are pertinent to the performance of utilities in pricing their products competitively Accordingly Commission Staff proposes that utilities provide price metrics on their wholesale power sales derived from the transaction information and price data utilities report on wholesale power sales in the Electric Quarterly Report39 To ensure comparability with the load-
36 In the final rule in Integration of Variable Energy Resources the Commission
amended the pro forma OATT to provide all transmission customers the option of using more frequent transmission scheduling intervals within each operating hour at 15-minute intervals See Integration of Variable Energy Resources Order No 764 139 FERC para 61246 at P 91 (2012)
37 Id P 271
38 16 USC sect 824e (2006)
39 Revised Public Utility Filing Requirements Order No 2001 67 Fed Reg 31043 (May 8 2002) FERC Stats amp Regs para 31127 rehrsquog denied Order No 2001-A 100 FERC para 61074 rehrsquog denied Order No 2001-B 100 FERC para 61342 order
13
20121015-4003 FERC PDF (Unofficial) 10152012
Docket No AD12-8-000
weighted data provided by ISOs and RTOs Commission Staff proposes that participating utilities submit a single volume-weighted average annual price for energy and for capacity Commission Staff recognizes that in the regions outside of ISORTO markets as in the ISORTO markets some of the wholesale prices that are reported in the Electronic Quarterly Reports include cost-based transactions that reflect cost allocation decisions of regulators as well as market-based transactions Also wholesale power prices reflect fuel prices that are a function of global and nationwide price trends that are beyond the control of utilities To address these matters the metric could be developed to include market-based transactions only and to hold fuel prices constant in a fuel-adjusted price metric40 Commission Staff further recognizes that utilities provide a series of peak off-peak and year-round wholesale power products and therefore utilities will need to volume-weight each of these products into a single average annual price for energy and for capacity in addition to reporting peak and off-peak prices Commission Staff also requests comments on whether seasonal prices provide useful information on utility performance In light of the fact that Commission Staff is now proposing a price metric for the first time and therefore there has not been an opportunity for a full and complete discussion among stakeholders of the pros and cons of various price metric options Commission Staff is not including a price metric on the list of recommended metrics in Appendix A Rather Commission Staff recommends that participating utilities discuss in their 2012 reports their perspectives on a wholesale price metric Based on these perspectives and further discussions with interested stakeholders Commission Staff intends to recommend a price metric that participating utilities will submit in their next report following the report that is requested in this Commission Staff Report
directing filing Order No 2001-C 101 FERC para 61314 (2002) order directing filing Order No 2001-D 102 FERC para 61334 order refining filing requirements Order No 2001-E 105 FERC para 61352 (2003) order on clarification Order No 2001-F 106 FERC para 61060 (2004) order revising filing requirements Order No 2001-G 72 Fed Reg 56735 (Oct 4 2007) 120 FERC para 61270 order on rehrsquog and clarification Order No 2001-H 73 Fed Reg 1876 (Jan 10 2008) 121 FERC para 61289 (2007) order revising filing requirements Order No 2001-I 73 Fed Reg 65526 (Nov 4 2008) 125 FERC para 61103 (2008)
40 The RTO price metrics include a fuel-adjusted LMP price metric
14
20121015-4003 FERC PDF (Unofficial) 10152012
Docket No AD12-8-000
3 Discussion of Individual Metrics The two major categories of performance metrics are reliability and systems operations measures The reliability metrics were chosen to measure the reliability of day-to-day operations using metrics such as compliance with national and regional reliability standards the real-time balance of supply and demand forecasting and Special Protection Schemes and to measure long-term reliability using metrics such as long-term transmission and resource planning The systems operations measures were chosen to measure the operating performance of utilities in non-ISORTO regions using metrics such as system resource and transmission availability and system lambda a National and Regional Reliability Standards Compliance Metrics i Performance Metric This metric measures the number of violations of national and regional reliability standards provides information on how these violations were reported and indicates the severity of the violations41 The metric also details unserved energy (or load shedding) caused by violations and requires a utility to provide additional details on the number of events the duration of the events whether the events occurred during onoff peak hours and information on the equipment types affected and the kilovolts of lines affected
Consistent with the 2010 ISORTO Metrics Report the text of the metric has been revised to reflect the fact that this metric is a quantification of all NERC and Regional Reliability Organization standard violations that have been identified during an audit or as a result of a self-report and have been published as part of that process42 Additionally the text of the metric has been revised to clarify that utilities located in regions outside of ISOs and RTOs should limit reporting to the same eight functional areas used by the IS 43Os and RTOs
41 A full listing of the reliability standards is provided at
httpwwwnerccompagephpcid=2|20
42 2011 ISORTO Metrics Report Docket No AD10-5-00 at 12 (August 31 2011)
43 The eight functional areas are as follows 1) Balancing Authority 2) Interchange Authority 3) Planning Authority 4) Reliability Coordinator 5) Resource Planner 6) Transmission Operator 7) Transmission Planner and 8) Transmission Service Provider
15
20121015-4003 FERC PDF (Unofficial) 10152012
Docket No AD12-8-000
ii Comments
Multiple TDUs assert that the Commission and NERC would benefit from the collection of data regarding events when Footnote b44 is invoked and utilities interrupt non-consequential Firm Demand Multiple TDUs state that there should not be any dispute about the utility of this information and note that the Commission has directed NERC to collect information regarding the specific circumstances and frequency with which Firm Demand is planned to be interrupted as part of the Footnote b remand process45 Multiple TDUs explain that since it is not a violation of any reliability standard to interrupt non-consequential Firm Demand if Footnote b is applicable National or Regional Reliability Standards Compliance metrics will not encompass events where Footnote b is involved Multiple TDUs believe that the collection of the following categories of data would facilitate further discussion at the Commission and NERC (1) the number of incidents in which the utility relies on Footnote b in order to interrupt non-consequential Firm Demand (2) information concerning the severity of these incidents and whether there are systemic problems with the transmission system and transmission plan46 and (3) information concerning whether interrupted wholesale
44 Footnote b refers to a petition filed by the North American Electric Reliability Corporation (NERC) seeking approval of Table 1 Footnote b of four Reliability Standards Transmission Planning TPL-001-1ndash System Performance Under Normal (No Contingency) Conditions (Category A) TPL-002-1b ndash System Performance Following Loss of a Single Bulk Electric System Element (Category B) TPL-003-1a ndash System Performance Following Loss of Two or More Bulk Electric System Elements (Category C) and TPL-004-1ndash System Performance Following Extreme Events Resulting in the Loss of Two or More Bulk Electric System Elements (Category D) While Footnote b appears in all four of the above referenced TPL Reliability Standards its relevance and practical applicability is limited to TPL-002-0a See Transmission Planning Reliability Standards Order No 762 139 FERC para 61060 at P 1 amp n2 (2012) Footnote b states
Planned or controlled interruption of electric supply to radial customers or some local Network customers connected to or supplied by the Faulted element or by the affected area may occur in certain areas without impacting the overall reliability of the interconnected transmission systems To prepare for the next contingency system adjustments are permitted including curtailments of contracted Firm (non-recallable reserved) electric power Transfers
Id P 3
45 Multiple TDUs Comments at 9 (citing Order No 762 139 FERC para 61060 at P 20)
16
20121015-4003 FERC PDF (Unofficial) 10152012
Docket No AD12-8-000
transmission customers of the reporting transmission provider have notice and understanding before the interruption Multiple TDUs recognize that Footnote b is in flux and as a result urge the Commission to revisit the metrics associated with Footnote b after Footnote b is revised47
In reply to Multiple TDUs EEI argues that situations in which Footnote b is invoked are clearly contemplated under section A7 of the Reliability metrics proposed in the Commission notice48
NIPPC argues that the Commission should consider expanding the reliability standards metrics to include the number of dispatch orders issued to generators to curtail output and the specific reasons for each of those dispatch orders as a dispatch order made to a generator to avoid or mitigate a reliability violation will have the same impact on a market as a reliability violation NIPPC also argues that the metrics should include the number of and justification for schedule curtailments (or e-tag curtailments) NIPPC further maintains that the metrics should compare the percentage of the dispatch orders or schedule curtailments issued to independent power producers to the percentage of independently owned generation capacity interconnected to the transmission providerrsquos system49 iii Response
While Reliability metric A7 captures situations where Footnote b is invoked
Commission Staff concludes that for purposes of clarity it would be beneficial to have a separate metric to address the planned Firm Demand interruptions that planners use to meet the system performance requirements of TPL-002-2b Table 1 for Category B single contingency events (ie Footnote b interruptions as discussed in Order No 762) and that the metric should track the number severity and duration of these incidents This information is a good performance measure because it could expose an area of weakness in the Bulk Electric System that may need to be addressed with a capital project or an appropriate operating procedure Commission Staff recommends that in the narrative that accompanies the metrics report participating utilities discuss the actions taken to address the interruptions and the notice utilities provide customers before interruptions are made
46 We note that this request is discussed in our response infra at pp 19-20
47 Multiple TDUs Comments at 10-11
48 EEI Reply Comments at 4
49 NIPPC Comments at 4
17
20121015-4003 FERC PDF (Unofficial) 10152012
Docket No AD12-8-000
Responding to NIPPC the reliability standards metrics are limited to providing information on reliability violations Actions taken by transmission providers to curtail the dispatch of generators or adjust transmission schedules (or e-tags) are relevant to the dispatch reliability metrics discussed below As discussed in that section Commission Staff is recommending that participating utilities include narratives on all actions they take to manage dispatch reliability Commission Staff is not recommending that this information be incorporated into metrics because not all participating utilities take these actions and there are no standardized measures for these activities With respect to NIPPCrsquos request that a metric be developed to measure transmission schedule adjustments or e-tag revisions we note that these actions are the result of transmission loading reliefs (TLR) or Unscheduled Flow Relief events that are being reported in the Dispatch Reliability measure below and are already covered by the metrics For this reason Commission Staff does not recommend adding this metric
b Dispatch Reliability i Performance Metrics Dispatch reliability is measured by three metrics The proposed metrics listed in the notice retained two of the metrics used to measure dispatch reliability in ISOs and RTOs (1) Balancing Authority Area Control Error Limit or Control Performance Standard 1 and Control Performance Standard 2 and (2) Energy Management System Availability The proposed metric relating to TLR or Unscheduled Flow Relief Events would measure the number of events ndash rather than the hours as is reported in the performance metrics for ISOs and RTOs ndash of TLRs (of severity level 3 or higher) or unscheduled flows called by the incumbent transmission provider Utilities that are part of the Western Electricity Coordinating Council (WECC) will report events under the WECC Unscheduled Flow Mitigation Procedure that are equivalent to the NERC TLR Level 3 ii Comments
EPSA contends that in order to properly identify problem areas the Commission should require each transmission provider to identify the length and magnitude of each TLR event EPSA states that at a minimum each transmission owner should provide the following information (1) how long each constrained element is subject to a continuous Level 3 or higher TLR in hours (2) the number of MW of network transmission service curtailed for each continuous TLR event and for all continuous TLR events in total (3) the number of MW of firm point-to-point transmission service curtailed for each continuous TLR event and in aggregate and (4) the number of MW of non-firm transmission service curtailed per continuous TLR event and in aggregate50 EPSA
50 EPSA Comments at 3-4
18
20121015-4003 FERC PDF (Unofficial) 10152012
Docket No AD12-8-000
further states that monitoring and tracking TLR events on a system that are categorized at level 1 or 2 can provide additional insights into system dynamics as those events can be prevented by nodal market designs that dispatch around binding constraints using congestion prices Additionally EPSA states that all TLR events at level 5 or higher should be tracked and reported separately from all other TLR events as TLR events at this level indicate a severely constrained system EPSA recommends that the metrics include a metric for reporting all congestion management events ndash not only those categorized as a TLR ndash because some areas rely on a variety of other congestion management techniques EPSA further recommends including an evaluation of the number and severity level of all congestion management events of a utility or transmission system with the changes discussed above51 iii Response
Commission Staff agrees with EPSA that the metric concerning TLR should measure the duration of such events Accordingly Commission Staff recommends that the TLR metric be revised to measure the hours of TLR called by the incumbent transmission provider Commission Staff notes that this revision will result in a metric that is consistent with the metrics for ISO and RTO markets
Commission Staff does not consider information on severity level 1 and 2 events
to be measures of utility reliability performance Such events by definition only impact local area operations and as a result will not impact system reliability For this reason TLR events of level 3 and above are systemic events and are the appropriate basis for a performance metric for system reliability For TLR events of severity level 3 and above Commission Staff agrees with EPSA that the TLRUnscheduled Flow Relief metric should be supplemented with information on TLR (or Unscheduled Flow Relief) events for each severity level energy curtailment data on the number of MW curtailed and duration of curtailment information Such information along with a discussion by the participating utility of the impact of curtailments on customers and the various resource types will allow for a better informed evaluation of performance52 For this reason we
51Id at 5
52 We note that in Order No 890 the Commission concluded that requiring transmission providers to post additional information on curtailments was necessary to provide transparency and enable customers to assess whether they have been treated without undue discrimination See Preventing Undue Discrimination and Preference in Transmission Service Order No 890 FERC Stats amp Regs para 31241 at P 1626 order on rehrsquog Order No 890-A FERC Stats amp Regs para 31261 (2007) order on rehrsquog Order No 890-B 123 FERC para 61299 (2008) order on rehrsquog Order No 890-C 126 FERC para 61228 (2009) order on clarification Order No 890-D 129 FERC para 61126 (2009) For
19
20121015-4003 FERC PDF (Unofficial) 10152012
Docket No AD12-8-000
recommend that this information be included in the narrative discussions that accompany the (TLRUnscheduled Flow Relief) metric to the extent the information is available
With respect to EPSArsquos request for metrics on all congestion management activities such as Local Area Protocols Commission Staff recommends that participating utilities provide narratives on the use of Local Area Protocols out-of-merit dispatches and other techniques to resolve system dispatch reliability problems Such information will provide a context for the role played by TLRs or Unscheduled Flow Reliefs thereby providing the basis for a more comprehensive assessment of constraint management by the participating utility Since not all participating utilities use these techniques and the definitions of these techniques may differ among utilities Commission Staff does not consider this information to be appropriate for standardized metrics c Load Forecasting Accuracy
Actual peak load as a percentage variance from forecasted peak load as reported in a transmission providerrsquos OASIS measures the effectiveness of the load forecasting function of utilities in non-ISORTO regions Since load forecasting provides the basis for resource commitment this metric impacts the incurrence of resource costs The more accurate a utility is in forecasting load the greater the likelihood that it can commit sufficient resources in a cost effective manner that avoids over-commitment of resources inefficient commitment of short lead-time resources or under-utilization of available resources This metric measures the percentage difference between actual peak load and forecasted peak load No comments were submitted on this metric d Wind Forecasting Accuracy i Performance Metric This metric measures the percentage accuracy of actual wind availability compared to forecasted wind availability Improving the accuracy of the wind forecast will facilitate the timely commitment and dispatch of sufficient supplemental resources ii Comments NIPPC maintains that the Commission should clarify whether this metric applies to the wind generation assets controlled by the merchant function of the transmission provider or to the independently owned and operated wind generation interconnection to
TLR events of severity level 3 and above Commission Staff recommends including a narrative explanation of why transactions could not be continued or completed similar to what is required by Order No 890 Id P 1627
20
20121015-4003 FERC PDF (Unofficial) 10152012
Docket No AD12-8-000
the transmission providerrsquos system NIPPC argues that the metric should not extend to generators not owned or controlled by the merchant function of the transmission provider in light of the market-sensitive nature of a generatorrsquos wind forecasting accuracy and scheduling practices53 NIPPC also urges the Commission to consider expanding this metric to require a transmission provider to report whether it has implemented a centralized wind forecast system for use in its operations and if so to collect additional metrics on the accuracy of that centralized forecast54 NIPPC contends that a single metric comparing actual wind output to forecast output over the reporting period is not a useful metric as inaccuracies in the forecast may cancel out over a long reporting period NIPPC argues that a more relevant measure of accuracy would be the number of hours during the reporting period that the forecast is accurate (where the forecast is within five percent of actual output) NIPPC also suggests that the following additional metrics would be useful (1) the MW of windsolar capacity subject to the forecast (2) granularity of the forecast (monthly weekly daily hourly sub-hourly) (3) whether the forecast is integrated into the transmission providerrsquos operations (4) whether the transmission provider shares the forecast with market participants (or generation owners) and (5) an equivalent metric for forecasts associated with solar energy and hydroelectric energy55 iii Response The wind accuracy metric was intended to apply to all wind resources ndash owned and non-owned ndash on the transmission providersrsquo systems Commission Staff does not recommend excluding wind generators not owned or controlled by transmission providers from the wind accuracy metric To be an effective tool to ensure system reliability this metric must measure the accuracy of forecasts that account for all wind resources in a utilityrsquos footprint This requirement is increasingly important as wind resources become a more significant portion of total resource output When wind generators ndash including those not owned or controlled by the utility ndash provide wind availability forecasts they are performing a reliability function that has implications for system reliability management and planning Accordingly Commission Staff considers this information to be an important element in an assessment of a utilityrsquos reliability performance We encourage participating utilities to work with wind generators not owned or controlled by the utility to ensure that the data gathered and reported protects market-sensitive information from
53 NIPPC Comments at 5
54 Id
55 Id at 5-6
21
20121015-4003 FERC PDF (Unofficial) 10152012
Docket No AD12-8-000
being reported in public reports or released to utility subsidiaries that compete with these wind generators Commission Staff agrees with NIPPC that to the extent that centralized forecasting can minimize integration costs this information is an indication of utility performance Therefore Commission Staff recommends that participating utilities discuss their forecasting process in their reports With respect to NIPPCrsquos concern that inaccuracies in the forecast may cancel out Commission Staff notes that the wind accuracy forecast will be based on the mean absolute error of the forecast compared to actual wind availability Therefore all errors ndash positive and negative ndash will be measured and will not cancel out Since the proposed metric will measure the magnitude of forecast inaccuracies Commission Staff considers the proposed metric to be superior to the alternative proposed by NIPPC that only indicates the number of hours in which a forecast is outside a five percent threshold Further responding to NIPPC Commission Staff notes that forecast accuracy will be based on a comparison of the day-ahead forecast to actual availability Commission Staff also notes that the capacity of wind and solar subject to the forecast which NIPPC requests be an additional performance metric is included in the Clean Energy metric discussed below Commission Staff is not recommending the inclusion of a metric measuring the accuracy of forecasts for other variable energy resources because many utilities do not perform these forecasts or they are not performed according to a standardized process Nevertheless Commission Staff considers it appropriate that participating utilities provide narrative descriptions of their solar and hydro forecasts to the extent these resources are significant sources of energy to allow for a more complete assessment of forecasting performance e Unscheduled Flows Metric Unscheduled flows are defined as the difference between net actual interchange (actual power flow measured in real time) and net scheduled interchange The two components of unscheduled flows are inadvertent energy defined to be the difference between actual and scheduled interchange for all interties and parallel flow (or loop flow) defined to be the actual power flow on a contract path within an interconnection from one Balancing Authority Area to a second Balancing Authority Area through ldquoparallelrdquo transmission lines through a third Balancing Authority Area Parallel flows are a function of the interconnectionrsquos operating configuration line resistance and physics Unscheduled flows provide information relevant to operation planning because curtailments may occur when unscheduled flows exceed system operating limits This metric is measured by the difference between net actual interchange (actual measured power flow in real time) and the net scheduled interchange in MWh as reported in a
22
20121015-4003 FERC PDF (Unofficial) 10152012
Docket No AD12-8-000
utilityrsquos FERC Form No 714 ldquoAnnual Electric Balancing Authority Area and Planning Area Reportrdquo No comments were received on this metric f Transmission Outage Coordination i Performance Metric
The transmission outage coordination metric measures the percentage of outages planned and unplanned that occur with less than two days notice Effective transmission outage coordination will result in early notification of outages and therefore will be indicated in the metrics as a low percentage of short notice outages56 Effective transmission outage coordination by utilities in non-ISORTO regions ensures that outages do not threaten system reliability and that additional and potentially more expensive resources do not need to be committed
ii Comments ESPA recommends that the performance metrics track a utilityrsquos transmission outage performance EPSA states that the information posted on OASIS is valuable information and requests that the Commission include information regarding any transmission outages known ahead of time including the time and date of the planned outage and the planned duration of the outage57 EPSA maintains that providing this information would allow market participants to evaluate the information concerning the proposed outage and make other arrangements if necessary or otherwise take proactive steps to reduce the impact of any such planned outage EPSA states that outage performance information would also give the Commission and other observers the opportunity to evaluate how well the utility or transmission owner can schedule outages and execute that schedule58
iii Response
Commission Staff agrees with EPSA that the transmission outage metrics should include information to measure the utilitiesrsquo ability to plan for outages and successfully execute their outage plan As stated in the Commission Staff Report on ISORTO Performance Metrics effective transmission outage coordination is defined as early
56 The proposed metrics will measure outages for major transmission facilities
which are defined for purposes of the metrics as 200kV and higher
57 EPSA Comments at 7-8
58 Id at 8
23
20121015-4003 FERC PDF (Unofficial) 10152012
Docket No AD12-8-000
notification of planned outages of five days or longer ndash ie notification at least one month prior to the outage commencement date ndash and timely review of outage impacts59 Also effective transmission outage coordination is measured by the percentage of planned outages that are canceled due to conflicting planned outages as well as forced (unscheduled) outages that could cause reliability issues and additional congestion costs Commission Staff recommends adding these metrics for outages on major transmission lines of 200kV and higher to be consistent with the metrics for ISOs and RTOs60 g Long-Term Reliability Planning ndash Transmission i Performance Metric The proposed metric tracks the dollar amount of transmission facilities approved to be constructed for reliability purposes the percentage of approved construction completed the number of requests for and completed reliability studies and a narrative detailing a utilityrsquos economic study process This information measures the ability of each utilityrsquos expansion planning process to identify reliability and economic needs in advance which is essential to ensuring that market participants have sufficient time to develop either transmission or resource solutions to system reliability and economic requirements The metric also includes a narrative discussion of the transmission planning stakeholder process ii Comments Multiple TDUs state that a metric related to planning and completion of economic transmission is needed for multiple reasons First vertically-integrated transmission
59 Staff Report at 25
60 See Staff Report at Appendix B Peformance Metric F1 (Oct 21 2010) (Percentage of gt 200kV planned outages of 5 days or more that are submitted to ISORTO at least 1 month prior to the outage commencement date) We note that in Revisions to Electric Reliability Organization Definition of Bulk Electric System and Rules of Procedure Notice of Proposed Rulemaking 77 Fed Reg 39846 139 FERC para 61247 (2012) the Commission proposed to approve a modification to the currently-effective definition of ldquobulk electricrdquo systemrdquo that would establish a bright-line threshold that includes all facilities at or above 100 kV Commission Staff still considers it reasonable to require a 200 kV minimum for reporting information related to outages for performance metrics purposes particularly since this 200 kV minimum is consistent with the threshold ISOsRTOs used in their prior metric reports Nevertheless Commission Staff will monitor responses under this metric and continue to evaluate whether this is the appropriate threshold
24
20121015-4003 FERC PDF (Unofficial) 10152012
Docket No AD12-8-000
providers have inherent incentives to discriminate and underperform when performing this function Multiple TDUs state that the Commission has recognized as much and that such a metric would help measure the efficacy of the remedies that the Commission adopted in Order No 890 to address this concern61 Second the economic costs of transmission constraints are not transparent in areas without centralized markets like those found in ISOs and RTOs with congestion pricing Third more specificity is needed because a vertically-integrated transmission owner reporting on transmission construction and identifying shortfalls would be identifying its own unsuccessful outcomes62 Multiple TDUs argue that merely requiring vertically-integrated transmission providers to provide a narrative detailing their economic studies process as is proposed will elicit little more than a repetition of the planning process descriptions that were filed in compliance with Order No 890 For these reasons Multiple TDUs argue that the transmission planning and construction metric should be expanded to include the dollar amount of facilities constructed for purposes whose predominant purpose was not reliability broken down between (a) economic (b) public policy (c) facilities to support the planned generation resources of the transmission provider or its affiliates (d) transmission or interconnection requests made by the transmission provider or its affiliates and (e) in response to requests from others Multiple TDUs state that the metrics should also include the number of transmission construction projects that were added to the transmission provider construction plans between the issuance of Order No 890 and the submission of the report broken down into categories (a) through (e) and into their current status (ie completed incomplete and on schedule incomplete and behind schedule and removed from plan) EEI argues that the Multiple TDUsrsquo request is unwarranted EEI maintains that due to the low incidence of economic study requests requiring such additional reporting will create an added and unnecessary burden to reporting utilities63 Multiple TDUs also state that the metric should include a narrative assessment supported by quantitative information of the transmission providerrsquos planning process efficacy64 Similarly EPSA argues that the performance metrics should include a metric
61 Multiple TDUs Comments at 6 (citing Order No 890 FERC Stats amp Regs para
31241) 62 Id at 6-7
63 EEI Reply Comments at 4
64 Multiple TDUs Comments at 7-8
25
20121015-4003 FERC PDF (Unofficial) 10152012
Docket No AD12-8-000
detailing how well a utility executes its transmission development plans EPSA explains that a utilityrsquos failure to follow its transmission plan can adversely impact customers and merchant generators Thus EPSA maintains that a metric assessing how well a utility executes its transmission plan would provide valuable information including a demonstration of how prepared a utility is to meet any future reliability needs on its system65 iii Response
Commission Staff does not recommend adding the metrics proposed by Multiple TDUs on non-reliability transmission and interconnection projects The purpose of this metric is to assess the extent to which transmission solutions are analyzed planned and deployed to meet reliability requirements Thus additional information to examine discrimination by utilities or to obtain information on all project spending including projects to meet public policy objectives would go beyond the scope of the metric The congestion issues of concern to Multiple TDUs including the impact of transmission planning on congestion are discussed further below in the Congestion Management metric
Commission Staff agrees with commenters that additional information is needed
however in the transmission planning metrics to provide a more comprehensive assessment of transmission planning performance and to allow for comparisons between ISOs and RTOs and participating utilities in regions outside of ISOs and RTOs Accordingly Commission Staff recommends additional information be included in the metrics as follows (1) the proposed dollar amount of facilities approved to be constructed for reliability purposes should be revised to also include the number of facilities so that this metric is comparable to the relevant ISORTO performance metric (2) the proposed percentage of approved construction completed metric should be revised to the percentage of approved construction on schedule and completed and (3) the proposed narrative detailing the economic studies process should be revised to a metric that measures the percentage completion of economic projects
Responding to EEI Commission Staff does not find that it would be unduly
burdensome to incorporate both the number of economic study requests and the number of economic studies accomplished into a narrative explanation of the status of planning for economic expansions Economic projects can reduce congestion which in turn can reduce costs to customers and decrease the likelihood that reliability issues will occur Therefore this information provides an important indicator on the progress made by utilities in improving the efficiency of their transmission systems
65 EPSA Comments at 7
26
20121015-4003 FERC PDF (Unofficial) 10152012
Docket No AD12-8-000
Commission Staff agrees with EPSA that the reports provided by participating utilities should also include a discussion of the status of their transmission plans Such information will allow participating utilities to explain their progress in meeting planning goals and explain the issues that may be delaying the completion of reliability and economic projects Commission Staff expects that this discussion will also address the desire of Multiple TDUs to have a narrative assessment of the efficacy of the transmission providerrsquos planning process66 and to address how utilities provide an opportunity to consider transmission needs driven by Public Policy Requirements in their planning process67
h Long-Term Reliability Transmission Planning ndash Resources
Three metrics are employed to measure the effectiveness of long-term reliability planning for resources The first metric processing time for generation interconnection requests measures the effectiveness of processes in achieving timely interconnection of new resources that are needed to ensure reliability The second metric the planned reserve margin is the planned number of MW of resources available as system reserves divided by the number of MW of peak load The third metric is a narrative discussion of demand response programs and how they are used in system planning No comments were received on this metric Commission Staff recommends that the proposed planned reserve margin metric be revised to compare the actual reserve margin to the planned reserve margin This comparison will allow for an evaluation of utility performance in achieving the planned reserve margin
i Infrastructure Investment ndash Interconnection and Transmission Process Metrics
i Performance Metric
These metrics track the progress that utilities have made in regions outside of ISOs and RTOs in completing their reliability reviews ndash namely feasibility system impact and
66 We note that this narrative assessment is in keeping with the Commissionrsquos
requirement that public utility transmission providers make available information regarding the status of transmission upgrades identified in their transmission plans See Transmission Planning and Cost Allocation by Transmission Owning and Operating Public Utilities Order No 1000 FERC Stats amp Regs para 31323 at P 159 amp n154 (2011)) order on rehrsquog Order No 1000-A 139 FERC para 61132 (2012)
67 Order No 1000 FERC Stats amp Regs para 31323 at P 203
27
20121015-4003 FERC PDF (Unofficial) 10152012
Docket No AD12-8-000
facility studies ndash of interconnection and transmission service requests in a timely and efficient manner The metrics track the number of requests the time required to complete the reliability reviews and the costs of completing each of the three types of studies There is also a metric that measures the number of transmission access denials and transmission service request denials The purpose of this metric is to provide information on the magnitude and reasons for transmission service denials and whether additional infrastructure investment is needed to avoid transmission service denials ii Comments Multiple TDUs state that the Commission should collect additional information on the completion of transmission studies Multiple TDUs state that while the metrics for ISOs and RTOs require the reporting of information on studies such measures are omitted from the draft metrics for regions outside of ISOs and RTOs without explanation Multiple TDUs argue that such metrics are even more important than in the ISO and RTO context and that it would be worth obtaining from vertically-integrated transmission providers all of the study completion metrics that ISOs and RTOs are required to produce Multiple TDUs explain that the cost of collecting and providing this information should not be inordinate and that transmission providers should already have expense tracking mechanisms in place to estimate and bill study costs Multiple TDUs state that the following additional metrics would be worth collecting from vertically-integrated transmission providers (1) percentages of long-term transmission service requests and interconnection requests that triggered study requirements (2) percentages of the studies undertaken that led to the identification of upgrade costs (3) the average estimated upgrade cost (4) the percent of transmission service requests withdrawn and the percent approved and (5) the average processing time through each process milestone identified in the transmission providerrsquos Order No 890 compliance tariff provisions such as completion of a feasibility study system impact study and facilities study Multiple TDUs claims that such information would help the Commission identify situations in which impediments to obtaining transmission or interconnection service warrant further investigation68 Multiple TDUs state that the addition of a metric concerning the number of transmission access denials or transmission service requests denied is less meaningful than it first appears Multiple TDUs explain that under the pro forma Open Access Transmission Tariff long-term transmission service requests cannot be legitimately denied instead if there is no existing transmission capability available to accommodate the request the requester is supposed to be informed that meeting the request would require additional facilities and offered the opportunity to fund studies to determine what
68 Multiple TDUs Comments at 5
28
20121015-4003 FERC PDF (Unofficial) 10152012
Docket No AD12-8-000
upgrades are needed Multiple TDUs state that a metric tracking how often entities requesting service withdraw their request for service in the face of these requirements would be worthwhile but that the proposed metric might not elicit such information69 Accordingly Multiple TDUs suggest revising the metric to require entities to report the number of long-term transmission service requests for which ATC was initially found to be unavailable and the disposition of each request with each of these points broken down between requests made by third-party transmission customers and requests made by affiliates or divisions of the transmission provider70
NIPPC contends that the Commission should require transmission operators to
report information concerning the pace of large generator interconnections including the total number of pending interconnection requests the number of pending requests in each phase of the LGIA process and the number of requests in each phase that have experienced delays in completing that phase of the interconnection process along with a narrative describing the causes of those delays71 iii Response Commission Staff agrees with Multiple TDUs that the proposed metrics should include information on how long it takes participating utilities to complete interconnection and transmission studies as a measure of the efficiency of the utilityrsquos infrastructure development process Accordingly Commission Staff recommends that the performance metrics be revised to include metrics concerning the average age of incomplete studies and the average time to complete studies Commission Staff considers the time to complete all studies to be an appropriate metric to measure the efficiency of utility interconnection and transmission study processes It is expected that the narrative discussions that accompany the metrics will address issues with the various study stages and that the discussions will address the issues of concern to Multiple TDUs Commission Staff does not consider that information on the percentage of requests that trigger studies or are withdrawn will reflect utility performance The percentage of requests that trigger studies is a function of available transmission capacity not utility performance The percentage of requests withdrawn is caused by the actions of market participants ndash not utilities ndash and therefore does not measure utility performance Therefore we are not recommending the addition of this information to the metrics reports
69 Id at 8
70 Id
71 NIPPC Comments at 4-5
29
20121015-4003 FERC PDF (Unofficial) 10152012
Docket No AD12-8-000
With regard to Multiple TDUsrsquo interest in additional metrics on transmission service denials Commission Staff expects that the narrative discussions provided by participating utilities will address issues of concern to the Multiple TDUs such as the disposition of requests for service Commission Staff notes however that this metric is not intended to measure ATC or transmission capacity in general Rather the purpose of tracking transmission service denials is to provide an additional measure of the efficiency of utilities in processing requests for transmission service and therefore is intended to be evaluated in the context of the other infrastructure investment processing metrics This information combined with explanations provided by the utilities in their narrative discussion will provide the basis for a comprehensive assessment of how utilities are managing their infrastructure development process Commission Staff does not recommend adding a metric concerning the number of pending generation interconnection requests as requested by NIPPC By measuring the time it takes utilities to complete their studies for interconnection and transmission service the proposed metric appropriately focuses on the efficiency of a utilityrsquos processing of service requests ndash irrespective of the total number of requests Also since many interconnection requests in a utilityrsquos interconnection queue may not be ready to proceed because of commercial issues and other factors beyond the control of utilities the number of pending interconnection requests is not an appropriate measure of utility performance As has been the case in the ISORTO performance metrics reports Commission Staff expects that the narrative discussion that accompanies the utility metrics on interconnections and transmission service will explain the status of their request queues and reasons for delays j Special Protection Systems Special Protection Systems72 are automatic protection systems designed to detect abnormal or predetermined system conditions and take corrective actions such as changing demand generation or system configurations in order to maintain system stability acceptable voltage levels or maintain power flows These metrics measure the performance of such Special Protection Systems based on the definition of Special Protection Systems utilized by the reporting entityrsquos Regional Entity These metrics measure both the frequency with which the region relies on these systems and their effectiveness as measured by successful activations and the number of unintended activations No comments were submitted on this metric
72 Special Protection Systems are also referred to as Special Protection Schemes
Remedial Action Schemes (RAS) or System Integrity Protection Schemes (SIPS)
30
20121015-4003 FERC PDF (Unofficial) 10152012
Docket No AD12-8-000
k Demand Response Entities responding to this metric will be required to provide a comprehensive explanation of the nature of utility demand response programs implemented for load management as well as in compliance with state requirements There were no comments on this metric l System Lambda System lambda is the incremental cost of energy of the marginal unit assuming no system constraints This metric tracks the trend in marginal fuel costs and is an important metric since fuel costs represent the largest component of wholesale energy costs The system lambda metric would not apply to utilities where the marginal price is typically set by hydro units Also system lambda data will be based on information contained in FERC Form No 714 There were no comments on this metric m Congestion Management i Performance Metric Congestion represents the cost to customers of paying for more expensive energy because physical transmission line limits do not allow full delivery of least-cost energy Entities responding to this metric would be required to provide a congestion analysis consistent with Order No 890 In Order No 890 the Commission adopted a planning principle requiring transmission providers to prepare studies identifying ldquosignificant and recurringrdquo congestion and post such studies on their OASIS The Commission explained that the studies should analyze and report on the following items (1) the location and magnitude of the congestion (2) possible remedies for the elimination of the congestion in whole or in part (3) the associated costs of congestion and (4) the cost associated with relieving congestion through system enhancements (or other means)73 ii Comments Multiple TDUs argue that merely requiring vertically-integrated transmission providers to provide a narrative detailing their economic study processes as is proposed will elicit little more than a repetition of the planning process descriptions that were filed in compliance with Order No 890
73 Order No 890 FERC Stats amp Regs para 31241 at PP 529 542
31
20121015-4003 FERC PDF (Unofficial) 10152012
Docket No AD12-8-000
iii Response Commission Staff recommends that utilities discuss the status of their transmission plans as explained in the Long-Term Transmission Planning Metrics discussed above Commission Staff expects that these discussions will address expansion plans to resolve congestion issues on their systems Therefore Commission Staff expects that the performance reports submitted by utilities will provide substantive information on congestion management n Resource Availability i Performance Metric
The proposed metric measures the percentage of time that system resources are not available because of unplanned outages as measured by the system forced outage rate No comments were submitted on the metric
ii Response Commission Staff recommends that this metric be revised to be 1 minus the
system forced outage rate Revising the metric as recommended will measure unforced capacity availability and therefore resource availability This revision will also make this metric comparable to the performance metric adopted for ISOs and RTOs Resource availability is an indication of system efficiency and cost management by utilities in regions outside of ISOs and RTOs Higher resource availability can result in the commitment of fewer peak resources (or the importation of peak supplies) that potentially have high costs thereby resulting in reduced costs o Transmission System Availability This metric measures interrupted load MWh as a percentage of load served In light of the many factors that can result in load interruptions some of which are beyond the control of utilities the narrative detailing the reasons for load interruptions will be essential in assessing performance No comments were submitted on this metric p Fuel Diversity
This metric is defined to be the percentage mix of fuel types installed and available (capacity fuel diversity) and produced (generation fuel diversity) Fuel diversity provides an indication of a utilityrsquos capability to integrate fuels with different characteristics such as lower costs or lower environmental impacts No comments were submitted on this metric
32
20121015-4003 FERC PDF (Unofficial) 10152012
Docket No AD12-8-000
q Clean Energy i Performance Metric
These metrics measure the use of ldquoclean energyrdquo74 The metrics track number of MWh of clean energy by resource type as a percentage of total energy and the number of MW of clean energy by resource type as a percentage of total capacity
ii Comments NIPPC states that the Commission should expand the clean energy metric to include information related to curtailments of clean energy resources as frequent curtailments of these resources by a transmission operator may reflect a dysfunction in the generation market since these resources have no fuel costs NIPPC explains that the metric should include the number of curtailments the duration of each curtailment the number of MW hours curtailed and the justification for the curtailment75 iii Response Commission Staff does not consider curtailments of clean energy to be a measure of the diversity of a utilityrsquos resource mix Rather curtailments of resources ndash or more accurately schedule adjustments or manual redispatch instructions by transmission providers ndash are used to maintain system reliability We note that the diversity metrics in conjunction with the narratives regarding actions taken to manage dispatch reliability and TLR (see pages 18-19 infra) will provide a basis for a comprehensive view of the issue of clean energy
D Burden Estimate
1 Information Collection Statement In its solicitation for comments Commission Staff estimated the public reporting
burden for participating utilities to be approximately 140 hours per respondent for each report
74 Clean Energy is defined to include nuclear energy and variable energy
resources including solar wind hydro geothermal and biomass resources
75 NIPPC Comments at 6
33
20121015-4003 FERC PDF (Unofficial) 10152012
Docket No AD12-8-000
2 Comment EEI asserts that the response time could be as high as 300-400 hours
3 Response
Commission Staff will adjust the burden estimate based on EEIrsquos high estimate of 300-400 hours Commission Staff considers EEIrsquos estimate to be reflective of the most time that it would take an entity to respond to the metrics While Commission Staff recognizes that this report requires additional metrics and narrative discussions Commission Staff nevertheless continues to conclude that 140 hours still represents a reasonable estimate of the burden since much of the data required should be readily available to the responding utilities However in recognition of the fact that the burden will vary from entity to entity we will revise our estimate to 245 hours per respondent which is the mid-point between these estimates
E Information Collection Statement Information Collection Statement
The following collection of information contained in these metrics is subject to
review by the Office of Management and Budget (OMB) under section 3507 of the Paperwork Reduction Act of 199576 OMBrsquos regulations require approval of certain information collection requirements imposed by agency actions77 The Commission cannot conduct this information collection unless it displays a valid OMB control number78
The collection of information requires those public utilities outside of ISOs and RTOs that choose to participate to provide information responding to the attached metrics on a periodic basis This includes the submission of price data and information relating to reliability transmission planning requests for service and system capacity The
76 44 USC sect 3507 (2006) The Paperwork Reduction Act requires OMB
approval of certain information collection activities when these activities apply to 10 or more persons Because it is estimated that 11 entities will respond to this collection the Chairman is requesting approval from OMB
77 5 CFR sect 1320 (2012)
78 The Commission is issuing a separate notice regarding the collection of information that will be published in the Federal Register to comply with the OMB requirements at 5 CFR sect 13205(a)(iv)
34
20121015-4003 FERC PDF (Unofficial) 10152012
Docket No AD12-8-000
information submitted by participating utilities would be used to help develop a common set of metrics for both ISORTO markets and non-RTOISO markets and for evaluating market performance thereafter
35
20121015-4003 FERC PDF (Unofficial) 10152012
Docket No AD12-8-000
Burden Estimate The estimated public reporting burdens for the reporting
requirements have been adjusted as described above
FERC-922 Requirements
Number of Respondents
Annually (1)
Number of
Responses per Respondent
(2)
Average Burden Hours per Response
(3)
Total Annual Burden Hours
(1)x(2)x(3) Metrics Data Collection
140 1540
Write Performance Analysis
85 935
Management Review
11 1
20 220
Total 245 2695
Cost to Comply The Chairman has projected the cost of compliance to be $184460 Technical Expertise = $168300 (1540 hours data collection + 935 hours report completion $68 per hour) Management Review = $17160 (220 hours report review $78 per hour) Cost per hour figures are calculated using BLS data79 The technical expertise category factors in the median wage for an engineer analyst attorney and economist The management category factors in the median wage for general and operations managers Based on BLS data80 both cost figures have been adjusted to include benefits (benefits represent 295 percent of the total hourly figure)
Title FERC-922 Non-RTOISO Performance Metrics
Action Proposed Collection
OMB Control No TBD
79 See httpblsgovoescurrentnaics3_221000htm
80 See httpwwwblsgovnewsreleaseececnr0htm
36
20121015-4003 FERC PDF (Unofficial) 10152012
Docket No AD12-8-000
Internal Review The Chairman has reviewed the proposed metrics and has determined that the metrics and data gathered thereunder are necessary These requirements conform to the Commissionrsquos need for efficient information collection communication and management within the energy industry The Chairman is assured by means of internal review that there is specific objective support for the burden estimates associated with the information collection requirements
Interested persons may obtain information on the reporting requirements by contacting the following Federal Energy Regulatory Commission 888 First Street NE Washington DC 20426 [Attention Ellen Brown Office of the Executive Director] e-mail DataClearancefercgov Phone (202) 502-8663 fax (202) 273-0873 Any further comments on the collections of information and the associated burden estimates in this proceeding should be sent to the Commission in this docket and may also be sent to the Office of Information and Regulatory Affairs Office of Management and Budget Washington DC 20503 [Attention Desk Officer for the Federal Energy Regulatory Commission] For security reasons comments to OMB should be submitted by e-mail to oira_submissionombeopgov Comments submitted to OMB should include Docket Number AD12-8-000 and FERC-922
37
20121015-4003 FERC PDF (Unofficial) 10152012
Docket No AD12-8-000
38
IV Appendix
20121015-4003 FERC PDF (Unofficial) 10152012
Docket No AD12-8-000 39
Performance Metric Specific Metric(s) Reliability A National or Regional
Reliability Standards Compliance
1 References to which Electricity Reliability Organization (ERO) and Regional Reliability Organization (RRO) standards are applicable 2 Number of violations self-reported and made public by NERCFERC 3 Number of violations identified and made public as RRO or ERO audit findings 4 Total number of violations made public by NERCFERC 5 Severity level of each violation made public by NERCFERC 6 Compliance with operating reserve standards 7 Unserved energy (or load shedding) caused by violations Additional detail will be provided on (1) number of events (2) duration of the events (3) whether the events occurred during onoff-peak hours (4) additional information on equipment types affected and kV of lines affected and (5) number of events (and severity and duration of events) resulting in load shedding based on the utilization of TPL-002 Footnote b criteria Items 2-7 Track the ISORTO definition ldquoThis metric is a quantification of all NERC and RRO Reliability Standards violations that have been identified during an audit or as a result of an ISORTO self-report and have been published as part of that processrdquo Non ndashISORTO utilities should limit reporting to the same eight functional areas used by the ISORTOs 1 Balancing Authority 7 Transmission Planner 2 Interchange Authority 8 Transmission Service Provider 3 Planning Authority 4 Reliability Coordinator 5 Resource Planner 6 Transmission Operator
20121015-4003 FERC PDF (Unofficial) 10152012
Docket No AD12-8-000 40
B Dispatch Reliability 1 Balance Authority Ace Limit (BAAL) OR CPS1 and CPS2
2 Number of hours of transmission load reliefs (of severity level 3 or higher) called by the incumbent transmission provider or unscheduled flows
WECC entities will report events under the WECC Unscheduled Flow Mitigation Procedure (equivalent to the NERC TLR Level three)
3 Energy Management System (EMS) availability C Operational Planning ndash
Load Forecast Accuracy Actual peak load as a percentage variance from forecasted peak load as reported in OASIS
D Wind Forecasting Accuracy
Actual wind availability compared to forecasted wind availability
E Unscheduled Flows Difference between net actual interchange (actual measured power flow in real time) and the net scheduled interchange in megawatt hours Reported in Form 714
F Transmission Outage Coordination
1 Percentage of ge 200 kV planned outages of 5 days or more for which utility notified customers at least 1 month prior to the outage commencement date 2 Percentage of ge 200kV outages cancelled by utility after having been previously approved 3 Report information posted on OASIS (percentage of outages planned and unplanned with less than 2 days notice)
20121015-4003 FERC PDF (Unofficial) 10152012
Docket No AD12-8-000 41
G Long-Term Reliability Planning ndash Transmission
Dollar amount and number of facilities approved to be constructed for reliability purposes
2 Percentage of approved construction on schedule and completed
3 Performance of planning process related to
a Requests for and number of completed reliability studies
b Requests and number of completed economic studies
Discussion of stakeholder process and identification of stakeholder groups participating
H Long-Term Reliability
Planning ndash Resources 1 Processing time for generation interconnection requests 2 Actual reserve margins compared with planned reserve margins 3 Explanation of the nature and characteristics of demand response programs and how they are used in system planning Discussion of programs to facilitate the integration of renewable resources and to mitigate any issues and uncertainty associated with scheduling renewable resources
20121015-4003 FERC PDF (Unofficial) 10152012
Docket No AD12-8-000 42
I Infrastructure Investment ndash Interconnection and Transmission Process Metrics
1 Number of requests
2 Number of studies completed
3 Average age of incomplete studies
4 Average time for completed studies
5 Total cost and types of studies completed (eg feasibility study system impact study and facility study)
6 Number of transmission access denialstransmission service requests (TSRs) denied
J Special Protection
Systems 1 Number of special protection systems
2 Percentage of special protection systems that responded as designed when activated
Applicable pool of special protection systems should be based on how the reporting entityrsquos Regional Entity defines ldquospecial protection systemsrdquo
3 Number of unintended activations
20121015-4003 FERC PDF (Unofficial) 10152012
Docket No AD12-8-000 43
System Operations Measures A Demand Response Comprehensive explanation of the nature of utility demand response programs
implemented for load management as well as in compliance with state requirements B System Lambda System Lambda (on marginal unit)
Proposed System Lambda metric would not apply to utilities where the
marginal price is typically set by hydro units System lambda data will be based on Form 714 information
C Congestion Management Congestion analysis per Order No 890 D Resource Availability 1 - System forced outage rate as measured over 12 months E Transmission System
Availability Interrupted load megawatt hours as a percentage of load served
F Fuel Diversity Fuel diversity in terms of energy installed capacity and actual production G Clean Energy 1 Clean Energy megawatt hours by resource type as a percentage of total energy
2 Clean Energy megawatts by resource type as a percentage of total capacity Organizational Effectiveness Not applicable to non-RTO
entities
20121015-4003 FERC PDF (Unofficial) 10152012
Document Content(s)
Staff Report Non-RTO Metrics Final1015 2PDF1-43
20121015-4003 FERC PDF (Unofficial) 10152012
- Staff Report Non-RTO Metrics Final1015 2PDF
- Document Content(s)
-

Docket No AD12-8-000
Table of Contents
Section Page
I Backgroundhelliphelliphelliphelliphelliphelliphelliphelliphelliphelliphelliphelliphelliphelliphelliphelliphelliphelliphelliphelliphelliphelliphelliphelliphellip 4 II Notice of Filing and Responsive Pleadingshelliphelliphelliphelliphelliphelliphelliphelliphelliphelliphellip 5 III Discussionhelliphelliphelliphelliphelliphelliphelliphelliphelliphelliphelliphelliphelliphelliphelliphelliphelliphelliphelliphelliphelliphelliphellip 6
A Procedural Issueshelliphelliphelliphelliphelliphelliphelliphelliphelliphelliphelliphelliphelliphelliphelliphelliphelliphelliphellip 6 B Metrics Issueshelliphelliphelliphelliphelliphelliphelliphelliphelliphelliphelliphelliphelliphelliphelliphelliphelliphelliphelliphelliphellip7
1 General Issueshelliphelliphelliphelliphelliphelliphelliphelliphelliphelliphelliphelliphelliphelliphelliphelliphelliphelliphellip7 2 Additional Metricshelliphelliphelliphelliphelliphelliphelliphelliphelliphelliphelliphelliphelliphelliphelliphelliphellip9 3 Discussion of Individual Metricshelliphelliphelliphelliphelliphelliphelliphelliphelliphelliphellip15
a National and Regional Reliability Standardshelliphelliphellip15 b Dispatch Reliabilityhelliphelliphelliphelliphelliphelliphelliphelliphelliphelliphelliphelliphellip18 c Load Forecasting Accuracyhelliphelliphelliphelliphelliphelliphelliphelliphellip20 d Wind Forecasting Accuracyhelliphelliphelliphelliphelliphelliphelliphelliphellip20 e Unscheduled Flowshelliphelliphelliphelliphelliphelliphelliphelliphelliphelliphelliphelliphellip22 f Transmission Outage Coordinationhelliphelliphelliphelliphelliphellip23 g Long-Term Reliability Planning ndash Transmissionhellip24 h Long-Term Reliability Planning ndash Resourceshelliphellip27 i Infrastructure Investmenthelliphelliphelliphelliphelliphelliphelliphelliphelliphellip27 j Special Protection Systemshelliphelliphelliphelliphelliphelliphelliphelliphelliphellip30
k Demand Responsehelliphelliphelliphelliphelliphelliphelliphelliphelliphelliphelliphelliphellip31 l System Lambdahelliphelliphelliphelliphelliphelliphelliphelliphelliphelliphelliphelliphelliphellip31 m Congestion Managementhelliphelliphelliphelliphelliphelliphelliphelliphelliphelliphellip31 n Resource Availabilityhelliphelliphelliphelliphelliphelliphelliphelliphelliphelliphelliphellip32 o Transmission System Availabilityhelliphelliphelliphelliphelliphelliphellip32 p Fuel Diversityhelliphelliphelliphelliphelliphelliphelliphelliphelliphelliphelliphelliphelliphellip32 q Clean Energyhelliphelliphelliphelliphelliphelliphelliphelliphelliphelliphelliphelliphelliphellip33
C Burden Estimatehelliphelliphelliphelliphelliphelliphelliphelliphelliphelliphelliphelliphelliphelliphelliphelliphelliphelliphelliphellip33 D Information Collection Statementhelliphelliphelliphelliphelliphelliphelliphelliphelliphelliphelliphelliphellip34
Appendix Performance Metrics in Regions Outside ISOs and RTOs
2
20121015-4003 FERC PDF (Unofficial) 10152012
Docket No AD12-8-000
Federal Energy Regulatory Commission Staff Report on Performance Metrics for Regions Outside of ISOs and RTOs1
The purpose of this Federal Energy Regulatory Commission (Commission) Staff report is to describe the final metrics that have been developed to track performance and operations of utilities in regions outside of Independent System Operators (ISO) and Regional Transmission Organizations (RTO) While these metrics are based on the metrics previously developed to track the performance of ISOs and RTOs in Docket No AD10-5 they have been tailored to fit markets outside of ISOs and RTOs Consistent with the approach used to create performance metrics for ISOs and RTOs and also with the Commissionrsquos FY2009-2014 Strategic Plan Commission Staff worked with the Edison Electric Institute (EEI) its members and other interested stakeholders to design this set of performance metrics Commission Staff appreciates the public comments filed in this proceeding which we have taken into account in developing the final metrics for tracking performance and operations of utilities in regions outside of ISOs and RTOs2
As for next steps Commission Staff requests participating utilities to submit reports providing data and explanatory information for the 2006-2010 period that responds to the final list of performance metrics contained in the Appendix3 The information included in these reports will cover the same time period that ISOs and RTOs covered in their second performance report to the Commission We ask participating utilities to submit their reports by January 25 2013
The next performance report which is expected to issue in 2013 will be based on 2008-2012 data Having developed metrics for ISOsRTOs and then tailored these metrics to suit non-ISOsRTOs Commission Staff has established appropriate common metrics between ISOsRTOs and non-ISOsRTOs4 We will however continue to assess the metrics and evaluate the responses received in response to both the ISORTO metrics
1 This report does not necessarily reflect the views of the Commission its
Chairman or individual Commissioners and it is not binding on the Commission
2 The final list of metrics is provided in the Appendix
3 We expect entities to provide data and explain performance trends in a manner consistent with the responses provided by ISOs and RTOs in Docket No AD10-5-000 See eg The Six ISOs and RTOs 2011 ISORTO Metrics Report Docket No AD10-5-000 (Aug 31 2011) (2011 ISORTO Metrics Report)
4 See Commission Staff Report on ISORTO Metrics Docket No AD10-5-000 at 6 (October 21 2010) (Staff Report)
3
20121015-4003 FERC PDF (Unofficial) 10152012
Docket No AD12-8-000
and the non-ISORTO metrics to ensure there are no inconsistencies and we will further modify the metrics as necessary I Background Responding to a request for an investigation into ISORTO costs structure processes and operations5 the Government Accountability Office in a September 2008 Report to the US Senate Committee on Homeland Security and Governmental Affairs6 recommended that the Chairman of the Commission take action to accomplish the following (1) work with RTOs stakeholders and other experts to develop standardized measures that track the performance of RTO operations and markets and (2) report the performance results to Congress and the public while also providing the following interpretation (a) what the measures and reported performance communicate about the benefits of RTOs and where appropriate (b) changes that need to be made to address any performance concerns The Government Accountability Office Report also suggested that the Commission explore performance metrics for non-ISOsRTOs7 The Performance Metrics effort is also part of the Commissionrsquos Strategic Plan which includes a Metrics Initiative The first step of the Performance Metrics effort was to develop appropriate operational and financial metrics for ISOsRTOs This step was completed with the submission of a Report to Congress8 The next steps in the Metrics Initiative are as follows (1) explore and develop appropriate operational and financial
5 This request was made on May 21 2007 by Senator Joseph I Lieberman
Chairman and Senator Susan M Collins Ranking Minority Member of the US Senate Committee on Homeland Security and Governmental Affairs in a letter to the US Government Accountability Office The letter expressed the Senatorsrsquo concern that ISOsRTOs may not be living up to their full potential with respect to improving efficiencies and reducing costs and that they might not have adequate incentives to minimize costs
6 US Government Accountability Office Electricity Restructuring FERC Could Take Additional Steps to Analyze Regional Transmission Organizationsrsquo Benefits and Performance (2008) (Government Accountability Office Report) A copy of the Government Accountability Office Report GAO-08-987 can be found at httpwwwgaogovnewitemsd08987pdf
7 Government Accountability Office Report at 57
8 Performance Metrics For Independent System Operators and Regional Transmission Organizations Docket No AD10-5-000 at 5 (October 21 2010) See also 2010 ISORTO Metrics Report Docket No AD10-5-000 (Dec 6 2010)
4
20121015-4003 FERC PDF (Unofficial) 10152012
Docket No AD12-8-000
metrics for utilities in non-ISORTO regions (2) establish appropriate common metrics between ISOsRTOs and non-ISORTO regions (3) monitor implementation and performance and (4) evaluate performance and seek changes as necessary Consistent with FERCrsquos FY 2009 ndash 2014 Strategic Plan with the issuance of this report Commission Staff has now completed the first and second of the ldquonext stepsrdquo of the Metrics Initiative and in the coming months will evaluate the performance of utilities in non-ISORTO regions Starting with the list of metrics developed for ISOsRTOs Commission Staff met with a team of representatives of utilities that operate outside of ISOs and RTOs to develop performance metrics for utilities in non-ISORTO regions These discussions resulted in a list of 31 proposed performance metrics Commission Staff then held focused outreach meetings with a variety of industry consumer and state regulatory associations to discuss the proposed metrics9 As a follow-up to that outreach Commission Staffrsquos proposed performance metrics were noticed for public comment and reply comment in Docket No AD12-8-000 on February 23 2012 II Notice of Filing and Responsive Pleadings Notice of Commission Staffrsquos request for comments on draft metrics for regions outside of ISOs and RTOs was published in the Federal Register 77 Fed Reg 12832 (2012) with comments due on or before May 1 2012 and reply comments due on or before May 16 2012 Comments were filed by Edison Electric Institute (EEI) Electric Power Supply Association (EPSA) Joint Commenters10 Multiple TDUs11 and Northwest amp Intermountain Power Producers Coalition (NIPPC) EEI filed reply comments
9 Commission Staff Edison Electric Institute (EEI) and utility representatives met
with the Compete Coalition ISORTO Council Electric Power Supply Association (EPSA) National Association of Regulatory Utility Commissioners (NARUC) National Association of State Utility Consumer Advocates (NASUCA) and National Rural Electric Cooperative Association (NRECA)
10 Joint Protesters are AARP American Public Power Association Citizen Power Electricity Consumers Research Council and Virginia Citizens Consumer Council
11 Multiple TDUs are Public Works Commission of the City of Fayetteville North Carolina Lafayette Utilities System and the City of Orangeburg South Carolina
5
20121015-4003 FERC PDF (Unofficial) 10152012
Docket No AD12-8-000
III Discussion A Procedural Issues 1 Comments Joint Commenters argue that the process used for developing performance metrics outside of ISOs and RTOs is fundamentally flawed They claim that the metrics developed for ISOs and RTOs do not adequately measure performance because the Commission relied on the regulated ISOs and RTOs themselves to develop measures of their own performance Thus they maintain that any attempt to develop comparable metrics for public utilities outside of RTOs and ISOs is a fruitless endeavor Moreover they state that the Commission is making the same mistake here by allowing those entities that will eventually report under the metrics to drive their development While they acknowledge that regulated entities have expertise that can inform the development of the metrics they object to having regulated entities develop the metrics without the benefit of what Joint Commenters consider to be a transparent and open public process12 In reply EEI argues that the Joint Commenters overlook the fact that the metrics are the product of a collaborative process In this regard EEI notes that it and its members participated in Commission-led outreach sessions to discuss the proposed metrics and solicit feedback from stakeholders which was taken into account before the metrics were issued for public comment EEI notes that the Joint Commenters fail to provide reasons why the metrics will not be useful and cautions the Commission against ignoring the benefits of the metrics in favor of accepting the Joint Commentersrsquo unsupported claims13 2 Response Commission Staff disagrees with Joint Commentersrsquo characterization of the process used to develop the metrics for regions outside of ISOs and RTOs as ldquofundamentally flawedrdquo Commission Staff used a process similar to the process that was used to develop metrics for ISOsRTOs Commission Staff invited broad stakeholder participation and engaged in a process with EEI its members and other interested stakeholders to develop performance metrics tailored to regions outside of ISOs and RTOs Since the goal is to develop metrics that are comparable for ISOsRTOs and non-
12 Joint Commenters Comments at 2-3
13 EEI Reply Comments at 2-3
6
20121015-4003 FERC PDF (Unofficial) 10152012
Docket No AD12-8-000
ISOsRTOs Commission Staff began by assessing which ISORTO metrics should apply to non-ISOsRTOs and tailored these metrics to the non-ISORTO context Commission Staff met with representatives from various stakeholder groups and solicited comments prior to issuing the metrics for public comment Commission Staff then provided an opportunity for public comment and as further discussed below Commission Staff has taken these comments into account when crafting a final list of metrics Thus Commission Staff concludes that the process was sufficiently interactive and transparent Moreover Commission Staff concludes that any benefits to be gained from restarting the process would not justify the attendant delay in using the draft metrics to gather performance data Therefore just as similar procedural criticisms were considered in the ISORTO metrics report we also dismiss them here B Metrics Issues As noted when the draft metrics were issued for public comment the list of metrics for regions outside of ISOs and RTOs was based on the list of metrics adopted in Docket No AD10-5-000 and was tailored to markets in these regions14 Based on the comments discussed below and certain adjustments by Commission Staff 39 performance metrics have been selected for participating utilities in regions outside of ISOs and RTOs As noted above these metrics are listed in the Appendix 1 General Issues a Comments Several commenters express general support for the proposed metrics for regions outside of ISOs and RTOs EPSA explains that it supports the proposed metrics and expects that the metrics will address the factors necessary to evaluate the performance of non-ISORTO markets EPSA states that the proposed metrics appear to appropriately reflect the unique differences in the markets that exist outside of an ISO or RTO EPSA states that the development of performance metrics for non-ISORTO markets will assist the Commission by providing a solid basis for comparing markets within an ISO and RTO and those outside of such regions15
14 See Commission Staff Request Comments on Performance Metrics for Regions
Outside of RTOs and ISOs Non-ISORTO Performance Metrics Docket No AD12-8-000 at 2 (Feb 23 2012)
15 EPSA Comments at 2-3
7
20121015-4003 FERC PDF (Unofficial) 10152012
Docket No AD12-8-000
Similarly EEI states that the metrics are sufficient to provide meaningful data without being overly burdensome on members that choose to respond16 EEI cautions however that use of the data should be limited to the purposes contemplated in the notice EEI states that given the differences in the entities that voluntarily choose to respond it may be difficult to draw comparisons among them Moreover EEI states that data reported in response to the metrics should not be used as record evidence in any contested proceeding or serve as a basis for any enforcement action against an entity voluntarily providing data in response to these metrics17
A number of commenters claim that there will be gaps in the information available
without the participation of non-jurisdictional entities NIPPC explains that non-jurisdictional transmission providers play a significant role in the ldquoHybrid West marketrdquo (the area of the Western Interconnection outside of the organized markets in Alberta and California) and as a result the Commission will only have limited insight into market performance in this region without the participation of non-jurisdictional transmission providers Likewise EEI notes that several stand-alone utilities coordinate their operations with non-jurisdictional entities to maintain reliability and since these entities will not be reporting data there will be significant gaps for some of the metrics18 b Response
Commission Staff agrees with commenters that the proposed performance metrics
for non-ISORTO regions should provide a suitable basis for comparing the performance of ISOs RTOs and utilities in regions outside ISORTO markets Commission Staff will monitor implementation and performance under both the ISORTO metrics and the non-ISORTO metrics and if necessary make modifications to improve the comparability of metrics for these two sets of entities
While Commission Staff recognizes that an analysis of performance metrics in
non-ISORTO regions would be enhanced by the inclusion of information from non-jurisdictional entities as NIPPC and EEI note the performance metrics are being developed and analyzed in a voluntary and collaborative process Commission Staff encourages and welcomes information that these entities are willing to provide voluntarily
16 Id at 3
17 Id at 3 4-5
18 Id at 4
8
20121015-4003 FERC PDF (Unofficial) 10152012
Docket No AD12-8-000
2 Additional Metrics and Information a Comments
A number of commenters recommend that the Commission adopt additional metrics For instance EPSA states that the metrics should include a metric measuring and monitoring the transfer capability of a utility or transmission system as the ability to import or export megawatts (MW) into or out of a utilityrsquos transmission system is a solid indicator of that utilityrsquos or transmission systemrsquos performance EPSA explains that a metric monitoring transfer capability would assist both the Commission and the public in determining which balancing authority areas have available power to transfer which in turn could provide competitive suppliers with greater access to wholesale customers and enhance competition19
NIPPC argues that the Commission should require transmission providers to report
the extent of their participation in initiatives facilitating virtual consolidation of operations among transmission providers such as the Joint Initiative project NIPPC explains that the Joint Initiative project refers to an effort to promote market efficiency through greater cooperation among the Northern Tier Transmission Group Columbia Grid and WestConnect20 NIPPC also states that the Commission should include a metric concerning whether the transmission provider is participating in the Area Control Error Diversity Interchange Program which involves the pooling of individual Area Control Errors21 to take advantage of control error diversity22 NIPPC further maintains that the Commission should require transmission providers to indicate whether they are participating in the Joint Initiative Dynamic Scheduling System which allows dynamic
19 Id at 6
20 NIPPC Comments at 7
21 Area Control Error refers to the instantaneous difference between a balancing authorityrsquos net actual and scheduled interchange taking into account the effects of Frequency Bias and correction for meter error See North American Electric Reliability Council (NERC) Glossary of Terms Used in NERC Reliability Standards (NERC Glossary) available at httpwwwnerccomfilesGlossary_of_Terms_2012May25pdf It is a measure of the power balance on the interties between balancing authority areas
22 NIPPC Comments at 7
9
20121015-4003 FERC PDF (Unofficial) 10152012
Docket No AD12-8-000
schedules to be implemented quickly while requiring minimal changes to existingprocesses and p 23
rocedures
NIPPC argues that as parts of the western United States move to intra-hour
markets andor energy imbalance markets the Commission would benefit from information concerning which transmission providers are actively participating in those markets Similarly noting that the Commission has observed that intra-hour scheduling can reduce the cost of providing reserves to integrate variable energy resources24 NIPPC argues that the Commission should obtain information from transmission providers on whether they allow intra-hour scheduling Accordingly NIPPC urges the Commission to collect metrics describing (1) whether the transmission provider allows intra-hourly scheduling and facilitates customer participation in an intra-hour energy market (2) what products are traded in that intra-hour market (eg scheduling increments) and (3) the total number of intra-hour scheduling requests and (4) for each of the products identified the total number of transactions and the total megawatt hour (MWh) quantity of transactions25 Additionally NIPPC notes that transmission providers in the Hybrid West market26 are seeking to impose integration charges on variable energy resource generators and argues that the Commission should require transmission providers who impose such charges to report the specific charge and the specific service associated with the charge27
NIPPC also argues that the Commission should obtain information on whether the transmission provider has adopted the Joint Initiative standards ndash standardized business practices and procedures to facilitate the intra-hour schedule developed by the Joint Initiative project28 Further NIPPC claims that the Commission should obtain information from transmission providers on whether they participate in the I-TAPwebExchange and if so the number and nature of transactions using the tool29
23 Id at 8
24 Id (citing Integration of Variable Energy Resources Notice of Proposed Rulemaking 133 FERC para 61149 (2011) (VERS NOPR))
25 NIPPC Comments at 9-10
26 NIPPC defines the ldquoHybrid Westrdquo [market] as the area of the Western Interconnection outside the organized markets in Alberta and California Id at 2
27 Id at 10
28 Id
29 NIPPC explains that the Joint Initiative project developed I-TAP which reduces the number of keystrokes necessary to complete a transaction and thereby reduces the
10
20121015-4003 FERC PDF (Unofficial) 10152012
Docket No AD12-8-000
EPSA expresses concern that there are insufficient metrics for evaluating a
utilityrsquos cost to serve native load which is important for comparing the performance of utilities within an ISO or RTO with those outside30 EPSA argues that the Commission should evaluate price metrics for entities in regions outside of ISOs and RTOs EPSA asserts that establishing a price metric for these regions is consistent with the metrics established to evaluate performance in an ISO or RTO EPSA acknowledges the difficulties in comparing prices between a utility in a region outside of an RTO or ISO and one that participates in such a market Nevertheless EPSA maintains that it is important to establish some method to compare prices if the metrics are to provide a realistic method to compare ISOs and RTOs with regions outside of such markets31 EEI points out that it is the statersquos responsibility to monitor and evaluate a utilityrsquos cost of service to native load EEI argues that this is outside the Commissionrsquos jurisdiction and could further complicate state efforts to ensure that native load receives reliable cost-effective service32
b Response
With respect to EPSArsquos interest in transfer capability metrics we note that transfer capability is measured by Available Transfer Capacity (ATC)33 which is a function of system topology and the transmission capacity reserved by firm transmission customers to meet their load requirements Since many aspects of system topology are beyond the control of utilities such as system capabilities on neighboring systems and they must reserve firm capacity to meet load requirements Commission Staff does not consider ATC to be a good indication of a utilityrsquos performance
potential for errors Id at 8-9 I-TAP will not be a centralized market but instead is expected to operate as a highly-efficient bilateral market that will enable energy and capacity products to be traded in as short a term as intra-hour All participation will be voluntary with completed transactions being bilateral deals between the individual parties
30 EPSA Comments at 9
31 Id at 8 n6
32 EEI Reply Comments at 3-4
33 ATC is a measure of the flow capacity remaining on a flowgate for further commercial activity over and above already committed uses See NERC Glossary
11
20121015-4003 FERC PDF (Unofficial) 10152012
Docket No AD12-8-000
While Commission Staff does not think that ATC would be an appropriate measure of a utilityrsquos performance we share EPSArsquos concern about the under-utilization of capacity It appears that EPSA is concerned that utilities are reserving capacity that they do not utilize thereby leaving available capacity unused This can harm competition and reduce the efficiency of the electric system by limiting the ability to deliver low cost energy where it is needed Such a practice could be especially problematic where utilities do not schedule transmission until just prior to the operating hour For these reasons Commission Staff recommends that participating utilities provide a narrative discussion addressing interconnection-wide and seams issues consistent with the Commission Staff report addressing ISO and RTO markets34
As NIPPC points out initiatives such as the Joint Initiative project involving the Northern Tier Transmission Group Columbia Grid and WestConnect can be the basis for improving the efficiency of the regional transmission system through joint planning and transmission access programs For this reason Commission Staff recommends that transmission providers include narrative discussions of their participation in joint regional initiatives and progress made on improving the efficiency of regional transmission systems in their reports on interconnection-wide and seams-wide issues Also regarding NIPPCrsquos interest in tracking progress toward the development of energy imbalance markets in particular Commission Staff agrees that discussions of a transmission providerrsquos participation in such markets and the progress made in the development of these markets would be useful Imbalance markets can reduce the cost of supply and foster competition among suppliers Therefore utility participation in these programs can ultimately result in reducing the cost of power Consequently Commission Staff recommends that participating utilities include information on the development of energy imbalance markets in the narrative discussions in their performance reports However Commission Staff does not recommend adding metrics measuring the number of transactions or MW traded at this time35 In light of the early stage of development of these markets and the impact of factors beyond the control of utilities in the development of these markets it is premature to designate this information as a measure of the performance of utilities
Commission Staff agrees with NIPPC that information on utility participation in programs to facilitate the integration of variable energy resources and to mitigate any issues and uncertainty associated with scheduling variable energy resources would provide information relevant to the performance of utilities Such information would allow for an assessment of how utilities are ensuring the efficiency of their operations
34 Staff Report at 15
35 We note that this information is included in the Electric Quarterly Reports that must be filed with the Commission See 18 CFR sect 3510b (2012)
12
20121015-4003 FERC PDF (Unofficial) 10152012
Docket No AD12-8-000
while integrating renewable resources While we do not think a standard metric is necessary at this time Commission Staff nevertheless recommends that utilities include in their reports narrative discussions of their progress in implementing such programs including area control error diversity interchange dynamic scheduling systems intra-hour transmission scheduling36 and intra-hour transaction accelerator platforms Regarding NIPPCrsquos request for information on transmission grid integration charges for variable energy resources the Commission recently addressed the design of generator regulation service charges in its final rule in Docket No RM10-11-00037 Any such charges would be subject to Commission review under section 205 of the Federal Power Act38 and as a result subject to public review With respect to EPSArsquos interest in price metrics for entities in regions outside of ISOs and RTOs Commission Staff agrees with EPSA that it is difficult to compare prices outside of ISO and RTO markets with prices in these markets ISO and RTO market prices are locational marginal prices (LMPs) that are based on resource offers and load bids LMP pricing does not exist outside these markets This lack of comparability was the primary reason that Commission Staff did not propose a price metric for utilities outside ISO and RTO markets Commission Staff also considered utility cost-of-service rates that include retail costs to be unsuitable price metrics These rates include distribution and other functions that are not encompassed by the wholesale service provided by ISOs and RTOs and as noted by EEI utility cost-of-service rates are outside the Commissionrsquos jurisdiction Notwithstanding the difficulties inherent in comparing wholesale prices between ISORTO markets and regions outside ISORTO markets wholesale prices are pertinent to the performance of utilities in pricing their products competitively Accordingly Commission Staff proposes that utilities provide price metrics on their wholesale power sales derived from the transaction information and price data utilities report on wholesale power sales in the Electric Quarterly Report39 To ensure comparability with the load-
36 In the final rule in Integration of Variable Energy Resources the Commission
amended the pro forma OATT to provide all transmission customers the option of using more frequent transmission scheduling intervals within each operating hour at 15-minute intervals See Integration of Variable Energy Resources Order No 764 139 FERC para 61246 at P 91 (2012)
37 Id P 271
38 16 USC sect 824e (2006)
39 Revised Public Utility Filing Requirements Order No 2001 67 Fed Reg 31043 (May 8 2002) FERC Stats amp Regs para 31127 rehrsquog denied Order No 2001-A 100 FERC para 61074 rehrsquog denied Order No 2001-B 100 FERC para 61342 order
13
20121015-4003 FERC PDF (Unofficial) 10152012
Docket No AD12-8-000
weighted data provided by ISOs and RTOs Commission Staff proposes that participating utilities submit a single volume-weighted average annual price for energy and for capacity Commission Staff recognizes that in the regions outside of ISORTO markets as in the ISORTO markets some of the wholesale prices that are reported in the Electronic Quarterly Reports include cost-based transactions that reflect cost allocation decisions of regulators as well as market-based transactions Also wholesale power prices reflect fuel prices that are a function of global and nationwide price trends that are beyond the control of utilities To address these matters the metric could be developed to include market-based transactions only and to hold fuel prices constant in a fuel-adjusted price metric40 Commission Staff further recognizes that utilities provide a series of peak off-peak and year-round wholesale power products and therefore utilities will need to volume-weight each of these products into a single average annual price for energy and for capacity in addition to reporting peak and off-peak prices Commission Staff also requests comments on whether seasonal prices provide useful information on utility performance In light of the fact that Commission Staff is now proposing a price metric for the first time and therefore there has not been an opportunity for a full and complete discussion among stakeholders of the pros and cons of various price metric options Commission Staff is not including a price metric on the list of recommended metrics in Appendix A Rather Commission Staff recommends that participating utilities discuss in their 2012 reports their perspectives on a wholesale price metric Based on these perspectives and further discussions with interested stakeholders Commission Staff intends to recommend a price metric that participating utilities will submit in their next report following the report that is requested in this Commission Staff Report
directing filing Order No 2001-C 101 FERC para 61314 (2002) order directing filing Order No 2001-D 102 FERC para 61334 order refining filing requirements Order No 2001-E 105 FERC para 61352 (2003) order on clarification Order No 2001-F 106 FERC para 61060 (2004) order revising filing requirements Order No 2001-G 72 Fed Reg 56735 (Oct 4 2007) 120 FERC para 61270 order on rehrsquog and clarification Order No 2001-H 73 Fed Reg 1876 (Jan 10 2008) 121 FERC para 61289 (2007) order revising filing requirements Order No 2001-I 73 Fed Reg 65526 (Nov 4 2008) 125 FERC para 61103 (2008)
40 The RTO price metrics include a fuel-adjusted LMP price metric
14
20121015-4003 FERC PDF (Unofficial) 10152012
Docket No AD12-8-000
3 Discussion of Individual Metrics The two major categories of performance metrics are reliability and systems operations measures The reliability metrics were chosen to measure the reliability of day-to-day operations using metrics such as compliance with national and regional reliability standards the real-time balance of supply and demand forecasting and Special Protection Schemes and to measure long-term reliability using metrics such as long-term transmission and resource planning The systems operations measures were chosen to measure the operating performance of utilities in non-ISORTO regions using metrics such as system resource and transmission availability and system lambda a National and Regional Reliability Standards Compliance Metrics i Performance Metric This metric measures the number of violations of national and regional reliability standards provides information on how these violations were reported and indicates the severity of the violations41 The metric also details unserved energy (or load shedding) caused by violations and requires a utility to provide additional details on the number of events the duration of the events whether the events occurred during onoff peak hours and information on the equipment types affected and the kilovolts of lines affected
Consistent with the 2010 ISORTO Metrics Report the text of the metric has been revised to reflect the fact that this metric is a quantification of all NERC and Regional Reliability Organization standard violations that have been identified during an audit or as a result of a self-report and have been published as part of that process42 Additionally the text of the metric has been revised to clarify that utilities located in regions outside of ISOs and RTOs should limit reporting to the same eight functional areas used by the IS 43Os and RTOs
41 A full listing of the reliability standards is provided at
httpwwwnerccompagephpcid=2|20
42 2011 ISORTO Metrics Report Docket No AD10-5-00 at 12 (August 31 2011)
43 The eight functional areas are as follows 1) Balancing Authority 2) Interchange Authority 3) Planning Authority 4) Reliability Coordinator 5) Resource Planner 6) Transmission Operator 7) Transmission Planner and 8) Transmission Service Provider
15
20121015-4003 FERC PDF (Unofficial) 10152012
Docket No AD12-8-000
ii Comments
Multiple TDUs assert that the Commission and NERC would benefit from the collection of data regarding events when Footnote b44 is invoked and utilities interrupt non-consequential Firm Demand Multiple TDUs state that there should not be any dispute about the utility of this information and note that the Commission has directed NERC to collect information regarding the specific circumstances and frequency with which Firm Demand is planned to be interrupted as part of the Footnote b remand process45 Multiple TDUs explain that since it is not a violation of any reliability standard to interrupt non-consequential Firm Demand if Footnote b is applicable National or Regional Reliability Standards Compliance metrics will not encompass events where Footnote b is involved Multiple TDUs believe that the collection of the following categories of data would facilitate further discussion at the Commission and NERC (1) the number of incidents in which the utility relies on Footnote b in order to interrupt non-consequential Firm Demand (2) information concerning the severity of these incidents and whether there are systemic problems with the transmission system and transmission plan46 and (3) information concerning whether interrupted wholesale
44 Footnote b refers to a petition filed by the North American Electric Reliability Corporation (NERC) seeking approval of Table 1 Footnote b of four Reliability Standards Transmission Planning TPL-001-1ndash System Performance Under Normal (No Contingency) Conditions (Category A) TPL-002-1b ndash System Performance Following Loss of a Single Bulk Electric System Element (Category B) TPL-003-1a ndash System Performance Following Loss of Two or More Bulk Electric System Elements (Category C) and TPL-004-1ndash System Performance Following Extreme Events Resulting in the Loss of Two or More Bulk Electric System Elements (Category D) While Footnote b appears in all four of the above referenced TPL Reliability Standards its relevance and practical applicability is limited to TPL-002-0a See Transmission Planning Reliability Standards Order No 762 139 FERC para 61060 at P 1 amp n2 (2012) Footnote b states
Planned or controlled interruption of electric supply to radial customers or some local Network customers connected to or supplied by the Faulted element or by the affected area may occur in certain areas without impacting the overall reliability of the interconnected transmission systems To prepare for the next contingency system adjustments are permitted including curtailments of contracted Firm (non-recallable reserved) electric power Transfers
Id P 3
45 Multiple TDUs Comments at 9 (citing Order No 762 139 FERC para 61060 at P 20)
16
20121015-4003 FERC PDF (Unofficial) 10152012
Docket No AD12-8-000
transmission customers of the reporting transmission provider have notice and understanding before the interruption Multiple TDUs recognize that Footnote b is in flux and as a result urge the Commission to revisit the metrics associated with Footnote b after Footnote b is revised47
In reply to Multiple TDUs EEI argues that situations in which Footnote b is invoked are clearly contemplated under section A7 of the Reliability metrics proposed in the Commission notice48
NIPPC argues that the Commission should consider expanding the reliability standards metrics to include the number of dispatch orders issued to generators to curtail output and the specific reasons for each of those dispatch orders as a dispatch order made to a generator to avoid or mitigate a reliability violation will have the same impact on a market as a reliability violation NIPPC also argues that the metrics should include the number of and justification for schedule curtailments (or e-tag curtailments) NIPPC further maintains that the metrics should compare the percentage of the dispatch orders or schedule curtailments issued to independent power producers to the percentage of independently owned generation capacity interconnected to the transmission providerrsquos system49 iii Response
While Reliability metric A7 captures situations where Footnote b is invoked
Commission Staff concludes that for purposes of clarity it would be beneficial to have a separate metric to address the planned Firm Demand interruptions that planners use to meet the system performance requirements of TPL-002-2b Table 1 for Category B single contingency events (ie Footnote b interruptions as discussed in Order No 762) and that the metric should track the number severity and duration of these incidents This information is a good performance measure because it could expose an area of weakness in the Bulk Electric System that may need to be addressed with a capital project or an appropriate operating procedure Commission Staff recommends that in the narrative that accompanies the metrics report participating utilities discuss the actions taken to address the interruptions and the notice utilities provide customers before interruptions are made
46 We note that this request is discussed in our response infra at pp 19-20
47 Multiple TDUs Comments at 10-11
48 EEI Reply Comments at 4
49 NIPPC Comments at 4
17
20121015-4003 FERC PDF (Unofficial) 10152012
Docket No AD12-8-000
Responding to NIPPC the reliability standards metrics are limited to providing information on reliability violations Actions taken by transmission providers to curtail the dispatch of generators or adjust transmission schedules (or e-tags) are relevant to the dispatch reliability metrics discussed below As discussed in that section Commission Staff is recommending that participating utilities include narratives on all actions they take to manage dispatch reliability Commission Staff is not recommending that this information be incorporated into metrics because not all participating utilities take these actions and there are no standardized measures for these activities With respect to NIPPCrsquos request that a metric be developed to measure transmission schedule adjustments or e-tag revisions we note that these actions are the result of transmission loading reliefs (TLR) or Unscheduled Flow Relief events that are being reported in the Dispatch Reliability measure below and are already covered by the metrics For this reason Commission Staff does not recommend adding this metric
b Dispatch Reliability i Performance Metrics Dispatch reliability is measured by three metrics The proposed metrics listed in the notice retained two of the metrics used to measure dispatch reliability in ISOs and RTOs (1) Balancing Authority Area Control Error Limit or Control Performance Standard 1 and Control Performance Standard 2 and (2) Energy Management System Availability The proposed metric relating to TLR or Unscheduled Flow Relief Events would measure the number of events ndash rather than the hours as is reported in the performance metrics for ISOs and RTOs ndash of TLRs (of severity level 3 or higher) or unscheduled flows called by the incumbent transmission provider Utilities that are part of the Western Electricity Coordinating Council (WECC) will report events under the WECC Unscheduled Flow Mitigation Procedure that are equivalent to the NERC TLR Level 3 ii Comments
EPSA contends that in order to properly identify problem areas the Commission should require each transmission provider to identify the length and magnitude of each TLR event EPSA states that at a minimum each transmission owner should provide the following information (1) how long each constrained element is subject to a continuous Level 3 or higher TLR in hours (2) the number of MW of network transmission service curtailed for each continuous TLR event and for all continuous TLR events in total (3) the number of MW of firm point-to-point transmission service curtailed for each continuous TLR event and in aggregate and (4) the number of MW of non-firm transmission service curtailed per continuous TLR event and in aggregate50 EPSA
50 EPSA Comments at 3-4
18
20121015-4003 FERC PDF (Unofficial) 10152012
Docket No AD12-8-000
further states that monitoring and tracking TLR events on a system that are categorized at level 1 or 2 can provide additional insights into system dynamics as those events can be prevented by nodal market designs that dispatch around binding constraints using congestion prices Additionally EPSA states that all TLR events at level 5 or higher should be tracked and reported separately from all other TLR events as TLR events at this level indicate a severely constrained system EPSA recommends that the metrics include a metric for reporting all congestion management events ndash not only those categorized as a TLR ndash because some areas rely on a variety of other congestion management techniques EPSA further recommends including an evaluation of the number and severity level of all congestion management events of a utility or transmission system with the changes discussed above51 iii Response
Commission Staff agrees with EPSA that the metric concerning TLR should measure the duration of such events Accordingly Commission Staff recommends that the TLR metric be revised to measure the hours of TLR called by the incumbent transmission provider Commission Staff notes that this revision will result in a metric that is consistent with the metrics for ISO and RTO markets
Commission Staff does not consider information on severity level 1 and 2 events
to be measures of utility reliability performance Such events by definition only impact local area operations and as a result will not impact system reliability For this reason TLR events of level 3 and above are systemic events and are the appropriate basis for a performance metric for system reliability For TLR events of severity level 3 and above Commission Staff agrees with EPSA that the TLRUnscheduled Flow Relief metric should be supplemented with information on TLR (or Unscheduled Flow Relief) events for each severity level energy curtailment data on the number of MW curtailed and duration of curtailment information Such information along with a discussion by the participating utility of the impact of curtailments on customers and the various resource types will allow for a better informed evaluation of performance52 For this reason we
51Id at 5
52 We note that in Order No 890 the Commission concluded that requiring transmission providers to post additional information on curtailments was necessary to provide transparency and enable customers to assess whether they have been treated without undue discrimination See Preventing Undue Discrimination and Preference in Transmission Service Order No 890 FERC Stats amp Regs para 31241 at P 1626 order on rehrsquog Order No 890-A FERC Stats amp Regs para 31261 (2007) order on rehrsquog Order No 890-B 123 FERC para 61299 (2008) order on rehrsquog Order No 890-C 126 FERC para 61228 (2009) order on clarification Order No 890-D 129 FERC para 61126 (2009) For
19
20121015-4003 FERC PDF (Unofficial) 10152012
Docket No AD12-8-000
recommend that this information be included in the narrative discussions that accompany the (TLRUnscheduled Flow Relief) metric to the extent the information is available
With respect to EPSArsquos request for metrics on all congestion management activities such as Local Area Protocols Commission Staff recommends that participating utilities provide narratives on the use of Local Area Protocols out-of-merit dispatches and other techniques to resolve system dispatch reliability problems Such information will provide a context for the role played by TLRs or Unscheduled Flow Reliefs thereby providing the basis for a more comprehensive assessment of constraint management by the participating utility Since not all participating utilities use these techniques and the definitions of these techniques may differ among utilities Commission Staff does not consider this information to be appropriate for standardized metrics c Load Forecasting Accuracy
Actual peak load as a percentage variance from forecasted peak load as reported in a transmission providerrsquos OASIS measures the effectiveness of the load forecasting function of utilities in non-ISORTO regions Since load forecasting provides the basis for resource commitment this metric impacts the incurrence of resource costs The more accurate a utility is in forecasting load the greater the likelihood that it can commit sufficient resources in a cost effective manner that avoids over-commitment of resources inefficient commitment of short lead-time resources or under-utilization of available resources This metric measures the percentage difference between actual peak load and forecasted peak load No comments were submitted on this metric d Wind Forecasting Accuracy i Performance Metric This metric measures the percentage accuracy of actual wind availability compared to forecasted wind availability Improving the accuracy of the wind forecast will facilitate the timely commitment and dispatch of sufficient supplemental resources ii Comments NIPPC maintains that the Commission should clarify whether this metric applies to the wind generation assets controlled by the merchant function of the transmission provider or to the independently owned and operated wind generation interconnection to
TLR events of severity level 3 and above Commission Staff recommends including a narrative explanation of why transactions could not be continued or completed similar to what is required by Order No 890 Id P 1627
20
20121015-4003 FERC PDF (Unofficial) 10152012
Docket No AD12-8-000
the transmission providerrsquos system NIPPC argues that the metric should not extend to generators not owned or controlled by the merchant function of the transmission provider in light of the market-sensitive nature of a generatorrsquos wind forecasting accuracy and scheduling practices53 NIPPC also urges the Commission to consider expanding this metric to require a transmission provider to report whether it has implemented a centralized wind forecast system for use in its operations and if so to collect additional metrics on the accuracy of that centralized forecast54 NIPPC contends that a single metric comparing actual wind output to forecast output over the reporting period is not a useful metric as inaccuracies in the forecast may cancel out over a long reporting period NIPPC argues that a more relevant measure of accuracy would be the number of hours during the reporting period that the forecast is accurate (where the forecast is within five percent of actual output) NIPPC also suggests that the following additional metrics would be useful (1) the MW of windsolar capacity subject to the forecast (2) granularity of the forecast (monthly weekly daily hourly sub-hourly) (3) whether the forecast is integrated into the transmission providerrsquos operations (4) whether the transmission provider shares the forecast with market participants (or generation owners) and (5) an equivalent metric for forecasts associated with solar energy and hydroelectric energy55 iii Response The wind accuracy metric was intended to apply to all wind resources ndash owned and non-owned ndash on the transmission providersrsquo systems Commission Staff does not recommend excluding wind generators not owned or controlled by transmission providers from the wind accuracy metric To be an effective tool to ensure system reliability this metric must measure the accuracy of forecasts that account for all wind resources in a utilityrsquos footprint This requirement is increasingly important as wind resources become a more significant portion of total resource output When wind generators ndash including those not owned or controlled by the utility ndash provide wind availability forecasts they are performing a reliability function that has implications for system reliability management and planning Accordingly Commission Staff considers this information to be an important element in an assessment of a utilityrsquos reliability performance We encourage participating utilities to work with wind generators not owned or controlled by the utility to ensure that the data gathered and reported protects market-sensitive information from
53 NIPPC Comments at 5
54 Id
55 Id at 5-6
21
20121015-4003 FERC PDF (Unofficial) 10152012
Docket No AD12-8-000
being reported in public reports or released to utility subsidiaries that compete with these wind generators Commission Staff agrees with NIPPC that to the extent that centralized forecasting can minimize integration costs this information is an indication of utility performance Therefore Commission Staff recommends that participating utilities discuss their forecasting process in their reports With respect to NIPPCrsquos concern that inaccuracies in the forecast may cancel out Commission Staff notes that the wind accuracy forecast will be based on the mean absolute error of the forecast compared to actual wind availability Therefore all errors ndash positive and negative ndash will be measured and will not cancel out Since the proposed metric will measure the magnitude of forecast inaccuracies Commission Staff considers the proposed metric to be superior to the alternative proposed by NIPPC that only indicates the number of hours in which a forecast is outside a five percent threshold Further responding to NIPPC Commission Staff notes that forecast accuracy will be based on a comparison of the day-ahead forecast to actual availability Commission Staff also notes that the capacity of wind and solar subject to the forecast which NIPPC requests be an additional performance metric is included in the Clean Energy metric discussed below Commission Staff is not recommending the inclusion of a metric measuring the accuracy of forecasts for other variable energy resources because many utilities do not perform these forecasts or they are not performed according to a standardized process Nevertheless Commission Staff considers it appropriate that participating utilities provide narrative descriptions of their solar and hydro forecasts to the extent these resources are significant sources of energy to allow for a more complete assessment of forecasting performance e Unscheduled Flows Metric Unscheduled flows are defined as the difference between net actual interchange (actual power flow measured in real time) and net scheduled interchange The two components of unscheduled flows are inadvertent energy defined to be the difference between actual and scheduled interchange for all interties and parallel flow (or loop flow) defined to be the actual power flow on a contract path within an interconnection from one Balancing Authority Area to a second Balancing Authority Area through ldquoparallelrdquo transmission lines through a third Balancing Authority Area Parallel flows are a function of the interconnectionrsquos operating configuration line resistance and physics Unscheduled flows provide information relevant to operation planning because curtailments may occur when unscheduled flows exceed system operating limits This metric is measured by the difference between net actual interchange (actual measured power flow in real time) and the net scheduled interchange in MWh as reported in a
22
20121015-4003 FERC PDF (Unofficial) 10152012
Docket No AD12-8-000
utilityrsquos FERC Form No 714 ldquoAnnual Electric Balancing Authority Area and Planning Area Reportrdquo No comments were received on this metric f Transmission Outage Coordination i Performance Metric
The transmission outage coordination metric measures the percentage of outages planned and unplanned that occur with less than two days notice Effective transmission outage coordination will result in early notification of outages and therefore will be indicated in the metrics as a low percentage of short notice outages56 Effective transmission outage coordination by utilities in non-ISORTO regions ensures that outages do not threaten system reliability and that additional and potentially more expensive resources do not need to be committed
ii Comments ESPA recommends that the performance metrics track a utilityrsquos transmission outage performance EPSA states that the information posted on OASIS is valuable information and requests that the Commission include information regarding any transmission outages known ahead of time including the time and date of the planned outage and the planned duration of the outage57 EPSA maintains that providing this information would allow market participants to evaluate the information concerning the proposed outage and make other arrangements if necessary or otherwise take proactive steps to reduce the impact of any such planned outage EPSA states that outage performance information would also give the Commission and other observers the opportunity to evaluate how well the utility or transmission owner can schedule outages and execute that schedule58
iii Response
Commission Staff agrees with EPSA that the transmission outage metrics should include information to measure the utilitiesrsquo ability to plan for outages and successfully execute their outage plan As stated in the Commission Staff Report on ISORTO Performance Metrics effective transmission outage coordination is defined as early
56 The proposed metrics will measure outages for major transmission facilities
which are defined for purposes of the metrics as 200kV and higher
57 EPSA Comments at 7-8
58 Id at 8
23
20121015-4003 FERC PDF (Unofficial) 10152012
Docket No AD12-8-000
notification of planned outages of five days or longer ndash ie notification at least one month prior to the outage commencement date ndash and timely review of outage impacts59 Also effective transmission outage coordination is measured by the percentage of planned outages that are canceled due to conflicting planned outages as well as forced (unscheduled) outages that could cause reliability issues and additional congestion costs Commission Staff recommends adding these metrics for outages on major transmission lines of 200kV and higher to be consistent with the metrics for ISOs and RTOs60 g Long-Term Reliability Planning ndash Transmission i Performance Metric The proposed metric tracks the dollar amount of transmission facilities approved to be constructed for reliability purposes the percentage of approved construction completed the number of requests for and completed reliability studies and a narrative detailing a utilityrsquos economic study process This information measures the ability of each utilityrsquos expansion planning process to identify reliability and economic needs in advance which is essential to ensuring that market participants have sufficient time to develop either transmission or resource solutions to system reliability and economic requirements The metric also includes a narrative discussion of the transmission planning stakeholder process ii Comments Multiple TDUs state that a metric related to planning and completion of economic transmission is needed for multiple reasons First vertically-integrated transmission
59 Staff Report at 25
60 See Staff Report at Appendix B Peformance Metric F1 (Oct 21 2010) (Percentage of gt 200kV planned outages of 5 days or more that are submitted to ISORTO at least 1 month prior to the outage commencement date) We note that in Revisions to Electric Reliability Organization Definition of Bulk Electric System and Rules of Procedure Notice of Proposed Rulemaking 77 Fed Reg 39846 139 FERC para 61247 (2012) the Commission proposed to approve a modification to the currently-effective definition of ldquobulk electricrdquo systemrdquo that would establish a bright-line threshold that includes all facilities at or above 100 kV Commission Staff still considers it reasonable to require a 200 kV minimum for reporting information related to outages for performance metrics purposes particularly since this 200 kV minimum is consistent with the threshold ISOsRTOs used in their prior metric reports Nevertheless Commission Staff will monitor responses under this metric and continue to evaluate whether this is the appropriate threshold
24
20121015-4003 FERC PDF (Unofficial) 10152012
Docket No AD12-8-000
providers have inherent incentives to discriminate and underperform when performing this function Multiple TDUs state that the Commission has recognized as much and that such a metric would help measure the efficacy of the remedies that the Commission adopted in Order No 890 to address this concern61 Second the economic costs of transmission constraints are not transparent in areas without centralized markets like those found in ISOs and RTOs with congestion pricing Third more specificity is needed because a vertically-integrated transmission owner reporting on transmission construction and identifying shortfalls would be identifying its own unsuccessful outcomes62 Multiple TDUs argue that merely requiring vertically-integrated transmission providers to provide a narrative detailing their economic studies process as is proposed will elicit little more than a repetition of the planning process descriptions that were filed in compliance with Order No 890 For these reasons Multiple TDUs argue that the transmission planning and construction metric should be expanded to include the dollar amount of facilities constructed for purposes whose predominant purpose was not reliability broken down between (a) economic (b) public policy (c) facilities to support the planned generation resources of the transmission provider or its affiliates (d) transmission or interconnection requests made by the transmission provider or its affiliates and (e) in response to requests from others Multiple TDUs state that the metrics should also include the number of transmission construction projects that were added to the transmission provider construction plans between the issuance of Order No 890 and the submission of the report broken down into categories (a) through (e) and into their current status (ie completed incomplete and on schedule incomplete and behind schedule and removed from plan) EEI argues that the Multiple TDUsrsquo request is unwarranted EEI maintains that due to the low incidence of economic study requests requiring such additional reporting will create an added and unnecessary burden to reporting utilities63 Multiple TDUs also state that the metric should include a narrative assessment supported by quantitative information of the transmission providerrsquos planning process efficacy64 Similarly EPSA argues that the performance metrics should include a metric
61 Multiple TDUs Comments at 6 (citing Order No 890 FERC Stats amp Regs para
31241) 62 Id at 6-7
63 EEI Reply Comments at 4
64 Multiple TDUs Comments at 7-8
25
20121015-4003 FERC PDF (Unofficial) 10152012
Docket No AD12-8-000
detailing how well a utility executes its transmission development plans EPSA explains that a utilityrsquos failure to follow its transmission plan can adversely impact customers and merchant generators Thus EPSA maintains that a metric assessing how well a utility executes its transmission plan would provide valuable information including a demonstration of how prepared a utility is to meet any future reliability needs on its system65 iii Response
Commission Staff does not recommend adding the metrics proposed by Multiple TDUs on non-reliability transmission and interconnection projects The purpose of this metric is to assess the extent to which transmission solutions are analyzed planned and deployed to meet reliability requirements Thus additional information to examine discrimination by utilities or to obtain information on all project spending including projects to meet public policy objectives would go beyond the scope of the metric The congestion issues of concern to Multiple TDUs including the impact of transmission planning on congestion are discussed further below in the Congestion Management metric
Commission Staff agrees with commenters that additional information is needed
however in the transmission planning metrics to provide a more comprehensive assessment of transmission planning performance and to allow for comparisons between ISOs and RTOs and participating utilities in regions outside of ISOs and RTOs Accordingly Commission Staff recommends additional information be included in the metrics as follows (1) the proposed dollar amount of facilities approved to be constructed for reliability purposes should be revised to also include the number of facilities so that this metric is comparable to the relevant ISORTO performance metric (2) the proposed percentage of approved construction completed metric should be revised to the percentage of approved construction on schedule and completed and (3) the proposed narrative detailing the economic studies process should be revised to a metric that measures the percentage completion of economic projects
Responding to EEI Commission Staff does not find that it would be unduly
burdensome to incorporate both the number of economic study requests and the number of economic studies accomplished into a narrative explanation of the status of planning for economic expansions Economic projects can reduce congestion which in turn can reduce costs to customers and decrease the likelihood that reliability issues will occur Therefore this information provides an important indicator on the progress made by utilities in improving the efficiency of their transmission systems
65 EPSA Comments at 7
26
20121015-4003 FERC PDF (Unofficial) 10152012
Docket No AD12-8-000
Commission Staff agrees with EPSA that the reports provided by participating utilities should also include a discussion of the status of their transmission plans Such information will allow participating utilities to explain their progress in meeting planning goals and explain the issues that may be delaying the completion of reliability and economic projects Commission Staff expects that this discussion will also address the desire of Multiple TDUs to have a narrative assessment of the efficacy of the transmission providerrsquos planning process66 and to address how utilities provide an opportunity to consider transmission needs driven by Public Policy Requirements in their planning process67
h Long-Term Reliability Transmission Planning ndash Resources
Three metrics are employed to measure the effectiveness of long-term reliability planning for resources The first metric processing time for generation interconnection requests measures the effectiveness of processes in achieving timely interconnection of new resources that are needed to ensure reliability The second metric the planned reserve margin is the planned number of MW of resources available as system reserves divided by the number of MW of peak load The third metric is a narrative discussion of demand response programs and how they are used in system planning No comments were received on this metric Commission Staff recommends that the proposed planned reserve margin metric be revised to compare the actual reserve margin to the planned reserve margin This comparison will allow for an evaluation of utility performance in achieving the planned reserve margin
i Infrastructure Investment ndash Interconnection and Transmission Process Metrics
i Performance Metric
These metrics track the progress that utilities have made in regions outside of ISOs and RTOs in completing their reliability reviews ndash namely feasibility system impact and
66 We note that this narrative assessment is in keeping with the Commissionrsquos
requirement that public utility transmission providers make available information regarding the status of transmission upgrades identified in their transmission plans See Transmission Planning and Cost Allocation by Transmission Owning and Operating Public Utilities Order No 1000 FERC Stats amp Regs para 31323 at P 159 amp n154 (2011)) order on rehrsquog Order No 1000-A 139 FERC para 61132 (2012)
67 Order No 1000 FERC Stats amp Regs para 31323 at P 203
27
20121015-4003 FERC PDF (Unofficial) 10152012
Docket No AD12-8-000
facility studies ndash of interconnection and transmission service requests in a timely and efficient manner The metrics track the number of requests the time required to complete the reliability reviews and the costs of completing each of the three types of studies There is also a metric that measures the number of transmission access denials and transmission service request denials The purpose of this metric is to provide information on the magnitude and reasons for transmission service denials and whether additional infrastructure investment is needed to avoid transmission service denials ii Comments Multiple TDUs state that the Commission should collect additional information on the completion of transmission studies Multiple TDUs state that while the metrics for ISOs and RTOs require the reporting of information on studies such measures are omitted from the draft metrics for regions outside of ISOs and RTOs without explanation Multiple TDUs argue that such metrics are even more important than in the ISO and RTO context and that it would be worth obtaining from vertically-integrated transmission providers all of the study completion metrics that ISOs and RTOs are required to produce Multiple TDUs explain that the cost of collecting and providing this information should not be inordinate and that transmission providers should already have expense tracking mechanisms in place to estimate and bill study costs Multiple TDUs state that the following additional metrics would be worth collecting from vertically-integrated transmission providers (1) percentages of long-term transmission service requests and interconnection requests that triggered study requirements (2) percentages of the studies undertaken that led to the identification of upgrade costs (3) the average estimated upgrade cost (4) the percent of transmission service requests withdrawn and the percent approved and (5) the average processing time through each process milestone identified in the transmission providerrsquos Order No 890 compliance tariff provisions such as completion of a feasibility study system impact study and facilities study Multiple TDUs claims that such information would help the Commission identify situations in which impediments to obtaining transmission or interconnection service warrant further investigation68 Multiple TDUs state that the addition of a metric concerning the number of transmission access denials or transmission service requests denied is less meaningful than it first appears Multiple TDUs explain that under the pro forma Open Access Transmission Tariff long-term transmission service requests cannot be legitimately denied instead if there is no existing transmission capability available to accommodate the request the requester is supposed to be informed that meeting the request would require additional facilities and offered the opportunity to fund studies to determine what
68 Multiple TDUs Comments at 5
28
20121015-4003 FERC PDF (Unofficial) 10152012
Docket No AD12-8-000
upgrades are needed Multiple TDUs state that a metric tracking how often entities requesting service withdraw their request for service in the face of these requirements would be worthwhile but that the proposed metric might not elicit such information69 Accordingly Multiple TDUs suggest revising the metric to require entities to report the number of long-term transmission service requests for which ATC was initially found to be unavailable and the disposition of each request with each of these points broken down between requests made by third-party transmission customers and requests made by affiliates or divisions of the transmission provider70
NIPPC contends that the Commission should require transmission operators to
report information concerning the pace of large generator interconnections including the total number of pending interconnection requests the number of pending requests in each phase of the LGIA process and the number of requests in each phase that have experienced delays in completing that phase of the interconnection process along with a narrative describing the causes of those delays71 iii Response Commission Staff agrees with Multiple TDUs that the proposed metrics should include information on how long it takes participating utilities to complete interconnection and transmission studies as a measure of the efficiency of the utilityrsquos infrastructure development process Accordingly Commission Staff recommends that the performance metrics be revised to include metrics concerning the average age of incomplete studies and the average time to complete studies Commission Staff considers the time to complete all studies to be an appropriate metric to measure the efficiency of utility interconnection and transmission study processes It is expected that the narrative discussions that accompany the metrics will address issues with the various study stages and that the discussions will address the issues of concern to Multiple TDUs Commission Staff does not consider that information on the percentage of requests that trigger studies or are withdrawn will reflect utility performance The percentage of requests that trigger studies is a function of available transmission capacity not utility performance The percentage of requests withdrawn is caused by the actions of market participants ndash not utilities ndash and therefore does not measure utility performance Therefore we are not recommending the addition of this information to the metrics reports
69 Id at 8
70 Id
71 NIPPC Comments at 4-5
29
20121015-4003 FERC PDF (Unofficial) 10152012
Docket No AD12-8-000
With regard to Multiple TDUsrsquo interest in additional metrics on transmission service denials Commission Staff expects that the narrative discussions provided by participating utilities will address issues of concern to the Multiple TDUs such as the disposition of requests for service Commission Staff notes however that this metric is not intended to measure ATC or transmission capacity in general Rather the purpose of tracking transmission service denials is to provide an additional measure of the efficiency of utilities in processing requests for transmission service and therefore is intended to be evaluated in the context of the other infrastructure investment processing metrics This information combined with explanations provided by the utilities in their narrative discussion will provide the basis for a comprehensive assessment of how utilities are managing their infrastructure development process Commission Staff does not recommend adding a metric concerning the number of pending generation interconnection requests as requested by NIPPC By measuring the time it takes utilities to complete their studies for interconnection and transmission service the proposed metric appropriately focuses on the efficiency of a utilityrsquos processing of service requests ndash irrespective of the total number of requests Also since many interconnection requests in a utilityrsquos interconnection queue may not be ready to proceed because of commercial issues and other factors beyond the control of utilities the number of pending interconnection requests is not an appropriate measure of utility performance As has been the case in the ISORTO performance metrics reports Commission Staff expects that the narrative discussion that accompanies the utility metrics on interconnections and transmission service will explain the status of their request queues and reasons for delays j Special Protection Systems Special Protection Systems72 are automatic protection systems designed to detect abnormal or predetermined system conditions and take corrective actions such as changing demand generation or system configurations in order to maintain system stability acceptable voltage levels or maintain power flows These metrics measure the performance of such Special Protection Systems based on the definition of Special Protection Systems utilized by the reporting entityrsquos Regional Entity These metrics measure both the frequency with which the region relies on these systems and their effectiveness as measured by successful activations and the number of unintended activations No comments were submitted on this metric
72 Special Protection Systems are also referred to as Special Protection Schemes
Remedial Action Schemes (RAS) or System Integrity Protection Schemes (SIPS)
30
20121015-4003 FERC PDF (Unofficial) 10152012
Docket No AD12-8-000
k Demand Response Entities responding to this metric will be required to provide a comprehensive explanation of the nature of utility demand response programs implemented for load management as well as in compliance with state requirements There were no comments on this metric l System Lambda System lambda is the incremental cost of energy of the marginal unit assuming no system constraints This metric tracks the trend in marginal fuel costs and is an important metric since fuel costs represent the largest component of wholesale energy costs The system lambda metric would not apply to utilities where the marginal price is typically set by hydro units Also system lambda data will be based on information contained in FERC Form No 714 There were no comments on this metric m Congestion Management i Performance Metric Congestion represents the cost to customers of paying for more expensive energy because physical transmission line limits do not allow full delivery of least-cost energy Entities responding to this metric would be required to provide a congestion analysis consistent with Order No 890 In Order No 890 the Commission adopted a planning principle requiring transmission providers to prepare studies identifying ldquosignificant and recurringrdquo congestion and post such studies on their OASIS The Commission explained that the studies should analyze and report on the following items (1) the location and magnitude of the congestion (2) possible remedies for the elimination of the congestion in whole or in part (3) the associated costs of congestion and (4) the cost associated with relieving congestion through system enhancements (or other means)73 ii Comments Multiple TDUs argue that merely requiring vertically-integrated transmission providers to provide a narrative detailing their economic study processes as is proposed will elicit little more than a repetition of the planning process descriptions that were filed in compliance with Order No 890
73 Order No 890 FERC Stats amp Regs para 31241 at PP 529 542
31
20121015-4003 FERC PDF (Unofficial) 10152012
Docket No AD12-8-000
iii Response Commission Staff recommends that utilities discuss the status of their transmission plans as explained in the Long-Term Transmission Planning Metrics discussed above Commission Staff expects that these discussions will address expansion plans to resolve congestion issues on their systems Therefore Commission Staff expects that the performance reports submitted by utilities will provide substantive information on congestion management n Resource Availability i Performance Metric
The proposed metric measures the percentage of time that system resources are not available because of unplanned outages as measured by the system forced outage rate No comments were submitted on the metric
ii Response Commission Staff recommends that this metric be revised to be 1 minus the
system forced outage rate Revising the metric as recommended will measure unforced capacity availability and therefore resource availability This revision will also make this metric comparable to the performance metric adopted for ISOs and RTOs Resource availability is an indication of system efficiency and cost management by utilities in regions outside of ISOs and RTOs Higher resource availability can result in the commitment of fewer peak resources (or the importation of peak supplies) that potentially have high costs thereby resulting in reduced costs o Transmission System Availability This metric measures interrupted load MWh as a percentage of load served In light of the many factors that can result in load interruptions some of which are beyond the control of utilities the narrative detailing the reasons for load interruptions will be essential in assessing performance No comments were submitted on this metric p Fuel Diversity
This metric is defined to be the percentage mix of fuel types installed and available (capacity fuel diversity) and produced (generation fuel diversity) Fuel diversity provides an indication of a utilityrsquos capability to integrate fuels with different characteristics such as lower costs or lower environmental impacts No comments were submitted on this metric
32
20121015-4003 FERC PDF (Unofficial) 10152012
Docket No AD12-8-000
q Clean Energy i Performance Metric
These metrics measure the use of ldquoclean energyrdquo74 The metrics track number of MWh of clean energy by resource type as a percentage of total energy and the number of MW of clean energy by resource type as a percentage of total capacity
ii Comments NIPPC states that the Commission should expand the clean energy metric to include information related to curtailments of clean energy resources as frequent curtailments of these resources by a transmission operator may reflect a dysfunction in the generation market since these resources have no fuel costs NIPPC explains that the metric should include the number of curtailments the duration of each curtailment the number of MW hours curtailed and the justification for the curtailment75 iii Response Commission Staff does not consider curtailments of clean energy to be a measure of the diversity of a utilityrsquos resource mix Rather curtailments of resources ndash or more accurately schedule adjustments or manual redispatch instructions by transmission providers ndash are used to maintain system reliability We note that the diversity metrics in conjunction with the narratives regarding actions taken to manage dispatch reliability and TLR (see pages 18-19 infra) will provide a basis for a comprehensive view of the issue of clean energy
D Burden Estimate
1 Information Collection Statement In its solicitation for comments Commission Staff estimated the public reporting
burden for participating utilities to be approximately 140 hours per respondent for each report
74 Clean Energy is defined to include nuclear energy and variable energy
resources including solar wind hydro geothermal and biomass resources
75 NIPPC Comments at 6
33
20121015-4003 FERC PDF (Unofficial) 10152012
Docket No AD12-8-000
2 Comment EEI asserts that the response time could be as high as 300-400 hours
3 Response
Commission Staff will adjust the burden estimate based on EEIrsquos high estimate of 300-400 hours Commission Staff considers EEIrsquos estimate to be reflective of the most time that it would take an entity to respond to the metrics While Commission Staff recognizes that this report requires additional metrics and narrative discussions Commission Staff nevertheless continues to conclude that 140 hours still represents a reasonable estimate of the burden since much of the data required should be readily available to the responding utilities However in recognition of the fact that the burden will vary from entity to entity we will revise our estimate to 245 hours per respondent which is the mid-point between these estimates
E Information Collection Statement Information Collection Statement
The following collection of information contained in these metrics is subject to
review by the Office of Management and Budget (OMB) under section 3507 of the Paperwork Reduction Act of 199576 OMBrsquos regulations require approval of certain information collection requirements imposed by agency actions77 The Commission cannot conduct this information collection unless it displays a valid OMB control number78
The collection of information requires those public utilities outside of ISOs and RTOs that choose to participate to provide information responding to the attached metrics on a periodic basis This includes the submission of price data and information relating to reliability transmission planning requests for service and system capacity The
76 44 USC sect 3507 (2006) The Paperwork Reduction Act requires OMB
approval of certain information collection activities when these activities apply to 10 or more persons Because it is estimated that 11 entities will respond to this collection the Chairman is requesting approval from OMB
77 5 CFR sect 1320 (2012)
78 The Commission is issuing a separate notice regarding the collection of information that will be published in the Federal Register to comply with the OMB requirements at 5 CFR sect 13205(a)(iv)
34
20121015-4003 FERC PDF (Unofficial) 10152012
Docket No AD12-8-000
information submitted by participating utilities would be used to help develop a common set of metrics for both ISORTO markets and non-RTOISO markets and for evaluating market performance thereafter
35
20121015-4003 FERC PDF (Unofficial) 10152012
Docket No AD12-8-000
Burden Estimate The estimated public reporting burdens for the reporting
requirements have been adjusted as described above
FERC-922 Requirements
Number of Respondents
Annually (1)
Number of
Responses per Respondent
(2)
Average Burden Hours per Response
(3)
Total Annual Burden Hours
(1)x(2)x(3) Metrics Data Collection
140 1540
Write Performance Analysis
85 935
Management Review
11 1
20 220
Total 245 2695
Cost to Comply The Chairman has projected the cost of compliance to be $184460 Technical Expertise = $168300 (1540 hours data collection + 935 hours report completion $68 per hour) Management Review = $17160 (220 hours report review $78 per hour) Cost per hour figures are calculated using BLS data79 The technical expertise category factors in the median wage for an engineer analyst attorney and economist The management category factors in the median wage for general and operations managers Based on BLS data80 both cost figures have been adjusted to include benefits (benefits represent 295 percent of the total hourly figure)
Title FERC-922 Non-RTOISO Performance Metrics
Action Proposed Collection
OMB Control No TBD
79 See httpblsgovoescurrentnaics3_221000htm
80 See httpwwwblsgovnewsreleaseececnr0htm
36
20121015-4003 FERC PDF (Unofficial) 10152012
Docket No AD12-8-000
Internal Review The Chairman has reviewed the proposed metrics and has determined that the metrics and data gathered thereunder are necessary These requirements conform to the Commissionrsquos need for efficient information collection communication and management within the energy industry The Chairman is assured by means of internal review that there is specific objective support for the burden estimates associated with the information collection requirements
Interested persons may obtain information on the reporting requirements by contacting the following Federal Energy Regulatory Commission 888 First Street NE Washington DC 20426 [Attention Ellen Brown Office of the Executive Director] e-mail DataClearancefercgov Phone (202) 502-8663 fax (202) 273-0873 Any further comments on the collections of information and the associated burden estimates in this proceeding should be sent to the Commission in this docket and may also be sent to the Office of Information and Regulatory Affairs Office of Management and Budget Washington DC 20503 [Attention Desk Officer for the Federal Energy Regulatory Commission] For security reasons comments to OMB should be submitted by e-mail to oira_submissionombeopgov Comments submitted to OMB should include Docket Number AD12-8-000 and FERC-922
37
20121015-4003 FERC PDF (Unofficial) 10152012
Docket No AD12-8-000
38
IV Appendix
20121015-4003 FERC PDF (Unofficial) 10152012
Docket No AD12-8-000 39
Performance Metric Specific Metric(s) Reliability A National or Regional
Reliability Standards Compliance
1 References to which Electricity Reliability Organization (ERO) and Regional Reliability Organization (RRO) standards are applicable 2 Number of violations self-reported and made public by NERCFERC 3 Number of violations identified and made public as RRO or ERO audit findings 4 Total number of violations made public by NERCFERC 5 Severity level of each violation made public by NERCFERC 6 Compliance with operating reserve standards 7 Unserved energy (or load shedding) caused by violations Additional detail will be provided on (1) number of events (2) duration of the events (3) whether the events occurred during onoff-peak hours (4) additional information on equipment types affected and kV of lines affected and (5) number of events (and severity and duration of events) resulting in load shedding based on the utilization of TPL-002 Footnote b criteria Items 2-7 Track the ISORTO definition ldquoThis metric is a quantification of all NERC and RRO Reliability Standards violations that have been identified during an audit or as a result of an ISORTO self-report and have been published as part of that processrdquo Non ndashISORTO utilities should limit reporting to the same eight functional areas used by the ISORTOs 1 Balancing Authority 7 Transmission Planner 2 Interchange Authority 8 Transmission Service Provider 3 Planning Authority 4 Reliability Coordinator 5 Resource Planner 6 Transmission Operator
20121015-4003 FERC PDF (Unofficial) 10152012
Docket No AD12-8-000 40
B Dispatch Reliability 1 Balance Authority Ace Limit (BAAL) OR CPS1 and CPS2
2 Number of hours of transmission load reliefs (of severity level 3 or higher) called by the incumbent transmission provider or unscheduled flows
WECC entities will report events under the WECC Unscheduled Flow Mitigation Procedure (equivalent to the NERC TLR Level three)
3 Energy Management System (EMS) availability C Operational Planning ndash
Load Forecast Accuracy Actual peak load as a percentage variance from forecasted peak load as reported in OASIS
D Wind Forecasting Accuracy
Actual wind availability compared to forecasted wind availability
E Unscheduled Flows Difference between net actual interchange (actual measured power flow in real time) and the net scheduled interchange in megawatt hours Reported in Form 714
F Transmission Outage Coordination
1 Percentage of ge 200 kV planned outages of 5 days or more for which utility notified customers at least 1 month prior to the outage commencement date 2 Percentage of ge 200kV outages cancelled by utility after having been previously approved 3 Report information posted on OASIS (percentage of outages planned and unplanned with less than 2 days notice)
20121015-4003 FERC PDF (Unofficial) 10152012
Docket No AD12-8-000 41
G Long-Term Reliability Planning ndash Transmission
Dollar amount and number of facilities approved to be constructed for reliability purposes
2 Percentage of approved construction on schedule and completed
3 Performance of planning process related to
a Requests for and number of completed reliability studies
b Requests and number of completed economic studies
Discussion of stakeholder process and identification of stakeholder groups participating
H Long-Term Reliability
Planning ndash Resources 1 Processing time for generation interconnection requests 2 Actual reserve margins compared with planned reserve margins 3 Explanation of the nature and characteristics of demand response programs and how they are used in system planning Discussion of programs to facilitate the integration of renewable resources and to mitigate any issues and uncertainty associated with scheduling renewable resources
20121015-4003 FERC PDF (Unofficial) 10152012
Docket No AD12-8-000 42
I Infrastructure Investment ndash Interconnection and Transmission Process Metrics
1 Number of requests
2 Number of studies completed
3 Average age of incomplete studies
4 Average time for completed studies
5 Total cost and types of studies completed (eg feasibility study system impact study and facility study)
6 Number of transmission access denialstransmission service requests (TSRs) denied
J Special Protection
Systems 1 Number of special protection systems
2 Percentage of special protection systems that responded as designed when activated
Applicable pool of special protection systems should be based on how the reporting entityrsquos Regional Entity defines ldquospecial protection systemsrdquo
3 Number of unintended activations
20121015-4003 FERC PDF (Unofficial) 10152012
Docket No AD12-8-000 43
System Operations Measures A Demand Response Comprehensive explanation of the nature of utility demand response programs
implemented for load management as well as in compliance with state requirements B System Lambda System Lambda (on marginal unit)
Proposed System Lambda metric would not apply to utilities where the
marginal price is typically set by hydro units System lambda data will be based on Form 714 information
C Congestion Management Congestion analysis per Order No 890 D Resource Availability 1 - System forced outage rate as measured over 12 months E Transmission System
Availability Interrupted load megawatt hours as a percentage of load served
F Fuel Diversity Fuel diversity in terms of energy installed capacity and actual production G Clean Energy 1 Clean Energy megawatt hours by resource type as a percentage of total energy
2 Clean Energy megawatts by resource type as a percentage of total capacity Organizational Effectiveness Not applicable to non-RTO
entities
20121015-4003 FERC PDF (Unofficial) 10152012
Document Content(s)
Staff Report Non-RTO Metrics Final1015 2PDF1-43
20121015-4003 FERC PDF (Unofficial) 10152012
- Staff Report Non-RTO Metrics Final1015 2PDF
- Document Content(s)
-
Docket No AD12-8-000
metrics for utilities in non-ISORTO regions (2) establish appropriate common metrics between ISOsRTOs and non-ISORTO regions (3) monitor implementation and performance and (4) evaluate performance and seek changes as necessary Consistent with FERCrsquos FY 2009 ndash 2014 Strategic Plan with the issuance of this report Commission Staff has now completed the first and second of the ldquonext stepsrdquo of the Metrics Initiative and in the coming months will evaluate the performance of utilities in non-ISORTO regions Starting with the list of metrics developed for ISOsRTOs Commission Staff met with a team of representatives of utilities that operate outside of ISOs and RTOs to develop performance metrics for utilities in non-ISORTO regions These discussions resulted in a list of 31 proposed performance metrics Commission Staff then held focused outreach meetings with a variety of industry consumer and state regulatory associations to discuss the proposed metrics9 As a follow-up to that outreach Commission Staffrsquos proposed performance metrics were noticed for public comment and reply comment in Docket No AD12-8-000 on February 23 2012 II Notice of Filing and Responsive Pleadings Notice of Commission Staffrsquos request for comments on draft metrics for regions outside of ISOs and RTOs was published in the Federal Register 77 Fed Reg 12832 (2012) with comments due on or before May 1 2012 and reply comments due on or before May 16 2012 Comments were filed by Edison Electric Institute (EEI) Electric Power Supply Association (EPSA) Joint Commenters10 Multiple TDUs11 and Northwest amp Intermountain Power Producers Coalition (NIPPC) EEI filed reply comments
9 Commission Staff Edison Electric Institute (EEI) and utility representatives met
with the Compete Coalition ISORTO Council Electric Power Supply Association (EPSA) National Association of Regulatory Utility Commissioners (NARUC) National Association of State Utility Consumer Advocates (NASUCA) and National Rural Electric Cooperative Association (NRECA)
10 Joint Protesters are AARP American Public Power Association Citizen Power Electricity Consumers Research Council and Virginia Citizens Consumer Council
11 Multiple TDUs are Public Works Commission of the City of Fayetteville North Carolina Lafayette Utilities System and the City of Orangeburg South Carolina
5
20121015-4003 FERC PDF (Unofficial) 10152012
Docket No AD12-8-000
III Discussion A Procedural Issues 1 Comments Joint Commenters argue that the process used for developing performance metrics outside of ISOs and RTOs is fundamentally flawed They claim that the metrics developed for ISOs and RTOs do not adequately measure performance because the Commission relied on the regulated ISOs and RTOs themselves to develop measures of their own performance Thus they maintain that any attempt to develop comparable metrics for public utilities outside of RTOs and ISOs is a fruitless endeavor Moreover they state that the Commission is making the same mistake here by allowing those entities that will eventually report under the metrics to drive their development While they acknowledge that regulated entities have expertise that can inform the development of the metrics they object to having regulated entities develop the metrics without the benefit of what Joint Commenters consider to be a transparent and open public process12 In reply EEI argues that the Joint Commenters overlook the fact that the metrics are the product of a collaborative process In this regard EEI notes that it and its members participated in Commission-led outreach sessions to discuss the proposed metrics and solicit feedback from stakeholders which was taken into account before the metrics were issued for public comment EEI notes that the Joint Commenters fail to provide reasons why the metrics will not be useful and cautions the Commission against ignoring the benefits of the metrics in favor of accepting the Joint Commentersrsquo unsupported claims13 2 Response Commission Staff disagrees with Joint Commentersrsquo characterization of the process used to develop the metrics for regions outside of ISOs and RTOs as ldquofundamentally flawedrdquo Commission Staff used a process similar to the process that was used to develop metrics for ISOsRTOs Commission Staff invited broad stakeholder participation and engaged in a process with EEI its members and other interested stakeholders to develop performance metrics tailored to regions outside of ISOs and RTOs Since the goal is to develop metrics that are comparable for ISOsRTOs and non-
12 Joint Commenters Comments at 2-3
13 EEI Reply Comments at 2-3
6
20121015-4003 FERC PDF (Unofficial) 10152012
Docket No AD12-8-000
ISOsRTOs Commission Staff began by assessing which ISORTO metrics should apply to non-ISOsRTOs and tailored these metrics to the non-ISORTO context Commission Staff met with representatives from various stakeholder groups and solicited comments prior to issuing the metrics for public comment Commission Staff then provided an opportunity for public comment and as further discussed below Commission Staff has taken these comments into account when crafting a final list of metrics Thus Commission Staff concludes that the process was sufficiently interactive and transparent Moreover Commission Staff concludes that any benefits to be gained from restarting the process would not justify the attendant delay in using the draft metrics to gather performance data Therefore just as similar procedural criticisms were considered in the ISORTO metrics report we also dismiss them here B Metrics Issues As noted when the draft metrics were issued for public comment the list of metrics for regions outside of ISOs and RTOs was based on the list of metrics adopted in Docket No AD10-5-000 and was tailored to markets in these regions14 Based on the comments discussed below and certain adjustments by Commission Staff 39 performance metrics have been selected for participating utilities in regions outside of ISOs and RTOs As noted above these metrics are listed in the Appendix 1 General Issues a Comments Several commenters express general support for the proposed metrics for regions outside of ISOs and RTOs EPSA explains that it supports the proposed metrics and expects that the metrics will address the factors necessary to evaluate the performance of non-ISORTO markets EPSA states that the proposed metrics appear to appropriately reflect the unique differences in the markets that exist outside of an ISO or RTO EPSA states that the development of performance metrics for non-ISORTO markets will assist the Commission by providing a solid basis for comparing markets within an ISO and RTO and those outside of such regions15
14 See Commission Staff Request Comments on Performance Metrics for Regions
Outside of RTOs and ISOs Non-ISORTO Performance Metrics Docket No AD12-8-000 at 2 (Feb 23 2012)
15 EPSA Comments at 2-3
7
20121015-4003 FERC PDF (Unofficial) 10152012
Docket No AD12-8-000
Similarly EEI states that the metrics are sufficient to provide meaningful data without being overly burdensome on members that choose to respond16 EEI cautions however that use of the data should be limited to the purposes contemplated in the notice EEI states that given the differences in the entities that voluntarily choose to respond it may be difficult to draw comparisons among them Moreover EEI states that data reported in response to the metrics should not be used as record evidence in any contested proceeding or serve as a basis for any enforcement action against an entity voluntarily providing data in response to these metrics17
A number of commenters claim that there will be gaps in the information available
without the participation of non-jurisdictional entities NIPPC explains that non-jurisdictional transmission providers play a significant role in the ldquoHybrid West marketrdquo (the area of the Western Interconnection outside of the organized markets in Alberta and California) and as a result the Commission will only have limited insight into market performance in this region without the participation of non-jurisdictional transmission providers Likewise EEI notes that several stand-alone utilities coordinate their operations with non-jurisdictional entities to maintain reliability and since these entities will not be reporting data there will be significant gaps for some of the metrics18 b Response
Commission Staff agrees with commenters that the proposed performance metrics
for non-ISORTO regions should provide a suitable basis for comparing the performance of ISOs RTOs and utilities in regions outside ISORTO markets Commission Staff will monitor implementation and performance under both the ISORTO metrics and the non-ISORTO metrics and if necessary make modifications to improve the comparability of metrics for these two sets of entities
While Commission Staff recognizes that an analysis of performance metrics in
non-ISORTO regions would be enhanced by the inclusion of information from non-jurisdictional entities as NIPPC and EEI note the performance metrics are being developed and analyzed in a voluntary and collaborative process Commission Staff encourages and welcomes information that these entities are willing to provide voluntarily
16 Id at 3
17 Id at 3 4-5
18 Id at 4
8
20121015-4003 FERC PDF (Unofficial) 10152012
Docket No AD12-8-000
2 Additional Metrics and Information a Comments
A number of commenters recommend that the Commission adopt additional metrics For instance EPSA states that the metrics should include a metric measuring and monitoring the transfer capability of a utility or transmission system as the ability to import or export megawatts (MW) into or out of a utilityrsquos transmission system is a solid indicator of that utilityrsquos or transmission systemrsquos performance EPSA explains that a metric monitoring transfer capability would assist both the Commission and the public in determining which balancing authority areas have available power to transfer which in turn could provide competitive suppliers with greater access to wholesale customers and enhance competition19
NIPPC argues that the Commission should require transmission providers to report
the extent of their participation in initiatives facilitating virtual consolidation of operations among transmission providers such as the Joint Initiative project NIPPC explains that the Joint Initiative project refers to an effort to promote market efficiency through greater cooperation among the Northern Tier Transmission Group Columbia Grid and WestConnect20 NIPPC also states that the Commission should include a metric concerning whether the transmission provider is participating in the Area Control Error Diversity Interchange Program which involves the pooling of individual Area Control Errors21 to take advantage of control error diversity22 NIPPC further maintains that the Commission should require transmission providers to indicate whether they are participating in the Joint Initiative Dynamic Scheduling System which allows dynamic
19 Id at 6
20 NIPPC Comments at 7
21 Area Control Error refers to the instantaneous difference between a balancing authorityrsquos net actual and scheduled interchange taking into account the effects of Frequency Bias and correction for meter error See North American Electric Reliability Council (NERC) Glossary of Terms Used in NERC Reliability Standards (NERC Glossary) available at httpwwwnerccomfilesGlossary_of_Terms_2012May25pdf It is a measure of the power balance on the interties between balancing authority areas
22 NIPPC Comments at 7
9
20121015-4003 FERC PDF (Unofficial) 10152012
Docket No AD12-8-000
schedules to be implemented quickly while requiring minimal changes to existingprocesses and p 23
rocedures
NIPPC argues that as parts of the western United States move to intra-hour
markets andor energy imbalance markets the Commission would benefit from information concerning which transmission providers are actively participating in those markets Similarly noting that the Commission has observed that intra-hour scheduling can reduce the cost of providing reserves to integrate variable energy resources24 NIPPC argues that the Commission should obtain information from transmission providers on whether they allow intra-hour scheduling Accordingly NIPPC urges the Commission to collect metrics describing (1) whether the transmission provider allows intra-hourly scheduling and facilitates customer participation in an intra-hour energy market (2) what products are traded in that intra-hour market (eg scheduling increments) and (3) the total number of intra-hour scheduling requests and (4) for each of the products identified the total number of transactions and the total megawatt hour (MWh) quantity of transactions25 Additionally NIPPC notes that transmission providers in the Hybrid West market26 are seeking to impose integration charges on variable energy resource generators and argues that the Commission should require transmission providers who impose such charges to report the specific charge and the specific service associated with the charge27
NIPPC also argues that the Commission should obtain information on whether the transmission provider has adopted the Joint Initiative standards ndash standardized business practices and procedures to facilitate the intra-hour schedule developed by the Joint Initiative project28 Further NIPPC claims that the Commission should obtain information from transmission providers on whether they participate in the I-TAPwebExchange and if so the number and nature of transactions using the tool29
23 Id at 8
24 Id (citing Integration of Variable Energy Resources Notice of Proposed Rulemaking 133 FERC para 61149 (2011) (VERS NOPR))
25 NIPPC Comments at 9-10
26 NIPPC defines the ldquoHybrid Westrdquo [market] as the area of the Western Interconnection outside the organized markets in Alberta and California Id at 2
27 Id at 10
28 Id
29 NIPPC explains that the Joint Initiative project developed I-TAP which reduces the number of keystrokes necessary to complete a transaction and thereby reduces the
10
20121015-4003 FERC PDF (Unofficial) 10152012
Docket No AD12-8-000
EPSA expresses concern that there are insufficient metrics for evaluating a
utilityrsquos cost to serve native load which is important for comparing the performance of utilities within an ISO or RTO with those outside30 EPSA argues that the Commission should evaluate price metrics for entities in regions outside of ISOs and RTOs EPSA asserts that establishing a price metric for these regions is consistent with the metrics established to evaluate performance in an ISO or RTO EPSA acknowledges the difficulties in comparing prices between a utility in a region outside of an RTO or ISO and one that participates in such a market Nevertheless EPSA maintains that it is important to establish some method to compare prices if the metrics are to provide a realistic method to compare ISOs and RTOs with regions outside of such markets31 EEI points out that it is the statersquos responsibility to monitor and evaluate a utilityrsquos cost of service to native load EEI argues that this is outside the Commissionrsquos jurisdiction and could further complicate state efforts to ensure that native load receives reliable cost-effective service32
b Response
With respect to EPSArsquos interest in transfer capability metrics we note that transfer capability is measured by Available Transfer Capacity (ATC)33 which is a function of system topology and the transmission capacity reserved by firm transmission customers to meet their load requirements Since many aspects of system topology are beyond the control of utilities such as system capabilities on neighboring systems and they must reserve firm capacity to meet load requirements Commission Staff does not consider ATC to be a good indication of a utilityrsquos performance
potential for errors Id at 8-9 I-TAP will not be a centralized market but instead is expected to operate as a highly-efficient bilateral market that will enable energy and capacity products to be traded in as short a term as intra-hour All participation will be voluntary with completed transactions being bilateral deals between the individual parties
30 EPSA Comments at 9
31 Id at 8 n6
32 EEI Reply Comments at 3-4
33 ATC is a measure of the flow capacity remaining on a flowgate for further commercial activity over and above already committed uses See NERC Glossary
11
20121015-4003 FERC PDF (Unofficial) 10152012
Docket No AD12-8-000
While Commission Staff does not think that ATC would be an appropriate measure of a utilityrsquos performance we share EPSArsquos concern about the under-utilization of capacity It appears that EPSA is concerned that utilities are reserving capacity that they do not utilize thereby leaving available capacity unused This can harm competition and reduce the efficiency of the electric system by limiting the ability to deliver low cost energy where it is needed Such a practice could be especially problematic where utilities do not schedule transmission until just prior to the operating hour For these reasons Commission Staff recommends that participating utilities provide a narrative discussion addressing interconnection-wide and seams issues consistent with the Commission Staff report addressing ISO and RTO markets34
As NIPPC points out initiatives such as the Joint Initiative project involving the Northern Tier Transmission Group Columbia Grid and WestConnect can be the basis for improving the efficiency of the regional transmission system through joint planning and transmission access programs For this reason Commission Staff recommends that transmission providers include narrative discussions of their participation in joint regional initiatives and progress made on improving the efficiency of regional transmission systems in their reports on interconnection-wide and seams-wide issues Also regarding NIPPCrsquos interest in tracking progress toward the development of energy imbalance markets in particular Commission Staff agrees that discussions of a transmission providerrsquos participation in such markets and the progress made in the development of these markets would be useful Imbalance markets can reduce the cost of supply and foster competition among suppliers Therefore utility participation in these programs can ultimately result in reducing the cost of power Consequently Commission Staff recommends that participating utilities include information on the development of energy imbalance markets in the narrative discussions in their performance reports However Commission Staff does not recommend adding metrics measuring the number of transactions or MW traded at this time35 In light of the early stage of development of these markets and the impact of factors beyond the control of utilities in the development of these markets it is premature to designate this information as a measure of the performance of utilities
Commission Staff agrees with NIPPC that information on utility participation in programs to facilitate the integration of variable energy resources and to mitigate any issues and uncertainty associated with scheduling variable energy resources would provide information relevant to the performance of utilities Such information would allow for an assessment of how utilities are ensuring the efficiency of their operations
34 Staff Report at 15
35 We note that this information is included in the Electric Quarterly Reports that must be filed with the Commission See 18 CFR sect 3510b (2012)
12
20121015-4003 FERC PDF (Unofficial) 10152012
Docket No AD12-8-000
while integrating renewable resources While we do not think a standard metric is necessary at this time Commission Staff nevertheless recommends that utilities include in their reports narrative discussions of their progress in implementing such programs including area control error diversity interchange dynamic scheduling systems intra-hour transmission scheduling36 and intra-hour transaction accelerator platforms Regarding NIPPCrsquos request for information on transmission grid integration charges for variable energy resources the Commission recently addressed the design of generator regulation service charges in its final rule in Docket No RM10-11-00037 Any such charges would be subject to Commission review under section 205 of the Federal Power Act38 and as a result subject to public review With respect to EPSArsquos interest in price metrics for entities in regions outside of ISOs and RTOs Commission Staff agrees with EPSA that it is difficult to compare prices outside of ISO and RTO markets with prices in these markets ISO and RTO market prices are locational marginal prices (LMPs) that are based on resource offers and load bids LMP pricing does not exist outside these markets This lack of comparability was the primary reason that Commission Staff did not propose a price metric for utilities outside ISO and RTO markets Commission Staff also considered utility cost-of-service rates that include retail costs to be unsuitable price metrics These rates include distribution and other functions that are not encompassed by the wholesale service provided by ISOs and RTOs and as noted by EEI utility cost-of-service rates are outside the Commissionrsquos jurisdiction Notwithstanding the difficulties inherent in comparing wholesale prices between ISORTO markets and regions outside ISORTO markets wholesale prices are pertinent to the performance of utilities in pricing their products competitively Accordingly Commission Staff proposes that utilities provide price metrics on their wholesale power sales derived from the transaction information and price data utilities report on wholesale power sales in the Electric Quarterly Report39 To ensure comparability with the load-
36 In the final rule in Integration of Variable Energy Resources the Commission
amended the pro forma OATT to provide all transmission customers the option of using more frequent transmission scheduling intervals within each operating hour at 15-minute intervals See Integration of Variable Energy Resources Order No 764 139 FERC para 61246 at P 91 (2012)
37 Id P 271
38 16 USC sect 824e (2006)
39 Revised Public Utility Filing Requirements Order No 2001 67 Fed Reg 31043 (May 8 2002) FERC Stats amp Regs para 31127 rehrsquog denied Order No 2001-A 100 FERC para 61074 rehrsquog denied Order No 2001-B 100 FERC para 61342 order
13
20121015-4003 FERC PDF (Unofficial) 10152012
Docket No AD12-8-000
weighted data provided by ISOs and RTOs Commission Staff proposes that participating utilities submit a single volume-weighted average annual price for energy and for capacity Commission Staff recognizes that in the regions outside of ISORTO markets as in the ISORTO markets some of the wholesale prices that are reported in the Electronic Quarterly Reports include cost-based transactions that reflect cost allocation decisions of regulators as well as market-based transactions Also wholesale power prices reflect fuel prices that are a function of global and nationwide price trends that are beyond the control of utilities To address these matters the metric could be developed to include market-based transactions only and to hold fuel prices constant in a fuel-adjusted price metric40 Commission Staff further recognizes that utilities provide a series of peak off-peak and year-round wholesale power products and therefore utilities will need to volume-weight each of these products into a single average annual price for energy and for capacity in addition to reporting peak and off-peak prices Commission Staff also requests comments on whether seasonal prices provide useful information on utility performance In light of the fact that Commission Staff is now proposing a price metric for the first time and therefore there has not been an opportunity for a full and complete discussion among stakeholders of the pros and cons of various price metric options Commission Staff is not including a price metric on the list of recommended metrics in Appendix A Rather Commission Staff recommends that participating utilities discuss in their 2012 reports their perspectives on a wholesale price metric Based on these perspectives and further discussions with interested stakeholders Commission Staff intends to recommend a price metric that participating utilities will submit in their next report following the report that is requested in this Commission Staff Report
directing filing Order No 2001-C 101 FERC para 61314 (2002) order directing filing Order No 2001-D 102 FERC para 61334 order refining filing requirements Order No 2001-E 105 FERC para 61352 (2003) order on clarification Order No 2001-F 106 FERC para 61060 (2004) order revising filing requirements Order No 2001-G 72 Fed Reg 56735 (Oct 4 2007) 120 FERC para 61270 order on rehrsquog and clarification Order No 2001-H 73 Fed Reg 1876 (Jan 10 2008) 121 FERC para 61289 (2007) order revising filing requirements Order No 2001-I 73 Fed Reg 65526 (Nov 4 2008) 125 FERC para 61103 (2008)
40 The RTO price metrics include a fuel-adjusted LMP price metric
14
20121015-4003 FERC PDF (Unofficial) 10152012
Docket No AD12-8-000
3 Discussion of Individual Metrics The two major categories of performance metrics are reliability and systems operations measures The reliability metrics were chosen to measure the reliability of day-to-day operations using metrics such as compliance with national and regional reliability standards the real-time balance of supply and demand forecasting and Special Protection Schemes and to measure long-term reliability using metrics such as long-term transmission and resource planning The systems operations measures were chosen to measure the operating performance of utilities in non-ISORTO regions using metrics such as system resource and transmission availability and system lambda a National and Regional Reliability Standards Compliance Metrics i Performance Metric This metric measures the number of violations of national and regional reliability standards provides information on how these violations were reported and indicates the severity of the violations41 The metric also details unserved energy (or load shedding) caused by violations and requires a utility to provide additional details on the number of events the duration of the events whether the events occurred during onoff peak hours and information on the equipment types affected and the kilovolts of lines affected
Consistent with the 2010 ISORTO Metrics Report the text of the metric has been revised to reflect the fact that this metric is a quantification of all NERC and Regional Reliability Organization standard violations that have been identified during an audit or as a result of a self-report and have been published as part of that process42 Additionally the text of the metric has been revised to clarify that utilities located in regions outside of ISOs and RTOs should limit reporting to the same eight functional areas used by the IS 43Os and RTOs
41 A full listing of the reliability standards is provided at
httpwwwnerccompagephpcid=2|20
42 2011 ISORTO Metrics Report Docket No AD10-5-00 at 12 (August 31 2011)
43 The eight functional areas are as follows 1) Balancing Authority 2) Interchange Authority 3) Planning Authority 4) Reliability Coordinator 5) Resource Planner 6) Transmission Operator 7) Transmission Planner and 8) Transmission Service Provider
15
20121015-4003 FERC PDF (Unofficial) 10152012
Docket No AD12-8-000
ii Comments
Multiple TDUs assert that the Commission and NERC would benefit from the collection of data regarding events when Footnote b44 is invoked and utilities interrupt non-consequential Firm Demand Multiple TDUs state that there should not be any dispute about the utility of this information and note that the Commission has directed NERC to collect information regarding the specific circumstances and frequency with which Firm Demand is planned to be interrupted as part of the Footnote b remand process45 Multiple TDUs explain that since it is not a violation of any reliability standard to interrupt non-consequential Firm Demand if Footnote b is applicable National or Regional Reliability Standards Compliance metrics will not encompass events where Footnote b is involved Multiple TDUs believe that the collection of the following categories of data would facilitate further discussion at the Commission and NERC (1) the number of incidents in which the utility relies on Footnote b in order to interrupt non-consequential Firm Demand (2) information concerning the severity of these incidents and whether there are systemic problems with the transmission system and transmission plan46 and (3) information concerning whether interrupted wholesale
44 Footnote b refers to a petition filed by the North American Electric Reliability Corporation (NERC) seeking approval of Table 1 Footnote b of four Reliability Standards Transmission Planning TPL-001-1ndash System Performance Under Normal (No Contingency) Conditions (Category A) TPL-002-1b ndash System Performance Following Loss of a Single Bulk Electric System Element (Category B) TPL-003-1a ndash System Performance Following Loss of Two or More Bulk Electric System Elements (Category C) and TPL-004-1ndash System Performance Following Extreme Events Resulting in the Loss of Two or More Bulk Electric System Elements (Category D) While Footnote b appears in all four of the above referenced TPL Reliability Standards its relevance and practical applicability is limited to TPL-002-0a See Transmission Planning Reliability Standards Order No 762 139 FERC para 61060 at P 1 amp n2 (2012) Footnote b states
Planned or controlled interruption of electric supply to radial customers or some local Network customers connected to or supplied by the Faulted element or by the affected area may occur in certain areas without impacting the overall reliability of the interconnected transmission systems To prepare for the next contingency system adjustments are permitted including curtailments of contracted Firm (non-recallable reserved) electric power Transfers
Id P 3
45 Multiple TDUs Comments at 9 (citing Order No 762 139 FERC para 61060 at P 20)
16
20121015-4003 FERC PDF (Unofficial) 10152012
Docket No AD12-8-000
transmission customers of the reporting transmission provider have notice and understanding before the interruption Multiple TDUs recognize that Footnote b is in flux and as a result urge the Commission to revisit the metrics associated with Footnote b after Footnote b is revised47
In reply to Multiple TDUs EEI argues that situations in which Footnote b is invoked are clearly contemplated under section A7 of the Reliability metrics proposed in the Commission notice48
NIPPC argues that the Commission should consider expanding the reliability standards metrics to include the number of dispatch orders issued to generators to curtail output and the specific reasons for each of those dispatch orders as a dispatch order made to a generator to avoid or mitigate a reliability violation will have the same impact on a market as a reliability violation NIPPC also argues that the metrics should include the number of and justification for schedule curtailments (or e-tag curtailments) NIPPC further maintains that the metrics should compare the percentage of the dispatch orders or schedule curtailments issued to independent power producers to the percentage of independently owned generation capacity interconnected to the transmission providerrsquos system49 iii Response
While Reliability metric A7 captures situations where Footnote b is invoked
Commission Staff concludes that for purposes of clarity it would be beneficial to have a separate metric to address the planned Firm Demand interruptions that planners use to meet the system performance requirements of TPL-002-2b Table 1 for Category B single contingency events (ie Footnote b interruptions as discussed in Order No 762) and that the metric should track the number severity and duration of these incidents This information is a good performance measure because it could expose an area of weakness in the Bulk Electric System that may need to be addressed with a capital project or an appropriate operating procedure Commission Staff recommends that in the narrative that accompanies the metrics report participating utilities discuss the actions taken to address the interruptions and the notice utilities provide customers before interruptions are made
46 We note that this request is discussed in our response infra at pp 19-20
47 Multiple TDUs Comments at 10-11
48 EEI Reply Comments at 4
49 NIPPC Comments at 4
17
20121015-4003 FERC PDF (Unofficial) 10152012
Docket No AD12-8-000
Responding to NIPPC the reliability standards metrics are limited to providing information on reliability violations Actions taken by transmission providers to curtail the dispatch of generators or adjust transmission schedules (or e-tags) are relevant to the dispatch reliability metrics discussed below As discussed in that section Commission Staff is recommending that participating utilities include narratives on all actions they take to manage dispatch reliability Commission Staff is not recommending that this information be incorporated into metrics because not all participating utilities take these actions and there are no standardized measures for these activities With respect to NIPPCrsquos request that a metric be developed to measure transmission schedule adjustments or e-tag revisions we note that these actions are the result of transmission loading reliefs (TLR) or Unscheduled Flow Relief events that are being reported in the Dispatch Reliability measure below and are already covered by the metrics For this reason Commission Staff does not recommend adding this metric
b Dispatch Reliability i Performance Metrics Dispatch reliability is measured by three metrics The proposed metrics listed in the notice retained two of the metrics used to measure dispatch reliability in ISOs and RTOs (1) Balancing Authority Area Control Error Limit or Control Performance Standard 1 and Control Performance Standard 2 and (2) Energy Management System Availability The proposed metric relating to TLR or Unscheduled Flow Relief Events would measure the number of events ndash rather than the hours as is reported in the performance metrics for ISOs and RTOs ndash of TLRs (of severity level 3 or higher) or unscheduled flows called by the incumbent transmission provider Utilities that are part of the Western Electricity Coordinating Council (WECC) will report events under the WECC Unscheduled Flow Mitigation Procedure that are equivalent to the NERC TLR Level 3 ii Comments
EPSA contends that in order to properly identify problem areas the Commission should require each transmission provider to identify the length and magnitude of each TLR event EPSA states that at a minimum each transmission owner should provide the following information (1) how long each constrained element is subject to a continuous Level 3 or higher TLR in hours (2) the number of MW of network transmission service curtailed for each continuous TLR event and for all continuous TLR events in total (3) the number of MW of firm point-to-point transmission service curtailed for each continuous TLR event and in aggregate and (4) the number of MW of non-firm transmission service curtailed per continuous TLR event and in aggregate50 EPSA
50 EPSA Comments at 3-4
18
20121015-4003 FERC PDF (Unofficial) 10152012
Docket No AD12-8-000
further states that monitoring and tracking TLR events on a system that are categorized at level 1 or 2 can provide additional insights into system dynamics as those events can be prevented by nodal market designs that dispatch around binding constraints using congestion prices Additionally EPSA states that all TLR events at level 5 or higher should be tracked and reported separately from all other TLR events as TLR events at this level indicate a severely constrained system EPSA recommends that the metrics include a metric for reporting all congestion management events ndash not only those categorized as a TLR ndash because some areas rely on a variety of other congestion management techniques EPSA further recommends including an evaluation of the number and severity level of all congestion management events of a utility or transmission system with the changes discussed above51 iii Response
Commission Staff agrees with EPSA that the metric concerning TLR should measure the duration of such events Accordingly Commission Staff recommends that the TLR metric be revised to measure the hours of TLR called by the incumbent transmission provider Commission Staff notes that this revision will result in a metric that is consistent with the metrics for ISO and RTO markets
Commission Staff does not consider information on severity level 1 and 2 events
to be measures of utility reliability performance Such events by definition only impact local area operations and as a result will not impact system reliability For this reason TLR events of level 3 and above are systemic events and are the appropriate basis for a performance metric for system reliability For TLR events of severity level 3 and above Commission Staff agrees with EPSA that the TLRUnscheduled Flow Relief metric should be supplemented with information on TLR (or Unscheduled Flow Relief) events for each severity level energy curtailment data on the number of MW curtailed and duration of curtailment information Such information along with a discussion by the participating utility of the impact of curtailments on customers and the various resource types will allow for a better informed evaluation of performance52 For this reason we
51Id at 5
52 We note that in Order No 890 the Commission concluded that requiring transmission providers to post additional information on curtailments was necessary to provide transparency and enable customers to assess whether they have been treated without undue discrimination See Preventing Undue Discrimination and Preference in Transmission Service Order No 890 FERC Stats amp Regs para 31241 at P 1626 order on rehrsquog Order No 890-A FERC Stats amp Regs para 31261 (2007) order on rehrsquog Order No 890-B 123 FERC para 61299 (2008) order on rehrsquog Order No 890-C 126 FERC para 61228 (2009) order on clarification Order No 890-D 129 FERC para 61126 (2009) For
19
20121015-4003 FERC PDF (Unofficial) 10152012
Docket No AD12-8-000
recommend that this information be included in the narrative discussions that accompany the (TLRUnscheduled Flow Relief) metric to the extent the information is available
With respect to EPSArsquos request for metrics on all congestion management activities such as Local Area Protocols Commission Staff recommends that participating utilities provide narratives on the use of Local Area Protocols out-of-merit dispatches and other techniques to resolve system dispatch reliability problems Such information will provide a context for the role played by TLRs or Unscheduled Flow Reliefs thereby providing the basis for a more comprehensive assessment of constraint management by the participating utility Since not all participating utilities use these techniques and the definitions of these techniques may differ among utilities Commission Staff does not consider this information to be appropriate for standardized metrics c Load Forecasting Accuracy
Actual peak load as a percentage variance from forecasted peak load as reported in a transmission providerrsquos OASIS measures the effectiveness of the load forecasting function of utilities in non-ISORTO regions Since load forecasting provides the basis for resource commitment this metric impacts the incurrence of resource costs The more accurate a utility is in forecasting load the greater the likelihood that it can commit sufficient resources in a cost effective manner that avoids over-commitment of resources inefficient commitment of short lead-time resources or under-utilization of available resources This metric measures the percentage difference between actual peak load and forecasted peak load No comments were submitted on this metric d Wind Forecasting Accuracy i Performance Metric This metric measures the percentage accuracy of actual wind availability compared to forecasted wind availability Improving the accuracy of the wind forecast will facilitate the timely commitment and dispatch of sufficient supplemental resources ii Comments NIPPC maintains that the Commission should clarify whether this metric applies to the wind generation assets controlled by the merchant function of the transmission provider or to the independently owned and operated wind generation interconnection to
TLR events of severity level 3 and above Commission Staff recommends including a narrative explanation of why transactions could not be continued or completed similar to what is required by Order No 890 Id P 1627
20
20121015-4003 FERC PDF (Unofficial) 10152012
Docket No AD12-8-000
the transmission providerrsquos system NIPPC argues that the metric should not extend to generators not owned or controlled by the merchant function of the transmission provider in light of the market-sensitive nature of a generatorrsquos wind forecasting accuracy and scheduling practices53 NIPPC also urges the Commission to consider expanding this metric to require a transmission provider to report whether it has implemented a centralized wind forecast system for use in its operations and if so to collect additional metrics on the accuracy of that centralized forecast54 NIPPC contends that a single metric comparing actual wind output to forecast output over the reporting period is not a useful metric as inaccuracies in the forecast may cancel out over a long reporting period NIPPC argues that a more relevant measure of accuracy would be the number of hours during the reporting period that the forecast is accurate (where the forecast is within five percent of actual output) NIPPC also suggests that the following additional metrics would be useful (1) the MW of windsolar capacity subject to the forecast (2) granularity of the forecast (monthly weekly daily hourly sub-hourly) (3) whether the forecast is integrated into the transmission providerrsquos operations (4) whether the transmission provider shares the forecast with market participants (or generation owners) and (5) an equivalent metric for forecasts associated with solar energy and hydroelectric energy55 iii Response The wind accuracy metric was intended to apply to all wind resources ndash owned and non-owned ndash on the transmission providersrsquo systems Commission Staff does not recommend excluding wind generators not owned or controlled by transmission providers from the wind accuracy metric To be an effective tool to ensure system reliability this metric must measure the accuracy of forecasts that account for all wind resources in a utilityrsquos footprint This requirement is increasingly important as wind resources become a more significant portion of total resource output When wind generators ndash including those not owned or controlled by the utility ndash provide wind availability forecasts they are performing a reliability function that has implications for system reliability management and planning Accordingly Commission Staff considers this information to be an important element in an assessment of a utilityrsquos reliability performance We encourage participating utilities to work with wind generators not owned or controlled by the utility to ensure that the data gathered and reported protects market-sensitive information from
53 NIPPC Comments at 5
54 Id
55 Id at 5-6
21
20121015-4003 FERC PDF (Unofficial) 10152012
Docket No AD12-8-000
being reported in public reports or released to utility subsidiaries that compete with these wind generators Commission Staff agrees with NIPPC that to the extent that centralized forecasting can minimize integration costs this information is an indication of utility performance Therefore Commission Staff recommends that participating utilities discuss their forecasting process in their reports With respect to NIPPCrsquos concern that inaccuracies in the forecast may cancel out Commission Staff notes that the wind accuracy forecast will be based on the mean absolute error of the forecast compared to actual wind availability Therefore all errors ndash positive and negative ndash will be measured and will not cancel out Since the proposed metric will measure the magnitude of forecast inaccuracies Commission Staff considers the proposed metric to be superior to the alternative proposed by NIPPC that only indicates the number of hours in which a forecast is outside a five percent threshold Further responding to NIPPC Commission Staff notes that forecast accuracy will be based on a comparison of the day-ahead forecast to actual availability Commission Staff also notes that the capacity of wind and solar subject to the forecast which NIPPC requests be an additional performance metric is included in the Clean Energy metric discussed below Commission Staff is not recommending the inclusion of a metric measuring the accuracy of forecasts for other variable energy resources because many utilities do not perform these forecasts or they are not performed according to a standardized process Nevertheless Commission Staff considers it appropriate that participating utilities provide narrative descriptions of their solar and hydro forecasts to the extent these resources are significant sources of energy to allow for a more complete assessment of forecasting performance e Unscheduled Flows Metric Unscheduled flows are defined as the difference between net actual interchange (actual power flow measured in real time) and net scheduled interchange The two components of unscheduled flows are inadvertent energy defined to be the difference between actual and scheduled interchange for all interties and parallel flow (or loop flow) defined to be the actual power flow on a contract path within an interconnection from one Balancing Authority Area to a second Balancing Authority Area through ldquoparallelrdquo transmission lines through a third Balancing Authority Area Parallel flows are a function of the interconnectionrsquos operating configuration line resistance and physics Unscheduled flows provide information relevant to operation planning because curtailments may occur when unscheduled flows exceed system operating limits This metric is measured by the difference between net actual interchange (actual measured power flow in real time) and the net scheduled interchange in MWh as reported in a
22
20121015-4003 FERC PDF (Unofficial) 10152012
Docket No AD12-8-000
utilityrsquos FERC Form No 714 ldquoAnnual Electric Balancing Authority Area and Planning Area Reportrdquo No comments were received on this metric f Transmission Outage Coordination i Performance Metric
The transmission outage coordination metric measures the percentage of outages planned and unplanned that occur with less than two days notice Effective transmission outage coordination will result in early notification of outages and therefore will be indicated in the metrics as a low percentage of short notice outages56 Effective transmission outage coordination by utilities in non-ISORTO regions ensures that outages do not threaten system reliability and that additional and potentially more expensive resources do not need to be committed
ii Comments ESPA recommends that the performance metrics track a utilityrsquos transmission outage performance EPSA states that the information posted on OASIS is valuable information and requests that the Commission include information regarding any transmission outages known ahead of time including the time and date of the planned outage and the planned duration of the outage57 EPSA maintains that providing this information would allow market participants to evaluate the information concerning the proposed outage and make other arrangements if necessary or otherwise take proactive steps to reduce the impact of any such planned outage EPSA states that outage performance information would also give the Commission and other observers the opportunity to evaluate how well the utility or transmission owner can schedule outages and execute that schedule58
iii Response
Commission Staff agrees with EPSA that the transmission outage metrics should include information to measure the utilitiesrsquo ability to plan for outages and successfully execute their outage plan As stated in the Commission Staff Report on ISORTO Performance Metrics effective transmission outage coordination is defined as early
56 The proposed metrics will measure outages for major transmission facilities
which are defined for purposes of the metrics as 200kV and higher
57 EPSA Comments at 7-8
58 Id at 8
23
20121015-4003 FERC PDF (Unofficial) 10152012
Docket No AD12-8-000
notification of planned outages of five days or longer ndash ie notification at least one month prior to the outage commencement date ndash and timely review of outage impacts59 Also effective transmission outage coordination is measured by the percentage of planned outages that are canceled due to conflicting planned outages as well as forced (unscheduled) outages that could cause reliability issues and additional congestion costs Commission Staff recommends adding these metrics for outages on major transmission lines of 200kV and higher to be consistent with the metrics for ISOs and RTOs60 g Long-Term Reliability Planning ndash Transmission i Performance Metric The proposed metric tracks the dollar amount of transmission facilities approved to be constructed for reliability purposes the percentage of approved construction completed the number of requests for and completed reliability studies and a narrative detailing a utilityrsquos economic study process This information measures the ability of each utilityrsquos expansion planning process to identify reliability and economic needs in advance which is essential to ensuring that market participants have sufficient time to develop either transmission or resource solutions to system reliability and economic requirements The metric also includes a narrative discussion of the transmission planning stakeholder process ii Comments Multiple TDUs state that a metric related to planning and completion of economic transmission is needed for multiple reasons First vertically-integrated transmission
59 Staff Report at 25
60 See Staff Report at Appendix B Peformance Metric F1 (Oct 21 2010) (Percentage of gt 200kV planned outages of 5 days or more that are submitted to ISORTO at least 1 month prior to the outage commencement date) We note that in Revisions to Electric Reliability Organization Definition of Bulk Electric System and Rules of Procedure Notice of Proposed Rulemaking 77 Fed Reg 39846 139 FERC para 61247 (2012) the Commission proposed to approve a modification to the currently-effective definition of ldquobulk electricrdquo systemrdquo that would establish a bright-line threshold that includes all facilities at or above 100 kV Commission Staff still considers it reasonable to require a 200 kV minimum for reporting information related to outages for performance metrics purposes particularly since this 200 kV minimum is consistent with the threshold ISOsRTOs used in their prior metric reports Nevertheless Commission Staff will monitor responses under this metric and continue to evaluate whether this is the appropriate threshold
24
20121015-4003 FERC PDF (Unofficial) 10152012
Docket No AD12-8-000
providers have inherent incentives to discriminate and underperform when performing this function Multiple TDUs state that the Commission has recognized as much and that such a metric would help measure the efficacy of the remedies that the Commission adopted in Order No 890 to address this concern61 Second the economic costs of transmission constraints are not transparent in areas without centralized markets like those found in ISOs and RTOs with congestion pricing Third more specificity is needed because a vertically-integrated transmission owner reporting on transmission construction and identifying shortfalls would be identifying its own unsuccessful outcomes62 Multiple TDUs argue that merely requiring vertically-integrated transmission providers to provide a narrative detailing their economic studies process as is proposed will elicit little more than a repetition of the planning process descriptions that were filed in compliance with Order No 890 For these reasons Multiple TDUs argue that the transmission planning and construction metric should be expanded to include the dollar amount of facilities constructed for purposes whose predominant purpose was not reliability broken down between (a) economic (b) public policy (c) facilities to support the planned generation resources of the transmission provider or its affiliates (d) transmission or interconnection requests made by the transmission provider or its affiliates and (e) in response to requests from others Multiple TDUs state that the metrics should also include the number of transmission construction projects that were added to the transmission provider construction plans between the issuance of Order No 890 and the submission of the report broken down into categories (a) through (e) and into their current status (ie completed incomplete and on schedule incomplete and behind schedule and removed from plan) EEI argues that the Multiple TDUsrsquo request is unwarranted EEI maintains that due to the low incidence of economic study requests requiring such additional reporting will create an added and unnecessary burden to reporting utilities63 Multiple TDUs also state that the metric should include a narrative assessment supported by quantitative information of the transmission providerrsquos planning process efficacy64 Similarly EPSA argues that the performance metrics should include a metric
61 Multiple TDUs Comments at 6 (citing Order No 890 FERC Stats amp Regs para
31241) 62 Id at 6-7
63 EEI Reply Comments at 4
64 Multiple TDUs Comments at 7-8
25
20121015-4003 FERC PDF (Unofficial) 10152012
Docket No AD12-8-000
detailing how well a utility executes its transmission development plans EPSA explains that a utilityrsquos failure to follow its transmission plan can adversely impact customers and merchant generators Thus EPSA maintains that a metric assessing how well a utility executes its transmission plan would provide valuable information including a demonstration of how prepared a utility is to meet any future reliability needs on its system65 iii Response
Commission Staff does not recommend adding the metrics proposed by Multiple TDUs on non-reliability transmission and interconnection projects The purpose of this metric is to assess the extent to which transmission solutions are analyzed planned and deployed to meet reliability requirements Thus additional information to examine discrimination by utilities or to obtain information on all project spending including projects to meet public policy objectives would go beyond the scope of the metric The congestion issues of concern to Multiple TDUs including the impact of transmission planning on congestion are discussed further below in the Congestion Management metric
Commission Staff agrees with commenters that additional information is needed
however in the transmission planning metrics to provide a more comprehensive assessment of transmission planning performance and to allow for comparisons between ISOs and RTOs and participating utilities in regions outside of ISOs and RTOs Accordingly Commission Staff recommends additional information be included in the metrics as follows (1) the proposed dollar amount of facilities approved to be constructed for reliability purposes should be revised to also include the number of facilities so that this metric is comparable to the relevant ISORTO performance metric (2) the proposed percentage of approved construction completed metric should be revised to the percentage of approved construction on schedule and completed and (3) the proposed narrative detailing the economic studies process should be revised to a metric that measures the percentage completion of economic projects
Responding to EEI Commission Staff does not find that it would be unduly
burdensome to incorporate both the number of economic study requests and the number of economic studies accomplished into a narrative explanation of the status of planning for economic expansions Economic projects can reduce congestion which in turn can reduce costs to customers and decrease the likelihood that reliability issues will occur Therefore this information provides an important indicator on the progress made by utilities in improving the efficiency of their transmission systems
65 EPSA Comments at 7
26
20121015-4003 FERC PDF (Unofficial) 10152012
Docket No AD12-8-000
Commission Staff agrees with EPSA that the reports provided by participating utilities should also include a discussion of the status of their transmission plans Such information will allow participating utilities to explain their progress in meeting planning goals and explain the issues that may be delaying the completion of reliability and economic projects Commission Staff expects that this discussion will also address the desire of Multiple TDUs to have a narrative assessment of the efficacy of the transmission providerrsquos planning process66 and to address how utilities provide an opportunity to consider transmission needs driven by Public Policy Requirements in their planning process67
h Long-Term Reliability Transmission Planning ndash Resources
Three metrics are employed to measure the effectiveness of long-term reliability planning for resources The first metric processing time for generation interconnection requests measures the effectiveness of processes in achieving timely interconnection of new resources that are needed to ensure reliability The second metric the planned reserve margin is the planned number of MW of resources available as system reserves divided by the number of MW of peak load The third metric is a narrative discussion of demand response programs and how they are used in system planning No comments were received on this metric Commission Staff recommends that the proposed planned reserve margin metric be revised to compare the actual reserve margin to the planned reserve margin This comparison will allow for an evaluation of utility performance in achieving the planned reserve margin
i Infrastructure Investment ndash Interconnection and Transmission Process Metrics
i Performance Metric
These metrics track the progress that utilities have made in regions outside of ISOs and RTOs in completing their reliability reviews ndash namely feasibility system impact and
66 We note that this narrative assessment is in keeping with the Commissionrsquos
requirement that public utility transmission providers make available information regarding the status of transmission upgrades identified in their transmission plans See Transmission Planning and Cost Allocation by Transmission Owning and Operating Public Utilities Order No 1000 FERC Stats amp Regs para 31323 at P 159 amp n154 (2011)) order on rehrsquog Order No 1000-A 139 FERC para 61132 (2012)
67 Order No 1000 FERC Stats amp Regs para 31323 at P 203
27
20121015-4003 FERC PDF (Unofficial) 10152012
Docket No AD12-8-000
facility studies ndash of interconnection and transmission service requests in a timely and efficient manner The metrics track the number of requests the time required to complete the reliability reviews and the costs of completing each of the three types of studies There is also a metric that measures the number of transmission access denials and transmission service request denials The purpose of this metric is to provide information on the magnitude and reasons for transmission service denials and whether additional infrastructure investment is needed to avoid transmission service denials ii Comments Multiple TDUs state that the Commission should collect additional information on the completion of transmission studies Multiple TDUs state that while the metrics for ISOs and RTOs require the reporting of information on studies such measures are omitted from the draft metrics for regions outside of ISOs and RTOs without explanation Multiple TDUs argue that such metrics are even more important than in the ISO and RTO context and that it would be worth obtaining from vertically-integrated transmission providers all of the study completion metrics that ISOs and RTOs are required to produce Multiple TDUs explain that the cost of collecting and providing this information should not be inordinate and that transmission providers should already have expense tracking mechanisms in place to estimate and bill study costs Multiple TDUs state that the following additional metrics would be worth collecting from vertically-integrated transmission providers (1) percentages of long-term transmission service requests and interconnection requests that triggered study requirements (2) percentages of the studies undertaken that led to the identification of upgrade costs (3) the average estimated upgrade cost (4) the percent of transmission service requests withdrawn and the percent approved and (5) the average processing time through each process milestone identified in the transmission providerrsquos Order No 890 compliance tariff provisions such as completion of a feasibility study system impact study and facilities study Multiple TDUs claims that such information would help the Commission identify situations in which impediments to obtaining transmission or interconnection service warrant further investigation68 Multiple TDUs state that the addition of a metric concerning the number of transmission access denials or transmission service requests denied is less meaningful than it first appears Multiple TDUs explain that under the pro forma Open Access Transmission Tariff long-term transmission service requests cannot be legitimately denied instead if there is no existing transmission capability available to accommodate the request the requester is supposed to be informed that meeting the request would require additional facilities and offered the opportunity to fund studies to determine what
68 Multiple TDUs Comments at 5
28
20121015-4003 FERC PDF (Unofficial) 10152012
Docket No AD12-8-000
upgrades are needed Multiple TDUs state that a metric tracking how often entities requesting service withdraw their request for service in the face of these requirements would be worthwhile but that the proposed metric might not elicit such information69 Accordingly Multiple TDUs suggest revising the metric to require entities to report the number of long-term transmission service requests for which ATC was initially found to be unavailable and the disposition of each request with each of these points broken down between requests made by third-party transmission customers and requests made by affiliates or divisions of the transmission provider70
NIPPC contends that the Commission should require transmission operators to
report information concerning the pace of large generator interconnections including the total number of pending interconnection requests the number of pending requests in each phase of the LGIA process and the number of requests in each phase that have experienced delays in completing that phase of the interconnection process along with a narrative describing the causes of those delays71 iii Response Commission Staff agrees with Multiple TDUs that the proposed metrics should include information on how long it takes participating utilities to complete interconnection and transmission studies as a measure of the efficiency of the utilityrsquos infrastructure development process Accordingly Commission Staff recommends that the performance metrics be revised to include metrics concerning the average age of incomplete studies and the average time to complete studies Commission Staff considers the time to complete all studies to be an appropriate metric to measure the efficiency of utility interconnection and transmission study processes It is expected that the narrative discussions that accompany the metrics will address issues with the various study stages and that the discussions will address the issues of concern to Multiple TDUs Commission Staff does not consider that information on the percentage of requests that trigger studies or are withdrawn will reflect utility performance The percentage of requests that trigger studies is a function of available transmission capacity not utility performance The percentage of requests withdrawn is caused by the actions of market participants ndash not utilities ndash and therefore does not measure utility performance Therefore we are not recommending the addition of this information to the metrics reports
69 Id at 8
70 Id
71 NIPPC Comments at 4-5
29
20121015-4003 FERC PDF (Unofficial) 10152012
Docket No AD12-8-000
With regard to Multiple TDUsrsquo interest in additional metrics on transmission service denials Commission Staff expects that the narrative discussions provided by participating utilities will address issues of concern to the Multiple TDUs such as the disposition of requests for service Commission Staff notes however that this metric is not intended to measure ATC or transmission capacity in general Rather the purpose of tracking transmission service denials is to provide an additional measure of the efficiency of utilities in processing requests for transmission service and therefore is intended to be evaluated in the context of the other infrastructure investment processing metrics This information combined with explanations provided by the utilities in their narrative discussion will provide the basis for a comprehensive assessment of how utilities are managing their infrastructure development process Commission Staff does not recommend adding a metric concerning the number of pending generation interconnection requests as requested by NIPPC By measuring the time it takes utilities to complete their studies for interconnection and transmission service the proposed metric appropriately focuses on the efficiency of a utilityrsquos processing of service requests ndash irrespective of the total number of requests Also since many interconnection requests in a utilityrsquos interconnection queue may not be ready to proceed because of commercial issues and other factors beyond the control of utilities the number of pending interconnection requests is not an appropriate measure of utility performance As has been the case in the ISORTO performance metrics reports Commission Staff expects that the narrative discussion that accompanies the utility metrics on interconnections and transmission service will explain the status of their request queues and reasons for delays j Special Protection Systems Special Protection Systems72 are automatic protection systems designed to detect abnormal or predetermined system conditions and take corrective actions such as changing demand generation or system configurations in order to maintain system stability acceptable voltage levels or maintain power flows These metrics measure the performance of such Special Protection Systems based on the definition of Special Protection Systems utilized by the reporting entityrsquos Regional Entity These metrics measure both the frequency with which the region relies on these systems and their effectiveness as measured by successful activations and the number of unintended activations No comments were submitted on this metric
72 Special Protection Systems are also referred to as Special Protection Schemes
Remedial Action Schemes (RAS) or System Integrity Protection Schemes (SIPS)
30
20121015-4003 FERC PDF (Unofficial) 10152012
Docket No AD12-8-000
k Demand Response Entities responding to this metric will be required to provide a comprehensive explanation of the nature of utility demand response programs implemented for load management as well as in compliance with state requirements There were no comments on this metric l System Lambda System lambda is the incremental cost of energy of the marginal unit assuming no system constraints This metric tracks the trend in marginal fuel costs and is an important metric since fuel costs represent the largest component of wholesale energy costs The system lambda metric would not apply to utilities where the marginal price is typically set by hydro units Also system lambda data will be based on information contained in FERC Form No 714 There were no comments on this metric m Congestion Management i Performance Metric Congestion represents the cost to customers of paying for more expensive energy because physical transmission line limits do not allow full delivery of least-cost energy Entities responding to this metric would be required to provide a congestion analysis consistent with Order No 890 In Order No 890 the Commission adopted a planning principle requiring transmission providers to prepare studies identifying ldquosignificant and recurringrdquo congestion and post such studies on their OASIS The Commission explained that the studies should analyze and report on the following items (1) the location and magnitude of the congestion (2) possible remedies for the elimination of the congestion in whole or in part (3) the associated costs of congestion and (4) the cost associated with relieving congestion through system enhancements (or other means)73 ii Comments Multiple TDUs argue that merely requiring vertically-integrated transmission providers to provide a narrative detailing their economic study processes as is proposed will elicit little more than a repetition of the planning process descriptions that were filed in compliance with Order No 890
73 Order No 890 FERC Stats amp Regs para 31241 at PP 529 542
31
20121015-4003 FERC PDF (Unofficial) 10152012
Docket No AD12-8-000
iii Response Commission Staff recommends that utilities discuss the status of their transmission plans as explained in the Long-Term Transmission Planning Metrics discussed above Commission Staff expects that these discussions will address expansion plans to resolve congestion issues on their systems Therefore Commission Staff expects that the performance reports submitted by utilities will provide substantive information on congestion management n Resource Availability i Performance Metric
The proposed metric measures the percentage of time that system resources are not available because of unplanned outages as measured by the system forced outage rate No comments were submitted on the metric
ii Response Commission Staff recommends that this metric be revised to be 1 minus the
system forced outage rate Revising the metric as recommended will measure unforced capacity availability and therefore resource availability This revision will also make this metric comparable to the performance metric adopted for ISOs and RTOs Resource availability is an indication of system efficiency and cost management by utilities in regions outside of ISOs and RTOs Higher resource availability can result in the commitment of fewer peak resources (or the importation of peak supplies) that potentially have high costs thereby resulting in reduced costs o Transmission System Availability This metric measures interrupted load MWh as a percentage of load served In light of the many factors that can result in load interruptions some of which are beyond the control of utilities the narrative detailing the reasons for load interruptions will be essential in assessing performance No comments were submitted on this metric p Fuel Diversity
This metric is defined to be the percentage mix of fuel types installed and available (capacity fuel diversity) and produced (generation fuel diversity) Fuel diversity provides an indication of a utilityrsquos capability to integrate fuels with different characteristics such as lower costs or lower environmental impacts No comments were submitted on this metric
32
20121015-4003 FERC PDF (Unofficial) 10152012
Docket No AD12-8-000
q Clean Energy i Performance Metric
These metrics measure the use of ldquoclean energyrdquo74 The metrics track number of MWh of clean energy by resource type as a percentage of total energy and the number of MW of clean energy by resource type as a percentage of total capacity
ii Comments NIPPC states that the Commission should expand the clean energy metric to include information related to curtailments of clean energy resources as frequent curtailments of these resources by a transmission operator may reflect a dysfunction in the generation market since these resources have no fuel costs NIPPC explains that the metric should include the number of curtailments the duration of each curtailment the number of MW hours curtailed and the justification for the curtailment75 iii Response Commission Staff does not consider curtailments of clean energy to be a measure of the diversity of a utilityrsquos resource mix Rather curtailments of resources ndash or more accurately schedule adjustments or manual redispatch instructions by transmission providers ndash are used to maintain system reliability We note that the diversity metrics in conjunction with the narratives regarding actions taken to manage dispatch reliability and TLR (see pages 18-19 infra) will provide a basis for a comprehensive view of the issue of clean energy
D Burden Estimate
1 Information Collection Statement In its solicitation for comments Commission Staff estimated the public reporting
burden for participating utilities to be approximately 140 hours per respondent for each report
74 Clean Energy is defined to include nuclear energy and variable energy
resources including solar wind hydro geothermal and biomass resources
75 NIPPC Comments at 6
33
20121015-4003 FERC PDF (Unofficial) 10152012
Docket No AD12-8-000
2 Comment EEI asserts that the response time could be as high as 300-400 hours
3 Response
Commission Staff will adjust the burden estimate based on EEIrsquos high estimate of 300-400 hours Commission Staff considers EEIrsquos estimate to be reflective of the most time that it would take an entity to respond to the metrics While Commission Staff recognizes that this report requires additional metrics and narrative discussions Commission Staff nevertheless continues to conclude that 140 hours still represents a reasonable estimate of the burden since much of the data required should be readily available to the responding utilities However in recognition of the fact that the burden will vary from entity to entity we will revise our estimate to 245 hours per respondent which is the mid-point between these estimates
E Information Collection Statement Information Collection Statement
The following collection of information contained in these metrics is subject to
review by the Office of Management and Budget (OMB) under section 3507 of the Paperwork Reduction Act of 199576 OMBrsquos regulations require approval of certain information collection requirements imposed by agency actions77 The Commission cannot conduct this information collection unless it displays a valid OMB control number78
The collection of information requires those public utilities outside of ISOs and RTOs that choose to participate to provide information responding to the attached metrics on a periodic basis This includes the submission of price data and information relating to reliability transmission planning requests for service and system capacity The
76 44 USC sect 3507 (2006) The Paperwork Reduction Act requires OMB
approval of certain information collection activities when these activities apply to 10 or more persons Because it is estimated that 11 entities will respond to this collection the Chairman is requesting approval from OMB
77 5 CFR sect 1320 (2012)
78 The Commission is issuing a separate notice regarding the collection of information that will be published in the Federal Register to comply with the OMB requirements at 5 CFR sect 13205(a)(iv)
34
20121015-4003 FERC PDF (Unofficial) 10152012
Docket No AD12-8-000
information submitted by participating utilities would be used to help develop a common set of metrics for both ISORTO markets and non-RTOISO markets and for evaluating market performance thereafter
35
20121015-4003 FERC PDF (Unofficial) 10152012
Docket No AD12-8-000
Burden Estimate The estimated public reporting burdens for the reporting
requirements have been adjusted as described above
FERC-922 Requirements
Number of Respondents
Annually (1)
Number of
Responses per Respondent
(2)
Average Burden Hours per Response
(3)
Total Annual Burden Hours
(1)x(2)x(3) Metrics Data Collection
140 1540
Write Performance Analysis
85 935
Management Review
11 1
20 220
Total 245 2695
Cost to Comply The Chairman has projected the cost of compliance to be $184460 Technical Expertise = $168300 (1540 hours data collection + 935 hours report completion $68 per hour) Management Review = $17160 (220 hours report review $78 per hour) Cost per hour figures are calculated using BLS data79 The technical expertise category factors in the median wage for an engineer analyst attorney and economist The management category factors in the median wage for general and operations managers Based on BLS data80 both cost figures have been adjusted to include benefits (benefits represent 295 percent of the total hourly figure)
Title FERC-922 Non-RTOISO Performance Metrics
Action Proposed Collection
OMB Control No TBD
79 See httpblsgovoescurrentnaics3_221000htm
80 See httpwwwblsgovnewsreleaseececnr0htm
36
20121015-4003 FERC PDF (Unofficial) 10152012
Docket No AD12-8-000
Internal Review The Chairman has reviewed the proposed metrics and has determined that the metrics and data gathered thereunder are necessary These requirements conform to the Commissionrsquos need for efficient information collection communication and management within the energy industry The Chairman is assured by means of internal review that there is specific objective support for the burden estimates associated with the information collection requirements
Interested persons may obtain information on the reporting requirements by contacting the following Federal Energy Regulatory Commission 888 First Street NE Washington DC 20426 [Attention Ellen Brown Office of the Executive Director] e-mail DataClearancefercgov Phone (202) 502-8663 fax (202) 273-0873 Any further comments on the collections of information and the associated burden estimates in this proceeding should be sent to the Commission in this docket and may also be sent to the Office of Information and Regulatory Affairs Office of Management and Budget Washington DC 20503 [Attention Desk Officer for the Federal Energy Regulatory Commission] For security reasons comments to OMB should be submitted by e-mail to oira_submissionombeopgov Comments submitted to OMB should include Docket Number AD12-8-000 and FERC-922
37
20121015-4003 FERC PDF (Unofficial) 10152012
Docket No AD12-8-000
38
IV Appendix
20121015-4003 FERC PDF (Unofficial) 10152012
Docket No AD12-8-000 39
Performance Metric Specific Metric(s) Reliability A National or Regional
Reliability Standards Compliance
1 References to which Electricity Reliability Organization (ERO) and Regional Reliability Organization (RRO) standards are applicable 2 Number of violations self-reported and made public by NERCFERC 3 Number of violations identified and made public as RRO or ERO audit findings 4 Total number of violations made public by NERCFERC 5 Severity level of each violation made public by NERCFERC 6 Compliance with operating reserve standards 7 Unserved energy (or load shedding) caused by violations Additional detail will be provided on (1) number of events (2) duration of the events (3) whether the events occurred during onoff-peak hours (4) additional information on equipment types affected and kV of lines affected and (5) number of events (and severity and duration of events) resulting in load shedding based on the utilization of TPL-002 Footnote b criteria Items 2-7 Track the ISORTO definition ldquoThis metric is a quantification of all NERC and RRO Reliability Standards violations that have been identified during an audit or as a result of an ISORTO self-report and have been published as part of that processrdquo Non ndashISORTO utilities should limit reporting to the same eight functional areas used by the ISORTOs 1 Balancing Authority 7 Transmission Planner 2 Interchange Authority 8 Transmission Service Provider 3 Planning Authority 4 Reliability Coordinator 5 Resource Planner 6 Transmission Operator
20121015-4003 FERC PDF (Unofficial) 10152012
Docket No AD12-8-000 40
B Dispatch Reliability 1 Balance Authority Ace Limit (BAAL) OR CPS1 and CPS2
2 Number of hours of transmission load reliefs (of severity level 3 or higher) called by the incumbent transmission provider or unscheduled flows
WECC entities will report events under the WECC Unscheduled Flow Mitigation Procedure (equivalent to the NERC TLR Level three)
3 Energy Management System (EMS) availability C Operational Planning ndash
Load Forecast Accuracy Actual peak load as a percentage variance from forecasted peak load as reported in OASIS
D Wind Forecasting Accuracy
Actual wind availability compared to forecasted wind availability
E Unscheduled Flows Difference between net actual interchange (actual measured power flow in real time) and the net scheduled interchange in megawatt hours Reported in Form 714
F Transmission Outage Coordination
1 Percentage of ge 200 kV planned outages of 5 days or more for which utility notified customers at least 1 month prior to the outage commencement date 2 Percentage of ge 200kV outages cancelled by utility after having been previously approved 3 Report information posted on OASIS (percentage of outages planned and unplanned with less than 2 days notice)
20121015-4003 FERC PDF (Unofficial) 10152012
Docket No AD12-8-000 41
G Long-Term Reliability Planning ndash Transmission
Dollar amount and number of facilities approved to be constructed for reliability purposes
2 Percentage of approved construction on schedule and completed
3 Performance of planning process related to
a Requests for and number of completed reliability studies
b Requests and number of completed economic studies
Discussion of stakeholder process and identification of stakeholder groups participating
H Long-Term Reliability
Planning ndash Resources 1 Processing time for generation interconnection requests 2 Actual reserve margins compared with planned reserve margins 3 Explanation of the nature and characteristics of demand response programs and how they are used in system planning Discussion of programs to facilitate the integration of renewable resources and to mitigate any issues and uncertainty associated with scheduling renewable resources
20121015-4003 FERC PDF (Unofficial) 10152012
Docket No AD12-8-000 42
I Infrastructure Investment ndash Interconnection and Transmission Process Metrics
1 Number of requests
2 Number of studies completed
3 Average age of incomplete studies
4 Average time for completed studies
5 Total cost and types of studies completed (eg feasibility study system impact study and facility study)
6 Number of transmission access denialstransmission service requests (TSRs) denied
J Special Protection
Systems 1 Number of special protection systems
2 Percentage of special protection systems that responded as designed when activated
Applicable pool of special protection systems should be based on how the reporting entityrsquos Regional Entity defines ldquospecial protection systemsrdquo
3 Number of unintended activations
20121015-4003 FERC PDF (Unofficial) 10152012
Docket No AD12-8-000 43
System Operations Measures A Demand Response Comprehensive explanation of the nature of utility demand response programs
implemented for load management as well as in compliance with state requirements B System Lambda System Lambda (on marginal unit)
Proposed System Lambda metric would not apply to utilities where the
marginal price is typically set by hydro units System lambda data will be based on Form 714 information
C Congestion Management Congestion analysis per Order No 890 D Resource Availability 1 - System forced outage rate as measured over 12 months E Transmission System
Availability Interrupted load megawatt hours as a percentage of load served
F Fuel Diversity Fuel diversity in terms of energy installed capacity and actual production G Clean Energy 1 Clean Energy megawatt hours by resource type as a percentage of total energy
2 Clean Energy megawatts by resource type as a percentage of total capacity Organizational Effectiveness Not applicable to non-RTO
entities
20121015-4003 FERC PDF (Unofficial) 10152012
Document Content(s)
Staff Report Non-RTO Metrics Final1015 2PDF1-43
20121015-4003 FERC PDF (Unofficial) 10152012
- Staff Report Non-RTO Metrics Final1015 2PDF
- Document Content(s)
-

Docket No AD12-8-000
2 Additional Metrics and Information a Comments
A number of commenters recommend that the Commission adopt additional metrics For instance EPSA states that the metrics should include a metric measuring and monitoring the transfer capability of a utility or transmission system as the ability to import or export megawatts (MW) into or out of a utilityrsquos transmission system is a solid indicator of that utilityrsquos or transmission systemrsquos performance EPSA explains that a metric monitoring transfer capability would assist both the Commission and the public in determining which balancing authority areas have available power to transfer which in turn could provide competitive suppliers with greater access to wholesale customers and enhance competition19
NIPPC argues that the Commission should require transmission providers to report
the extent of their participation in initiatives facilitating virtual consolidation of operations among transmission providers such as the Joint Initiative project NIPPC explains that the Joint Initiative project refers to an effort to promote market efficiency through greater cooperation among the Northern Tier Transmission Group Columbia Grid and WestConnect20 NIPPC also states that the Commission should include a metric concerning whether the transmission provider is participating in the Area Control Error Diversity Interchange Program which involves the pooling of individual Area Control Errors21 to take advantage of control error diversity22 NIPPC further maintains that the Commission should require transmission providers to indicate whether they are participating in the Joint Initiative Dynamic Scheduling System which allows dynamic
19 Id at 6
20 NIPPC Comments at 7
21 Area Control Error refers to the instantaneous difference between a balancing authorityrsquos net actual and scheduled interchange taking into account the effects of Frequency Bias and correction for meter error See North American Electric Reliability Council (NERC) Glossary of Terms Used in NERC Reliability Standards (NERC Glossary) available at httpwwwnerccomfilesGlossary_of_Terms_2012May25pdf It is a measure of the power balance on the interties between balancing authority areas
22 NIPPC Comments at 7
9
20121015-4003 FERC PDF (Unofficial) 10152012
Docket No AD12-8-000
schedules to be implemented quickly while requiring minimal changes to existingprocesses and p 23
rocedures
NIPPC argues that as parts of the western United States move to intra-hour
markets andor energy imbalance markets the Commission would benefit from information concerning which transmission providers are actively participating in those markets Similarly noting that the Commission has observed that intra-hour scheduling can reduce the cost of providing reserves to integrate variable energy resources24 NIPPC argues that the Commission should obtain information from transmission providers on whether they allow intra-hour scheduling Accordingly NIPPC urges the Commission to collect metrics describing (1) whether the transmission provider allows intra-hourly scheduling and facilitates customer participation in an intra-hour energy market (2) what products are traded in that intra-hour market (eg scheduling increments) and (3) the total number of intra-hour scheduling requests and (4) for each of the products identified the total number of transactions and the total megawatt hour (MWh) quantity of transactions25 Additionally NIPPC notes that transmission providers in the Hybrid West market26 are seeking to impose integration charges on variable energy resource generators and argues that the Commission should require transmission providers who impose such charges to report the specific charge and the specific service associated with the charge27
NIPPC also argues that the Commission should obtain information on whether the transmission provider has adopted the Joint Initiative standards ndash standardized business practices and procedures to facilitate the intra-hour schedule developed by the Joint Initiative project28 Further NIPPC claims that the Commission should obtain information from transmission providers on whether they participate in the I-TAPwebExchange and if so the number and nature of transactions using the tool29
23 Id at 8
24 Id (citing Integration of Variable Energy Resources Notice of Proposed Rulemaking 133 FERC para 61149 (2011) (VERS NOPR))
25 NIPPC Comments at 9-10
26 NIPPC defines the ldquoHybrid Westrdquo [market] as the area of the Western Interconnection outside the organized markets in Alberta and California Id at 2
27 Id at 10
28 Id
29 NIPPC explains that the Joint Initiative project developed I-TAP which reduces the number of keystrokes necessary to complete a transaction and thereby reduces the
10
20121015-4003 FERC PDF (Unofficial) 10152012
Docket No AD12-8-000
EPSA expresses concern that there are insufficient metrics for evaluating a
utilityrsquos cost to serve native load which is important for comparing the performance of utilities within an ISO or RTO with those outside30 EPSA argues that the Commission should evaluate price metrics for entities in regions outside of ISOs and RTOs EPSA asserts that establishing a price metric for these regions is consistent with the metrics established to evaluate performance in an ISO or RTO EPSA acknowledges the difficulties in comparing prices between a utility in a region outside of an RTO or ISO and one that participates in such a market Nevertheless EPSA maintains that it is important to establish some method to compare prices if the metrics are to provide a realistic method to compare ISOs and RTOs with regions outside of such markets31 EEI points out that it is the statersquos responsibility to monitor and evaluate a utilityrsquos cost of service to native load EEI argues that this is outside the Commissionrsquos jurisdiction and could further complicate state efforts to ensure that native load receives reliable cost-effective service32
b Response
With respect to EPSArsquos interest in transfer capability metrics we note that transfer capability is measured by Available Transfer Capacity (ATC)33 which is a function of system topology and the transmission capacity reserved by firm transmission customers to meet their load requirements Since many aspects of system topology are beyond the control of utilities such as system capabilities on neighboring systems and they must reserve firm capacity to meet load requirements Commission Staff does not consider ATC to be a good indication of a utilityrsquos performance
potential for errors Id at 8-9 I-TAP will not be a centralized market but instead is expected to operate as a highly-efficient bilateral market that will enable energy and capacity products to be traded in as short a term as intra-hour All participation will be voluntary with completed transactions being bilateral deals between the individual parties
30 EPSA Comments at 9
31 Id at 8 n6
32 EEI Reply Comments at 3-4
33 ATC is a measure of the flow capacity remaining on a flowgate for further commercial activity over and above already committed uses See NERC Glossary
11
20121015-4003 FERC PDF (Unofficial) 10152012
Docket No AD12-8-000
While Commission Staff does not think that ATC would be an appropriate measure of a utilityrsquos performance we share EPSArsquos concern about the under-utilization of capacity It appears that EPSA is concerned that utilities are reserving capacity that they do not utilize thereby leaving available capacity unused This can harm competition and reduce the efficiency of the electric system by limiting the ability to deliver low cost energy where it is needed Such a practice could be especially problematic where utilities do not schedule transmission until just prior to the operating hour For these reasons Commission Staff recommends that participating utilities provide a narrative discussion addressing interconnection-wide and seams issues consistent with the Commission Staff report addressing ISO and RTO markets34
As NIPPC points out initiatives such as the Joint Initiative project involving the Northern Tier Transmission Group Columbia Grid and WestConnect can be the basis for improving the efficiency of the regional transmission system through joint planning and transmission access programs For this reason Commission Staff recommends that transmission providers include narrative discussions of their participation in joint regional initiatives and progress made on improving the efficiency of regional transmission systems in their reports on interconnection-wide and seams-wide issues Also regarding NIPPCrsquos interest in tracking progress toward the development of energy imbalance markets in particular Commission Staff agrees that discussions of a transmission providerrsquos participation in such markets and the progress made in the development of these markets would be useful Imbalance markets can reduce the cost of supply and foster competition among suppliers Therefore utility participation in these programs can ultimately result in reducing the cost of power Consequently Commission Staff recommends that participating utilities include information on the development of energy imbalance markets in the narrative discussions in their performance reports However Commission Staff does not recommend adding metrics measuring the number of transactions or MW traded at this time35 In light of the early stage of development of these markets and the impact of factors beyond the control of utilities in the development of these markets it is premature to designate this information as a measure of the performance of utilities
Commission Staff agrees with NIPPC that information on utility participation in programs to facilitate the integration of variable energy resources and to mitigate any issues and uncertainty associated with scheduling variable energy resources would provide information relevant to the performance of utilities Such information would allow for an assessment of how utilities are ensuring the efficiency of their operations
34 Staff Report at 15
35 We note that this information is included in the Electric Quarterly Reports that must be filed with the Commission See 18 CFR sect 3510b (2012)
12
20121015-4003 FERC PDF (Unofficial) 10152012
Docket No AD12-8-000
while integrating renewable resources While we do not think a standard metric is necessary at this time Commission Staff nevertheless recommends that utilities include in their reports narrative discussions of their progress in implementing such programs including area control error diversity interchange dynamic scheduling systems intra-hour transmission scheduling36 and intra-hour transaction accelerator platforms Regarding NIPPCrsquos request for information on transmission grid integration charges for variable energy resources the Commission recently addressed the design of generator regulation service charges in its final rule in Docket No RM10-11-00037 Any such charges would be subject to Commission review under section 205 of the Federal Power Act38 and as a result subject to public review With respect to EPSArsquos interest in price metrics for entities in regions outside of ISOs and RTOs Commission Staff agrees with EPSA that it is difficult to compare prices outside of ISO and RTO markets with prices in these markets ISO and RTO market prices are locational marginal prices (LMPs) that are based on resource offers and load bids LMP pricing does not exist outside these markets This lack of comparability was the primary reason that Commission Staff did not propose a price metric for utilities outside ISO and RTO markets Commission Staff also considered utility cost-of-service rates that include retail costs to be unsuitable price metrics These rates include distribution and other functions that are not encompassed by the wholesale service provided by ISOs and RTOs and as noted by EEI utility cost-of-service rates are outside the Commissionrsquos jurisdiction Notwithstanding the difficulties inherent in comparing wholesale prices between ISORTO markets and regions outside ISORTO markets wholesale prices are pertinent to the performance of utilities in pricing their products competitively Accordingly Commission Staff proposes that utilities provide price metrics on their wholesale power sales derived from the transaction information and price data utilities report on wholesale power sales in the Electric Quarterly Report39 To ensure comparability with the load-
36 In the final rule in Integration of Variable Energy Resources the Commission
amended the pro forma OATT to provide all transmission customers the option of using more frequent transmission scheduling intervals within each operating hour at 15-minute intervals See Integration of Variable Energy Resources Order No 764 139 FERC para 61246 at P 91 (2012)
37 Id P 271
38 16 USC sect 824e (2006)
39 Revised Public Utility Filing Requirements Order No 2001 67 Fed Reg 31043 (May 8 2002) FERC Stats amp Regs para 31127 rehrsquog denied Order No 2001-A 100 FERC para 61074 rehrsquog denied Order No 2001-B 100 FERC para 61342 order
13
20121015-4003 FERC PDF (Unofficial) 10152012
Docket No AD12-8-000
weighted data provided by ISOs and RTOs Commission Staff proposes that participating utilities submit a single volume-weighted average annual price for energy and for capacity Commission Staff recognizes that in the regions outside of ISORTO markets as in the ISORTO markets some of the wholesale prices that are reported in the Electronic Quarterly Reports include cost-based transactions that reflect cost allocation decisions of regulators as well as market-based transactions Also wholesale power prices reflect fuel prices that are a function of global and nationwide price trends that are beyond the control of utilities To address these matters the metric could be developed to include market-based transactions only and to hold fuel prices constant in a fuel-adjusted price metric40 Commission Staff further recognizes that utilities provide a series of peak off-peak and year-round wholesale power products and therefore utilities will need to volume-weight each of these products into a single average annual price for energy and for capacity in addition to reporting peak and off-peak prices Commission Staff also requests comments on whether seasonal prices provide useful information on utility performance In light of the fact that Commission Staff is now proposing a price metric for the first time and therefore there has not been an opportunity for a full and complete discussion among stakeholders of the pros and cons of various price metric options Commission Staff is not including a price metric on the list of recommended metrics in Appendix A Rather Commission Staff recommends that participating utilities discuss in their 2012 reports their perspectives on a wholesale price metric Based on these perspectives and further discussions with interested stakeholders Commission Staff intends to recommend a price metric that participating utilities will submit in their next report following the report that is requested in this Commission Staff Report
directing filing Order No 2001-C 101 FERC para 61314 (2002) order directing filing Order No 2001-D 102 FERC para 61334 order refining filing requirements Order No 2001-E 105 FERC para 61352 (2003) order on clarification Order No 2001-F 106 FERC para 61060 (2004) order revising filing requirements Order No 2001-G 72 Fed Reg 56735 (Oct 4 2007) 120 FERC para 61270 order on rehrsquog and clarification Order No 2001-H 73 Fed Reg 1876 (Jan 10 2008) 121 FERC para 61289 (2007) order revising filing requirements Order No 2001-I 73 Fed Reg 65526 (Nov 4 2008) 125 FERC para 61103 (2008)
40 The RTO price metrics include a fuel-adjusted LMP price metric
14
20121015-4003 FERC PDF (Unofficial) 10152012
Docket No AD12-8-000
3 Discussion of Individual Metrics The two major categories of performance metrics are reliability and systems operations measures The reliability metrics were chosen to measure the reliability of day-to-day operations using metrics such as compliance with national and regional reliability standards the real-time balance of supply and demand forecasting and Special Protection Schemes and to measure long-term reliability using metrics such as long-term transmission and resource planning The systems operations measures were chosen to measure the operating performance of utilities in non-ISORTO regions using metrics such as system resource and transmission availability and system lambda a National and Regional Reliability Standards Compliance Metrics i Performance Metric This metric measures the number of violations of national and regional reliability standards provides information on how these violations were reported and indicates the severity of the violations41 The metric also details unserved energy (or load shedding) caused by violations and requires a utility to provide additional details on the number of events the duration of the events whether the events occurred during onoff peak hours and information on the equipment types affected and the kilovolts of lines affected
Consistent with the 2010 ISORTO Metrics Report the text of the metric has been revised to reflect the fact that this metric is a quantification of all NERC and Regional Reliability Organization standard violations that have been identified during an audit or as a result of a self-report and have been published as part of that process42 Additionally the text of the metric has been revised to clarify that utilities located in regions outside of ISOs and RTOs should limit reporting to the same eight functional areas used by the IS 43Os and RTOs
41 A full listing of the reliability standards is provided at
httpwwwnerccompagephpcid=2|20
42 2011 ISORTO Metrics Report Docket No AD10-5-00 at 12 (August 31 2011)
43 The eight functional areas are as follows 1) Balancing Authority 2) Interchange Authority 3) Planning Authority 4) Reliability Coordinator 5) Resource Planner 6) Transmission Operator 7) Transmission Planner and 8) Transmission Service Provider
15
20121015-4003 FERC PDF (Unofficial) 10152012
Docket No AD12-8-000
ii Comments
Multiple TDUs assert that the Commission and NERC would benefit from the collection of data regarding events when Footnote b44 is invoked and utilities interrupt non-consequential Firm Demand Multiple TDUs state that there should not be any dispute about the utility of this information and note that the Commission has directed NERC to collect information regarding the specific circumstances and frequency with which Firm Demand is planned to be interrupted as part of the Footnote b remand process45 Multiple TDUs explain that since it is not a violation of any reliability standard to interrupt non-consequential Firm Demand if Footnote b is applicable National or Regional Reliability Standards Compliance metrics will not encompass events where Footnote b is involved Multiple TDUs believe that the collection of the following categories of data would facilitate further discussion at the Commission and NERC (1) the number of incidents in which the utility relies on Footnote b in order to interrupt non-consequential Firm Demand (2) information concerning the severity of these incidents and whether there are systemic problems with the transmission system and transmission plan46 and (3) information concerning whether interrupted wholesale
44 Footnote b refers to a petition filed by the North American Electric Reliability Corporation (NERC) seeking approval of Table 1 Footnote b of four Reliability Standards Transmission Planning TPL-001-1ndash System Performance Under Normal (No Contingency) Conditions (Category A) TPL-002-1b ndash System Performance Following Loss of a Single Bulk Electric System Element (Category B) TPL-003-1a ndash System Performance Following Loss of Two or More Bulk Electric System Elements (Category C) and TPL-004-1ndash System Performance Following Extreme Events Resulting in the Loss of Two or More Bulk Electric System Elements (Category D) While Footnote b appears in all four of the above referenced TPL Reliability Standards its relevance and practical applicability is limited to TPL-002-0a See Transmission Planning Reliability Standards Order No 762 139 FERC para 61060 at P 1 amp n2 (2012) Footnote b states
Planned or controlled interruption of electric supply to radial customers or some local Network customers connected to or supplied by the Faulted element or by the affected area may occur in certain areas without impacting the overall reliability of the interconnected transmission systems To prepare for the next contingency system adjustments are permitted including curtailments of contracted Firm (non-recallable reserved) electric power Transfers
Id P 3
45 Multiple TDUs Comments at 9 (citing Order No 762 139 FERC para 61060 at P 20)
16
20121015-4003 FERC PDF (Unofficial) 10152012
Docket No AD12-8-000
transmission customers of the reporting transmission provider have notice and understanding before the interruption Multiple TDUs recognize that Footnote b is in flux and as a result urge the Commission to revisit the metrics associated with Footnote b after Footnote b is revised47
In reply to Multiple TDUs EEI argues that situations in which Footnote b is invoked are clearly contemplated under section A7 of the Reliability metrics proposed in the Commission notice48
NIPPC argues that the Commission should consider expanding the reliability standards metrics to include the number of dispatch orders issued to generators to curtail output and the specific reasons for each of those dispatch orders as a dispatch order made to a generator to avoid or mitigate a reliability violation will have the same impact on a market as a reliability violation NIPPC also argues that the metrics should include the number of and justification for schedule curtailments (or e-tag curtailments) NIPPC further maintains that the metrics should compare the percentage of the dispatch orders or schedule curtailments issued to independent power producers to the percentage of independently owned generation capacity interconnected to the transmission providerrsquos system49 iii Response
While Reliability metric A7 captures situations where Footnote b is invoked
Commission Staff concludes that for purposes of clarity it would be beneficial to have a separate metric to address the planned Firm Demand interruptions that planners use to meet the system performance requirements of TPL-002-2b Table 1 for Category B single contingency events (ie Footnote b interruptions as discussed in Order No 762) and that the metric should track the number severity and duration of these incidents This information is a good performance measure because it could expose an area of weakness in the Bulk Electric System that may need to be addressed with a capital project or an appropriate operating procedure Commission Staff recommends that in the narrative that accompanies the metrics report participating utilities discuss the actions taken to address the interruptions and the notice utilities provide customers before interruptions are made
46 We note that this request is discussed in our response infra at pp 19-20
47 Multiple TDUs Comments at 10-11
48 EEI Reply Comments at 4
49 NIPPC Comments at 4
17
20121015-4003 FERC PDF (Unofficial) 10152012
Docket No AD12-8-000
Responding to NIPPC the reliability standards metrics are limited to providing information on reliability violations Actions taken by transmission providers to curtail the dispatch of generators or adjust transmission schedules (or e-tags) are relevant to the dispatch reliability metrics discussed below As discussed in that section Commission Staff is recommending that participating utilities include narratives on all actions they take to manage dispatch reliability Commission Staff is not recommending that this information be incorporated into metrics because not all participating utilities take these actions and there are no standardized measures for these activities With respect to NIPPCrsquos request that a metric be developed to measure transmission schedule adjustments or e-tag revisions we note that these actions are the result of transmission loading reliefs (TLR) or Unscheduled Flow Relief events that are being reported in the Dispatch Reliability measure below and are already covered by the metrics For this reason Commission Staff does not recommend adding this metric
b Dispatch Reliability i Performance Metrics Dispatch reliability is measured by three metrics The proposed metrics listed in the notice retained two of the metrics used to measure dispatch reliability in ISOs and RTOs (1) Balancing Authority Area Control Error Limit or Control Performance Standard 1 and Control Performance Standard 2 and (2) Energy Management System Availability The proposed metric relating to TLR or Unscheduled Flow Relief Events would measure the number of events ndash rather than the hours as is reported in the performance metrics for ISOs and RTOs ndash of TLRs (of severity level 3 or higher) or unscheduled flows called by the incumbent transmission provider Utilities that are part of the Western Electricity Coordinating Council (WECC) will report events under the WECC Unscheduled Flow Mitigation Procedure that are equivalent to the NERC TLR Level 3 ii Comments
EPSA contends that in order to properly identify problem areas the Commission should require each transmission provider to identify the length and magnitude of each TLR event EPSA states that at a minimum each transmission owner should provide the following information (1) how long each constrained element is subject to a continuous Level 3 or higher TLR in hours (2) the number of MW of network transmission service curtailed for each continuous TLR event and for all continuous TLR events in total (3) the number of MW of firm point-to-point transmission service curtailed for each continuous TLR event and in aggregate and (4) the number of MW of non-firm transmission service curtailed per continuous TLR event and in aggregate50 EPSA
50 EPSA Comments at 3-4
18
20121015-4003 FERC PDF (Unofficial) 10152012
Docket No AD12-8-000
further states that monitoring and tracking TLR events on a system that are categorized at level 1 or 2 can provide additional insights into system dynamics as those events can be prevented by nodal market designs that dispatch around binding constraints using congestion prices Additionally EPSA states that all TLR events at level 5 or higher should be tracked and reported separately from all other TLR events as TLR events at this level indicate a severely constrained system EPSA recommends that the metrics include a metric for reporting all congestion management events ndash not only those categorized as a TLR ndash because some areas rely on a variety of other congestion management techniques EPSA further recommends including an evaluation of the number and severity level of all congestion management events of a utility or transmission system with the changes discussed above51 iii Response
Commission Staff agrees with EPSA that the metric concerning TLR should measure the duration of such events Accordingly Commission Staff recommends that the TLR metric be revised to measure the hours of TLR called by the incumbent transmission provider Commission Staff notes that this revision will result in a metric that is consistent with the metrics for ISO and RTO markets
Commission Staff does not consider information on severity level 1 and 2 events
to be measures of utility reliability performance Such events by definition only impact local area operations and as a result will not impact system reliability For this reason TLR events of level 3 and above are systemic events and are the appropriate basis for a performance metric for system reliability For TLR events of severity level 3 and above Commission Staff agrees with EPSA that the TLRUnscheduled Flow Relief metric should be supplemented with information on TLR (or Unscheduled Flow Relief) events for each severity level energy curtailment data on the number of MW curtailed and duration of curtailment information Such information along with a discussion by the participating utility of the impact of curtailments on customers and the various resource types will allow for a better informed evaluation of performance52 For this reason we
51Id at 5
52 We note that in Order No 890 the Commission concluded that requiring transmission providers to post additional information on curtailments was necessary to provide transparency and enable customers to assess whether they have been treated without undue discrimination See Preventing Undue Discrimination and Preference in Transmission Service Order No 890 FERC Stats amp Regs para 31241 at P 1626 order on rehrsquog Order No 890-A FERC Stats amp Regs para 31261 (2007) order on rehrsquog Order No 890-B 123 FERC para 61299 (2008) order on rehrsquog Order No 890-C 126 FERC para 61228 (2009) order on clarification Order No 890-D 129 FERC para 61126 (2009) For
19
20121015-4003 FERC PDF (Unofficial) 10152012
Docket No AD12-8-000
recommend that this information be included in the narrative discussions that accompany the (TLRUnscheduled Flow Relief) metric to the extent the information is available
With respect to EPSArsquos request for metrics on all congestion management activities such as Local Area Protocols Commission Staff recommends that participating utilities provide narratives on the use of Local Area Protocols out-of-merit dispatches and other techniques to resolve system dispatch reliability problems Such information will provide a context for the role played by TLRs or Unscheduled Flow Reliefs thereby providing the basis for a more comprehensive assessment of constraint management by the participating utility Since not all participating utilities use these techniques and the definitions of these techniques may differ among utilities Commission Staff does not consider this information to be appropriate for standardized metrics c Load Forecasting Accuracy
Actual peak load as a percentage variance from forecasted peak load as reported in a transmission providerrsquos OASIS measures the effectiveness of the load forecasting function of utilities in non-ISORTO regions Since load forecasting provides the basis for resource commitment this metric impacts the incurrence of resource costs The more accurate a utility is in forecasting load the greater the likelihood that it can commit sufficient resources in a cost effective manner that avoids over-commitment of resources inefficient commitment of short lead-time resources or under-utilization of available resources This metric measures the percentage difference between actual peak load and forecasted peak load No comments were submitted on this metric d Wind Forecasting Accuracy i Performance Metric This metric measures the percentage accuracy of actual wind availability compared to forecasted wind availability Improving the accuracy of the wind forecast will facilitate the timely commitment and dispatch of sufficient supplemental resources ii Comments NIPPC maintains that the Commission should clarify whether this metric applies to the wind generation assets controlled by the merchant function of the transmission provider or to the independently owned and operated wind generation interconnection to
TLR events of severity level 3 and above Commission Staff recommends including a narrative explanation of why transactions could not be continued or completed similar to what is required by Order No 890 Id P 1627
20
20121015-4003 FERC PDF (Unofficial) 10152012
Docket No AD12-8-000
the transmission providerrsquos system NIPPC argues that the metric should not extend to generators not owned or controlled by the merchant function of the transmission provider in light of the market-sensitive nature of a generatorrsquos wind forecasting accuracy and scheduling practices53 NIPPC also urges the Commission to consider expanding this metric to require a transmission provider to report whether it has implemented a centralized wind forecast system for use in its operations and if so to collect additional metrics on the accuracy of that centralized forecast54 NIPPC contends that a single metric comparing actual wind output to forecast output over the reporting period is not a useful metric as inaccuracies in the forecast may cancel out over a long reporting period NIPPC argues that a more relevant measure of accuracy would be the number of hours during the reporting period that the forecast is accurate (where the forecast is within five percent of actual output) NIPPC also suggests that the following additional metrics would be useful (1) the MW of windsolar capacity subject to the forecast (2) granularity of the forecast (monthly weekly daily hourly sub-hourly) (3) whether the forecast is integrated into the transmission providerrsquos operations (4) whether the transmission provider shares the forecast with market participants (or generation owners) and (5) an equivalent metric for forecasts associated with solar energy and hydroelectric energy55 iii Response The wind accuracy metric was intended to apply to all wind resources ndash owned and non-owned ndash on the transmission providersrsquo systems Commission Staff does not recommend excluding wind generators not owned or controlled by transmission providers from the wind accuracy metric To be an effective tool to ensure system reliability this metric must measure the accuracy of forecasts that account for all wind resources in a utilityrsquos footprint This requirement is increasingly important as wind resources become a more significant portion of total resource output When wind generators ndash including those not owned or controlled by the utility ndash provide wind availability forecasts they are performing a reliability function that has implications for system reliability management and planning Accordingly Commission Staff considers this information to be an important element in an assessment of a utilityrsquos reliability performance We encourage participating utilities to work with wind generators not owned or controlled by the utility to ensure that the data gathered and reported protects market-sensitive information from
53 NIPPC Comments at 5
54 Id
55 Id at 5-6
21
20121015-4003 FERC PDF (Unofficial) 10152012
Docket No AD12-8-000
being reported in public reports or released to utility subsidiaries that compete with these wind generators Commission Staff agrees with NIPPC that to the extent that centralized forecasting can minimize integration costs this information is an indication of utility performance Therefore Commission Staff recommends that participating utilities discuss their forecasting process in their reports With respect to NIPPCrsquos concern that inaccuracies in the forecast may cancel out Commission Staff notes that the wind accuracy forecast will be based on the mean absolute error of the forecast compared to actual wind availability Therefore all errors ndash positive and negative ndash will be measured and will not cancel out Since the proposed metric will measure the magnitude of forecast inaccuracies Commission Staff considers the proposed metric to be superior to the alternative proposed by NIPPC that only indicates the number of hours in which a forecast is outside a five percent threshold Further responding to NIPPC Commission Staff notes that forecast accuracy will be based on a comparison of the day-ahead forecast to actual availability Commission Staff also notes that the capacity of wind and solar subject to the forecast which NIPPC requests be an additional performance metric is included in the Clean Energy metric discussed below Commission Staff is not recommending the inclusion of a metric measuring the accuracy of forecasts for other variable energy resources because many utilities do not perform these forecasts or they are not performed according to a standardized process Nevertheless Commission Staff considers it appropriate that participating utilities provide narrative descriptions of their solar and hydro forecasts to the extent these resources are significant sources of energy to allow for a more complete assessment of forecasting performance e Unscheduled Flows Metric Unscheduled flows are defined as the difference between net actual interchange (actual power flow measured in real time) and net scheduled interchange The two components of unscheduled flows are inadvertent energy defined to be the difference between actual and scheduled interchange for all interties and parallel flow (or loop flow) defined to be the actual power flow on a contract path within an interconnection from one Balancing Authority Area to a second Balancing Authority Area through ldquoparallelrdquo transmission lines through a third Balancing Authority Area Parallel flows are a function of the interconnectionrsquos operating configuration line resistance and physics Unscheduled flows provide information relevant to operation planning because curtailments may occur when unscheduled flows exceed system operating limits This metric is measured by the difference between net actual interchange (actual measured power flow in real time) and the net scheduled interchange in MWh as reported in a
22
20121015-4003 FERC PDF (Unofficial) 10152012
Docket No AD12-8-000
utilityrsquos FERC Form No 714 ldquoAnnual Electric Balancing Authority Area and Planning Area Reportrdquo No comments were received on this metric f Transmission Outage Coordination i Performance Metric
The transmission outage coordination metric measures the percentage of outages planned and unplanned that occur with less than two days notice Effective transmission outage coordination will result in early notification of outages and therefore will be indicated in the metrics as a low percentage of short notice outages56 Effective transmission outage coordination by utilities in non-ISORTO regions ensures that outages do not threaten system reliability and that additional and potentially more expensive resources do not need to be committed
ii Comments ESPA recommends that the performance metrics track a utilityrsquos transmission outage performance EPSA states that the information posted on OASIS is valuable information and requests that the Commission include information regarding any transmission outages known ahead of time including the time and date of the planned outage and the planned duration of the outage57 EPSA maintains that providing this information would allow market participants to evaluate the information concerning the proposed outage and make other arrangements if necessary or otherwise take proactive steps to reduce the impact of any such planned outage EPSA states that outage performance information would also give the Commission and other observers the opportunity to evaluate how well the utility or transmission owner can schedule outages and execute that schedule58
iii Response
Commission Staff agrees with EPSA that the transmission outage metrics should include information to measure the utilitiesrsquo ability to plan for outages and successfully execute their outage plan As stated in the Commission Staff Report on ISORTO Performance Metrics effective transmission outage coordination is defined as early
56 The proposed metrics will measure outages for major transmission facilities
which are defined for purposes of the metrics as 200kV and higher
57 EPSA Comments at 7-8
58 Id at 8
23
20121015-4003 FERC PDF (Unofficial) 10152012
Docket No AD12-8-000
notification of planned outages of five days or longer ndash ie notification at least one month prior to the outage commencement date ndash and timely review of outage impacts59 Also effective transmission outage coordination is measured by the percentage of planned outages that are canceled due to conflicting planned outages as well as forced (unscheduled) outages that could cause reliability issues and additional congestion costs Commission Staff recommends adding these metrics for outages on major transmission lines of 200kV and higher to be consistent with the metrics for ISOs and RTOs60 g Long-Term Reliability Planning ndash Transmission i Performance Metric The proposed metric tracks the dollar amount of transmission facilities approved to be constructed for reliability purposes the percentage of approved construction completed the number of requests for and completed reliability studies and a narrative detailing a utilityrsquos economic study process This information measures the ability of each utilityrsquos expansion planning process to identify reliability and economic needs in advance which is essential to ensuring that market participants have sufficient time to develop either transmission or resource solutions to system reliability and economic requirements The metric also includes a narrative discussion of the transmission planning stakeholder process ii Comments Multiple TDUs state that a metric related to planning and completion of economic transmission is needed for multiple reasons First vertically-integrated transmission
59 Staff Report at 25
60 See Staff Report at Appendix B Peformance Metric F1 (Oct 21 2010) (Percentage of gt 200kV planned outages of 5 days or more that are submitted to ISORTO at least 1 month prior to the outage commencement date) We note that in Revisions to Electric Reliability Organization Definition of Bulk Electric System and Rules of Procedure Notice of Proposed Rulemaking 77 Fed Reg 39846 139 FERC para 61247 (2012) the Commission proposed to approve a modification to the currently-effective definition of ldquobulk electricrdquo systemrdquo that would establish a bright-line threshold that includes all facilities at or above 100 kV Commission Staff still considers it reasonable to require a 200 kV minimum for reporting information related to outages for performance metrics purposes particularly since this 200 kV minimum is consistent with the threshold ISOsRTOs used in their prior metric reports Nevertheless Commission Staff will monitor responses under this metric and continue to evaluate whether this is the appropriate threshold
24
20121015-4003 FERC PDF (Unofficial) 10152012
Docket No AD12-8-000
providers have inherent incentives to discriminate and underperform when performing this function Multiple TDUs state that the Commission has recognized as much and that such a metric would help measure the efficacy of the remedies that the Commission adopted in Order No 890 to address this concern61 Second the economic costs of transmission constraints are not transparent in areas without centralized markets like those found in ISOs and RTOs with congestion pricing Third more specificity is needed because a vertically-integrated transmission owner reporting on transmission construction and identifying shortfalls would be identifying its own unsuccessful outcomes62 Multiple TDUs argue that merely requiring vertically-integrated transmission providers to provide a narrative detailing their economic studies process as is proposed will elicit little more than a repetition of the planning process descriptions that were filed in compliance with Order No 890 For these reasons Multiple TDUs argue that the transmission planning and construction metric should be expanded to include the dollar amount of facilities constructed for purposes whose predominant purpose was not reliability broken down between (a) economic (b) public policy (c) facilities to support the planned generation resources of the transmission provider or its affiliates (d) transmission or interconnection requests made by the transmission provider or its affiliates and (e) in response to requests from others Multiple TDUs state that the metrics should also include the number of transmission construction projects that were added to the transmission provider construction plans between the issuance of Order No 890 and the submission of the report broken down into categories (a) through (e) and into their current status (ie completed incomplete and on schedule incomplete and behind schedule and removed from plan) EEI argues that the Multiple TDUsrsquo request is unwarranted EEI maintains that due to the low incidence of economic study requests requiring such additional reporting will create an added and unnecessary burden to reporting utilities63 Multiple TDUs also state that the metric should include a narrative assessment supported by quantitative information of the transmission providerrsquos planning process efficacy64 Similarly EPSA argues that the performance metrics should include a metric
61 Multiple TDUs Comments at 6 (citing Order No 890 FERC Stats amp Regs para
31241) 62 Id at 6-7
63 EEI Reply Comments at 4
64 Multiple TDUs Comments at 7-8
25
20121015-4003 FERC PDF (Unofficial) 10152012
Docket No AD12-8-000
detailing how well a utility executes its transmission development plans EPSA explains that a utilityrsquos failure to follow its transmission plan can adversely impact customers and merchant generators Thus EPSA maintains that a metric assessing how well a utility executes its transmission plan would provide valuable information including a demonstration of how prepared a utility is to meet any future reliability needs on its system65 iii Response
Commission Staff does not recommend adding the metrics proposed by Multiple TDUs on non-reliability transmission and interconnection projects The purpose of this metric is to assess the extent to which transmission solutions are analyzed planned and deployed to meet reliability requirements Thus additional information to examine discrimination by utilities or to obtain information on all project spending including projects to meet public policy objectives would go beyond the scope of the metric The congestion issues of concern to Multiple TDUs including the impact of transmission planning on congestion are discussed further below in the Congestion Management metric
Commission Staff agrees with commenters that additional information is needed
however in the transmission planning metrics to provide a more comprehensive assessment of transmission planning performance and to allow for comparisons between ISOs and RTOs and participating utilities in regions outside of ISOs and RTOs Accordingly Commission Staff recommends additional information be included in the metrics as follows (1) the proposed dollar amount of facilities approved to be constructed for reliability purposes should be revised to also include the number of facilities so that this metric is comparable to the relevant ISORTO performance metric (2) the proposed percentage of approved construction completed metric should be revised to the percentage of approved construction on schedule and completed and (3) the proposed narrative detailing the economic studies process should be revised to a metric that measures the percentage completion of economic projects
Responding to EEI Commission Staff does not find that it would be unduly
burdensome to incorporate both the number of economic study requests and the number of economic studies accomplished into a narrative explanation of the status of planning for economic expansions Economic projects can reduce congestion which in turn can reduce costs to customers and decrease the likelihood that reliability issues will occur Therefore this information provides an important indicator on the progress made by utilities in improving the efficiency of their transmission systems
65 EPSA Comments at 7
26
20121015-4003 FERC PDF (Unofficial) 10152012
Docket No AD12-8-000
Commission Staff agrees with EPSA that the reports provided by participating utilities should also include a discussion of the status of their transmission plans Such information will allow participating utilities to explain their progress in meeting planning goals and explain the issues that may be delaying the completion of reliability and economic projects Commission Staff expects that this discussion will also address the desire of Multiple TDUs to have a narrative assessment of the efficacy of the transmission providerrsquos planning process66 and to address how utilities provide an opportunity to consider transmission needs driven by Public Policy Requirements in their planning process67
h Long-Term Reliability Transmission Planning ndash Resources
Three metrics are employed to measure the effectiveness of long-term reliability planning for resources The first metric processing time for generation interconnection requests measures the effectiveness of processes in achieving timely interconnection of new resources that are needed to ensure reliability The second metric the planned reserve margin is the planned number of MW of resources available as system reserves divided by the number of MW of peak load The third metric is a narrative discussion of demand response programs and how they are used in system planning No comments were received on this metric Commission Staff recommends that the proposed planned reserve margin metric be revised to compare the actual reserve margin to the planned reserve margin This comparison will allow for an evaluation of utility performance in achieving the planned reserve margin
i Infrastructure Investment ndash Interconnection and Transmission Process Metrics
i Performance Metric
These metrics track the progress that utilities have made in regions outside of ISOs and RTOs in completing their reliability reviews ndash namely feasibility system impact and
66 We note that this narrative assessment is in keeping with the Commissionrsquos
requirement that public utility transmission providers make available information regarding the status of transmission upgrades identified in their transmission plans See Transmission Planning and Cost Allocation by Transmission Owning and Operating Public Utilities Order No 1000 FERC Stats amp Regs para 31323 at P 159 amp n154 (2011)) order on rehrsquog Order No 1000-A 139 FERC para 61132 (2012)
67 Order No 1000 FERC Stats amp Regs para 31323 at P 203
27
20121015-4003 FERC PDF (Unofficial) 10152012
Docket No AD12-8-000
facility studies ndash of interconnection and transmission service requests in a timely and efficient manner The metrics track the number of requests the time required to complete the reliability reviews and the costs of completing each of the three types of studies There is also a metric that measures the number of transmission access denials and transmission service request denials The purpose of this metric is to provide information on the magnitude and reasons for transmission service denials and whether additional infrastructure investment is needed to avoid transmission service denials ii Comments Multiple TDUs state that the Commission should collect additional information on the completion of transmission studies Multiple TDUs state that while the metrics for ISOs and RTOs require the reporting of information on studies such measures are omitted from the draft metrics for regions outside of ISOs and RTOs without explanation Multiple TDUs argue that such metrics are even more important than in the ISO and RTO context and that it would be worth obtaining from vertically-integrated transmission providers all of the study completion metrics that ISOs and RTOs are required to produce Multiple TDUs explain that the cost of collecting and providing this information should not be inordinate and that transmission providers should already have expense tracking mechanisms in place to estimate and bill study costs Multiple TDUs state that the following additional metrics would be worth collecting from vertically-integrated transmission providers (1) percentages of long-term transmission service requests and interconnection requests that triggered study requirements (2) percentages of the studies undertaken that led to the identification of upgrade costs (3) the average estimated upgrade cost (4) the percent of transmission service requests withdrawn and the percent approved and (5) the average processing time through each process milestone identified in the transmission providerrsquos Order No 890 compliance tariff provisions such as completion of a feasibility study system impact study and facilities study Multiple TDUs claims that such information would help the Commission identify situations in which impediments to obtaining transmission or interconnection service warrant further investigation68 Multiple TDUs state that the addition of a metric concerning the number of transmission access denials or transmission service requests denied is less meaningful than it first appears Multiple TDUs explain that under the pro forma Open Access Transmission Tariff long-term transmission service requests cannot be legitimately denied instead if there is no existing transmission capability available to accommodate the request the requester is supposed to be informed that meeting the request would require additional facilities and offered the opportunity to fund studies to determine what
68 Multiple TDUs Comments at 5
28
20121015-4003 FERC PDF (Unofficial) 10152012
Docket No AD12-8-000
upgrades are needed Multiple TDUs state that a metric tracking how often entities requesting service withdraw their request for service in the face of these requirements would be worthwhile but that the proposed metric might not elicit such information69 Accordingly Multiple TDUs suggest revising the metric to require entities to report the number of long-term transmission service requests for which ATC was initially found to be unavailable and the disposition of each request with each of these points broken down between requests made by third-party transmission customers and requests made by affiliates or divisions of the transmission provider70
NIPPC contends that the Commission should require transmission operators to
report information concerning the pace of large generator interconnections including the total number of pending interconnection requests the number of pending requests in each phase of the LGIA process and the number of requests in each phase that have experienced delays in completing that phase of the interconnection process along with a narrative describing the causes of those delays71 iii Response Commission Staff agrees with Multiple TDUs that the proposed metrics should include information on how long it takes participating utilities to complete interconnection and transmission studies as a measure of the efficiency of the utilityrsquos infrastructure development process Accordingly Commission Staff recommends that the performance metrics be revised to include metrics concerning the average age of incomplete studies and the average time to complete studies Commission Staff considers the time to complete all studies to be an appropriate metric to measure the efficiency of utility interconnection and transmission study processes It is expected that the narrative discussions that accompany the metrics will address issues with the various study stages and that the discussions will address the issues of concern to Multiple TDUs Commission Staff does not consider that information on the percentage of requests that trigger studies or are withdrawn will reflect utility performance The percentage of requests that trigger studies is a function of available transmission capacity not utility performance The percentage of requests withdrawn is caused by the actions of market participants ndash not utilities ndash and therefore does not measure utility performance Therefore we are not recommending the addition of this information to the metrics reports
69 Id at 8
70 Id
71 NIPPC Comments at 4-5
29
20121015-4003 FERC PDF (Unofficial) 10152012
Docket No AD12-8-000
With regard to Multiple TDUsrsquo interest in additional metrics on transmission service denials Commission Staff expects that the narrative discussions provided by participating utilities will address issues of concern to the Multiple TDUs such as the disposition of requests for service Commission Staff notes however that this metric is not intended to measure ATC or transmission capacity in general Rather the purpose of tracking transmission service denials is to provide an additional measure of the efficiency of utilities in processing requests for transmission service and therefore is intended to be evaluated in the context of the other infrastructure investment processing metrics This information combined with explanations provided by the utilities in their narrative discussion will provide the basis for a comprehensive assessment of how utilities are managing their infrastructure development process Commission Staff does not recommend adding a metric concerning the number of pending generation interconnection requests as requested by NIPPC By measuring the time it takes utilities to complete their studies for interconnection and transmission service the proposed metric appropriately focuses on the efficiency of a utilityrsquos processing of service requests ndash irrespective of the total number of requests Also since many interconnection requests in a utilityrsquos interconnection queue may not be ready to proceed because of commercial issues and other factors beyond the control of utilities the number of pending interconnection requests is not an appropriate measure of utility performance As has been the case in the ISORTO performance metrics reports Commission Staff expects that the narrative discussion that accompanies the utility metrics on interconnections and transmission service will explain the status of their request queues and reasons for delays j Special Protection Systems Special Protection Systems72 are automatic protection systems designed to detect abnormal or predetermined system conditions and take corrective actions such as changing demand generation or system configurations in order to maintain system stability acceptable voltage levels or maintain power flows These metrics measure the performance of such Special Protection Systems based on the definition of Special Protection Systems utilized by the reporting entityrsquos Regional Entity These metrics measure both the frequency with which the region relies on these systems and their effectiveness as measured by successful activations and the number of unintended activations No comments were submitted on this metric
72 Special Protection Systems are also referred to as Special Protection Schemes
Remedial Action Schemes (RAS) or System Integrity Protection Schemes (SIPS)
30
20121015-4003 FERC PDF (Unofficial) 10152012
Docket No AD12-8-000
k Demand Response Entities responding to this metric will be required to provide a comprehensive explanation of the nature of utility demand response programs implemented for load management as well as in compliance with state requirements There were no comments on this metric l System Lambda System lambda is the incremental cost of energy of the marginal unit assuming no system constraints This metric tracks the trend in marginal fuel costs and is an important metric since fuel costs represent the largest component of wholesale energy costs The system lambda metric would not apply to utilities where the marginal price is typically set by hydro units Also system lambda data will be based on information contained in FERC Form No 714 There were no comments on this metric m Congestion Management i Performance Metric Congestion represents the cost to customers of paying for more expensive energy because physical transmission line limits do not allow full delivery of least-cost energy Entities responding to this metric would be required to provide a congestion analysis consistent with Order No 890 In Order No 890 the Commission adopted a planning principle requiring transmission providers to prepare studies identifying ldquosignificant and recurringrdquo congestion and post such studies on their OASIS The Commission explained that the studies should analyze and report on the following items (1) the location and magnitude of the congestion (2) possible remedies for the elimination of the congestion in whole or in part (3) the associated costs of congestion and (4) the cost associated with relieving congestion through system enhancements (or other means)73 ii Comments Multiple TDUs argue that merely requiring vertically-integrated transmission providers to provide a narrative detailing their economic study processes as is proposed will elicit little more than a repetition of the planning process descriptions that were filed in compliance with Order No 890
73 Order No 890 FERC Stats amp Regs para 31241 at PP 529 542
31
20121015-4003 FERC PDF (Unofficial) 10152012
Docket No AD12-8-000
iii Response Commission Staff recommends that utilities discuss the status of their transmission plans as explained in the Long-Term Transmission Planning Metrics discussed above Commission Staff expects that these discussions will address expansion plans to resolve congestion issues on their systems Therefore Commission Staff expects that the performance reports submitted by utilities will provide substantive information on congestion management n Resource Availability i Performance Metric
The proposed metric measures the percentage of time that system resources are not available because of unplanned outages as measured by the system forced outage rate No comments were submitted on the metric
ii Response Commission Staff recommends that this metric be revised to be 1 minus the
system forced outage rate Revising the metric as recommended will measure unforced capacity availability and therefore resource availability This revision will also make this metric comparable to the performance metric adopted for ISOs and RTOs Resource availability is an indication of system efficiency and cost management by utilities in regions outside of ISOs and RTOs Higher resource availability can result in the commitment of fewer peak resources (or the importation of peak supplies) that potentially have high costs thereby resulting in reduced costs o Transmission System Availability This metric measures interrupted load MWh as a percentage of load served In light of the many factors that can result in load interruptions some of which are beyond the control of utilities the narrative detailing the reasons for load interruptions will be essential in assessing performance No comments were submitted on this metric p Fuel Diversity
This metric is defined to be the percentage mix of fuel types installed and available (capacity fuel diversity) and produced (generation fuel diversity) Fuel diversity provides an indication of a utilityrsquos capability to integrate fuels with different characteristics such as lower costs or lower environmental impacts No comments were submitted on this metric
32
20121015-4003 FERC PDF (Unofficial) 10152012
Docket No AD12-8-000
q Clean Energy i Performance Metric
These metrics measure the use of ldquoclean energyrdquo74 The metrics track number of MWh of clean energy by resource type as a percentage of total energy and the number of MW of clean energy by resource type as a percentage of total capacity
ii Comments NIPPC states that the Commission should expand the clean energy metric to include information related to curtailments of clean energy resources as frequent curtailments of these resources by a transmission operator may reflect a dysfunction in the generation market since these resources have no fuel costs NIPPC explains that the metric should include the number of curtailments the duration of each curtailment the number of MW hours curtailed and the justification for the curtailment75 iii Response Commission Staff does not consider curtailments of clean energy to be a measure of the diversity of a utilityrsquos resource mix Rather curtailments of resources ndash or more accurately schedule adjustments or manual redispatch instructions by transmission providers ndash are used to maintain system reliability We note that the diversity metrics in conjunction with the narratives regarding actions taken to manage dispatch reliability and TLR (see pages 18-19 infra) will provide a basis for a comprehensive view of the issue of clean energy
D Burden Estimate
1 Information Collection Statement In its solicitation for comments Commission Staff estimated the public reporting
burden for participating utilities to be approximately 140 hours per respondent for each report
74 Clean Energy is defined to include nuclear energy and variable energy
resources including solar wind hydro geothermal and biomass resources
75 NIPPC Comments at 6
33
20121015-4003 FERC PDF (Unofficial) 10152012
Docket No AD12-8-000
2 Comment EEI asserts that the response time could be as high as 300-400 hours
3 Response
Commission Staff will adjust the burden estimate based on EEIrsquos high estimate of 300-400 hours Commission Staff considers EEIrsquos estimate to be reflective of the most time that it would take an entity to respond to the metrics While Commission Staff recognizes that this report requires additional metrics and narrative discussions Commission Staff nevertheless continues to conclude that 140 hours still represents a reasonable estimate of the burden since much of the data required should be readily available to the responding utilities However in recognition of the fact that the burden will vary from entity to entity we will revise our estimate to 245 hours per respondent which is the mid-point between these estimates
E Information Collection Statement Information Collection Statement
The following collection of information contained in these metrics is subject to
review by the Office of Management and Budget (OMB) under section 3507 of the Paperwork Reduction Act of 199576 OMBrsquos regulations require approval of certain information collection requirements imposed by agency actions77 The Commission cannot conduct this information collection unless it displays a valid OMB control number78
The collection of information requires those public utilities outside of ISOs and RTOs that choose to participate to provide information responding to the attached metrics on a periodic basis This includes the submission of price data and information relating to reliability transmission planning requests for service and system capacity The
76 44 USC sect 3507 (2006) The Paperwork Reduction Act requires OMB
approval of certain information collection activities when these activities apply to 10 or more persons Because it is estimated that 11 entities will respond to this collection the Chairman is requesting approval from OMB
77 5 CFR sect 1320 (2012)
78 The Commission is issuing a separate notice regarding the collection of information that will be published in the Federal Register to comply with the OMB requirements at 5 CFR sect 13205(a)(iv)
34
20121015-4003 FERC PDF (Unofficial) 10152012
Docket No AD12-8-000
information submitted by participating utilities would be used to help develop a common set of metrics for both ISORTO markets and non-RTOISO markets and for evaluating market performance thereafter
35
20121015-4003 FERC PDF (Unofficial) 10152012
Docket No AD12-8-000
Burden Estimate The estimated public reporting burdens for the reporting
requirements have been adjusted as described above
FERC-922 Requirements
Number of Respondents
Annually (1)
Number of
Responses per Respondent
(2)
Average Burden Hours per Response
(3)
Total Annual Burden Hours
(1)x(2)x(3) Metrics Data Collection
140 1540
Write Performance Analysis
85 935
Management Review
11 1
20 220
Total 245 2695
Cost to Comply The Chairman has projected the cost of compliance to be $184460 Technical Expertise = $168300 (1540 hours data collection + 935 hours report completion $68 per hour) Management Review = $17160 (220 hours report review $78 per hour) Cost per hour figures are calculated using BLS data79 The technical expertise category factors in the median wage for an engineer analyst attorney and economist The management category factors in the median wage for general and operations managers Based on BLS data80 both cost figures have been adjusted to include benefits (benefits represent 295 percent of the total hourly figure)
Title FERC-922 Non-RTOISO Performance Metrics
Action Proposed Collection
OMB Control No TBD
79 See httpblsgovoescurrentnaics3_221000htm
80 See httpwwwblsgovnewsreleaseececnr0htm
36
20121015-4003 FERC PDF (Unofficial) 10152012
Docket No AD12-8-000
Internal Review The Chairman has reviewed the proposed metrics and has determined that the metrics and data gathered thereunder are necessary These requirements conform to the Commissionrsquos need for efficient information collection communication and management within the energy industry The Chairman is assured by means of internal review that there is specific objective support for the burden estimates associated with the information collection requirements
Interested persons may obtain information on the reporting requirements by contacting the following Federal Energy Regulatory Commission 888 First Street NE Washington DC 20426 [Attention Ellen Brown Office of the Executive Director] e-mail DataClearancefercgov Phone (202) 502-8663 fax (202) 273-0873 Any further comments on the collections of information and the associated burden estimates in this proceeding should be sent to the Commission in this docket and may also be sent to the Office of Information and Regulatory Affairs Office of Management and Budget Washington DC 20503 [Attention Desk Officer for the Federal Energy Regulatory Commission] For security reasons comments to OMB should be submitted by e-mail to oira_submissionombeopgov Comments submitted to OMB should include Docket Number AD12-8-000 and FERC-922
37
20121015-4003 FERC PDF (Unofficial) 10152012
Docket No AD12-8-000
38
IV Appendix
20121015-4003 FERC PDF (Unofficial) 10152012
Docket No AD12-8-000 39
Performance Metric Specific Metric(s) Reliability A National or Regional
Reliability Standards Compliance
1 References to which Electricity Reliability Organization (ERO) and Regional Reliability Organization (RRO) standards are applicable 2 Number of violations self-reported and made public by NERCFERC 3 Number of violations identified and made public as RRO or ERO audit findings 4 Total number of violations made public by NERCFERC 5 Severity level of each violation made public by NERCFERC 6 Compliance with operating reserve standards 7 Unserved energy (or load shedding) caused by violations Additional detail will be provided on (1) number of events (2) duration of the events (3) whether the events occurred during onoff-peak hours (4) additional information on equipment types affected and kV of lines affected and (5) number of events (and severity and duration of events) resulting in load shedding based on the utilization of TPL-002 Footnote b criteria Items 2-7 Track the ISORTO definition ldquoThis metric is a quantification of all NERC and RRO Reliability Standards violations that have been identified during an audit or as a result of an ISORTO self-report and have been published as part of that processrdquo Non ndashISORTO utilities should limit reporting to the same eight functional areas used by the ISORTOs 1 Balancing Authority 7 Transmission Planner 2 Interchange Authority 8 Transmission Service Provider 3 Planning Authority 4 Reliability Coordinator 5 Resource Planner 6 Transmission Operator
20121015-4003 FERC PDF (Unofficial) 10152012
Docket No AD12-8-000 40
B Dispatch Reliability 1 Balance Authority Ace Limit (BAAL) OR CPS1 and CPS2
2 Number of hours of transmission load reliefs (of severity level 3 or higher) called by the incumbent transmission provider or unscheduled flows
WECC entities will report events under the WECC Unscheduled Flow Mitigation Procedure (equivalent to the NERC TLR Level three)
3 Energy Management System (EMS) availability C Operational Planning ndash
Load Forecast Accuracy Actual peak load as a percentage variance from forecasted peak load as reported in OASIS
D Wind Forecasting Accuracy
Actual wind availability compared to forecasted wind availability
E Unscheduled Flows Difference between net actual interchange (actual measured power flow in real time) and the net scheduled interchange in megawatt hours Reported in Form 714
F Transmission Outage Coordination
1 Percentage of ge 200 kV planned outages of 5 days or more for which utility notified customers at least 1 month prior to the outage commencement date 2 Percentage of ge 200kV outages cancelled by utility after having been previously approved 3 Report information posted on OASIS (percentage of outages planned and unplanned with less than 2 days notice)
20121015-4003 FERC PDF (Unofficial) 10152012
Docket No AD12-8-000 41
G Long-Term Reliability Planning ndash Transmission
Dollar amount and number of facilities approved to be constructed for reliability purposes
2 Percentage of approved construction on schedule and completed
3 Performance of planning process related to
a Requests for and number of completed reliability studies
b Requests and number of completed economic studies
Discussion of stakeholder process and identification of stakeholder groups participating
H Long-Term Reliability
Planning ndash Resources 1 Processing time for generation interconnection requests 2 Actual reserve margins compared with planned reserve margins 3 Explanation of the nature and characteristics of demand response programs and how they are used in system planning Discussion of programs to facilitate the integration of renewable resources and to mitigate any issues and uncertainty associated with scheduling renewable resources
20121015-4003 FERC PDF (Unofficial) 10152012
Docket No AD12-8-000 42
I Infrastructure Investment ndash Interconnection and Transmission Process Metrics
1 Number of requests
2 Number of studies completed
3 Average age of incomplete studies
4 Average time for completed studies
5 Total cost and types of studies completed (eg feasibility study system impact study and facility study)
6 Number of transmission access denialstransmission service requests (TSRs) denied
J Special Protection
Systems 1 Number of special protection systems
2 Percentage of special protection systems that responded as designed when activated
Applicable pool of special protection systems should be based on how the reporting entityrsquos Regional Entity defines ldquospecial protection systemsrdquo
3 Number of unintended activations
20121015-4003 FERC PDF (Unofficial) 10152012
Docket No AD12-8-000 43
System Operations Measures A Demand Response Comprehensive explanation of the nature of utility demand response programs
implemented for load management as well as in compliance with state requirements B System Lambda System Lambda (on marginal unit)
Proposed System Lambda metric would not apply to utilities where the
marginal price is typically set by hydro units System lambda data will be based on Form 714 information
C Congestion Management Congestion analysis per Order No 890 D Resource Availability 1 - System forced outage rate as measured over 12 months E Transmission System
Availability Interrupted load megawatt hours as a percentage of load served
F Fuel Diversity Fuel diversity in terms of energy installed capacity and actual production G Clean Energy 1 Clean Energy megawatt hours by resource type as a percentage of total energy
2 Clean Energy megawatts by resource type as a percentage of total capacity Organizational Effectiveness Not applicable to non-RTO
entities
20121015-4003 FERC PDF (Unofficial) 10152012
Document Content(s)
Staff Report Non-RTO Metrics Final1015 2PDF1-43
20121015-4003 FERC PDF (Unofficial) 10152012
- Staff Report Non-RTO Metrics Final1015 2PDF
- Document Content(s)
-
Docket No AD12-8-000
while integrating renewable resources While we do not think a standard metric is necessary at this time Commission Staff nevertheless recommends that utilities include in their reports narrative discussions of their progress in implementing such programs including area control error diversity interchange dynamic scheduling systems intra-hour transmission scheduling36 and intra-hour transaction accelerator platforms Regarding NIPPCrsquos request for information on transmission grid integration charges for variable energy resources the Commission recently addressed the design of generator regulation service charges in its final rule in Docket No RM10-11-00037 Any such charges would be subject to Commission review under section 205 of the Federal Power Act38 and as a result subject to public review With respect to EPSArsquos interest in price metrics for entities in regions outside of ISOs and RTOs Commission Staff agrees with EPSA that it is difficult to compare prices outside of ISO and RTO markets with prices in these markets ISO and RTO market prices are locational marginal prices (LMPs) that are based on resource offers and load bids LMP pricing does not exist outside these markets This lack of comparability was the primary reason that Commission Staff did not propose a price metric for utilities outside ISO and RTO markets Commission Staff also considered utility cost-of-service rates that include retail costs to be unsuitable price metrics These rates include distribution and other functions that are not encompassed by the wholesale service provided by ISOs and RTOs and as noted by EEI utility cost-of-service rates are outside the Commissionrsquos jurisdiction Notwithstanding the difficulties inherent in comparing wholesale prices between ISORTO markets and regions outside ISORTO markets wholesale prices are pertinent to the performance of utilities in pricing their products competitively Accordingly Commission Staff proposes that utilities provide price metrics on their wholesale power sales derived from the transaction information and price data utilities report on wholesale power sales in the Electric Quarterly Report39 To ensure comparability with the load-
36 In the final rule in Integration of Variable Energy Resources the Commission
amended the pro forma OATT to provide all transmission customers the option of using more frequent transmission scheduling intervals within each operating hour at 15-minute intervals See Integration of Variable Energy Resources Order No 764 139 FERC para 61246 at P 91 (2012)
37 Id P 271
38 16 USC sect 824e (2006)
39 Revised Public Utility Filing Requirements Order No 2001 67 Fed Reg 31043 (May 8 2002) FERC Stats amp Regs para 31127 rehrsquog denied Order No 2001-A 100 FERC para 61074 rehrsquog denied Order No 2001-B 100 FERC para 61342 order
13
20121015-4003 FERC PDF (Unofficial) 10152012
Docket No AD12-8-000
weighted data provided by ISOs and RTOs Commission Staff proposes that participating utilities submit a single volume-weighted average annual price for energy and for capacity Commission Staff recognizes that in the regions outside of ISORTO markets as in the ISORTO markets some of the wholesale prices that are reported in the Electronic Quarterly Reports include cost-based transactions that reflect cost allocation decisions of regulators as well as market-based transactions Also wholesale power prices reflect fuel prices that are a function of global and nationwide price trends that are beyond the control of utilities To address these matters the metric could be developed to include market-based transactions only and to hold fuel prices constant in a fuel-adjusted price metric40 Commission Staff further recognizes that utilities provide a series of peak off-peak and year-round wholesale power products and therefore utilities will need to volume-weight each of these products into a single average annual price for energy and for capacity in addition to reporting peak and off-peak prices Commission Staff also requests comments on whether seasonal prices provide useful information on utility performance In light of the fact that Commission Staff is now proposing a price metric for the first time and therefore there has not been an opportunity for a full and complete discussion among stakeholders of the pros and cons of various price metric options Commission Staff is not including a price metric on the list of recommended metrics in Appendix A Rather Commission Staff recommends that participating utilities discuss in their 2012 reports their perspectives on a wholesale price metric Based on these perspectives and further discussions with interested stakeholders Commission Staff intends to recommend a price metric that participating utilities will submit in their next report following the report that is requested in this Commission Staff Report
directing filing Order No 2001-C 101 FERC para 61314 (2002) order directing filing Order No 2001-D 102 FERC para 61334 order refining filing requirements Order No 2001-E 105 FERC para 61352 (2003) order on clarification Order No 2001-F 106 FERC para 61060 (2004) order revising filing requirements Order No 2001-G 72 Fed Reg 56735 (Oct 4 2007) 120 FERC para 61270 order on rehrsquog and clarification Order No 2001-H 73 Fed Reg 1876 (Jan 10 2008) 121 FERC para 61289 (2007) order revising filing requirements Order No 2001-I 73 Fed Reg 65526 (Nov 4 2008) 125 FERC para 61103 (2008)
40 The RTO price metrics include a fuel-adjusted LMP price metric
14
20121015-4003 FERC PDF (Unofficial) 10152012
Docket No AD12-8-000
3 Discussion of Individual Metrics The two major categories of performance metrics are reliability and systems operations measures The reliability metrics were chosen to measure the reliability of day-to-day operations using metrics such as compliance with national and regional reliability standards the real-time balance of supply and demand forecasting and Special Protection Schemes and to measure long-term reliability using metrics such as long-term transmission and resource planning The systems operations measures were chosen to measure the operating performance of utilities in non-ISORTO regions using metrics such as system resource and transmission availability and system lambda a National and Regional Reliability Standards Compliance Metrics i Performance Metric This metric measures the number of violations of national and regional reliability standards provides information on how these violations were reported and indicates the severity of the violations41 The metric also details unserved energy (or load shedding) caused by violations and requires a utility to provide additional details on the number of events the duration of the events whether the events occurred during onoff peak hours and information on the equipment types affected and the kilovolts of lines affected
Consistent with the 2010 ISORTO Metrics Report the text of the metric has been revised to reflect the fact that this metric is a quantification of all NERC and Regional Reliability Organization standard violations that have been identified during an audit or as a result of a self-report and have been published as part of that process42 Additionally the text of the metric has been revised to clarify that utilities located in regions outside of ISOs and RTOs should limit reporting to the same eight functional areas used by the IS 43Os and RTOs
41 A full listing of the reliability standards is provided at
httpwwwnerccompagephpcid=2|20
42 2011 ISORTO Metrics Report Docket No AD10-5-00 at 12 (August 31 2011)
43 The eight functional areas are as follows 1) Balancing Authority 2) Interchange Authority 3) Planning Authority 4) Reliability Coordinator 5) Resource Planner 6) Transmission Operator 7) Transmission Planner and 8) Transmission Service Provider
15
20121015-4003 FERC PDF (Unofficial) 10152012
Docket No AD12-8-000
ii Comments
Multiple TDUs assert that the Commission and NERC would benefit from the collection of data regarding events when Footnote b44 is invoked and utilities interrupt non-consequential Firm Demand Multiple TDUs state that there should not be any dispute about the utility of this information and note that the Commission has directed NERC to collect information regarding the specific circumstances and frequency with which Firm Demand is planned to be interrupted as part of the Footnote b remand process45 Multiple TDUs explain that since it is not a violation of any reliability standard to interrupt non-consequential Firm Demand if Footnote b is applicable National or Regional Reliability Standards Compliance metrics will not encompass events where Footnote b is involved Multiple TDUs believe that the collection of the following categories of data would facilitate further discussion at the Commission and NERC (1) the number of incidents in which the utility relies on Footnote b in order to interrupt non-consequential Firm Demand (2) information concerning the severity of these incidents and whether there are systemic problems with the transmission system and transmission plan46 and (3) information concerning whether interrupted wholesale
44 Footnote b refers to a petition filed by the North American Electric Reliability Corporation (NERC) seeking approval of Table 1 Footnote b of four Reliability Standards Transmission Planning TPL-001-1ndash System Performance Under Normal (No Contingency) Conditions (Category A) TPL-002-1b ndash System Performance Following Loss of a Single Bulk Electric System Element (Category B) TPL-003-1a ndash System Performance Following Loss of Two or More Bulk Electric System Elements (Category C) and TPL-004-1ndash System Performance Following Extreme Events Resulting in the Loss of Two or More Bulk Electric System Elements (Category D) While Footnote b appears in all four of the above referenced TPL Reliability Standards its relevance and practical applicability is limited to TPL-002-0a See Transmission Planning Reliability Standards Order No 762 139 FERC para 61060 at P 1 amp n2 (2012) Footnote b states
Planned or controlled interruption of electric supply to radial customers or some local Network customers connected to or supplied by the Faulted element or by the affected area may occur in certain areas without impacting the overall reliability of the interconnected transmission systems To prepare for the next contingency system adjustments are permitted including curtailments of contracted Firm (non-recallable reserved) electric power Transfers
Id P 3
45 Multiple TDUs Comments at 9 (citing Order No 762 139 FERC para 61060 at P 20)
16
20121015-4003 FERC PDF (Unofficial) 10152012
Docket No AD12-8-000
transmission customers of the reporting transmission provider have notice and understanding before the interruption Multiple TDUs recognize that Footnote b is in flux and as a result urge the Commission to revisit the metrics associated with Footnote b after Footnote b is revised47
In reply to Multiple TDUs EEI argues that situations in which Footnote b is invoked are clearly contemplated under section A7 of the Reliability metrics proposed in the Commission notice48
NIPPC argues that the Commission should consider expanding the reliability standards metrics to include the number of dispatch orders issued to generators to curtail output and the specific reasons for each of those dispatch orders as a dispatch order made to a generator to avoid or mitigate a reliability violation will have the same impact on a market as a reliability violation NIPPC also argues that the metrics should include the number of and justification for schedule curtailments (or e-tag curtailments) NIPPC further maintains that the metrics should compare the percentage of the dispatch orders or schedule curtailments issued to independent power producers to the percentage of independently owned generation capacity interconnected to the transmission providerrsquos system49 iii Response
While Reliability metric A7 captures situations where Footnote b is invoked
Commission Staff concludes that for purposes of clarity it would be beneficial to have a separate metric to address the planned Firm Demand interruptions that planners use to meet the system performance requirements of TPL-002-2b Table 1 for Category B single contingency events (ie Footnote b interruptions as discussed in Order No 762) and that the metric should track the number severity and duration of these incidents This information is a good performance measure because it could expose an area of weakness in the Bulk Electric System that may need to be addressed with a capital project or an appropriate operating procedure Commission Staff recommends that in the narrative that accompanies the metrics report participating utilities discuss the actions taken to address the interruptions and the notice utilities provide customers before interruptions are made
46 We note that this request is discussed in our response infra at pp 19-20
47 Multiple TDUs Comments at 10-11
48 EEI Reply Comments at 4
49 NIPPC Comments at 4
17
20121015-4003 FERC PDF (Unofficial) 10152012
Docket No AD12-8-000
Responding to NIPPC the reliability standards metrics are limited to providing information on reliability violations Actions taken by transmission providers to curtail the dispatch of generators or adjust transmission schedules (or e-tags) are relevant to the dispatch reliability metrics discussed below As discussed in that section Commission Staff is recommending that participating utilities include narratives on all actions they take to manage dispatch reliability Commission Staff is not recommending that this information be incorporated into metrics because not all participating utilities take these actions and there are no standardized measures for these activities With respect to NIPPCrsquos request that a metric be developed to measure transmission schedule adjustments or e-tag revisions we note that these actions are the result of transmission loading reliefs (TLR) or Unscheduled Flow Relief events that are being reported in the Dispatch Reliability measure below and are already covered by the metrics For this reason Commission Staff does not recommend adding this metric
b Dispatch Reliability i Performance Metrics Dispatch reliability is measured by three metrics The proposed metrics listed in the notice retained two of the metrics used to measure dispatch reliability in ISOs and RTOs (1) Balancing Authority Area Control Error Limit or Control Performance Standard 1 and Control Performance Standard 2 and (2) Energy Management System Availability The proposed metric relating to TLR or Unscheduled Flow Relief Events would measure the number of events ndash rather than the hours as is reported in the performance metrics for ISOs and RTOs ndash of TLRs (of severity level 3 or higher) or unscheduled flows called by the incumbent transmission provider Utilities that are part of the Western Electricity Coordinating Council (WECC) will report events under the WECC Unscheduled Flow Mitigation Procedure that are equivalent to the NERC TLR Level 3 ii Comments
EPSA contends that in order to properly identify problem areas the Commission should require each transmission provider to identify the length and magnitude of each TLR event EPSA states that at a minimum each transmission owner should provide the following information (1) how long each constrained element is subject to a continuous Level 3 or higher TLR in hours (2) the number of MW of network transmission service curtailed for each continuous TLR event and for all continuous TLR events in total (3) the number of MW of firm point-to-point transmission service curtailed for each continuous TLR event and in aggregate and (4) the number of MW of non-firm transmission service curtailed per continuous TLR event and in aggregate50 EPSA
50 EPSA Comments at 3-4
18
20121015-4003 FERC PDF (Unofficial) 10152012
Docket No AD12-8-000
further states that monitoring and tracking TLR events on a system that are categorized at level 1 or 2 can provide additional insights into system dynamics as those events can be prevented by nodal market designs that dispatch around binding constraints using congestion prices Additionally EPSA states that all TLR events at level 5 or higher should be tracked and reported separately from all other TLR events as TLR events at this level indicate a severely constrained system EPSA recommends that the metrics include a metric for reporting all congestion management events ndash not only those categorized as a TLR ndash because some areas rely on a variety of other congestion management techniques EPSA further recommends including an evaluation of the number and severity level of all congestion management events of a utility or transmission system with the changes discussed above51 iii Response
Commission Staff agrees with EPSA that the metric concerning TLR should measure the duration of such events Accordingly Commission Staff recommends that the TLR metric be revised to measure the hours of TLR called by the incumbent transmission provider Commission Staff notes that this revision will result in a metric that is consistent with the metrics for ISO and RTO markets
Commission Staff does not consider information on severity level 1 and 2 events
to be measures of utility reliability performance Such events by definition only impact local area operations and as a result will not impact system reliability For this reason TLR events of level 3 and above are systemic events and are the appropriate basis for a performance metric for system reliability For TLR events of severity level 3 and above Commission Staff agrees with EPSA that the TLRUnscheduled Flow Relief metric should be supplemented with information on TLR (or Unscheduled Flow Relief) events for each severity level energy curtailment data on the number of MW curtailed and duration of curtailment information Such information along with a discussion by the participating utility of the impact of curtailments on customers and the various resource types will allow for a better informed evaluation of performance52 For this reason we
51Id at 5
52 We note that in Order No 890 the Commission concluded that requiring transmission providers to post additional information on curtailments was necessary to provide transparency and enable customers to assess whether they have been treated without undue discrimination See Preventing Undue Discrimination and Preference in Transmission Service Order No 890 FERC Stats amp Regs para 31241 at P 1626 order on rehrsquog Order No 890-A FERC Stats amp Regs para 31261 (2007) order on rehrsquog Order No 890-B 123 FERC para 61299 (2008) order on rehrsquog Order No 890-C 126 FERC para 61228 (2009) order on clarification Order No 890-D 129 FERC para 61126 (2009) For
19
20121015-4003 FERC PDF (Unofficial) 10152012
Docket No AD12-8-000
recommend that this information be included in the narrative discussions that accompany the (TLRUnscheduled Flow Relief) metric to the extent the information is available
With respect to EPSArsquos request for metrics on all congestion management activities such as Local Area Protocols Commission Staff recommends that participating utilities provide narratives on the use of Local Area Protocols out-of-merit dispatches and other techniques to resolve system dispatch reliability problems Such information will provide a context for the role played by TLRs or Unscheduled Flow Reliefs thereby providing the basis for a more comprehensive assessment of constraint management by the participating utility Since not all participating utilities use these techniques and the definitions of these techniques may differ among utilities Commission Staff does not consider this information to be appropriate for standardized metrics c Load Forecasting Accuracy
Actual peak load as a percentage variance from forecasted peak load as reported in a transmission providerrsquos OASIS measures the effectiveness of the load forecasting function of utilities in non-ISORTO regions Since load forecasting provides the basis for resource commitment this metric impacts the incurrence of resource costs The more accurate a utility is in forecasting load the greater the likelihood that it can commit sufficient resources in a cost effective manner that avoids over-commitment of resources inefficient commitment of short lead-time resources or under-utilization of available resources This metric measures the percentage difference between actual peak load and forecasted peak load No comments were submitted on this metric d Wind Forecasting Accuracy i Performance Metric This metric measures the percentage accuracy of actual wind availability compared to forecasted wind availability Improving the accuracy of the wind forecast will facilitate the timely commitment and dispatch of sufficient supplemental resources ii Comments NIPPC maintains that the Commission should clarify whether this metric applies to the wind generation assets controlled by the merchant function of the transmission provider or to the independently owned and operated wind generation interconnection to
TLR events of severity level 3 and above Commission Staff recommends including a narrative explanation of why transactions could not be continued or completed similar to what is required by Order No 890 Id P 1627
20
20121015-4003 FERC PDF (Unofficial) 10152012
Docket No AD12-8-000
the transmission providerrsquos system NIPPC argues that the metric should not extend to generators not owned or controlled by the merchant function of the transmission provider in light of the market-sensitive nature of a generatorrsquos wind forecasting accuracy and scheduling practices53 NIPPC also urges the Commission to consider expanding this metric to require a transmission provider to report whether it has implemented a centralized wind forecast system for use in its operations and if so to collect additional metrics on the accuracy of that centralized forecast54 NIPPC contends that a single metric comparing actual wind output to forecast output over the reporting period is not a useful metric as inaccuracies in the forecast may cancel out over a long reporting period NIPPC argues that a more relevant measure of accuracy would be the number of hours during the reporting period that the forecast is accurate (where the forecast is within five percent of actual output) NIPPC also suggests that the following additional metrics would be useful (1) the MW of windsolar capacity subject to the forecast (2) granularity of the forecast (monthly weekly daily hourly sub-hourly) (3) whether the forecast is integrated into the transmission providerrsquos operations (4) whether the transmission provider shares the forecast with market participants (or generation owners) and (5) an equivalent metric for forecasts associated with solar energy and hydroelectric energy55 iii Response The wind accuracy metric was intended to apply to all wind resources ndash owned and non-owned ndash on the transmission providersrsquo systems Commission Staff does not recommend excluding wind generators not owned or controlled by transmission providers from the wind accuracy metric To be an effective tool to ensure system reliability this metric must measure the accuracy of forecasts that account for all wind resources in a utilityrsquos footprint This requirement is increasingly important as wind resources become a more significant portion of total resource output When wind generators ndash including those not owned or controlled by the utility ndash provide wind availability forecasts they are performing a reliability function that has implications for system reliability management and planning Accordingly Commission Staff considers this information to be an important element in an assessment of a utilityrsquos reliability performance We encourage participating utilities to work with wind generators not owned or controlled by the utility to ensure that the data gathered and reported protects market-sensitive information from
53 NIPPC Comments at 5
54 Id
55 Id at 5-6
21
20121015-4003 FERC PDF (Unofficial) 10152012
Docket No AD12-8-000
being reported in public reports or released to utility subsidiaries that compete with these wind generators Commission Staff agrees with NIPPC that to the extent that centralized forecasting can minimize integration costs this information is an indication of utility performance Therefore Commission Staff recommends that participating utilities discuss their forecasting process in their reports With respect to NIPPCrsquos concern that inaccuracies in the forecast may cancel out Commission Staff notes that the wind accuracy forecast will be based on the mean absolute error of the forecast compared to actual wind availability Therefore all errors ndash positive and negative ndash will be measured and will not cancel out Since the proposed metric will measure the magnitude of forecast inaccuracies Commission Staff considers the proposed metric to be superior to the alternative proposed by NIPPC that only indicates the number of hours in which a forecast is outside a five percent threshold Further responding to NIPPC Commission Staff notes that forecast accuracy will be based on a comparison of the day-ahead forecast to actual availability Commission Staff also notes that the capacity of wind and solar subject to the forecast which NIPPC requests be an additional performance metric is included in the Clean Energy metric discussed below Commission Staff is not recommending the inclusion of a metric measuring the accuracy of forecasts for other variable energy resources because many utilities do not perform these forecasts or they are not performed according to a standardized process Nevertheless Commission Staff considers it appropriate that participating utilities provide narrative descriptions of their solar and hydro forecasts to the extent these resources are significant sources of energy to allow for a more complete assessment of forecasting performance e Unscheduled Flows Metric Unscheduled flows are defined as the difference between net actual interchange (actual power flow measured in real time) and net scheduled interchange The two components of unscheduled flows are inadvertent energy defined to be the difference between actual and scheduled interchange for all interties and parallel flow (or loop flow) defined to be the actual power flow on a contract path within an interconnection from one Balancing Authority Area to a second Balancing Authority Area through ldquoparallelrdquo transmission lines through a third Balancing Authority Area Parallel flows are a function of the interconnectionrsquos operating configuration line resistance and physics Unscheduled flows provide information relevant to operation planning because curtailments may occur when unscheduled flows exceed system operating limits This metric is measured by the difference between net actual interchange (actual measured power flow in real time) and the net scheduled interchange in MWh as reported in a
22
20121015-4003 FERC PDF (Unofficial) 10152012
Docket No AD12-8-000
utilityrsquos FERC Form No 714 ldquoAnnual Electric Balancing Authority Area and Planning Area Reportrdquo No comments were received on this metric f Transmission Outage Coordination i Performance Metric
The transmission outage coordination metric measures the percentage of outages planned and unplanned that occur with less than two days notice Effective transmission outage coordination will result in early notification of outages and therefore will be indicated in the metrics as a low percentage of short notice outages56 Effective transmission outage coordination by utilities in non-ISORTO regions ensures that outages do not threaten system reliability and that additional and potentially more expensive resources do not need to be committed
ii Comments ESPA recommends that the performance metrics track a utilityrsquos transmission outage performance EPSA states that the information posted on OASIS is valuable information and requests that the Commission include information regarding any transmission outages known ahead of time including the time and date of the planned outage and the planned duration of the outage57 EPSA maintains that providing this information would allow market participants to evaluate the information concerning the proposed outage and make other arrangements if necessary or otherwise take proactive steps to reduce the impact of any such planned outage EPSA states that outage performance information would also give the Commission and other observers the opportunity to evaluate how well the utility or transmission owner can schedule outages and execute that schedule58
iii Response
Commission Staff agrees with EPSA that the transmission outage metrics should include information to measure the utilitiesrsquo ability to plan for outages and successfully execute their outage plan As stated in the Commission Staff Report on ISORTO Performance Metrics effective transmission outage coordination is defined as early
56 The proposed metrics will measure outages for major transmission facilities
which are defined for purposes of the metrics as 200kV and higher
57 EPSA Comments at 7-8
58 Id at 8
23
20121015-4003 FERC PDF (Unofficial) 10152012
Docket No AD12-8-000
notification of planned outages of five days or longer ndash ie notification at least one month prior to the outage commencement date ndash and timely review of outage impacts59 Also effective transmission outage coordination is measured by the percentage of planned outages that are canceled due to conflicting planned outages as well as forced (unscheduled) outages that could cause reliability issues and additional congestion costs Commission Staff recommends adding these metrics for outages on major transmission lines of 200kV and higher to be consistent with the metrics for ISOs and RTOs60 g Long-Term Reliability Planning ndash Transmission i Performance Metric The proposed metric tracks the dollar amount of transmission facilities approved to be constructed for reliability purposes the percentage of approved construction completed the number of requests for and completed reliability studies and a narrative detailing a utilityrsquos economic study process This information measures the ability of each utilityrsquos expansion planning process to identify reliability and economic needs in advance which is essential to ensuring that market participants have sufficient time to develop either transmission or resource solutions to system reliability and economic requirements The metric also includes a narrative discussion of the transmission planning stakeholder process ii Comments Multiple TDUs state that a metric related to planning and completion of economic transmission is needed for multiple reasons First vertically-integrated transmission
59 Staff Report at 25
60 See Staff Report at Appendix B Peformance Metric F1 (Oct 21 2010) (Percentage of gt 200kV planned outages of 5 days or more that are submitted to ISORTO at least 1 month prior to the outage commencement date) We note that in Revisions to Electric Reliability Organization Definition of Bulk Electric System and Rules of Procedure Notice of Proposed Rulemaking 77 Fed Reg 39846 139 FERC para 61247 (2012) the Commission proposed to approve a modification to the currently-effective definition of ldquobulk electricrdquo systemrdquo that would establish a bright-line threshold that includes all facilities at or above 100 kV Commission Staff still considers it reasonable to require a 200 kV minimum for reporting information related to outages for performance metrics purposes particularly since this 200 kV minimum is consistent with the threshold ISOsRTOs used in their prior metric reports Nevertheless Commission Staff will monitor responses under this metric and continue to evaluate whether this is the appropriate threshold
24
20121015-4003 FERC PDF (Unofficial) 10152012
Docket No AD12-8-000
providers have inherent incentives to discriminate and underperform when performing this function Multiple TDUs state that the Commission has recognized as much and that such a metric would help measure the efficacy of the remedies that the Commission adopted in Order No 890 to address this concern61 Second the economic costs of transmission constraints are not transparent in areas without centralized markets like those found in ISOs and RTOs with congestion pricing Third more specificity is needed because a vertically-integrated transmission owner reporting on transmission construction and identifying shortfalls would be identifying its own unsuccessful outcomes62 Multiple TDUs argue that merely requiring vertically-integrated transmission providers to provide a narrative detailing their economic studies process as is proposed will elicit little more than a repetition of the planning process descriptions that were filed in compliance with Order No 890 For these reasons Multiple TDUs argue that the transmission planning and construction metric should be expanded to include the dollar amount of facilities constructed for purposes whose predominant purpose was not reliability broken down between (a) economic (b) public policy (c) facilities to support the planned generation resources of the transmission provider or its affiliates (d) transmission or interconnection requests made by the transmission provider or its affiliates and (e) in response to requests from others Multiple TDUs state that the metrics should also include the number of transmission construction projects that were added to the transmission provider construction plans between the issuance of Order No 890 and the submission of the report broken down into categories (a) through (e) and into their current status (ie completed incomplete and on schedule incomplete and behind schedule and removed from plan) EEI argues that the Multiple TDUsrsquo request is unwarranted EEI maintains that due to the low incidence of economic study requests requiring such additional reporting will create an added and unnecessary burden to reporting utilities63 Multiple TDUs also state that the metric should include a narrative assessment supported by quantitative information of the transmission providerrsquos planning process efficacy64 Similarly EPSA argues that the performance metrics should include a metric
61 Multiple TDUs Comments at 6 (citing Order No 890 FERC Stats amp Regs para
31241) 62 Id at 6-7
63 EEI Reply Comments at 4
64 Multiple TDUs Comments at 7-8
25
20121015-4003 FERC PDF (Unofficial) 10152012
Docket No AD12-8-000
detailing how well a utility executes its transmission development plans EPSA explains that a utilityrsquos failure to follow its transmission plan can adversely impact customers and merchant generators Thus EPSA maintains that a metric assessing how well a utility executes its transmission plan would provide valuable information including a demonstration of how prepared a utility is to meet any future reliability needs on its system65 iii Response
Commission Staff does not recommend adding the metrics proposed by Multiple TDUs on non-reliability transmission and interconnection projects The purpose of this metric is to assess the extent to which transmission solutions are analyzed planned and deployed to meet reliability requirements Thus additional information to examine discrimination by utilities or to obtain information on all project spending including projects to meet public policy objectives would go beyond the scope of the metric The congestion issues of concern to Multiple TDUs including the impact of transmission planning on congestion are discussed further below in the Congestion Management metric
Commission Staff agrees with commenters that additional information is needed
however in the transmission planning metrics to provide a more comprehensive assessment of transmission planning performance and to allow for comparisons between ISOs and RTOs and participating utilities in regions outside of ISOs and RTOs Accordingly Commission Staff recommends additional information be included in the metrics as follows (1) the proposed dollar amount of facilities approved to be constructed for reliability purposes should be revised to also include the number of facilities so that this metric is comparable to the relevant ISORTO performance metric (2) the proposed percentage of approved construction completed metric should be revised to the percentage of approved construction on schedule and completed and (3) the proposed narrative detailing the economic studies process should be revised to a metric that measures the percentage completion of economic projects
Responding to EEI Commission Staff does not find that it would be unduly
burdensome to incorporate both the number of economic study requests and the number of economic studies accomplished into a narrative explanation of the status of planning for economic expansions Economic projects can reduce congestion which in turn can reduce costs to customers and decrease the likelihood that reliability issues will occur Therefore this information provides an important indicator on the progress made by utilities in improving the efficiency of their transmission systems
65 EPSA Comments at 7
26
20121015-4003 FERC PDF (Unofficial) 10152012
Docket No AD12-8-000
Commission Staff agrees with EPSA that the reports provided by participating utilities should also include a discussion of the status of their transmission plans Such information will allow participating utilities to explain their progress in meeting planning goals and explain the issues that may be delaying the completion of reliability and economic projects Commission Staff expects that this discussion will also address the desire of Multiple TDUs to have a narrative assessment of the efficacy of the transmission providerrsquos planning process66 and to address how utilities provide an opportunity to consider transmission needs driven by Public Policy Requirements in their planning process67
h Long-Term Reliability Transmission Planning ndash Resources
Three metrics are employed to measure the effectiveness of long-term reliability planning for resources The first metric processing time for generation interconnection requests measures the effectiveness of processes in achieving timely interconnection of new resources that are needed to ensure reliability The second metric the planned reserve margin is the planned number of MW of resources available as system reserves divided by the number of MW of peak load The third metric is a narrative discussion of demand response programs and how they are used in system planning No comments were received on this metric Commission Staff recommends that the proposed planned reserve margin metric be revised to compare the actual reserve margin to the planned reserve margin This comparison will allow for an evaluation of utility performance in achieving the planned reserve margin
i Infrastructure Investment ndash Interconnection and Transmission Process Metrics
i Performance Metric
These metrics track the progress that utilities have made in regions outside of ISOs and RTOs in completing their reliability reviews ndash namely feasibility system impact and
66 We note that this narrative assessment is in keeping with the Commissionrsquos
requirement that public utility transmission providers make available information regarding the status of transmission upgrades identified in their transmission plans See Transmission Planning and Cost Allocation by Transmission Owning and Operating Public Utilities Order No 1000 FERC Stats amp Regs para 31323 at P 159 amp n154 (2011)) order on rehrsquog Order No 1000-A 139 FERC para 61132 (2012)
67 Order No 1000 FERC Stats amp Regs para 31323 at P 203
27
20121015-4003 FERC PDF (Unofficial) 10152012
Docket No AD12-8-000
facility studies ndash of interconnection and transmission service requests in a timely and efficient manner The metrics track the number of requests the time required to complete the reliability reviews and the costs of completing each of the three types of studies There is also a metric that measures the number of transmission access denials and transmission service request denials The purpose of this metric is to provide information on the magnitude and reasons for transmission service denials and whether additional infrastructure investment is needed to avoid transmission service denials ii Comments Multiple TDUs state that the Commission should collect additional information on the completion of transmission studies Multiple TDUs state that while the metrics for ISOs and RTOs require the reporting of information on studies such measures are omitted from the draft metrics for regions outside of ISOs and RTOs without explanation Multiple TDUs argue that such metrics are even more important than in the ISO and RTO context and that it would be worth obtaining from vertically-integrated transmission providers all of the study completion metrics that ISOs and RTOs are required to produce Multiple TDUs explain that the cost of collecting and providing this information should not be inordinate and that transmission providers should already have expense tracking mechanisms in place to estimate and bill study costs Multiple TDUs state that the following additional metrics would be worth collecting from vertically-integrated transmission providers (1) percentages of long-term transmission service requests and interconnection requests that triggered study requirements (2) percentages of the studies undertaken that led to the identification of upgrade costs (3) the average estimated upgrade cost (4) the percent of transmission service requests withdrawn and the percent approved and (5) the average processing time through each process milestone identified in the transmission providerrsquos Order No 890 compliance tariff provisions such as completion of a feasibility study system impact study and facilities study Multiple TDUs claims that such information would help the Commission identify situations in which impediments to obtaining transmission or interconnection service warrant further investigation68 Multiple TDUs state that the addition of a metric concerning the number of transmission access denials or transmission service requests denied is less meaningful than it first appears Multiple TDUs explain that under the pro forma Open Access Transmission Tariff long-term transmission service requests cannot be legitimately denied instead if there is no existing transmission capability available to accommodate the request the requester is supposed to be informed that meeting the request would require additional facilities and offered the opportunity to fund studies to determine what
68 Multiple TDUs Comments at 5
28
20121015-4003 FERC PDF (Unofficial) 10152012
Docket No AD12-8-000
upgrades are needed Multiple TDUs state that a metric tracking how often entities requesting service withdraw their request for service in the face of these requirements would be worthwhile but that the proposed metric might not elicit such information69 Accordingly Multiple TDUs suggest revising the metric to require entities to report the number of long-term transmission service requests for which ATC was initially found to be unavailable and the disposition of each request with each of these points broken down between requests made by third-party transmission customers and requests made by affiliates or divisions of the transmission provider70
NIPPC contends that the Commission should require transmission operators to
report information concerning the pace of large generator interconnections including the total number of pending interconnection requests the number of pending requests in each phase of the LGIA process and the number of requests in each phase that have experienced delays in completing that phase of the interconnection process along with a narrative describing the causes of those delays71 iii Response Commission Staff agrees with Multiple TDUs that the proposed metrics should include information on how long it takes participating utilities to complete interconnection and transmission studies as a measure of the efficiency of the utilityrsquos infrastructure development process Accordingly Commission Staff recommends that the performance metrics be revised to include metrics concerning the average age of incomplete studies and the average time to complete studies Commission Staff considers the time to complete all studies to be an appropriate metric to measure the efficiency of utility interconnection and transmission study processes It is expected that the narrative discussions that accompany the metrics will address issues with the various study stages and that the discussions will address the issues of concern to Multiple TDUs Commission Staff does not consider that information on the percentage of requests that trigger studies or are withdrawn will reflect utility performance The percentage of requests that trigger studies is a function of available transmission capacity not utility performance The percentage of requests withdrawn is caused by the actions of market participants ndash not utilities ndash and therefore does not measure utility performance Therefore we are not recommending the addition of this information to the metrics reports
69 Id at 8
70 Id
71 NIPPC Comments at 4-5
29
20121015-4003 FERC PDF (Unofficial) 10152012
Docket No AD12-8-000
With regard to Multiple TDUsrsquo interest in additional metrics on transmission service denials Commission Staff expects that the narrative discussions provided by participating utilities will address issues of concern to the Multiple TDUs such as the disposition of requests for service Commission Staff notes however that this metric is not intended to measure ATC or transmission capacity in general Rather the purpose of tracking transmission service denials is to provide an additional measure of the efficiency of utilities in processing requests for transmission service and therefore is intended to be evaluated in the context of the other infrastructure investment processing metrics This information combined with explanations provided by the utilities in their narrative discussion will provide the basis for a comprehensive assessment of how utilities are managing their infrastructure development process Commission Staff does not recommend adding a metric concerning the number of pending generation interconnection requests as requested by NIPPC By measuring the time it takes utilities to complete their studies for interconnection and transmission service the proposed metric appropriately focuses on the efficiency of a utilityrsquos processing of service requests ndash irrespective of the total number of requests Also since many interconnection requests in a utilityrsquos interconnection queue may not be ready to proceed because of commercial issues and other factors beyond the control of utilities the number of pending interconnection requests is not an appropriate measure of utility performance As has been the case in the ISORTO performance metrics reports Commission Staff expects that the narrative discussion that accompanies the utility metrics on interconnections and transmission service will explain the status of their request queues and reasons for delays j Special Protection Systems Special Protection Systems72 are automatic protection systems designed to detect abnormal or predetermined system conditions and take corrective actions such as changing demand generation or system configurations in order to maintain system stability acceptable voltage levels or maintain power flows These metrics measure the performance of such Special Protection Systems based on the definition of Special Protection Systems utilized by the reporting entityrsquos Regional Entity These metrics measure both the frequency with which the region relies on these systems and their effectiveness as measured by successful activations and the number of unintended activations No comments were submitted on this metric
72 Special Protection Systems are also referred to as Special Protection Schemes
Remedial Action Schemes (RAS) or System Integrity Protection Schemes (SIPS)
30
20121015-4003 FERC PDF (Unofficial) 10152012
Docket No AD12-8-000
k Demand Response Entities responding to this metric will be required to provide a comprehensive explanation of the nature of utility demand response programs implemented for load management as well as in compliance with state requirements There were no comments on this metric l System Lambda System lambda is the incremental cost of energy of the marginal unit assuming no system constraints This metric tracks the trend in marginal fuel costs and is an important metric since fuel costs represent the largest component of wholesale energy costs The system lambda metric would not apply to utilities where the marginal price is typically set by hydro units Also system lambda data will be based on information contained in FERC Form No 714 There were no comments on this metric m Congestion Management i Performance Metric Congestion represents the cost to customers of paying for more expensive energy because physical transmission line limits do not allow full delivery of least-cost energy Entities responding to this metric would be required to provide a congestion analysis consistent with Order No 890 In Order No 890 the Commission adopted a planning principle requiring transmission providers to prepare studies identifying ldquosignificant and recurringrdquo congestion and post such studies on their OASIS The Commission explained that the studies should analyze and report on the following items (1) the location and magnitude of the congestion (2) possible remedies for the elimination of the congestion in whole or in part (3) the associated costs of congestion and (4) the cost associated with relieving congestion through system enhancements (or other means)73 ii Comments Multiple TDUs argue that merely requiring vertically-integrated transmission providers to provide a narrative detailing their economic study processes as is proposed will elicit little more than a repetition of the planning process descriptions that were filed in compliance with Order No 890
73 Order No 890 FERC Stats amp Regs para 31241 at PP 529 542
31
20121015-4003 FERC PDF (Unofficial) 10152012
Docket No AD12-8-000
iii Response Commission Staff recommends that utilities discuss the status of their transmission plans as explained in the Long-Term Transmission Planning Metrics discussed above Commission Staff expects that these discussions will address expansion plans to resolve congestion issues on their systems Therefore Commission Staff expects that the performance reports submitted by utilities will provide substantive information on congestion management n Resource Availability i Performance Metric
The proposed metric measures the percentage of time that system resources are not available because of unplanned outages as measured by the system forced outage rate No comments were submitted on the metric
ii Response Commission Staff recommends that this metric be revised to be 1 minus the
system forced outage rate Revising the metric as recommended will measure unforced capacity availability and therefore resource availability This revision will also make this metric comparable to the performance metric adopted for ISOs and RTOs Resource availability is an indication of system efficiency and cost management by utilities in regions outside of ISOs and RTOs Higher resource availability can result in the commitment of fewer peak resources (or the importation of peak supplies) that potentially have high costs thereby resulting in reduced costs o Transmission System Availability This metric measures interrupted load MWh as a percentage of load served In light of the many factors that can result in load interruptions some of which are beyond the control of utilities the narrative detailing the reasons for load interruptions will be essential in assessing performance No comments were submitted on this metric p Fuel Diversity
This metric is defined to be the percentage mix of fuel types installed and available (capacity fuel diversity) and produced (generation fuel diversity) Fuel diversity provides an indication of a utilityrsquos capability to integrate fuels with different characteristics such as lower costs or lower environmental impacts No comments were submitted on this metric
32
20121015-4003 FERC PDF (Unofficial) 10152012
Docket No AD12-8-000
q Clean Energy i Performance Metric
These metrics measure the use of ldquoclean energyrdquo74 The metrics track number of MWh of clean energy by resource type as a percentage of total energy and the number of MW of clean energy by resource type as a percentage of total capacity
ii Comments NIPPC states that the Commission should expand the clean energy metric to include information related to curtailments of clean energy resources as frequent curtailments of these resources by a transmission operator may reflect a dysfunction in the generation market since these resources have no fuel costs NIPPC explains that the metric should include the number of curtailments the duration of each curtailment the number of MW hours curtailed and the justification for the curtailment75 iii Response Commission Staff does not consider curtailments of clean energy to be a measure of the diversity of a utilityrsquos resource mix Rather curtailments of resources ndash or more accurately schedule adjustments or manual redispatch instructions by transmission providers ndash are used to maintain system reliability We note that the diversity metrics in conjunction with the narratives regarding actions taken to manage dispatch reliability and TLR (see pages 18-19 infra) will provide a basis for a comprehensive view of the issue of clean energy
D Burden Estimate
1 Information Collection Statement In its solicitation for comments Commission Staff estimated the public reporting
burden for participating utilities to be approximately 140 hours per respondent for each report
74 Clean Energy is defined to include nuclear energy and variable energy
resources including solar wind hydro geothermal and biomass resources
75 NIPPC Comments at 6
33
20121015-4003 FERC PDF (Unofficial) 10152012
Docket No AD12-8-000
2 Comment EEI asserts that the response time could be as high as 300-400 hours
3 Response
Commission Staff will adjust the burden estimate based on EEIrsquos high estimate of 300-400 hours Commission Staff considers EEIrsquos estimate to be reflective of the most time that it would take an entity to respond to the metrics While Commission Staff recognizes that this report requires additional metrics and narrative discussions Commission Staff nevertheless continues to conclude that 140 hours still represents a reasonable estimate of the burden since much of the data required should be readily available to the responding utilities However in recognition of the fact that the burden will vary from entity to entity we will revise our estimate to 245 hours per respondent which is the mid-point between these estimates
E Information Collection Statement Information Collection Statement
The following collection of information contained in these metrics is subject to
review by the Office of Management and Budget (OMB) under section 3507 of the Paperwork Reduction Act of 199576 OMBrsquos regulations require approval of certain information collection requirements imposed by agency actions77 The Commission cannot conduct this information collection unless it displays a valid OMB control number78
The collection of information requires those public utilities outside of ISOs and RTOs that choose to participate to provide information responding to the attached metrics on a periodic basis This includes the submission of price data and information relating to reliability transmission planning requests for service and system capacity The
76 44 USC sect 3507 (2006) The Paperwork Reduction Act requires OMB
approval of certain information collection activities when these activities apply to 10 or more persons Because it is estimated that 11 entities will respond to this collection the Chairman is requesting approval from OMB
77 5 CFR sect 1320 (2012)
78 The Commission is issuing a separate notice regarding the collection of information that will be published in the Federal Register to comply with the OMB requirements at 5 CFR sect 13205(a)(iv)
34
20121015-4003 FERC PDF (Unofficial) 10152012
Docket No AD12-8-000
information submitted by participating utilities would be used to help develop a common set of metrics for both ISORTO markets and non-RTOISO markets and for evaluating market performance thereafter
35
20121015-4003 FERC PDF (Unofficial) 10152012
Docket No AD12-8-000
Burden Estimate The estimated public reporting burdens for the reporting
requirements have been adjusted as described above
FERC-922 Requirements
Number of Respondents
Annually (1)
Number of
Responses per Respondent
(2)
Average Burden Hours per Response
(3)
Total Annual Burden Hours
(1)x(2)x(3) Metrics Data Collection
140 1540
Write Performance Analysis
85 935
Management Review
11 1
20 220
Total 245 2695
Cost to Comply The Chairman has projected the cost of compliance to be $184460 Technical Expertise = $168300 (1540 hours data collection + 935 hours report completion $68 per hour) Management Review = $17160 (220 hours report review $78 per hour) Cost per hour figures are calculated using BLS data79 The technical expertise category factors in the median wage for an engineer analyst attorney and economist The management category factors in the median wage for general and operations managers Based on BLS data80 both cost figures have been adjusted to include benefits (benefits represent 295 percent of the total hourly figure)
Title FERC-922 Non-RTOISO Performance Metrics
Action Proposed Collection
OMB Control No TBD
79 See httpblsgovoescurrentnaics3_221000htm
80 See httpwwwblsgovnewsreleaseececnr0htm
36
20121015-4003 FERC PDF (Unofficial) 10152012
Docket No AD12-8-000
Internal Review The Chairman has reviewed the proposed metrics and has determined that the metrics and data gathered thereunder are necessary These requirements conform to the Commissionrsquos need for efficient information collection communication and management within the energy industry The Chairman is assured by means of internal review that there is specific objective support for the burden estimates associated with the information collection requirements
Interested persons may obtain information on the reporting requirements by contacting the following Federal Energy Regulatory Commission 888 First Street NE Washington DC 20426 [Attention Ellen Brown Office of the Executive Director] e-mail DataClearancefercgov Phone (202) 502-8663 fax (202) 273-0873 Any further comments on the collections of information and the associated burden estimates in this proceeding should be sent to the Commission in this docket and may also be sent to the Office of Information and Regulatory Affairs Office of Management and Budget Washington DC 20503 [Attention Desk Officer for the Federal Energy Regulatory Commission] For security reasons comments to OMB should be submitted by e-mail to oira_submissionombeopgov Comments submitted to OMB should include Docket Number AD12-8-000 and FERC-922
37
20121015-4003 FERC PDF (Unofficial) 10152012
Docket No AD12-8-000
38
IV Appendix
20121015-4003 FERC PDF (Unofficial) 10152012
Docket No AD12-8-000 39
Performance Metric Specific Metric(s) Reliability A National or Regional
Reliability Standards Compliance
1 References to which Electricity Reliability Organization (ERO) and Regional Reliability Organization (RRO) standards are applicable 2 Number of violations self-reported and made public by NERCFERC 3 Number of violations identified and made public as RRO or ERO audit findings 4 Total number of violations made public by NERCFERC 5 Severity level of each violation made public by NERCFERC 6 Compliance with operating reserve standards 7 Unserved energy (or load shedding) caused by violations Additional detail will be provided on (1) number of events (2) duration of the events (3) whether the events occurred during onoff-peak hours (4) additional information on equipment types affected and kV of lines affected and (5) number of events (and severity and duration of events) resulting in load shedding based on the utilization of TPL-002 Footnote b criteria Items 2-7 Track the ISORTO definition ldquoThis metric is a quantification of all NERC and RRO Reliability Standards violations that have been identified during an audit or as a result of an ISORTO self-report and have been published as part of that processrdquo Non ndashISORTO utilities should limit reporting to the same eight functional areas used by the ISORTOs 1 Balancing Authority 7 Transmission Planner 2 Interchange Authority 8 Transmission Service Provider 3 Planning Authority 4 Reliability Coordinator 5 Resource Planner 6 Transmission Operator
20121015-4003 FERC PDF (Unofficial) 10152012
Docket No AD12-8-000 40
B Dispatch Reliability 1 Balance Authority Ace Limit (BAAL) OR CPS1 and CPS2
2 Number of hours of transmission load reliefs (of severity level 3 or higher) called by the incumbent transmission provider or unscheduled flows
WECC entities will report events under the WECC Unscheduled Flow Mitigation Procedure (equivalent to the NERC TLR Level three)
3 Energy Management System (EMS) availability C Operational Planning ndash
Load Forecast Accuracy Actual peak load as a percentage variance from forecasted peak load as reported in OASIS
D Wind Forecasting Accuracy
Actual wind availability compared to forecasted wind availability
E Unscheduled Flows Difference between net actual interchange (actual measured power flow in real time) and the net scheduled interchange in megawatt hours Reported in Form 714
F Transmission Outage Coordination
1 Percentage of ge 200 kV planned outages of 5 days or more for which utility notified customers at least 1 month prior to the outage commencement date 2 Percentage of ge 200kV outages cancelled by utility after having been previously approved 3 Report information posted on OASIS (percentage of outages planned and unplanned with less than 2 days notice)
20121015-4003 FERC PDF (Unofficial) 10152012
Docket No AD12-8-000 41
G Long-Term Reliability Planning ndash Transmission
Dollar amount and number of facilities approved to be constructed for reliability purposes
2 Percentage of approved construction on schedule and completed
3 Performance of planning process related to
a Requests for and number of completed reliability studies
b Requests and number of completed economic studies
Discussion of stakeholder process and identification of stakeholder groups participating
H Long-Term Reliability
Planning ndash Resources 1 Processing time for generation interconnection requests 2 Actual reserve margins compared with planned reserve margins 3 Explanation of the nature and characteristics of demand response programs and how they are used in system planning Discussion of programs to facilitate the integration of renewable resources and to mitigate any issues and uncertainty associated with scheduling renewable resources
20121015-4003 FERC PDF (Unofficial) 10152012
Docket No AD12-8-000 42
I Infrastructure Investment ndash Interconnection and Transmission Process Metrics
1 Number of requests
2 Number of studies completed
3 Average age of incomplete studies
4 Average time for completed studies
5 Total cost and types of studies completed (eg feasibility study system impact study and facility study)
6 Number of transmission access denialstransmission service requests (TSRs) denied
J Special Protection
Systems 1 Number of special protection systems
2 Percentage of special protection systems that responded as designed when activated
Applicable pool of special protection systems should be based on how the reporting entityrsquos Regional Entity defines ldquospecial protection systemsrdquo
3 Number of unintended activations
20121015-4003 FERC PDF (Unofficial) 10152012
Docket No AD12-8-000 43
System Operations Measures A Demand Response Comprehensive explanation of the nature of utility demand response programs
implemented for load management as well as in compliance with state requirements B System Lambda System Lambda (on marginal unit)
Proposed System Lambda metric would not apply to utilities where the
marginal price is typically set by hydro units System lambda data will be based on Form 714 information
C Congestion Management Congestion analysis per Order No 890 D Resource Availability 1 - System forced outage rate as measured over 12 months E Transmission System
Availability Interrupted load megawatt hours as a percentage of load served
F Fuel Diversity Fuel diversity in terms of energy installed capacity and actual production G Clean Energy 1 Clean Energy megawatt hours by resource type as a percentage of total energy
2 Clean Energy megawatts by resource type as a percentage of total capacity Organizational Effectiveness Not applicable to non-RTO
entities
20121015-4003 FERC PDF (Unofficial) 10152012
Document Content(s)
Staff Report Non-RTO Metrics Final1015 2PDF1-43
20121015-4003 FERC PDF (Unofficial) 10152012
- Staff Report Non-RTO Metrics Final1015 2PDF
- Document Content(s)
-

Docket No AD12-8-000
transmission customers of the reporting transmission provider have notice and understanding before the interruption Multiple TDUs recognize that Footnote b is in flux and as a result urge the Commission to revisit the metrics associated with Footnote b after Footnote b is revised47
In reply to Multiple TDUs EEI argues that situations in which Footnote b is invoked are clearly contemplated under section A7 of the Reliability metrics proposed in the Commission notice48
NIPPC argues that the Commission should consider expanding the reliability standards metrics to include the number of dispatch orders issued to generators to curtail output and the specific reasons for each of those dispatch orders as a dispatch order made to a generator to avoid or mitigate a reliability violation will have the same impact on a market as a reliability violation NIPPC also argues that the metrics should include the number of and justification for schedule curtailments (or e-tag curtailments) NIPPC further maintains that the metrics should compare the percentage of the dispatch orders or schedule curtailments issued to independent power producers to the percentage of independently owned generation capacity interconnected to the transmission providerrsquos system49 iii Response
While Reliability metric A7 captures situations where Footnote b is invoked
Commission Staff concludes that for purposes of clarity it would be beneficial to have a separate metric to address the planned Firm Demand interruptions that planners use to meet the system performance requirements of TPL-002-2b Table 1 for Category B single contingency events (ie Footnote b interruptions as discussed in Order No 762) and that the metric should track the number severity and duration of these incidents This information is a good performance measure because it could expose an area of weakness in the Bulk Electric System that may need to be addressed with a capital project or an appropriate operating procedure Commission Staff recommends that in the narrative that accompanies the metrics report participating utilities discuss the actions taken to address the interruptions and the notice utilities provide customers before interruptions are made
46 We note that this request is discussed in our response infra at pp 19-20
47 Multiple TDUs Comments at 10-11
48 EEI Reply Comments at 4
49 NIPPC Comments at 4
17
20121015-4003 FERC PDF (Unofficial) 10152012
Docket No AD12-8-000
Responding to NIPPC the reliability standards metrics are limited to providing information on reliability violations Actions taken by transmission providers to curtail the dispatch of generators or adjust transmission schedules (or e-tags) are relevant to the dispatch reliability metrics discussed below As discussed in that section Commission Staff is recommending that participating utilities include narratives on all actions they take to manage dispatch reliability Commission Staff is not recommending that this information be incorporated into metrics because not all participating utilities take these actions and there are no standardized measures for these activities With respect to NIPPCrsquos request that a metric be developed to measure transmission schedule adjustments or e-tag revisions we note that these actions are the result of transmission loading reliefs (TLR) or Unscheduled Flow Relief events that are being reported in the Dispatch Reliability measure below and are already covered by the metrics For this reason Commission Staff does not recommend adding this metric
b Dispatch Reliability i Performance Metrics Dispatch reliability is measured by three metrics The proposed metrics listed in the notice retained two of the metrics used to measure dispatch reliability in ISOs and RTOs (1) Balancing Authority Area Control Error Limit or Control Performance Standard 1 and Control Performance Standard 2 and (2) Energy Management System Availability The proposed metric relating to TLR or Unscheduled Flow Relief Events would measure the number of events ndash rather than the hours as is reported in the performance metrics for ISOs and RTOs ndash of TLRs (of severity level 3 or higher) or unscheduled flows called by the incumbent transmission provider Utilities that are part of the Western Electricity Coordinating Council (WECC) will report events under the WECC Unscheduled Flow Mitigation Procedure that are equivalent to the NERC TLR Level 3 ii Comments
EPSA contends that in order to properly identify problem areas the Commission should require each transmission provider to identify the length and magnitude of each TLR event EPSA states that at a minimum each transmission owner should provide the following information (1) how long each constrained element is subject to a continuous Level 3 or higher TLR in hours (2) the number of MW of network transmission service curtailed for each continuous TLR event and for all continuous TLR events in total (3) the number of MW of firm point-to-point transmission service curtailed for each continuous TLR event and in aggregate and (4) the number of MW of non-firm transmission service curtailed per continuous TLR event and in aggregate50 EPSA
50 EPSA Comments at 3-4
18
20121015-4003 FERC PDF (Unofficial) 10152012
Docket No AD12-8-000
further states that monitoring and tracking TLR events on a system that are categorized at level 1 or 2 can provide additional insights into system dynamics as those events can be prevented by nodal market designs that dispatch around binding constraints using congestion prices Additionally EPSA states that all TLR events at level 5 or higher should be tracked and reported separately from all other TLR events as TLR events at this level indicate a severely constrained system EPSA recommends that the metrics include a metric for reporting all congestion management events ndash not only those categorized as a TLR ndash because some areas rely on a variety of other congestion management techniques EPSA further recommends including an evaluation of the number and severity level of all congestion management events of a utility or transmission system with the changes discussed above51 iii Response
Commission Staff agrees with EPSA that the metric concerning TLR should measure the duration of such events Accordingly Commission Staff recommends that the TLR metric be revised to measure the hours of TLR called by the incumbent transmission provider Commission Staff notes that this revision will result in a metric that is consistent with the metrics for ISO and RTO markets
Commission Staff does not consider information on severity level 1 and 2 events
to be measures of utility reliability performance Such events by definition only impact local area operations and as a result will not impact system reliability For this reason TLR events of level 3 and above are systemic events and are the appropriate basis for a performance metric for system reliability For TLR events of severity level 3 and above Commission Staff agrees with EPSA that the TLRUnscheduled Flow Relief metric should be supplemented with information on TLR (or Unscheduled Flow Relief) events for each severity level energy curtailment data on the number of MW curtailed and duration of curtailment information Such information along with a discussion by the participating utility of the impact of curtailments on customers and the various resource types will allow for a better informed evaluation of performance52 For this reason we
51Id at 5
52 We note that in Order No 890 the Commission concluded that requiring transmission providers to post additional information on curtailments was necessary to provide transparency and enable customers to assess whether they have been treated without undue discrimination See Preventing Undue Discrimination and Preference in Transmission Service Order No 890 FERC Stats amp Regs para 31241 at P 1626 order on rehrsquog Order No 890-A FERC Stats amp Regs para 31261 (2007) order on rehrsquog Order No 890-B 123 FERC para 61299 (2008) order on rehrsquog Order No 890-C 126 FERC para 61228 (2009) order on clarification Order No 890-D 129 FERC para 61126 (2009) For
19
20121015-4003 FERC PDF (Unofficial) 10152012
Docket No AD12-8-000
recommend that this information be included in the narrative discussions that accompany the (TLRUnscheduled Flow Relief) metric to the extent the information is available
With respect to EPSArsquos request for metrics on all congestion management activities such as Local Area Protocols Commission Staff recommends that participating utilities provide narratives on the use of Local Area Protocols out-of-merit dispatches and other techniques to resolve system dispatch reliability problems Such information will provide a context for the role played by TLRs or Unscheduled Flow Reliefs thereby providing the basis for a more comprehensive assessment of constraint management by the participating utility Since not all participating utilities use these techniques and the definitions of these techniques may differ among utilities Commission Staff does not consider this information to be appropriate for standardized metrics c Load Forecasting Accuracy
Actual peak load as a percentage variance from forecasted peak load as reported in a transmission providerrsquos OASIS measures the effectiveness of the load forecasting function of utilities in non-ISORTO regions Since load forecasting provides the basis for resource commitment this metric impacts the incurrence of resource costs The more accurate a utility is in forecasting load the greater the likelihood that it can commit sufficient resources in a cost effective manner that avoids over-commitment of resources inefficient commitment of short lead-time resources or under-utilization of available resources This metric measures the percentage difference between actual peak load and forecasted peak load No comments were submitted on this metric d Wind Forecasting Accuracy i Performance Metric This metric measures the percentage accuracy of actual wind availability compared to forecasted wind availability Improving the accuracy of the wind forecast will facilitate the timely commitment and dispatch of sufficient supplemental resources ii Comments NIPPC maintains that the Commission should clarify whether this metric applies to the wind generation assets controlled by the merchant function of the transmission provider or to the independently owned and operated wind generation interconnection to
TLR events of severity level 3 and above Commission Staff recommends including a narrative explanation of why transactions could not be continued or completed similar to what is required by Order No 890 Id P 1627
20
20121015-4003 FERC PDF (Unofficial) 10152012
Docket No AD12-8-000
the transmission providerrsquos system NIPPC argues that the metric should not extend to generators not owned or controlled by the merchant function of the transmission provider in light of the market-sensitive nature of a generatorrsquos wind forecasting accuracy and scheduling practices53 NIPPC also urges the Commission to consider expanding this metric to require a transmission provider to report whether it has implemented a centralized wind forecast system for use in its operations and if so to collect additional metrics on the accuracy of that centralized forecast54 NIPPC contends that a single metric comparing actual wind output to forecast output over the reporting period is not a useful metric as inaccuracies in the forecast may cancel out over a long reporting period NIPPC argues that a more relevant measure of accuracy would be the number of hours during the reporting period that the forecast is accurate (where the forecast is within five percent of actual output) NIPPC also suggests that the following additional metrics would be useful (1) the MW of windsolar capacity subject to the forecast (2) granularity of the forecast (monthly weekly daily hourly sub-hourly) (3) whether the forecast is integrated into the transmission providerrsquos operations (4) whether the transmission provider shares the forecast with market participants (or generation owners) and (5) an equivalent metric for forecasts associated with solar energy and hydroelectric energy55 iii Response The wind accuracy metric was intended to apply to all wind resources ndash owned and non-owned ndash on the transmission providersrsquo systems Commission Staff does not recommend excluding wind generators not owned or controlled by transmission providers from the wind accuracy metric To be an effective tool to ensure system reliability this metric must measure the accuracy of forecasts that account for all wind resources in a utilityrsquos footprint This requirement is increasingly important as wind resources become a more significant portion of total resource output When wind generators ndash including those not owned or controlled by the utility ndash provide wind availability forecasts they are performing a reliability function that has implications for system reliability management and planning Accordingly Commission Staff considers this information to be an important element in an assessment of a utilityrsquos reliability performance We encourage participating utilities to work with wind generators not owned or controlled by the utility to ensure that the data gathered and reported protects market-sensitive information from
53 NIPPC Comments at 5
54 Id
55 Id at 5-6
21
20121015-4003 FERC PDF (Unofficial) 10152012
Docket No AD12-8-000
being reported in public reports or released to utility subsidiaries that compete with these wind generators Commission Staff agrees with NIPPC that to the extent that centralized forecasting can minimize integration costs this information is an indication of utility performance Therefore Commission Staff recommends that participating utilities discuss their forecasting process in their reports With respect to NIPPCrsquos concern that inaccuracies in the forecast may cancel out Commission Staff notes that the wind accuracy forecast will be based on the mean absolute error of the forecast compared to actual wind availability Therefore all errors ndash positive and negative ndash will be measured and will not cancel out Since the proposed metric will measure the magnitude of forecast inaccuracies Commission Staff considers the proposed metric to be superior to the alternative proposed by NIPPC that only indicates the number of hours in which a forecast is outside a five percent threshold Further responding to NIPPC Commission Staff notes that forecast accuracy will be based on a comparison of the day-ahead forecast to actual availability Commission Staff also notes that the capacity of wind and solar subject to the forecast which NIPPC requests be an additional performance metric is included in the Clean Energy metric discussed below Commission Staff is not recommending the inclusion of a metric measuring the accuracy of forecasts for other variable energy resources because many utilities do not perform these forecasts or they are not performed according to a standardized process Nevertheless Commission Staff considers it appropriate that participating utilities provide narrative descriptions of their solar and hydro forecasts to the extent these resources are significant sources of energy to allow for a more complete assessment of forecasting performance e Unscheduled Flows Metric Unscheduled flows are defined as the difference between net actual interchange (actual power flow measured in real time) and net scheduled interchange The two components of unscheduled flows are inadvertent energy defined to be the difference between actual and scheduled interchange for all interties and parallel flow (or loop flow) defined to be the actual power flow on a contract path within an interconnection from one Balancing Authority Area to a second Balancing Authority Area through ldquoparallelrdquo transmission lines through a third Balancing Authority Area Parallel flows are a function of the interconnectionrsquos operating configuration line resistance and physics Unscheduled flows provide information relevant to operation planning because curtailments may occur when unscheduled flows exceed system operating limits This metric is measured by the difference between net actual interchange (actual measured power flow in real time) and the net scheduled interchange in MWh as reported in a
22
20121015-4003 FERC PDF (Unofficial) 10152012
Docket No AD12-8-000
utilityrsquos FERC Form No 714 ldquoAnnual Electric Balancing Authority Area and Planning Area Reportrdquo No comments were received on this metric f Transmission Outage Coordination i Performance Metric
The transmission outage coordination metric measures the percentage of outages planned and unplanned that occur with less than two days notice Effective transmission outage coordination will result in early notification of outages and therefore will be indicated in the metrics as a low percentage of short notice outages56 Effective transmission outage coordination by utilities in non-ISORTO regions ensures that outages do not threaten system reliability and that additional and potentially more expensive resources do not need to be committed
ii Comments ESPA recommends that the performance metrics track a utilityrsquos transmission outage performance EPSA states that the information posted on OASIS is valuable information and requests that the Commission include information regarding any transmission outages known ahead of time including the time and date of the planned outage and the planned duration of the outage57 EPSA maintains that providing this information would allow market participants to evaluate the information concerning the proposed outage and make other arrangements if necessary or otherwise take proactive steps to reduce the impact of any such planned outage EPSA states that outage performance information would also give the Commission and other observers the opportunity to evaluate how well the utility or transmission owner can schedule outages and execute that schedule58
iii Response
Commission Staff agrees with EPSA that the transmission outage metrics should include information to measure the utilitiesrsquo ability to plan for outages and successfully execute their outage plan As stated in the Commission Staff Report on ISORTO Performance Metrics effective transmission outage coordination is defined as early
56 The proposed metrics will measure outages for major transmission facilities
which are defined for purposes of the metrics as 200kV and higher
57 EPSA Comments at 7-8
58 Id at 8
23
20121015-4003 FERC PDF (Unofficial) 10152012
Docket No AD12-8-000
notification of planned outages of five days or longer ndash ie notification at least one month prior to the outage commencement date ndash and timely review of outage impacts59 Also effective transmission outage coordination is measured by the percentage of planned outages that are canceled due to conflicting planned outages as well as forced (unscheduled) outages that could cause reliability issues and additional congestion costs Commission Staff recommends adding these metrics for outages on major transmission lines of 200kV and higher to be consistent with the metrics for ISOs and RTOs60 g Long-Term Reliability Planning ndash Transmission i Performance Metric The proposed metric tracks the dollar amount of transmission facilities approved to be constructed for reliability purposes the percentage of approved construction completed the number of requests for and completed reliability studies and a narrative detailing a utilityrsquos economic study process This information measures the ability of each utilityrsquos expansion planning process to identify reliability and economic needs in advance which is essential to ensuring that market participants have sufficient time to develop either transmission or resource solutions to system reliability and economic requirements The metric also includes a narrative discussion of the transmission planning stakeholder process ii Comments Multiple TDUs state that a metric related to planning and completion of economic transmission is needed for multiple reasons First vertically-integrated transmission
59 Staff Report at 25
60 See Staff Report at Appendix B Peformance Metric F1 (Oct 21 2010) (Percentage of gt 200kV planned outages of 5 days or more that are submitted to ISORTO at least 1 month prior to the outage commencement date) We note that in Revisions to Electric Reliability Organization Definition of Bulk Electric System and Rules of Procedure Notice of Proposed Rulemaking 77 Fed Reg 39846 139 FERC para 61247 (2012) the Commission proposed to approve a modification to the currently-effective definition of ldquobulk electricrdquo systemrdquo that would establish a bright-line threshold that includes all facilities at or above 100 kV Commission Staff still considers it reasonable to require a 200 kV minimum for reporting information related to outages for performance metrics purposes particularly since this 200 kV minimum is consistent with the threshold ISOsRTOs used in their prior metric reports Nevertheless Commission Staff will monitor responses under this metric and continue to evaluate whether this is the appropriate threshold
24
20121015-4003 FERC PDF (Unofficial) 10152012
Docket No AD12-8-000
providers have inherent incentives to discriminate and underperform when performing this function Multiple TDUs state that the Commission has recognized as much and that such a metric would help measure the efficacy of the remedies that the Commission adopted in Order No 890 to address this concern61 Second the economic costs of transmission constraints are not transparent in areas without centralized markets like those found in ISOs and RTOs with congestion pricing Third more specificity is needed because a vertically-integrated transmission owner reporting on transmission construction and identifying shortfalls would be identifying its own unsuccessful outcomes62 Multiple TDUs argue that merely requiring vertically-integrated transmission providers to provide a narrative detailing their economic studies process as is proposed will elicit little more than a repetition of the planning process descriptions that were filed in compliance with Order No 890 For these reasons Multiple TDUs argue that the transmission planning and construction metric should be expanded to include the dollar amount of facilities constructed for purposes whose predominant purpose was not reliability broken down between (a) economic (b) public policy (c) facilities to support the planned generation resources of the transmission provider or its affiliates (d) transmission or interconnection requests made by the transmission provider or its affiliates and (e) in response to requests from others Multiple TDUs state that the metrics should also include the number of transmission construction projects that were added to the transmission provider construction plans between the issuance of Order No 890 and the submission of the report broken down into categories (a) through (e) and into their current status (ie completed incomplete and on schedule incomplete and behind schedule and removed from plan) EEI argues that the Multiple TDUsrsquo request is unwarranted EEI maintains that due to the low incidence of economic study requests requiring such additional reporting will create an added and unnecessary burden to reporting utilities63 Multiple TDUs also state that the metric should include a narrative assessment supported by quantitative information of the transmission providerrsquos planning process efficacy64 Similarly EPSA argues that the performance metrics should include a metric
61 Multiple TDUs Comments at 6 (citing Order No 890 FERC Stats amp Regs para
31241) 62 Id at 6-7
63 EEI Reply Comments at 4
64 Multiple TDUs Comments at 7-8
25
20121015-4003 FERC PDF (Unofficial) 10152012
Docket No AD12-8-000
detailing how well a utility executes its transmission development plans EPSA explains that a utilityrsquos failure to follow its transmission plan can adversely impact customers and merchant generators Thus EPSA maintains that a metric assessing how well a utility executes its transmission plan would provide valuable information including a demonstration of how prepared a utility is to meet any future reliability needs on its system65 iii Response
Commission Staff does not recommend adding the metrics proposed by Multiple TDUs on non-reliability transmission and interconnection projects The purpose of this metric is to assess the extent to which transmission solutions are analyzed planned and deployed to meet reliability requirements Thus additional information to examine discrimination by utilities or to obtain information on all project spending including projects to meet public policy objectives would go beyond the scope of the metric The congestion issues of concern to Multiple TDUs including the impact of transmission planning on congestion are discussed further below in the Congestion Management metric
Commission Staff agrees with commenters that additional information is needed
however in the transmission planning metrics to provide a more comprehensive assessment of transmission planning performance and to allow for comparisons between ISOs and RTOs and participating utilities in regions outside of ISOs and RTOs Accordingly Commission Staff recommends additional information be included in the metrics as follows (1) the proposed dollar amount of facilities approved to be constructed for reliability purposes should be revised to also include the number of facilities so that this metric is comparable to the relevant ISORTO performance metric (2) the proposed percentage of approved construction completed metric should be revised to the percentage of approved construction on schedule and completed and (3) the proposed narrative detailing the economic studies process should be revised to a metric that measures the percentage completion of economic projects
Responding to EEI Commission Staff does not find that it would be unduly
burdensome to incorporate both the number of economic study requests and the number of economic studies accomplished into a narrative explanation of the status of planning for economic expansions Economic projects can reduce congestion which in turn can reduce costs to customers and decrease the likelihood that reliability issues will occur Therefore this information provides an important indicator on the progress made by utilities in improving the efficiency of their transmission systems
65 EPSA Comments at 7
26
20121015-4003 FERC PDF (Unofficial) 10152012
Docket No AD12-8-000
Commission Staff agrees with EPSA that the reports provided by participating utilities should also include a discussion of the status of their transmission plans Such information will allow participating utilities to explain their progress in meeting planning goals and explain the issues that may be delaying the completion of reliability and economic projects Commission Staff expects that this discussion will also address the desire of Multiple TDUs to have a narrative assessment of the efficacy of the transmission providerrsquos planning process66 and to address how utilities provide an opportunity to consider transmission needs driven by Public Policy Requirements in their planning process67
h Long-Term Reliability Transmission Planning ndash Resources
Three metrics are employed to measure the effectiveness of long-term reliability planning for resources The first metric processing time for generation interconnection requests measures the effectiveness of processes in achieving timely interconnection of new resources that are needed to ensure reliability The second metric the planned reserve margin is the planned number of MW of resources available as system reserves divided by the number of MW of peak load The third metric is a narrative discussion of demand response programs and how they are used in system planning No comments were received on this metric Commission Staff recommends that the proposed planned reserve margin metric be revised to compare the actual reserve margin to the planned reserve margin This comparison will allow for an evaluation of utility performance in achieving the planned reserve margin
i Infrastructure Investment ndash Interconnection and Transmission Process Metrics
i Performance Metric
These metrics track the progress that utilities have made in regions outside of ISOs and RTOs in completing their reliability reviews ndash namely feasibility system impact and
66 We note that this narrative assessment is in keeping with the Commissionrsquos
requirement that public utility transmission providers make available information regarding the status of transmission upgrades identified in their transmission plans See Transmission Planning and Cost Allocation by Transmission Owning and Operating Public Utilities Order No 1000 FERC Stats amp Regs para 31323 at P 159 amp n154 (2011)) order on rehrsquog Order No 1000-A 139 FERC para 61132 (2012)
67 Order No 1000 FERC Stats amp Regs para 31323 at P 203
27
20121015-4003 FERC PDF (Unofficial) 10152012
Docket No AD12-8-000
facility studies ndash of interconnection and transmission service requests in a timely and efficient manner The metrics track the number of requests the time required to complete the reliability reviews and the costs of completing each of the three types of studies There is also a metric that measures the number of transmission access denials and transmission service request denials The purpose of this metric is to provide information on the magnitude and reasons for transmission service denials and whether additional infrastructure investment is needed to avoid transmission service denials ii Comments Multiple TDUs state that the Commission should collect additional information on the completion of transmission studies Multiple TDUs state that while the metrics for ISOs and RTOs require the reporting of information on studies such measures are omitted from the draft metrics for regions outside of ISOs and RTOs without explanation Multiple TDUs argue that such metrics are even more important than in the ISO and RTO context and that it would be worth obtaining from vertically-integrated transmission providers all of the study completion metrics that ISOs and RTOs are required to produce Multiple TDUs explain that the cost of collecting and providing this information should not be inordinate and that transmission providers should already have expense tracking mechanisms in place to estimate and bill study costs Multiple TDUs state that the following additional metrics would be worth collecting from vertically-integrated transmission providers (1) percentages of long-term transmission service requests and interconnection requests that triggered study requirements (2) percentages of the studies undertaken that led to the identification of upgrade costs (3) the average estimated upgrade cost (4) the percent of transmission service requests withdrawn and the percent approved and (5) the average processing time through each process milestone identified in the transmission providerrsquos Order No 890 compliance tariff provisions such as completion of a feasibility study system impact study and facilities study Multiple TDUs claims that such information would help the Commission identify situations in which impediments to obtaining transmission or interconnection service warrant further investigation68 Multiple TDUs state that the addition of a metric concerning the number of transmission access denials or transmission service requests denied is less meaningful than it first appears Multiple TDUs explain that under the pro forma Open Access Transmission Tariff long-term transmission service requests cannot be legitimately denied instead if there is no existing transmission capability available to accommodate the request the requester is supposed to be informed that meeting the request would require additional facilities and offered the opportunity to fund studies to determine what
68 Multiple TDUs Comments at 5
28
20121015-4003 FERC PDF (Unofficial) 10152012
Docket No AD12-8-000
upgrades are needed Multiple TDUs state that a metric tracking how often entities requesting service withdraw their request for service in the face of these requirements would be worthwhile but that the proposed metric might not elicit such information69 Accordingly Multiple TDUs suggest revising the metric to require entities to report the number of long-term transmission service requests for which ATC was initially found to be unavailable and the disposition of each request with each of these points broken down between requests made by third-party transmission customers and requests made by affiliates or divisions of the transmission provider70
NIPPC contends that the Commission should require transmission operators to
report information concerning the pace of large generator interconnections including the total number of pending interconnection requests the number of pending requests in each phase of the LGIA process and the number of requests in each phase that have experienced delays in completing that phase of the interconnection process along with a narrative describing the causes of those delays71 iii Response Commission Staff agrees with Multiple TDUs that the proposed metrics should include information on how long it takes participating utilities to complete interconnection and transmission studies as a measure of the efficiency of the utilityrsquos infrastructure development process Accordingly Commission Staff recommends that the performance metrics be revised to include metrics concerning the average age of incomplete studies and the average time to complete studies Commission Staff considers the time to complete all studies to be an appropriate metric to measure the efficiency of utility interconnection and transmission study processes It is expected that the narrative discussions that accompany the metrics will address issues with the various study stages and that the discussions will address the issues of concern to Multiple TDUs Commission Staff does not consider that information on the percentage of requests that trigger studies or are withdrawn will reflect utility performance The percentage of requests that trigger studies is a function of available transmission capacity not utility performance The percentage of requests withdrawn is caused by the actions of market participants ndash not utilities ndash and therefore does not measure utility performance Therefore we are not recommending the addition of this information to the metrics reports
69 Id at 8
70 Id
71 NIPPC Comments at 4-5
29
20121015-4003 FERC PDF (Unofficial) 10152012
Docket No AD12-8-000
With regard to Multiple TDUsrsquo interest in additional metrics on transmission service denials Commission Staff expects that the narrative discussions provided by participating utilities will address issues of concern to the Multiple TDUs such as the disposition of requests for service Commission Staff notes however that this metric is not intended to measure ATC or transmission capacity in general Rather the purpose of tracking transmission service denials is to provide an additional measure of the efficiency of utilities in processing requests for transmission service and therefore is intended to be evaluated in the context of the other infrastructure investment processing metrics This information combined with explanations provided by the utilities in their narrative discussion will provide the basis for a comprehensive assessment of how utilities are managing their infrastructure development process Commission Staff does not recommend adding a metric concerning the number of pending generation interconnection requests as requested by NIPPC By measuring the time it takes utilities to complete their studies for interconnection and transmission service the proposed metric appropriately focuses on the efficiency of a utilityrsquos processing of service requests ndash irrespective of the total number of requests Also since many interconnection requests in a utilityrsquos interconnection queue may not be ready to proceed because of commercial issues and other factors beyond the control of utilities the number of pending interconnection requests is not an appropriate measure of utility performance As has been the case in the ISORTO performance metrics reports Commission Staff expects that the narrative discussion that accompanies the utility metrics on interconnections and transmission service will explain the status of their request queues and reasons for delays j Special Protection Systems Special Protection Systems72 are automatic protection systems designed to detect abnormal or predetermined system conditions and take corrective actions such as changing demand generation or system configurations in order to maintain system stability acceptable voltage levels or maintain power flows These metrics measure the performance of such Special Protection Systems based on the definition of Special Protection Systems utilized by the reporting entityrsquos Regional Entity These metrics measure both the frequency with which the region relies on these systems and their effectiveness as measured by successful activations and the number of unintended activations No comments were submitted on this metric
72 Special Protection Systems are also referred to as Special Protection Schemes
Remedial Action Schemes (RAS) or System Integrity Protection Schemes (SIPS)
30
20121015-4003 FERC PDF (Unofficial) 10152012
Docket No AD12-8-000
k Demand Response Entities responding to this metric will be required to provide a comprehensive explanation of the nature of utility demand response programs implemented for load management as well as in compliance with state requirements There were no comments on this metric l System Lambda System lambda is the incremental cost of energy of the marginal unit assuming no system constraints This metric tracks the trend in marginal fuel costs and is an important metric since fuel costs represent the largest component of wholesale energy costs The system lambda metric would not apply to utilities where the marginal price is typically set by hydro units Also system lambda data will be based on information contained in FERC Form No 714 There were no comments on this metric m Congestion Management i Performance Metric Congestion represents the cost to customers of paying for more expensive energy because physical transmission line limits do not allow full delivery of least-cost energy Entities responding to this metric would be required to provide a congestion analysis consistent with Order No 890 In Order No 890 the Commission adopted a planning principle requiring transmission providers to prepare studies identifying ldquosignificant and recurringrdquo congestion and post such studies on their OASIS The Commission explained that the studies should analyze and report on the following items (1) the location and magnitude of the congestion (2) possible remedies for the elimination of the congestion in whole or in part (3) the associated costs of congestion and (4) the cost associated with relieving congestion through system enhancements (or other means)73 ii Comments Multiple TDUs argue that merely requiring vertically-integrated transmission providers to provide a narrative detailing their economic study processes as is proposed will elicit little more than a repetition of the planning process descriptions that were filed in compliance with Order No 890
73 Order No 890 FERC Stats amp Regs para 31241 at PP 529 542
31
20121015-4003 FERC PDF (Unofficial) 10152012
Docket No AD12-8-000
iii Response Commission Staff recommends that utilities discuss the status of their transmission plans as explained in the Long-Term Transmission Planning Metrics discussed above Commission Staff expects that these discussions will address expansion plans to resolve congestion issues on their systems Therefore Commission Staff expects that the performance reports submitted by utilities will provide substantive information on congestion management n Resource Availability i Performance Metric
The proposed metric measures the percentage of time that system resources are not available because of unplanned outages as measured by the system forced outage rate No comments were submitted on the metric
ii Response Commission Staff recommends that this metric be revised to be 1 minus the
system forced outage rate Revising the metric as recommended will measure unforced capacity availability and therefore resource availability This revision will also make this metric comparable to the performance metric adopted for ISOs and RTOs Resource availability is an indication of system efficiency and cost management by utilities in regions outside of ISOs and RTOs Higher resource availability can result in the commitment of fewer peak resources (or the importation of peak supplies) that potentially have high costs thereby resulting in reduced costs o Transmission System Availability This metric measures interrupted load MWh as a percentage of load served In light of the many factors that can result in load interruptions some of which are beyond the control of utilities the narrative detailing the reasons for load interruptions will be essential in assessing performance No comments were submitted on this metric p Fuel Diversity
This metric is defined to be the percentage mix of fuel types installed and available (capacity fuel diversity) and produced (generation fuel diversity) Fuel diversity provides an indication of a utilityrsquos capability to integrate fuels with different characteristics such as lower costs or lower environmental impacts No comments were submitted on this metric
32
20121015-4003 FERC PDF (Unofficial) 10152012
Docket No AD12-8-000
q Clean Energy i Performance Metric
These metrics measure the use of ldquoclean energyrdquo74 The metrics track number of MWh of clean energy by resource type as a percentage of total energy and the number of MW of clean energy by resource type as a percentage of total capacity
ii Comments NIPPC states that the Commission should expand the clean energy metric to include information related to curtailments of clean energy resources as frequent curtailments of these resources by a transmission operator may reflect a dysfunction in the generation market since these resources have no fuel costs NIPPC explains that the metric should include the number of curtailments the duration of each curtailment the number of MW hours curtailed and the justification for the curtailment75 iii Response Commission Staff does not consider curtailments of clean energy to be a measure of the diversity of a utilityrsquos resource mix Rather curtailments of resources ndash or more accurately schedule adjustments or manual redispatch instructions by transmission providers ndash are used to maintain system reliability We note that the diversity metrics in conjunction with the narratives regarding actions taken to manage dispatch reliability and TLR (see pages 18-19 infra) will provide a basis for a comprehensive view of the issue of clean energy
D Burden Estimate
1 Information Collection Statement In its solicitation for comments Commission Staff estimated the public reporting
burden for participating utilities to be approximately 140 hours per respondent for each report
74 Clean Energy is defined to include nuclear energy and variable energy
resources including solar wind hydro geothermal and biomass resources
75 NIPPC Comments at 6
33
20121015-4003 FERC PDF (Unofficial) 10152012
Docket No AD12-8-000
2 Comment EEI asserts that the response time could be as high as 300-400 hours
3 Response
Commission Staff will adjust the burden estimate based on EEIrsquos high estimate of 300-400 hours Commission Staff considers EEIrsquos estimate to be reflective of the most time that it would take an entity to respond to the metrics While Commission Staff recognizes that this report requires additional metrics and narrative discussions Commission Staff nevertheless continues to conclude that 140 hours still represents a reasonable estimate of the burden since much of the data required should be readily available to the responding utilities However in recognition of the fact that the burden will vary from entity to entity we will revise our estimate to 245 hours per respondent which is the mid-point between these estimates
E Information Collection Statement Information Collection Statement
The following collection of information contained in these metrics is subject to
review by the Office of Management and Budget (OMB) under section 3507 of the Paperwork Reduction Act of 199576 OMBrsquos regulations require approval of certain information collection requirements imposed by agency actions77 The Commission cannot conduct this information collection unless it displays a valid OMB control number78
The collection of information requires those public utilities outside of ISOs and RTOs that choose to participate to provide information responding to the attached metrics on a periodic basis This includes the submission of price data and information relating to reliability transmission planning requests for service and system capacity The
76 44 USC sect 3507 (2006) The Paperwork Reduction Act requires OMB
approval of certain information collection activities when these activities apply to 10 or more persons Because it is estimated that 11 entities will respond to this collection the Chairman is requesting approval from OMB
77 5 CFR sect 1320 (2012)
78 The Commission is issuing a separate notice regarding the collection of information that will be published in the Federal Register to comply with the OMB requirements at 5 CFR sect 13205(a)(iv)
34
20121015-4003 FERC PDF (Unofficial) 10152012
Docket No AD12-8-000
information submitted by participating utilities would be used to help develop a common set of metrics for both ISORTO markets and non-RTOISO markets and for evaluating market performance thereafter
35
20121015-4003 FERC PDF (Unofficial) 10152012
Docket No AD12-8-000
Burden Estimate The estimated public reporting burdens for the reporting
requirements have been adjusted as described above
FERC-922 Requirements
Number of Respondents
Annually (1)
Number of
Responses per Respondent
(2)
Average Burden Hours per Response
(3)
Total Annual Burden Hours
(1)x(2)x(3) Metrics Data Collection
140 1540
Write Performance Analysis
85 935
Management Review
11 1
20 220
Total 245 2695
Cost to Comply The Chairman has projected the cost of compliance to be $184460 Technical Expertise = $168300 (1540 hours data collection + 935 hours report completion $68 per hour) Management Review = $17160 (220 hours report review $78 per hour) Cost per hour figures are calculated using BLS data79 The technical expertise category factors in the median wage for an engineer analyst attorney and economist The management category factors in the median wage for general and operations managers Based on BLS data80 both cost figures have been adjusted to include benefits (benefits represent 295 percent of the total hourly figure)
Title FERC-922 Non-RTOISO Performance Metrics
Action Proposed Collection
OMB Control No TBD
79 See httpblsgovoescurrentnaics3_221000htm
80 See httpwwwblsgovnewsreleaseececnr0htm
36
20121015-4003 FERC PDF (Unofficial) 10152012
Docket No AD12-8-000
Internal Review The Chairman has reviewed the proposed metrics and has determined that the metrics and data gathered thereunder are necessary These requirements conform to the Commissionrsquos need for efficient information collection communication and management within the energy industry The Chairman is assured by means of internal review that there is specific objective support for the burden estimates associated with the information collection requirements
Interested persons may obtain information on the reporting requirements by contacting the following Federal Energy Regulatory Commission 888 First Street NE Washington DC 20426 [Attention Ellen Brown Office of the Executive Director] e-mail DataClearancefercgov Phone (202) 502-8663 fax (202) 273-0873 Any further comments on the collections of information and the associated burden estimates in this proceeding should be sent to the Commission in this docket and may also be sent to the Office of Information and Regulatory Affairs Office of Management and Budget Washington DC 20503 [Attention Desk Officer for the Federal Energy Regulatory Commission] For security reasons comments to OMB should be submitted by e-mail to oira_submissionombeopgov Comments submitted to OMB should include Docket Number AD12-8-000 and FERC-922
37
20121015-4003 FERC PDF (Unofficial) 10152012
Docket No AD12-8-000
38
IV Appendix
20121015-4003 FERC PDF (Unofficial) 10152012
Docket No AD12-8-000 39
Performance Metric Specific Metric(s) Reliability A National or Regional
Reliability Standards Compliance
1 References to which Electricity Reliability Organization (ERO) and Regional Reliability Organization (RRO) standards are applicable 2 Number of violations self-reported and made public by NERCFERC 3 Number of violations identified and made public as RRO or ERO audit findings 4 Total number of violations made public by NERCFERC 5 Severity level of each violation made public by NERCFERC 6 Compliance with operating reserve standards 7 Unserved energy (or load shedding) caused by violations Additional detail will be provided on (1) number of events (2) duration of the events (3) whether the events occurred during onoff-peak hours (4) additional information on equipment types affected and kV of lines affected and (5) number of events (and severity and duration of events) resulting in load shedding based on the utilization of TPL-002 Footnote b criteria Items 2-7 Track the ISORTO definition ldquoThis metric is a quantification of all NERC and RRO Reliability Standards violations that have been identified during an audit or as a result of an ISORTO self-report and have been published as part of that processrdquo Non ndashISORTO utilities should limit reporting to the same eight functional areas used by the ISORTOs 1 Balancing Authority 7 Transmission Planner 2 Interchange Authority 8 Transmission Service Provider 3 Planning Authority 4 Reliability Coordinator 5 Resource Planner 6 Transmission Operator
20121015-4003 FERC PDF (Unofficial) 10152012
Docket No AD12-8-000 40
B Dispatch Reliability 1 Balance Authority Ace Limit (BAAL) OR CPS1 and CPS2
2 Number of hours of transmission load reliefs (of severity level 3 or higher) called by the incumbent transmission provider or unscheduled flows
WECC entities will report events under the WECC Unscheduled Flow Mitigation Procedure (equivalent to the NERC TLR Level three)
3 Energy Management System (EMS) availability C Operational Planning ndash
Load Forecast Accuracy Actual peak load as a percentage variance from forecasted peak load as reported in OASIS
D Wind Forecasting Accuracy
Actual wind availability compared to forecasted wind availability
E Unscheduled Flows Difference between net actual interchange (actual measured power flow in real time) and the net scheduled interchange in megawatt hours Reported in Form 714
F Transmission Outage Coordination
1 Percentage of ge 200 kV planned outages of 5 days or more for which utility notified customers at least 1 month prior to the outage commencement date 2 Percentage of ge 200kV outages cancelled by utility after having been previously approved 3 Report information posted on OASIS (percentage of outages planned and unplanned with less than 2 days notice)
20121015-4003 FERC PDF (Unofficial) 10152012
Docket No AD12-8-000 41
G Long-Term Reliability Planning ndash Transmission
Dollar amount and number of facilities approved to be constructed for reliability purposes
2 Percentage of approved construction on schedule and completed
3 Performance of planning process related to
a Requests for and number of completed reliability studies
b Requests and number of completed economic studies
Discussion of stakeholder process and identification of stakeholder groups participating
H Long-Term Reliability
Planning ndash Resources 1 Processing time for generation interconnection requests 2 Actual reserve margins compared with planned reserve margins 3 Explanation of the nature and characteristics of demand response programs and how they are used in system planning Discussion of programs to facilitate the integration of renewable resources and to mitigate any issues and uncertainty associated with scheduling renewable resources
20121015-4003 FERC PDF (Unofficial) 10152012
Docket No AD12-8-000 42
I Infrastructure Investment ndash Interconnection and Transmission Process Metrics
1 Number of requests
2 Number of studies completed
3 Average age of incomplete studies
4 Average time for completed studies
5 Total cost and types of studies completed (eg feasibility study system impact study and facility study)
6 Number of transmission access denialstransmission service requests (TSRs) denied
J Special Protection
Systems 1 Number of special protection systems
2 Percentage of special protection systems that responded as designed when activated
Applicable pool of special protection systems should be based on how the reporting entityrsquos Regional Entity defines ldquospecial protection systemsrdquo
3 Number of unintended activations
20121015-4003 FERC PDF (Unofficial) 10152012
Docket No AD12-8-000 43
System Operations Measures A Demand Response Comprehensive explanation of the nature of utility demand response programs
implemented for load management as well as in compliance with state requirements B System Lambda System Lambda (on marginal unit)
Proposed System Lambda metric would not apply to utilities where the
marginal price is typically set by hydro units System lambda data will be based on Form 714 information
C Congestion Management Congestion analysis per Order No 890 D Resource Availability 1 - System forced outage rate as measured over 12 months E Transmission System
Availability Interrupted load megawatt hours as a percentage of load served
F Fuel Diversity Fuel diversity in terms of energy installed capacity and actual production G Clean Energy 1 Clean Energy megawatt hours by resource type as a percentage of total energy
2 Clean Energy megawatts by resource type as a percentage of total capacity Organizational Effectiveness Not applicable to non-RTO
entities
20121015-4003 FERC PDF (Unofficial) 10152012
Document Content(s)
Staff Report Non-RTO Metrics Final1015 2PDF1-43
20121015-4003 FERC PDF (Unofficial) 10152012
- Staff Report Non-RTO Metrics Final1015 2PDF
- Document Content(s)
-
Docket No AD12-8-000
Responding to NIPPC the reliability standards metrics are limited to providing information on reliability violations Actions taken by transmission providers to curtail the dispatch of generators or adjust transmission schedules (or e-tags) are relevant to the dispatch reliability metrics discussed below As discussed in that section Commission Staff is recommending that participating utilities include narratives on all actions they take to manage dispatch reliability Commission Staff is not recommending that this information be incorporated into metrics because not all participating utilities take these actions and there are no standardized measures for these activities With respect to NIPPCrsquos request that a metric be developed to measure transmission schedule adjustments or e-tag revisions we note that these actions are the result of transmission loading reliefs (TLR) or Unscheduled Flow Relief events that are being reported in the Dispatch Reliability measure below and are already covered by the metrics For this reason Commission Staff does not recommend adding this metric
b Dispatch Reliability i Performance Metrics Dispatch reliability is measured by three metrics The proposed metrics listed in the notice retained two of the metrics used to measure dispatch reliability in ISOs and RTOs (1) Balancing Authority Area Control Error Limit or Control Performance Standard 1 and Control Performance Standard 2 and (2) Energy Management System Availability The proposed metric relating to TLR or Unscheduled Flow Relief Events would measure the number of events ndash rather than the hours as is reported in the performance metrics for ISOs and RTOs ndash of TLRs (of severity level 3 or higher) or unscheduled flows called by the incumbent transmission provider Utilities that are part of the Western Electricity Coordinating Council (WECC) will report events under the WECC Unscheduled Flow Mitigation Procedure that are equivalent to the NERC TLR Level 3 ii Comments
EPSA contends that in order to properly identify problem areas the Commission should require each transmission provider to identify the length and magnitude of each TLR event EPSA states that at a minimum each transmission owner should provide the following information (1) how long each constrained element is subject to a continuous Level 3 or higher TLR in hours (2) the number of MW of network transmission service curtailed for each continuous TLR event and for all continuous TLR events in total (3) the number of MW of firm point-to-point transmission service curtailed for each continuous TLR event and in aggregate and (4) the number of MW of non-firm transmission service curtailed per continuous TLR event and in aggregate50 EPSA
50 EPSA Comments at 3-4
18
20121015-4003 FERC PDF (Unofficial) 10152012
Docket No AD12-8-000
further states that monitoring and tracking TLR events on a system that are categorized at level 1 or 2 can provide additional insights into system dynamics as those events can be prevented by nodal market designs that dispatch around binding constraints using congestion prices Additionally EPSA states that all TLR events at level 5 or higher should be tracked and reported separately from all other TLR events as TLR events at this level indicate a severely constrained system EPSA recommends that the metrics include a metric for reporting all congestion management events ndash not only those categorized as a TLR ndash because some areas rely on a variety of other congestion management techniques EPSA further recommends including an evaluation of the number and severity level of all congestion management events of a utility or transmission system with the changes discussed above51 iii Response
Commission Staff agrees with EPSA that the metric concerning TLR should measure the duration of such events Accordingly Commission Staff recommends that the TLR metric be revised to measure the hours of TLR called by the incumbent transmission provider Commission Staff notes that this revision will result in a metric that is consistent with the metrics for ISO and RTO markets
Commission Staff does not consider information on severity level 1 and 2 events
to be measures of utility reliability performance Such events by definition only impact local area operations and as a result will not impact system reliability For this reason TLR events of level 3 and above are systemic events and are the appropriate basis for a performance metric for system reliability For TLR events of severity level 3 and above Commission Staff agrees with EPSA that the TLRUnscheduled Flow Relief metric should be supplemented with information on TLR (or Unscheduled Flow Relief) events for each severity level energy curtailment data on the number of MW curtailed and duration of curtailment information Such information along with a discussion by the participating utility of the impact of curtailments on customers and the various resource types will allow for a better informed evaluation of performance52 For this reason we
51Id at 5
52 We note that in Order No 890 the Commission concluded that requiring transmission providers to post additional information on curtailments was necessary to provide transparency and enable customers to assess whether they have been treated without undue discrimination See Preventing Undue Discrimination and Preference in Transmission Service Order No 890 FERC Stats amp Regs para 31241 at P 1626 order on rehrsquog Order No 890-A FERC Stats amp Regs para 31261 (2007) order on rehrsquog Order No 890-B 123 FERC para 61299 (2008) order on rehrsquog Order No 890-C 126 FERC para 61228 (2009) order on clarification Order No 890-D 129 FERC para 61126 (2009) For
19
20121015-4003 FERC PDF (Unofficial) 10152012
Docket No AD12-8-000
recommend that this information be included in the narrative discussions that accompany the (TLRUnscheduled Flow Relief) metric to the extent the information is available
With respect to EPSArsquos request for metrics on all congestion management activities such as Local Area Protocols Commission Staff recommends that participating utilities provide narratives on the use of Local Area Protocols out-of-merit dispatches and other techniques to resolve system dispatch reliability problems Such information will provide a context for the role played by TLRs or Unscheduled Flow Reliefs thereby providing the basis for a more comprehensive assessment of constraint management by the participating utility Since not all participating utilities use these techniques and the definitions of these techniques may differ among utilities Commission Staff does not consider this information to be appropriate for standardized metrics c Load Forecasting Accuracy
Actual peak load as a percentage variance from forecasted peak load as reported in a transmission providerrsquos OASIS measures the effectiveness of the load forecasting function of utilities in non-ISORTO regions Since load forecasting provides the basis for resource commitment this metric impacts the incurrence of resource costs The more accurate a utility is in forecasting load the greater the likelihood that it can commit sufficient resources in a cost effective manner that avoids over-commitment of resources inefficient commitment of short lead-time resources or under-utilization of available resources This metric measures the percentage difference between actual peak load and forecasted peak load No comments were submitted on this metric d Wind Forecasting Accuracy i Performance Metric This metric measures the percentage accuracy of actual wind availability compared to forecasted wind availability Improving the accuracy of the wind forecast will facilitate the timely commitment and dispatch of sufficient supplemental resources ii Comments NIPPC maintains that the Commission should clarify whether this metric applies to the wind generation assets controlled by the merchant function of the transmission provider or to the independently owned and operated wind generation interconnection to
TLR events of severity level 3 and above Commission Staff recommends including a narrative explanation of why transactions could not be continued or completed similar to what is required by Order No 890 Id P 1627
20
20121015-4003 FERC PDF (Unofficial) 10152012
Docket No AD12-8-000
the transmission providerrsquos system NIPPC argues that the metric should not extend to generators not owned or controlled by the merchant function of the transmission provider in light of the market-sensitive nature of a generatorrsquos wind forecasting accuracy and scheduling practices53 NIPPC also urges the Commission to consider expanding this metric to require a transmission provider to report whether it has implemented a centralized wind forecast system for use in its operations and if so to collect additional metrics on the accuracy of that centralized forecast54 NIPPC contends that a single metric comparing actual wind output to forecast output over the reporting period is not a useful metric as inaccuracies in the forecast may cancel out over a long reporting period NIPPC argues that a more relevant measure of accuracy would be the number of hours during the reporting period that the forecast is accurate (where the forecast is within five percent of actual output) NIPPC also suggests that the following additional metrics would be useful (1) the MW of windsolar capacity subject to the forecast (2) granularity of the forecast (monthly weekly daily hourly sub-hourly) (3) whether the forecast is integrated into the transmission providerrsquos operations (4) whether the transmission provider shares the forecast with market participants (or generation owners) and (5) an equivalent metric for forecasts associated with solar energy and hydroelectric energy55 iii Response The wind accuracy metric was intended to apply to all wind resources ndash owned and non-owned ndash on the transmission providersrsquo systems Commission Staff does not recommend excluding wind generators not owned or controlled by transmission providers from the wind accuracy metric To be an effective tool to ensure system reliability this metric must measure the accuracy of forecasts that account for all wind resources in a utilityrsquos footprint This requirement is increasingly important as wind resources become a more significant portion of total resource output When wind generators ndash including those not owned or controlled by the utility ndash provide wind availability forecasts they are performing a reliability function that has implications for system reliability management and planning Accordingly Commission Staff considers this information to be an important element in an assessment of a utilityrsquos reliability performance We encourage participating utilities to work with wind generators not owned or controlled by the utility to ensure that the data gathered and reported protects market-sensitive information from
53 NIPPC Comments at 5
54 Id
55 Id at 5-6
21
20121015-4003 FERC PDF (Unofficial) 10152012
Docket No AD12-8-000
being reported in public reports or released to utility subsidiaries that compete with these wind generators Commission Staff agrees with NIPPC that to the extent that centralized forecasting can minimize integration costs this information is an indication of utility performance Therefore Commission Staff recommends that participating utilities discuss their forecasting process in their reports With respect to NIPPCrsquos concern that inaccuracies in the forecast may cancel out Commission Staff notes that the wind accuracy forecast will be based on the mean absolute error of the forecast compared to actual wind availability Therefore all errors ndash positive and negative ndash will be measured and will not cancel out Since the proposed metric will measure the magnitude of forecast inaccuracies Commission Staff considers the proposed metric to be superior to the alternative proposed by NIPPC that only indicates the number of hours in which a forecast is outside a five percent threshold Further responding to NIPPC Commission Staff notes that forecast accuracy will be based on a comparison of the day-ahead forecast to actual availability Commission Staff also notes that the capacity of wind and solar subject to the forecast which NIPPC requests be an additional performance metric is included in the Clean Energy metric discussed below Commission Staff is not recommending the inclusion of a metric measuring the accuracy of forecasts for other variable energy resources because many utilities do not perform these forecasts or they are not performed according to a standardized process Nevertheless Commission Staff considers it appropriate that participating utilities provide narrative descriptions of their solar and hydro forecasts to the extent these resources are significant sources of energy to allow for a more complete assessment of forecasting performance e Unscheduled Flows Metric Unscheduled flows are defined as the difference between net actual interchange (actual power flow measured in real time) and net scheduled interchange The two components of unscheduled flows are inadvertent energy defined to be the difference between actual and scheduled interchange for all interties and parallel flow (or loop flow) defined to be the actual power flow on a contract path within an interconnection from one Balancing Authority Area to a second Balancing Authority Area through ldquoparallelrdquo transmission lines through a third Balancing Authority Area Parallel flows are a function of the interconnectionrsquos operating configuration line resistance and physics Unscheduled flows provide information relevant to operation planning because curtailments may occur when unscheduled flows exceed system operating limits This metric is measured by the difference between net actual interchange (actual measured power flow in real time) and the net scheduled interchange in MWh as reported in a
22
20121015-4003 FERC PDF (Unofficial) 10152012
Docket No AD12-8-000
utilityrsquos FERC Form No 714 ldquoAnnual Electric Balancing Authority Area and Planning Area Reportrdquo No comments were received on this metric f Transmission Outage Coordination i Performance Metric
The transmission outage coordination metric measures the percentage of outages planned and unplanned that occur with less than two days notice Effective transmission outage coordination will result in early notification of outages and therefore will be indicated in the metrics as a low percentage of short notice outages56 Effective transmission outage coordination by utilities in non-ISORTO regions ensures that outages do not threaten system reliability and that additional and potentially more expensive resources do not need to be committed
ii Comments ESPA recommends that the performance metrics track a utilityrsquos transmission outage performance EPSA states that the information posted on OASIS is valuable information and requests that the Commission include information regarding any transmission outages known ahead of time including the time and date of the planned outage and the planned duration of the outage57 EPSA maintains that providing this information would allow market participants to evaluate the information concerning the proposed outage and make other arrangements if necessary or otherwise take proactive steps to reduce the impact of any such planned outage EPSA states that outage performance information would also give the Commission and other observers the opportunity to evaluate how well the utility or transmission owner can schedule outages and execute that schedule58
iii Response
Commission Staff agrees with EPSA that the transmission outage metrics should include information to measure the utilitiesrsquo ability to plan for outages and successfully execute their outage plan As stated in the Commission Staff Report on ISORTO Performance Metrics effective transmission outage coordination is defined as early
56 The proposed metrics will measure outages for major transmission facilities
which are defined for purposes of the metrics as 200kV and higher
57 EPSA Comments at 7-8
58 Id at 8
23
20121015-4003 FERC PDF (Unofficial) 10152012
Docket No AD12-8-000
notification of planned outages of five days or longer ndash ie notification at least one month prior to the outage commencement date ndash and timely review of outage impacts59 Also effective transmission outage coordination is measured by the percentage of planned outages that are canceled due to conflicting planned outages as well as forced (unscheduled) outages that could cause reliability issues and additional congestion costs Commission Staff recommends adding these metrics for outages on major transmission lines of 200kV and higher to be consistent with the metrics for ISOs and RTOs60 g Long-Term Reliability Planning ndash Transmission i Performance Metric The proposed metric tracks the dollar amount of transmission facilities approved to be constructed for reliability purposes the percentage of approved construction completed the number of requests for and completed reliability studies and a narrative detailing a utilityrsquos economic study process This information measures the ability of each utilityrsquos expansion planning process to identify reliability and economic needs in advance which is essential to ensuring that market participants have sufficient time to develop either transmission or resource solutions to system reliability and economic requirements The metric also includes a narrative discussion of the transmission planning stakeholder process ii Comments Multiple TDUs state that a metric related to planning and completion of economic transmission is needed for multiple reasons First vertically-integrated transmission
59 Staff Report at 25
60 See Staff Report at Appendix B Peformance Metric F1 (Oct 21 2010) (Percentage of gt 200kV planned outages of 5 days or more that are submitted to ISORTO at least 1 month prior to the outage commencement date) We note that in Revisions to Electric Reliability Organization Definition of Bulk Electric System and Rules of Procedure Notice of Proposed Rulemaking 77 Fed Reg 39846 139 FERC para 61247 (2012) the Commission proposed to approve a modification to the currently-effective definition of ldquobulk electricrdquo systemrdquo that would establish a bright-line threshold that includes all facilities at or above 100 kV Commission Staff still considers it reasonable to require a 200 kV minimum for reporting information related to outages for performance metrics purposes particularly since this 200 kV minimum is consistent with the threshold ISOsRTOs used in their prior metric reports Nevertheless Commission Staff will monitor responses under this metric and continue to evaluate whether this is the appropriate threshold
24
20121015-4003 FERC PDF (Unofficial) 10152012
Docket No AD12-8-000
providers have inherent incentives to discriminate and underperform when performing this function Multiple TDUs state that the Commission has recognized as much and that such a metric would help measure the efficacy of the remedies that the Commission adopted in Order No 890 to address this concern61 Second the economic costs of transmission constraints are not transparent in areas without centralized markets like those found in ISOs and RTOs with congestion pricing Third more specificity is needed because a vertically-integrated transmission owner reporting on transmission construction and identifying shortfalls would be identifying its own unsuccessful outcomes62 Multiple TDUs argue that merely requiring vertically-integrated transmission providers to provide a narrative detailing their economic studies process as is proposed will elicit little more than a repetition of the planning process descriptions that were filed in compliance with Order No 890 For these reasons Multiple TDUs argue that the transmission planning and construction metric should be expanded to include the dollar amount of facilities constructed for purposes whose predominant purpose was not reliability broken down between (a) economic (b) public policy (c) facilities to support the planned generation resources of the transmission provider or its affiliates (d) transmission or interconnection requests made by the transmission provider or its affiliates and (e) in response to requests from others Multiple TDUs state that the metrics should also include the number of transmission construction projects that were added to the transmission provider construction plans between the issuance of Order No 890 and the submission of the report broken down into categories (a) through (e) and into their current status (ie completed incomplete and on schedule incomplete and behind schedule and removed from plan) EEI argues that the Multiple TDUsrsquo request is unwarranted EEI maintains that due to the low incidence of economic study requests requiring such additional reporting will create an added and unnecessary burden to reporting utilities63 Multiple TDUs also state that the metric should include a narrative assessment supported by quantitative information of the transmission providerrsquos planning process efficacy64 Similarly EPSA argues that the performance metrics should include a metric
61 Multiple TDUs Comments at 6 (citing Order No 890 FERC Stats amp Regs para
31241) 62 Id at 6-7
63 EEI Reply Comments at 4
64 Multiple TDUs Comments at 7-8
25
20121015-4003 FERC PDF (Unofficial) 10152012
Docket No AD12-8-000
detailing how well a utility executes its transmission development plans EPSA explains that a utilityrsquos failure to follow its transmission plan can adversely impact customers and merchant generators Thus EPSA maintains that a metric assessing how well a utility executes its transmission plan would provide valuable information including a demonstration of how prepared a utility is to meet any future reliability needs on its system65 iii Response
Commission Staff does not recommend adding the metrics proposed by Multiple TDUs on non-reliability transmission and interconnection projects The purpose of this metric is to assess the extent to which transmission solutions are analyzed planned and deployed to meet reliability requirements Thus additional information to examine discrimination by utilities or to obtain information on all project spending including projects to meet public policy objectives would go beyond the scope of the metric The congestion issues of concern to Multiple TDUs including the impact of transmission planning on congestion are discussed further below in the Congestion Management metric
Commission Staff agrees with commenters that additional information is needed
however in the transmission planning metrics to provide a more comprehensive assessment of transmission planning performance and to allow for comparisons between ISOs and RTOs and participating utilities in regions outside of ISOs and RTOs Accordingly Commission Staff recommends additional information be included in the metrics as follows (1) the proposed dollar amount of facilities approved to be constructed for reliability purposes should be revised to also include the number of facilities so that this metric is comparable to the relevant ISORTO performance metric (2) the proposed percentage of approved construction completed metric should be revised to the percentage of approved construction on schedule and completed and (3) the proposed narrative detailing the economic studies process should be revised to a metric that measures the percentage completion of economic projects
Responding to EEI Commission Staff does not find that it would be unduly
burdensome to incorporate both the number of economic study requests and the number of economic studies accomplished into a narrative explanation of the status of planning for economic expansions Economic projects can reduce congestion which in turn can reduce costs to customers and decrease the likelihood that reliability issues will occur Therefore this information provides an important indicator on the progress made by utilities in improving the efficiency of their transmission systems
65 EPSA Comments at 7
26
20121015-4003 FERC PDF (Unofficial) 10152012
Docket No AD12-8-000
Commission Staff agrees with EPSA that the reports provided by participating utilities should also include a discussion of the status of their transmission plans Such information will allow participating utilities to explain their progress in meeting planning goals and explain the issues that may be delaying the completion of reliability and economic projects Commission Staff expects that this discussion will also address the desire of Multiple TDUs to have a narrative assessment of the efficacy of the transmission providerrsquos planning process66 and to address how utilities provide an opportunity to consider transmission needs driven by Public Policy Requirements in their planning process67
h Long-Term Reliability Transmission Planning ndash Resources
Three metrics are employed to measure the effectiveness of long-term reliability planning for resources The first metric processing time for generation interconnection requests measures the effectiveness of processes in achieving timely interconnection of new resources that are needed to ensure reliability The second metric the planned reserve margin is the planned number of MW of resources available as system reserves divided by the number of MW of peak load The third metric is a narrative discussion of demand response programs and how they are used in system planning No comments were received on this metric Commission Staff recommends that the proposed planned reserve margin metric be revised to compare the actual reserve margin to the planned reserve margin This comparison will allow for an evaluation of utility performance in achieving the planned reserve margin
i Infrastructure Investment ndash Interconnection and Transmission Process Metrics
i Performance Metric
These metrics track the progress that utilities have made in regions outside of ISOs and RTOs in completing their reliability reviews ndash namely feasibility system impact and
66 We note that this narrative assessment is in keeping with the Commissionrsquos
requirement that public utility transmission providers make available information regarding the status of transmission upgrades identified in their transmission plans See Transmission Planning and Cost Allocation by Transmission Owning and Operating Public Utilities Order No 1000 FERC Stats amp Regs para 31323 at P 159 amp n154 (2011)) order on rehrsquog Order No 1000-A 139 FERC para 61132 (2012)
67 Order No 1000 FERC Stats amp Regs para 31323 at P 203
27
20121015-4003 FERC PDF (Unofficial) 10152012
Docket No AD12-8-000
facility studies ndash of interconnection and transmission service requests in a timely and efficient manner The metrics track the number of requests the time required to complete the reliability reviews and the costs of completing each of the three types of studies There is also a metric that measures the number of transmission access denials and transmission service request denials The purpose of this metric is to provide information on the magnitude and reasons for transmission service denials and whether additional infrastructure investment is needed to avoid transmission service denials ii Comments Multiple TDUs state that the Commission should collect additional information on the completion of transmission studies Multiple TDUs state that while the metrics for ISOs and RTOs require the reporting of information on studies such measures are omitted from the draft metrics for regions outside of ISOs and RTOs without explanation Multiple TDUs argue that such metrics are even more important than in the ISO and RTO context and that it would be worth obtaining from vertically-integrated transmission providers all of the study completion metrics that ISOs and RTOs are required to produce Multiple TDUs explain that the cost of collecting and providing this information should not be inordinate and that transmission providers should already have expense tracking mechanisms in place to estimate and bill study costs Multiple TDUs state that the following additional metrics would be worth collecting from vertically-integrated transmission providers (1) percentages of long-term transmission service requests and interconnection requests that triggered study requirements (2) percentages of the studies undertaken that led to the identification of upgrade costs (3) the average estimated upgrade cost (4) the percent of transmission service requests withdrawn and the percent approved and (5) the average processing time through each process milestone identified in the transmission providerrsquos Order No 890 compliance tariff provisions such as completion of a feasibility study system impact study and facilities study Multiple TDUs claims that such information would help the Commission identify situations in which impediments to obtaining transmission or interconnection service warrant further investigation68 Multiple TDUs state that the addition of a metric concerning the number of transmission access denials or transmission service requests denied is less meaningful than it first appears Multiple TDUs explain that under the pro forma Open Access Transmission Tariff long-term transmission service requests cannot be legitimately denied instead if there is no existing transmission capability available to accommodate the request the requester is supposed to be informed that meeting the request would require additional facilities and offered the opportunity to fund studies to determine what
68 Multiple TDUs Comments at 5
28
20121015-4003 FERC PDF (Unofficial) 10152012
Docket No AD12-8-000
upgrades are needed Multiple TDUs state that a metric tracking how often entities requesting service withdraw their request for service in the face of these requirements would be worthwhile but that the proposed metric might not elicit such information69 Accordingly Multiple TDUs suggest revising the metric to require entities to report the number of long-term transmission service requests for which ATC was initially found to be unavailable and the disposition of each request with each of these points broken down between requests made by third-party transmission customers and requests made by affiliates or divisions of the transmission provider70
NIPPC contends that the Commission should require transmission operators to
report information concerning the pace of large generator interconnections including the total number of pending interconnection requests the number of pending requests in each phase of the LGIA process and the number of requests in each phase that have experienced delays in completing that phase of the interconnection process along with a narrative describing the causes of those delays71 iii Response Commission Staff agrees with Multiple TDUs that the proposed metrics should include information on how long it takes participating utilities to complete interconnection and transmission studies as a measure of the efficiency of the utilityrsquos infrastructure development process Accordingly Commission Staff recommends that the performance metrics be revised to include metrics concerning the average age of incomplete studies and the average time to complete studies Commission Staff considers the time to complete all studies to be an appropriate metric to measure the efficiency of utility interconnection and transmission study processes It is expected that the narrative discussions that accompany the metrics will address issues with the various study stages and that the discussions will address the issues of concern to Multiple TDUs Commission Staff does not consider that information on the percentage of requests that trigger studies or are withdrawn will reflect utility performance The percentage of requests that trigger studies is a function of available transmission capacity not utility performance The percentage of requests withdrawn is caused by the actions of market participants ndash not utilities ndash and therefore does not measure utility performance Therefore we are not recommending the addition of this information to the metrics reports
69 Id at 8
70 Id
71 NIPPC Comments at 4-5
29
20121015-4003 FERC PDF (Unofficial) 10152012
Docket No AD12-8-000
With regard to Multiple TDUsrsquo interest in additional metrics on transmission service denials Commission Staff expects that the narrative discussions provided by participating utilities will address issues of concern to the Multiple TDUs such as the disposition of requests for service Commission Staff notes however that this metric is not intended to measure ATC or transmission capacity in general Rather the purpose of tracking transmission service denials is to provide an additional measure of the efficiency of utilities in processing requests for transmission service and therefore is intended to be evaluated in the context of the other infrastructure investment processing metrics This information combined with explanations provided by the utilities in their narrative discussion will provide the basis for a comprehensive assessment of how utilities are managing their infrastructure development process Commission Staff does not recommend adding a metric concerning the number of pending generation interconnection requests as requested by NIPPC By measuring the time it takes utilities to complete their studies for interconnection and transmission service the proposed metric appropriately focuses on the efficiency of a utilityrsquos processing of service requests ndash irrespective of the total number of requests Also since many interconnection requests in a utilityrsquos interconnection queue may not be ready to proceed because of commercial issues and other factors beyond the control of utilities the number of pending interconnection requests is not an appropriate measure of utility performance As has been the case in the ISORTO performance metrics reports Commission Staff expects that the narrative discussion that accompanies the utility metrics on interconnections and transmission service will explain the status of their request queues and reasons for delays j Special Protection Systems Special Protection Systems72 are automatic protection systems designed to detect abnormal or predetermined system conditions and take corrective actions such as changing demand generation or system configurations in order to maintain system stability acceptable voltage levels or maintain power flows These metrics measure the performance of such Special Protection Systems based on the definition of Special Protection Systems utilized by the reporting entityrsquos Regional Entity These metrics measure both the frequency with which the region relies on these systems and their effectiveness as measured by successful activations and the number of unintended activations No comments were submitted on this metric
72 Special Protection Systems are also referred to as Special Protection Schemes
Remedial Action Schemes (RAS) or System Integrity Protection Schemes (SIPS)
30
20121015-4003 FERC PDF (Unofficial) 10152012
Docket No AD12-8-000
k Demand Response Entities responding to this metric will be required to provide a comprehensive explanation of the nature of utility demand response programs implemented for load management as well as in compliance with state requirements There were no comments on this metric l System Lambda System lambda is the incremental cost of energy of the marginal unit assuming no system constraints This metric tracks the trend in marginal fuel costs and is an important metric since fuel costs represent the largest component of wholesale energy costs The system lambda metric would not apply to utilities where the marginal price is typically set by hydro units Also system lambda data will be based on information contained in FERC Form No 714 There were no comments on this metric m Congestion Management i Performance Metric Congestion represents the cost to customers of paying for more expensive energy because physical transmission line limits do not allow full delivery of least-cost energy Entities responding to this metric would be required to provide a congestion analysis consistent with Order No 890 In Order No 890 the Commission adopted a planning principle requiring transmission providers to prepare studies identifying ldquosignificant and recurringrdquo congestion and post such studies on their OASIS The Commission explained that the studies should analyze and report on the following items (1) the location and magnitude of the congestion (2) possible remedies for the elimination of the congestion in whole or in part (3) the associated costs of congestion and (4) the cost associated with relieving congestion through system enhancements (or other means)73 ii Comments Multiple TDUs argue that merely requiring vertically-integrated transmission providers to provide a narrative detailing their economic study processes as is proposed will elicit little more than a repetition of the planning process descriptions that were filed in compliance with Order No 890
73 Order No 890 FERC Stats amp Regs para 31241 at PP 529 542
31
20121015-4003 FERC PDF (Unofficial) 10152012
Docket No AD12-8-000
iii Response Commission Staff recommends that utilities discuss the status of their transmission plans as explained in the Long-Term Transmission Planning Metrics discussed above Commission Staff expects that these discussions will address expansion plans to resolve congestion issues on their systems Therefore Commission Staff expects that the performance reports submitted by utilities will provide substantive information on congestion management n Resource Availability i Performance Metric
The proposed metric measures the percentage of time that system resources are not available because of unplanned outages as measured by the system forced outage rate No comments were submitted on the metric
ii Response Commission Staff recommends that this metric be revised to be 1 minus the
system forced outage rate Revising the metric as recommended will measure unforced capacity availability and therefore resource availability This revision will also make this metric comparable to the performance metric adopted for ISOs and RTOs Resource availability is an indication of system efficiency and cost management by utilities in regions outside of ISOs and RTOs Higher resource availability can result in the commitment of fewer peak resources (or the importation of peak supplies) that potentially have high costs thereby resulting in reduced costs o Transmission System Availability This metric measures interrupted load MWh as a percentage of load served In light of the many factors that can result in load interruptions some of which are beyond the control of utilities the narrative detailing the reasons for load interruptions will be essential in assessing performance No comments were submitted on this metric p Fuel Diversity
This metric is defined to be the percentage mix of fuel types installed and available (capacity fuel diversity) and produced (generation fuel diversity) Fuel diversity provides an indication of a utilityrsquos capability to integrate fuels with different characteristics such as lower costs or lower environmental impacts No comments were submitted on this metric
32
20121015-4003 FERC PDF (Unofficial) 10152012
Docket No AD12-8-000
q Clean Energy i Performance Metric
These metrics measure the use of ldquoclean energyrdquo74 The metrics track number of MWh of clean energy by resource type as a percentage of total energy and the number of MW of clean energy by resource type as a percentage of total capacity
ii Comments NIPPC states that the Commission should expand the clean energy metric to include information related to curtailments of clean energy resources as frequent curtailments of these resources by a transmission operator may reflect a dysfunction in the generation market since these resources have no fuel costs NIPPC explains that the metric should include the number of curtailments the duration of each curtailment the number of MW hours curtailed and the justification for the curtailment75 iii Response Commission Staff does not consider curtailments of clean energy to be a measure of the diversity of a utilityrsquos resource mix Rather curtailments of resources ndash or more accurately schedule adjustments or manual redispatch instructions by transmission providers ndash are used to maintain system reliability We note that the diversity metrics in conjunction with the narratives regarding actions taken to manage dispatch reliability and TLR (see pages 18-19 infra) will provide a basis for a comprehensive view of the issue of clean energy
D Burden Estimate
1 Information Collection Statement In its solicitation for comments Commission Staff estimated the public reporting
burden for participating utilities to be approximately 140 hours per respondent for each report
74 Clean Energy is defined to include nuclear energy and variable energy
resources including solar wind hydro geothermal and biomass resources
75 NIPPC Comments at 6
33
20121015-4003 FERC PDF (Unofficial) 10152012
Docket No AD12-8-000
2 Comment EEI asserts that the response time could be as high as 300-400 hours
3 Response
Commission Staff will adjust the burden estimate based on EEIrsquos high estimate of 300-400 hours Commission Staff considers EEIrsquos estimate to be reflective of the most time that it would take an entity to respond to the metrics While Commission Staff recognizes that this report requires additional metrics and narrative discussions Commission Staff nevertheless continues to conclude that 140 hours still represents a reasonable estimate of the burden since much of the data required should be readily available to the responding utilities However in recognition of the fact that the burden will vary from entity to entity we will revise our estimate to 245 hours per respondent which is the mid-point between these estimates
E Information Collection Statement Information Collection Statement
The following collection of information contained in these metrics is subject to
review by the Office of Management and Budget (OMB) under section 3507 of the Paperwork Reduction Act of 199576 OMBrsquos regulations require approval of certain information collection requirements imposed by agency actions77 The Commission cannot conduct this information collection unless it displays a valid OMB control number78
The collection of information requires those public utilities outside of ISOs and RTOs that choose to participate to provide information responding to the attached metrics on a periodic basis This includes the submission of price data and information relating to reliability transmission planning requests for service and system capacity The
76 44 USC sect 3507 (2006) The Paperwork Reduction Act requires OMB
approval of certain information collection activities when these activities apply to 10 or more persons Because it is estimated that 11 entities will respond to this collection the Chairman is requesting approval from OMB
77 5 CFR sect 1320 (2012)
78 The Commission is issuing a separate notice regarding the collection of information that will be published in the Federal Register to comply with the OMB requirements at 5 CFR sect 13205(a)(iv)
34
20121015-4003 FERC PDF (Unofficial) 10152012
Docket No AD12-8-000
information submitted by participating utilities would be used to help develop a common set of metrics for both ISORTO markets and non-RTOISO markets and for evaluating market performance thereafter
35
20121015-4003 FERC PDF (Unofficial) 10152012
Docket No AD12-8-000
Burden Estimate The estimated public reporting burdens for the reporting
requirements have been adjusted as described above
FERC-922 Requirements
Number of Respondents
Annually (1)
Number of
Responses per Respondent
(2)
Average Burden Hours per Response
(3)
Total Annual Burden Hours
(1)x(2)x(3) Metrics Data Collection
140 1540
Write Performance Analysis
85 935
Management Review
11 1
20 220
Total 245 2695
Cost to Comply The Chairman has projected the cost of compliance to be $184460 Technical Expertise = $168300 (1540 hours data collection + 935 hours report completion $68 per hour) Management Review = $17160 (220 hours report review $78 per hour) Cost per hour figures are calculated using BLS data79 The technical expertise category factors in the median wage for an engineer analyst attorney and economist The management category factors in the median wage for general and operations managers Based on BLS data80 both cost figures have been adjusted to include benefits (benefits represent 295 percent of the total hourly figure)
Title FERC-922 Non-RTOISO Performance Metrics
Action Proposed Collection
OMB Control No TBD
79 See httpblsgovoescurrentnaics3_221000htm
80 See httpwwwblsgovnewsreleaseececnr0htm
36
20121015-4003 FERC PDF (Unofficial) 10152012
Docket No AD12-8-000
Internal Review The Chairman has reviewed the proposed metrics and has determined that the metrics and data gathered thereunder are necessary These requirements conform to the Commissionrsquos need for efficient information collection communication and management within the energy industry The Chairman is assured by means of internal review that there is specific objective support for the burden estimates associated with the information collection requirements
Interested persons may obtain information on the reporting requirements by contacting the following Federal Energy Regulatory Commission 888 First Street NE Washington DC 20426 [Attention Ellen Brown Office of the Executive Director] e-mail DataClearancefercgov Phone (202) 502-8663 fax (202) 273-0873 Any further comments on the collections of information and the associated burden estimates in this proceeding should be sent to the Commission in this docket and may also be sent to the Office of Information and Regulatory Affairs Office of Management and Budget Washington DC 20503 [Attention Desk Officer for the Federal Energy Regulatory Commission] For security reasons comments to OMB should be submitted by e-mail to oira_submissionombeopgov Comments submitted to OMB should include Docket Number AD12-8-000 and FERC-922
37
20121015-4003 FERC PDF (Unofficial) 10152012
Docket No AD12-8-000
38
IV Appendix
20121015-4003 FERC PDF (Unofficial) 10152012
Docket No AD12-8-000 39
Performance Metric Specific Metric(s) Reliability A National or Regional
Reliability Standards Compliance
1 References to which Electricity Reliability Organization (ERO) and Regional Reliability Organization (RRO) standards are applicable 2 Number of violations self-reported and made public by NERCFERC 3 Number of violations identified and made public as RRO or ERO audit findings 4 Total number of violations made public by NERCFERC 5 Severity level of each violation made public by NERCFERC 6 Compliance with operating reserve standards 7 Unserved energy (or load shedding) caused by violations Additional detail will be provided on (1) number of events (2) duration of the events (3) whether the events occurred during onoff-peak hours (4) additional information on equipment types affected and kV of lines affected and (5) number of events (and severity and duration of events) resulting in load shedding based on the utilization of TPL-002 Footnote b criteria Items 2-7 Track the ISORTO definition ldquoThis metric is a quantification of all NERC and RRO Reliability Standards violations that have been identified during an audit or as a result of an ISORTO self-report and have been published as part of that processrdquo Non ndashISORTO utilities should limit reporting to the same eight functional areas used by the ISORTOs 1 Balancing Authority 7 Transmission Planner 2 Interchange Authority 8 Transmission Service Provider 3 Planning Authority 4 Reliability Coordinator 5 Resource Planner 6 Transmission Operator
20121015-4003 FERC PDF (Unofficial) 10152012
Docket No AD12-8-000 40
B Dispatch Reliability 1 Balance Authority Ace Limit (BAAL) OR CPS1 and CPS2
2 Number of hours of transmission load reliefs (of severity level 3 or higher) called by the incumbent transmission provider or unscheduled flows
WECC entities will report events under the WECC Unscheduled Flow Mitigation Procedure (equivalent to the NERC TLR Level three)
3 Energy Management System (EMS) availability C Operational Planning ndash
Load Forecast Accuracy Actual peak load as a percentage variance from forecasted peak load as reported in OASIS
D Wind Forecasting Accuracy
Actual wind availability compared to forecasted wind availability
E Unscheduled Flows Difference between net actual interchange (actual measured power flow in real time) and the net scheduled interchange in megawatt hours Reported in Form 714
F Transmission Outage Coordination
1 Percentage of ge 200 kV planned outages of 5 days or more for which utility notified customers at least 1 month prior to the outage commencement date 2 Percentage of ge 200kV outages cancelled by utility after having been previously approved 3 Report information posted on OASIS (percentage of outages planned and unplanned with less than 2 days notice)
20121015-4003 FERC PDF (Unofficial) 10152012
Docket No AD12-8-000 41
G Long-Term Reliability Planning ndash Transmission
Dollar amount and number of facilities approved to be constructed for reliability purposes
2 Percentage of approved construction on schedule and completed
3 Performance of planning process related to
a Requests for and number of completed reliability studies
b Requests and number of completed economic studies
Discussion of stakeholder process and identification of stakeholder groups participating
H Long-Term Reliability
Planning ndash Resources 1 Processing time for generation interconnection requests 2 Actual reserve margins compared with planned reserve margins 3 Explanation of the nature and characteristics of demand response programs and how they are used in system planning Discussion of programs to facilitate the integration of renewable resources and to mitigate any issues and uncertainty associated with scheduling renewable resources
20121015-4003 FERC PDF (Unofficial) 10152012
Docket No AD12-8-000 42
I Infrastructure Investment ndash Interconnection and Transmission Process Metrics
1 Number of requests
2 Number of studies completed
3 Average age of incomplete studies
4 Average time for completed studies
5 Total cost and types of studies completed (eg feasibility study system impact study and facility study)
6 Number of transmission access denialstransmission service requests (TSRs) denied
J Special Protection
Systems 1 Number of special protection systems
2 Percentage of special protection systems that responded as designed when activated
Applicable pool of special protection systems should be based on how the reporting entityrsquos Regional Entity defines ldquospecial protection systemsrdquo
3 Number of unintended activations
20121015-4003 FERC PDF (Unofficial) 10152012
Docket No AD12-8-000 43
System Operations Measures A Demand Response Comprehensive explanation of the nature of utility demand response programs
implemented for load management as well as in compliance with state requirements B System Lambda System Lambda (on marginal unit)
Proposed System Lambda metric would not apply to utilities where the
marginal price is typically set by hydro units System lambda data will be based on Form 714 information
C Congestion Management Congestion analysis per Order No 890 D Resource Availability 1 - System forced outage rate as measured over 12 months E Transmission System
Availability Interrupted load megawatt hours as a percentage of load served
F Fuel Diversity Fuel diversity in terms of energy installed capacity and actual production G Clean Energy 1 Clean Energy megawatt hours by resource type as a percentage of total energy
2 Clean Energy megawatts by resource type as a percentage of total capacity Organizational Effectiveness Not applicable to non-RTO
entities
20121015-4003 FERC PDF (Unofficial) 10152012
Document Content(s)
Staff Report Non-RTO Metrics Final1015 2PDF1-43
20121015-4003 FERC PDF (Unofficial) 10152012
- Staff Report Non-RTO Metrics Final1015 2PDF
- Document Content(s)
-

Docket No AD12-8-000
recommend that this information be included in the narrative discussions that accompany the (TLRUnscheduled Flow Relief) metric to the extent the information is available
With respect to EPSArsquos request for metrics on all congestion management activities such as Local Area Protocols Commission Staff recommends that participating utilities provide narratives on the use of Local Area Protocols out-of-merit dispatches and other techniques to resolve system dispatch reliability problems Such information will provide a context for the role played by TLRs or Unscheduled Flow Reliefs thereby providing the basis for a more comprehensive assessment of constraint management by the participating utility Since not all participating utilities use these techniques and the definitions of these techniques may differ among utilities Commission Staff does not consider this information to be appropriate for standardized metrics c Load Forecasting Accuracy
Actual peak load as a percentage variance from forecasted peak load as reported in a transmission providerrsquos OASIS measures the effectiveness of the load forecasting function of utilities in non-ISORTO regions Since load forecasting provides the basis for resource commitment this metric impacts the incurrence of resource costs The more accurate a utility is in forecasting load the greater the likelihood that it can commit sufficient resources in a cost effective manner that avoids over-commitment of resources inefficient commitment of short lead-time resources or under-utilization of available resources This metric measures the percentage difference between actual peak load and forecasted peak load No comments were submitted on this metric d Wind Forecasting Accuracy i Performance Metric This metric measures the percentage accuracy of actual wind availability compared to forecasted wind availability Improving the accuracy of the wind forecast will facilitate the timely commitment and dispatch of sufficient supplemental resources ii Comments NIPPC maintains that the Commission should clarify whether this metric applies to the wind generation assets controlled by the merchant function of the transmission provider or to the independently owned and operated wind generation interconnection to
TLR events of severity level 3 and above Commission Staff recommends including a narrative explanation of why transactions could not be continued or completed similar to what is required by Order No 890 Id P 1627
20
20121015-4003 FERC PDF (Unofficial) 10152012
Docket No AD12-8-000
the transmission providerrsquos system NIPPC argues that the metric should not extend to generators not owned or controlled by the merchant function of the transmission provider in light of the market-sensitive nature of a generatorrsquos wind forecasting accuracy and scheduling practices53 NIPPC also urges the Commission to consider expanding this metric to require a transmission provider to report whether it has implemented a centralized wind forecast system for use in its operations and if so to collect additional metrics on the accuracy of that centralized forecast54 NIPPC contends that a single metric comparing actual wind output to forecast output over the reporting period is not a useful metric as inaccuracies in the forecast may cancel out over a long reporting period NIPPC argues that a more relevant measure of accuracy would be the number of hours during the reporting period that the forecast is accurate (where the forecast is within five percent of actual output) NIPPC also suggests that the following additional metrics would be useful (1) the MW of windsolar capacity subject to the forecast (2) granularity of the forecast (monthly weekly daily hourly sub-hourly) (3) whether the forecast is integrated into the transmission providerrsquos operations (4) whether the transmission provider shares the forecast with market participants (or generation owners) and (5) an equivalent metric for forecasts associated with solar energy and hydroelectric energy55 iii Response The wind accuracy metric was intended to apply to all wind resources ndash owned and non-owned ndash on the transmission providersrsquo systems Commission Staff does not recommend excluding wind generators not owned or controlled by transmission providers from the wind accuracy metric To be an effective tool to ensure system reliability this metric must measure the accuracy of forecasts that account for all wind resources in a utilityrsquos footprint This requirement is increasingly important as wind resources become a more significant portion of total resource output When wind generators ndash including those not owned or controlled by the utility ndash provide wind availability forecasts they are performing a reliability function that has implications for system reliability management and planning Accordingly Commission Staff considers this information to be an important element in an assessment of a utilityrsquos reliability performance We encourage participating utilities to work with wind generators not owned or controlled by the utility to ensure that the data gathered and reported protects market-sensitive information from
53 NIPPC Comments at 5
54 Id
55 Id at 5-6
21
20121015-4003 FERC PDF (Unofficial) 10152012
Docket No AD12-8-000
being reported in public reports or released to utility subsidiaries that compete with these wind generators Commission Staff agrees with NIPPC that to the extent that centralized forecasting can minimize integration costs this information is an indication of utility performance Therefore Commission Staff recommends that participating utilities discuss their forecasting process in their reports With respect to NIPPCrsquos concern that inaccuracies in the forecast may cancel out Commission Staff notes that the wind accuracy forecast will be based on the mean absolute error of the forecast compared to actual wind availability Therefore all errors ndash positive and negative ndash will be measured and will not cancel out Since the proposed metric will measure the magnitude of forecast inaccuracies Commission Staff considers the proposed metric to be superior to the alternative proposed by NIPPC that only indicates the number of hours in which a forecast is outside a five percent threshold Further responding to NIPPC Commission Staff notes that forecast accuracy will be based on a comparison of the day-ahead forecast to actual availability Commission Staff also notes that the capacity of wind and solar subject to the forecast which NIPPC requests be an additional performance metric is included in the Clean Energy metric discussed below Commission Staff is not recommending the inclusion of a metric measuring the accuracy of forecasts for other variable energy resources because many utilities do not perform these forecasts or they are not performed according to a standardized process Nevertheless Commission Staff considers it appropriate that participating utilities provide narrative descriptions of their solar and hydro forecasts to the extent these resources are significant sources of energy to allow for a more complete assessment of forecasting performance e Unscheduled Flows Metric Unscheduled flows are defined as the difference between net actual interchange (actual power flow measured in real time) and net scheduled interchange The two components of unscheduled flows are inadvertent energy defined to be the difference between actual and scheduled interchange for all interties and parallel flow (or loop flow) defined to be the actual power flow on a contract path within an interconnection from one Balancing Authority Area to a second Balancing Authority Area through ldquoparallelrdquo transmission lines through a third Balancing Authority Area Parallel flows are a function of the interconnectionrsquos operating configuration line resistance and physics Unscheduled flows provide information relevant to operation planning because curtailments may occur when unscheduled flows exceed system operating limits This metric is measured by the difference between net actual interchange (actual measured power flow in real time) and the net scheduled interchange in MWh as reported in a
22
20121015-4003 FERC PDF (Unofficial) 10152012
Docket No AD12-8-000
utilityrsquos FERC Form No 714 ldquoAnnual Electric Balancing Authority Area and Planning Area Reportrdquo No comments were received on this metric f Transmission Outage Coordination i Performance Metric
The transmission outage coordination metric measures the percentage of outages planned and unplanned that occur with less than two days notice Effective transmission outage coordination will result in early notification of outages and therefore will be indicated in the metrics as a low percentage of short notice outages56 Effective transmission outage coordination by utilities in non-ISORTO regions ensures that outages do not threaten system reliability and that additional and potentially more expensive resources do not need to be committed
ii Comments ESPA recommends that the performance metrics track a utilityrsquos transmission outage performance EPSA states that the information posted on OASIS is valuable information and requests that the Commission include information regarding any transmission outages known ahead of time including the time and date of the planned outage and the planned duration of the outage57 EPSA maintains that providing this information would allow market participants to evaluate the information concerning the proposed outage and make other arrangements if necessary or otherwise take proactive steps to reduce the impact of any such planned outage EPSA states that outage performance information would also give the Commission and other observers the opportunity to evaluate how well the utility or transmission owner can schedule outages and execute that schedule58
iii Response
Commission Staff agrees with EPSA that the transmission outage metrics should include information to measure the utilitiesrsquo ability to plan for outages and successfully execute their outage plan As stated in the Commission Staff Report on ISORTO Performance Metrics effective transmission outage coordination is defined as early
56 The proposed metrics will measure outages for major transmission facilities
which are defined for purposes of the metrics as 200kV and higher
57 EPSA Comments at 7-8
58 Id at 8
23
20121015-4003 FERC PDF (Unofficial) 10152012
Docket No AD12-8-000
notification of planned outages of five days or longer ndash ie notification at least one month prior to the outage commencement date ndash and timely review of outage impacts59 Also effective transmission outage coordination is measured by the percentage of planned outages that are canceled due to conflicting planned outages as well as forced (unscheduled) outages that could cause reliability issues and additional congestion costs Commission Staff recommends adding these metrics for outages on major transmission lines of 200kV and higher to be consistent with the metrics for ISOs and RTOs60 g Long-Term Reliability Planning ndash Transmission i Performance Metric The proposed metric tracks the dollar amount of transmission facilities approved to be constructed for reliability purposes the percentage of approved construction completed the number of requests for and completed reliability studies and a narrative detailing a utilityrsquos economic study process This information measures the ability of each utilityrsquos expansion planning process to identify reliability and economic needs in advance which is essential to ensuring that market participants have sufficient time to develop either transmission or resource solutions to system reliability and economic requirements The metric also includes a narrative discussion of the transmission planning stakeholder process ii Comments Multiple TDUs state that a metric related to planning and completion of economic transmission is needed for multiple reasons First vertically-integrated transmission
59 Staff Report at 25
60 See Staff Report at Appendix B Peformance Metric F1 (Oct 21 2010) (Percentage of gt 200kV planned outages of 5 days or more that are submitted to ISORTO at least 1 month prior to the outage commencement date) We note that in Revisions to Electric Reliability Organization Definition of Bulk Electric System and Rules of Procedure Notice of Proposed Rulemaking 77 Fed Reg 39846 139 FERC para 61247 (2012) the Commission proposed to approve a modification to the currently-effective definition of ldquobulk electricrdquo systemrdquo that would establish a bright-line threshold that includes all facilities at or above 100 kV Commission Staff still considers it reasonable to require a 200 kV minimum for reporting information related to outages for performance metrics purposes particularly since this 200 kV minimum is consistent with the threshold ISOsRTOs used in their prior metric reports Nevertheless Commission Staff will monitor responses under this metric and continue to evaluate whether this is the appropriate threshold
24
20121015-4003 FERC PDF (Unofficial) 10152012
Docket No AD12-8-000
providers have inherent incentives to discriminate and underperform when performing this function Multiple TDUs state that the Commission has recognized as much and that such a metric would help measure the efficacy of the remedies that the Commission adopted in Order No 890 to address this concern61 Second the economic costs of transmission constraints are not transparent in areas without centralized markets like those found in ISOs and RTOs with congestion pricing Third more specificity is needed because a vertically-integrated transmission owner reporting on transmission construction and identifying shortfalls would be identifying its own unsuccessful outcomes62 Multiple TDUs argue that merely requiring vertically-integrated transmission providers to provide a narrative detailing their economic studies process as is proposed will elicit little more than a repetition of the planning process descriptions that were filed in compliance with Order No 890 For these reasons Multiple TDUs argue that the transmission planning and construction metric should be expanded to include the dollar amount of facilities constructed for purposes whose predominant purpose was not reliability broken down between (a) economic (b) public policy (c) facilities to support the planned generation resources of the transmission provider or its affiliates (d) transmission or interconnection requests made by the transmission provider or its affiliates and (e) in response to requests from others Multiple TDUs state that the metrics should also include the number of transmission construction projects that were added to the transmission provider construction plans between the issuance of Order No 890 and the submission of the report broken down into categories (a) through (e) and into their current status (ie completed incomplete and on schedule incomplete and behind schedule and removed from plan) EEI argues that the Multiple TDUsrsquo request is unwarranted EEI maintains that due to the low incidence of economic study requests requiring such additional reporting will create an added and unnecessary burden to reporting utilities63 Multiple TDUs also state that the metric should include a narrative assessment supported by quantitative information of the transmission providerrsquos planning process efficacy64 Similarly EPSA argues that the performance metrics should include a metric
61 Multiple TDUs Comments at 6 (citing Order No 890 FERC Stats amp Regs para
31241) 62 Id at 6-7
63 EEI Reply Comments at 4
64 Multiple TDUs Comments at 7-8
25
20121015-4003 FERC PDF (Unofficial) 10152012
Docket No AD12-8-000
detailing how well a utility executes its transmission development plans EPSA explains that a utilityrsquos failure to follow its transmission plan can adversely impact customers and merchant generators Thus EPSA maintains that a metric assessing how well a utility executes its transmission plan would provide valuable information including a demonstration of how prepared a utility is to meet any future reliability needs on its system65 iii Response
Commission Staff does not recommend adding the metrics proposed by Multiple TDUs on non-reliability transmission and interconnection projects The purpose of this metric is to assess the extent to which transmission solutions are analyzed planned and deployed to meet reliability requirements Thus additional information to examine discrimination by utilities or to obtain information on all project spending including projects to meet public policy objectives would go beyond the scope of the metric The congestion issues of concern to Multiple TDUs including the impact of transmission planning on congestion are discussed further below in the Congestion Management metric
Commission Staff agrees with commenters that additional information is needed
however in the transmission planning metrics to provide a more comprehensive assessment of transmission planning performance and to allow for comparisons between ISOs and RTOs and participating utilities in regions outside of ISOs and RTOs Accordingly Commission Staff recommends additional information be included in the metrics as follows (1) the proposed dollar amount of facilities approved to be constructed for reliability purposes should be revised to also include the number of facilities so that this metric is comparable to the relevant ISORTO performance metric (2) the proposed percentage of approved construction completed metric should be revised to the percentage of approved construction on schedule and completed and (3) the proposed narrative detailing the economic studies process should be revised to a metric that measures the percentage completion of economic projects
Responding to EEI Commission Staff does not find that it would be unduly
burdensome to incorporate both the number of economic study requests and the number of economic studies accomplished into a narrative explanation of the status of planning for economic expansions Economic projects can reduce congestion which in turn can reduce costs to customers and decrease the likelihood that reliability issues will occur Therefore this information provides an important indicator on the progress made by utilities in improving the efficiency of their transmission systems
65 EPSA Comments at 7
26
20121015-4003 FERC PDF (Unofficial) 10152012
Docket No AD12-8-000
Commission Staff agrees with EPSA that the reports provided by participating utilities should also include a discussion of the status of their transmission plans Such information will allow participating utilities to explain their progress in meeting planning goals and explain the issues that may be delaying the completion of reliability and economic projects Commission Staff expects that this discussion will also address the desire of Multiple TDUs to have a narrative assessment of the efficacy of the transmission providerrsquos planning process66 and to address how utilities provide an opportunity to consider transmission needs driven by Public Policy Requirements in their planning process67
h Long-Term Reliability Transmission Planning ndash Resources
Three metrics are employed to measure the effectiveness of long-term reliability planning for resources The first metric processing time for generation interconnection requests measures the effectiveness of processes in achieving timely interconnection of new resources that are needed to ensure reliability The second metric the planned reserve margin is the planned number of MW of resources available as system reserves divided by the number of MW of peak load The third metric is a narrative discussion of demand response programs and how they are used in system planning No comments were received on this metric Commission Staff recommends that the proposed planned reserve margin metric be revised to compare the actual reserve margin to the planned reserve margin This comparison will allow for an evaluation of utility performance in achieving the planned reserve margin
i Infrastructure Investment ndash Interconnection and Transmission Process Metrics
i Performance Metric
These metrics track the progress that utilities have made in regions outside of ISOs and RTOs in completing their reliability reviews ndash namely feasibility system impact and
66 We note that this narrative assessment is in keeping with the Commissionrsquos
requirement that public utility transmission providers make available information regarding the status of transmission upgrades identified in their transmission plans See Transmission Planning and Cost Allocation by Transmission Owning and Operating Public Utilities Order No 1000 FERC Stats amp Regs para 31323 at P 159 amp n154 (2011)) order on rehrsquog Order No 1000-A 139 FERC para 61132 (2012)
67 Order No 1000 FERC Stats amp Regs para 31323 at P 203
27
20121015-4003 FERC PDF (Unofficial) 10152012
Docket No AD12-8-000
facility studies ndash of interconnection and transmission service requests in a timely and efficient manner The metrics track the number of requests the time required to complete the reliability reviews and the costs of completing each of the three types of studies There is also a metric that measures the number of transmission access denials and transmission service request denials The purpose of this metric is to provide information on the magnitude and reasons for transmission service denials and whether additional infrastructure investment is needed to avoid transmission service denials ii Comments Multiple TDUs state that the Commission should collect additional information on the completion of transmission studies Multiple TDUs state that while the metrics for ISOs and RTOs require the reporting of information on studies such measures are omitted from the draft metrics for regions outside of ISOs and RTOs without explanation Multiple TDUs argue that such metrics are even more important than in the ISO and RTO context and that it would be worth obtaining from vertically-integrated transmission providers all of the study completion metrics that ISOs and RTOs are required to produce Multiple TDUs explain that the cost of collecting and providing this information should not be inordinate and that transmission providers should already have expense tracking mechanisms in place to estimate and bill study costs Multiple TDUs state that the following additional metrics would be worth collecting from vertically-integrated transmission providers (1) percentages of long-term transmission service requests and interconnection requests that triggered study requirements (2) percentages of the studies undertaken that led to the identification of upgrade costs (3) the average estimated upgrade cost (4) the percent of transmission service requests withdrawn and the percent approved and (5) the average processing time through each process milestone identified in the transmission providerrsquos Order No 890 compliance tariff provisions such as completion of a feasibility study system impact study and facilities study Multiple TDUs claims that such information would help the Commission identify situations in which impediments to obtaining transmission or interconnection service warrant further investigation68 Multiple TDUs state that the addition of a metric concerning the number of transmission access denials or transmission service requests denied is less meaningful than it first appears Multiple TDUs explain that under the pro forma Open Access Transmission Tariff long-term transmission service requests cannot be legitimately denied instead if there is no existing transmission capability available to accommodate the request the requester is supposed to be informed that meeting the request would require additional facilities and offered the opportunity to fund studies to determine what
68 Multiple TDUs Comments at 5
28
20121015-4003 FERC PDF (Unofficial) 10152012
Docket No AD12-8-000
upgrades are needed Multiple TDUs state that a metric tracking how often entities requesting service withdraw their request for service in the face of these requirements would be worthwhile but that the proposed metric might not elicit such information69 Accordingly Multiple TDUs suggest revising the metric to require entities to report the number of long-term transmission service requests for which ATC was initially found to be unavailable and the disposition of each request with each of these points broken down between requests made by third-party transmission customers and requests made by affiliates or divisions of the transmission provider70
NIPPC contends that the Commission should require transmission operators to
report information concerning the pace of large generator interconnections including the total number of pending interconnection requests the number of pending requests in each phase of the LGIA process and the number of requests in each phase that have experienced delays in completing that phase of the interconnection process along with a narrative describing the causes of those delays71 iii Response Commission Staff agrees with Multiple TDUs that the proposed metrics should include information on how long it takes participating utilities to complete interconnection and transmission studies as a measure of the efficiency of the utilityrsquos infrastructure development process Accordingly Commission Staff recommends that the performance metrics be revised to include metrics concerning the average age of incomplete studies and the average time to complete studies Commission Staff considers the time to complete all studies to be an appropriate metric to measure the efficiency of utility interconnection and transmission study processes It is expected that the narrative discussions that accompany the metrics will address issues with the various study stages and that the discussions will address the issues of concern to Multiple TDUs Commission Staff does not consider that information on the percentage of requests that trigger studies or are withdrawn will reflect utility performance The percentage of requests that trigger studies is a function of available transmission capacity not utility performance The percentage of requests withdrawn is caused by the actions of market participants ndash not utilities ndash and therefore does not measure utility performance Therefore we are not recommending the addition of this information to the metrics reports
69 Id at 8
70 Id
71 NIPPC Comments at 4-5
29
20121015-4003 FERC PDF (Unofficial) 10152012
Docket No AD12-8-000
With regard to Multiple TDUsrsquo interest in additional metrics on transmission service denials Commission Staff expects that the narrative discussions provided by participating utilities will address issues of concern to the Multiple TDUs such as the disposition of requests for service Commission Staff notes however that this metric is not intended to measure ATC or transmission capacity in general Rather the purpose of tracking transmission service denials is to provide an additional measure of the efficiency of utilities in processing requests for transmission service and therefore is intended to be evaluated in the context of the other infrastructure investment processing metrics This information combined with explanations provided by the utilities in their narrative discussion will provide the basis for a comprehensive assessment of how utilities are managing their infrastructure development process Commission Staff does not recommend adding a metric concerning the number of pending generation interconnection requests as requested by NIPPC By measuring the time it takes utilities to complete their studies for interconnection and transmission service the proposed metric appropriately focuses on the efficiency of a utilityrsquos processing of service requests ndash irrespective of the total number of requests Also since many interconnection requests in a utilityrsquos interconnection queue may not be ready to proceed because of commercial issues and other factors beyond the control of utilities the number of pending interconnection requests is not an appropriate measure of utility performance As has been the case in the ISORTO performance metrics reports Commission Staff expects that the narrative discussion that accompanies the utility metrics on interconnections and transmission service will explain the status of their request queues and reasons for delays j Special Protection Systems Special Protection Systems72 are automatic protection systems designed to detect abnormal or predetermined system conditions and take corrective actions such as changing demand generation or system configurations in order to maintain system stability acceptable voltage levels or maintain power flows These metrics measure the performance of such Special Protection Systems based on the definition of Special Protection Systems utilized by the reporting entityrsquos Regional Entity These metrics measure both the frequency with which the region relies on these systems and their effectiveness as measured by successful activations and the number of unintended activations No comments were submitted on this metric
72 Special Protection Systems are also referred to as Special Protection Schemes
Remedial Action Schemes (RAS) or System Integrity Protection Schemes (SIPS)
30
20121015-4003 FERC PDF (Unofficial) 10152012
Docket No AD12-8-000
k Demand Response Entities responding to this metric will be required to provide a comprehensive explanation of the nature of utility demand response programs implemented for load management as well as in compliance with state requirements There were no comments on this metric l System Lambda System lambda is the incremental cost of energy of the marginal unit assuming no system constraints This metric tracks the trend in marginal fuel costs and is an important metric since fuel costs represent the largest component of wholesale energy costs The system lambda metric would not apply to utilities where the marginal price is typically set by hydro units Also system lambda data will be based on information contained in FERC Form No 714 There were no comments on this metric m Congestion Management i Performance Metric Congestion represents the cost to customers of paying for more expensive energy because physical transmission line limits do not allow full delivery of least-cost energy Entities responding to this metric would be required to provide a congestion analysis consistent with Order No 890 In Order No 890 the Commission adopted a planning principle requiring transmission providers to prepare studies identifying ldquosignificant and recurringrdquo congestion and post such studies on their OASIS The Commission explained that the studies should analyze and report on the following items (1) the location and magnitude of the congestion (2) possible remedies for the elimination of the congestion in whole or in part (3) the associated costs of congestion and (4) the cost associated with relieving congestion through system enhancements (or other means)73 ii Comments Multiple TDUs argue that merely requiring vertically-integrated transmission providers to provide a narrative detailing their economic study processes as is proposed will elicit little more than a repetition of the planning process descriptions that were filed in compliance with Order No 890
73 Order No 890 FERC Stats amp Regs para 31241 at PP 529 542
31
20121015-4003 FERC PDF (Unofficial) 10152012
Docket No AD12-8-000
iii Response Commission Staff recommends that utilities discuss the status of their transmission plans as explained in the Long-Term Transmission Planning Metrics discussed above Commission Staff expects that these discussions will address expansion plans to resolve congestion issues on their systems Therefore Commission Staff expects that the performance reports submitted by utilities will provide substantive information on congestion management n Resource Availability i Performance Metric
The proposed metric measures the percentage of time that system resources are not available because of unplanned outages as measured by the system forced outage rate No comments were submitted on the metric
ii Response Commission Staff recommends that this metric be revised to be 1 minus the
system forced outage rate Revising the metric as recommended will measure unforced capacity availability and therefore resource availability This revision will also make this metric comparable to the performance metric adopted for ISOs and RTOs Resource availability is an indication of system efficiency and cost management by utilities in regions outside of ISOs and RTOs Higher resource availability can result in the commitment of fewer peak resources (or the importation of peak supplies) that potentially have high costs thereby resulting in reduced costs o Transmission System Availability This metric measures interrupted load MWh as a percentage of load served In light of the many factors that can result in load interruptions some of which are beyond the control of utilities the narrative detailing the reasons for load interruptions will be essential in assessing performance No comments were submitted on this metric p Fuel Diversity
This metric is defined to be the percentage mix of fuel types installed and available (capacity fuel diversity) and produced (generation fuel diversity) Fuel diversity provides an indication of a utilityrsquos capability to integrate fuels with different characteristics such as lower costs or lower environmental impacts No comments were submitted on this metric
32
20121015-4003 FERC PDF (Unofficial) 10152012
Docket No AD12-8-000
q Clean Energy i Performance Metric
These metrics measure the use of ldquoclean energyrdquo74 The metrics track number of MWh of clean energy by resource type as a percentage of total energy and the number of MW of clean energy by resource type as a percentage of total capacity
ii Comments NIPPC states that the Commission should expand the clean energy metric to include information related to curtailments of clean energy resources as frequent curtailments of these resources by a transmission operator may reflect a dysfunction in the generation market since these resources have no fuel costs NIPPC explains that the metric should include the number of curtailments the duration of each curtailment the number of MW hours curtailed and the justification for the curtailment75 iii Response Commission Staff does not consider curtailments of clean energy to be a measure of the diversity of a utilityrsquos resource mix Rather curtailments of resources ndash or more accurately schedule adjustments or manual redispatch instructions by transmission providers ndash are used to maintain system reliability We note that the diversity metrics in conjunction with the narratives regarding actions taken to manage dispatch reliability and TLR (see pages 18-19 infra) will provide a basis for a comprehensive view of the issue of clean energy
D Burden Estimate
1 Information Collection Statement In its solicitation for comments Commission Staff estimated the public reporting
burden for participating utilities to be approximately 140 hours per respondent for each report
74 Clean Energy is defined to include nuclear energy and variable energy
resources including solar wind hydro geothermal and biomass resources
75 NIPPC Comments at 6
33
20121015-4003 FERC PDF (Unofficial) 10152012
Docket No AD12-8-000
2 Comment EEI asserts that the response time could be as high as 300-400 hours
3 Response
Commission Staff will adjust the burden estimate based on EEIrsquos high estimate of 300-400 hours Commission Staff considers EEIrsquos estimate to be reflective of the most time that it would take an entity to respond to the metrics While Commission Staff recognizes that this report requires additional metrics and narrative discussions Commission Staff nevertheless continues to conclude that 140 hours still represents a reasonable estimate of the burden since much of the data required should be readily available to the responding utilities However in recognition of the fact that the burden will vary from entity to entity we will revise our estimate to 245 hours per respondent which is the mid-point between these estimates
E Information Collection Statement Information Collection Statement
The following collection of information contained in these metrics is subject to
review by the Office of Management and Budget (OMB) under section 3507 of the Paperwork Reduction Act of 199576 OMBrsquos regulations require approval of certain information collection requirements imposed by agency actions77 The Commission cannot conduct this information collection unless it displays a valid OMB control number78
The collection of information requires those public utilities outside of ISOs and RTOs that choose to participate to provide information responding to the attached metrics on a periodic basis This includes the submission of price data and information relating to reliability transmission planning requests for service and system capacity The
76 44 USC sect 3507 (2006) The Paperwork Reduction Act requires OMB
approval of certain information collection activities when these activities apply to 10 or more persons Because it is estimated that 11 entities will respond to this collection the Chairman is requesting approval from OMB
77 5 CFR sect 1320 (2012)
78 The Commission is issuing a separate notice regarding the collection of information that will be published in the Federal Register to comply with the OMB requirements at 5 CFR sect 13205(a)(iv)
34
20121015-4003 FERC PDF (Unofficial) 10152012
Docket No AD12-8-000
information submitted by participating utilities would be used to help develop a common set of metrics for both ISORTO markets and non-RTOISO markets and for evaluating market performance thereafter
35
20121015-4003 FERC PDF (Unofficial) 10152012
Docket No AD12-8-000
Burden Estimate The estimated public reporting burdens for the reporting
requirements have been adjusted as described above
FERC-922 Requirements
Number of Respondents
Annually (1)
Number of
Responses per Respondent
(2)
Average Burden Hours per Response
(3)
Total Annual Burden Hours
(1)x(2)x(3) Metrics Data Collection
140 1540
Write Performance Analysis
85 935
Management Review
11 1
20 220
Total 245 2695
Cost to Comply The Chairman has projected the cost of compliance to be $184460 Technical Expertise = $168300 (1540 hours data collection + 935 hours report completion $68 per hour) Management Review = $17160 (220 hours report review $78 per hour) Cost per hour figures are calculated using BLS data79 The technical expertise category factors in the median wage for an engineer analyst attorney and economist The management category factors in the median wage for general and operations managers Based on BLS data80 both cost figures have been adjusted to include benefits (benefits represent 295 percent of the total hourly figure)
Title FERC-922 Non-RTOISO Performance Metrics
Action Proposed Collection
OMB Control No TBD
79 See httpblsgovoescurrentnaics3_221000htm
80 See httpwwwblsgovnewsreleaseececnr0htm
36
20121015-4003 FERC PDF (Unofficial) 10152012
Docket No AD12-8-000
Internal Review The Chairman has reviewed the proposed metrics and has determined that the metrics and data gathered thereunder are necessary These requirements conform to the Commissionrsquos need for efficient information collection communication and management within the energy industry The Chairman is assured by means of internal review that there is specific objective support for the burden estimates associated with the information collection requirements
Interested persons may obtain information on the reporting requirements by contacting the following Federal Energy Regulatory Commission 888 First Street NE Washington DC 20426 [Attention Ellen Brown Office of the Executive Director] e-mail DataClearancefercgov Phone (202) 502-8663 fax (202) 273-0873 Any further comments on the collections of information and the associated burden estimates in this proceeding should be sent to the Commission in this docket and may also be sent to the Office of Information and Regulatory Affairs Office of Management and Budget Washington DC 20503 [Attention Desk Officer for the Federal Energy Regulatory Commission] For security reasons comments to OMB should be submitted by e-mail to oira_submissionombeopgov Comments submitted to OMB should include Docket Number AD12-8-000 and FERC-922
37
20121015-4003 FERC PDF (Unofficial) 10152012
Docket No AD12-8-000
38
IV Appendix
20121015-4003 FERC PDF (Unofficial) 10152012
Docket No AD12-8-000 39
Performance Metric Specific Metric(s) Reliability A National or Regional
Reliability Standards Compliance
1 References to which Electricity Reliability Organization (ERO) and Regional Reliability Organization (RRO) standards are applicable 2 Number of violations self-reported and made public by NERCFERC 3 Number of violations identified and made public as RRO or ERO audit findings 4 Total number of violations made public by NERCFERC 5 Severity level of each violation made public by NERCFERC 6 Compliance with operating reserve standards 7 Unserved energy (or load shedding) caused by violations Additional detail will be provided on (1) number of events (2) duration of the events (3) whether the events occurred during onoff-peak hours (4) additional information on equipment types affected and kV of lines affected and (5) number of events (and severity and duration of events) resulting in load shedding based on the utilization of TPL-002 Footnote b criteria Items 2-7 Track the ISORTO definition ldquoThis metric is a quantification of all NERC and RRO Reliability Standards violations that have been identified during an audit or as a result of an ISORTO self-report and have been published as part of that processrdquo Non ndashISORTO utilities should limit reporting to the same eight functional areas used by the ISORTOs 1 Balancing Authority 7 Transmission Planner 2 Interchange Authority 8 Transmission Service Provider 3 Planning Authority 4 Reliability Coordinator 5 Resource Planner 6 Transmission Operator
20121015-4003 FERC PDF (Unofficial) 10152012
Docket No AD12-8-000 40
B Dispatch Reliability 1 Balance Authority Ace Limit (BAAL) OR CPS1 and CPS2
2 Number of hours of transmission load reliefs (of severity level 3 or higher) called by the incumbent transmission provider or unscheduled flows
WECC entities will report events under the WECC Unscheduled Flow Mitigation Procedure (equivalent to the NERC TLR Level three)
3 Energy Management System (EMS) availability C Operational Planning ndash
Load Forecast Accuracy Actual peak load as a percentage variance from forecasted peak load as reported in OASIS
D Wind Forecasting Accuracy
Actual wind availability compared to forecasted wind availability
E Unscheduled Flows Difference between net actual interchange (actual measured power flow in real time) and the net scheduled interchange in megawatt hours Reported in Form 714
F Transmission Outage Coordination
1 Percentage of ge 200 kV planned outages of 5 days or more for which utility notified customers at least 1 month prior to the outage commencement date 2 Percentage of ge 200kV outages cancelled by utility after having been previously approved 3 Report information posted on OASIS (percentage of outages planned and unplanned with less than 2 days notice)
20121015-4003 FERC PDF (Unofficial) 10152012
Docket No AD12-8-000 41
G Long-Term Reliability Planning ndash Transmission
Dollar amount and number of facilities approved to be constructed for reliability purposes
2 Percentage of approved construction on schedule and completed
3 Performance of planning process related to
a Requests for and number of completed reliability studies
b Requests and number of completed economic studies
Discussion of stakeholder process and identification of stakeholder groups participating
H Long-Term Reliability
Planning ndash Resources 1 Processing time for generation interconnection requests 2 Actual reserve margins compared with planned reserve margins 3 Explanation of the nature and characteristics of demand response programs and how they are used in system planning Discussion of programs to facilitate the integration of renewable resources and to mitigate any issues and uncertainty associated with scheduling renewable resources
20121015-4003 FERC PDF (Unofficial) 10152012
Docket No AD12-8-000 42
I Infrastructure Investment ndash Interconnection and Transmission Process Metrics
1 Number of requests
2 Number of studies completed
3 Average age of incomplete studies
4 Average time for completed studies
5 Total cost and types of studies completed (eg feasibility study system impact study and facility study)
6 Number of transmission access denialstransmission service requests (TSRs) denied
J Special Protection
Systems 1 Number of special protection systems
2 Percentage of special protection systems that responded as designed when activated
Applicable pool of special protection systems should be based on how the reporting entityrsquos Regional Entity defines ldquospecial protection systemsrdquo
3 Number of unintended activations
20121015-4003 FERC PDF (Unofficial) 10152012
Docket No AD12-8-000 43
System Operations Measures A Demand Response Comprehensive explanation of the nature of utility demand response programs
implemented for load management as well as in compliance with state requirements B System Lambda System Lambda (on marginal unit)
Proposed System Lambda metric would not apply to utilities where the
marginal price is typically set by hydro units System lambda data will be based on Form 714 information
C Congestion Management Congestion analysis per Order No 890 D Resource Availability 1 - System forced outage rate as measured over 12 months E Transmission System
Availability Interrupted load megawatt hours as a percentage of load served
F Fuel Diversity Fuel diversity in terms of energy installed capacity and actual production G Clean Energy 1 Clean Energy megawatt hours by resource type as a percentage of total energy
2 Clean Energy megawatts by resource type as a percentage of total capacity Organizational Effectiveness Not applicable to non-RTO
entities
20121015-4003 FERC PDF (Unofficial) 10152012
Document Content(s)
Staff Report Non-RTO Metrics Final1015 2PDF1-43
20121015-4003 FERC PDF (Unofficial) 10152012
- Staff Report Non-RTO Metrics Final1015 2PDF
- Document Content(s)
-
Docket No AD12-8-000
notification of planned outages of five days or longer ndash ie notification at least one month prior to the outage commencement date ndash and timely review of outage impacts59 Also effective transmission outage coordination is measured by the percentage of planned outages that are canceled due to conflicting planned outages as well as forced (unscheduled) outages that could cause reliability issues and additional congestion costs Commission Staff recommends adding these metrics for outages on major transmission lines of 200kV and higher to be consistent with the metrics for ISOs and RTOs60 g Long-Term Reliability Planning ndash Transmission i Performance Metric The proposed metric tracks the dollar amount of transmission facilities approved to be constructed for reliability purposes the percentage of approved construction completed the number of requests for and completed reliability studies and a narrative detailing a utilityrsquos economic study process This information measures the ability of each utilityrsquos expansion planning process to identify reliability and economic needs in advance which is essential to ensuring that market participants have sufficient time to develop either transmission or resource solutions to system reliability and economic requirements The metric also includes a narrative discussion of the transmission planning stakeholder process ii Comments Multiple TDUs state that a metric related to planning and completion of economic transmission is needed for multiple reasons First vertically-integrated transmission
59 Staff Report at 25
60 See Staff Report at Appendix B Peformance Metric F1 (Oct 21 2010) (Percentage of gt 200kV planned outages of 5 days or more that are submitted to ISORTO at least 1 month prior to the outage commencement date) We note that in Revisions to Electric Reliability Organization Definition of Bulk Electric System and Rules of Procedure Notice of Proposed Rulemaking 77 Fed Reg 39846 139 FERC para 61247 (2012) the Commission proposed to approve a modification to the currently-effective definition of ldquobulk electricrdquo systemrdquo that would establish a bright-line threshold that includes all facilities at or above 100 kV Commission Staff still considers it reasonable to require a 200 kV minimum for reporting information related to outages for performance metrics purposes particularly since this 200 kV minimum is consistent with the threshold ISOsRTOs used in their prior metric reports Nevertheless Commission Staff will monitor responses under this metric and continue to evaluate whether this is the appropriate threshold
24
20121015-4003 FERC PDF (Unofficial) 10152012
Docket No AD12-8-000
providers have inherent incentives to discriminate and underperform when performing this function Multiple TDUs state that the Commission has recognized as much and that such a metric would help measure the efficacy of the remedies that the Commission adopted in Order No 890 to address this concern61 Second the economic costs of transmission constraints are not transparent in areas without centralized markets like those found in ISOs and RTOs with congestion pricing Third more specificity is needed because a vertically-integrated transmission owner reporting on transmission construction and identifying shortfalls would be identifying its own unsuccessful outcomes62 Multiple TDUs argue that merely requiring vertically-integrated transmission providers to provide a narrative detailing their economic studies process as is proposed will elicit little more than a repetition of the planning process descriptions that were filed in compliance with Order No 890 For these reasons Multiple TDUs argue that the transmission planning and construction metric should be expanded to include the dollar amount of facilities constructed for purposes whose predominant purpose was not reliability broken down between (a) economic (b) public policy (c) facilities to support the planned generation resources of the transmission provider or its affiliates (d) transmission or interconnection requests made by the transmission provider or its affiliates and (e) in response to requests from others Multiple TDUs state that the metrics should also include the number of transmission construction projects that were added to the transmission provider construction plans between the issuance of Order No 890 and the submission of the report broken down into categories (a) through (e) and into their current status (ie completed incomplete and on schedule incomplete and behind schedule and removed from plan) EEI argues that the Multiple TDUsrsquo request is unwarranted EEI maintains that due to the low incidence of economic study requests requiring such additional reporting will create an added and unnecessary burden to reporting utilities63 Multiple TDUs also state that the metric should include a narrative assessment supported by quantitative information of the transmission providerrsquos planning process efficacy64 Similarly EPSA argues that the performance metrics should include a metric
61 Multiple TDUs Comments at 6 (citing Order No 890 FERC Stats amp Regs para
31241) 62 Id at 6-7
63 EEI Reply Comments at 4
64 Multiple TDUs Comments at 7-8
25
20121015-4003 FERC PDF (Unofficial) 10152012
Docket No AD12-8-000
detailing how well a utility executes its transmission development plans EPSA explains that a utilityrsquos failure to follow its transmission plan can adversely impact customers and merchant generators Thus EPSA maintains that a metric assessing how well a utility executes its transmission plan would provide valuable information including a demonstration of how prepared a utility is to meet any future reliability needs on its system65 iii Response
Commission Staff does not recommend adding the metrics proposed by Multiple TDUs on non-reliability transmission and interconnection projects The purpose of this metric is to assess the extent to which transmission solutions are analyzed planned and deployed to meet reliability requirements Thus additional information to examine discrimination by utilities or to obtain information on all project spending including projects to meet public policy objectives would go beyond the scope of the metric The congestion issues of concern to Multiple TDUs including the impact of transmission planning on congestion are discussed further below in the Congestion Management metric
Commission Staff agrees with commenters that additional information is needed
however in the transmission planning metrics to provide a more comprehensive assessment of transmission planning performance and to allow for comparisons between ISOs and RTOs and participating utilities in regions outside of ISOs and RTOs Accordingly Commission Staff recommends additional information be included in the metrics as follows (1) the proposed dollar amount of facilities approved to be constructed for reliability purposes should be revised to also include the number of facilities so that this metric is comparable to the relevant ISORTO performance metric (2) the proposed percentage of approved construction completed metric should be revised to the percentage of approved construction on schedule and completed and (3) the proposed narrative detailing the economic studies process should be revised to a metric that measures the percentage completion of economic projects
Responding to EEI Commission Staff does not find that it would be unduly
burdensome to incorporate both the number of economic study requests and the number of economic studies accomplished into a narrative explanation of the status of planning for economic expansions Economic projects can reduce congestion which in turn can reduce costs to customers and decrease the likelihood that reliability issues will occur Therefore this information provides an important indicator on the progress made by utilities in improving the efficiency of their transmission systems
65 EPSA Comments at 7
26
20121015-4003 FERC PDF (Unofficial) 10152012
Docket No AD12-8-000
Commission Staff agrees with EPSA that the reports provided by participating utilities should also include a discussion of the status of their transmission plans Such information will allow participating utilities to explain their progress in meeting planning goals and explain the issues that may be delaying the completion of reliability and economic projects Commission Staff expects that this discussion will also address the desire of Multiple TDUs to have a narrative assessment of the efficacy of the transmission providerrsquos planning process66 and to address how utilities provide an opportunity to consider transmission needs driven by Public Policy Requirements in their planning process67
h Long-Term Reliability Transmission Planning ndash Resources
Three metrics are employed to measure the effectiveness of long-term reliability planning for resources The first metric processing time for generation interconnection requests measures the effectiveness of processes in achieving timely interconnection of new resources that are needed to ensure reliability The second metric the planned reserve margin is the planned number of MW of resources available as system reserves divided by the number of MW of peak load The third metric is a narrative discussion of demand response programs and how they are used in system planning No comments were received on this metric Commission Staff recommends that the proposed planned reserve margin metric be revised to compare the actual reserve margin to the planned reserve margin This comparison will allow for an evaluation of utility performance in achieving the planned reserve margin
i Infrastructure Investment ndash Interconnection and Transmission Process Metrics
i Performance Metric
These metrics track the progress that utilities have made in regions outside of ISOs and RTOs in completing their reliability reviews ndash namely feasibility system impact and
66 We note that this narrative assessment is in keeping with the Commissionrsquos
requirement that public utility transmission providers make available information regarding the status of transmission upgrades identified in their transmission plans See Transmission Planning and Cost Allocation by Transmission Owning and Operating Public Utilities Order No 1000 FERC Stats amp Regs para 31323 at P 159 amp n154 (2011)) order on rehrsquog Order No 1000-A 139 FERC para 61132 (2012)
67 Order No 1000 FERC Stats amp Regs para 31323 at P 203
27
20121015-4003 FERC PDF (Unofficial) 10152012
Docket No AD12-8-000
facility studies ndash of interconnection and transmission service requests in a timely and efficient manner The metrics track the number of requests the time required to complete the reliability reviews and the costs of completing each of the three types of studies There is also a metric that measures the number of transmission access denials and transmission service request denials The purpose of this metric is to provide information on the magnitude and reasons for transmission service denials and whether additional infrastructure investment is needed to avoid transmission service denials ii Comments Multiple TDUs state that the Commission should collect additional information on the completion of transmission studies Multiple TDUs state that while the metrics for ISOs and RTOs require the reporting of information on studies such measures are omitted from the draft metrics for regions outside of ISOs and RTOs without explanation Multiple TDUs argue that such metrics are even more important than in the ISO and RTO context and that it would be worth obtaining from vertically-integrated transmission providers all of the study completion metrics that ISOs and RTOs are required to produce Multiple TDUs explain that the cost of collecting and providing this information should not be inordinate and that transmission providers should already have expense tracking mechanisms in place to estimate and bill study costs Multiple TDUs state that the following additional metrics would be worth collecting from vertically-integrated transmission providers (1) percentages of long-term transmission service requests and interconnection requests that triggered study requirements (2) percentages of the studies undertaken that led to the identification of upgrade costs (3) the average estimated upgrade cost (4) the percent of transmission service requests withdrawn and the percent approved and (5) the average processing time through each process milestone identified in the transmission providerrsquos Order No 890 compliance tariff provisions such as completion of a feasibility study system impact study and facilities study Multiple TDUs claims that such information would help the Commission identify situations in which impediments to obtaining transmission or interconnection service warrant further investigation68 Multiple TDUs state that the addition of a metric concerning the number of transmission access denials or transmission service requests denied is less meaningful than it first appears Multiple TDUs explain that under the pro forma Open Access Transmission Tariff long-term transmission service requests cannot be legitimately denied instead if there is no existing transmission capability available to accommodate the request the requester is supposed to be informed that meeting the request would require additional facilities and offered the opportunity to fund studies to determine what
68 Multiple TDUs Comments at 5
28
20121015-4003 FERC PDF (Unofficial) 10152012
Docket No AD12-8-000
upgrades are needed Multiple TDUs state that a metric tracking how often entities requesting service withdraw their request for service in the face of these requirements would be worthwhile but that the proposed metric might not elicit such information69 Accordingly Multiple TDUs suggest revising the metric to require entities to report the number of long-term transmission service requests for which ATC was initially found to be unavailable and the disposition of each request with each of these points broken down between requests made by third-party transmission customers and requests made by affiliates or divisions of the transmission provider70
NIPPC contends that the Commission should require transmission operators to
report information concerning the pace of large generator interconnections including the total number of pending interconnection requests the number of pending requests in each phase of the LGIA process and the number of requests in each phase that have experienced delays in completing that phase of the interconnection process along with a narrative describing the causes of those delays71 iii Response Commission Staff agrees with Multiple TDUs that the proposed metrics should include information on how long it takes participating utilities to complete interconnection and transmission studies as a measure of the efficiency of the utilityrsquos infrastructure development process Accordingly Commission Staff recommends that the performance metrics be revised to include metrics concerning the average age of incomplete studies and the average time to complete studies Commission Staff considers the time to complete all studies to be an appropriate metric to measure the efficiency of utility interconnection and transmission study processes It is expected that the narrative discussions that accompany the metrics will address issues with the various study stages and that the discussions will address the issues of concern to Multiple TDUs Commission Staff does not consider that information on the percentage of requests that trigger studies or are withdrawn will reflect utility performance The percentage of requests that trigger studies is a function of available transmission capacity not utility performance The percentage of requests withdrawn is caused by the actions of market participants ndash not utilities ndash and therefore does not measure utility performance Therefore we are not recommending the addition of this information to the metrics reports
69 Id at 8
70 Id
71 NIPPC Comments at 4-5
29
20121015-4003 FERC PDF (Unofficial) 10152012
Docket No AD12-8-000
With regard to Multiple TDUsrsquo interest in additional metrics on transmission service denials Commission Staff expects that the narrative discussions provided by participating utilities will address issues of concern to the Multiple TDUs such as the disposition of requests for service Commission Staff notes however that this metric is not intended to measure ATC or transmission capacity in general Rather the purpose of tracking transmission service denials is to provide an additional measure of the efficiency of utilities in processing requests for transmission service and therefore is intended to be evaluated in the context of the other infrastructure investment processing metrics This information combined with explanations provided by the utilities in their narrative discussion will provide the basis for a comprehensive assessment of how utilities are managing their infrastructure development process Commission Staff does not recommend adding a metric concerning the number of pending generation interconnection requests as requested by NIPPC By measuring the time it takes utilities to complete their studies for interconnection and transmission service the proposed metric appropriately focuses on the efficiency of a utilityrsquos processing of service requests ndash irrespective of the total number of requests Also since many interconnection requests in a utilityrsquos interconnection queue may not be ready to proceed because of commercial issues and other factors beyond the control of utilities the number of pending interconnection requests is not an appropriate measure of utility performance As has been the case in the ISORTO performance metrics reports Commission Staff expects that the narrative discussion that accompanies the utility metrics on interconnections and transmission service will explain the status of their request queues and reasons for delays j Special Protection Systems Special Protection Systems72 are automatic protection systems designed to detect abnormal or predetermined system conditions and take corrective actions such as changing demand generation or system configurations in order to maintain system stability acceptable voltage levels or maintain power flows These metrics measure the performance of such Special Protection Systems based on the definition of Special Protection Systems utilized by the reporting entityrsquos Regional Entity These metrics measure both the frequency with which the region relies on these systems and their effectiveness as measured by successful activations and the number of unintended activations No comments were submitted on this metric
72 Special Protection Systems are also referred to as Special Protection Schemes
Remedial Action Schemes (RAS) or System Integrity Protection Schemes (SIPS)
30
20121015-4003 FERC PDF (Unofficial) 10152012
Docket No AD12-8-000
k Demand Response Entities responding to this metric will be required to provide a comprehensive explanation of the nature of utility demand response programs implemented for load management as well as in compliance with state requirements There were no comments on this metric l System Lambda System lambda is the incremental cost of energy of the marginal unit assuming no system constraints This metric tracks the trend in marginal fuel costs and is an important metric since fuel costs represent the largest component of wholesale energy costs The system lambda metric would not apply to utilities where the marginal price is typically set by hydro units Also system lambda data will be based on information contained in FERC Form No 714 There were no comments on this metric m Congestion Management i Performance Metric Congestion represents the cost to customers of paying for more expensive energy because physical transmission line limits do not allow full delivery of least-cost energy Entities responding to this metric would be required to provide a congestion analysis consistent with Order No 890 In Order No 890 the Commission adopted a planning principle requiring transmission providers to prepare studies identifying ldquosignificant and recurringrdquo congestion and post such studies on their OASIS The Commission explained that the studies should analyze and report on the following items (1) the location and magnitude of the congestion (2) possible remedies for the elimination of the congestion in whole or in part (3) the associated costs of congestion and (4) the cost associated with relieving congestion through system enhancements (or other means)73 ii Comments Multiple TDUs argue that merely requiring vertically-integrated transmission providers to provide a narrative detailing their economic study processes as is proposed will elicit little more than a repetition of the planning process descriptions that were filed in compliance with Order No 890
73 Order No 890 FERC Stats amp Regs para 31241 at PP 529 542
31
20121015-4003 FERC PDF (Unofficial) 10152012
Docket No AD12-8-000
iii Response Commission Staff recommends that utilities discuss the status of their transmission plans as explained in the Long-Term Transmission Planning Metrics discussed above Commission Staff expects that these discussions will address expansion plans to resolve congestion issues on their systems Therefore Commission Staff expects that the performance reports submitted by utilities will provide substantive information on congestion management n Resource Availability i Performance Metric
The proposed metric measures the percentage of time that system resources are not available because of unplanned outages as measured by the system forced outage rate No comments were submitted on the metric
ii Response Commission Staff recommends that this metric be revised to be 1 minus the
system forced outage rate Revising the metric as recommended will measure unforced capacity availability and therefore resource availability This revision will also make this metric comparable to the performance metric adopted for ISOs and RTOs Resource availability is an indication of system efficiency and cost management by utilities in regions outside of ISOs and RTOs Higher resource availability can result in the commitment of fewer peak resources (or the importation of peak supplies) that potentially have high costs thereby resulting in reduced costs o Transmission System Availability This metric measures interrupted load MWh as a percentage of load served In light of the many factors that can result in load interruptions some of which are beyond the control of utilities the narrative detailing the reasons for load interruptions will be essential in assessing performance No comments were submitted on this metric p Fuel Diversity
This metric is defined to be the percentage mix of fuel types installed and available (capacity fuel diversity) and produced (generation fuel diversity) Fuel diversity provides an indication of a utilityrsquos capability to integrate fuels with different characteristics such as lower costs or lower environmental impacts No comments were submitted on this metric
32
20121015-4003 FERC PDF (Unofficial) 10152012
Docket No AD12-8-000
q Clean Energy i Performance Metric
These metrics measure the use of ldquoclean energyrdquo74 The metrics track number of MWh of clean energy by resource type as a percentage of total energy and the number of MW of clean energy by resource type as a percentage of total capacity
ii Comments NIPPC states that the Commission should expand the clean energy metric to include information related to curtailments of clean energy resources as frequent curtailments of these resources by a transmission operator may reflect a dysfunction in the generation market since these resources have no fuel costs NIPPC explains that the metric should include the number of curtailments the duration of each curtailment the number of MW hours curtailed and the justification for the curtailment75 iii Response Commission Staff does not consider curtailments of clean energy to be a measure of the diversity of a utilityrsquos resource mix Rather curtailments of resources ndash or more accurately schedule adjustments or manual redispatch instructions by transmission providers ndash are used to maintain system reliability We note that the diversity metrics in conjunction with the narratives regarding actions taken to manage dispatch reliability and TLR (see pages 18-19 infra) will provide a basis for a comprehensive view of the issue of clean energy
D Burden Estimate
1 Information Collection Statement In its solicitation for comments Commission Staff estimated the public reporting
burden for participating utilities to be approximately 140 hours per respondent for each report
74 Clean Energy is defined to include nuclear energy and variable energy
resources including solar wind hydro geothermal and biomass resources
75 NIPPC Comments at 6
33
20121015-4003 FERC PDF (Unofficial) 10152012
Docket No AD12-8-000
2 Comment EEI asserts that the response time could be as high as 300-400 hours
3 Response
Commission Staff will adjust the burden estimate based on EEIrsquos high estimate of 300-400 hours Commission Staff considers EEIrsquos estimate to be reflective of the most time that it would take an entity to respond to the metrics While Commission Staff recognizes that this report requires additional metrics and narrative discussions Commission Staff nevertheless continues to conclude that 140 hours still represents a reasonable estimate of the burden since much of the data required should be readily available to the responding utilities However in recognition of the fact that the burden will vary from entity to entity we will revise our estimate to 245 hours per respondent which is the mid-point between these estimates
E Information Collection Statement Information Collection Statement
The following collection of information contained in these metrics is subject to
review by the Office of Management and Budget (OMB) under section 3507 of the Paperwork Reduction Act of 199576 OMBrsquos regulations require approval of certain information collection requirements imposed by agency actions77 The Commission cannot conduct this information collection unless it displays a valid OMB control number78
The collection of information requires those public utilities outside of ISOs and RTOs that choose to participate to provide information responding to the attached metrics on a periodic basis This includes the submission of price data and information relating to reliability transmission planning requests for service and system capacity The
76 44 USC sect 3507 (2006) The Paperwork Reduction Act requires OMB
approval of certain information collection activities when these activities apply to 10 or more persons Because it is estimated that 11 entities will respond to this collection the Chairman is requesting approval from OMB
77 5 CFR sect 1320 (2012)
78 The Commission is issuing a separate notice regarding the collection of information that will be published in the Federal Register to comply with the OMB requirements at 5 CFR sect 13205(a)(iv)
34
20121015-4003 FERC PDF (Unofficial) 10152012
Docket No AD12-8-000
information submitted by participating utilities would be used to help develop a common set of metrics for both ISORTO markets and non-RTOISO markets and for evaluating market performance thereafter
35
20121015-4003 FERC PDF (Unofficial) 10152012
Docket No AD12-8-000
Burden Estimate The estimated public reporting burdens for the reporting
requirements have been adjusted as described above
FERC-922 Requirements
Number of Respondents
Annually (1)
Number of
Responses per Respondent
(2)
Average Burden Hours per Response
(3)
Total Annual Burden Hours
(1)x(2)x(3) Metrics Data Collection
140 1540
Write Performance Analysis
85 935
Management Review
11 1
20 220
Total 245 2695
Cost to Comply The Chairman has projected the cost of compliance to be $184460 Technical Expertise = $168300 (1540 hours data collection + 935 hours report completion $68 per hour) Management Review = $17160 (220 hours report review $78 per hour) Cost per hour figures are calculated using BLS data79 The technical expertise category factors in the median wage for an engineer analyst attorney and economist The management category factors in the median wage for general and operations managers Based on BLS data80 both cost figures have been adjusted to include benefits (benefits represent 295 percent of the total hourly figure)
Title FERC-922 Non-RTOISO Performance Metrics
Action Proposed Collection
OMB Control No TBD
79 See httpblsgovoescurrentnaics3_221000htm
80 See httpwwwblsgovnewsreleaseececnr0htm
36
20121015-4003 FERC PDF (Unofficial) 10152012
Docket No AD12-8-000
Internal Review The Chairman has reviewed the proposed metrics and has determined that the metrics and data gathered thereunder are necessary These requirements conform to the Commissionrsquos need for efficient information collection communication and management within the energy industry The Chairman is assured by means of internal review that there is specific objective support for the burden estimates associated with the information collection requirements
Interested persons may obtain information on the reporting requirements by contacting the following Federal Energy Regulatory Commission 888 First Street NE Washington DC 20426 [Attention Ellen Brown Office of the Executive Director] e-mail DataClearancefercgov Phone (202) 502-8663 fax (202) 273-0873 Any further comments on the collections of information and the associated burden estimates in this proceeding should be sent to the Commission in this docket and may also be sent to the Office of Information and Regulatory Affairs Office of Management and Budget Washington DC 20503 [Attention Desk Officer for the Federal Energy Regulatory Commission] For security reasons comments to OMB should be submitted by e-mail to oira_submissionombeopgov Comments submitted to OMB should include Docket Number AD12-8-000 and FERC-922
37
20121015-4003 FERC PDF (Unofficial) 10152012
Docket No AD12-8-000
38
IV Appendix
20121015-4003 FERC PDF (Unofficial) 10152012
Docket No AD12-8-000 39
Performance Metric Specific Metric(s) Reliability A National or Regional
Reliability Standards Compliance
1 References to which Electricity Reliability Organization (ERO) and Regional Reliability Organization (RRO) standards are applicable 2 Number of violations self-reported and made public by NERCFERC 3 Number of violations identified and made public as RRO or ERO audit findings 4 Total number of violations made public by NERCFERC 5 Severity level of each violation made public by NERCFERC 6 Compliance with operating reserve standards 7 Unserved energy (or load shedding) caused by violations Additional detail will be provided on (1) number of events (2) duration of the events (3) whether the events occurred during onoff-peak hours (4) additional information on equipment types affected and kV of lines affected and (5) number of events (and severity and duration of events) resulting in load shedding based on the utilization of TPL-002 Footnote b criteria Items 2-7 Track the ISORTO definition ldquoThis metric is a quantification of all NERC and RRO Reliability Standards violations that have been identified during an audit or as a result of an ISORTO self-report and have been published as part of that processrdquo Non ndashISORTO utilities should limit reporting to the same eight functional areas used by the ISORTOs 1 Balancing Authority 7 Transmission Planner 2 Interchange Authority 8 Transmission Service Provider 3 Planning Authority 4 Reliability Coordinator 5 Resource Planner 6 Transmission Operator
20121015-4003 FERC PDF (Unofficial) 10152012
Docket No AD12-8-000 40
B Dispatch Reliability 1 Balance Authority Ace Limit (BAAL) OR CPS1 and CPS2
2 Number of hours of transmission load reliefs (of severity level 3 or higher) called by the incumbent transmission provider or unscheduled flows
WECC entities will report events under the WECC Unscheduled Flow Mitigation Procedure (equivalent to the NERC TLR Level three)
3 Energy Management System (EMS) availability C Operational Planning ndash
Load Forecast Accuracy Actual peak load as a percentage variance from forecasted peak load as reported in OASIS
D Wind Forecasting Accuracy
Actual wind availability compared to forecasted wind availability
E Unscheduled Flows Difference between net actual interchange (actual measured power flow in real time) and the net scheduled interchange in megawatt hours Reported in Form 714
F Transmission Outage Coordination
1 Percentage of ge 200 kV planned outages of 5 days or more for which utility notified customers at least 1 month prior to the outage commencement date 2 Percentage of ge 200kV outages cancelled by utility after having been previously approved 3 Report information posted on OASIS (percentage of outages planned and unplanned with less than 2 days notice)
20121015-4003 FERC PDF (Unofficial) 10152012
Docket No AD12-8-000 41
G Long-Term Reliability Planning ndash Transmission
Dollar amount and number of facilities approved to be constructed for reliability purposes
2 Percentage of approved construction on schedule and completed
3 Performance of planning process related to
a Requests for and number of completed reliability studies
b Requests and number of completed economic studies
Discussion of stakeholder process and identification of stakeholder groups participating
H Long-Term Reliability
Planning ndash Resources 1 Processing time for generation interconnection requests 2 Actual reserve margins compared with planned reserve margins 3 Explanation of the nature and characteristics of demand response programs and how they are used in system planning Discussion of programs to facilitate the integration of renewable resources and to mitigate any issues and uncertainty associated with scheduling renewable resources
20121015-4003 FERC PDF (Unofficial) 10152012
Docket No AD12-8-000 42
I Infrastructure Investment ndash Interconnection and Transmission Process Metrics
1 Number of requests
2 Number of studies completed
3 Average age of incomplete studies
4 Average time for completed studies
5 Total cost and types of studies completed (eg feasibility study system impact study and facility study)
6 Number of transmission access denialstransmission service requests (TSRs) denied
J Special Protection
Systems 1 Number of special protection systems
2 Percentage of special protection systems that responded as designed when activated
Applicable pool of special protection systems should be based on how the reporting entityrsquos Regional Entity defines ldquospecial protection systemsrdquo
3 Number of unintended activations
20121015-4003 FERC PDF (Unofficial) 10152012
Docket No AD12-8-000 43
System Operations Measures A Demand Response Comprehensive explanation of the nature of utility demand response programs
implemented for load management as well as in compliance with state requirements B System Lambda System Lambda (on marginal unit)
Proposed System Lambda metric would not apply to utilities where the
marginal price is typically set by hydro units System lambda data will be based on Form 714 information
C Congestion Management Congestion analysis per Order No 890 D Resource Availability 1 - System forced outage rate as measured over 12 months E Transmission System
Availability Interrupted load megawatt hours as a percentage of load served
F Fuel Diversity Fuel diversity in terms of energy installed capacity and actual production G Clean Energy 1 Clean Energy megawatt hours by resource type as a percentage of total energy
2 Clean Energy megawatts by resource type as a percentage of total capacity Organizational Effectiveness Not applicable to non-RTO
entities
20121015-4003 FERC PDF (Unofficial) 10152012
Document Content(s)
Staff Report Non-RTO Metrics Final1015 2PDF1-43
20121015-4003 FERC PDF (Unofficial) 10152012
- Staff Report Non-RTO Metrics Final1015 2PDF
- Document Content(s)
-

Docket No AD12-8-000
providers have inherent incentives to discriminate and underperform when performing this function Multiple TDUs state that the Commission has recognized as much and that such a metric would help measure the efficacy of the remedies that the Commission adopted in Order No 890 to address this concern61 Second the economic costs of transmission constraints are not transparent in areas without centralized markets like those found in ISOs and RTOs with congestion pricing Third more specificity is needed because a vertically-integrated transmission owner reporting on transmission construction and identifying shortfalls would be identifying its own unsuccessful outcomes62 Multiple TDUs argue that merely requiring vertically-integrated transmission providers to provide a narrative detailing their economic studies process as is proposed will elicit little more than a repetition of the planning process descriptions that were filed in compliance with Order No 890 For these reasons Multiple TDUs argue that the transmission planning and construction metric should be expanded to include the dollar amount of facilities constructed for purposes whose predominant purpose was not reliability broken down between (a) economic (b) public policy (c) facilities to support the planned generation resources of the transmission provider or its affiliates (d) transmission or interconnection requests made by the transmission provider or its affiliates and (e) in response to requests from others Multiple TDUs state that the metrics should also include the number of transmission construction projects that were added to the transmission provider construction plans between the issuance of Order No 890 and the submission of the report broken down into categories (a) through (e) and into their current status (ie completed incomplete and on schedule incomplete and behind schedule and removed from plan) EEI argues that the Multiple TDUsrsquo request is unwarranted EEI maintains that due to the low incidence of economic study requests requiring such additional reporting will create an added and unnecessary burden to reporting utilities63 Multiple TDUs also state that the metric should include a narrative assessment supported by quantitative information of the transmission providerrsquos planning process efficacy64 Similarly EPSA argues that the performance metrics should include a metric
61 Multiple TDUs Comments at 6 (citing Order No 890 FERC Stats amp Regs para
31241) 62 Id at 6-7
63 EEI Reply Comments at 4
64 Multiple TDUs Comments at 7-8
25
20121015-4003 FERC PDF (Unofficial) 10152012
Docket No AD12-8-000
detailing how well a utility executes its transmission development plans EPSA explains that a utilityrsquos failure to follow its transmission plan can adversely impact customers and merchant generators Thus EPSA maintains that a metric assessing how well a utility executes its transmission plan would provide valuable information including a demonstration of how prepared a utility is to meet any future reliability needs on its system65 iii Response
Commission Staff does not recommend adding the metrics proposed by Multiple TDUs on non-reliability transmission and interconnection projects The purpose of this metric is to assess the extent to which transmission solutions are analyzed planned and deployed to meet reliability requirements Thus additional information to examine discrimination by utilities or to obtain information on all project spending including projects to meet public policy objectives would go beyond the scope of the metric The congestion issues of concern to Multiple TDUs including the impact of transmission planning on congestion are discussed further below in the Congestion Management metric
Commission Staff agrees with commenters that additional information is needed
however in the transmission planning metrics to provide a more comprehensive assessment of transmission planning performance and to allow for comparisons between ISOs and RTOs and participating utilities in regions outside of ISOs and RTOs Accordingly Commission Staff recommends additional information be included in the metrics as follows (1) the proposed dollar amount of facilities approved to be constructed for reliability purposes should be revised to also include the number of facilities so that this metric is comparable to the relevant ISORTO performance metric (2) the proposed percentage of approved construction completed metric should be revised to the percentage of approved construction on schedule and completed and (3) the proposed narrative detailing the economic studies process should be revised to a metric that measures the percentage completion of economic projects
Responding to EEI Commission Staff does not find that it would be unduly
burdensome to incorporate both the number of economic study requests and the number of economic studies accomplished into a narrative explanation of the status of planning for economic expansions Economic projects can reduce congestion which in turn can reduce costs to customers and decrease the likelihood that reliability issues will occur Therefore this information provides an important indicator on the progress made by utilities in improving the efficiency of their transmission systems
65 EPSA Comments at 7
26
20121015-4003 FERC PDF (Unofficial) 10152012
Docket No AD12-8-000
Commission Staff agrees with EPSA that the reports provided by participating utilities should also include a discussion of the status of their transmission plans Such information will allow participating utilities to explain their progress in meeting planning goals and explain the issues that may be delaying the completion of reliability and economic projects Commission Staff expects that this discussion will also address the desire of Multiple TDUs to have a narrative assessment of the efficacy of the transmission providerrsquos planning process66 and to address how utilities provide an opportunity to consider transmission needs driven by Public Policy Requirements in their planning process67
h Long-Term Reliability Transmission Planning ndash Resources
Three metrics are employed to measure the effectiveness of long-term reliability planning for resources The first metric processing time for generation interconnection requests measures the effectiveness of processes in achieving timely interconnection of new resources that are needed to ensure reliability The second metric the planned reserve margin is the planned number of MW of resources available as system reserves divided by the number of MW of peak load The third metric is a narrative discussion of demand response programs and how they are used in system planning No comments were received on this metric Commission Staff recommends that the proposed planned reserve margin metric be revised to compare the actual reserve margin to the planned reserve margin This comparison will allow for an evaluation of utility performance in achieving the planned reserve margin
i Infrastructure Investment ndash Interconnection and Transmission Process Metrics
i Performance Metric
These metrics track the progress that utilities have made in regions outside of ISOs and RTOs in completing their reliability reviews ndash namely feasibility system impact and
66 We note that this narrative assessment is in keeping with the Commissionrsquos
requirement that public utility transmission providers make available information regarding the status of transmission upgrades identified in their transmission plans See Transmission Planning and Cost Allocation by Transmission Owning and Operating Public Utilities Order No 1000 FERC Stats amp Regs para 31323 at P 159 amp n154 (2011)) order on rehrsquog Order No 1000-A 139 FERC para 61132 (2012)
67 Order No 1000 FERC Stats amp Regs para 31323 at P 203
27
20121015-4003 FERC PDF (Unofficial) 10152012
Docket No AD12-8-000
facility studies ndash of interconnection and transmission service requests in a timely and efficient manner The metrics track the number of requests the time required to complete the reliability reviews and the costs of completing each of the three types of studies There is also a metric that measures the number of transmission access denials and transmission service request denials The purpose of this metric is to provide information on the magnitude and reasons for transmission service denials and whether additional infrastructure investment is needed to avoid transmission service denials ii Comments Multiple TDUs state that the Commission should collect additional information on the completion of transmission studies Multiple TDUs state that while the metrics for ISOs and RTOs require the reporting of information on studies such measures are omitted from the draft metrics for regions outside of ISOs and RTOs without explanation Multiple TDUs argue that such metrics are even more important than in the ISO and RTO context and that it would be worth obtaining from vertically-integrated transmission providers all of the study completion metrics that ISOs and RTOs are required to produce Multiple TDUs explain that the cost of collecting and providing this information should not be inordinate and that transmission providers should already have expense tracking mechanisms in place to estimate and bill study costs Multiple TDUs state that the following additional metrics would be worth collecting from vertically-integrated transmission providers (1) percentages of long-term transmission service requests and interconnection requests that triggered study requirements (2) percentages of the studies undertaken that led to the identification of upgrade costs (3) the average estimated upgrade cost (4) the percent of transmission service requests withdrawn and the percent approved and (5) the average processing time through each process milestone identified in the transmission providerrsquos Order No 890 compliance tariff provisions such as completion of a feasibility study system impact study and facilities study Multiple TDUs claims that such information would help the Commission identify situations in which impediments to obtaining transmission or interconnection service warrant further investigation68 Multiple TDUs state that the addition of a metric concerning the number of transmission access denials or transmission service requests denied is less meaningful than it first appears Multiple TDUs explain that under the pro forma Open Access Transmission Tariff long-term transmission service requests cannot be legitimately denied instead if there is no existing transmission capability available to accommodate the request the requester is supposed to be informed that meeting the request would require additional facilities and offered the opportunity to fund studies to determine what
68 Multiple TDUs Comments at 5
28
20121015-4003 FERC PDF (Unofficial) 10152012
Docket No AD12-8-000
upgrades are needed Multiple TDUs state that a metric tracking how often entities requesting service withdraw their request for service in the face of these requirements would be worthwhile but that the proposed metric might not elicit such information69 Accordingly Multiple TDUs suggest revising the metric to require entities to report the number of long-term transmission service requests for which ATC was initially found to be unavailable and the disposition of each request with each of these points broken down between requests made by third-party transmission customers and requests made by affiliates or divisions of the transmission provider70
NIPPC contends that the Commission should require transmission operators to
report information concerning the pace of large generator interconnections including the total number of pending interconnection requests the number of pending requests in each phase of the LGIA process and the number of requests in each phase that have experienced delays in completing that phase of the interconnection process along with a narrative describing the causes of those delays71 iii Response Commission Staff agrees with Multiple TDUs that the proposed metrics should include information on how long it takes participating utilities to complete interconnection and transmission studies as a measure of the efficiency of the utilityrsquos infrastructure development process Accordingly Commission Staff recommends that the performance metrics be revised to include metrics concerning the average age of incomplete studies and the average time to complete studies Commission Staff considers the time to complete all studies to be an appropriate metric to measure the efficiency of utility interconnection and transmission study processes It is expected that the narrative discussions that accompany the metrics will address issues with the various study stages and that the discussions will address the issues of concern to Multiple TDUs Commission Staff does not consider that information on the percentage of requests that trigger studies or are withdrawn will reflect utility performance The percentage of requests that trigger studies is a function of available transmission capacity not utility performance The percentage of requests withdrawn is caused by the actions of market participants ndash not utilities ndash and therefore does not measure utility performance Therefore we are not recommending the addition of this information to the metrics reports
69 Id at 8
70 Id
71 NIPPC Comments at 4-5
29
20121015-4003 FERC PDF (Unofficial) 10152012
Docket No AD12-8-000
With regard to Multiple TDUsrsquo interest in additional metrics on transmission service denials Commission Staff expects that the narrative discussions provided by participating utilities will address issues of concern to the Multiple TDUs such as the disposition of requests for service Commission Staff notes however that this metric is not intended to measure ATC or transmission capacity in general Rather the purpose of tracking transmission service denials is to provide an additional measure of the efficiency of utilities in processing requests for transmission service and therefore is intended to be evaluated in the context of the other infrastructure investment processing metrics This information combined with explanations provided by the utilities in their narrative discussion will provide the basis for a comprehensive assessment of how utilities are managing their infrastructure development process Commission Staff does not recommend adding a metric concerning the number of pending generation interconnection requests as requested by NIPPC By measuring the time it takes utilities to complete their studies for interconnection and transmission service the proposed metric appropriately focuses on the efficiency of a utilityrsquos processing of service requests ndash irrespective of the total number of requests Also since many interconnection requests in a utilityrsquos interconnection queue may not be ready to proceed because of commercial issues and other factors beyond the control of utilities the number of pending interconnection requests is not an appropriate measure of utility performance As has been the case in the ISORTO performance metrics reports Commission Staff expects that the narrative discussion that accompanies the utility metrics on interconnections and transmission service will explain the status of their request queues and reasons for delays j Special Protection Systems Special Protection Systems72 are automatic protection systems designed to detect abnormal or predetermined system conditions and take corrective actions such as changing demand generation or system configurations in order to maintain system stability acceptable voltage levels or maintain power flows These metrics measure the performance of such Special Protection Systems based on the definition of Special Protection Systems utilized by the reporting entityrsquos Regional Entity These metrics measure both the frequency with which the region relies on these systems and their effectiveness as measured by successful activations and the number of unintended activations No comments were submitted on this metric
72 Special Protection Systems are also referred to as Special Protection Schemes
Remedial Action Schemes (RAS) or System Integrity Protection Schemes (SIPS)
30
20121015-4003 FERC PDF (Unofficial) 10152012
Docket No AD12-8-000
k Demand Response Entities responding to this metric will be required to provide a comprehensive explanation of the nature of utility demand response programs implemented for load management as well as in compliance with state requirements There were no comments on this metric l System Lambda System lambda is the incremental cost of energy of the marginal unit assuming no system constraints This metric tracks the trend in marginal fuel costs and is an important metric since fuel costs represent the largest component of wholesale energy costs The system lambda metric would not apply to utilities where the marginal price is typically set by hydro units Also system lambda data will be based on information contained in FERC Form No 714 There were no comments on this metric m Congestion Management i Performance Metric Congestion represents the cost to customers of paying for more expensive energy because physical transmission line limits do not allow full delivery of least-cost energy Entities responding to this metric would be required to provide a congestion analysis consistent with Order No 890 In Order No 890 the Commission adopted a planning principle requiring transmission providers to prepare studies identifying ldquosignificant and recurringrdquo congestion and post such studies on their OASIS The Commission explained that the studies should analyze and report on the following items (1) the location and magnitude of the congestion (2) possible remedies for the elimination of the congestion in whole or in part (3) the associated costs of congestion and (4) the cost associated with relieving congestion through system enhancements (or other means)73 ii Comments Multiple TDUs argue that merely requiring vertically-integrated transmission providers to provide a narrative detailing their economic study processes as is proposed will elicit little more than a repetition of the planning process descriptions that were filed in compliance with Order No 890
73 Order No 890 FERC Stats amp Regs para 31241 at PP 529 542
31
20121015-4003 FERC PDF (Unofficial) 10152012
Docket No AD12-8-000
iii Response Commission Staff recommends that utilities discuss the status of their transmission plans as explained in the Long-Term Transmission Planning Metrics discussed above Commission Staff expects that these discussions will address expansion plans to resolve congestion issues on their systems Therefore Commission Staff expects that the performance reports submitted by utilities will provide substantive information on congestion management n Resource Availability i Performance Metric
The proposed metric measures the percentage of time that system resources are not available because of unplanned outages as measured by the system forced outage rate No comments were submitted on the metric
ii Response Commission Staff recommends that this metric be revised to be 1 minus the
system forced outage rate Revising the metric as recommended will measure unforced capacity availability and therefore resource availability This revision will also make this metric comparable to the performance metric adopted for ISOs and RTOs Resource availability is an indication of system efficiency and cost management by utilities in regions outside of ISOs and RTOs Higher resource availability can result in the commitment of fewer peak resources (or the importation of peak supplies) that potentially have high costs thereby resulting in reduced costs o Transmission System Availability This metric measures interrupted load MWh as a percentage of load served In light of the many factors that can result in load interruptions some of which are beyond the control of utilities the narrative detailing the reasons for load interruptions will be essential in assessing performance No comments were submitted on this metric p Fuel Diversity
This metric is defined to be the percentage mix of fuel types installed and available (capacity fuel diversity) and produced (generation fuel diversity) Fuel diversity provides an indication of a utilityrsquos capability to integrate fuels with different characteristics such as lower costs or lower environmental impacts No comments were submitted on this metric
32
20121015-4003 FERC PDF (Unofficial) 10152012
Docket No AD12-8-000
q Clean Energy i Performance Metric
These metrics measure the use of ldquoclean energyrdquo74 The metrics track number of MWh of clean energy by resource type as a percentage of total energy and the number of MW of clean energy by resource type as a percentage of total capacity
ii Comments NIPPC states that the Commission should expand the clean energy metric to include information related to curtailments of clean energy resources as frequent curtailments of these resources by a transmission operator may reflect a dysfunction in the generation market since these resources have no fuel costs NIPPC explains that the metric should include the number of curtailments the duration of each curtailment the number of MW hours curtailed and the justification for the curtailment75 iii Response Commission Staff does not consider curtailments of clean energy to be a measure of the diversity of a utilityrsquos resource mix Rather curtailments of resources ndash or more accurately schedule adjustments or manual redispatch instructions by transmission providers ndash are used to maintain system reliability We note that the diversity metrics in conjunction with the narratives regarding actions taken to manage dispatch reliability and TLR (see pages 18-19 infra) will provide a basis for a comprehensive view of the issue of clean energy
D Burden Estimate
1 Information Collection Statement In its solicitation for comments Commission Staff estimated the public reporting
burden for participating utilities to be approximately 140 hours per respondent for each report
74 Clean Energy is defined to include nuclear energy and variable energy
resources including solar wind hydro geothermal and biomass resources
75 NIPPC Comments at 6
33
20121015-4003 FERC PDF (Unofficial) 10152012
Docket No AD12-8-000
2 Comment EEI asserts that the response time could be as high as 300-400 hours
3 Response
Commission Staff will adjust the burden estimate based on EEIrsquos high estimate of 300-400 hours Commission Staff considers EEIrsquos estimate to be reflective of the most time that it would take an entity to respond to the metrics While Commission Staff recognizes that this report requires additional metrics and narrative discussions Commission Staff nevertheless continues to conclude that 140 hours still represents a reasonable estimate of the burden since much of the data required should be readily available to the responding utilities However in recognition of the fact that the burden will vary from entity to entity we will revise our estimate to 245 hours per respondent which is the mid-point between these estimates
E Information Collection Statement Information Collection Statement
The following collection of information contained in these metrics is subject to
review by the Office of Management and Budget (OMB) under section 3507 of the Paperwork Reduction Act of 199576 OMBrsquos regulations require approval of certain information collection requirements imposed by agency actions77 The Commission cannot conduct this information collection unless it displays a valid OMB control number78
The collection of information requires those public utilities outside of ISOs and RTOs that choose to participate to provide information responding to the attached metrics on a periodic basis This includes the submission of price data and information relating to reliability transmission planning requests for service and system capacity The
76 44 USC sect 3507 (2006) The Paperwork Reduction Act requires OMB
approval of certain information collection activities when these activities apply to 10 or more persons Because it is estimated that 11 entities will respond to this collection the Chairman is requesting approval from OMB
77 5 CFR sect 1320 (2012)
78 The Commission is issuing a separate notice regarding the collection of information that will be published in the Federal Register to comply with the OMB requirements at 5 CFR sect 13205(a)(iv)
34
20121015-4003 FERC PDF (Unofficial) 10152012
Docket No AD12-8-000
information submitted by participating utilities would be used to help develop a common set of metrics for both ISORTO markets and non-RTOISO markets and for evaluating market performance thereafter
35
20121015-4003 FERC PDF (Unofficial) 10152012
Docket No AD12-8-000
Burden Estimate The estimated public reporting burdens for the reporting
requirements have been adjusted as described above
FERC-922 Requirements
Number of Respondents
Annually (1)
Number of
Responses per Respondent
(2)
Average Burden Hours per Response
(3)
Total Annual Burden Hours
(1)x(2)x(3) Metrics Data Collection
140 1540
Write Performance Analysis
85 935
Management Review
11 1
20 220
Total 245 2695
Cost to Comply The Chairman has projected the cost of compliance to be $184460 Technical Expertise = $168300 (1540 hours data collection + 935 hours report completion $68 per hour) Management Review = $17160 (220 hours report review $78 per hour) Cost per hour figures are calculated using BLS data79 The technical expertise category factors in the median wage for an engineer analyst attorney and economist The management category factors in the median wage for general and operations managers Based on BLS data80 both cost figures have been adjusted to include benefits (benefits represent 295 percent of the total hourly figure)
Title FERC-922 Non-RTOISO Performance Metrics
Action Proposed Collection
OMB Control No TBD
79 See httpblsgovoescurrentnaics3_221000htm
80 See httpwwwblsgovnewsreleaseececnr0htm
36
20121015-4003 FERC PDF (Unofficial) 10152012
Docket No AD12-8-000
Internal Review The Chairman has reviewed the proposed metrics and has determined that the metrics and data gathered thereunder are necessary These requirements conform to the Commissionrsquos need for efficient information collection communication and management within the energy industry The Chairman is assured by means of internal review that there is specific objective support for the burden estimates associated with the information collection requirements
Interested persons may obtain information on the reporting requirements by contacting the following Federal Energy Regulatory Commission 888 First Street NE Washington DC 20426 [Attention Ellen Brown Office of the Executive Director] e-mail DataClearancefercgov Phone (202) 502-8663 fax (202) 273-0873 Any further comments on the collections of information and the associated burden estimates in this proceeding should be sent to the Commission in this docket and may also be sent to the Office of Information and Regulatory Affairs Office of Management and Budget Washington DC 20503 [Attention Desk Officer for the Federal Energy Regulatory Commission] For security reasons comments to OMB should be submitted by e-mail to oira_submissionombeopgov Comments submitted to OMB should include Docket Number AD12-8-000 and FERC-922
37
20121015-4003 FERC PDF (Unofficial) 10152012
Docket No AD12-8-000
38
IV Appendix
20121015-4003 FERC PDF (Unofficial) 10152012
Docket No AD12-8-000 39
Performance Metric Specific Metric(s) Reliability A National or Regional
Reliability Standards Compliance
1 References to which Electricity Reliability Organization (ERO) and Regional Reliability Organization (RRO) standards are applicable 2 Number of violations self-reported and made public by NERCFERC 3 Number of violations identified and made public as RRO or ERO audit findings 4 Total number of violations made public by NERCFERC 5 Severity level of each violation made public by NERCFERC 6 Compliance with operating reserve standards 7 Unserved energy (or load shedding) caused by violations Additional detail will be provided on (1) number of events (2) duration of the events (3) whether the events occurred during onoff-peak hours (4) additional information on equipment types affected and kV of lines affected and (5) number of events (and severity and duration of events) resulting in load shedding based on the utilization of TPL-002 Footnote b criteria Items 2-7 Track the ISORTO definition ldquoThis metric is a quantification of all NERC and RRO Reliability Standards violations that have been identified during an audit or as a result of an ISORTO self-report and have been published as part of that processrdquo Non ndashISORTO utilities should limit reporting to the same eight functional areas used by the ISORTOs 1 Balancing Authority 7 Transmission Planner 2 Interchange Authority 8 Transmission Service Provider 3 Planning Authority 4 Reliability Coordinator 5 Resource Planner 6 Transmission Operator
20121015-4003 FERC PDF (Unofficial) 10152012
Docket No AD12-8-000 40
B Dispatch Reliability 1 Balance Authority Ace Limit (BAAL) OR CPS1 and CPS2
2 Number of hours of transmission load reliefs (of severity level 3 or higher) called by the incumbent transmission provider or unscheduled flows
WECC entities will report events under the WECC Unscheduled Flow Mitigation Procedure (equivalent to the NERC TLR Level three)
3 Energy Management System (EMS) availability C Operational Planning ndash
Load Forecast Accuracy Actual peak load as a percentage variance from forecasted peak load as reported in OASIS
D Wind Forecasting Accuracy
Actual wind availability compared to forecasted wind availability
E Unscheduled Flows Difference between net actual interchange (actual measured power flow in real time) and the net scheduled interchange in megawatt hours Reported in Form 714
F Transmission Outage Coordination
1 Percentage of ge 200 kV planned outages of 5 days or more for which utility notified customers at least 1 month prior to the outage commencement date 2 Percentage of ge 200kV outages cancelled by utility after having been previously approved 3 Report information posted on OASIS (percentage of outages planned and unplanned with less than 2 days notice)
20121015-4003 FERC PDF (Unofficial) 10152012
Docket No AD12-8-000 41
G Long-Term Reliability Planning ndash Transmission
Dollar amount and number of facilities approved to be constructed for reliability purposes
2 Percentage of approved construction on schedule and completed
3 Performance of planning process related to
a Requests for and number of completed reliability studies
b Requests and number of completed economic studies
Discussion of stakeholder process and identification of stakeholder groups participating
H Long-Term Reliability
Planning ndash Resources 1 Processing time for generation interconnection requests 2 Actual reserve margins compared with planned reserve margins 3 Explanation of the nature and characteristics of demand response programs and how they are used in system planning Discussion of programs to facilitate the integration of renewable resources and to mitigate any issues and uncertainty associated with scheduling renewable resources
20121015-4003 FERC PDF (Unofficial) 10152012
Docket No AD12-8-000 42
I Infrastructure Investment ndash Interconnection and Transmission Process Metrics
1 Number of requests
2 Number of studies completed
3 Average age of incomplete studies
4 Average time for completed studies
5 Total cost and types of studies completed (eg feasibility study system impact study and facility study)
6 Number of transmission access denialstransmission service requests (TSRs) denied
J Special Protection
Systems 1 Number of special protection systems
2 Percentage of special protection systems that responded as designed when activated
Applicable pool of special protection systems should be based on how the reporting entityrsquos Regional Entity defines ldquospecial protection systemsrdquo
3 Number of unintended activations
20121015-4003 FERC PDF (Unofficial) 10152012
Docket No AD12-8-000 43
System Operations Measures A Demand Response Comprehensive explanation of the nature of utility demand response programs
implemented for load management as well as in compliance with state requirements B System Lambda System Lambda (on marginal unit)
Proposed System Lambda metric would not apply to utilities where the
marginal price is typically set by hydro units System lambda data will be based on Form 714 information
C Congestion Management Congestion analysis per Order No 890 D Resource Availability 1 - System forced outage rate as measured over 12 months E Transmission System
Availability Interrupted load megawatt hours as a percentage of load served
F Fuel Diversity Fuel diversity in terms of energy installed capacity and actual production G Clean Energy 1 Clean Energy megawatt hours by resource type as a percentage of total energy
2 Clean Energy megawatts by resource type as a percentage of total capacity Organizational Effectiveness Not applicable to non-RTO
entities
20121015-4003 FERC PDF (Unofficial) 10152012
Document Content(s)
Staff Report Non-RTO Metrics Final1015 2PDF1-43
20121015-4003 FERC PDF (Unofficial) 10152012
- Staff Report Non-RTO Metrics Final1015 2PDF
- Document Content(s)
-
Docket No AD12-8-000
detailing how well a utility executes its transmission development plans EPSA explains that a utilityrsquos failure to follow its transmission plan can adversely impact customers and merchant generators Thus EPSA maintains that a metric assessing how well a utility executes its transmission plan would provide valuable information including a demonstration of how prepared a utility is to meet any future reliability needs on its system65 iii Response
Commission Staff does not recommend adding the metrics proposed by Multiple TDUs on non-reliability transmission and interconnection projects The purpose of this metric is to assess the extent to which transmission solutions are analyzed planned and deployed to meet reliability requirements Thus additional information to examine discrimination by utilities or to obtain information on all project spending including projects to meet public policy objectives would go beyond the scope of the metric The congestion issues of concern to Multiple TDUs including the impact of transmission planning on congestion are discussed further below in the Congestion Management metric
Commission Staff agrees with commenters that additional information is needed
however in the transmission planning metrics to provide a more comprehensive assessment of transmission planning performance and to allow for comparisons between ISOs and RTOs and participating utilities in regions outside of ISOs and RTOs Accordingly Commission Staff recommends additional information be included in the metrics as follows (1) the proposed dollar amount of facilities approved to be constructed for reliability purposes should be revised to also include the number of facilities so that this metric is comparable to the relevant ISORTO performance metric (2) the proposed percentage of approved construction completed metric should be revised to the percentage of approved construction on schedule and completed and (3) the proposed narrative detailing the economic studies process should be revised to a metric that measures the percentage completion of economic projects
Responding to EEI Commission Staff does not find that it would be unduly
burdensome to incorporate both the number of economic study requests and the number of economic studies accomplished into a narrative explanation of the status of planning for economic expansions Economic projects can reduce congestion which in turn can reduce costs to customers and decrease the likelihood that reliability issues will occur Therefore this information provides an important indicator on the progress made by utilities in improving the efficiency of their transmission systems
65 EPSA Comments at 7
26
20121015-4003 FERC PDF (Unofficial) 10152012
Docket No AD12-8-000
Commission Staff agrees with EPSA that the reports provided by participating utilities should also include a discussion of the status of their transmission plans Such information will allow participating utilities to explain their progress in meeting planning goals and explain the issues that may be delaying the completion of reliability and economic projects Commission Staff expects that this discussion will also address the desire of Multiple TDUs to have a narrative assessment of the efficacy of the transmission providerrsquos planning process66 and to address how utilities provide an opportunity to consider transmission needs driven by Public Policy Requirements in their planning process67
h Long-Term Reliability Transmission Planning ndash Resources
Three metrics are employed to measure the effectiveness of long-term reliability planning for resources The first metric processing time for generation interconnection requests measures the effectiveness of processes in achieving timely interconnection of new resources that are needed to ensure reliability The second metric the planned reserve margin is the planned number of MW of resources available as system reserves divided by the number of MW of peak load The third metric is a narrative discussion of demand response programs and how they are used in system planning No comments were received on this metric Commission Staff recommends that the proposed planned reserve margin metric be revised to compare the actual reserve margin to the planned reserve margin This comparison will allow for an evaluation of utility performance in achieving the planned reserve margin
i Infrastructure Investment ndash Interconnection and Transmission Process Metrics
i Performance Metric
These metrics track the progress that utilities have made in regions outside of ISOs and RTOs in completing their reliability reviews ndash namely feasibility system impact and
66 We note that this narrative assessment is in keeping with the Commissionrsquos
requirement that public utility transmission providers make available information regarding the status of transmission upgrades identified in their transmission plans See Transmission Planning and Cost Allocation by Transmission Owning and Operating Public Utilities Order No 1000 FERC Stats amp Regs para 31323 at P 159 amp n154 (2011)) order on rehrsquog Order No 1000-A 139 FERC para 61132 (2012)
67 Order No 1000 FERC Stats amp Regs para 31323 at P 203
27
20121015-4003 FERC PDF (Unofficial) 10152012
Docket No AD12-8-000
facility studies ndash of interconnection and transmission service requests in a timely and efficient manner The metrics track the number of requests the time required to complete the reliability reviews and the costs of completing each of the three types of studies There is also a metric that measures the number of transmission access denials and transmission service request denials The purpose of this metric is to provide information on the magnitude and reasons for transmission service denials and whether additional infrastructure investment is needed to avoid transmission service denials ii Comments Multiple TDUs state that the Commission should collect additional information on the completion of transmission studies Multiple TDUs state that while the metrics for ISOs and RTOs require the reporting of information on studies such measures are omitted from the draft metrics for regions outside of ISOs and RTOs without explanation Multiple TDUs argue that such metrics are even more important than in the ISO and RTO context and that it would be worth obtaining from vertically-integrated transmission providers all of the study completion metrics that ISOs and RTOs are required to produce Multiple TDUs explain that the cost of collecting and providing this information should not be inordinate and that transmission providers should already have expense tracking mechanisms in place to estimate and bill study costs Multiple TDUs state that the following additional metrics would be worth collecting from vertically-integrated transmission providers (1) percentages of long-term transmission service requests and interconnection requests that triggered study requirements (2) percentages of the studies undertaken that led to the identification of upgrade costs (3) the average estimated upgrade cost (4) the percent of transmission service requests withdrawn and the percent approved and (5) the average processing time through each process milestone identified in the transmission providerrsquos Order No 890 compliance tariff provisions such as completion of a feasibility study system impact study and facilities study Multiple TDUs claims that such information would help the Commission identify situations in which impediments to obtaining transmission or interconnection service warrant further investigation68 Multiple TDUs state that the addition of a metric concerning the number of transmission access denials or transmission service requests denied is less meaningful than it first appears Multiple TDUs explain that under the pro forma Open Access Transmission Tariff long-term transmission service requests cannot be legitimately denied instead if there is no existing transmission capability available to accommodate the request the requester is supposed to be informed that meeting the request would require additional facilities and offered the opportunity to fund studies to determine what
68 Multiple TDUs Comments at 5
28
20121015-4003 FERC PDF (Unofficial) 10152012
Docket No AD12-8-000
upgrades are needed Multiple TDUs state that a metric tracking how often entities requesting service withdraw their request for service in the face of these requirements would be worthwhile but that the proposed metric might not elicit such information69 Accordingly Multiple TDUs suggest revising the metric to require entities to report the number of long-term transmission service requests for which ATC was initially found to be unavailable and the disposition of each request with each of these points broken down between requests made by third-party transmission customers and requests made by affiliates or divisions of the transmission provider70
NIPPC contends that the Commission should require transmission operators to
report information concerning the pace of large generator interconnections including the total number of pending interconnection requests the number of pending requests in each phase of the LGIA process and the number of requests in each phase that have experienced delays in completing that phase of the interconnection process along with a narrative describing the causes of those delays71 iii Response Commission Staff agrees with Multiple TDUs that the proposed metrics should include information on how long it takes participating utilities to complete interconnection and transmission studies as a measure of the efficiency of the utilityrsquos infrastructure development process Accordingly Commission Staff recommends that the performance metrics be revised to include metrics concerning the average age of incomplete studies and the average time to complete studies Commission Staff considers the time to complete all studies to be an appropriate metric to measure the efficiency of utility interconnection and transmission study processes It is expected that the narrative discussions that accompany the metrics will address issues with the various study stages and that the discussions will address the issues of concern to Multiple TDUs Commission Staff does not consider that information on the percentage of requests that trigger studies or are withdrawn will reflect utility performance The percentage of requests that trigger studies is a function of available transmission capacity not utility performance The percentage of requests withdrawn is caused by the actions of market participants ndash not utilities ndash and therefore does not measure utility performance Therefore we are not recommending the addition of this information to the metrics reports
69 Id at 8
70 Id
71 NIPPC Comments at 4-5
29
20121015-4003 FERC PDF (Unofficial) 10152012
Docket No AD12-8-000
With regard to Multiple TDUsrsquo interest in additional metrics on transmission service denials Commission Staff expects that the narrative discussions provided by participating utilities will address issues of concern to the Multiple TDUs such as the disposition of requests for service Commission Staff notes however that this metric is not intended to measure ATC or transmission capacity in general Rather the purpose of tracking transmission service denials is to provide an additional measure of the efficiency of utilities in processing requests for transmission service and therefore is intended to be evaluated in the context of the other infrastructure investment processing metrics This information combined with explanations provided by the utilities in their narrative discussion will provide the basis for a comprehensive assessment of how utilities are managing their infrastructure development process Commission Staff does not recommend adding a metric concerning the number of pending generation interconnection requests as requested by NIPPC By measuring the time it takes utilities to complete their studies for interconnection and transmission service the proposed metric appropriately focuses on the efficiency of a utilityrsquos processing of service requests ndash irrespective of the total number of requests Also since many interconnection requests in a utilityrsquos interconnection queue may not be ready to proceed because of commercial issues and other factors beyond the control of utilities the number of pending interconnection requests is not an appropriate measure of utility performance As has been the case in the ISORTO performance metrics reports Commission Staff expects that the narrative discussion that accompanies the utility metrics on interconnections and transmission service will explain the status of their request queues and reasons for delays j Special Protection Systems Special Protection Systems72 are automatic protection systems designed to detect abnormal or predetermined system conditions and take corrective actions such as changing demand generation or system configurations in order to maintain system stability acceptable voltage levels or maintain power flows These metrics measure the performance of such Special Protection Systems based on the definition of Special Protection Systems utilized by the reporting entityrsquos Regional Entity These metrics measure both the frequency with which the region relies on these systems and their effectiveness as measured by successful activations and the number of unintended activations No comments were submitted on this metric
72 Special Protection Systems are also referred to as Special Protection Schemes
Remedial Action Schemes (RAS) or System Integrity Protection Schemes (SIPS)
30
20121015-4003 FERC PDF (Unofficial) 10152012
Docket No AD12-8-000
k Demand Response Entities responding to this metric will be required to provide a comprehensive explanation of the nature of utility demand response programs implemented for load management as well as in compliance with state requirements There were no comments on this metric l System Lambda System lambda is the incremental cost of energy of the marginal unit assuming no system constraints This metric tracks the trend in marginal fuel costs and is an important metric since fuel costs represent the largest component of wholesale energy costs The system lambda metric would not apply to utilities where the marginal price is typically set by hydro units Also system lambda data will be based on information contained in FERC Form No 714 There were no comments on this metric m Congestion Management i Performance Metric Congestion represents the cost to customers of paying for more expensive energy because physical transmission line limits do not allow full delivery of least-cost energy Entities responding to this metric would be required to provide a congestion analysis consistent with Order No 890 In Order No 890 the Commission adopted a planning principle requiring transmission providers to prepare studies identifying ldquosignificant and recurringrdquo congestion and post such studies on their OASIS The Commission explained that the studies should analyze and report on the following items (1) the location and magnitude of the congestion (2) possible remedies for the elimination of the congestion in whole or in part (3) the associated costs of congestion and (4) the cost associated with relieving congestion through system enhancements (or other means)73 ii Comments Multiple TDUs argue that merely requiring vertically-integrated transmission providers to provide a narrative detailing their economic study processes as is proposed will elicit little more than a repetition of the planning process descriptions that were filed in compliance with Order No 890
73 Order No 890 FERC Stats amp Regs para 31241 at PP 529 542
31
20121015-4003 FERC PDF (Unofficial) 10152012
Docket No AD12-8-000
iii Response Commission Staff recommends that utilities discuss the status of their transmission plans as explained in the Long-Term Transmission Planning Metrics discussed above Commission Staff expects that these discussions will address expansion plans to resolve congestion issues on their systems Therefore Commission Staff expects that the performance reports submitted by utilities will provide substantive information on congestion management n Resource Availability i Performance Metric
The proposed metric measures the percentage of time that system resources are not available because of unplanned outages as measured by the system forced outage rate No comments were submitted on the metric
ii Response Commission Staff recommends that this metric be revised to be 1 minus the
system forced outage rate Revising the metric as recommended will measure unforced capacity availability and therefore resource availability This revision will also make this metric comparable to the performance metric adopted for ISOs and RTOs Resource availability is an indication of system efficiency and cost management by utilities in regions outside of ISOs and RTOs Higher resource availability can result in the commitment of fewer peak resources (or the importation of peak supplies) that potentially have high costs thereby resulting in reduced costs o Transmission System Availability This metric measures interrupted load MWh as a percentage of load served In light of the many factors that can result in load interruptions some of which are beyond the control of utilities the narrative detailing the reasons for load interruptions will be essential in assessing performance No comments were submitted on this metric p Fuel Diversity
This metric is defined to be the percentage mix of fuel types installed and available (capacity fuel diversity) and produced (generation fuel diversity) Fuel diversity provides an indication of a utilityrsquos capability to integrate fuels with different characteristics such as lower costs or lower environmental impacts No comments were submitted on this metric
32
20121015-4003 FERC PDF (Unofficial) 10152012
Docket No AD12-8-000
q Clean Energy i Performance Metric
These metrics measure the use of ldquoclean energyrdquo74 The metrics track number of MWh of clean energy by resource type as a percentage of total energy and the number of MW of clean energy by resource type as a percentage of total capacity
ii Comments NIPPC states that the Commission should expand the clean energy metric to include information related to curtailments of clean energy resources as frequent curtailments of these resources by a transmission operator may reflect a dysfunction in the generation market since these resources have no fuel costs NIPPC explains that the metric should include the number of curtailments the duration of each curtailment the number of MW hours curtailed and the justification for the curtailment75 iii Response Commission Staff does not consider curtailments of clean energy to be a measure of the diversity of a utilityrsquos resource mix Rather curtailments of resources ndash or more accurately schedule adjustments or manual redispatch instructions by transmission providers ndash are used to maintain system reliability We note that the diversity metrics in conjunction with the narratives regarding actions taken to manage dispatch reliability and TLR (see pages 18-19 infra) will provide a basis for a comprehensive view of the issue of clean energy
D Burden Estimate
1 Information Collection Statement In its solicitation for comments Commission Staff estimated the public reporting
burden for participating utilities to be approximately 140 hours per respondent for each report
74 Clean Energy is defined to include nuclear energy and variable energy
resources including solar wind hydro geothermal and biomass resources
75 NIPPC Comments at 6
33
20121015-4003 FERC PDF (Unofficial) 10152012
Docket No AD12-8-000
2 Comment EEI asserts that the response time could be as high as 300-400 hours
3 Response
Commission Staff will adjust the burden estimate based on EEIrsquos high estimate of 300-400 hours Commission Staff considers EEIrsquos estimate to be reflective of the most time that it would take an entity to respond to the metrics While Commission Staff recognizes that this report requires additional metrics and narrative discussions Commission Staff nevertheless continues to conclude that 140 hours still represents a reasonable estimate of the burden since much of the data required should be readily available to the responding utilities However in recognition of the fact that the burden will vary from entity to entity we will revise our estimate to 245 hours per respondent which is the mid-point between these estimates
E Information Collection Statement Information Collection Statement
The following collection of information contained in these metrics is subject to
review by the Office of Management and Budget (OMB) under section 3507 of the Paperwork Reduction Act of 199576 OMBrsquos regulations require approval of certain information collection requirements imposed by agency actions77 The Commission cannot conduct this information collection unless it displays a valid OMB control number78
The collection of information requires those public utilities outside of ISOs and RTOs that choose to participate to provide information responding to the attached metrics on a periodic basis This includes the submission of price data and information relating to reliability transmission planning requests for service and system capacity The
76 44 USC sect 3507 (2006) The Paperwork Reduction Act requires OMB
approval of certain information collection activities when these activities apply to 10 or more persons Because it is estimated that 11 entities will respond to this collection the Chairman is requesting approval from OMB
77 5 CFR sect 1320 (2012)
78 The Commission is issuing a separate notice regarding the collection of information that will be published in the Federal Register to comply with the OMB requirements at 5 CFR sect 13205(a)(iv)
34
20121015-4003 FERC PDF (Unofficial) 10152012
Docket No AD12-8-000
information submitted by participating utilities would be used to help develop a common set of metrics for both ISORTO markets and non-RTOISO markets and for evaluating market performance thereafter
35
20121015-4003 FERC PDF (Unofficial) 10152012
Docket No AD12-8-000
Burden Estimate The estimated public reporting burdens for the reporting
requirements have been adjusted as described above
FERC-922 Requirements
Number of Respondents
Annually (1)
Number of
Responses per Respondent
(2)
Average Burden Hours per Response
(3)
Total Annual Burden Hours
(1)x(2)x(3) Metrics Data Collection
140 1540
Write Performance Analysis
85 935
Management Review
11 1
20 220
Total 245 2695
Cost to Comply The Chairman has projected the cost of compliance to be $184460 Technical Expertise = $168300 (1540 hours data collection + 935 hours report completion $68 per hour) Management Review = $17160 (220 hours report review $78 per hour) Cost per hour figures are calculated using BLS data79 The technical expertise category factors in the median wage for an engineer analyst attorney and economist The management category factors in the median wage for general and operations managers Based on BLS data80 both cost figures have been adjusted to include benefits (benefits represent 295 percent of the total hourly figure)
Title FERC-922 Non-RTOISO Performance Metrics
Action Proposed Collection
OMB Control No TBD
79 See httpblsgovoescurrentnaics3_221000htm
80 See httpwwwblsgovnewsreleaseececnr0htm
36
20121015-4003 FERC PDF (Unofficial) 10152012
Docket No AD12-8-000
Internal Review The Chairman has reviewed the proposed metrics and has determined that the metrics and data gathered thereunder are necessary These requirements conform to the Commissionrsquos need for efficient information collection communication and management within the energy industry The Chairman is assured by means of internal review that there is specific objective support for the burden estimates associated with the information collection requirements
Interested persons may obtain information on the reporting requirements by contacting the following Federal Energy Regulatory Commission 888 First Street NE Washington DC 20426 [Attention Ellen Brown Office of the Executive Director] e-mail DataClearancefercgov Phone (202) 502-8663 fax (202) 273-0873 Any further comments on the collections of information and the associated burden estimates in this proceeding should be sent to the Commission in this docket and may also be sent to the Office of Information and Regulatory Affairs Office of Management and Budget Washington DC 20503 [Attention Desk Officer for the Federal Energy Regulatory Commission] For security reasons comments to OMB should be submitted by e-mail to oira_submissionombeopgov Comments submitted to OMB should include Docket Number AD12-8-000 and FERC-922
37
20121015-4003 FERC PDF (Unofficial) 10152012
Docket No AD12-8-000
38
IV Appendix
20121015-4003 FERC PDF (Unofficial) 10152012
Docket No AD12-8-000 39
Performance Metric Specific Metric(s) Reliability A National or Regional
Reliability Standards Compliance
1 References to which Electricity Reliability Organization (ERO) and Regional Reliability Organization (RRO) standards are applicable 2 Number of violations self-reported and made public by NERCFERC 3 Number of violations identified and made public as RRO or ERO audit findings 4 Total number of violations made public by NERCFERC 5 Severity level of each violation made public by NERCFERC 6 Compliance with operating reserve standards 7 Unserved energy (or load shedding) caused by violations Additional detail will be provided on (1) number of events (2) duration of the events (3) whether the events occurred during onoff-peak hours (4) additional information on equipment types affected and kV of lines affected and (5) number of events (and severity and duration of events) resulting in load shedding based on the utilization of TPL-002 Footnote b criteria Items 2-7 Track the ISORTO definition ldquoThis metric is a quantification of all NERC and RRO Reliability Standards violations that have been identified during an audit or as a result of an ISORTO self-report and have been published as part of that processrdquo Non ndashISORTO utilities should limit reporting to the same eight functional areas used by the ISORTOs 1 Balancing Authority 7 Transmission Planner 2 Interchange Authority 8 Transmission Service Provider 3 Planning Authority 4 Reliability Coordinator 5 Resource Planner 6 Transmission Operator
20121015-4003 FERC PDF (Unofficial) 10152012
Docket No AD12-8-000 40
B Dispatch Reliability 1 Balance Authority Ace Limit (BAAL) OR CPS1 and CPS2
2 Number of hours of transmission load reliefs (of severity level 3 or higher) called by the incumbent transmission provider or unscheduled flows
WECC entities will report events under the WECC Unscheduled Flow Mitigation Procedure (equivalent to the NERC TLR Level three)
3 Energy Management System (EMS) availability C Operational Planning ndash
Load Forecast Accuracy Actual peak load as a percentage variance from forecasted peak load as reported in OASIS
D Wind Forecasting Accuracy
Actual wind availability compared to forecasted wind availability
E Unscheduled Flows Difference between net actual interchange (actual measured power flow in real time) and the net scheduled interchange in megawatt hours Reported in Form 714
F Transmission Outage Coordination
1 Percentage of ge 200 kV planned outages of 5 days or more for which utility notified customers at least 1 month prior to the outage commencement date 2 Percentage of ge 200kV outages cancelled by utility after having been previously approved 3 Report information posted on OASIS (percentage of outages planned and unplanned with less than 2 days notice)
20121015-4003 FERC PDF (Unofficial) 10152012
Docket No AD12-8-000 41
G Long-Term Reliability Planning ndash Transmission
Dollar amount and number of facilities approved to be constructed for reliability purposes
2 Percentage of approved construction on schedule and completed
3 Performance of planning process related to
a Requests for and number of completed reliability studies
b Requests and number of completed economic studies
Discussion of stakeholder process and identification of stakeholder groups participating
H Long-Term Reliability
Planning ndash Resources 1 Processing time for generation interconnection requests 2 Actual reserve margins compared with planned reserve margins 3 Explanation of the nature and characteristics of demand response programs and how they are used in system planning Discussion of programs to facilitate the integration of renewable resources and to mitigate any issues and uncertainty associated with scheduling renewable resources
20121015-4003 FERC PDF (Unofficial) 10152012
Docket No AD12-8-000 42
I Infrastructure Investment ndash Interconnection and Transmission Process Metrics
1 Number of requests
2 Number of studies completed
3 Average age of incomplete studies
4 Average time for completed studies
5 Total cost and types of studies completed (eg feasibility study system impact study and facility study)
6 Number of transmission access denialstransmission service requests (TSRs) denied
J Special Protection
Systems 1 Number of special protection systems
2 Percentage of special protection systems that responded as designed when activated
Applicable pool of special protection systems should be based on how the reporting entityrsquos Regional Entity defines ldquospecial protection systemsrdquo
3 Number of unintended activations
20121015-4003 FERC PDF (Unofficial) 10152012
Docket No AD12-8-000 43
System Operations Measures A Demand Response Comprehensive explanation of the nature of utility demand response programs
implemented for load management as well as in compliance with state requirements B System Lambda System Lambda (on marginal unit)
Proposed System Lambda metric would not apply to utilities where the
marginal price is typically set by hydro units System lambda data will be based on Form 714 information
C Congestion Management Congestion analysis per Order No 890 D Resource Availability 1 - System forced outage rate as measured over 12 months E Transmission System
Availability Interrupted load megawatt hours as a percentage of load served
F Fuel Diversity Fuel diversity in terms of energy installed capacity and actual production G Clean Energy 1 Clean Energy megawatt hours by resource type as a percentage of total energy
2 Clean Energy megawatts by resource type as a percentage of total capacity Organizational Effectiveness Not applicable to non-RTO
entities
20121015-4003 FERC PDF (Unofficial) 10152012
Document Content(s)
Staff Report Non-RTO Metrics Final1015 2PDF1-43
20121015-4003 FERC PDF (Unofficial) 10152012
- Staff Report Non-RTO Metrics Final1015 2PDF
- Document Content(s)
-

Docket No AD12-8-000
Commission Staff agrees with EPSA that the reports provided by participating utilities should also include a discussion of the status of their transmission plans Such information will allow participating utilities to explain their progress in meeting planning goals and explain the issues that may be delaying the completion of reliability and economic projects Commission Staff expects that this discussion will also address the desire of Multiple TDUs to have a narrative assessment of the efficacy of the transmission providerrsquos planning process66 and to address how utilities provide an opportunity to consider transmission needs driven by Public Policy Requirements in their planning process67
h Long-Term Reliability Transmission Planning ndash Resources
Three metrics are employed to measure the effectiveness of long-term reliability planning for resources The first metric processing time for generation interconnection requests measures the effectiveness of processes in achieving timely interconnection of new resources that are needed to ensure reliability The second metric the planned reserve margin is the planned number of MW of resources available as system reserves divided by the number of MW of peak load The third metric is a narrative discussion of demand response programs and how they are used in system planning No comments were received on this metric Commission Staff recommends that the proposed planned reserve margin metric be revised to compare the actual reserve margin to the planned reserve margin This comparison will allow for an evaluation of utility performance in achieving the planned reserve margin
i Infrastructure Investment ndash Interconnection and Transmission Process Metrics
i Performance Metric
These metrics track the progress that utilities have made in regions outside of ISOs and RTOs in completing their reliability reviews ndash namely feasibility system impact and
66 We note that this narrative assessment is in keeping with the Commissionrsquos
requirement that public utility transmission providers make available information regarding the status of transmission upgrades identified in their transmission plans See Transmission Planning and Cost Allocation by Transmission Owning and Operating Public Utilities Order No 1000 FERC Stats amp Regs para 31323 at P 159 amp n154 (2011)) order on rehrsquog Order No 1000-A 139 FERC para 61132 (2012)
67 Order No 1000 FERC Stats amp Regs para 31323 at P 203
27
20121015-4003 FERC PDF (Unofficial) 10152012
Docket No AD12-8-000
facility studies ndash of interconnection and transmission service requests in a timely and efficient manner The metrics track the number of requests the time required to complete the reliability reviews and the costs of completing each of the three types of studies There is also a metric that measures the number of transmission access denials and transmission service request denials The purpose of this metric is to provide information on the magnitude and reasons for transmission service denials and whether additional infrastructure investment is needed to avoid transmission service denials ii Comments Multiple TDUs state that the Commission should collect additional information on the completion of transmission studies Multiple TDUs state that while the metrics for ISOs and RTOs require the reporting of information on studies such measures are omitted from the draft metrics for regions outside of ISOs and RTOs without explanation Multiple TDUs argue that such metrics are even more important than in the ISO and RTO context and that it would be worth obtaining from vertically-integrated transmission providers all of the study completion metrics that ISOs and RTOs are required to produce Multiple TDUs explain that the cost of collecting and providing this information should not be inordinate and that transmission providers should already have expense tracking mechanisms in place to estimate and bill study costs Multiple TDUs state that the following additional metrics would be worth collecting from vertically-integrated transmission providers (1) percentages of long-term transmission service requests and interconnection requests that triggered study requirements (2) percentages of the studies undertaken that led to the identification of upgrade costs (3) the average estimated upgrade cost (4) the percent of transmission service requests withdrawn and the percent approved and (5) the average processing time through each process milestone identified in the transmission providerrsquos Order No 890 compliance tariff provisions such as completion of a feasibility study system impact study and facilities study Multiple TDUs claims that such information would help the Commission identify situations in which impediments to obtaining transmission or interconnection service warrant further investigation68 Multiple TDUs state that the addition of a metric concerning the number of transmission access denials or transmission service requests denied is less meaningful than it first appears Multiple TDUs explain that under the pro forma Open Access Transmission Tariff long-term transmission service requests cannot be legitimately denied instead if there is no existing transmission capability available to accommodate the request the requester is supposed to be informed that meeting the request would require additional facilities and offered the opportunity to fund studies to determine what
68 Multiple TDUs Comments at 5
28
20121015-4003 FERC PDF (Unofficial) 10152012
Docket No AD12-8-000
upgrades are needed Multiple TDUs state that a metric tracking how often entities requesting service withdraw their request for service in the face of these requirements would be worthwhile but that the proposed metric might not elicit such information69 Accordingly Multiple TDUs suggest revising the metric to require entities to report the number of long-term transmission service requests for which ATC was initially found to be unavailable and the disposition of each request with each of these points broken down between requests made by third-party transmission customers and requests made by affiliates or divisions of the transmission provider70
NIPPC contends that the Commission should require transmission operators to
report information concerning the pace of large generator interconnections including the total number of pending interconnection requests the number of pending requests in each phase of the LGIA process and the number of requests in each phase that have experienced delays in completing that phase of the interconnection process along with a narrative describing the causes of those delays71 iii Response Commission Staff agrees with Multiple TDUs that the proposed metrics should include information on how long it takes participating utilities to complete interconnection and transmission studies as a measure of the efficiency of the utilityrsquos infrastructure development process Accordingly Commission Staff recommends that the performance metrics be revised to include metrics concerning the average age of incomplete studies and the average time to complete studies Commission Staff considers the time to complete all studies to be an appropriate metric to measure the efficiency of utility interconnection and transmission study processes It is expected that the narrative discussions that accompany the metrics will address issues with the various study stages and that the discussions will address the issues of concern to Multiple TDUs Commission Staff does not consider that information on the percentage of requests that trigger studies or are withdrawn will reflect utility performance The percentage of requests that trigger studies is a function of available transmission capacity not utility performance The percentage of requests withdrawn is caused by the actions of market participants ndash not utilities ndash and therefore does not measure utility performance Therefore we are not recommending the addition of this information to the metrics reports
69 Id at 8
70 Id
71 NIPPC Comments at 4-5
29
20121015-4003 FERC PDF (Unofficial) 10152012
Docket No AD12-8-000
With regard to Multiple TDUsrsquo interest in additional metrics on transmission service denials Commission Staff expects that the narrative discussions provided by participating utilities will address issues of concern to the Multiple TDUs such as the disposition of requests for service Commission Staff notes however that this metric is not intended to measure ATC or transmission capacity in general Rather the purpose of tracking transmission service denials is to provide an additional measure of the efficiency of utilities in processing requests for transmission service and therefore is intended to be evaluated in the context of the other infrastructure investment processing metrics This information combined with explanations provided by the utilities in their narrative discussion will provide the basis for a comprehensive assessment of how utilities are managing their infrastructure development process Commission Staff does not recommend adding a metric concerning the number of pending generation interconnection requests as requested by NIPPC By measuring the time it takes utilities to complete their studies for interconnection and transmission service the proposed metric appropriately focuses on the efficiency of a utilityrsquos processing of service requests ndash irrespective of the total number of requests Also since many interconnection requests in a utilityrsquos interconnection queue may not be ready to proceed because of commercial issues and other factors beyond the control of utilities the number of pending interconnection requests is not an appropriate measure of utility performance As has been the case in the ISORTO performance metrics reports Commission Staff expects that the narrative discussion that accompanies the utility metrics on interconnections and transmission service will explain the status of their request queues and reasons for delays j Special Protection Systems Special Protection Systems72 are automatic protection systems designed to detect abnormal or predetermined system conditions and take corrective actions such as changing demand generation or system configurations in order to maintain system stability acceptable voltage levels or maintain power flows These metrics measure the performance of such Special Protection Systems based on the definition of Special Protection Systems utilized by the reporting entityrsquos Regional Entity These metrics measure both the frequency with which the region relies on these systems and their effectiveness as measured by successful activations and the number of unintended activations No comments were submitted on this metric
72 Special Protection Systems are also referred to as Special Protection Schemes
Remedial Action Schemes (RAS) or System Integrity Protection Schemes (SIPS)
30
20121015-4003 FERC PDF (Unofficial) 10152012
Docket No AD12-8-000
k Demand Response Entities responding to this metric will be required to provide a comprehensive explanation of the nature of utility demand response programs implemented for load management as well as in compliance with state requirements There were no comments on this metric l System Lambda System lambda is the incremental cost of energy of the marginal unit assuming no system constraints This metric tracks the trend in marginal fuel costs and is an important metric since fuel costs represent the largest component of wholesale energy costs The system lambda metric would not apply to utilities where the marginal price is typically set by hydro units Also system lambda data will be based on information contained in FERC Form No 714 There were no comments on this metric m Congestion Management i Performance Metric Congestion represents the cost to customers of paying for more expensive energy because physical transmission line limits do not allow full delivery of least-cost energy Entities responding to this metric would be required to provide a congestion analysis consistent with Order No 890 In Order No 890 the Commission adopted a planning principle requiring transmission providers to prepare studies identifying ldquosignificant and recurringrdquo congestion and post such studies on their OASIS The Commission explained that the studies should analyze and report on the following items (1) the location and magnitude of the congestion (2) possible remedies for the elimination of the congestion in whole or in part (3) the associated costs of congestion and (4) the cost associated with relieving congestion through system enhancements (or other means)73 ii Comments Multiple TDUs argue that merely requiring vertically-integrated transmission providers to provide a narrative detailing their economic study processes as is proposed will elicit little more than a repetition of the planning process descriptions that were filed in compliance with Order No 890
73 Order No 890 FERC Stats amp Regs para 31241 at PP 529 542
31
20121015-4003 FERC PDF (Unofficial) 10152012
Docket No AD12-8-000
iii Response Commission Staff recommends that utilities discuss the status of their transmission plans as explained in the Long-Term Transmission Planning Metrics discussed above Commission Staff expects that these discussions will address expansion plans to resolve congestion issues on their systems Therefore Commission Staff expects that the performance reports submitted by utilities will provide substantive information on congestion management n Resource Availability i Performance Metric
The proposed metric measures the percentage of time that system resources are not available because of unplanned outages as measured by the system forced outage rate No comments were submitted on the metric
ii Response Commission Staff recommends that this metric be revised to be 1 minus the
system forced outage rate Revising the metric as recommended will measure unforced capacity availability and therefore resource availability This revision will also make this metric comparable to the performance metric adopted for ISOs and RTOs Resource availability is an indication of system efficiency and cost management by utilities in regions outside of ISOs and RTOs Higher resource availability can result in the commitment of fewer peak resources (or the importation of peak supplies) that potentially have high costs thereby resulting in reduced costs o Transmission System Availability This metric measures interrupted load MWh as a percentage of load served In light of the many factors that can result in load interruptions some of which are beyond the control of utilities the narrative detailing the reasons for load interruptions will be essential in assessing performance No comments were submitted on this metric p Fuel Diversity
This metric is defined to be the percentage mix of fuel types installed and available (capacity fuel diversity) and produced (generation fuel diversity) Fuel diversity provides an indication of a utilityrsquos capability to integrate fuels with different characteristics such as lower costs or lower environmental impacts No comments were submitted on this metric
32
20121015-4003 FERC PDF (Unofficial) 10152012
Docket No AD12-8-000
q Clean Energy i Performance Metric
These metrics measure the use of ldquoclean energyrdquo74 The metrics track number of MWh of clean energy by resource type as a percentage of total energy and the number of MW of clean energy by resource type as a percentage of total capacity
ii Comments NIPPC states that the Commission should expand the clean energy metric to include information related to curtailments of clean energy resources as frequent curtailments of these resources by a transmission operator may reflect a dysfunction in the generation market since these resources have no fuel costs NIPPC explains that the metric should include the number of curtailments the duration of each curtailment the number of MW hours curtailed and the justification for the curtailment75 iii Response Commission Staff does not consider curtailments of clean energy to be a measure of the diversity of a utilityrsquos resource mix Rather curtailments of resources ndash or more accurately schedule adjustments or manual redispatch instructions by transmission providers ndash are used to maintain system reliability We note that the diversity metrics in conjunction with the narratives regarding actions taken to manage dispatch reliability and TLR (see pages 18-19 infra) will provide a basis for a comprehensive view of the issue of clean energy
D Burden Estimate
1 Information Collection Statement In its solicitation for comments Commission Staff estimated the public reporting
burden for participating utilities to be approximately 140 hours per respondent for each report
74 Clean Energy is defined to include nuclear energy and variable energy
resources including solar wind hydro geothermal and biomass resources
75 NIPPC Comments at 6
33
20121015-4003 FERC PDF (Unofficial) 10152012
Docket No AD12-8-000
2 Comment EEI asserts that the response time could be as high as 300-400 hours
3 Response
Commission Staff will adjust the burden estimate based on EEIrsquos high estimate of 300-400 hours Commission Staff considers EEIrsquos estimate to be reflective of the most time that it would take an entity to respond to the metrics While Commission Staff recognizes that this report requires additional metrics and narrative discussions Commission Staff nevertheless continues to conclude that 140 hours still represents a reasonable estimate of the burden since much of the data required should be readily available to the responding utilities However in recognition of the fact that the burden will vary from entity to entity we will revise our estimate to 245 hours per respondent which is the mid-point between these estimates
E Information Collection Statement Information Collection Statement
The following collection of information contained in these metrics is subject to
review by the Office of Management and Budget (OMB) under section 3507 of the Paperwork Reduction Act of 199576 OMBrsquos regulations require approval of certain information collection requirements imposed by agency actions77 The Commission cannot conduct this information collection unless it displays a valid OMB control number78
The collection of information requires those public utilities outside of ISOs and RTOs that choose to participate to provide information responding to the attached metrics on a periodic basis This includes the submission of price data and information relating to reliability transmission planning requests for service and system capacity The
76 44 USC sect 3507 (2006) The Paperwork Reduction Act requires OMB
approval of certain information collection activities when these activities apply to 10 or more persons Because it is estimated that 11 entities will respond to this collection the Chairman is requesting approval from OMB
77 5 CFR sect 1320 (2012)
78 The Commission is issuing a separate notice regarding the collection of information that will be published in the Federal Register to comply with the OMB requirements at 5 CFR sect 13205(a)(iv)
34
20121015-4003 FERC PDF (Unofficial) 10152012
Docket No AD12-8-000
information submitted by participating utilities would be used to help develop a common set of metrics for both ISORTO markets and non-RTOISO markets and for evaluating market performance thereafter
35
20121015-4003 FERC PDF (Unofficial) 10152012
Docket No AD12-8-000
Burden Estimate The estimated public reporting burdens for the reporting
requirements have been adjusted as described above
FERC-922 Requirements
Number of Respondents
Annually (1)
Number of
Responses per Respondent
(2)
Average Burden Hours per Response
(3)
Total Annual Burden Hours
(1)x(2)x(3) Metrics Data Collection
140 1540
Write Performance Analysis
85 935
Management Review
11 1
20 220
Total 245 2695
Cost to Comply The Chairman has projected the cost of compliance to be $184460 Technical Expertise = $168300 (1540 hours data collection + 935 hours report completion $68 per hour) Management Review = $17160 (220 hours report review $78 per hour) Cost per hour figures are calculated using BLS data79 The technical expertise category factors in the median wage for an engineer analyst attorney and economist The management category factors in the median wage for general and operations managers Based on BLS data80 both cost figures have been adjusted to include benefits (benefits represent 295 percent of the total hourly figure)
Title FERC-922 Non-RTOISO Performance Metrics
Action Proposed Collection
OMB Control No TBD
79 See httpblsgovoescurrentnaics3_221000htm
80 See httpwwwblsgovnewsreleaseececnr0htm
36
20121015-4003 FERC PDF (Unofficial) 10152012
Docket No AD12-8-000
Internal Review The Chairman has reviewed the proposed metrics and has determined that the metrics and data gathered thereunder are necessary These requirements conform to the Commissionrsquos need for efficient information collection communication and management within the energy industry The Chairman is assured by means of internal review that there is specific objective support for the burden estimates associated with the information collection requirements
Interested persons may obtain information on the reporting requirements by contacting the following Federal Energy Regulatory Commission 888 First Street NE Washington DC 20426 [Attention Ellen Brown Office of the Executive Director] e-mail DataClearancefercgov Phone (202) 502-8663 fax (202) 273-0873 Any further comments on the collections of information and the associated burden estimates in this proceeding should be sent to the Commission in this docket and may also be sent to the Office of Information and Regulatory Affairs Office of Management and Budget Washington DC 20503 [Attention Desk Officer for the Federal Energy Regulatory Commission] For security reasons comments to OMB should be submitted by e-mail to oira_submissionombeopgov Comments submitted to OMB should include Docket Number AD12-8-000 and FERC-922
37
20121015-4003 FERC PDF (Unofficial) 10152012
Docket No AD12-8-000
38
IV Appendix
20121015-4003 FERC PDF (Unofficial) 10152012
Docket No AD12-8-000 39
Performance Metric Specific Metric(s) Reliability A National or Regional
Reliability Standards Compliance
1 References to which Electricity Reliability Organization (ERO) and Regional Reliability Organization (RRO) standards are applicable 2 Number of violations self-reported and made public by NERCFERC 3 Number of violations identified and made public as RRO or ERO audit findings 4 Total number of violations made public by NERCFERC 5 Severity level of each violation made public by NERCFERC 6 Compliance with operating reserve standards 7 Unserved energy (or load shedding) caused by violations Additional detail will be provided on (1) number of events (2) duration of the events (3) whether the events occurred during onoff-peak hours (4) additional information on equipment types affected and kV of lines affected and (5) number of events (and severity and duration of events) resulting in load shedding based on the utilization of TPL-002 Footnote b criteria Items 2-7 Track the ISORTO definition ldquoThis metric is a quantification of all NERC and RRO Reliability Standards violations that have been identified during an audit or as a result of an ISORTO self-report and have been published as part of that processrdquo Non ndashISORTO utilities should limit reporting to the same eight functional areas used by the ISORTOs 1 Balancing Authority 7 Transmission Planner 2 Interchange Authority 8 Transmission Service Provider 3 Planning Authority 4 Reliability Coordinator 5 Resource Planner 6 Transmission Operator
20121015-4003 FERC PDF (Unofficial) 10152012
Docket No AD12-8-000 40
B Dispatch Reliability 1 Balance Authority Ace Limit (BAAL) OR CPS1 and CPS2
2 Number of hours of transmission load reliefs (of severity level 3 or higher) called by the incumbent transmission provider or unscheduled flows
WECC entities will report events under the WECC Unscheduled Flow Mitigation Procedure (equivalent to the NERC TLR Level three)
3 Energy Management System (EMS) availability C Operational Planning ndash
Load Forecast Accuracy Actual peak load as a percentage variance from forecasted peak load as reported in OASIS
D Wind Forecasting Accuracy
Actual wind availability compared to forecasted wind availability
E Unscheduled Flows Difference between net actual interchange (actual measured power flow in real time) and the net scheduled interchange in megawatt hours Reported in Form 714
F Transmission Outage Coordination
1 Percentage of ge 200 kV planned outages of 5 days or more for which utility notified customers at least 1 month prior to the outage commencement date 2 Percentage of ge 200kV outages cancelled by utility after having been previously approved 3 Report information posted on OASIS (percentage of outages planned and unplanned with less than 2 days notice)
20121015-4003 FERC PDF (Unofficial) 10152012
Docket No AD12-8-000 41
G Long-Term Reliability Planning ndash Transmission
Dollar amount and number of facilities approved to be constructed for reliability purposes
2 Percentage of approved construction on schedule and completed
3 Performance of planning process related to
a Requests for and number of completed reliability studies
b Requests and number of completed economic studies
Discussion of stakeholder process and identification of stakeholder groups participating
H Long-Term Reliability
Planning ndash Resources 1 Processing time for generation interconnection requests 2 Actual reserve margins compared with planned reserve margins 3 Explanation of the nature and characteristics of demand response programs and how they are used in system planning Discussion of programs to facilitate the integration of renewable resources and to mitigate any issues and uncertainty associated with scheduling renewable resources
20121015-4003 FERC PDF (Unofficial) 10152012
Docket No AD12-8-000 42
I Infrastructure Investment ndash Interconnection and Transmission Process Metrics
1 Number of requests
2 Number of studies completed
3 Average age of incomplete studies
4 Average time for completed studies
5 Total cost and types of studies completed (eg feasibility study system impact study and facility study)
6 Number of transmission access denialstransmission service requests (TSRs) denied
J Special Protection
Systems 1 Number of special protection systems
2 Percentage of special protection systems that responded as designed when activated
Applicable pool of special protection systems should be based on how the reporting entityrsquos Regional Entity defines ldquospecial protection systemsrdquo
3 Number of unintended activations
20121015-4003 FERC PDF (Unofficial) 10152012
Docket No AD12-8-000 43
System Operations Measures A Demand Response Comprehensive explanation of the nature of utility demand response programs
implemented for load management as well as in compliance with state requirements B System Lambda System Lambda (on marginal unit)
Proposed System Lambda metric would not apply to utilities where the
marginal price is typically set by hydro units System lambda data will be based on Form 714 information
C Congestion Management Congestion analysis per Order No 890 D Resource Availability 1 - System forced outage rate as measured over 12 months E Transmission System
Availability Interrupted load megawatt hours as a percentage of load served
F Fuel Diversity Fuel diversity in terms of energy installed capacity and actual production G Clean Energy 1 Clean Energy megawatt hours by resource type as a percentage of total energy
2 Clean Energy megawatts by resource type as a percentage of total capacity Organizational Effectiveness Not applicable to non-RTO
entities
20121015-4003 FERC PDF (Unofficial) 10152012
Document Content(s)
Staff Report Non-RTO Metrics Final1015 2PDF1-43
20121015-4003 FERC PDF (Unofficial) 10152012
- Staff Report Non-RTO Metrics Final1015 2PDF
- Document Content(s)
-
Docket No AD12-8-000
facility studies ndash of interconnection and transmission service requests in a timely and efficient manner The metrics track the number of requests the time required to complete the reliability reviews and the costs of completing each of the three types of studies There is also a metric that measures the number of transmission access denials and transmission service request denials The purpose of this metric is to provide information on the magnitude and reasons for transmission service denials and whether additional infrastructure investment is needed to avoid transmission service denials ii Comments Multiple TDUs state that the Commission should collect additional information on the completion of transmission studies Multiple TDUs state that while the metrics for ISOs and RTOs require the reporting of information on studies such measures are omitted from the draft metrics for regions outside of ISOs and RTOs without explanation Multiple TDUs argue that such metrics are even more important than in the ISO and RTO context and that it would be worth obtaining from vertically-integrated transmission providers all of the study completion metrics that ISOs and RTOs are required to produce Multiple TDUs explain that the cost of collecting and providing this information should not be inordinate and that transmission providers should already have expense tracking mechanisms in place to estimate and bill study costs Multiple TDUs state that the following additional metrics would be worth collecting from vertically-integrated transmission providers (1) percentages of long-term transmission service requests and interconnection requests that triggered study requirements (2) percentages of the studies undertaken that led to the identification of upgrade costs (3) the average estimated upgrade cost (4) the percent of transmission service requests withdrawn and the percent approved and (5) the average processing time through each process milestone identified in the transmission providerrsquos Order No 890 compliance tariff provisions such as completion of a feasibility study system impact study and facilities study Multiple TDUs claims that such information would help the Commission identify situations in which impediments to obtaining transmission or interconnection service warrant further investigation68 Multiple TDUs state that the addition of a metric concerning the number of transmission access denials or transmission service requests denied is less meaningful than it first appears Multiple TDUs explain that under the pro forma Open Access Transmission Tariff long-term transmission service requests cannot be legitimately denied instead if there is no existing transmission capability available to accommodate the request the requester is supposed to be informed that meeting the request would require additional facilities and offered the opportunity to fund studies to determine what
68 Multiple TDUs Comments at 5
28
20121015-4003 FERC PDF (Unofficial) 10152012
Docket No AD12-8-000
upgrades are needed Multiple TDUs state that a metric tracking how often entities requesting service withdraw their request for service in the face of these requirements would be worthwhile but that the proposed metric might not elicit such information69 Accordingly Multiple TDUs suggest revising the metric to require entities to report the number of long-term transmission service requests for which ATC was initially found to be unavailable and the disposition of each request with each of these points broken down between requests made by third-party transmission customers and requests made by affiliates or divisions of the transmission provider70
NIPPC contends that the Commission should require transmission operators to
report information concerning the pace of large generator interconnections including the total number of pending interconnection requests the number of pending requests in each phase of the LGIA process and the number of requests in each phase that have experienced delays in completing that phase of the interconnection process along with a narrative describing the causes of those delays71 iii Response Commission Staff agrees with Multiple TDUs that the proposed metrics should include information on how long it takes participating utilities to complete interconnection and transmission studies as a measure of the efficiency of the utilityrsquos infrastructure development process Accordingly Commission Staff recommends that the performance metrics be revised to include metrics concerning the average age of incomplete studies and the average time to complete studies Commission Staff considers the time to complete all studies to be an appropriate metric to measure the efficiency of utility interconnection and transmission study processes It is expected that the narrative discussions that accompany the metrics will address issues with the various study stages and that the discussions will address the issues of concern to Multiple TDUs Commission Staff does not consider that information on the percentage of requests that trigger studies or are withdrawn will reflect utility performance The percentage of requests that trigger studies is a function of available transmission capacity not utility performance The percentage of requests withdrawn is caused by the actions of market participants ndash not utilities ndash and therefore does not measure utility performance Therefore we are not recommending the addition of this information to the metrics reports
69 Id at 8
70 Id
71 NIPPC Comments at 4-5
29
20121015-4003 FERC PDF (Unofficial) 10152012
Docket No AD12-8-000
With regard to Multiple TDUsrsquo interest in additional metrics on transmission service denials Commission Staff expects that the narrative discussions provided by participating utilities will address issues of concern to the Multiple TDUs such as the disposition of requests for service Commission Staff notes however that this metric is not intended to measure ATC or transmission capacity in general Rather the purpose of tracking transmission service denials is to provide an additional measure of the efficiency of utilities in processing requests for transmission service and therefore is intended to be evaluated in the context of the other infrastructure investment processing metrics This information combined with explanations provided by the utilities in their narrative discussion will provide the basis for a comprehensive assessment of how utilities are managing their infrastructure development process Commission Staff does not recommend adding a metric concerning the number of pending generation interconnection requests as requested by NIPPC By measuring the time it takes utilities to complete their studies for interconnection and transmission service the proposed metric appropriately focuses on the efficiency of a utilityrsquos processing of service requests ndash irrespective of the total number of requests Also since many interconnection requests in a utilityrsquos interconnection queue may not be ready to proceed because of commercial issues and other factors beyond the control of utilities the number of pending interconnection requests is not an appropriate measure of utility performance As has been the case in the ISORTO performance metrics reports Commission Staff expects that the narrative discussion that accompanies the utility metrics on interconnections and transmission service will explain the status of their request queues and reasons for delays j Special Protection Systems Special Protection Systems72 are automatic protection systems designed to detect abnormal or predetermined system conditions and take corrective actions such as changing demand generation or system configurations in order to maintain system stability acceptable voltage levels or maintain power flows These metrics measure the performance of such Special Protection Systems based on the definition of Special Protection Systems utilized by the reporting entityrsquos Regional Entity These metrics measure both the frequency with which the region relies on these systems and their effectiveness as measured by successful activations and the number of unintended activations No comments were submitted on this metric
72 Special Protection Systems are also referred to as Special Protection Schemes
Remedial Action Schemes (RAS) or System Integrity Protection Schemes (SIPS)
30
20121015-4003 FERC PDF (Unofficial) 10152012
Docket No AD12-8-000
k Demand Response Entities responding to this metric will be required to provide a comprehensive explanation of the nature of utility demand response programs implemented for load management as well as in compliance with state requirements There were no comments on this metric l System Lambda System lambda is the incremental cost of energy of the marginal unit assuming no system constraints This metric tracks the trend in marginal fuel costs and is an important metric since fuel costs represent the largest component of wholesale energy costs The system lambda metric would not apply to utilities where the marginal price is typically set by hydro units Also system lambda data will be based on information contained in FERC Form No 714 There were no comments on this metric m Congestion Management i Performance Metric Congestion represents the cost to customers of paying for more expensive energy because physical transmission line limits do not allow full delivery of least-cost energy Entities responding to this metric would be required to provide a congestion analysis consistent with Order No 890 In Order No 890 the Commission adopted a planning principle requiring transmission providers to prepare studies identifying ldquosignificant and recurringrdquo congestion and post such studies on their OASIS The Commission explained that the studies should analyze and report on the following items (1) the location and magnitude of the congestion (2) possible remedies for the elimination of the congestion in whole or in part (3) the associated costs of congestion and (4) the cost associated with relieving congestion through system enhancements (or other means)73 ii Comments Multiple TDUs argue that merely requiring vertically-integrated transmission providers to provide a narrative detailing their economic study processes as is proposed will elicit little more than a repetition of the planning process descriptions that were filed in compliance with Order No 890
73 Order No 890 FERC Stats amp Regs para 31241 at PP 529 542
31
20121015-4003 FERC PDF (Unofficial) 10152012
Docket No AD12-8-000
iii Response Commission Staff recommends that utilities discuss the status of their transmission plans as explained in the Long-Term Transmission Planning Metrics discussed above Commission Staff expects that these discussions will address expansion plans to resolve congestion issues on their systems Therefore Commission Staff expects that the performance reports submitted by utilities will provide substantive information on congestion management n Resource Availability i Performance Metric
The proposed metric measures the percentage of time that system resources are not available because of unplanned outages as measured by the system forced outage rate No comments were submitted on the metric
ii Response Commission Staff recommends that this metric be revised to be 1 minus the
system forced outage rate Revising the metric as recommended will measure unforced capacity availability and therefore resource availability This revision will also make this metric comparable to the performance metric adopted for ISOs and RTOs Resource availability is an indication of system efficiency and cost management by utilities in regions outside of ISOs and RTOs Higher resource availability can result in the commitment of fewer peak resources (or the importation of peak supplies) that potentially have high costs thereby resulting in reduced costs o Transmission System Availability This metric measures interrupted load MWh as a percentage of load served In light of the many factors that can result in load interruptions some of which are beyond the control of utilities the narrative detailing the reasons for load interruptions will be essential in assessing performance No comments were submitted on this metric p Fuel Diversity
This metric is defined to be the percentage mix of fuel types installed and available (capacity fuel diversity) and produced (generation fuel diversity) Fuel diversity provides an indication of a utilityrsquos capability to integrate fuels with different characteristics such as lower costs or lower environmental impacts No comments were submitted on this metric
32
20121015-4003 FERC PDF (Unofficial) 10152012
Docket No AD12-8-000
q Clean Energy i Performance Metric
These metrics measure the use of ldquoclean energyrdquo74 The metrics track number of MWh of clean energy by resource type as a percentage of total energy and the number of MW of clean energy by resource type as a percentage of total capacity
ii Comments NIPPC states that the Commission should expand the clean energy metric to include information related to curtailments of clean energy resources as frequent curtailments of these resources by a transmission operator may reflect a dysfunction in the generation market since these resources have no fuel costs NIPPC explains that the metric should include the number of curtailments the duration of each curtailment the number of MW hours curtailed and the justification for the curtailment75 iii Response Commission Staff does not consider curtailments of clean energy to be a measure of the diversity of a utilityrsquos resource mix Rather curtailments of resources ndash or more accurately schedule adjustments or manual redispatch instructions by transmission providers ndash are used to maintain system reliability We note that the diversity metrics in conjunction with the narratives regarding actions taken to manage dispatch reliability and TLR (see pages 18-19 infra) will provide a basis for a comprehensive view of the issue of clean energy
D Burden Estimate
1 Information Collection Statement In its solicitation for comments Commission Staff estimated the public reporting
burden for participating utilities to be approximately 140 hours per respondent for each report
74 Clean Energy is defined to include nuclear energy and variable energy
resources including solar wind hydro geothermal and biomass resources
75 NIPPC Comments at 6
33
20121015-4003 FERC PDF (Unofficial) 10152012
Docket No AD12-8-000
2 Comment EEI asserts that the response time could be as high as 300-400 hours
3 Response
Commission Staff will adjust the burden estimate based on EEIrsquos high estimate of 300-400 hours Commission Staff considers EEIrsquos estimate to be reflective of the most time that it would take an entity to respond to the metrics While Commission Staff recognizes that this report requires additional metrics and narrative discussions Commission Staff nevertheless continues to conclude that 140 hours still represents a reasonable estimate of the burden since much of the data required should be readily available to the responding utilities However in recognition of the fact that the burden will vary from entity to entity we will revise our estimate to 245 hours per respondent which is the mid-point between these estimates
E Information Collection Statement Information Collection Statement
The following collection of information contained in these metrics is subject to
review by the Office of Management and Budget (OMB) under section 3507 of the Paperwork Reduction Act of 199576 OMBrsquos regulations require approval of certain information collection requirements imposed by agency actions77 The Commission cannot conduct this information collection unless it displays a valid OMB control number78
The collection of information requires those public utilities outside of ISOs and RTOs that choose to participate to provide information responding to the attached metrics on a periodic basis This includes the submission of price data and information relating to reliability transmission planning requests for service and system capacity The
76 44 USC sect 3507 (2006) The Paperwork Reduction Act requires OMB
approval of certain information collection activities when these activities apply to 10 or more persons Because it is estimated that 11 entities will respond to this collection the Chairman is requesting approval from OMB
77 5 CFR sect 1320 (2012)
78 The Commission is issuing a separate notice regarding the collection of information that will be published in the Federal Register to comply with the OMB requirements at 5 CFR sect 13205(a)(iv)
34
20121015-4003 FERC PDF (Unofficial) 10152012
Docket No AD12-8-000
information submitted by participating utilities would be used to help develop a common set of metrics for both ISORTO markets and non-RTOISO markets and for evaluating market performance thereafter
35
20121015-4003 FERC PDF (Unofficial) 10152012
Docket No AD12-8-000
Burden Estimate The estimated public reporting burdens for the reporting
requirements have been adjusted as described above
FERC-922 Requirements
Number of Respondents
Annually (1)
Number of
Responses per Respondent
(2)
Average Burden Hours per Response
(3)
Total Annual Burden Hours
(1)x(2)x(3) Metrics Data Collection
140 1540
Write Performance Analysis
85 935
Management Review
11 1
20 220
Total 245 2695
Cost to Comply The Chairman has projected the cost of compliance to be $184460 Technical Expertise = $168300 (1540 hours data collection + 935 hours report completion $68 per hour) Management Review = $17160 (220 hours report review $78 per hour) Cost per hour figures are calculated using BLS data79 The technical expertise category factors in the median wage for an engineer analyst attorney and economist The management category factors in the median wage for general and operations managers Based on BLS data80 both cost figures have been adjusted to include benefits (benefits represent 295 percent of the total hourly figure)
Title FERC-922 Non-RTOISO Performance Metrics
Action Proposed Collection
OMB Control No TBD
79 See httpblsgovoescurrentnaics3_221000htm
80 See httpwwwblsgovnewsreleaseececnr0htm
36
20121015-4003 FERC PDF (Unofficial) 10152012
Docket No AD12-8-000
Internal Review The Chairman has reviewed the proposed metrics and has determined that the metrics and data gathered thereunder are necessary These requirements conform to the Commissionrsquos need for efficient information collection communication and management within the energy industry The Chairman is assured by means of internal review that there is specific objective support for the burden estimates associated with the information collection requirements
Interested persons may obtain information on the reporting requirements by contacting the following Federal Energy Regulatory Commission 888 First Street NE Washington DC 20426 [Attention Ellen Brown Office of the Executive Director] e-mail DataClearancefercgov Phone (202) 502-8663 fax (202) 273-0873 Any further comments on the collections of information and the associated burden estimates in this proceeding should be sent to the Commission in this docket and may also be sent to the Office of Information and Regulatory Affairs Office of Management and Budget Washington DC 20503 [Attention Desk Officer for the Federal Energy Regulatory Commission] For security reasons comments to OMB should be submitted by e-mail to oira_submissionombeopgov Comments submitted to OMB should include Docket Number AD12-8-000 and FERC-922
37
20121015-4003 FERC PDF (Unofficial) 10152012
Docket No AD12-8-000
38
IV Appendix
20121015-4003 FERC PDF (Unofficial) 10152012
Docket No AD12-8-000 39
Performance Metric Specific Metric(s) Reliability A National or Regional
Reliability Standards Compliance
1 References to which Electricity Reliability Organization (ERO) and Regional Reliability Organization (RRO) standards are applicable 2 Number of violations self-reported and made public by NERCFERC 3 Number of violations identified and made public as RRO or ERO audit findings 4 Total number of violations made public by NERCFERC 5 Severity level of each violation made public by NERCFERC 6 Compliance with operating reserve standards 7 Unserved energy (or load shedding) caused by violations Additional detail will be provided on (1) number of events (2) duration of the events (3) whether the events occurred during onoff-peak hours (4) additional information on equipment types affected and kV of lines affected and (5) number of events (and severity and duration of events) resulting in load shedding based on the utilization of TPL-002 Footnote b criteria Items 2-7 Track the ISORTO definition ldquoThis metric is a quantification of all NERC and RRO Reliability Standards violations that have been identified during an audit or as a result of an ISORTO self-report and have been published as part of that processrdquo Non ndashISORTO utilities should limit reporting to the same eight functional areas used by the ISORTOs 1 Balancing Authority 7 Transmission Planner 2 Interchange Authority 8 Transmission Service Provider 3 Planning Authority 4 Reliability Coordinator 5 Resource Planner 6 Transmission Operator
20121015-4003 FERC PDF (Unofficial) 10152012
Docket No AD12-8-000 40
B Dispatch Reliability 1 Balance Authority Ace Limit (BAAL) OR CPS1 and CPS2
2 Number of hours of transmission load reliefs (of severity level 3 or higher) called by the incumbent transmission provider or unscheduled flows
WECC entities will report events under the WECC Unscheduled Flow Mitigation Procedure (equivalent to the NERC TLR Level three)
3 Energy Management System (EMS) availability C Operational Planning ndash
Load Forecast Accuracy Actual peak load as a percentage variance from forecasted peak load as reported in OASIS
D Wind Forecasting Accuracy
Actual wind availability compared to forecasted wind availability
E Unscheduled Flows Difference between net actual interchange (actual measured power flow in real time) and the net scheduled interchange in megawatt hours Reported in Form 714
F Transmission Outage Coordination
1 Percentage of ge 200 kV planned outages of 5 days or more for which utility notified customers at least 1 month prior to the outage commencement date 2 Percentage of ge 200kV outages cancelled by utility after having been previously approved 3 Report information posted on OASIS (percentage of outages planned and unplanned with less than 2 days notice)
20121015-4003 FERC PDF (Unofficial) 10152012
Docket No AD12-8-000 41
G Long-Term Reliability Planning ndash Transmission
Dollar amount and number of facilities approved to be constructed for reliability purposes
2 Percentage of approved construction on schedule and completed
3 Performance of planning process related to
a Requests for and number of completed reliability studies
b Requests and number of completed economic studies
Discussion of stakeholder process and identification of stakeholder groups participating
H Long-Term Reliability
Planning ndash Resources 1 Processing time for generation interconnection requests 2 Actual reserve margins compared with planned reserve margins 3 Explanation of the nature and characteristics of demand response programs and how they are used in system planning Discussion of programs to facilitate the integration of renewable resources and to mitigate any issues and uncertainty associated with scheduling renewable resources
20121015-4003 FERC PDF (Unofficial) 10152012
Docket No AD12-8-000 42
I Infrastructure Investment ndash Interconnection and Transmission Process Metrics
1 Number of requests
2 Number of studies completed
3 Average age of incomplete studies
4 Average time for completed studies
5 Total cost and types of studies completed (eg feasibility study system impact study and facility study)
6 Number of transmission access denialstransmission service requests (TSRs) denied
J Special Protection
Systems 1 Number of special protection systems
2 Percentage of special protection systems that responded as designed when activated
Applicable pool of special protection systems should be based on how the reporting entityrsquos Regional Entity defines ldquospecial protection systemsrdquo
3 Number of unintended activations
20121015-4003 FERC PDF (Unofficial) 10152012
Docket No AD12-8-000 43
System Operations Measures A Demand Response Comprehensive explanation of the nature of utility demand response programs
implemented for load management as well as in compliance with state requirements B System Lambda System Lambda (on marginal unit)
Proposed System Lambda metric would not apply to utilities where the
marginal price is typically set by hydro units System lambda data will be based on Form 714 information
C Congestion Management Congestion analysis per Order No 890 D Resource Availability 1 - System forced outage rate as measured over 12 months E Transmission System
Availability Interrupted load megawatt hours as a percentage of load served
F Fuel Diversity Fuel diversity in terms of energy installed capacity and actual production G Clean Energy 1 Clean Energy megawatt hours by resource type as a percentage of total energy
2 Clean Energy megawatts by resource type as a percentage of total capacity Organizational Effectiveness Not applicable to non-RTO
entities
20121015-4003 FERC PDF (Unofficial) 10152012
Document Content(s)
Staff Report Non-RTO Metrics Final1015 2PDF1-43
20121015-4003 FERC PDF (Unofficial) 10152012
- Staff Report Non-RTO Metrics Final1015 2PDF
- Document Content(s)
-

Docket No AD12-8-000
With regard to Multiple TDUsrsquo interest in additional metrics on transmission service denials Commission Staff expects that the narrative discussions provided by participating utilities will address issues of concern to the Multiple TDUs such as the disposition of requests for service Commission Staff notes however that this metric is not intended to measure ATC or transmission capacity in general Rather the purpose of tracking transmission service denials is to provide an additional measure of the efficiency of utilities in processing requests for transmission service and therefore is intended to be evaluated in the context of the other infrastructure investment processing metrics This information combined with explanations provided by the utilities in their narrative discussion will provide the basis for a comprehensive assessment of how utilities are managing their infrastructure development process Commission Staff does not recommend adding a metric concerning the number of pending generation interconnection requests as requested by NIPPC By measuring the time it takes utilities to complete their studies for interconnection and transmission service the proposed metric appropriately focuses on the efficiency of a utilityrsquos processing of service requests ndash irrespective of the total number of requests Also since many interconnection requests in a utilityrsquos interconnection queue may not be ready to proceed because of commercial issues and other factors beyond the control of utilities the number of pending interconnection requests is not an appropriate measure of utility performance As has been the case in the ISORTO performance metrics reports Commission Staff expects that the narrative discussion that accompanies the utility metrics on interconnections and transmission service will explain the status of their request queues and reasons for delays j Special Protection Systems Special Protection Systems72 are automatic protection systems designed to detect abnormal or predetermined system conditions and take corrective actions such as changing demand generation or system configurations in order to maintain system stability acceptable voltage levels or maintain power flows These metrics measure the performance of such Special Protection Systems based on the definition of Special Protection Systems utilized by the reporting entityrsquos Regional Entity These metrics measure both the frequency with which the region relies on these systems and their effectiveness as measured by successful activations and the number of unintended activations No comments were submitted on this metric
72 Special Protection Systems are also referred to as Special Protection Schemes
Remedial Action Schemes (RAS) or System Integrity Protection Schemes (SIPS)
30
20121015-4003 FERC PDF (Unofficial) 10152012
Docket No AD12-8-000
k Demand Response Entities responding to this metric will be required to provide a comprehensive explanation of the nature of utility demand response programs implemented for load management as well as in compliance with state requirements There were no comments on this metric l System Lambda System lambda is the incremental cost of energy of the marginal unit assuming no system constraints This metric tracks the trend in marginal fuel costs and is an important metric since fuel costs represent the largest component of wholesale energy costs The system lambda metric would not apply to utilities where the marginal price is typically set by hydro units Also system lambda data will be based on information contained in FERC Form No 714 There were no comments on this metric m Congestion Management i Performance Metric Congestion represents the cost to customers of paying for more expensive energy because physical transmission line limits do not allow full delivery of least-cost energy Entities responding to this metric would be required to provide a congestion analysis consistent with Order No 890 In Order No 890 the Commission adopted a planning principle requiring transmission providers to prepare studies identifying ldquosignificant and recurringrdquo congestion and post such studies on their OASIS The Commission explained that the studies should analyze and report on the following items (1) the location and magnitude of the congestion (2) possible remedies for the elimination of the congestion in whole or in part (3) the associated costs of congestion and (4) the cost associated with relieving congestion through system enhancements (or other means)73 ii Comments Multiple TDUs argue that merely requiring vertically-integrated transmission providers to provide a narrative detailing their economic study processes as is proposed will elicit little more than a repetition of the planning process descriptions that were filed in compliance with Order No 890
73 Order No 890 FERC Stats amp Regs para 31241 at PP 529 542
31
20121015-4003 FERC PDF (Unofficial) 10152012
Docket No AD12-8-000
iii Response Commission Staff recommends that utilities discuss the status of their transmission plans as explained in the Long-Term Transmission Planning Metrics discussed above Commission Staff expects that these discussions will address expansion plans to resolve congestion issues on their systems Therefore Commission Staff expects that the performance reports submitted by utilities will provide substantive information on congestion management n Resource Availability i Performance Metric
The proposed metric measures the percentage of time that system resources are not available because of unplanned outages as measured by the system forced outage rate No comments were submitted on the metric
ii Response Commission Staff recommends that this metric be revised to be 1 minus the
system forced outage rate Revising the metric as recommended will measure unforced capacity availability and therefore resource availability This revision will also make this metric comparable to the performance metric adopted for ISOs and RTOs Resource availability is an indication of system efficiency and cost management by utilities in regions outside of ISOs and RTOs Higher resource availability can result in the commitment of fewer peak resources (or the importation of peak supplies) that potentially have high costs thereby resulting in reduced costs o Transmission System Availability This metric measures interrupted load MWh as a percentage of load served In light of the many factors that can result in load interruptions some of which are beyond the control of utilities the narrative detailing the reasons for load interruptions will be essential in assessing performance No comments were submitted on this metric p Fuel Diversity
This metric is defined to be the percentage mix of fuel types installed and available (capacity fuel diversity) and produced (generation fuel diversity) Fuel diversity provides an indication of a utilityrsquos capability to integrate fuels with different characteristics such as lower costs or lower environmental impacts No comments were submitted on this metric
32
20121015-4003 FERC PDF (Unofficial) 10152012
Docket No AD12-8-000
q Clean Energy i Performance Metric
These metrics measure the use of ldquoclean energyrdquo74 The metrics track number of MWh of clean energy by resource type as a percentage of total energy and the number of MW of clean energy by resource type as a percentage of total capacity
ii Comments NIPPC states that the Commission should expand the clean energy metric to include information related to curtailments of clean energy resources as frequent curtailments of these resources by a transmission operator may reflect a dysfunction in the generation market since these resources have no fuel costs NIPPC explains that the metric should include the number of curtailments the duration of each curtailment the number of MW hours curtailed and the justification for the curtailment75 iii Response Commission Staff does not consider curtailments of clean energy to be a measure of the diversity of a utilityrsquos resource mix Rather curtailments of resources ndash or more accurately schedule adjustments or manual redispatch instructions by transmission providers ndash are used to maintain system reliability We note that the diversity metrics in conjunction with the narratives regarding actions taken to manage dispatch reliability and TLR (see pages 18-19 infra) will provide a basis for a comprehensive view of the issue of clean energy
D Burden Estimate
1 Information Collection Statement In its solicitation for comments Commission Staff estimated the public reporting
burden for participating utilities to be approximately 140 hours per respondent for each report
74 Clean Energy is defined to include nuclear energy and variable energy
resources including solar wind hydro geothermal and biomass resources
75 NIPPC Comments at 6
33
20121015-4003 FERC PDF (Unofficial) 10152012
Docket No AD12-8-000
2 Comment EEI asserts that the response time could be as high as 300-400 hours
3 Response
Commission Staff will adjust the burden estimate based on EEIrsquos high estimate of 300-400 hours Commission Staff considers EEIrsquos estimate to be reflective of the most time that it would take an entity to respond to the metrics While Commission Staff recognizes that this report requires additional metrics and narrative discussions Commission Staff nevertheless continues to conclude that 140 hours still represents a reasonable estimate of the burden since much of the data required should be readily available to the responding utilities However in recognition of the fact that the burden will vary from entity to entity we will revise our estimate to 245 hours per respondent which is the mid-point between these estimates
E Information Collection Statement Information Collection Statement
The following collection of information contained in these metrics is subject to
review by the Office of Management and Budget (OMB) under section 3507 of the Paperwork Reduction Act of 199576 OMBrsquos regulations require approval of certain information collection requirements imposed by agency actions77 The Commission cannot conduct this information collection unless it displays a valid OMB control number78
The collection of information requires those public utilities outside of ISOs and RTOs that choose to participate to provide information responding to the attached metrics on a periodic basis This includes the submission of price data and information relating to reliability transmission planning requests for service and system capacity The
76 44 USC sect 3507 (2006) The Paperwork Reduction Act requires OMB
approval of certain information collection activities when these activities apply to 10 or more persons Because it is estimated that 11 entities will respond to this collection the Chairman is requesting approval from OMB
77 5 CFR sect 1320 (2012)
78 The Commission is issuing a separate notice regarding the collection of information that will be published in the Federal Register to comply with the OMB requirements at 5 CFR sect 13205(a)(iv)
34
20121015-4003 FERC PDF (Unofficial) 10152012
Docket No AD12-8-000
information submitted by participating utilities would be used to help develop a common set of metrics for both ISORTO markets and non-RTOISO markets and for evaluating market performance thereafter
35
20121015-4003 FERC PDF (Unofficial) 10152012
Docket No AD12-8-000
Burden Estimate The estimated public reporting burdens for the reporting
requirements have been adjusted as described above
FERC-922 Requirements
Number of Respondents
Annually (1)
Number of
Responses per Respondent
(2)
Average Burden Hours per Response
(3)
Total Annual Burden Hours
(1)x(2)x(3) Metrics Data Collection
140 1540
Write Performance Analysis
85 935
Management Review
11 1
20 220
Total 245 2695
Cost to Comply The Chairman has projected the cost of compliance to be $184460 Technical Expertise = $168300 (1540 hours data collection + 935 hours report completion $68 per hour) Management Review = $17160 (220 hours report review $78 per hour) Cost per hour figures are calculated using BLS data79 The technical expertise category factors in the median wage for an engineer analyst attorney and economist The management category factors in the median wage for general and operations managers Based on BLS data80 both cost figures have been adjusted to include benefits (benefits represent 295 percent of the total hourly figure)
Title FERC-922 Non-RTOISO Performance Metrics
Action Proposed Collection
OMB Control No TBD
79 See httpblsgovoescurrentnaics3_221000htm
80 See httpwwwblsgovnewsreleaseececnr0htm
36
20121015-4003 FERC PDF (Unofficial) 10152012
Docket No AD12-8-000
Internal Review The Chairman has reviewed the proposed metrics and has determined that the metrics and data gathered thereunder are necessary These requirements conform to the Commissionrsquos need for efficient information collection communication and management within the energy industry The Chairman is assured by means of internal review that there is specific objective support for the burden estimates associated with the information collection requirements
Interested persons may obtain information on the reporting requirements by contacting the following Federal Energy Regulatory Commission 888 First Street NE Washington DC 20426 [Attention Ellen Brown Office of the Executive Director] e-mail DataClearancefercgov Phone (202) 502-8663 fax (202) 273-0873 Any further comments on the collections of information and the associated burden estimates in this proceeding should be sent to the Commission in this docket and may also be sent to the Office of Information and Regulatory Affairs Office of Management and Budget Washington DC 20503 [Attention Desk Officer for the Federal Energy Regulatory Commission] For security reasons comments to OMB should be submitted by e-mail to oira_submissionombeopgov Comments submitted to OMB should include Docket Number AD12-8-000 and FERC-922
37
20121015-4003 FERC PDF (Unofficial) 10152012
Docket No AD12-8-000
38
IV Appendix
20121015-4003 FERC PDF (Unofficial) 10152012
Docket No AD12-8-000 39
Performance Metric Specific Metric(s) Reliability A National or Regional
Reliability Standards Compliance
1 References to which Electricity Reliability Organization (ERO) and Regional Reliability Organization (RRO) standards are applicable 2 Number of violations self-reported and made public by NERCFERC 3 Number of violations identified and made public as RRO or ERO audit findings 4 Total number of violations made public by NERCFERC 5 Severity level of each violation made public by NERCFERC 6 Compliance with operating reserve standards 7 Unserved energy (or load shedding) caused by violations Additional detail will be provided on (1) number of events (2) duration of the events (3) whether the events occurred during onoff-peak hours (4) additional information on equipment types affected and kV of lines affected and (5) number of events (and severity and duration of events) resulting in load shedding based on the utilization of TPL-002 Footnote b criteria Items 2-7 Track the ISORTO definition ldquoThis metric is a quantification of all NERC and RRO Reliability Standards violations that have been identified during an audit or as a result of an ISORTO self-report and have been published as part of that processrdquo Non ndashISORTO utilities should limit reporting to the same eight functional areas used by the ISORTOs 1 Balancing Authority 7 Transmission Planner 2 Interchange Authority 8 Transmission Service Provider 3 Planning Authority 4 Reliability Coordinator 5 Resource Planner 6 Transmission Operator
20121015-4003 FERC PDF (Unofficial) 10152012
Docket No AD12-8-000 40
B Dispatch Reliability 1 Balance Authority Ace Limit (BAAL) OR CPS1 and CPS2
2 Number of hours of transmission load reliefs (of severity level 3 or higher) called by the incumbent transmission provider or unscheduled flows
WECC entities will report events under the WECC Unscheduled Flow Mitigation Procedure (equivalent to the NERC TLR Level three)
3 Energy Management System (EMS) availability C Operational Planning ndash
Load Forecast Accuracy Actual peak load as a percentage variance from forecasted peak load as reported in OASIS
D Wind Forecasting Accuracy
Actual wind availability compared to forecasted wind availability
E Unscheduled Flows Difference between net actual interchange (actual measured power flow in real time) and the net scheduled interchange in megawatt hours Reported in Form 714
F Transmission Outage Coordination
1 Percentage of ge 200 kV planned outages of 5 days or more for which utility notified customers at least 1 month prior to the outage commencement date 2 Percentage of ge 200kV outages cancelled by utility after having been previously approved 3 Report information posted on OASIS (percentage of outages planned and unplanned with less than 2 days notice)
20121015-4003 FERC PDF (Unofficial) 10152012
Docket No AD12-8-000 41
G Long-Term Reliability Planning ndash Transmission
Dollar amount and number of facilities approved to be constructed for reliability purposes
2 Percentage of approved construction on schedule and completed
3 Performance of planning process related to
a Requests for and number of completed reliability studies
b Requests and number of completed economic studies
Discussion of stakeholder process and identification of stakeholder groups participating
H Long-Term Reliability
Planning ndash Resources 1 Processing time for generation interconnection requests 2 Actual reserve margins compared with planned reserve margins 3 Explanation of the nature and characteristics of demand response programs and how they are used in system planning Discussion of programs to facilitate the integration of renewable resources and to mitigate any issues and uncertainty associated with scheduling renewable resources
20121015-4003 FERC PDF (Unofficial) 10152012
Docket No AD12-8-000 42
I Infrastructure Investment ndash Interconnection and Transmission Process Metrics
1 Number of requests
2 Number of studies completed
3 Average age of incomplete studies
4 Average time for completed studies
5 Total cost and types of studies completed (eg feasibility study system impact study and facility study)
6 Number of transmission access denialstransmission service requests (TSRs) denied
J Special Protection
Systems 1 Number of special protection systems
2 Percentage of special protection systems that responded as designed when activated
Applicable pool of special protection systems should be based on how the reporting entityrsquos Regional Entity defines ldquospecial protection systemsrdquo
3 Number of unintended activations
20121015-4003 FERC PDF (Unofficial) 10152012
Docket No AD12-8-000 43
System Operations Measures A Demand Response Comprehensive explanation of the nature of utility demand response programs
implemented for load management as well as in compliance with state requirements B System Lambda System Lambda (on marginal unit)
Proposed System Lambda metric would not apply to utilities where the
marginal price is typically set by hydro units System lambda data will be based on Form 714 information
C Congestion Management Congestion analysis per Order No 890 D Resource Availability 1 - System forced outage rate as measured over 12 months E Transmission System
Availability Interrupted load megawatt hours as a percentage of load served
F Fuel Diversity Fuel diversity in terms of energy installed capacity and actual production G Clean Energy 1 Clean Energy megawatt hours by resource type as a percentage of total energy
2 Clean Energy megawatts by resource type as a percentage of total capacity Organizational Effectiveness Not applicable to non-RTO
entities
20121015-4003 FERC PDF (Unofficial) 10152012
Document Content(s)
Staff Report Non-RTO Metrics Final1015 2PDF1-43
20121015-4003 FERC PDF (Unofficial) 10152012
- Staff Report Non-RTO Metrics Final1015 2PDF
- Document Content(s)
-
Docket No AD12-8-000
q Clean Energy i Performance Metric
These metrics measure the use of ldquoclean energyrdquo74 The metrics track number of MWh of clean energy by resource type as a percentage of total energy and the number of MW of clean energy by resource type as a percentage of total capacity
ii Comments NIPPC states that the Commission should expand the clean energy metric to include information related to curtailments of clean energy resources as frequent curtailments of these resources by a transmission operator may reflect a dysfunction in the generation market since these resources have no fuel costs NIPPC explains that the metric should include the number of curtailments the duration of each curtailment the number of MW hours curtailed and the justification for the curtailment75 iii Response Commission Staff does not consider curtailments of clean energy to be a measure of the diversity of a utilityrsquos resource mix Rather curtailments of resources ndash or more accurately schedule adjustments or manual redispatch instructions by transmission providers ndash are used to maintain system reliability We note that the diversity metrics in conjunction with the narratives regarding actions taken to manage dispatch reliability and TLR (see pages 18-19 infra) will provide a basis for a comprehensive view of the issue of clean energy
D Burden Estimate
1 Information Collection Statement In its solicitation for comments Commission Staff estimated the public reporting
burden for participating utilities to be approximately 140 hours per respondent for each report
74 Clean Energy is defined to include nuclear energy and variable energy
resources including solar wind hydro geothermal and biomass resources
75 NIPPC Comments at 6
33
20121015-4003 FERC PDF (Unofficial) 10152012
Docket No AD12-8-000
2 Comment EEI asserts that the response time could be as high as 300-400 hours
3 Response
Commission Staff will adjust the burden estimate based on EEIrsquos high estimate of 300-400 hours Commission Staff considers EEIrsquos estimate to be reflective of the most time that it would take an entity to respond to the metrics While Commission Staff recognizes that this report requires additional metrics and narrative discussions Commission Staff nevertheless continues to conclude that 140 hours still represents a reasonable estimate of the burden since much of the data required should be readily available to the responding utilities However in recognition of the fact that the burden will vary from entity to entity we will revise our estimate to 245 hours per respondent which is the mid-point between these estimates
E Information Collection Statement Information Collection Statement
The following collection of information contained in these metrics is subject to
review by the Office of Management and Budget (OMB) under section 3507 of the Paperwork Reduction Act of 199576 OMBrsquos regulations require approval of certain information collection requirements imposed by agency actions77 The Commission cannot conduct this information collection unless it displays a valid OMB control number78
The collection of information requires those public utilities outside of ISOs and RTOs that choose to participate to provide information responding to the attached metrics on a periodic basis This includes the submission of price data and information relating to reliability transmission planning requests for service and system capacity The
76 44 USC sect 3507 (2006) The Paperwork Reduction Act requires OMB
approval of certain information collection activities when these activities apply to 10 or more persons Because it is estimated that 11 entities will respond to this collection the Chairman is requesting approval from OMB
77 5 CFR sect 1320 (2012)
78 The Commission is issuing a separate notice regarding the collection of information that will be published in the Federal Register to comply with the OMB requirements at 5 CFR sect 13205(a)(iv)
34
20121015-4003 FERC PDF (Unofficial) 10152012
Docket No AD12-8-000
information submitted by participating utilities would be used to help develop a common set of metrics for both ISORTO markets and non-RTOISO markets and for evaluating market performance thereafter
35
20121015-4003 FERC PDF (Unofficial) 10152012
Docket No AD12-8-000
Burden Estimate The estimated public reporting burdens for the reporting
requirements have been adjusted as described above
FERC-922 Requirements
Number of Respondents
Annually (1)
Number of
Responses per Respondent
(2)
Average Burden Hours per Response
(3)
Total Annual Burden Hours
(1)x(2)x(3) Metrics Data Collection
140 1540
Write Performance Analysis
85 935
Management Review
11 1
20 220
Total 245 2695
Cost to Comply The Chairman has projected the cost of compliance to be $184460 Technical Expertise = $168300 (1540 hours data collection + 935 hours report completion $68 per hour) Management Review = $17160 (220 hours report review $78 per hour) Cost per hour figures are calculated using BLS data79 The technical expertise category factors in the median wage for an engineer analyst attorney and economist The management category factors in the median wage for general and operations managers Based on BLS data80 both cost figures have been adjusted to include benefits (benefits represent 295 percent of the total hourly figure)
Title FERC-922 Non-RTOISO Performance Metrics
Action Proposed Collection
OMB Control No TBD
79 See httpblsgovoescurrentnaics3_221000htm
80 See httpwwwblsgovnewsreleaseececnr0htm
36
20121015-4003 FERC PDF (Unofficial) 10152012
Docket No AD12-8-000
Internal Review The Chairman has reviewed the proposed metrics and has determined that the metrics and data gathered thereunder are necessary These requirements conform to the Commissionrsquos need for efficient information collection communication and management within the energy industry The Chairman is assured by means of internal review that there is specific objective support for the burden estimates associated with the information collection requirements
Interested persons may obtain information on the reporting requirements by contacting the following Federal Energy Regulatory Commission 888 First Street NE Washington DC 20426 [Attention Ellen Brown Office of the Executive Director] e-mail DataClearancefercgov Phone (202) 502-8663 fax (202) 273-0873 Any further comments on the collections of information and the associated burden estimates in this proceeding should be sent to the Commission in this docket and may also be sent to the Office of Information and Regulatory Affairs Office of Management and Budget Washington DC 20503 [Attention Desk Officer for the Federal Energy Regulatory Commission] For security reasons comments to OMB should be submitted by e-mail to oira_submissionombeopgov Comments submitted to OMB should include Docket Number AD12-8-000 and FERC-922
37
20121015-4003 FERC PDF (Unofficial) 10152012
Docket No AD12-8-000
38
IV Appendix
20121015-4003 FERC PDF (Unofficial) 10152012
Docket No AD12-8-000 39
Performance Metric Specific Metric(s) Reliability A National or Regional
Reliability Standards Compliance
1 References to which Electricity Reliability Organization (ERO) and Regional Reliability Organization (RRO) standards are applicable 2 Number of violations self-reported and made public by NERCFERC 3 Number of violations identified and made public as RRO or ERO audit findings 4 Total number of violations made public by NERCFERC 5 Severity level of each violation made public by NERCFERC 6 Compliance with operating reserve standards 7 Unserved energy (or load shedding) caused by violations Additional detail will be provided on (1) number of events (2) duration of the events (3) whether the events occurred during onoff-peak hours (4) additional information on equipment types affected and kV of lines affected and (5) number of events (and severity and duration of events) resulting in load shedding based on the utilization of TPL-002 Footnote b criteria Items 2-7 Track the ISORTO definition ldquoThis metric is a quantification of all NERC and RRO Reliability Standards violations that have been identified during an audit or as a result of an ISORTO self-report and have been published as part of that processrdquo Non ndashISORTO utilities should limit reporting to the same eight functional areas used by the ISORTOs 1 Balancing Authority 7 Transmission Planner 2 Interchange Authority 8 Transmission Service Provider 3 Planning Authority 4 Reliability Coordinator 5 Resource Planner 6 Transmission Operator
20121015-4003 FERC PDF (Unofficial) 10152012
Docket No AD12-8-000 40
B Dispatch Reliability 1 Balance Authority Ace Limit (BAAL) OR CPS1 and CPS2
2 Number of hours of transmission load reliefs (of severity level 3 or higher) called by the incumbent transmission provider or unscheduled flows
WECC entities will report events under the WECC Unscheduled Flow Mitigation Procedure (equivalent to the NERC TLR Level three)
3 Energy Management System (EMS) availability C Operational Planning ndash
Load Forecast Accuracy Actual peak load as a percentage variance from forecasted peak load as reported in OASIS
D Wind Forecasting Accuracy
Actual wind availability compared to forecasted wind availability
E Unscheduled Flows Difference between net actual interchange (actual measured power flow in real time) and the net scheduled interchange in megawatt hours Reported in Form 714
F Transmission Outage Coordination
1 Percentage of ge 200 kV planned outages of 5 days or more for which utility notified customers at least 1 month prior to the outage commencement date 2 Percentage of ge 200kV outages cancelled by utility after having been previously approved 3 Report information posted on OASIS (percentage of outages planned and unplanned with less than 2 days notice)
20121015-4003 FERC PDF (Unofficial) 10152012
Docket No AD12-8-000 41
G Long-Term Reliability Planning ndash Transmission
Dollar amount and number of facilities approved to be constructed for reliability purposes
2 Percentage of approved construction on schedule and completed
3 Performance of planning process related to
a Requests for and number of completed reliability studies
b Requests and number of completed economic studies
Discussion of stakeholder process and identification of stakeholder groups participating
H Long-Term Reliability
Planning ndash Resources 1 Processing time for generation interconnection requests 2 Actual reserve margins compared with planned reserve margins 3 Explanation of the nature and characteristics of demand response programs and how they are used in system planning Discussion of programs to facilitate the integration of renewable resources and to mitigate any issues and uncertainty associated with scheduling renewable resources
20121015-4003 FERC PDF (Unofficial) 10152012
Docket No AD12-8-000 42
I Infrastructure Investment ndash Interconnection and Transmission Process Metrics
1 Number of requests
2 Number of studies completed
3 Average age of incomplete studies
4 Average time for completed studies
5 Total cost and types of studies completed (eg feasibility study system impact study and facility study)
6 Number of transmission access denialstransmission service requests (TSRs) denied
J Special Protection
Systems 1 Number of special protection systems
2 Percentage of special protection systems that responded as designed when activated
Applicable pool of special protection systems should be based on how the reporting entityrsquos Regional Entity defines ldquospecial protection systemsrdquo
3 Number of unintended activations
20121015-4003 FERC PDF (Unofficial) 10152012
Docket No AD12-8-000 43
System Operations Measures A Demand Response Comprehensive explanation of the nature of utility demand response programs
implemented for load management as well as in compliance with state requirements B System Lambda System Lambda (on marginal unit)
Proposed System Lambda metric would not apply to utilities where the
marginal price is typically set by hydro units System lambda data will be based on Form 714 information
C Congestion Management Congestion analysis per Order No 890 D Resource Availability 1 - System forced outage rate as measured over 12 months E Transmission System
Availability Interrupted load megawatt hours as a percentage of load served
F Fuel Diversity Fuel diversity in terms of energy installed capacity and actual production G Clean Energy 1 Clean Energy megawatt hours by resource type as a percentage of total energy
2 Clean Energy megawatts by resource type as a percentage of total capacity Organizational Effectiveness Not applicable to non-RTO
entities
20121015-4003 FERC PDF (Unofficial) 10152012
Document Content(s)
Staff Report Non-RTO Metrics Final1015 2PDF1-43
20121015-4003 FERC PDF (Unofficial) 10152012
- Staff Report Non-RTO Metrics Final1015 2PDF
- Document Content(s)
-

Docket No AD12-8-000
Burden Estimate The estimated public reporting burdens for the reporting
requirements have been adjusted as described above
FERC-922 Requirements
Number of Respondents
Annually (1)
Number of
Responses per Respondent
(2)
Average Burden Hours per Response
(3)
Total Annual Burden Hours
(1)x(2)x(3) Metrics Data Collection
140 1540
Write Performance Analysis
85 935
Management Review
11 1
20 220
Total 245 2695
Cost to Comply The Chairman has projected the cost of compliance to be $184460 Technical Expertise = $168300 (1540 hours data collection + 935 hours report completion $68 per hour) Management Review = $17160 (220 hours report review $78 per hour) Cost per hour figures are calculated using BLS data79 The technical expertise category factors in the median wage for an engineer analyst attorney and economist The management category factors in the median wage for general and operations managers Based on BLS data80 both cost figures have been adjusted to include benefits (benefits represent 295 percent of the total hourly figure)
Title FERC-922 Non-RTOISO Performance Metrics
Action Proposed Collection
OMB Control No TBD
79 See httpblsgovoescurrentnaics3_221000htm
80 See httpwwwblsgovnewsreleaseececnr0htm
36
20121015-4003 FERC PDF (Unofficial) 10152012
Docket No AD12-8-000
Internal Review The Chairman has reviewed the proposed metrics and has determined that the metrics and data gathered thereunder are necessary These requirements conform to the Commissionrsquos need for efficient information collection communication and management within the energy industry The Chairman is assured by means of internal review that there is specific objective support for the burden estimates associated with the information collection requirements
Interested persons may obtain information on the reporting requirements by contacting the following Federal Energy Regulatory Commission 888 First Street NE Washington DC 20426 [Attention Ellen Brown Office of the Executive Director] e-mail DataClearancefercgov Phone (202) 502-8663 fax (202) 273-0873 Any further comments on the collections of information and the associated burden estimates in this proceeding should be sent to the Commission in this docket and may also be sent to the Office of Information and Regulatory Affairs Office of Management and Budget Washington DC 20503 [Attention Desk Officer for the Federal Energy Regulatory Commission] For security reasons comments to OMB should be submitted by e-mail to oira_submissionombeopgov Comments submitted to OMB should include Docket Number AD12-8-000 and FERC-922
37
20121015-4003 FERC PDF (Unofficial) 10152012
Docket No AD12-8-000
38
IV Appendix
20121015-4003 FERC PDF (Unofficial) 10152012
Docket No AD12-8-000 39
Performance Metric Specific Metric(s) Reliability A National or Regional
Reliability Standards Compliance
1 References to which Electricity Reliability Organization (ERO) and Regional Reliability Organization (RRO) standards are applicable 2 Number of violations self-reported and made public by NERCFERC 3 Number of violations identified and made public as RRO or ERO audit findings 4 Total number of violations made public by NERCFERC 5 Severity level of each violation made public by NERCFERC 6 Compliance with operating reserve standards 7 Unserved energy (or load shedding) caused by violations Additional detail will be provided on (1) number of events (2) duration of the events (3) whether the events occurred during onoff-peak hours (4) additional information on equipment types affected and kV of lines affected and (5) number of events (and severity and duration of events) resulting in load shedding based on the utilization of TPL-002 Footnote b criteria Items 2-7 Track the ISORTO definition ldquoThis metric is a quantification of all NERC and RRO Reliability Standards violations that have been identified during an audit or as a result of an ISORTO self-report and have been published as part of that processrdquo Non ndashISORTO utilities should limit reporting to the same eight functional areas used by the ISORTOs 1 Balancing Authority 7 Transmission Planner 2 Interchange Authority 8 Transmission Service Provider 3 Planning Authority 4 Reliability Coordinator 5 Resource Planner 6 Transmission Operator
20121015-4003 FERC PDF (Unofficial) 10152012
Docket No AD12-8-000 40
B Dispatch Reliability 1 Balance Authority Ace Limit (BAAL) OR CPS1 and CPS2
2 Number of hours of transmission load reliefs (of severity level 3 or higher) called by the incumbent transmission provider or unscheduled flows
WECC entities will report events under the WECC Unscheduled Flow Mitigation Procedure (equivalent to the NERC TLR Level three)
3 Energy Management System (EMS) availability C Operational Planning ndash
Load Forecast Accuracy Actual peak load as a percentage variance from forecasted peak load as reported in OASIS
D Wind Forecasting Accuracy
Actual wind availability compared to forecasted wind availability
E Unscheduled Flows Difference between net actual interchange (actual measured power flow in real time) and the net scheduled interchange in megawatt hours Reported in Form 714
F Transmission Outage Coordination
1 Percentage of ge 200 kV planned outages of 5 days or more for which utility notified customers at least 1 month prior to the outage commencement date 2 Percentage of ge 200kV outages cancelled by utility after having been previously approved 3 Report information posted on OASIS (percentage of outages planned and unplanned with less than 2 days notice)
20121015-4003 FERC PDF (Unofficial) 10152012
Docket No AD12-8-000 41
G Long-Term Reliability Planning ndash Transmission
Dollar amount and number of facilities approved to be constructed for reliability purposes
2 Percentage of approved construction on schedule and completed
3 Performance of planning process related to
a Requests for and number of completed reliability studies
b Requests and number of completed economic studies
Discussion of stakeholder process and identification of stakeholder groups participating
H Long-Term Reliability
Planning ndash Resources 1 Processing time for generation interconnection requests 2 Actual reserve margins compared with planned reserve margins 3 Explanation of the nature and characteristics of demand response programs and how they are used in system planning Discussion of programs to facilitate the integration of renewable resources and to mitigate any issues and uncertainty associated with scheduling renewable resources
20121015-4003 FERC PDF (Unofficial) 10152012
Docket No AD12-8-000 42
I Infrastructure Investment ndash Interconnection and Transmission Process Metrics
1 Number of requests
2 Number of studies completed
3 Average age of incomplete studies
4 Average time for completed studies
5 Total cost and types of studies completed (eg feasibility study system impact study and facility study)
6 Number of transmission access denialstransmission service requests (TSRs) denied
J Special Protection
Systems 1 Number of special protection systems
2 Percentage of special protection systems that responded as designed when activated
Applicable pool of special protection systems should be based on how the reporting entityrsquos Regional Entity defines ldquospecial protection systemsrdquo
3 Number of unintended activations
20121015-4003 FERC PDF (Unofficial) 10152012
Docket No AD12-8-000 43
System Operations Measures A Demand Response Comprehensive explanation of the nature of utility demand response programs
implemented for load management as well as in compliance with state requirements B System Lambda System Lambda (on marginal unit)
Proposed System Lambda metric would not apply to utilities where the
marginal price is typically set by hydro units System lambda data will be based on Form 714 information
C Congestion Management Congestion analysis per Order No 890 D Resource Availability 1 - System forced outage rate as measured over 12 months E Transmission System
Availability Interrupted load megawatt hours as a percentage of load served
F Fuel Diversity Fuel diversity in terms of energy installed capacity and actual production G Clean Energy 1 Clean Energy megawatt hours by resource type as a percentage of total energy
2 Clean Energy megawatts by resource type as a percentage of total capacity Organizational Effectiveness Not applicable to non-RTO
entities
20121015-4003 FERC PDF (Unofficial) 10152012
Document Content(s)
Staff Report Non-RTO Metrics Final1015 2PDF1-43
20121015-4003 FERC PDF (Unofficial) 10152012
- Staff Report Non-RTO Metrics Final1015 2PDF
- Document Content(s)
-
Docket No AD12-8-000
Internal Review The Chairman has reviewed the proposed metrics and has determined that the metrics and data gathered thereunder are necessary These requirements conform to the Commissionrsquos need for efficient information collection communication and management within the energy industry The Chairman is assured by means of internal review that there is specific objective support for the burden estimates associated with the information collection requirements
Interested persons may obtain information on the reporting requirements by contacting the following Federal Energy Regulatory Commission 888 First Street NE Washington DC 20426 [Attention Ellen Brown Office of the Executive Director] e-mail DataClearancefercgov Phone (202) 502-8663 fax (202) 273-0873 Any further comments on the collections of information and the associated burden estimates in this proceeding should be sent to the Commission in this docket and may also be sent to the Office of Information and Regulatory Affairs Office of Management and Budget Washington DC 20503 [Attention Desk Officer for the Federal Energy Regulatory Commission] For security reasons comments to OMB should be submitted by e-mail to oira_submissionombeopgov Comments submitted to OMB should include Docket Number AD12-8-000 and FERC-922
37
20121015-4003 FERC PDF (Unofficial) 10152012
Docket No AD12-8-000
38
IV Appendix
20121015-4003 FERC PDF (Unofficial) 10152012
Docket No AD12-8-000 39
Performance Metric Specific Metric(s) Reliability A National or Regional
Reliability Standards Compliance
1 References to which Electricity Reliability Organization (ERO) and Regional Reliability Organization (RRO) standards are applicable 2 Number of violations self-reported and made public by NERCFERC 3 Number of violations identified and made public as RRO or ERO audit findings 4 Total number of violations made public by NERCFERC 5 Severity level of each violation made public by NERCFERC 6 Compliance with operating reserve standards 7 Unserved energy (or load shedding) caused by violations Additional detail will be provided on (1) number of events (2) duration of the events (3) whether the events occurred during onoff-peak hours (4) additional information on equipment types affected and kV of lines affected and (5) number of events (and severity and duration of events) resulting in load shedding based on the utilization of TPL-002 Footnote b criteria Items 2-7 Track the ISORTO definition ldquoThis metric is a quantification of all NERC and RRO Reliability Standards violations that have been identified during an audit or as a result of an ISORTO self-report and have been published as part of that processrdquo Non ndashISORTO utilities should limit reporting to the same eight functional areas used by the ISORTOs 1 Balancing Authority 7 Transmission Planner 2 Interchange Authority 8 Transmission Service Provider 3 Planning Authority 4 Reliability Coordinator 5 Resource Planner 6 Transmission Operator
20121015-4003 FERC PDF (Unofficial) 10152012
Docket No AD12-8-000 40
B Dispatch Reliability 1 Balance Authority Ace Limit (BAAL) OR CPS1 and CPS2
2 Number of hours of transmission load reliefs (of severity level 3 or higher) called by the incumbent transmission provider or unscheduled flows
WECC entities will report events under the WECC Unscheduled Flow Mitigation Procedure (equivalent to the NERC TLR Level three)
3 Energy Management System (EMS) availability C Operational Planning ndash
Load Forecast Accuracy Actual peak load as a percentage variance from forecasted peak load as reported in OASIS
D Wind Forecasting Accuracy
Actual wind availability compared to forecasted wind availability
E Unscheduled Flows Difference between net actual interchange (actual measured power flow in real time) and the net scheduled interchange in megawatt hours Reported in Form 714
F Transmission Outage Coordination
1 Percentage of ge 200 kV planned outages of 5 days or more for which utility notified customers at least 1 month prior to the outage commencement date 2 Percentage of ge 200kV outages cancelled by utility after having been previously approved 3 Report information posted on OASIS (percentage of outages planned and unplanned with less than 2 days notice)
20121015-4003 FERC PDF (Unofficial) 10152012
Docket No AD12-8-000 41
G Long-Term Reliability Planning ndash Transmission
Dollar amount and number of facilities approved to be constructed for reliability purposes
2 Percentage of approved construction on schedule and completed
3 Performance of planning process related to
a Requests for and number of completed reliability studies
b Requests and number of completed economic studies
Discussion of stakeholder process and identification of stakeholder groups participating
H Long-Term Reliability
Planning ndash Resources 1 Processing time for generation interconnection requests 2 Actual reserve margins compared with planned reserve margins 3 Explanation of the nature and characteristics of demand response programs and how they are used in system planning Discussion of programs to facilitate the integration of renewable resources and to mitigate any issues and uncertainty associated with scheduling renewable resources
20121015-4003 FERC PDF (Unofficial) 10152012
Docket No AD12-8-000 42
I Infrastructure Investment ndash Interconnection and Transmission Process Metrics
1 Number of requests
2 Number of studies completed
3 Average age of incomplete studies
4 Average time for completed studies
5 Total cost and types of studies completed (eg feasibility study system impact study and facility study)
6 Number of transmission access denialstransmission service requests (TSRs) denied
J Special Protection
Systems 1 Number of special protection systems
2 Percentage of special protection systems that responded as designed when activated
Applicable pool of special protection systems should be based on how the reporting entityrsquos Regional Entity defines ldquospecial protection systemsrdquo
3 Number of unintended activations
20121015-4003 FERC PDF (Unofficial) 10152012
Docket No AD12-8-000 43
System Operations Measures A Demand Response Comprehensive explanation of the nature of utility demand response programs
implemented for load management as well as in compliance with state requirements B System Lambda System Lambda (on marginal unit)
Proposed System Lambda metric would not apply to utilities where the
marginal price is typically set by hydro units System lambda data will be based on Form 714 information
C Congestion Management Congestion analysis per Order No 890 D Resource Availability 1 - System forced outage rate as measured over 12 months E Transmission System
Availability Interrupted load megawatt hours as a percentage of load served
F Fuel Diversity Fuel diversity in terms of energy installed capacity and actual production G Clean Energy 1 Clean Energy megawatt hours by resource type as a percentage of total energy
2 Clean Energy megawatts by resource type as a percentage of total capacity Organizational Effectiveness Not applicable to non-RTO
entities
20121015-4003 FERC PDF (Unofficial) 10152012
Document Content(s)
Staff Report Non-RTO Metrics Final1015 2PDF1-43
20121015-4003 FERC PDF (Unofficial) 10152012
- Staff Report Non-RTO Metrics Final1015 2PDF
- Document Content(s)
-
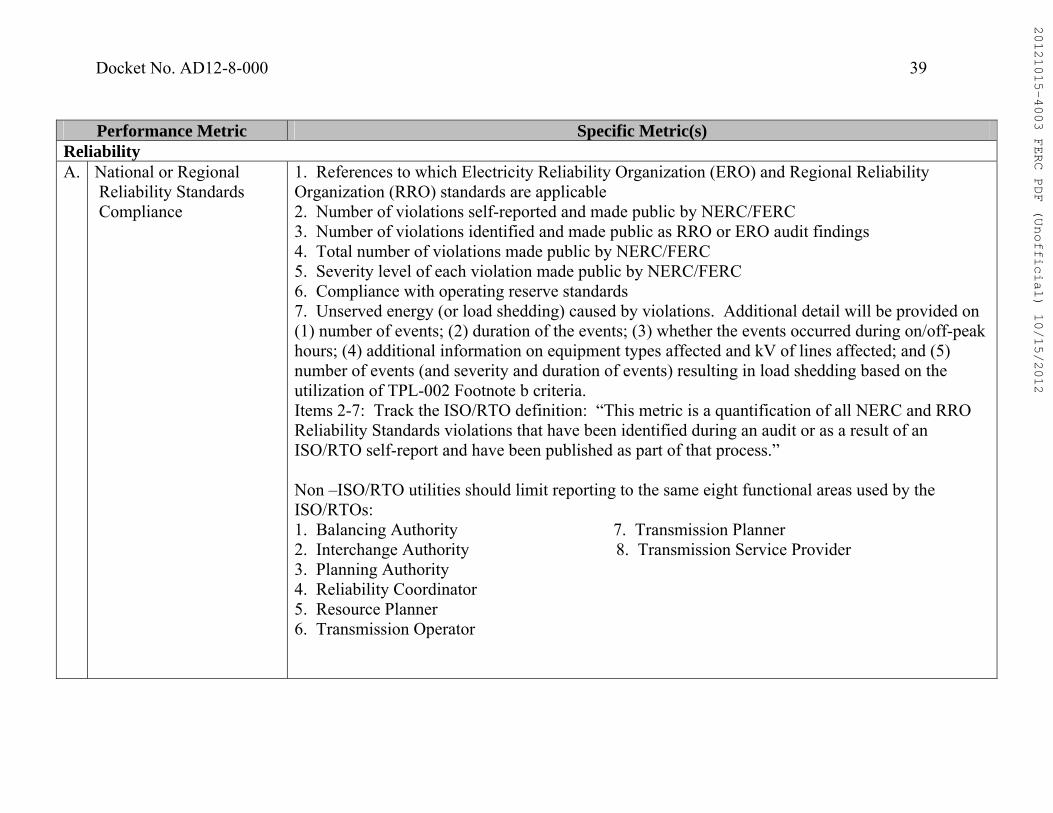
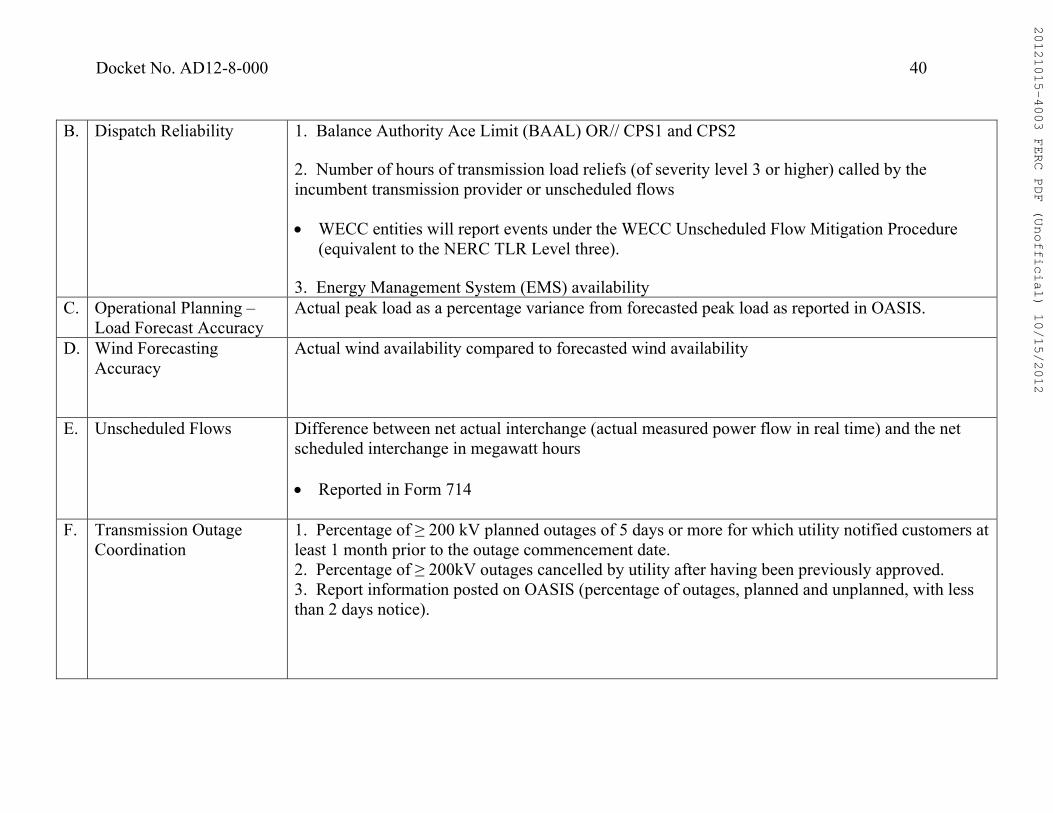
Document Content(s)
Staff Report Non-RTO Metrics Final1015 2PDF1-43
20121015-4003 FERC PDF (Unofficial) 10152012
- Staff Report Non-RTO Metrics Final1015 2PDF
- Document Content(s)
-