performance metric and project yourbenefit calculations...
TRANSCRIPT

7/24/2014
1
Performance metric and project benefit calculations
Marketing research and research report format
Darcy Bullock, P.E.Professor of Civil Engineering &
Joint Transportation Research Program Director
Purdue University
West Lafayette, IN
Your investment is having IMPACT
Research Philosophy
Research & Innovation
Implementation
Universities Business PartnersAgencies

7/24/2014
2
Engagement is Critical
District One Law Enforcement FHWA Briefing
IMI and E&B Paving Webinar Workshop with Utah
Outline
1. Message2. Past Efforts/Elevator Pitch3. New communication initiatives to
support engagement4. Series of case studies
illustrating blended communications tools.
5. Dialog

7/24/2014
3
Messages• Demonstrating implementation & return on investment is good, but demonstrating IMPACT is even more important
• IMPACT can be measured in multiple different ways
• Having a diverse portfolio of IMPACT messages is important
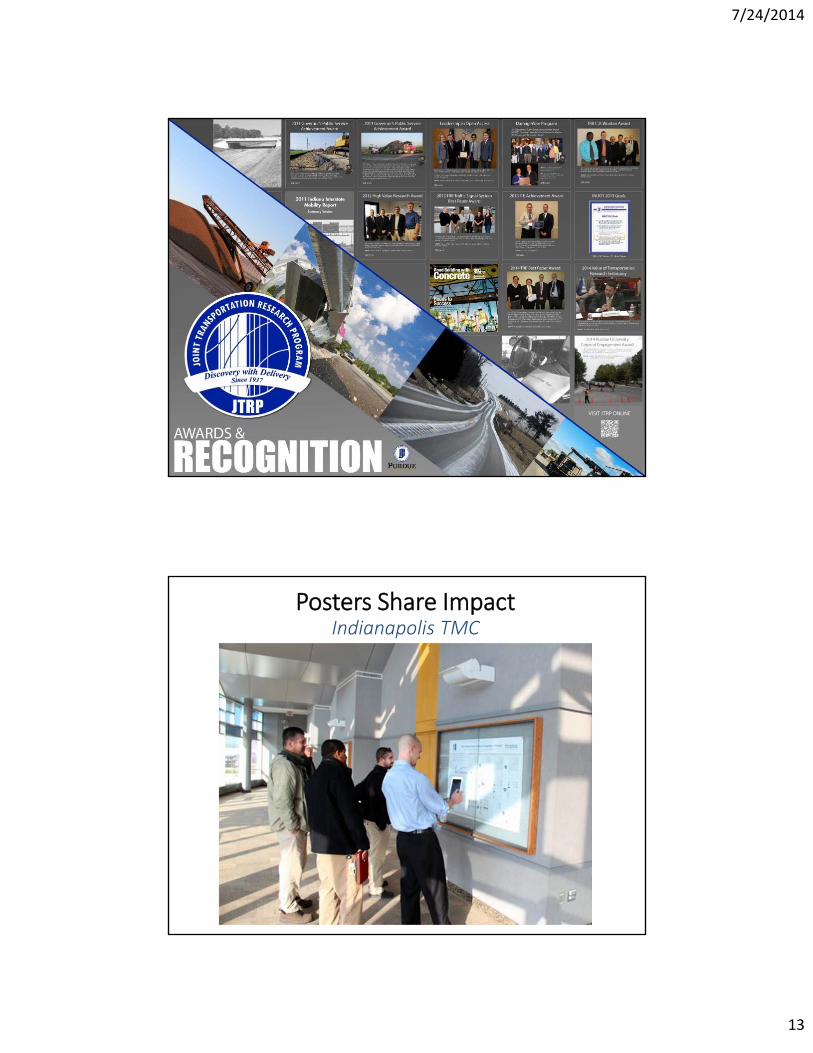
• It is important to have a variety of traditional and non‐traditional media to communicate IMPACT
• Posters, Pocket Portfolio, Video Abstracts, Traditional reports, informal content feed to agency PIO, carefully managed local media engagement
http://www.azdot.gov/CCPartnerships/News/NRel2959.asp

7/24/2014
4
2011 National Recognition“The return on the states’ investment in research is substantial. In just one example, a formal cost analysis in 2003 prepared for the Indiana Department of Transportation’s research program, jointly administered with Purdue University, showed benefit‐cost ratios ranging from as high as 220 to as low as 3 to 1. The average benefit‐cost ratio for nine projects, collectively, was an amazing 59:1. In 2009 a similar analyses was performed with an average benefit‐cost ratio of 32:1. But it is more than just good economics. Research, for example, is producing safer highways and construction zones for its customers and workforce, saving future maintenance expenses, developing longer lasting materials, introducing new technology and processes, developing environmentally friendly solutions, to Indiana’s waste problems, promoting economic growth, bringing on‐line faster and more economical facilities.”
Excerpted from the June 14, 2011, congressional testimony of John Halikowski (Director of Arizona DOT)
We are proud of this attribution, but it is important to back this up with direct measures of impact
Measuring Impact:One size does not fit all
Metrics include:• Mapping into Executive Staff priorities• Saving Dollars• Prioritizing Capital Program• Safety• Outcome Assessment• Extending Infrastructure Life• Leveraging University Resources• Environmental impact• National Recognition of Impact
7/24/2014
5
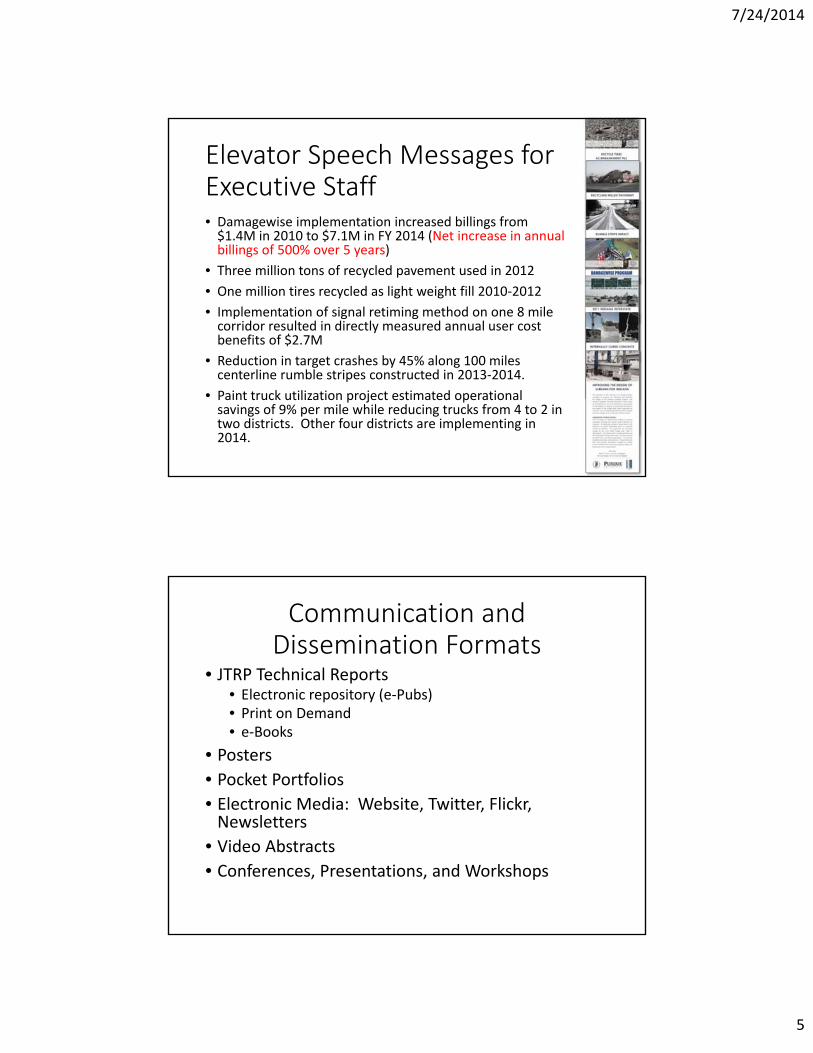
Elevator Speech Messages for Executive Staff• Damagewise implementation increased billings from $1.4M in 2010 to $7.1M in FY 2014 (Net increase in annual billings of 500% over 5 years)
• Three million tons of recycled pavement used in 2012
• One million tires recycled as light weight fill 2010‐2012
• Implementation of signal retiming method on one 8 mile corridor resulted in directly measured annual user cost benefits of $2.7M
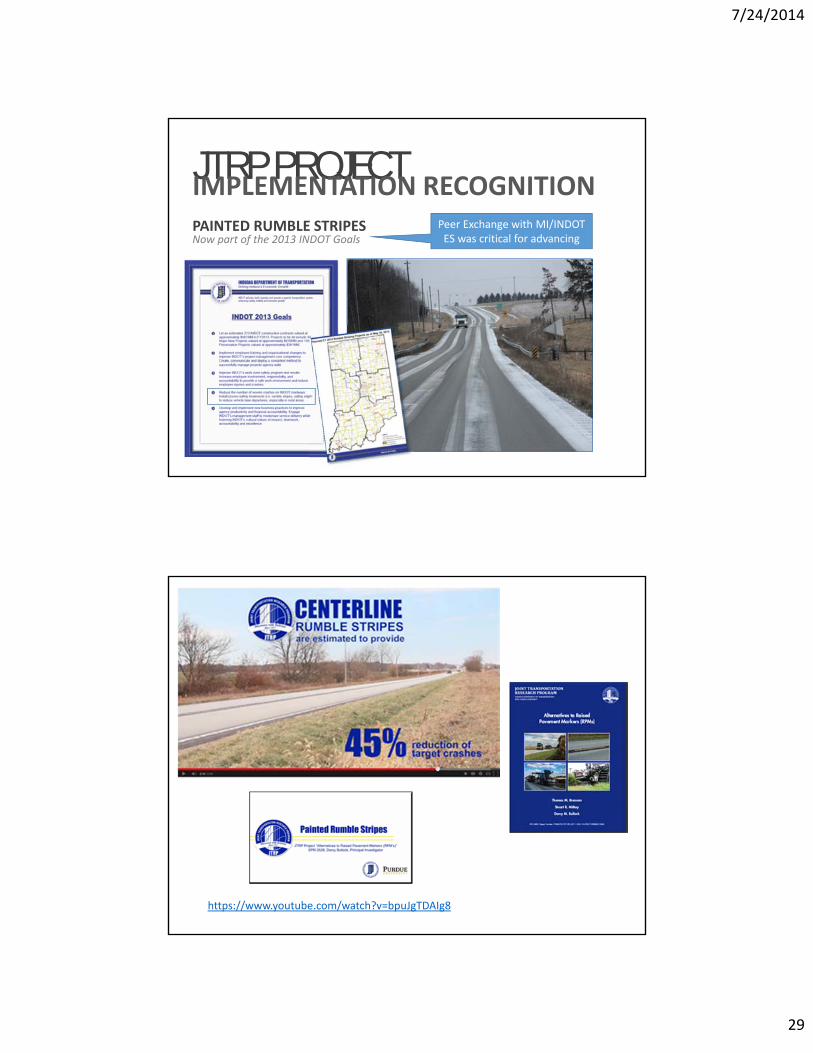
• Reduction in target crashes by 45% along 100 miles centerline rumble stripes constructed in 2013‐2014.
• Paint truck utilization project estimated operational savings of 9% per mile while reducing trucks from 4 to 2 in two districts. Other four districts are implementing in 2014.
Communication and Dissemination Formats
• JTRP Technical Reports• Electronic repository (e‐Pubs)• Print on Demand• e‐Books
• Posters• Pocket Portfolios• Electronic Media: Website, Twitter, Flickr, Newsletters
• Video Abstracts• Conferences, Presentations, and Workshops
7/24/2014
6
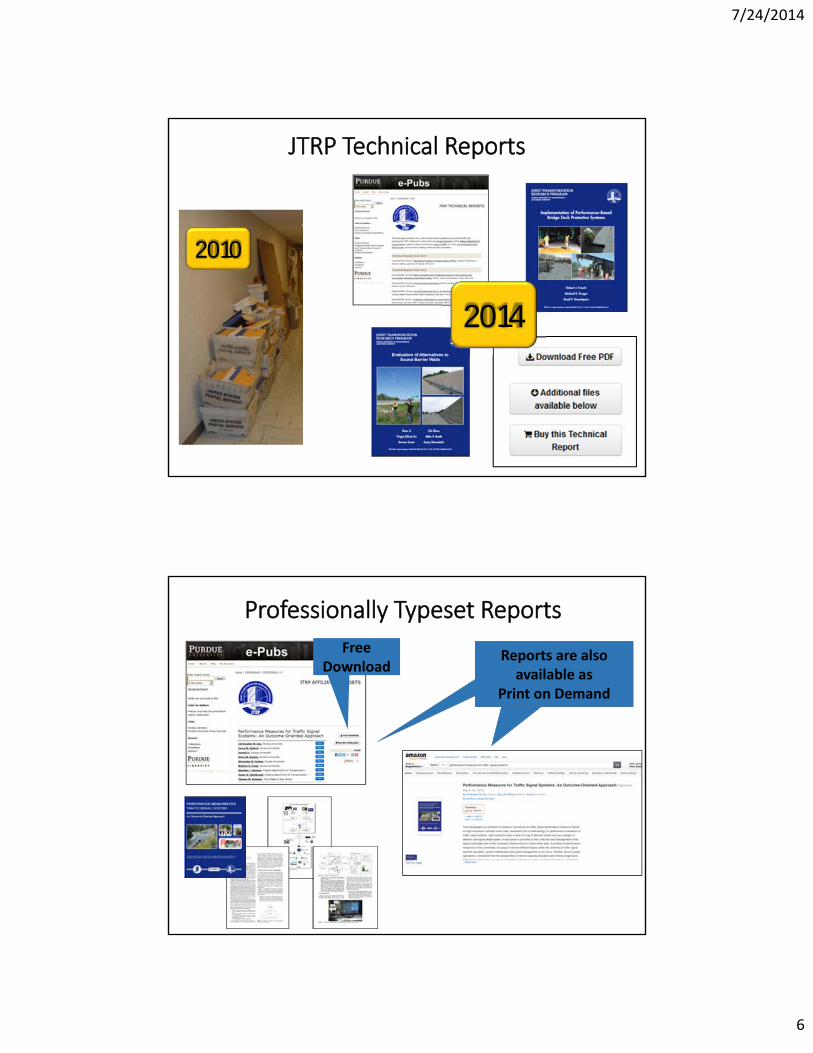
JTRP Technical Reports
2010
2014
Professionally Typeset Reports
Reports are also available as
Print on Demand
Free Download

7/24/2014
7
http://dx.doi.org/10.5703/1288284315209 http://dx.doi.org/10.5703/12882843152014
http://dx.doi.org/10.5703/1288284315216 http://dx.doi.org/10.5703/1288284315220

7/24/2014
8
http://dx.doi.org/10.5703/1288284315221 http://dx.doi.org/10.5703/1288284315224
Increasing Technical Report Impact
E‐Books are available starting with the
2014 JTRP Report Series.
e‐Pubs includes Video Abstracts associated with JTRP Technical Reports.
7/24/2014
9
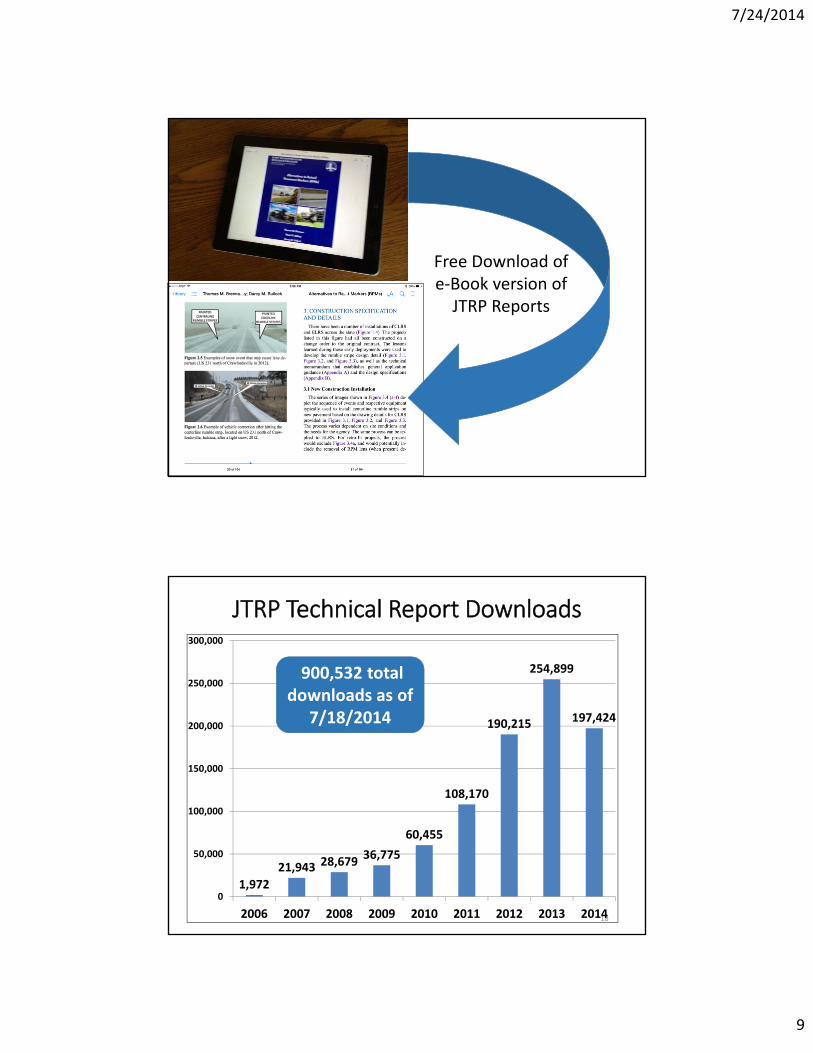
Free Download of e‐Book version of JTRP Reports
JTRP Technical Report Downloads
18
1,972
21,943 28,67936,775
60,455
108,170
190,215
254,899
197,424
0
50,000
100,000
150,000
200,000
250,000
300,000
2006 2007 2008 2009 2010 2011 2012 2013 2014
900,532 total downloads as of
7/18/2014
7/24/2014
10
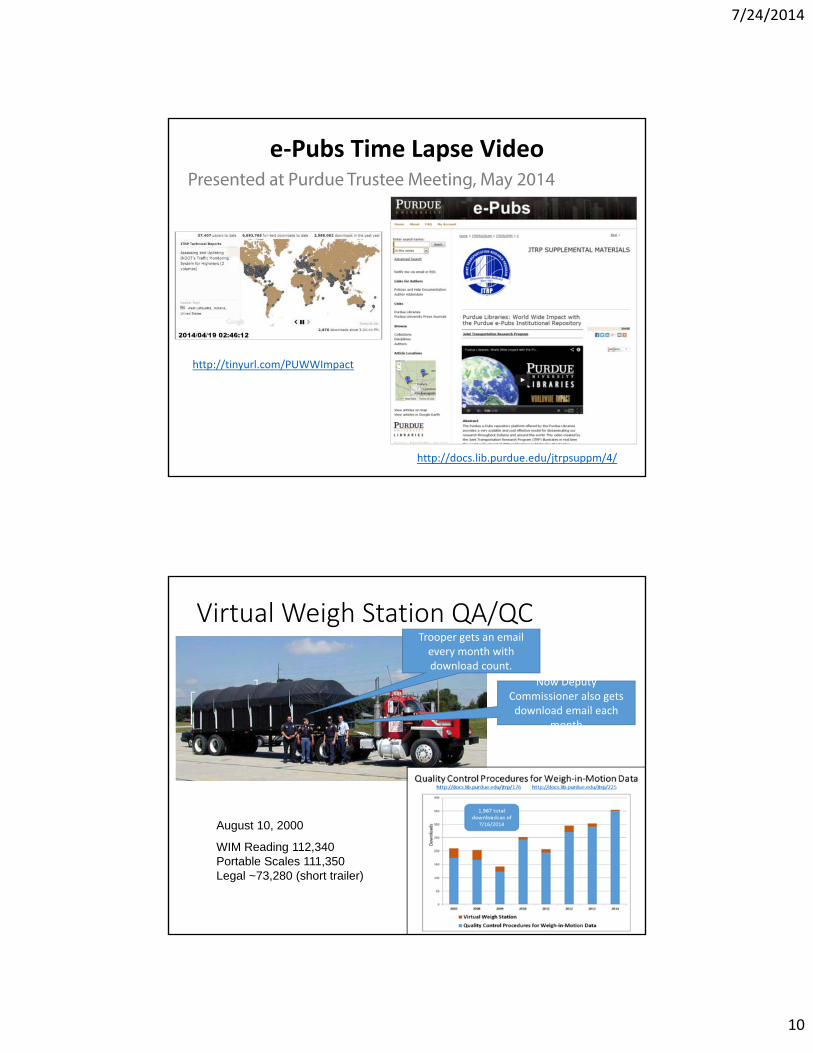
e‐Pubs Time Lapse VideoPresented at Purdue Trustee Meeting, May 2014
http://tinyurl.com/PUWWImpact
http://docs.lib.purdue.edu/jtrpsuppm/4/
Virtual Weigh Station QA/QC
August 10, 2000
WIM Reading 112,340Portable Scales 111,350Legal ~73,280 (short trailer)
Trooper gets an email every month with download count.
Now Deputy Commissioner also gets download email each
month

7/24/2014
11
But…not ever body we need to engage with will read our technical reports Particularly the winter ops guys

7/24/2014
12
7/24/2014
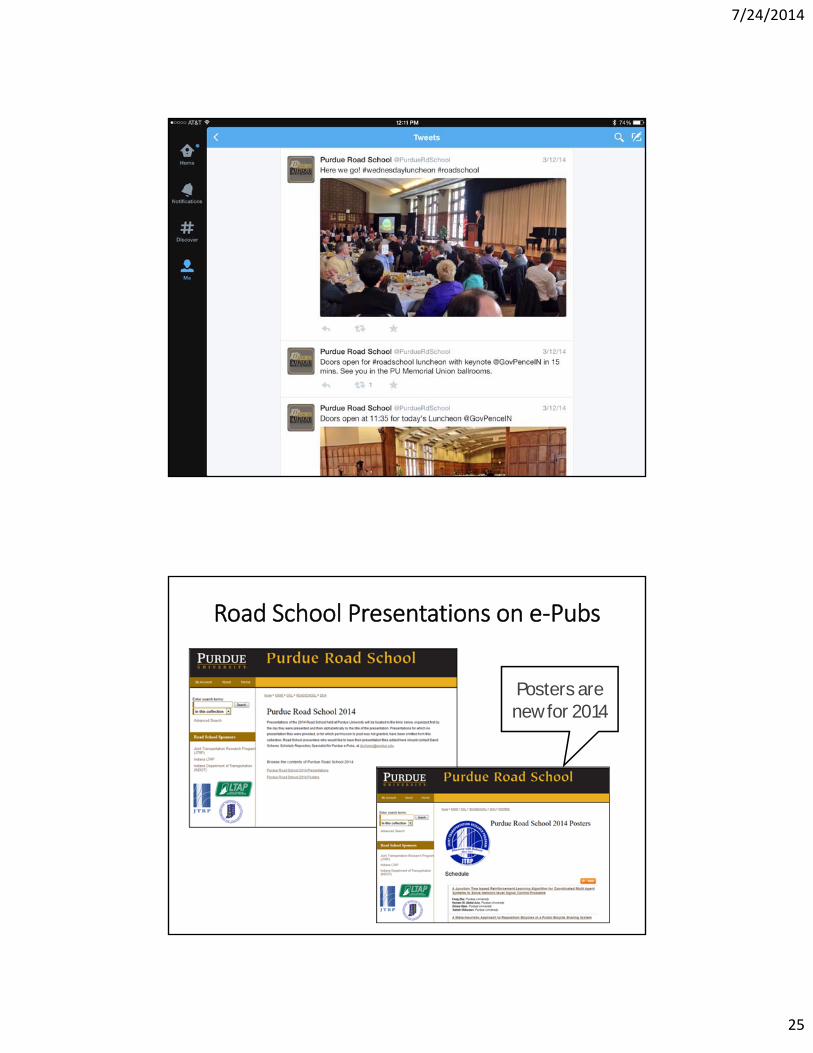
13
Posters Share ImpactIndianapolis TMC

7/24/2014
14
Posters Share ImpactCrawfordsville District and Research Division
Poster Frames will be installed in all districts
this summer.
Posters Share ImpactFHWA Indiana Division

7/24/2014
15
Posters Share ImpactINDOT Central Office
Posters share impact in Indiana
Multiple Displays throughout the State are Refreshed Regularly
o INDOT Offices
o FHWA Office
o Purdue Locations

7/24/2014
16
and beyond….from West Coast
to East Coast
Wow, those posters are amazing! I made sure
that one poster is sitting on the desk of Bill
Dudley, president & CEO of the company.Pat McVicker,
Bechtel CorporationReston, VA

7/24/2014
17
POCKET PORTFOLIO CARDS
On display at Indiana Department of Transportation Central Office.
Pocket Portfolio Cards

7/24/2014
18
Sharing Impact through Electronic Media
Social Media

7/24/2014
19
Outline
1. Message2. Past Efforts/Elevator Pitch3. New communication initiatives to
support engagement4. Series of case studies
illustrating blended communications tools.
5. Dialog
South Split Project Video Production
38

7/24/2014
20
http://youtu.be/CUWF3H_Gk_Q

7/24/2014
21
>20 Million Views
>1.4 Million Views
SOUTH SPLIT PROJECT ANNOUNCEMENT:Virginia Ave. Bridge Hits
SOUTH SPLIT PROJECT UPDATE:Virginia Ave. Steel Beam Installation
DAMAGEWISE IMPLEMENTATION:News Media Circulation
Impact of Video Abstracts is huge, but not directly quantifiable with ROI
Defined the need to the
public
Demonstrated progress to public.
Led to two Gov. Public Sector Achievement
Awards

7/24/2014
22
Damage to State Property
2010 2011 2012 2013 2014Annualized Billings $1.4 $2.4 $4.1 $4.7 $7.1
$0.0
$1.0
$2.0
$3.0
$4.0
$5.0
$6.0
$7.0
$8.0
Dol
lars
in M
illio
ns
Annualized Billings
AnnualizedBillings
000’s in Millions
*
INDOT Annualized Billings Continue to Exceed Previous Years; thereby Improving Resources Returned to the State by Over $2.7 Million Annually.
* Does not include extraordinary $1.0mm in DSP coming from INDOT’s Traffic Management Center.
21
DamageWise Reception“Pink Tag Appreciation”

7/24/2014
23
Conferences, Presentations, Workshops

7/24/2014
24
7/24/2014
25
Road School Presentations on e‐Pubs
Posters are new for 2014

7/24/2014
26
Road School Presentation Downloads35,821 Total as of 7/16/2014
51
1,855
4,6945,947
3,429
2,133
4,999
4,832
2,823
3,319
1,790
0
2,000
4,000
6,000
8,000
10,000
12,000
14,000
16,000
2011 2012 2013 2014
2011 Road School 2012 Road School
2013 Road School 2014 Road School
SPR‐3722: Striping Truck Utilization at Crawfordsville and Greenfield
Project Period: 1/1/2013 to 12/31/2013 (completed project)
Principal Investigators: Jim Handy and Jon Padfield
Paint Striping Truck Saving Dollars

7/24/2014
27
http://alturl.com/wrok3

7/24/2014
28
Paint Truck Reception, 2/17/2014
This has huge motivational impact for future collaboration
SPR‐3528: Alternatives to Raised Pavement Markers (RPM's)
Project Period: 1/1/2011 to 1/30/2014
Principal Investigator: Darcy Bullock
Painted Rumble Stripes Executive Staff Priorities
7/24/2014
29
JTRP PROJECTPAINTED RUMBLE STRIPESNow part of the 2013 INDOT Goals
IMPLEMENTATION RECOGNITIONPeer Exchange with MI/INDOT ES was critical for advancing
https://www.youtube.com/watch?v=bpuJgTDAIg8

7/24/2014
30
SPR‐2857: Tire Shred Backfill in MSE Walls and Embankment
Principal Investigators: Monica Prezzi and Rodrigo Salgado
Recycled Tires Environmental Impact
RECYCLE TIRES AS EMBANKMENT FILLTire shred‐soil mixture backfill is a low‐cost material used in construction projects and provides several advantages over traditional backfill materials:
1. Good drainage2. High shear strength3. Low compacted unit weight 4. Low lateral pressure exerted on retaining structures
It can also be used to shore up slopes prone to landslides and as a backfill behind retaining walls.
Governor’s Public Service Achievement Award
1 MILLIONTIRES FROM2010 - 2012
COSTSREDUCTION
LANDFILLINGMATERIALSPROJECTS
OF

7/24/2014
31
SPR‐2143: Use of Reclaimed Asphalt Pavement (RAP) Under
Superpave Specifications
SPR‐3018: Evaluation of Reclaimed Asphalt Pavement for
Surface Mixtures
Principal Investigator: Rebecca McDaniel
RAP: Reclaimed Asphalt Pavement
Environmental Impact
RECYCLING MILLED PAVEMENT
Reclaimed asphalt pavement (RAP) is an attractivereplacement for a portion of the virgin aggregatesand asphalt liquid. Incorporating milled pavementalso reduces the need for disposal of the asphaltthat contains valuable aggregate and asphalt. JTRP’sparticipation in a regional, multi‐state researcheffort led to new specifications that becameeffective in 2010. Of more than 3 MILLION TONS ofhot‐mixed asphalt placed in 2012, INDOT used over600,000 TONS of recycled asphalt pavement.
The projected cost savings for INDOT is
in contract costs annually.
$10-15 million
TONSOF RECYCLED
ASPHALT PAVEMENTIN 2012
20%OF HMA
7/24/2014
32
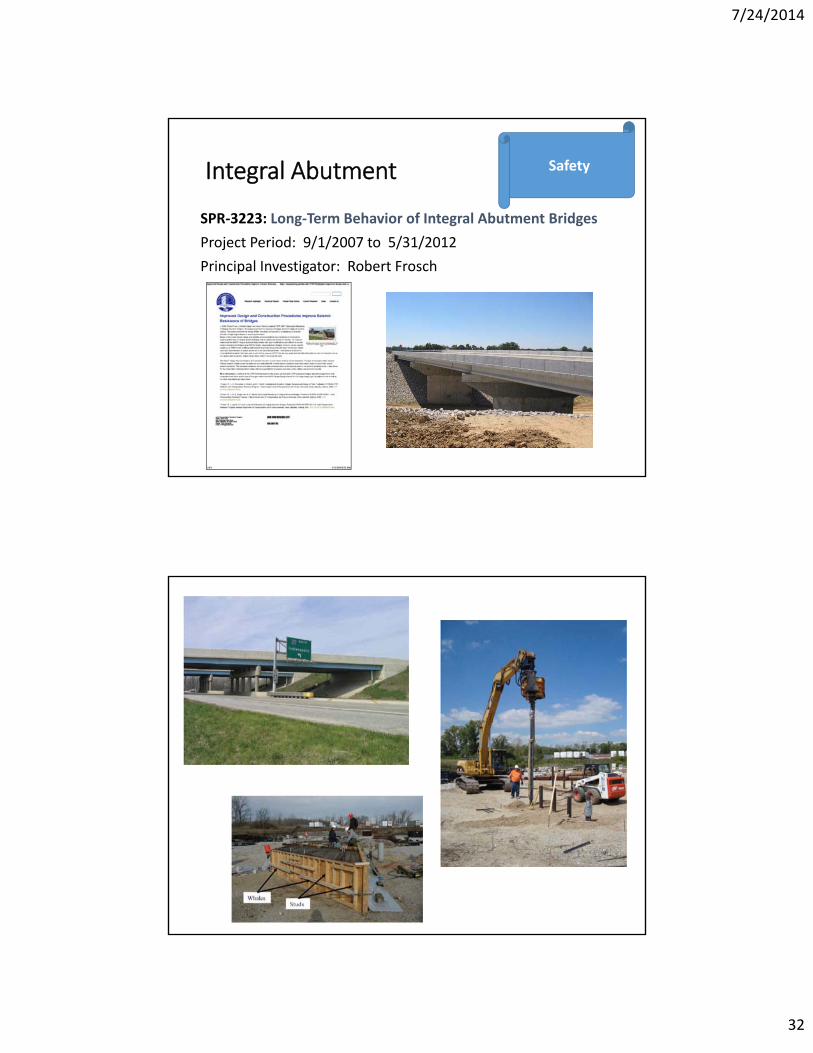
SPR‐3223: Long‐Term Behavior of Integral Abutment Bridges
Project Period: 9/1/2007 to 5/31/2012
Principal Investigator: Robert Frosch
Integral Abutment Safety

7/24/2014
33
Business Owner Comments
This research is one of the most significant projects that I have been a part of in my years at INDOT. We can now easily and with little effort build our way out of seismic risk as we replace older structures. The integral structures will remain in place for an extended period of time by getting rid of the joints. Large structures may have joints but the joint is located off of the bridge. Randy Strain, December 2012
SPR‐3531: Traffic Operation Mobility Measures
Project Period: 1/1/2011 to 10/31/2014
SPR‐3821: Real Time Traffic Mobility Measures
Project Period: 4/1/2014 to 1/31/2016
Principal Investigator: Darcy Bullock
MobilityPrioritizing
Capital Program and Safety

7/24/2014
34
We invest a lot of
resources counting traffic to
model system performance
Challenge
JTRP/INDOT Executive Staff/PU Library

7/24/2014
35
Ohio DOT Peer Exchange(Mobility 2012)
0
300
600
900
1200
1500
1800
2100
2400
2700
262.2
261.3
259.7
255.9
247.5
234.7
230.2
205.5
196.5
188.5
175.7
169.2
150.2
142.3
139.2
133.7
129.6
124.9
123.8
119.3
116.5
115.4
113.6
113.1
111.7
111.0
109.8
106.7
101.6
95.2
83.8
76.4
64.3
55.9
41.6
34.1
24.1
16.4
8.0
5.3
2.9
2.2
1.3
0.8
0.5
0.0
Mile Distance from Ken
tucky State Line
Exit 123: I‐465
Exit 106: I‐465
Exit 6: I‐265
Exit 253: US 30 (Merrillville)
Exit 230: SR 10 (Roselawn)
Exit 201: US 24 (Remington)
Exit 140: SR 32 (Lebanon)
Exit 90: SR 44 (Franklin)
Exit 68: SR 46 (Columbus)
Exit 50: US 50 (Seymour)
Exit 29: SR 56 (Scottsburg)
KY State Line
Exit 172: SR 26 (Lafayette)
Exit 110: I‐70
Exit 112: I‐70
Hours of Speed < 45 mph
Exit 259: I‐80/94 DEC
NOV
OCT
SEP
AUG
JUL
JUN
MAY
APR
MAR
FEB
JAN
DEC
NOV
OCT
SEP
AUG
JUL
JUN
MAY
APR
MAR
FEB
JAN
DEC
NOV
OCT
SEP
AUG
JUL
JUN
MAY
APR
MAR
FEB
JAN
DEC
NOV
OCT
SEP
AUG
JUL
JUN
MAY
APR
MAR
FEB
JAN
DEC
NOV
OCT
SEP
AUG
JUL
JUN
MAY
APR
MAR
FEB
JAN
DEC
NOV
OCT
SEP
AUG
JUL
JUN
MAY
APR
MAR
FEB
JAN
DEC
NOV
OCT
SEP
AUG
JUL
JUN
MAY
APR
MAR
FEB
JAN
DEC
NOV
OCT
SEP
AUG
JUL
JUN
MAY
APR
MAR
FEB
JAN
DEC
NOV
OCT
SEP
AUG
JUL
JUN
MAY
APR
MAR
FEB
JAN
DEC
NOV
OCT
SEP
AUG
JUL
JUN
MAY
APR
MAR
FEB
JAN
DEC
NOV
OCT
SEP
AUG
JUL
JUN
MAY
APR
MAR
FEB
JAN
DEC
NOV
OCT
SEP
AUG
JUL
JUN
MAY
APR
MAR
FEB
JAN
DEC
NOV
OCT
SEP
AUG
JUL
JUN
MAY
APR
MAR
FEB
JAN
Hours of Segment Speed < 45mph, by month
Almost 2600 hrs in a year

7/24/2014
36
94 near Chicago
I‐65 Near Indy
465
Congestion Hours: All Indiana Interstates [90 Million Records]
Applications of Mobility DataWinter Weather Impact
January 2014 Performance
I‐69 Winter Ops Video

7/24/2014
37
0
500
1000
1500
2000
2500
JAN '11
JAN '12
JAN '13
JAN '14
FEB '11
FEB '12
FEB '13
MAR '11
MAR '12
MAR '13
APR '11
APR '12
APR '13
MAY '11
MAY '12
MAY '13
JUN '11
JUN '12
JUN '13
JUL '11
JUL '12
JUL '13
AUG '11
AUG '12
AUG '13
SEP '11
SEP '12
SEP '13
OCT '11
OCT '12
OCT '13
NOV '11
NOV '12
NOV '13
DEC
'11
DEC
'12
DEC
'13
Delay F
I‐465 I‐94 I‐69 I‐70 I‐65 I‐74 I‐64
Jan 2014 Summary2011, 2012, 2013, Jan. 2014
0
10000
20000
30000
40000
50000
60000
JAN '11
JAN '12
JAN '13
JAN '14
FEB '11
FEB '12
FEB '13
MAR '11
MAR '12
MAR '13
APR '11
APR '12
APR '13
MAY '11
MAY '12
MAY '13
JUN '11
JUN '12
JUN '13
JUL '11
JUL '12
JUL '13
AUG '11
AUG '12
AUG '13
SEP '11
SEP '12
SEP '13
OCT '11
OCT '12
OCT '13
NOV '11
NOV '12
NOV '13
DEC
'11
DEC
'12
DEC
'13
Distance W
eighted Congestion Hours
I‐465 I‐94 I‐69 I‐70 I‐65 I‐74 I‐64
0
10000
20000
30000
40000
50000
60000
JAN '11
JAN '12
JAN '13
JAN '14
FEB '11
FEB '12
FEB '13
MAR '11
MAR '12
MAR '13
APR '11
APR '12
APR '13
MAY '11
MAY '12
MAY '13
JUN '11
JUN '12
JUN '13
JUL '11
JUL '12
JUL '13
AUG '11
AUG '12
AUG '13
SEP '11
SEP '12
SEP '13
OCT '11
OCT '12
OCT '13
NOV '11
NOV '12
NOV '13
DEC
'11
DEC
'12
DEC
'13
Congestion Hours
I‐465 I‐94 I‐69 I‐70 I‐65 I‐74 I‐64
Congestion Hours
Distance Weighted Congestion Hours
Delay F
“The Future of Surface Transportation”Congressional Testimony, June 18, 2014
Troy WoodruffChief of Staff
Indiana Department of Transportation
National Impact:Testimony highlighted INDOT and JTRP collaboration in areas of Mobility and Traffic Operations

7/24/2014
38
Outline
1. Message2. Past Efforts/Elevator Pitch3. New communication initiatives to
support engagement4. Series of case studies
illustrating blended communications tools.
5. Dialog
Performance metric and project benefit calculations
Marketing research and research report format
Darcy Bullock, P.E.Professor of Civil Engineering &
Joint Transportation Research Program Director
Purdue University
West Lafayette, IN
Your investment is having IMPACT