performance measurements and modelling of the … measurements and modelling of the orr on fuel cell...
TRANSCRIPT

Electrochimica Acta 179 (2015) 126–136
Performance measurements and modelling of the ORR on fuel cellelectrocatalysts – the modified double trap model
Matthew Markiewicz, Christopher Zalitis 1, Anthony Kucernak *Department of Chemistry, Imperial College London, London SW7 2AZ, United Kingdom
A R T I C L E I N F O
Article history:Received 28 December 2014Received in revised form 9 April 2015Accepted 10 April 2015Available online 25 April 2015
Keywords:oxygen reduction reactionplatinumfuel cellmodellingmass transport
A B S T R A C T
Experimental results for the ORR (oxygen reduction reaction) in perchloric acid for ultra low loading Pt/Celectrodes have been fitted to a number of different ORR mechanisms. These were accomplished as a
function of temperature (280–330 K), oxygen partial pressure(0:01 <po2p0o2
< 1) and potential (0.3–1.0 V vs.
RHE). A reaction exponent for oxygen of 1 �0.1 across the potential range 0.3–0.85 V vs. RHE is confirmed.From the experimental results it is clear that the surface becomes increasingly blocked towards the ORRas overpotential increases (i.e. as the potential decreases from 0.6 to 0.3 V vs. RHE). The double trap model[J.X. Wang, J. Zhang, R.R. Adzic, J. Phys. Chem. A, 111 (2007) 12,702] fails to account for this observation,although we have produced a modified version to include the formation of OOHad intermediates. Theseintermediates block the electrode at larger overpotentials and lead to a decrease in electrocatalystperformance compared to a Tafel type approximation. Furthermore these intermediates can lead to theformation of hydrogen peroxide at large overpotentials, an experimental observation which is currentlypoorly described by models.The decreased activity at large overpotentials suggests that blocking of active catalyst sites may be as
important to catalyst activity in an operating fuel cell as the absolute performance of the electrode in thelow overpotential region as typically measured on an RDE. It may also offer an explanation to theincreased losses seen in fuel cell electrodes at lower catalyst loadings – i.e. the loses, which are typicallyascribed to increased mass transport loses, may instead result from decreased electrocatalyticperformance at high overpotentials.
ã 2015 Z. Published by Elsevier Ltd. This is an open access article under the CC BY license (http://creativecommons.org/licenses/by/4.0/).
Contents lists available at ScienceDirect
Electrochimica Acta
journal homepa ge: www.elsev ier .com/locate /e lectacta
1. Introduction
The electrochemical reduction of O2toH2O is both afundamentallyand practically important reaction. In low temperature fuel cells, suchas the proton exchange membrane fuel cell (PEMFC), it is the singlelargest source of efficiency loss while under load. The sluggishness ofthis reaction necessitates the use of Pt based electrocatalysts atsignificant monetary costs. In order for PEMFCs to achieve costcompetitiveness with combustion engines, it is necessary to reducethe precious metal loading by an order of magnitude.
Although there has been much conjecture as to themechanism of oxygen reduction in acid medium over the lastfifty years, there still is not an overwhelming consensus due tothe lack of suitable experimental validation techniques whichcan accurately identify composition and coverage of surface
* Corresponding author. Tel.: +44 2075945831; fax: +44 2075945804.E-mail address: [email protected] (A. Kucernak).
1 Current address: Johnson Matthey Technology Centre, Blounts Court Road,Sonning Common, Reading, West Berkshire RG4 9NH.
http://dx.doi.org/10.1016/j.electacta.2015.04.0660013-4686/ã 2015 Z. Published by Elsevier Ltd. This is an open access article und
intermediates formed during this reaction. In part this is becauseof the similarity between these intermediates and the surround-ing condensed liquid phase (the product of the ORR). Althoughthere are a large number of possible mechanisms, there arerelatively few kinetic models which have been developed fromthose mechanisms, due to the complexity of the systems, and thelarge number of possible intermediates. In fact the dearth ofalternative models for fitting the orr probably comes aboutbecause previous available electrokinetic data is confined to alimited potential range. Hence it is not possible to distinguishbetween different models and their predictions (or to put itanother way, the results are overparameterised for the availabledata set). Most authors of papers involving extraction ofparameters from orr data (e.g. rotating disk electrode results)use a Butler–Volmer type model to fit their data. Recently, someattempts have been made to develop kinetic models thatexplicitly account for the coverage of these intermediates. Theseapproaches have been shown to accurately reproduce the ORRpolarization curve on single crystal electrodes over the limitedpotential range accessible by RDE techniques [1,2].
er the CC BY license (http://creativecommons.org/licenses/by/4.0/).

Fig. 1. Generalised oxygen reduction pathway after Wroblowa [3]. “*” denotesadsorbed intermediates.
Fig. 2. Cross-section of the electrochemical cell detailing the floating electrodetechnique utilising ultra-low loading electrodes.
M. Markiewicz et al. / Electrochimica Acta 179 (2015) 126–136 127
The mechanism of the ORR is typically thought to occur byeither a direct oxidation to water, or an indirect mechanisminvolving the formation of a peroxide intermediate (Fig. 1)[3–10].
Reduction of catalyst loading necessitates drawing higherspecific current density in order to achieve the same geometriccurrent density (assuming constant particle size and catalyst).Unfortunately, there exists a lack of kinetic studies that haveaccurately probed this high specific current density regime. Thedefault technique used to characterize a catalyst's ORR perfor-mance is the rotating ring-disk electrode (RRDE). The lowdiffusivity and solubility of dissolved oxygen in aqueous electro-lytes limits the potential range at which useful kinetic informationcan be determined, owing to the early onset of mass transportlimitations. The result is that kinetic behaviour observed at lowoverpotentials is assumed to accurately describe higher over-potentials (i.e., high specific current densities). Such extrapolationcan lead to inaccurate predictions. For example, Kucernak andToyoda [11] have shown that platinum black is 10x more activethan Pt/C at low overpotentials; however, this significantenhancement rapidly decreases at higher overpotentials.
Recently, Zalitis et al [12] have reported a new electrode for thecharacterization of catalysts involving gaseous reactants. In thatset-up, reactants are transported to the electrocatalyst in the gasphase rather than in solution, resulting in significantly decreasedtransport resistances. This has allowed the kinetic current of boththe hydrogen oxidation reaction (HOR) and the oxygen reductionreaction (ORR) to be measured over a wide range of overpotentialsin the absence of mass transport effects. The method has achievedarea specific current densities that are orders of magnitude higherthan those observed in the RRDE, and has revealed fine structure inthe HOR that has not been previously identified. Here, we utilizethis technique to study the ORR in aqueous acid electrolyte overthe potential-temperature domain relevant to PEMFCs. We thendevelop models to account for the variation of electrocatalyticperformance with overpotential.
2. Experimental
2.1. General
Electrochemical experiments where performed in a standardjacketed 3-compartment cell that was first cleaned by soaking inacidified KMnO4 overnight, rinsed with dilute acidified H2O2, andthen boiled in ultrapure water (Millipore Milli-Q, 18.2 MV cm). Allgases used where � 5.8N (Air Products), and electrolytes whereprepared using “Suprapure” grade HClO4 (VWR) and ultrapurewater.
PCTE electrode working electrodes with a Pt loading of2–4 mg cm�2 (HiSPEC 9100, 57 wt% Pt on Carbon, Alfa Aesar)where prepared as previously reported [12]. Before use, theelectrodes where cleaned by continuously rinsing the electrodewith hot ultrapure water in a soxhlet extractor for 8 hrs.
2.2. Electrochemical measurements
All electrochemical measurements were carried out using aGamry Reference 600 potentiostat, and using 0.5 or 4 mol dm�3
HClO4 electrolyte. Relatively high concentrations of acid wererequired to reduce the amount of iR drop correction required in theexperiments (see below). The presence of small quantities ofchloride is always of some concern when perchloric acid is used, aschloride is known to strongly poison the ORR. We performed RDEstudies in which known amounts of chloride were added to ouracid solution and we estimate that the background chlorideconcentration is less than 1 mmol dm�3. Compared to the RDEtechnique, the approach used in this study has the addedadvantage that convection of the solution is not required. Thisdecreases the flux of contaminants to the electrode by about twoorders of magnitude compared to the RDE technique, and furtherreduces the impact of solution phase poisons. The specific area ofthe catalyst deposit was calculated from the H(UPD) strippingcharge assuming that one monolayer of hydrogen produces210 mC cmPt
�2, and all current densities are reported using thespecific area of the catalyst.
Electrolytes where thoroughly purged with nitrogen beforemeasurements, and then the cell's headspace was filled with pureoxygen to collect ORR polarization curves. The temperature of theelectrochemical cell was controlled using a recirculating bath(Polyscience digital temperature controller, �0.1 �C). All potentialswhere measured versus a purpose built reversible hydrogenelectrode (RHE), and are reported versus this reference. Electro-chemical impedance measurements were performed during themeasurements, and the results where iR corrected post-measure-ment using the resistance determined from the high frequencyintercept of the impedance response with the real axis of theNyquist plot.
Results and discussion
A schematic representation of the electrochemical cell used inthis work, is shown in Fig. 2. The inset illustrates the polycarbonatetrack etched (PCTE) working electrode. In this set-up, gaseousreactants are transported to the catalyst layer through thehydrophobic porous membrane at rates that far exceed thoseobserved in solution [12]. Specific current densities as high as0.6 A cm�2 have been observed for the HOR using this set-up, andappear to be purely kinetically controlled at potentials between0–1.2 V vs. RHE. The high mass transport achieved using the PCTE

Fig. 3. (a) ORR polarization curves at room temperature obtained using the floating electrode configuration as a function of oxygen partial pressure (Nitrogen diluent), and (b)log-log plot of jspecific versus po2 :3:5mgPt cm�2Pt=C ðRF � 3Þ; 0.5 mol dm�3 HClO4; n = 10 mV s�1. CE = Pt wire, RE = RHE; T = 298K.
0.3 0.4 0.5 0.6 0.7 0.8 0.9
γ
0.5
0.6
0.7
0.8
0.9
1
1.1
1.2
1.3
1.4
1.5
Value+95% CI-95% CI
E vs. RHE / V
Fig. 4. Reaction order of O2 as a function of potential, obtained by analysis of data inFig. 3. Also plotted are the 95% confidence interval obtained from the regression ofthe log(po2 ) vs. log(jspecific) at each measured potential. 3.5 mgPt cm�2 Pt/C
�3 �1
128 M. Markiewicz et al. / Electrochimica Acta 179 (2015) 126–136
electrode revealed fine structure within the HOR polarizationcurve that has not been previously reported, and provides apowerful data set to analyze mechanistic details of fuel cellreactions.
For the ORR, specific current densities as high as 185 mA cm�2
have been achieved using the PCTE electrode. This corresponds to aturnover frequency of 220 s�1. Similar to the HOR, the polarizationcurves appear to be free of mass transport effects. Here, we focuson understanding the polarization curve of the ORR, withparticular emphasis on modelling the transients observed at highmass-transport and overpotentials.
Partial pressure dependence
To determine the reaction order with respect to O2, we firstassume that at large overpotentials the ORR follows the generalTafel type expression
j ¼ j0po2p0o2
!g
ea nFðE�E0Þ=RT (1)
Where, j is the kinetic current density, j0 is the exchange currentdensity, po2 and p0o2are the partial pressures of oxygen at theoperating condition and the standard state, g is the reaction orderof oxygen, a is the symmetry factor, F is Faradays constant, R is theideal gas constant, E0 is the equilibrium potential, E is the appliedpotential, and T is the temperature.
Taking the logarithm of Eq. (1) gives
logðjÞ ¼ glogpo2p0o2
!þ CðEÞ (2)
Where C(E) describes the potential dependence of j; the slope oflog(j) vs. log(po2 ) can then be used to determine the reaction orderat the operating potential. Fig. 3(a) plots the ORR polarisationcurves with po2 ranging from 0.01–0.13 bar (nitrogen diluent), andFig. 3(b) shows an example of the log-log relationship betweenjspecific and po2 at 0.6 V vs. RHE. Consistent with previous reports[13], a clear linear relationship with a slope of one is observed,indicating first order reaction kinetics with respect to O2.
Fig. 4 plots the reaction order of the polarisation curve as afunction of potential, as well as the 95% confidence interval fromthe regression. We find that the reaction order remains invariantbetween 0.85–0.3 V vs. RHE, suggesting that no change inmechanism occurs. At potentials near the onset of the ORR, thefitted reaction order exceeds one. However, this increase is alsoaccompanied by an expanding confidence interval with unitytypically bounded within it. We thus associate this increase withexperimental error at low overpotentials, rather than a change inthe ORR mechanism.
3.1. Double Trap kinetic model
As a first attempt to model the kinetic current of the ORR at highmass transport, we employ the double trap kinetic modelpublished by Wang et al [1]. In this model, the ORR mechanism
(RF � 3); 0.5 mol dm HClO4; n = 10 mV s . CE = Pt wire, RE = RHE; T = 298K.

M. Markiewicz et al. / Electrochimica Acta 179 (2015) 126–136 129
is assumed to follow four elementary steps:
1=2O2 Ð OadDissociativeAdsorptionðDAÞ (3)
1=2O2 þ Hþ þ e� Ð OHadReductiveAdsorption1 ðRA1Þ (4)
Oad þ Hþ þ e� Ð OHad ReductiveTransformation1ðRT1Þ (5)
OHad þ Hþ þ e� Ð H2O ReductiveDesorptionðRDÞ (6)
Using these expressions, the steady state coverage of Oad and OHad
are derived and the kinetic current is taken as calculated from thesum of the electron transfer rates. The details of this model havebeen thoroughly discussed previously [1], and the interestedreader is referred to the original source.
Fig. 5 plots the kinetic current for the ORR using the PCTEelectrode at 298 K. The figure also plots the predictions of thedouble trap kinetic model using the constants reported by Wanget al [1]. In the low overpotential region, we find that the doubletrap model predicts higher currents than those observedexperimentally. Similar observations have been reported usingPt/C catalyst [1], and is likely associated with activity differencesbetween single crystal Pt(111) and Pt/C.
Consistent with previous reports [1], the kinetic double trapmodel can be made to describe the kinetic current at lowoverpotentials upon invoking a scaling factor. Here, a factor of ca.6.7 is required compared with the factor of 3 used by Wang et al.[1], suggesting that the catalyst characterized here is less active inthe low overpotential region. This may be due to differences in thecatalyst itself (E-TEK vs. HiSPEC), differences in operationalconditions (i.e., supporting electrolyte or O2 concentrations), orpossibly due to trace contaminants.
The double trap kinetic model diverges from the experimentaldata at potentials below 0.8 V vs. RHE. Specifically, the modelproduces a linear relationship between log(j) and potential, whileclear curvature is observed using the PCTE electrode. It should benoted that the source data used to validate the data in the paper ofWang et al. achieves mass transport limitation at 0.7 V vs. RHE, so
Fig. 5. Kinetic current polarization curve obtained using the PCTE electrode, andthe predictions of the double trap kinetic model using the constants reported byWang [1]. A scaled version of the model, similar to that reported by Wang [26], isalso supplied. Inset is a plot of the difference in potential between the experimentaldata and the scaled results of Wang et al. as a function of specific current density. Forcomparison the mass transport limited current for ORR on an RDE is displayed.Experimental data: 2.2 mgPt cm�2 Pt/C catalyst (RF � 2.8); 4 mol dm�3 HClO4;n = 10 m V s�1. CE = Pt wire, RE = RHE; T = 298K.
observation of mechanistic effects at potentials lower than 0.8 Vbecomes very difficult.1 For comparison we also plot in Fig. 5 thediffusion limited current for an RDE in 0.1 mol dm�3 HClO4 at298 K. It is clear that the experimental results significantly exceedwhat is possible using the RDE. In contrast, the polarization curvescollected using the PCTE electrode is believed to be free of masstransport effects, and illustrate mechanistic details of the ORR thathave previously not been accounted for [14].
The divergence of the double trap kinetic model result inpredictions that are up to ca. three orders of magnitude greater thanthe experimentally measured kinetic currents reported here. Thisdiscrepancy convincingly suggests that additional and significantmechanistic details are not accounted for by the kinetic double trapmodel when operating at potentials below ca. 0.8 V vs. RHE.
3.2. Adsorbate blocking correction and temperature dependence
In addition to modelling the potential dependence of thepolarization curve, one can also include the temperature depen-dence of the ORR. Here, we derive kinetic expressions for apotential-temperature-current surface rather than a polarizationcurve at constant temperature. The advantage to this sort ofderivation lie in the concurrent fitting of both the potentialdependent and temperature dependent parameters, which mustthen be self-consistent throughout the modelled domain.
In an attempt to account for the over-predictions of the kineticdouble trap model, we first considered the blockage of the surfaceby adsorbed species. At potentials below 0.6 V vs. RHE, the doubletrap kinetic model predicts a constant coverage of OH(ad), (�0.5)and an exponential j-E relationship results. This behaviour ischaracteristically similar to the Butler-Volmer formulation at highoverpotentials when only the cathodic branch needs to beconsidered. We thus attempt to model the polarization curve athigh overpotentials using
jðEÞ ¼ j0cc0
� �ð1 � uÞeðE�E0Þ=2RT (7)
Where c and c0 are the molar concentrations of O2 at the operatingcondition and standard state condition, respectively. The aboveexpression is identical to that commonly used to model the ORR atpotentials where Pt oxides are reduced and become electro-catalytically active. Here, we apply Eq. (7) to a potential regionwhere Pt is predominantly in its reduced state, and the source ofthe u term is an unidentified adsorbate. j0 is thus the net exchangecurrent for the complete ORR mechanism.
Due to the close proximity of the liquid electrolyte, we assumethat the gaseous phase near the electrode-electrolyte interphase issaturated in water vapour. The vapour pressure of water is fittedusing tabulated data [15] and assuming the Clausius–Clapeyronrelationship. The partial pressure of oxygen is then calculated from
po2ðTÞ ¼ p�ð1 � e�4Hvap=Rð1=T�1=T�ÞÞ (8)
Where po2 is the partial pressure of O2 at T, and p* is the partialpressure of O2 in the dry gas, T* is the boiling point of water. Thepartial pressure of O2 in the gas phase is then related to theconcentration of oxygen dissolved in either the Nafion film oraqueous electrolyte using Henry' law.
1 Trivial back calculation of an ideal RDE curve shows that a 5% error indetermining the limiting current translates into a 30% error in the extrapolatedkinetic current when the measured current is 80% of the mass transport limitingvalue. For measured currents closed to the limiting current, the error associatedwith calculating the kinetic current grows very much larger than this value.

Fig. 6. (a) Modelled ORR potential-temperature-current surface assuming a simple active site blockage mechanism, and (b) percent error of the fitted surface. Experimentaldata: 2.2 mgPt cm�2 Pt/C catalyst (RF � 2.8); 4 mol dm�3 HClO4; n = 10 mV s�1. CE = Pt wire, RE = RHE.
Table 1Fitted parameters obtained for Eq. (16) based on a least-squares fit of experimentaldata, results shown in Fig. 6(a).
j0STP Ea/ DH0ad/ DS0ad/ z
/mA cm�2 kJ mol�1 kJ mol�1 J K�1mol�1
Value 2.8 40 �24 6 0.42Std. Error 0.2 2 2 8 0.003
130 M. Markiewicz et al. / Electrochimica Acta 179 (2015) 126–136
caq ¼ kH;cppo2 (9)
We then reference the concentrations to standard temperature andpressures and with dry oxygen in the gas phase, such that
caqc0aq
¼ kH;cppo2k0H;cpp0o2
(10)
The temperature dependence of the Henry's law constant isassumed to follow the van't Hoff equation, such that
kH;cp ¼ k0H;cpe�4H0
solv=R 1=T�1=298:15ð Þ (11)
Combining Eq (10) and (11) then gives the temperature dependantconcentration of dissolved oxygen.
capc0aq
¼ p� e�DH0solv=R 1=T�1=298:15ð Þ
� �1 � e�DHvap=R 1=T�1=T�ð Þ� �
(12)
It should be noted that the solvation enthalpy (DHosolv) is
temperature dependant [16]. However, for simplicity, this depen-dence is neglected.
We assume that the temperature dependence of the exchangecurrent follows the Arrhenius equation,
j0ðTÞ ¼ j0STPe�Ea=R 1=T�1=298:15ð Þ (13)
Where j0STP is the exchange current at the standard state, and Ea isthe apparent activation energy.
The equilibrium coverage of the unidentified blocking adsor-bate is assumed to be described by the Langmuir adsorptionisotherm [17] in which the adsorbate undergoes a reductive step(i.e. coverage increases with decreasing potential). The tempera-ture dependence of this isotherm is accounted for by fitting boththe entropy (DS0ad) and enthalpy (DH0
ad) of adsorption, which areassumed to be invariant over the temperature range studied here,dEeq
addT ¼ �4Seq
adzF : The temperature and potential dependent surface
coverage is then obtained from
uð1 � uÞ ¼ e4S0ad=Re�DH0
ad=RTe�zFE=RT (14)
ð1 � uÞ ¼ 1
1 þ e4S0ad=Re�DH0ad=RTe�zFE=RT
(15)
Where u is the coverage of the surface by the adsorbate, and z is thecharge of the adsorbing species.
Combining Eqs. (7),(12), (13), and (15) gives the final expressionfor the potential-temperature-current surface.
j ðE; TÞ ¼ j0STPe�Ea=R 1=T�1=298:15ð Þ p� e�4Hsolv=R 1=T�1=298:15ð Þ
� �h
1 � e�5151J=R 1=T�1=373:15ð Þ� �i 1
1 þ e4S0ad=Re�4H0ad=RTe�zFE=RT
� �eðE�E0Þ=2RT
(16)
Fig. 6(a) displays the fit of Eq (14) to the experimental data set.Fig. 6(b) plots the percent error between the experimental andmodelled surface. The coefficients of the modelled surface aresummarized in Table 1.
Despite the simplicity of the model derived here, an absoluteerror of 10% is achieved over most of the potential range. Largerdiscrepancies between the model and data are observed at lowoverpotentials, but are still typically less than 20%. The larger thanaverage percent error at high potentials may be due to neglectingother adsorbed species in the model. Indeed the kinetic double trapmodel shows slight potential dependence of uOH at potentialsbetween 0.6–0.7 V vs. RHE. At potentials below 0.6 V, however,good agreement is obtained throughout the potential andtemperature range studied here.
The equilibrium potential for the unidentified adsorbate iseasily calculated from the DH0
ad, DS0ad, and z using
E0 ¼ �ðDH0ad � TDS0adÞzF
(17)
The model fits an E0 of 0.637 V vs. RHE, with a 95% confidenceinterval of 0.789–0.485 V vs. RHE. It is interesting to note that theequilibrium potential for the adsorbate agrees well with the2e–reduction of O2 to H2O2.
O2 þ 2Hþ þ 2e� Ð H2O2 E0 ¼ 0:695 V (18)
DFT calculations by Norskov et al [18] suggest that the ORR changesfrom a dissociative mechanism (Oad and OHad intermediates) at

M. Markiewicz et al. / Electrochimica Acta 179 (2015) 126–136 131
potentials above 0.8 V vs. RHE to one involving the formation ofintermediate OOH (i.e. an associative mechanism). It seemsplausible that the blocking species fitted by Eq (16) may be anintermediate in this associative mechanism, if indeed not from theformation of adsorbed OOH, as this uncharged species is known tobe very unstable in the solution phase [19]. The production of H2O2
via the indirect mechanism is of practical importance due to itsknown participation in the degradation of the perfluorosulfonicacid membrane commonly used in PEMFCs [20]. The quantificationof this process is most commonly achieved by detecting solutionphase H2O2 at the ring electrode in the RRDE, and has resulted in apervasive opinion that the indirect mechanism is a minorcontributor to the ORR until potentials are in the H(UPD) regionor in the absence of strong adsorbates. However, previous work inour group challenged this perception - utilizing single platinumparticles, it was found that the effective number of electronsinvolved in the ORR is less than 4 under conditions of high masstransport [21], suggesting that the peroxide route was a significantone, but that detected peroxide concentration away from theelectrode was low due to its relatively strong binding strength.Such a view has also been championed by Ke et al [22], who havedemonstrated that the amount of H2O2 produced at moderateoverpotentials and subsequently collected at the ring electrode is afunction of catalyst loading. This relationship is argued to be aresult of the re-adsorption of solution phase H2O2 onto the diskelectrode, where it is further reduced to water.
The fitted value of z = 0.5 is intriguing; at first glance it appearsto be inconsistent with the formation of OOH(ad). However, this isnot necessarily the case. Specifically, combining Eq. (15) and (17),substituting in z and multiplying by a hypothetical rate constant(v0) gives
0 ¼ n0ð1 � uÞe0:5ðE0adÞ=RT � n0u (19)
The first product of Eq. (19) is equivalent to an electrochemicaladsorption following a Tafel type potential dependence (a = 0.5),while the latter is equivalent to a non-electrochemical transfor-mation/elimination; the full form resembles a steady stateapproximation for an intermediate that only has these twopathways accessible. However, it would be necessary that thefundamental rate constants describing the rate of formation andtransformation/elimination be nearly identical. To investigate thepossibility that the blocking adsorbate is a result of the associativepathway, we next modify the double trap kinetic model toexplicitly include it.
3.3. Modified Double Trap
To account for intermediates that are likely formed duringthe associative ORR mechanism, we modify the double trapkinetic model to include two additional fundamental steps. Thefirst step involves the reductive addition of a proton to anoxygen molecule as suggested by Sepa et al. as being the rds foroxygen reduction on platinum in acid [23], and also by Norskovet al [18], and used in the model by Jinnouchi et al [18].Formally this step produces an adsorbed protonated superoxideintermediate:
O2 þ Hþ þ e� Ð HO2ðadÞReductiveAddition2ðRA2Þ (20)
The second step involves the reductive addition of a second proton,followed by dissociation into OH(ad) [24]
HO2 þ Hþ þ e� Ð 2OHad ReductiveTransformation2ðRT2Þ (21)
Whilst this step is written as an elementary step, it may involveintermediate steps, such as the formation of an intermediateperoxide species [24], or the intermediate formation of O(ad) [2].
Addition of these steps is important, as it allows the formation ofsolution phase hydrogen peroxide, especially at lower potentials,an aspect currently not included within the double trap model.Production of solution phase peroxide may occur through reactionwith adsorbed hydrogen, H(ad)
HO2ðadÞ þ HðadÞ ! H2O2ðadÞ (22)
Or via disproportionation through a route equivalent to thesolution phase reaction
2HO2ðadÞ Ð H2O2ðaqÞ þ O2ðaqÞ (23)
The kinetics of the solution phase reaction are exceedingly fast,with the second order rate constant, kobs = 8.3 � 0.7 105 dm3
mol�1 s�1 [19]. For simplicities sake we have not included Eq (22) &(23) in the model presented in this paper. It might not be expectedthat a large coverage of HO2(ad) occurs on the surface. However, OHis also unstable in solution, but perfectly stable (and consideredpart of the oxide growth mechanism) on platinum. Clearly, solutionphase stability may not be a good predictor of surface stability (ormore precisely, the form of the surface adsorbed species may bedifferent to that of the solution species due to electron transferbetween the adsorbed species and the surface). In the model belowwe use the term HO2(ad) to represent a blocking species formedalong the RA2 pathway,
With the addition of these steps, the steady state approxima-tions becomes
duOdt
¼ vDA � vRT1 ¼ 0 (24)
duOHdt
¼ vRA1 þ vRT1 þ 2vRT2 � vRD ¼ 0 (25)
duHO2
dt¼ vRA2 � vRT2 ¼ 0 (26)
where vi is the rate of the ith step. The rates of these additionalreactions at E0 for the ORR are defined as
vRA2 ¼ kRA2aO2aHþ ð1 � uO � uOH � uHO2 ÞeðE0�EÞ=2kT
� k�RA2uHO2e�ðE0�EÞ=2kT (27)
vRT2 ¼ kRT2uHO2aHþ ð1 � uO � uOH � uHO2
ÞeðE0�EÞ=2kT
� k�RT2u2OH2e
�ðE0�EÞ=2kT (28)
where ki and k-i are the forward and reverse rate constant of the ith
step at E0 for the ORR. At the equilibrium potential, we can thendefine the exchange rates as
v0RA2 ¼ kRA2a0O2a0Hþ ð1 � u0O � u0OH � u0HO2
Þ ¼ k�RA2u0HO2
(29)
v0RT2 ¼ kRT2u0HO2
a0Hþ ð1 � u0O � u0OH � u0HO2Þ ¼ k�RT2ðu0OHÞ2 (30)
Then, dividing Eqs (27) and (28) by Eqs (29) and (30) givesexpressions for the kinetic rate relative to the exchange rate.
vRA2 ¼ v0RA2ð1 � u0O � u0OH � u0HO2
ÞaO2
a0O2
!aHþ
a0Hþ
!"
ð1 � uO � uOH � uHO2 ÞeðE0�EÞ=2kT
� uHO2
ð1 � u0O � u0OH � u0HO2Þ
u0HO2
!e�ðE0�EÞ=2kT
#(31)

132 M. Markiewicz et al. / Electrochimica Acta 179 (2015) 126–136
vRT2 ¼ v0RT2u0HO2
ð1 � u0O � u0OH � u0HO2Þ
aHþ
a0Hþ
!uHO2
"
ð1 � uO � uOH � uHO2 ÞeðE0�EÞ=2kT
� u2OHu0HO2
ð1 � u0O � u0OH � u0HO2Þ
u0HO� �2
0B@
1CAe�ðE0�EÞ=2kT
#(32)
Assuming that the Langmuir adsorption isotherm applies, theGibb's energy of adsorption (DG0
i) is related to the equilibriumcoverage by
e�4G0HO2 ¼ u0HO2
1 � u0O � u0HO � u0HO2
(33)
e�4G0OH ¼ u0OH
1 � u0O � u0OH � u0OH2
(34)
Combining Eqs (29)–(34) then gives rate expressions related to theforward rate constant and the Gibb's energy of adsorption of theintermediates at E0
vRA2 ¼ kRA2a0O2a0Hþ
aO2
a0O2
!aHþ
a0Hþ
!"
ð1 � uO � uOH � uHO2 ÞeðE0�EÞ=2kT
� uHO2e4G0
HO2=kTe�ðE0�EÞ=2kT
#Eq. 35
vRT2 ¼ kRT2a0HþaHþ
a0Hþ
!uHO2
ð1 � uO � uOH � uHO2ÞeðE0�EÞ=2kT
"
�u2OHe�ð4G0HO2
�24G0OHÞ=kTe�ðE0�EÞ=2kT
#Eq. 36
Assuming that concentration polarization is negligible (i.e., ai = ai0),and defining j = Fv, the intrinsic exchange currents for the forwardand reverse processes at E0 can then be defined as
j0RA2 ¼ FkRA2a0O2a0Hþ (37)
j0�RA2 ¼ j0RA2e4G0
HO2=kT (38)
j0RT2 ¼ FkRT2a0Hþ (39)
j0�RT2 ¼ j0RT2e�ð4G0
HO2�24G0
OHÞ=kT (40)
Combining Eqs 35-40 then gives the final potential dependentexpression for the two additional fundamental steps.
jRA2 ¼ j0RA2ð1 � uO � uOH � uHO2ÞeðE0�EÞ=2kT
� j0�RA2uHO2e�ðE0�EÞ=2kT (41)
jRT2 ¼ j0RT2uHO2 ð1 � uO � uOH � uHO2 ÞeðE0�EÞ=2kT
� j0�RT2u2OHe
�ðE0�EÞ=2kT (42)
We derive expressions for the original mechanism Eqs. (3)–(6) inthe same manner as outlined above. They are identical to thoseoriginally published by Wang et al., but additional include HO2
coverage.
jDA ¼ j0DAð1 � uO � uOH � uHO2Þ � j0�DAuO (43)
jRA1 ¼ j0RA1ð1 � uO � uOH � uHO2 ÞeðE0�EÞ=2kT
� j0�RA1uOHe�ðE0�EÞ=2KT (44)
jRT1 ¼ j0RT1uOeðE0�EÞ=2kT � j0�RT1uOHe
�ðE0�EÞ=2kT (45)
jRD ¼ j0RDuOHeðE0�EÞ=2kT � j0�RDð1 � uO � uOH � uHO2 Þe�ðE0�EÞ=2kT (46)
Where the exchange currents are defined as
j0DA ¼ FkDAða0O2Þ1
2= (47)
j0RA1 ¼ FkRA1a0Hþ ða0O2Þ1
2= (48)
j0RT1 ¼ FkRT1a0Hþ (49)
j0RD1 ¼ FkRD1a0Hþ (50)
j0�DA ¼ j0DAe4G0O=kT (51)
j0�RA1 ¼ j0�RA1e4G0OH=kT (52)
j0�RT1 ¼ j0RT1eð4G0
OH�4G0OÞ=kT (53)
j0�RD ¼ j0RDe�4G0
OH=kT (54)
The potential dependence coverage of all species was solvedsymbolically in MATLAB from the steady state approximationEqs (24)–(26) using Eqs. (41)–(46) and ji = Fvi. Although the steadystate approximation can be solved, the solution to this problem istoo complex to reproduce here owing to the second orderdependence of Eq. (42) on uOH. However, the derived MATLABfunction is supplied in the supplemental information for reference.
Fig. 7 plots the ORR polarization curve at 298K, and the modelfit using the parameters supplied in Table 2. Excellent agreementbetween the experimental data and the model is achieved over thefull potential range, with a percent error of only ca. 4% across theentire range of potentials studied –0.9 to 0.3 V. Although onecannot definitively identify the adsorbed blocking species throughthe mechanistic modelling presented here, it is impressive thatmodifying the double trap kinetic model to include an additionalintermediate at high overpotentials enables it to replicate thepolarization behaviour over a range of 0.6 V (i.e., ca. 11 orders ofmagnitude change in rate constants).
The model converges on adsorption energies for Oad and OHad
that agree reasonably well with those reported by Wang et al.However, we find that the rate of DA and RT1 are significantlyhigher. It has been previously reported that step edges are moreactive towards the cleavage of the O��O bond than terrace sites[25]. Given that nanoparticles have a significantly higher density of

0.2 0.4 0.6 0.8 1
-103
-102
-101
-100
-10-1
-10-2
ExpModel
0.2 0.4 0.6 0.8 1-8
-6
-4
-2
0
2
4
6(a) (b)
E vs. RHE / V
j(Nor
m. P
t sur
f.)/ m
Acm
-2
E vs. RHE / V
(j Exp
t.- jm
odel
) jE
xpt .
-1(%
)
Fig. 7. (a) Polarization curve for the ORR at 298K and the modelled curve using the modified double trap kinetic model, and (b) percent error between the model andexperimental data. Experimental data: 2.2 mgPt cm�2 Pt/C catalyst (RF � 2.8); 4 mol dm�3 HClO4; n = 10 mV s�1. CE = Pt wire, RE = RHE; T = 298K.
M. Markiewicz et al. / Electrochimica Acta 179 (2015) 126–136 133
edge sites than well prepared Pt(111), we suspect that the largedifference between these two values may be associated with theedge site density. These differences may be the source of thescaling factor needed in Fig. 5, as presented originally by Wang et al[26].
Unsurprisingly, there is a high degree of coupling between therates of RT2, and RA2 that allows the fitted values to varysignificantly without changing the accuracy of the resulting fit.The rate constants for RT2 and RA2 are identical within theirfitted errors, which is consistent with the steady state approxi-mation derived from the simple adsorbate blocking mechanismEq. (19). Clearly, the two models have converged on qualitativelyidentical solutions for the adsorbate isotherm. Similar to theadsorbate blockage model discussed previously, any value for jRA2and jRT2 (i.e., any v0) will sufficiently describe the kineticbehaviour at high overpotentials as long as their ratio is nearunity, as illustrated by the wide range of values in Table 2 forthese fitted values.
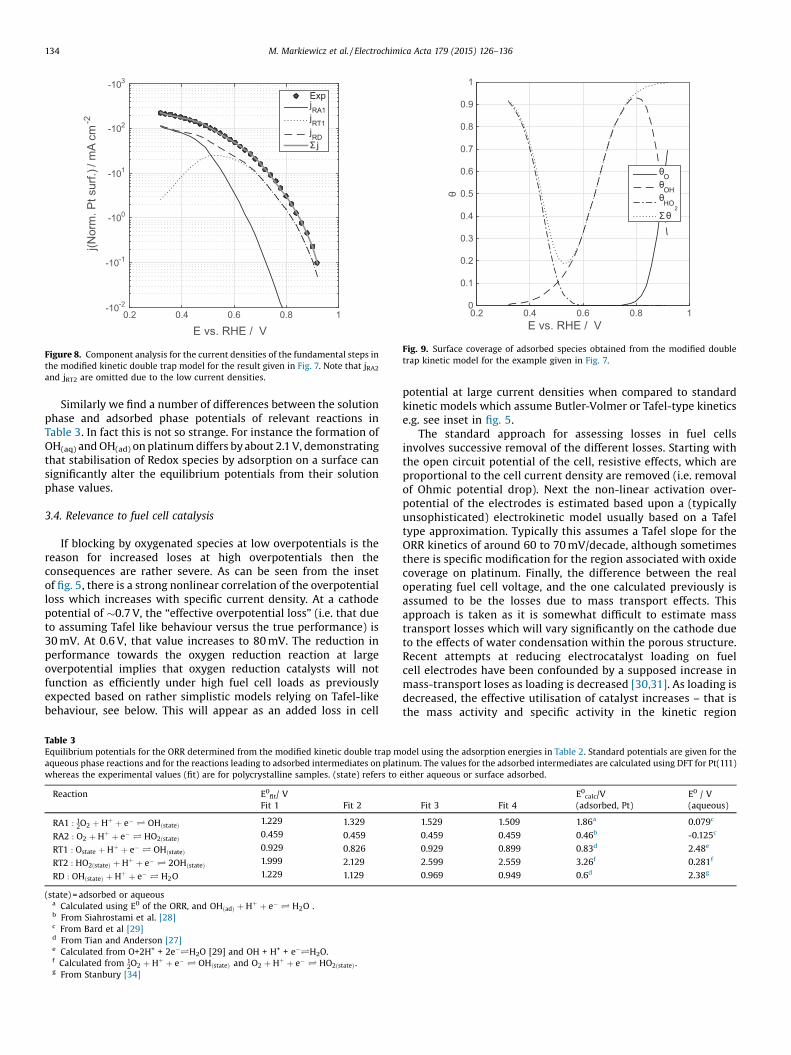
The current generation is well described by the sum of jRA1, jRT1,and jRD (Fig. 8). This behaviour suggest that the ORR over Pt/Cpredominantly occurs via rapid dissociative adsorption to formO(ad), followed by stepwise reduction of O(ad) to water. At higherover-potentials, site blocking by an intermediate that is formed viaan electron transfer reaction then hinders the overall rate of theORR. Hence the surface becomes poisoned at high overpotentials
Table 2Examples of trial fits that well-describe the ORR polarization curves using the modified
using the unmodified double trap model for Pt(111) is provided for comparison. Fit is
Fit # J0DA J0RA1 J0RA2 J0RT1 J0R/A cm–2 /A cm–2 /A cm–2 /A cm–2 /A
1 0.03 3x10⁻⁸ 1.85x10–60 0.2 1.9(0.02) (2x10⁻⁸) (0.08 x10-60) (2) (0
2 0.03 3x10⁻⁸ 0.9x10⁻¹⁶ 0.5x10⁻⁷ 0.(0.03) (2x10⁻⁸) (2.0 x10⁻¹⁶) (5.0x10⁻⁷) (2
3 0.03 3x10⁻⁸ 5.7x10–36 0.4x10⁻⁴ 6.(0.02) (2x10⁻⁸) (0.1 x10-36) (5.0x10⁻⁴) (0
4 0.03 2x10⁻⁸ 1.38x10⁻¹⁸ 0.3x10⁻⁴ 1.4(0.02) (2x10⁻⁸) (0.06 x10⁻¹⁸) (2.8x10⁻⁴) (0
Literature [1] 4.3x10⁻⁵ 1.7x10⁻⁸ – 3.3x10⁻⁹ –
by an alternate pathway which opens up at lower potentials andwhich ultimately can lead to formation of soluble peroxide, Fig. 9.
Despite the coupling of the rates involving the adsorbedblocking species, it is still possible to determine the equilibriumpotentials for the fundamental steps by equating the forward andreverse reactions and solving for the potential. These potentials aretabulated in Table 3. We find that the equilibrium potentials forRA2 and RT1 agree reasonable well with ab initio calculationsreported in the literature; however, somewhat greater variation inthe fitted potentials of RA1, RT2, and RD is observed. It appears thatthe model adequately captures the passivation of the ORR bystrongly bound oxides and the onset of the associative mechanism,but there appears to be discrepancies with the equilibriumpotentials that describe the transitions between intermediates.There is also a larger spread in the values for these steps withoutsignificantly altering the goodness of fit, suggesting that the modelis less governed by these steps.
The value calculated for RA2 is E0 = 0.46 V, This is close to thevalue of 0.40 V calculated in the paper of Tian and Anderson [27],and 0.46 as reported by Siahrostami et al [28]. In contrast, thesolution phase reduction of oxygen to the superoxide acid,equivalent to the solution phase version of reaction RA2
O2 þ Hþ þ e� Ð HO2ðaqÞ (55)
is -0.125 V vs RHE.[29].
double trap kinetic model. Note that uncertainties are supplied in brackets, and fitspresented in Figure 7(a).
T2 J0RD J0RA2/J0RT2 DG0O DG0
OH DG0HO2
cm–2 /A cm–2 /eV /eV /eV
x10–60 4x10⁻⁷ 0.97 �0.3 0 0.77.2x10–60) (1x10⁻⁷) (0.1) (0.1) (0.03)9x10–16 0.2x10⁻⁵ 1 �0.5 �0.1 0.77.4x10–16) (9.2x10⁻⁵) (0.1) (0.1) (0.03)0x10–36 4x10⁻⁷ 0.95 �0.6 �0.3 0.77.5 x10-36) (1x10⁻⁷) (0.1) (0.1) (0.03)x10–18 4x10⁻⁷ 0.99 �0.61 �0.28 0.77.2 x10-18) (1x10⁻⁷) (0.01) (0.07) (0.03)
2.0x10⁻⁸ –0.477 –0.120 –
0.2 0.4 0.6 0.8 1
θ
0
0.1
0.2
0.3
0.4
0.5
0.6
0.7
0.8
0.9
1
θOθ
OHθ
HO2
Σθ
E vs. RHE / V
Fig. 9. Surface coverage of adsorbed species obtained from the modified doubletrap kinetic model for the example given in Fig. 7.
0.2 0.4 0.6 0.8 1-10-2
-10-1
-100
-101
-102
-103
ExpjRA1jRT1jRDΣ j
E vs. RHE / V
j(Nor
m. P
t sur
f.)/ m
Acm
-2
Figure 8. Component analysis for the current densities of the fundamental steps inthe modified kinetic double trap model for the result given in Fig. 7. Note that jRA2and jRT2 are omitted due to the low current densities.
134 M. Markiewicz et al. / Electrochimica Acta 179 (2015) 126–136
Similarly we find a number of differences between the solutionphase and adsorbed phase potentials of relevant reactions inTable 3. In fact this is not so strange. For instance the formation ofOH(aq) and OH(ad) on platinum differs by about 2.1 V, demonstratingthat stabilisation of Redox species by adsorption on a surface cansignificantly alter the equilibrium potentials from their solutionphase values.
3.4. Relevance to fuel cell catalysis
If blocking by oxygenated species at low overpotentials is thereason for increased loses at high overpotentials then theconsequences are rather severe. As can be seen from the insetof fig. 5, there is a strong nonlinear correlation of the overpotentialloss which increases with specific current density. At a cathodepotential of �0.7 V, the “effective overpotential loss” (i.e. that dueto assuming Tafel like behaviour versus the true performance) is30 mV. At 0.6 V, that value increases to 80 mV. The reduction inperformance towards the oxygen reduction reaction at largeoverpotential implies that oxygen reduction catalysts will notfunction as efficiently under high fuel cell loads as previouslyexpected based on rather simplistic models relying on Tafel-likebehaviour, see below. This will appear as an added loss in cell
Table 3Equilibrium potentials for the ORR determined from the modified kinetic double trap maqueous phase reactions and for the reactions leading to adsorbed intermediates on platiwhereas the experimental values (fit) are for polycrystalline samples. (state) refers to
Reaction E0fit/ V
Fit 1 Fit 2
RA1 : 12O2 þ Hþ þ e� Ð OHðstateÞ 1.229 1.329
RA2 : O2 þ Hþ þ e� Ð HO2ðstateÞ 0.459 0.459
RT1 : Ostate þ Hþ þ e� Ð OHðstateÞ 0.929 0.826
RT2 : HO2ðstateÞ þ Hþ þ e� Ð 2OHðstateÞ 1.999 2.129
RD : OHðstateÞ þ Hþ þ e� Ð H2O 1.229 1.129
(state) = adsorbed or aqueousa Calculated using E0 of the ORR, and OHðadÞ þ Hþ þ e� Ð H2O .b From Siahrostami et al. [28]c From Bard et al [29]d From Tian and Anderson [27]e Calculated from O+2H+ + 2e�ÐH2O [29] and OH + H+ + e�ÐH2O.f Calculated from 1
2O2 þ Hþ þ e� Ð OHðstateÞ and O2 þ Hþ þ e� Ð HO2ðstateÞ .g From Stanbury [34]
potential at large current densities when compared to standardkinetic models which assume Butler-Volmer or Tafel-type kineticse.g. see inset in fig. 5.
The standard approach for assessing losses in fuel cellsinvolves successive removal of the different losses. Starting withthe open circuit potential of the cell, resistive effects, which areproportional to the cell current density are removed (i.e. removalof Ohmic potential drop). Next the non-linear activation over-potential of the electrodes is estimated based upon a (typicallyunsophisticated) electrokinetic model usually based on a Tafeltype approximation. Typically this assumes a Tafel slope for theORR kinetics of around 60 to 70 mV/decade, although sometimesthere is specific modification for the region associated with oxidecoverage on platinum. Finally, the difference between the realoperating fuel cell voltage, and the one calculated previously isassumed to be the losses due to mass transport effects. Thisapproach is taken as it is somewhat difficult to estimate masstransport losses which will vary significantly on the cathode dueto the effects of water condensation within the porous structure.Recent attempts at reducing electrocatalyst loading on fuelcell electrodes have been confounded by a supposed increase inmass-transport loses as loading is decreased [30,31]. As loading isdecreased, the effective utilisation of catalyst increases – that isthe mass activity and specific activity in the kinetic region
odel using the adsorption energies in Table 2. Standard potentials are given for thenum. The values for the adsorbed intermediates are calculated using DFT for Pt(111)either aqueous or surface adsorbed.
E0calc/V E0 / VFit 3 Fit 4 (adsorbed, Pt) (aqueous)
1.529 1.509 1.86a 0.079c
0.459 0.459 0.46b -0.125c
0.929 0.899 0.83d 2.48e
2.599 2.559 3.26f 0.281f
0.969 0.949 0.6d 2.38g

M. Markiewicz et al. / Electrochimica Acta 179 (2015) 126–136 135
improves [32]. This effect comes about because the catalyst ismore favourably disposed within the catalyst layer, leading to less“shielding” of catalyst particles by one another. However, itmight be expected that mass transport effects should be reducedunder these circumstances. Hence, increased mass transporteffects with reduced loading are somewhat counterintuitive andremain the subject of some discussion. For instance Yoon andWeber contend that some of the effect is due to a sub-unityoxygen stoichiometry in the kinetic equation (g = 0.8), along withsevere limitations in diffusion of oxygen through the perfluor-osulfonic acid ionomer covering the platinum particles [33]. Anintriguing possibility of the work in this paper is that thesupposed increase in mass transport overpotential is an artefactof the way that the measurements are made and a moresophisticated electrokinetic model of the type developed withinthis paper would eliminate the extra mass transport loses seen atlow catalyst loading.
4. Conclusion
The reductionofO2towaterunderelectrokinetic controlhasbeenstudied at overpotentials not typically accessible by conventionalmethods due to the onset of mass transport limitations. We havetriedto use the double trap kinetic model to fit ourexperimental data[26]. However, considerable deviation from the model occurs atpotentials in the double layer region. In this region the experimentalcurrent densities were lower than the values predicted by thestandard double-trap model. The experimental data on which thedouble trap model is validated is realistic only under electrokineticcontrol at potentials above 0.8 V, so it is hardly surprising that thestandard double trap model is unable to capture the trueelectrokinetic behaviour of the ORR in the potential regime lessthan 0.8 V. By introducing a simple model which includes anadsorbate bindingtothe surfaceat low potentials, we find good fits toour experimental dataset with a relative accuracy of 10% overtemperature (280–330 K) and potential ranges of 0.3 to 0.7 V vs. RHE.At low overpotentials there are somewhat larger deviations as thissimple model does not include the formation of oxide blockingspecies on the surface. The model does however imply a blockingspecies on the surface with increasing coverage as overpotential isincreased (i.e. as potential is decreased down to 0.3 V vs. RHE). Theadsorption isotherm of this adsorbate agrees with the formation ofhydrogen peroxide.
Aided by this simple model, we have modified the double trapkinetic model to include the formation and decomposition ofadsorbedHO2(ad).By including this specieswewere able to model thepolarization curve within 4% error between 0.3 and 0.9 V vs. RHE. Thefitted model suggests that the predominant path for the ORR is rapiddissociative adsorption to form O(ad), followed by subsequentreduction to H2O. This mechanism is hindered by the formation ofan additional surface species at potentials in the double layer.Although the model cannot unequivocally identify the species, thepresented model appears to be consistent with the formation of asurface species via the associative pathway. The extra species allowfor the possible formation of hydrogen peroxide (although thisaspect is currently missing in our model), something which is knownto occur on real catalysts but is not catered for by the double trapmodel. This addition has the effect of adding extra blocking species totheplatinumsurface, andthis blockingincreases astheoverpotentialincreases. The net result is that the ORR on platinum underperformscompared to standard models which assume Tafel-like behaviour atlarge overpotentials. We further note that the structure of the fittedisotherm is consistent with a step involving a free site, and theremoval of this species in a steady state type relationship.
These results suggest limits to the performance of catalysts infuel cells, and also suggest that studying the performance of
catalysts in the so-called kinetic regime (i.e. 0.9 V vs. RHE) andextrapolating this performance to that at fuel cell relevantpotentials (ca. 0.7 V vs. RHE) may give an incomplete picture as tothe performance in a fuel cell. Control of the blocking species onthe catalyst may be just as important as pushing the absoluteperformance of the catalysts on RDE electrodes at 0.9 V vs. RHE.
Acknowledgements
The authors would like to thank the U.K. Engineering andPhysical Sciences research council for supporting the research inthis paper under the projects EP/J016454/1 and EP/G030995/1.
References
[1] J.X. Wang, J. Zhang, R.R. Adzic, Double-trap kinetic equation for the oxygenreduction reaction on pt(111) in acidic media, Journal of Physical Chemistry A111 (2007) 12702–12710.
[2] R. Jinnouchi, K. Kodama, T. Hatanaka, Y. Morimoto, First principles based meanfield model for oxygen reduction reaction, Physical Chemistry ChemicalPhysics 13 (2011) 21070–21083.
[3] H.S. Wroblowa, G. Razumney, Electroreduction of oxygen: A new mechanisticcriterion, Journal of Electroanalytical Chemistry 69 (1976) 195–201.
[4] R. Adzic, Recent Advances in the Kinetics of Oxygen Reduction, in: J. Lipkowski,P.N. Ross (Eds.), Electrocatalysis, Wiley-VCH, New York, 1998, pp. 197.
[5] R.R. Adzic, Structural Effects in Electrocatalysis and Oxygen Electrochemistry,in: D. Scherson, D., Tryk, M., Daroux, X. Xing (Eds.), The ElectrochemicalSociety1992, pp. 419.
[6] A. Damjanovic, V. Brusic, ELECTRODE KINETICS OF OXYGEN REDUCTIONON OXIDE-FREE PLATINUM ELECTRODES, ELECTROCHIMICA ACTA 12 (1967)615.
[7] A. Damjanovic, M.A. Genshaw, J.O.M. Bockris, DISTINCTION BETWEENINTERMEDIATES PRODUCED IN MAIN AND SIDE ELECTRODIC REACTIONS,JOURNAL OF CHEMICAL PHYSICS 45 (1964) 4057.
[8] D.B. Sepa, M.V. Vojnovic, A. Damjanovic, Electrochim. Acta 25 (1980) 1491.[9] D.B. Sepa, M.V. Vojnovic, A. Damjanovic, Electrochim. Acta 26 (1981) 781.
[10] F.A. Uribe, M.S. Wilson, T.E. Springer, S. Gottesfeld, Proc. Workshop onStructural Effects in Electrocatalysis and Oxygen Electrochemistry, in: D.Scherson, M. Tryk, X. Xing Daroux (Eds.), 494, The Electrochemical Society,1992.
[11] A.R. Kucernak, E. Toyoda, Studying the oxygen reduction and hydrogenoxidation reactions under realistic fuel cell conditions, ElectrochemistryCommunications 10 (2008) 1728–1731.
[12] C.M. Zalitis, D. Kramer, A.R. Kucernak, Electrocatalytic performance of fuel cellreactions at low catalyst loading and high mass transport, Physical ChemistryChemical Physics 15 (2013) 4329–4340.
[13] A. Parthasarathy, Pressure Dependence of the Oxygen Reduction Reaction atthe Platinum Microelectrode/Nafion Interface: Electrode Kinetics and MassTransport, J Electrochem Soc 139 (1992) 2856.
[14] C.M. Zalitis D. Kramer J. Sharman E. Wright A.R. Kucernak Pt Nano-ParticlePerformance for PEFC Reactions at Low Catalyst Loading and High ReactantMass Transport ECS Trans. 58 (2013) 39–47.
[15] Thermophysical Properties of Fluids, in: W.M. Haynes (Ed.), CRC Press/Taylorand Francis, Boca Raton, FL, 2010.
[16] T. Rettich, R. Battino, E. Wilhelm, Solubility of gases in liquids. 22. High-precision determination of Henry's law constants of oxygen in liquid waterfromT=274K toT=328K, The Journal of Chemical Thermodynamics 32 (2000)1145–1156.
[17] A.J. Bard, L.R. Faulkner, Electrochemical Methods, John Wiley & Sons, inc,Hoboken, NJ, 2001.
[18] J. Nørskov, J. Rossmeisl, A. Logadottir, L. Lindqvist, J. Kitchin, T. Bligaard, H.Jonsson, Origin of the overpotential for oxygen reduction at a fuel-cell cathode,Journal Of Physical Chemistry B 108 (2004) 17886–17892.
[19] B.H.J. Bielski, D.E. Cabelli, R.L. Arudi, A.B. Ross, Reactivity of HO2/O-2 Radicalsin Aqueous Solution, Journal of Physical and Chemical Reference Data 14(1985) 1041–1100.
[20] S.M. Gubler, Radical (HO, H and HOO) Formation and Ionomer Degradation inPolymer Electrolyte Fuel Cells, J Electrochem Soc 158 (2011) B755.
[21] S. Chen, A. Kucernak, Electrocatalysis under Conditions of High MassTransport Rate: Oxygen Reduction on Single Submicrometer-Sized PtParticles Supported on Carbon, Journal Of Physical Chemistry B 108(2004) 3262–3276.
[22] K. Ke, T. Hatanaka, Y. Morimoto, Reconsideration of the quantitativecharacterization of the reaction intermediate on electrocatalysts by arotating ring-disk electrode: The intrinsic yield of H2O2 on Pt/C,Electrochimica Acta 56 (2011) 2098–2104.
[23] D.B. Sepa, M.V. Vojnovic, A. Damjanovic, Reaction intermediates as acontrolling factor in the kinetics and mechanism of oxygen reduction atplatinum electrodes Electrochimica Acta 26 (1981) 781–793.

136 M. Markiewicz et al. / Electrochimica Acta 179 (2015) 126–136
[24] A. Panchenko, M.T.M. Koper, T.E. Shubina, S.J. Mitchell, E. Roduner, Ab initiocalculations of intermediates of oxygen reduction on low-index platinumsurfaces, J. Electrochem. Soc. 151 (2004) A2016–A2027.
[25] P. Gambardella, Z. Šljivan9canin, B. Hammer, M. Blanc, K. Kuhnke, K. Kern,Oxygen Dissociation at Pt Steps, Physical Review Letters 87 (56) (2001)103.
[26] J.X. Wang, F.A. Uribe, T.E. Springer, J. Zhang, R.R. Adzic, Intrinsic kineticequation for oxygen reduction reaction in acidic media: the double Tafel slopeand fuel cell applications, Faraday Discussions 140 (2008) 347–362.
[27] F. Tian, A.B. Anderson, Effective Reversible Potential, Energy Loss, andOverpotential on Platinum Fuel Cell Cathodes, Journal of Physical ChemistryC 115 (2011) 4076–4088.
[28] S. Siahrostami, A. Verdaguer-Casadevall, M. Karamad, D. Deiana, P. Malacrida,B. Wickman, M. Escudero-Escribano, E.A. Paoli, R. Frydendal, T.W. Hansen, I.Chorkendorff, I.E.L. Stephens, J. Rossmeisl, Enabling direct H2O2 productionthrough rational electrocatalyst design, Nat Mater 12 (2013) 1137–1143.
[29] A.J. Bard, R. Parsons, J. J, Standard Potentials in Aqueous Solution, MarcelDekker, New York, 1985.
[30] Y. Fukuyama, T. Shiomi, T. Kotaka, Y. Tabuchi, The Impact of PlatinumReduction on Oxygen Transport in Proton Exchange Membrane Fuel Cells,Electrochimica Acta 117 (2014) 367–378.
[31] N. Nonoyama, S. Okazaki, A.Z. Weber, Y. Ikogi, T. Yoshida, Analysis of Oxygen-Transport Diffusion Resistance in Proton-Exchange-Membrane Fuel Cells, J.Electrochem. Soc. 158 (2011) B416–B423.
[32] Á. Kriston, T. Xie, D. Gamliel, P. Ganesan, B.N. Popov, Effect of ultra-low Ptloading on mass activity of polymer electrolyte membrane fuel cells, Journal ofPower Sources 243 (2013) 958–963.
[33] W. Yoon, A.Z. Weber, Modeling Low-Platinum-Loading Effects in Fuel-CellCatalyst Layers, J. Electrochem. Soc. 158 (2011) B1007–B1018.
[34] D.M. Stanbury, Reduction Potentials Involving Inorganic Free Radicals inAqueous Solution, in: A.G. Sykes (Ed.), Advances in Inorganic Chemistry,Academic Press, 1989, pp. 69–138.